Article

Active Wildland Fires in Central Chile and Local Winds (Puelche)

Arctic Research Center, Hokkaido University, Sapporo 0010021, Japan
Remote Sens. 2024, 16(14), 2605; https://doi.org/10.3390/rs16142605
Submission received: 10 May 2024 / Revised: 8 July 2024 / Accepted: 9 July 2024 / Published: 16 July 2024
(This article belongs to the Special Issue Remote Sensing Application in the Carbon Flux Modelling)

Abstract

:
Central Chile (CC, latitudes 32–40°S) experienced very active fires in 2017 and 2023. These fires burned large areas and killed many people. These unprecedented fires for CC presented a need for more defined fire weather conditions on the synoptic scale. In this paper, fire weather conditions were analyzed using various satellite-derived fire data (hotspots, HSs), wind streamlines, distribution maps of wind flow and temperature, and various synoptic-scale weather maps. Results showed that local winds, known as Puelche, blew on the peak fire days (26 January 2017 and 3 February 2023). The number of HSs on these days was 2676 and 2746, respectively, about 90 times the average (30). The occurrence of Puelche winds was confirmed by streamlines from high-pressure systems offshore of Argentina to the study area in CC. The formation of strong winds and high-temperature areas associated with Puelche winds were identified on the Earth survey satellite maps. Strong winds of about 38 km h−1 and high temperatures above 32 °C with low relative humidity below 33% were actually observed at the weather station near the fire-prone areas. Lastly, some indications for Puelche winds outbreaks are summarized. This paper’s results will be used to prevent future active fire occurrences in the CC.

1. Introduction

Many regions of the world are becoming increasingly arid due to the rapid temperature rise in recent years. This recent trend of high temperatures and dryness is expected to lead to an increase in active wildfires [1]. Recent active forest fires are not only hazardous to human health but are also destroying the environment and infrastructure and killing wildlife [2]. The annual global area burned under recent high-temperature trends is estimated to be 4.2 to 4.7 million km2 [3,4,5,6,7,8]. Wildland fires occur from the peat swamp forests near the equator to the Arctic tundra during the warmer dry season [9,10]. Wildland fires in temperate zones depend on rainfall and tend to occur during the dry season. Wildland fires in the Mediterranean climate regions, which are part of the temperate zone, tend to occur during the dry season under high temperatures. The recent rapid rise in temperatures and droughts have increased the intensity of forest fires [11,12].
The central Chile (CC, 32 to 40°S) region experienced significant territorial change between 1850 and 1950, a period when large tracts of virgin forest were destroyed by fire [13]. The decline of natural forests has become more pronounced over the past 150 years, mainly due to human activity such as large-scale burning of land for livestock, agriculture, and the development of plantation forests [14,15]. Land use change has fragmented the natural primary and secondary forests, replacing them with commercial pine and eucalyptus plantations [16]. Commercial plantations are prone to fires because the conifers of the Pinus family and the leaves of the Eucalyptus family are highly flammable. Crown fires are more likely to occur in commercial plantations due to high planting density [17,18].
After developments in forest fire defense began in 1967, the number of fires and the amount of damage in CC seemed to have stabilized over time, largely due to better regulations, legislation, and fire management protocols [13]. However, fires related to climate change and urbanization are on the rise, resulting in greater human suffering and losses. The paper, which compared forest fires from 2010–2015 and 1990–2009, showed a trend toward an increase in large-scale forest fires, an increase in the area burned, and a longer fire season [11]. These fire trends may suggest the effects of climate change on active fire occurrences in CC.
Fires at the wildland-urban interface (WUI) are also an important challenge for Chile from both ignition and environmental perspectives. Recent increases in urbanization rates are exacerbating the risk of fire at the wildland-urban interface [19,20]. The wildland-urban interface is defined as a risk area where ignition hazards from flammable vegetation coexist with vulnerabilities from population, housing, and infrastructure [21,22,23]. CC is recognized as a global hotspot for biodiversity but is increasingly urbanized, such as Valparaíso, Santiago, and Concepción. CC has 78.9% of the country’s total population and is where most of the agroforestry activities (85% of annual crops and 88% of forest plantations) are concentrated [23]. In CC, extensive conversion of primary forests to highly flammable and dense plantations and increased human-induced ignition have been factors associated with large-scale fire outbreaks in recent decades [24].
Among the large-scale fires occurring all over the world, two large-scale fires also broke out in CC. The very active 2017 fires burned about 6000 km2, killed 11 people, and destroyed over 2000 structures. Just six years later, active fires in 2023 consumed more than 4300 km2, killed 24 people, and destroyed at least 800 homes. The unprecedented scale of the 2017 and 2023 wildland fires highlighted the need to better understand the weather conditions under which large-scale fires occur. Several papers [25,26,27] have already been published regarding fires in Chile. However, it is very difficult to find scientific papers examining fire weather conditions for the 2017 and 2023 wildland fires. Most papers just concluded that active fires like those in 2017 are likely to occur under recent trends of warming temperatures, decreasing rainfall, and drought due to climate change.
Valdivia et al. analyzed the 2017 wildfires in the Las Máquinas Region in CC [26]. Their analysis results of various indices using on-earth observation tools were that active fires took place under very high averaged-maximum temperatures, the lowest Normalized Difference Vegetation Index values, and extreme fire weather index (FWI) values. McWethy et al. analyzed the surface and free tropospheric synoptic atmospheric conditions associated with months of unusually high (active) and low (inactive) burnt areas in CC based on fire data from 1984 to 2018. Their results revealed several synoptic atmospheric conditions during those fire-prone months. However, though there was little mention of the 2017 fires, they showed that the maximum summer temperature index for the 2016–2017 fire season was very high [27].
Satellites detected a very large number of hotspots (HSs) in January 2017 and February 2023 (High infrared intensity areas (pixels) detected by satellites are called hotspots in this paper). High HS conditions in both years lasted about one week. Large fires occurring in a short period of time suggest the involvement of local winds called Puelche in southern Chile [28]. However, there was little literature examining the relationship between fires and local winds.
The purpose of this paper is to identify the key fire weather conditions during active fire periods in 2017 and 2023 and to examine the impact of local winds on fires. To achieve these objectives, various data from Earth observation satellites were analyzed using various analysis tools on the web. Results were confirmed by hourly weather data measured at the weather station.
The paper is organized as follows: Section 2 describes the data and methodologies; the results and discussions are presented in Section 3 and Section 4; and finally, Section 5 contains the main conclusions of this paper.

2. Materials and Methods

2.1. Study Area

Figure 1 shows a map of central Chile and the study area covering CC (32–40°S, 70–74°W) belonging to a Mediterranean climate. Figure 1a shows that CC is located in the southwestern part of South America. Chile is a long and narrow country from north to south and has an elongated area located in southern South America at approximately 17.5°S to 55.6°S in latitude and 67°W to 75.7°W. The Great Divide is located primarily in the mountainous region of Chile, and most of it coincides with the border of Chile. The major sea currents are as follows:
The Peru Current (cold current), which flows from south to north along Chile’s coastline;
The Mentor Current (warm current), which flows off the Pacific Ocean from south to north;
The Cape Horn Current (cold current), which flows from east to west in the south of Chile.
The flow of these ocean currents is roughly indicated by straight lines with arrows in Figure 1a.
The map in Figure 1b shows the study area (32–40°S, 70–74°W) in CC. Most of the dark-green areas near the coast are forest plantations in the coastal mountain range. Most of the light-green areas are farmland in the central valley, while the dark-green areas near the mountain range are native forests. The lighter-blue color of the ocean indicates shallower water depths, suggesting that water temperatures are more variable along the coast of the study area. In addition, the upwelling season in CC is most pronounced in spring and summer, when southwesterly winds are at their highest of the year [29].

2.2. Analysis Methods and Procedures

First, the occurrence of local winds, known as Puelche winds, was determined using the wind streamlines shown on the satellite-derived weather map. Second, 22 years of satellite data were used to examine fire and rainfall trends in CC. Third, synoptic-scale weather conditions were examined using earth-observation satellite data. Finally, the weather conditions on active fire days were confirmed by hourly data (wind speed, temperature, and humidity) from the ground weather station in Talcahuano.

2.2.1. Wind Streamline, Speed, and Direction

The occurrence of local Puelche winds in CC was determined using the wind streamlines shown on the MERRA-2 weather map for 10 m winds (Modern-Era Retrospective Analysis for Research and Applications, Version 2, https://fluid.nccs.nasa.gov/reanalysis/classic_merra2/, accessed on 19 April 2024). Wind speed and direction and temperature related to Puelche winds at various air levels were also checked by Earth (application name on the web, data are derived from GFS/NCEP/US National Weather Service, https://earth.nullschool.net/jp/about.html, accessed on 9 February 2024) to confirm strong wind and high-temperature areas related to Puelche winds.

2.2.2. Fire and Rainfall Trend in CC

NASA hotspot data were used as the fire database to discuss the spatiotemporal distribution of fires in CC. Daily HS data of 22 years from 1 January 2003 to 31 December 2023 detected by Moderate Resolution Imaging Spectroradiometer (MODIS) on the Terra and Aqua satellites were obtained from the NASA Fire Information for Resource Management System (MODIS Collection 6.1, https://firms2.modaps.eosdis.nasa.gov/download/, accessed on 15 May 2023). Satellite-derived rainfall data were used to define dry and rainy periods in CC. Twenty years of daily rainfall data from 2003 for the Concepción (36.83°S, 73.05°W) were obtained from the Japan Aerospace Exploration Agency (JAXA) website (https://sharaku.eorc.jaxa.jp/GSMaP_CLM/index.htm, accessed on 1 October 2023). The rainfall data were obtained by processing information from multiple precipitation-observing satellites and geostationary meteorological satellites.

2.2.3. Synoptic-Scale Weather Conditions

Various weather maps of average height at the lower-air level (1000 and 850 hPa) and the upper-air level (500 hPa) and their anomaly maps, temperature maps at the lower-air level, and sea surface temperature (SST for short) maps were obtained from NCEP/NCAR 40-year reanalysis data (https://psl.noaa.gov/data/composites/hour/, accessed on 28 January 2024) and used to discuss synoptic-scale weather conditions. In addition, true color images of MODIS on Aqua from WORLDVIEW (https://worldview.earthdata.nasa.gov, accessed on 18 April 2024) by NASA were used to grasp mainly distributions of clouds and fires (HSs).

2.2.4. Hourly Weather Data

Hourly weather data measured at the ground weather station were used to check the effect of Puelche winds on wind speed and temperature. Hourly fundamental weather data (temperature, relative humidity, wind speed and direction, air pressure, and weather types) measured at the weather stations in Talcahuano (36.71°S, 73.11°W, northwest of Concepción) were obtained from the website “Weather Underground” (Talcahuano, Biobío: https://www.wunderground.com/history/daily/cl/talcahuano/SCIE/date/2023-2-3, accessed on 27 January 2024). Talcahuano is located approximately 14 km northwest of Concepción (36.83°S, 73.05°W).

3. Results

3.1. Recent Fire Trends from 2003 in CC

3.1.1. Average Fire Distribution

In Chile, a total of 170,879 HSs (average 8137 HSs year−1) were detected during the 22-year period from 1 January 2003 to 31 December 2023. Most of the HSs (about 85.8% of total HSs) were detected in CC (study area). Figure 1b shows the average HS distribution in CC. The maximum number of HSs was 1127 in the 1° grid cell (38–39°S), and HSs were detected on cropland in the central valley in CC. One 1° grid cell (HSs = 541) east of Talcahuano and a grid cell with HSs = 728 seems to cover the coastal mountain range consisting of forest plantations and cropland [23].
The active fire years of 2017 and 2023 had about three times as many HSs. The maximum number of HSs in 2017 was 3405 HSs in the 1° grid cell (35–36°S, 72–73°W) located north of Talcahuano. The maximum number of HSs in 2023 was 3297 HSs in the 1° grid cell (37–38°S, 72–73°W) located south of Talcahuano.

3.1.2. Average Active Fire Season and Rainy Period

Figure 2a shows the average daily rainfall in the Concepción area for the 22-year period from 2003. Rainy and dry periods could be defined by gradients of thin straight lines on the accumulated rainfall curve (blue curve). The rainy period lasts from the end of May to the end of August. The dry period starts around the middle of November (of the previous year) and lasts until early April.
The average fire occurrence in Chile is shown in Figure 2b. From daily average HS changes in Figure 2b, the average fire period, active fire period, and so on could be defined using the gradients of the four different thin straight lines on the accumulated HSs curve (thick green curve). In this paper, those fire periods are referred to as the summer fire period, active fire period, winter fire period, and spring fire period.
Fire trends using only MODIS HS data shown in Figure 2b did not coincide with the fire papers on Chilian fires [27,30]. This suggests MODIS on terra and aqua only detect relatively large and long-lasting fires in Chile.

3.1.3. Annual Fire Trends

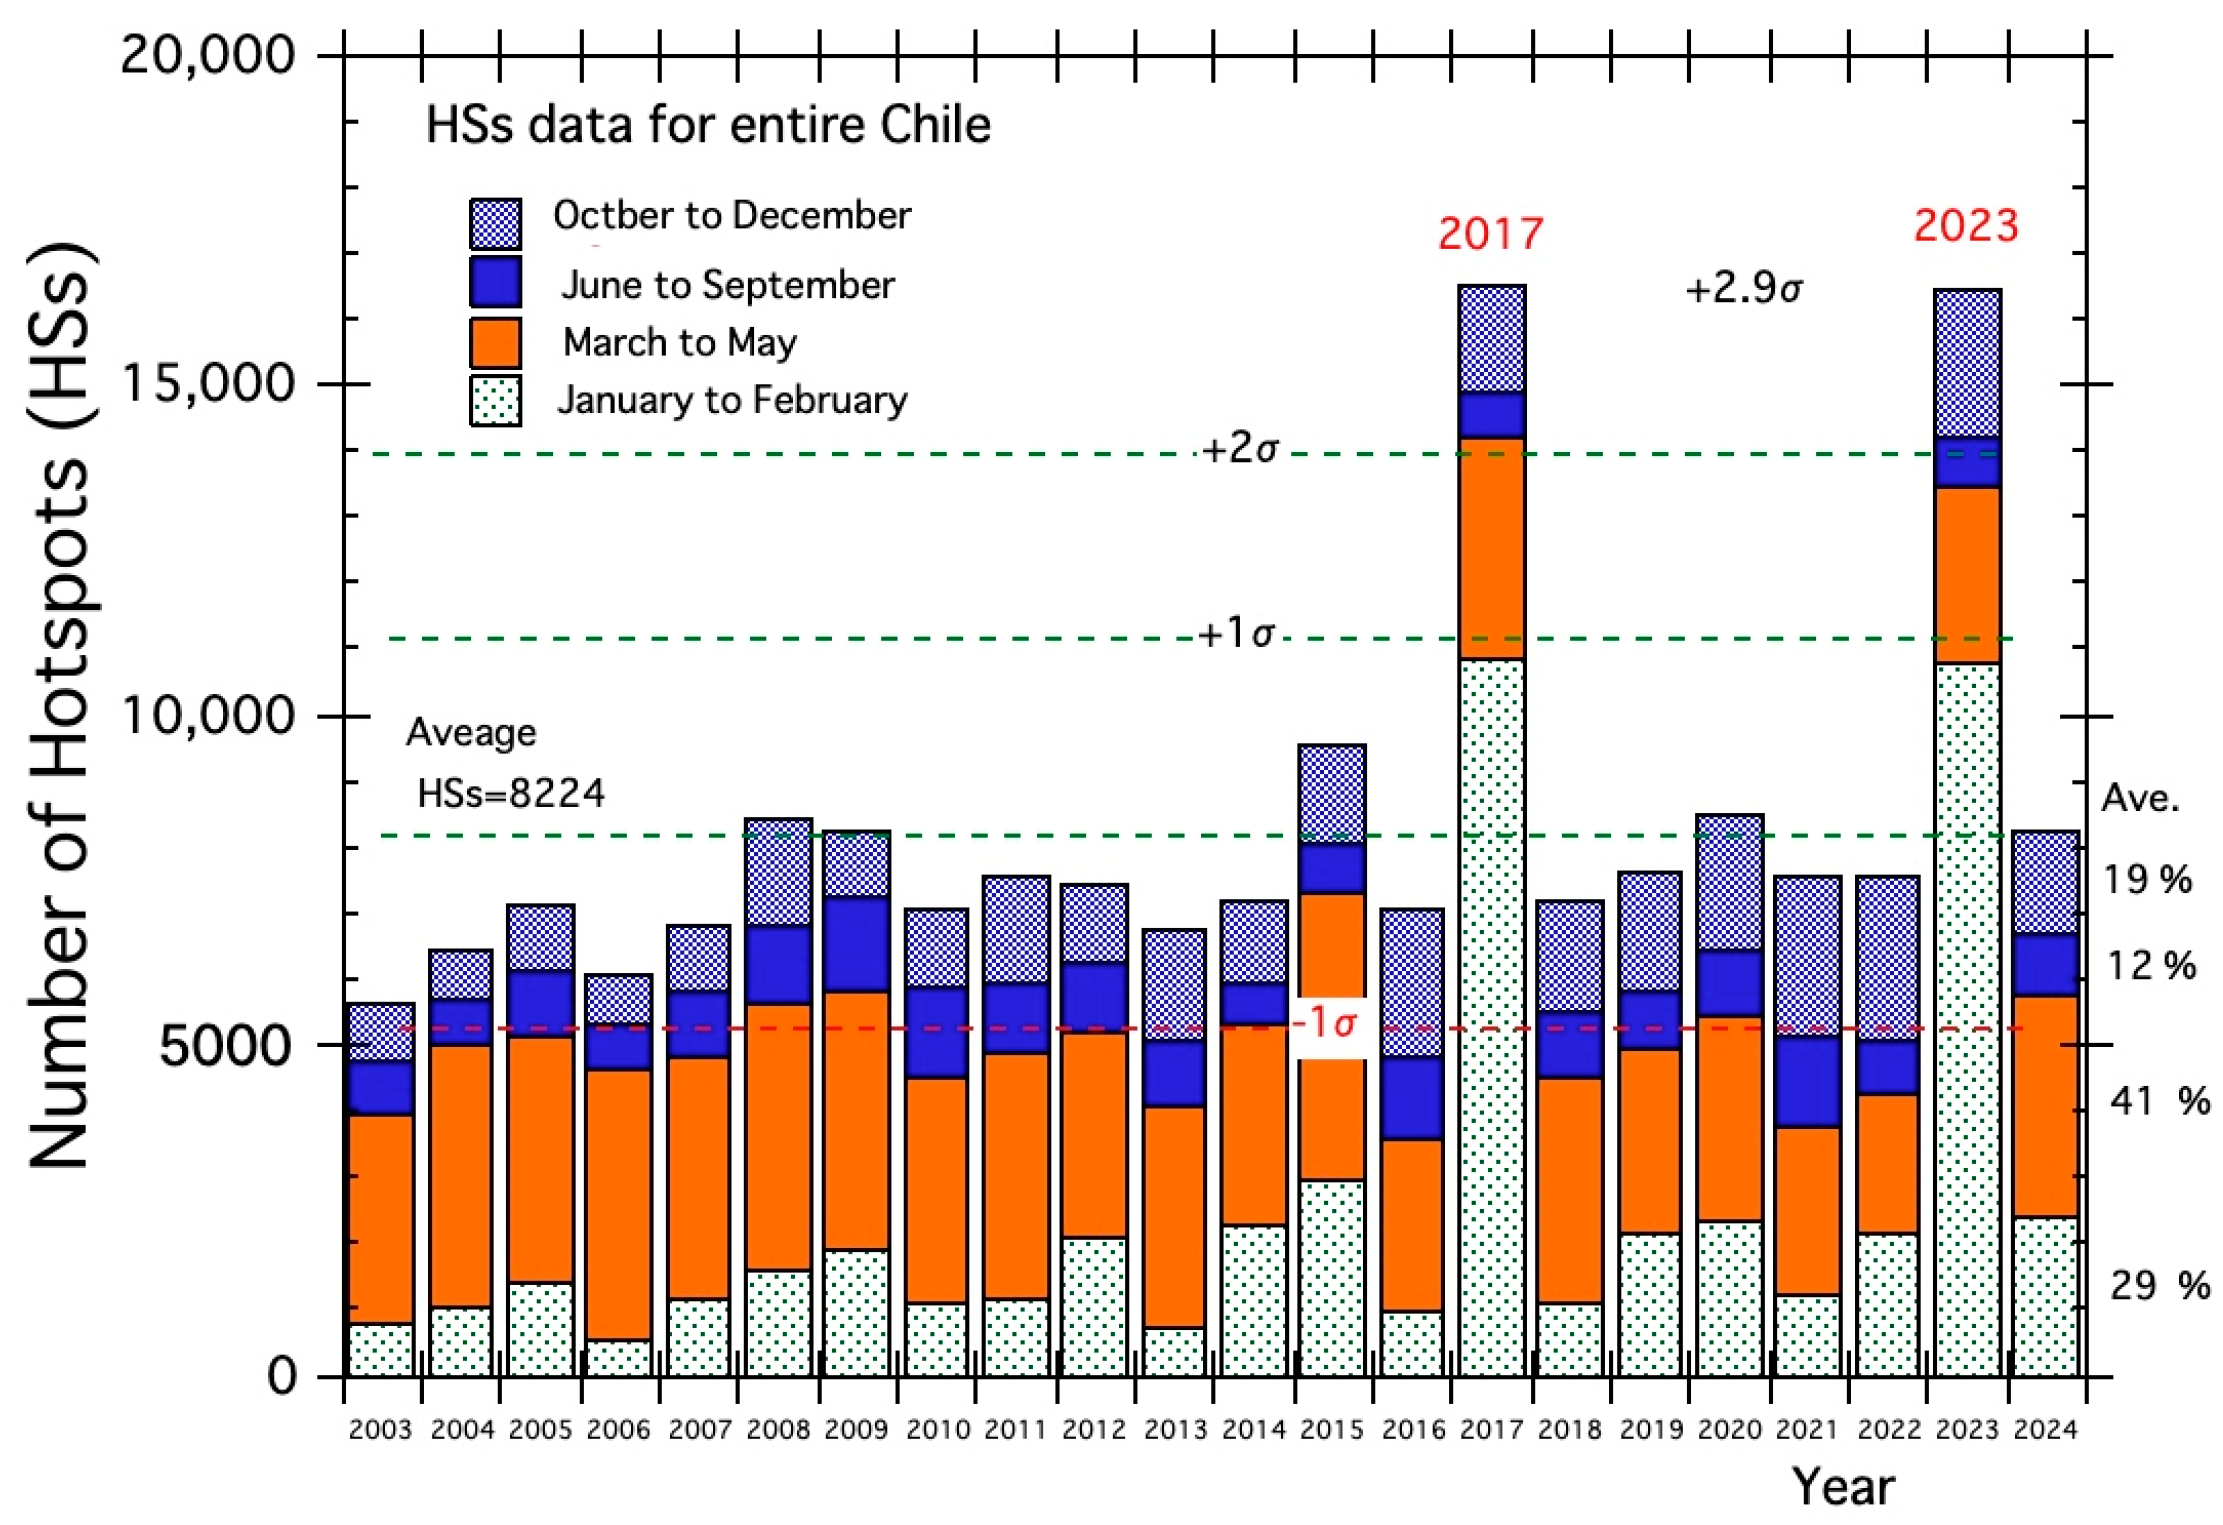
Figure 3 shows annual fire trends from 2003. The annual average number of HSs over the 22-year period was 8224. The annual HSs for 2017 and 2023 were 16,504 and 16,462, respectively, twice the average. The standard deviation (σ) and coefficient of variation (CV) of the HSs were 2877 and 0.3499, respectively. These values (σ and CV), excluding data for 2017 and 2023, are 907 and 0.1233, indicating that fires were occurring regularly. This confirms what was stated earlier, that “the amount of damage in CC seemed to have stabilized over time, largely due to better regulations, legislation, and fire-management protocols” [13]. Assuming that fire occurrence has a normal distribution, the standard deviation (+2.9σ) for 2017 and 2023 gives a probability density function of 0.0019. This small value suggests that the 2017 and 2023 fires are unprecedented or rare fires.
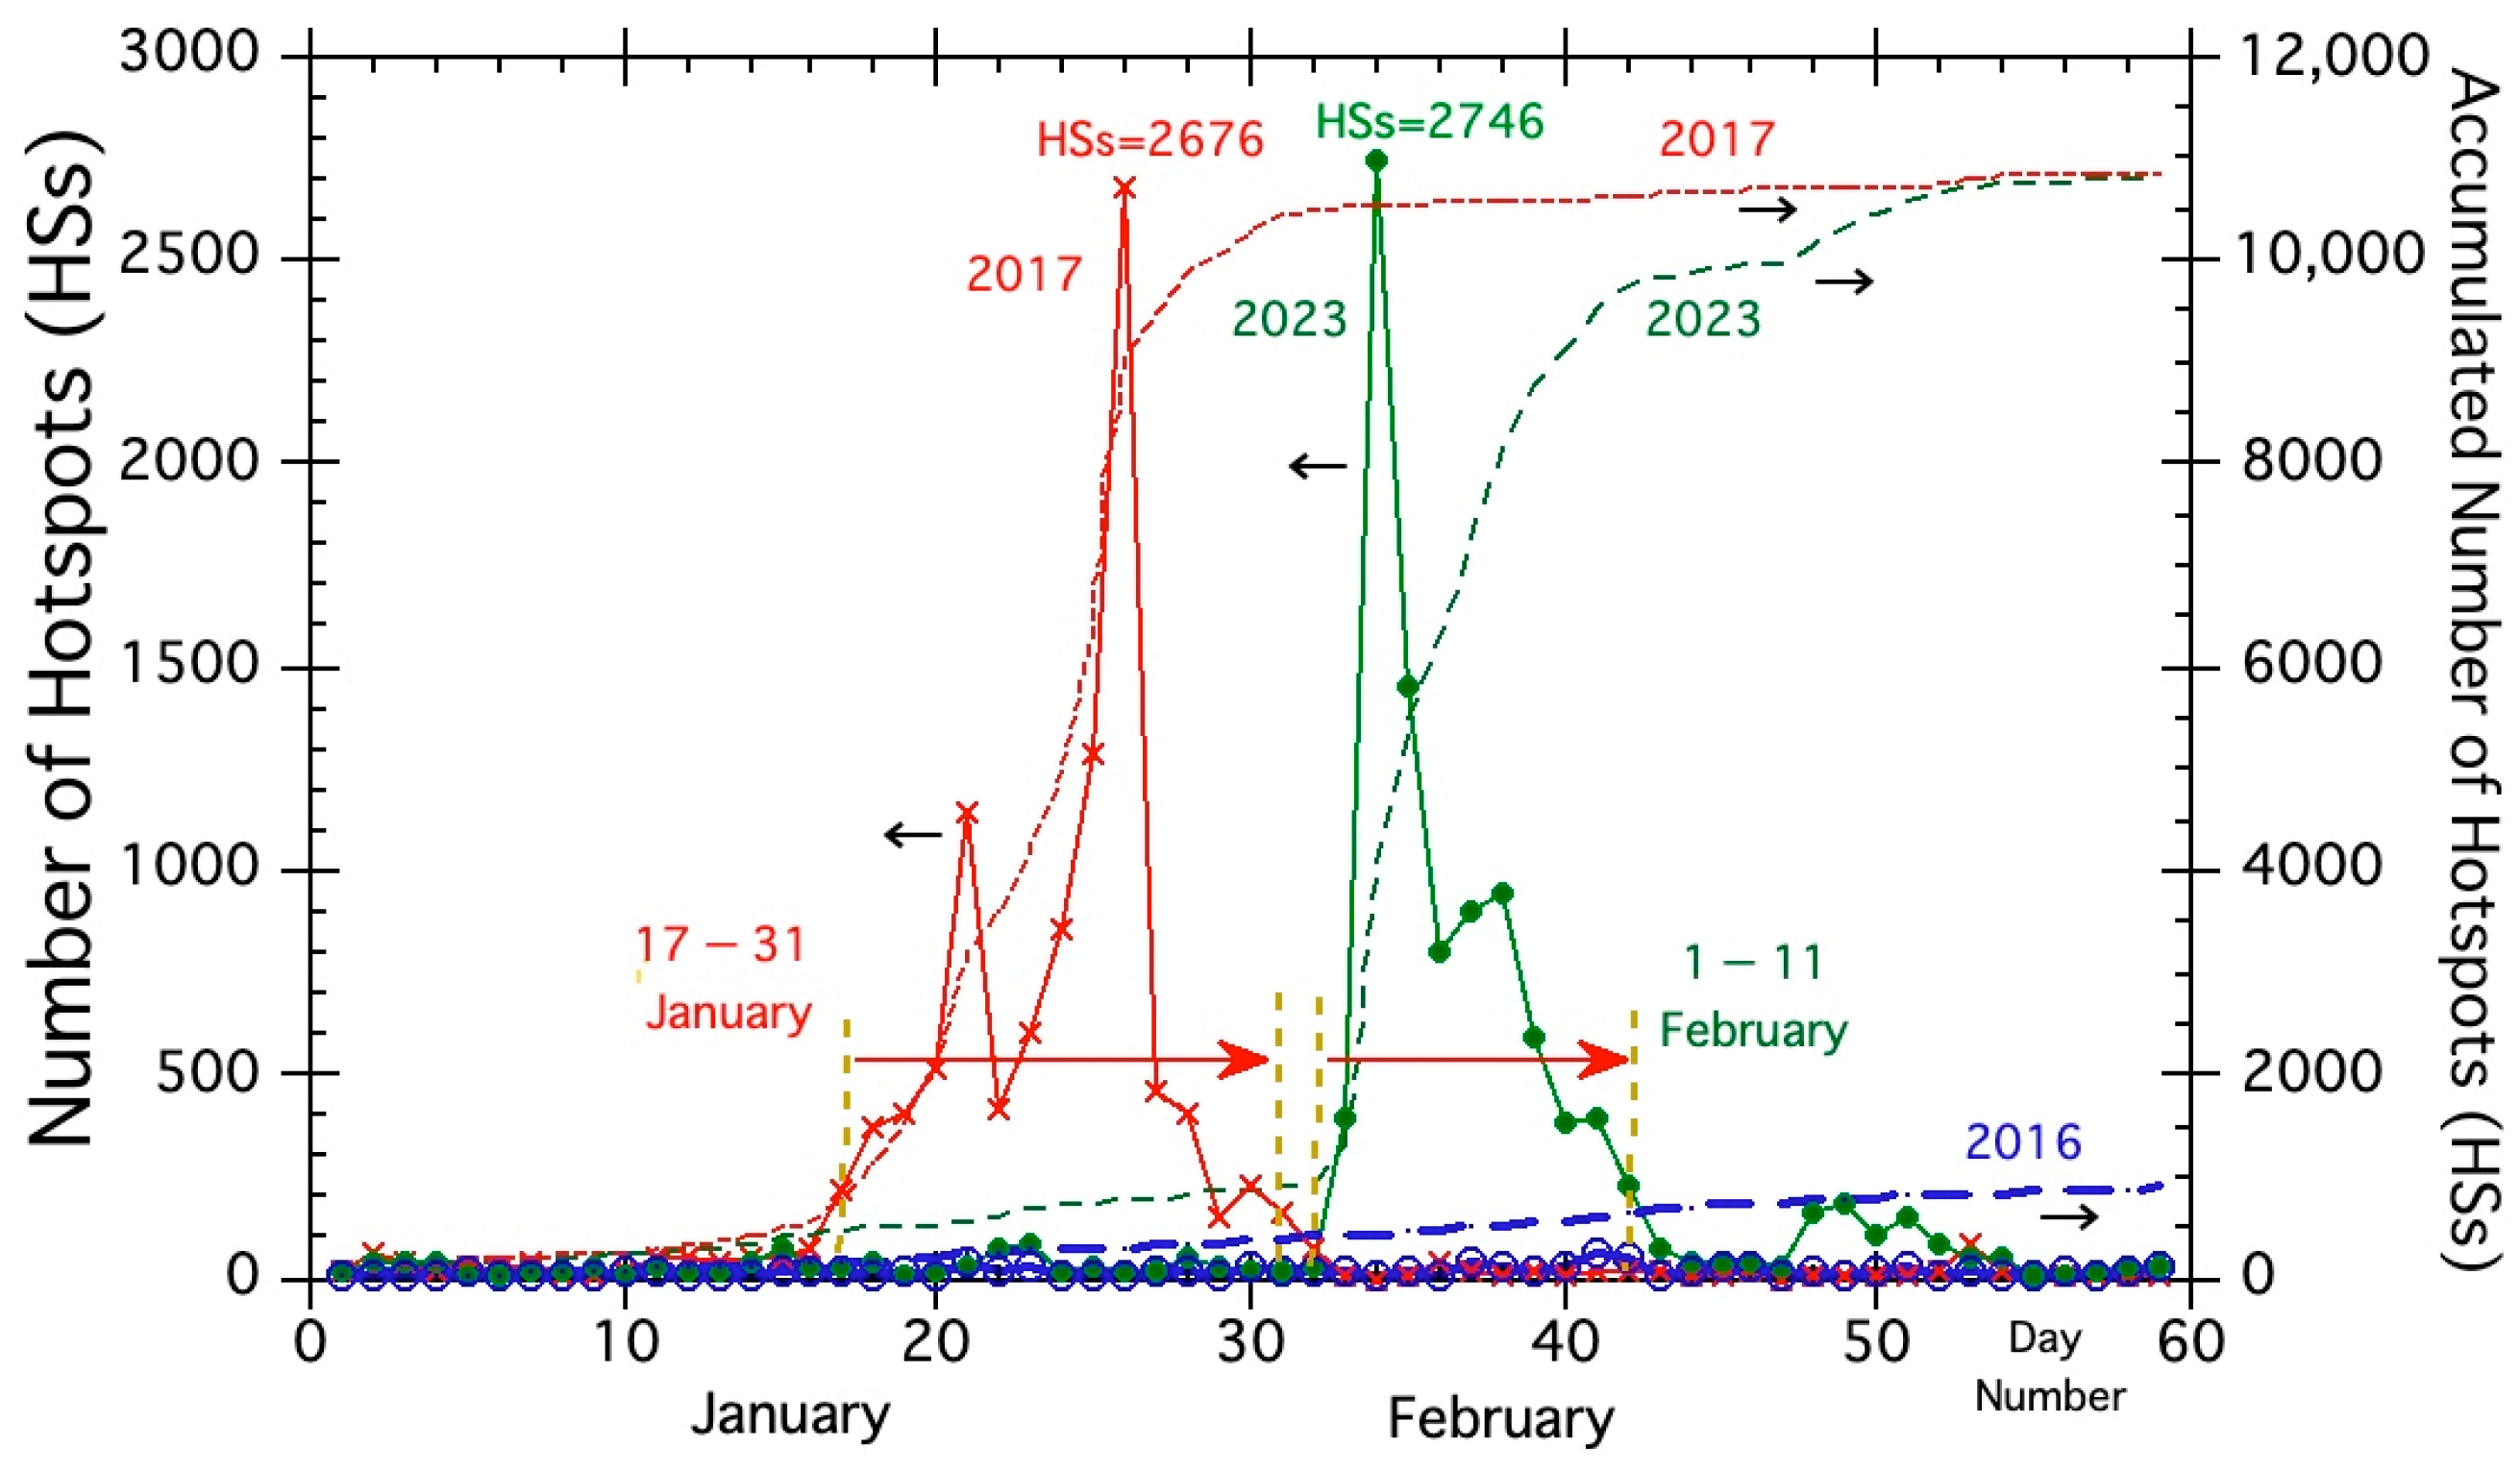
In 2017, very active fires (HSs = 9860) occurred mostly from 17 to 31 January. Very active fires (HSs = 8856) in 2023 occurred mainly from 1 to 11 February. 2016, which had the third lowest number of fires in January and February, was chosen to compare fire weather conditions with the active fire years 2017 and 2023. 2016 is called the reference year in this paper.

3.2. Active Fires and Puelche Winds

Various weather maps were analyzed to explain southwesterly strong winds, high temperatures, and low relative humidity in this section. Several weather maps clearly showed the synoptic weather conditions of active fires in 2017 and 2023.

3.2.1. Two Peak Fire Days in 2017 and 2023

Figure 4 shows fire occurrence trends for 2017, 2023, and 2016. In 2017, fires became active from around 17 January. The total number of HSs during the active fire period from 17 to 31 January was 9860. HSs on the peak fire day on 26 January were 2676 and 89 times higher than the average HS number (=2676/30). In 2017, 27.1% of total HSs were detected on just one peak fire day. In 2023, fires suddenly became active from 2 February. The total number of HSs during the active fire period from 2 to 11 February was 8833. HSs on the peak fire day of 3 February were 2746 and 92 times larger than the average HSs number (=2746/30). On just one peak fire day, 31.0% of total HSs were also detected.

3.2.2. Streamlines of Puelche Winds

Satellite images from Worldview in Figure 5a–c for each day in 2017, 2023, and 2016 contain various information such as weather conditions, ground conditions, fires shown by red dots, and so on. Figure 5a,b indicates favorable weather conditions with low cloud cover over a wide area from Argentina to Chile, and fires occurred under clear weather conditions. The fire distributions on two peak fire days in 2017 and 2023 in Figure 5a,b show that active fires occurred mainly in eastern and northern Talcahuano in 2017 and mainly in eastern and southern Talcahuano in 2023, respectively. Greyish smoke from fires is a haze. On the other hand, Figure 5c shows that red dots or fires in 2016 (the reference year) were too few to count, and clouds were visible over southern Chile and Argentina.
Local winds were determined using the wind streamlines shown on the MERRA-2 weather map for 10 m winds. Figure 5d–f shows wind streamlines with direction and distribution of high- and low-pressure systems at sea level pressure (SLP for short). The red wind streamlines in Figure 5d,e on two peak fire days in 2017 and 2023 show Puelche winds air flows towards the study area in CC. Their airflow from high-pressure systems H1024 in 2017 and H1027 in 2023 off Argentina rose up the Argentine slope, over the Andes mountains, and down the Chilean slope. We may say that the red color curves in Figure 5d,e are the main routes of Puelche winds to CC. On the other hand, Figure 5f shows wind flows in 2016 (the reference year) were mostly from the South Pacific.

3.2.3. Strong Winds and High Temperature Areas in CC

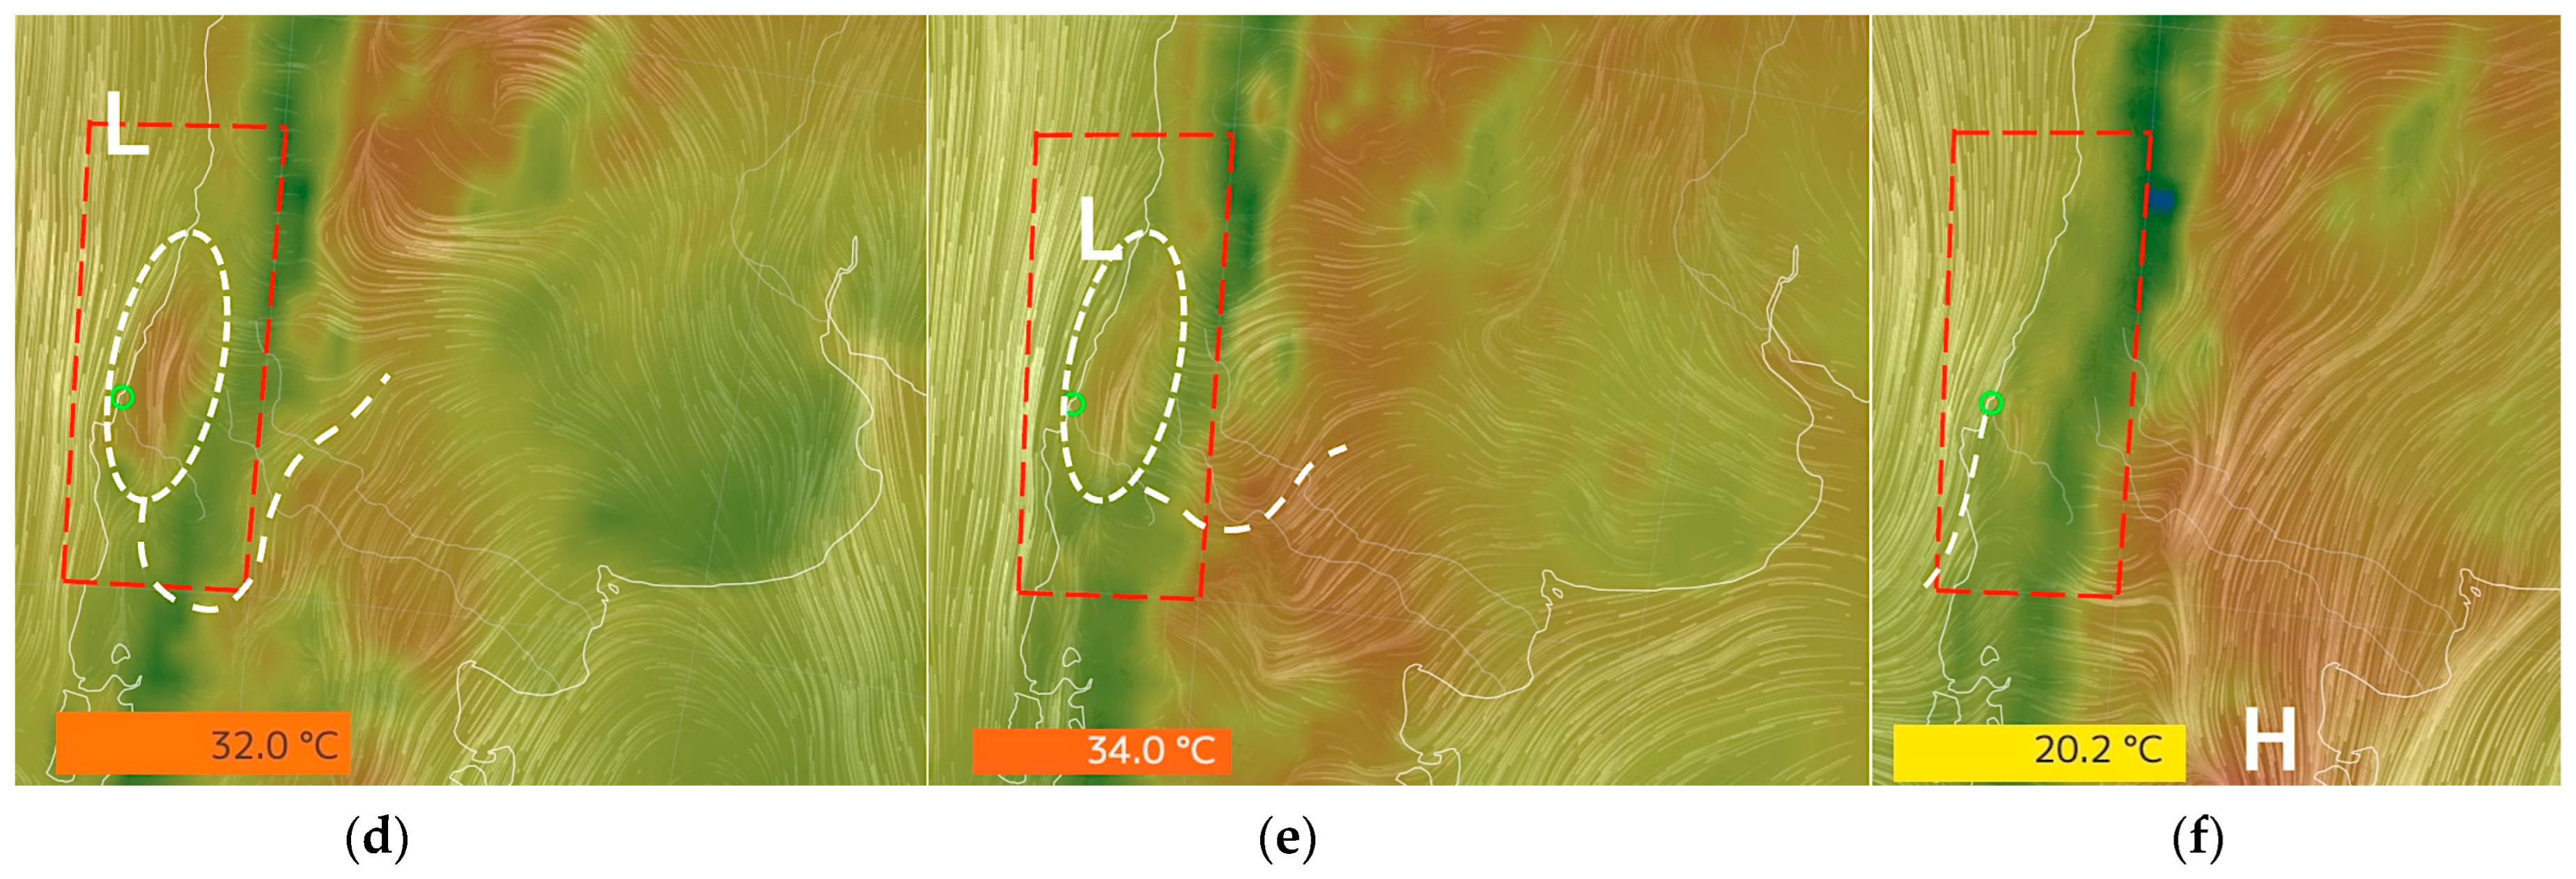
Earth (Earth survey satellites) is introduced to confirm strong winds and high-temperature areas in Central Chile under Puelche winds. Figure 6a,d shows strong winds (>35 km h−1) and high-temperature (>32 °C) areas in 2017. These areas are located in the eastern and northern parts of Talcahuano and coincide with active fire areas in Figure 6a. Figure 6b,e shows strong winds (>37 km h−1) and high temperature (>34 °C) areas in 2023.
The formation mechanism for the above-mentioned strong wind and high-temperature areas is thought to be related to Puelche winds, which is one of the characteristics of foehn-type local winds. Studies have been reported on the space between mountain ranges and coastal areas. Hoinka reported, “the increases in temperature and decreases in relative humidity are detected far from the foothills where strong downslope gusts are present during foehn and chinook episodes in the Alps and the Rocky Mountains,” and he named this process “foehn clearance” [31]. Montecinos et al. also reported about “foehn clearance” in CC [28].
On the other hand, Figure 6c,f shows wind and temperature conditions in the southeastern Talcahuano area were 9 km h−1 and 20.2 °C in 2016 (the reference year). However, this area had several HSs (red dots or fires), as shown in Figure 5c.

3.2.4. Synoptic-Scale Weather Conditions and Puelche Winds

In this section, synoptic-scale weather conditions were investigated just before Puelche winds began to blow. To explain fire weather conditions in Chile, two important weather phenomena, large jet stream meandering (LJM for short) [32] and cut-off low-pressure systems (COL for short) [33], are introduced here. These weather phenomena related to active fires in boreal forests in Alaska caused strong winds from high- and low-pressure systems [32,33].
  • Puelche winds in 2017 and pre-weather conditions of Puelche winds;
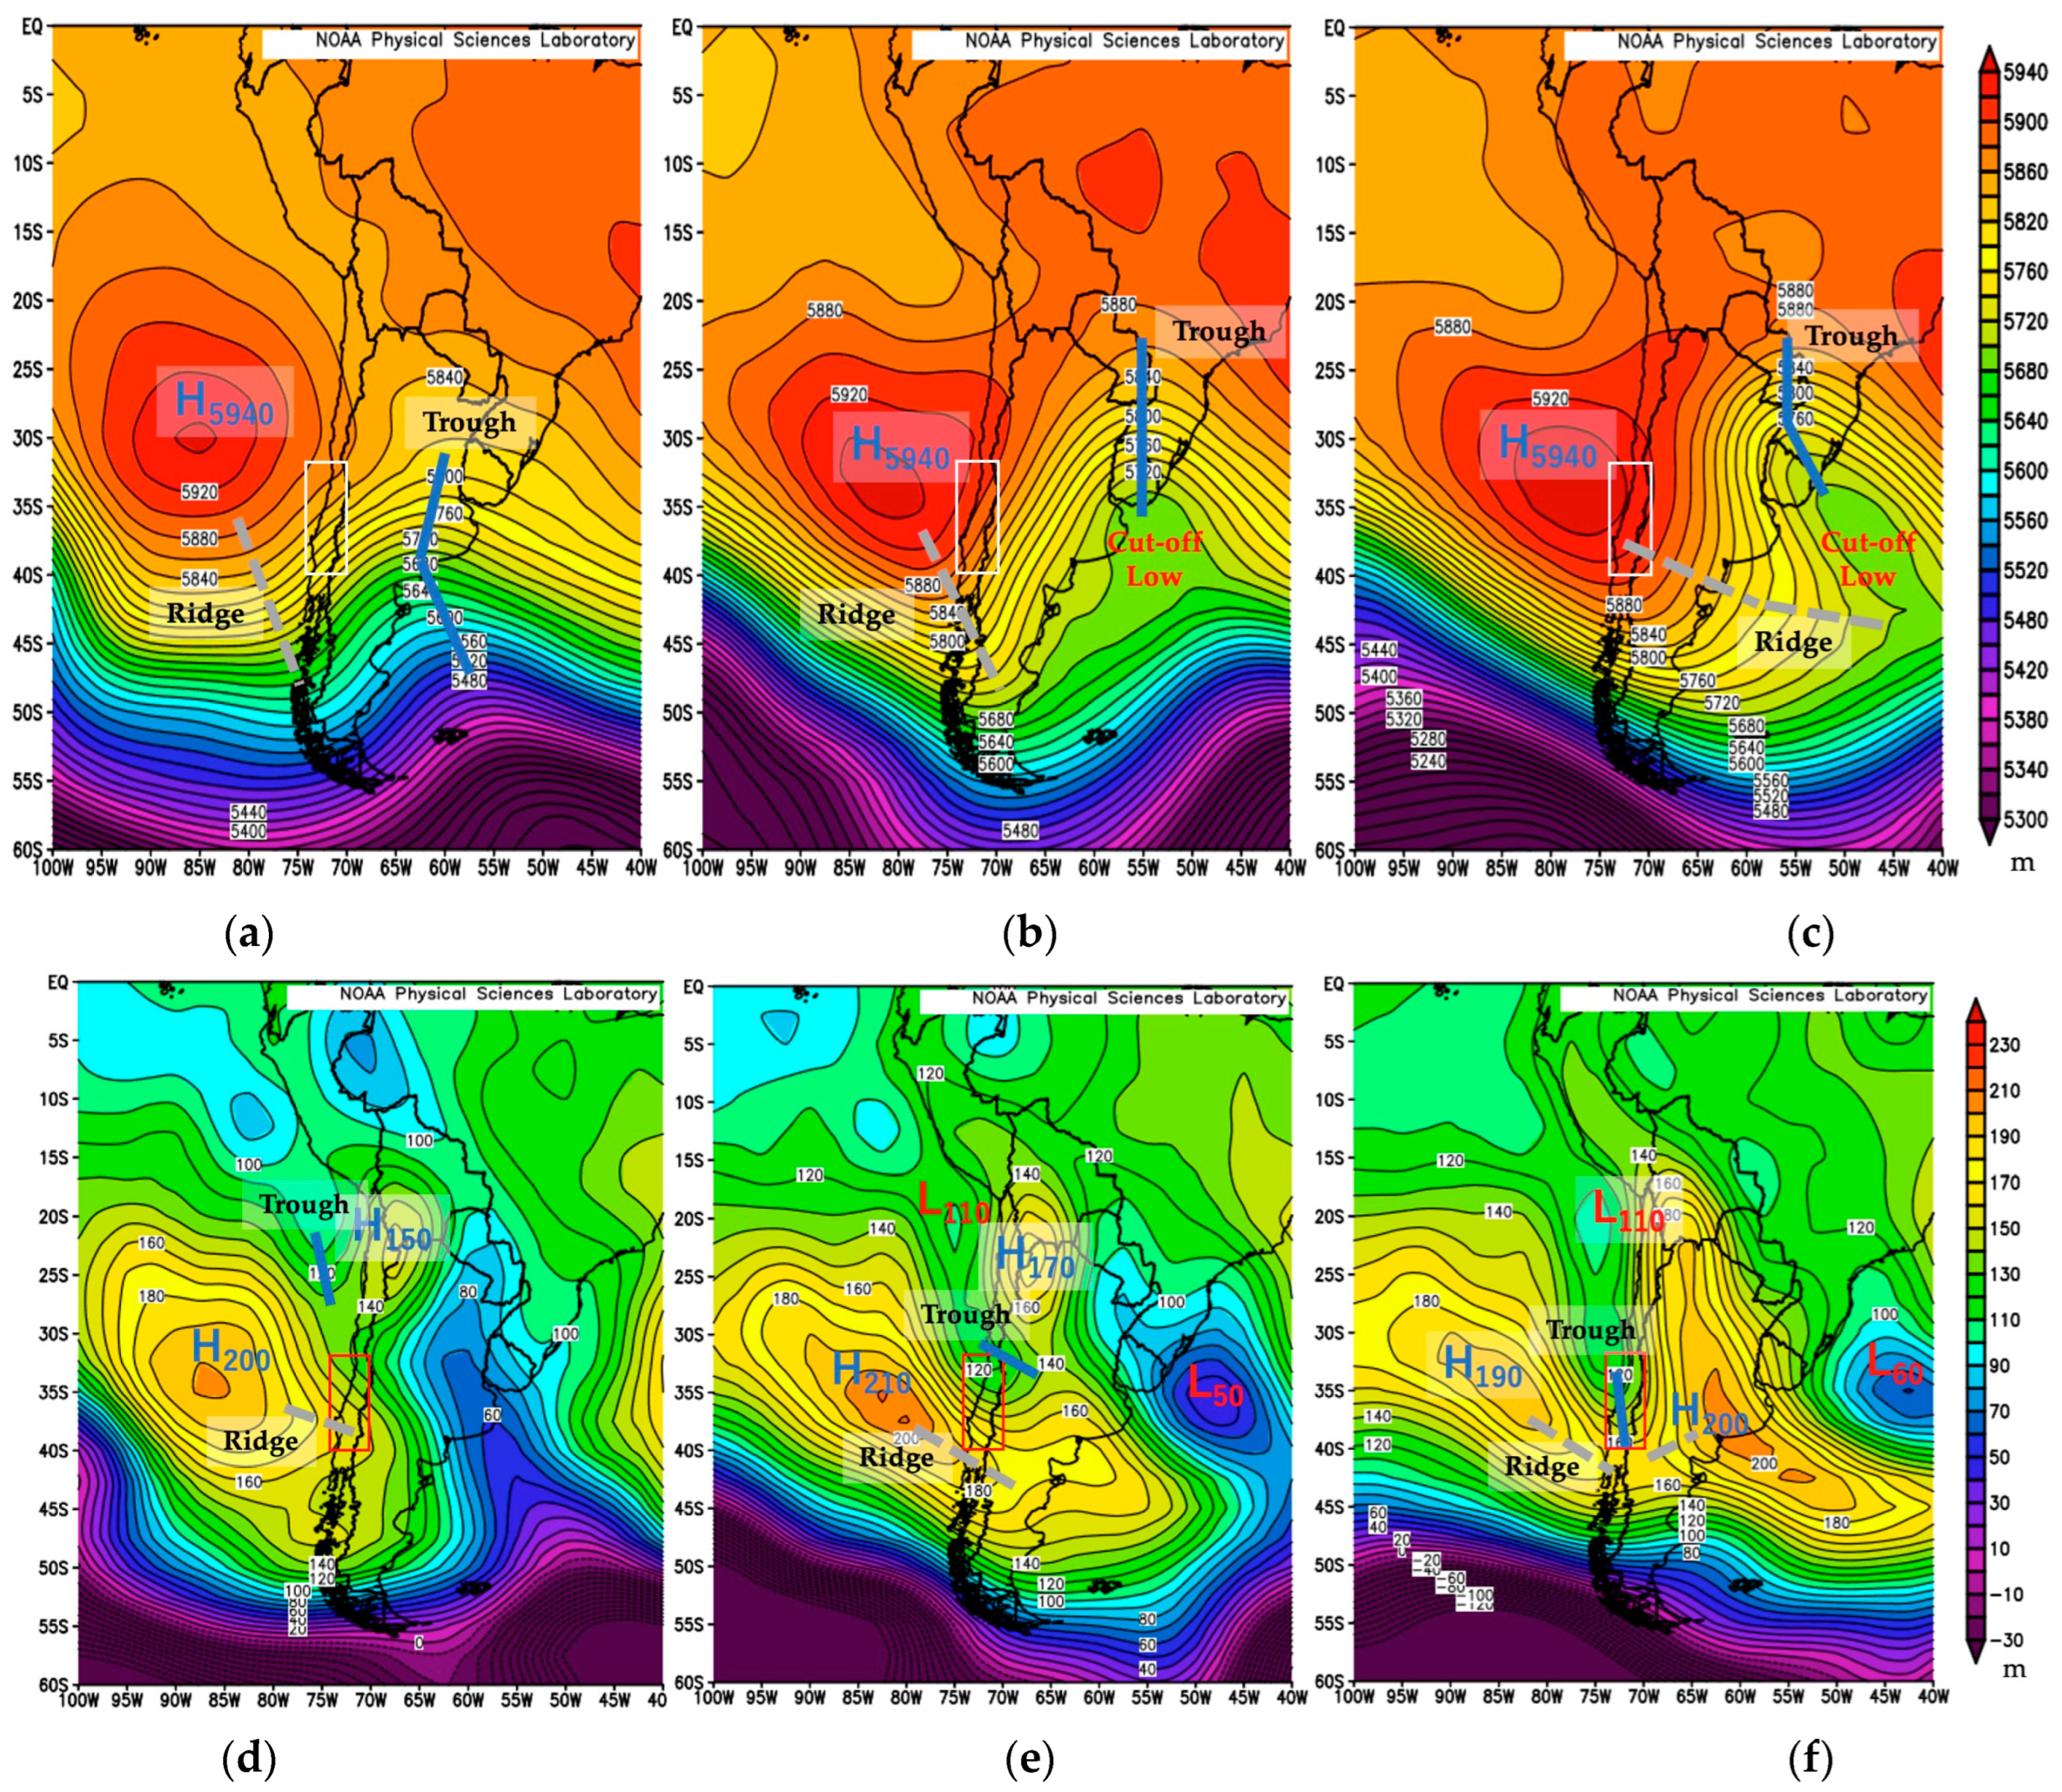
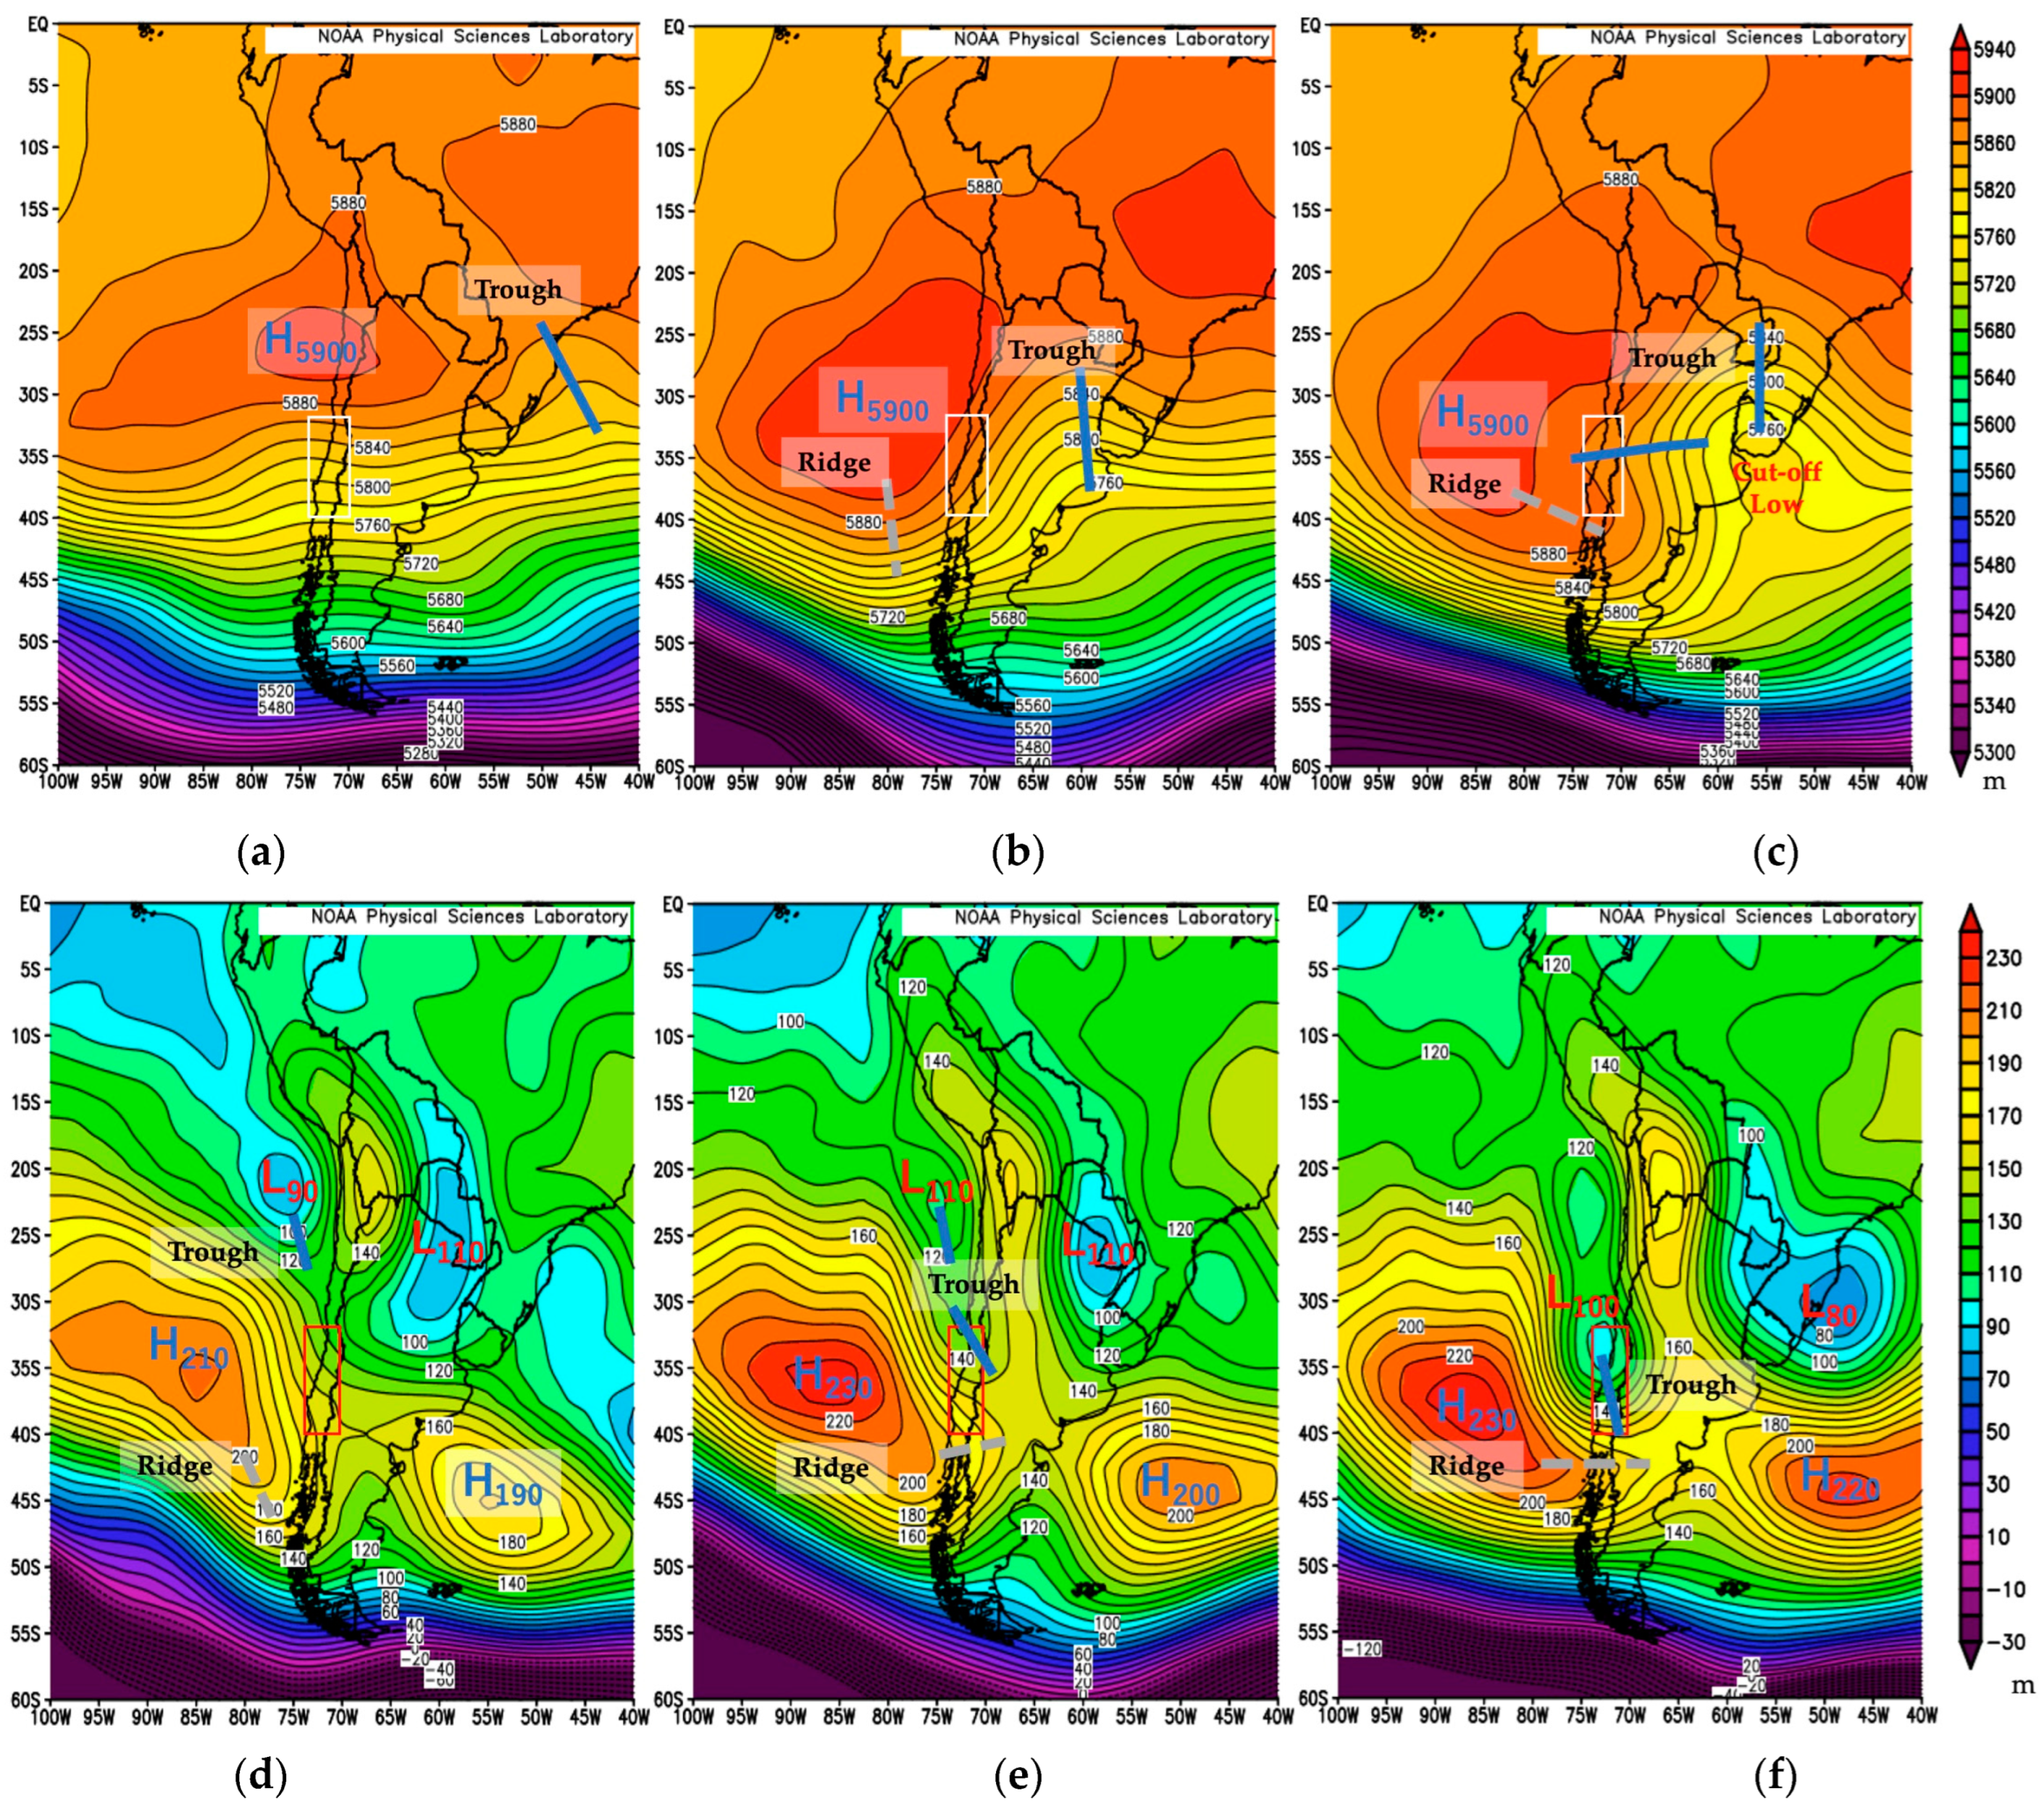
Figure 7 shows synoptic-scale weather maps at upper- and lower-air levels (1000 and 500 hPa) and pre-weather conditions of Puelche winds. From streamlines on the MERRA-2 weather maps, we could say Puelche winds blew for about 15 h from 00Z to 15 Z on 26 January (HS peak fire day). Figure 7a–c shows synoptic-scale weather maps at the upper-air layer (500 hPa) from 24–26 January 2017.
Major pre-weather conditions of Puelche winds were as follows:
(1)
High-pressure systems H5940 in Figure 7a–c off the coast of CC moved towards the study area while developing. H5940 will be called blocking high-pressure systems.
(2)
On 24 January, LJM over Argentina started due to the above persistent H5940 in the southeast Pacific Ocean, as shown in Figure 7a. LJM could be checked by contour lines of 5700 m near a light green color.
(3)
On 25 January, COL detached from the polar zone, as shown in Figure 7b.
(4)
LJM on 26 January (HS peak fire day) suggests local easterly wind flow, as shown in Figure 7c.
Under the above pre-weather conditions of Puelche winds at the upper-air level, pre-weather conditions of Puelche winds at the lower-air level were as follows:
(5)
High-pressure systems H200 in Figure 7d,e off the coast of CC moved towards the study area while developing. H200 on 26 January (HS peak fire day) over Argentina, as shown in Figure 7f, may supply Puelche winds into the study area.
(6)
Low-pressure systems related to COL of L50 and L60 in Figure 7e,f are stagnant and may block the eastward movement of high-pressure systems of H200.
(7)
Low-pressure systems of L110 in Figure 7e,f may cause strong wind conditions in the study area due to large height differences between L110 and H190 in the southeast Pacific Ocean.
  • Puelche winds in 2023 and pre-weather conditions of Puelche winds.
Figure 8 shows synoptic-scale weather maps at the upper- and lower-air levels (1000 and 500 hPa) and pre-weather conditions of Puelche winds. From streamlines on the MERRA-2 weather maps, we could say Puelche winds blew for about 33 h from 03Z on 3 February (HS peak fire day). Figure 8a–c shows synoptic-scale weather maps at the upper air layer (500 hPa) from 1–3 February 2023.
Major pre-weather conditions of Puelche winds were as follows:
(1)
High-pressure systems H5900 in Figure 8a covered the northern part of Chile. On 2 February, H5900 in Figure 8b off the coast of CC moved while developing. On 3 February (HS peak fire day), a ridge from H5900 covered the southern part of the study area.
(2)
On 2 February, LJM over Argentina started due to the above persistent H5990 in the southeast Pacific Ocean, as shown in Figure 8b. LJM could be checked by contour lines of 5760 m near a light-yellow color.
(3)
On 3 February (HS peak fire day), COL detached from the polar zone, as shown Figure 8c.
(4)
LJM on 3 February suggests local easterly wind flow, as shown in Figure 8c.
Under the above pre-weather conditions of Puelche winds at the upper-air level, pre-weather conditions of Puelche winds at lower-air level were as follows:
(5)
High-pressure systems H210 in Figure 8d,e off the coast of CC moved towards the study area while developing. H210 was persistent in the southeast Pacific Ocean.
(6)
H190 on 1 February off the coast of Argentina in Figure 8d was persistent but gradually developed. H190 became H200 on 1 February (Figure 8e) and H220 on 3 February (HS peak fire day) as shown in Figure 8f. H220 may supply Puelche winds into the study area.
(7)
Low-pressure systems related to COL of L80 in Figure 8f may be blocking the northward movement of high-pressure systems of H220.
(8)
Low-pressure systems of L110 in Figure 8e and L100 in Figure 8f may cause strong wind conditions in the study area due to large height differences between L100 and H230 in the southeast Pacific Ocean.

3.2.5. Weather Station Data

In this section, active fire weather conditions are discussed from the occurrence of local winds and hourly changes in weather data (atmospheric pressure, wind speed and direction, temperature, and relative humidity) during active fire periods in 2017 and 2023. The duration of the fire is set at eight days with a daily HS of approximately 500 or more.
  • Large air pressure drops;
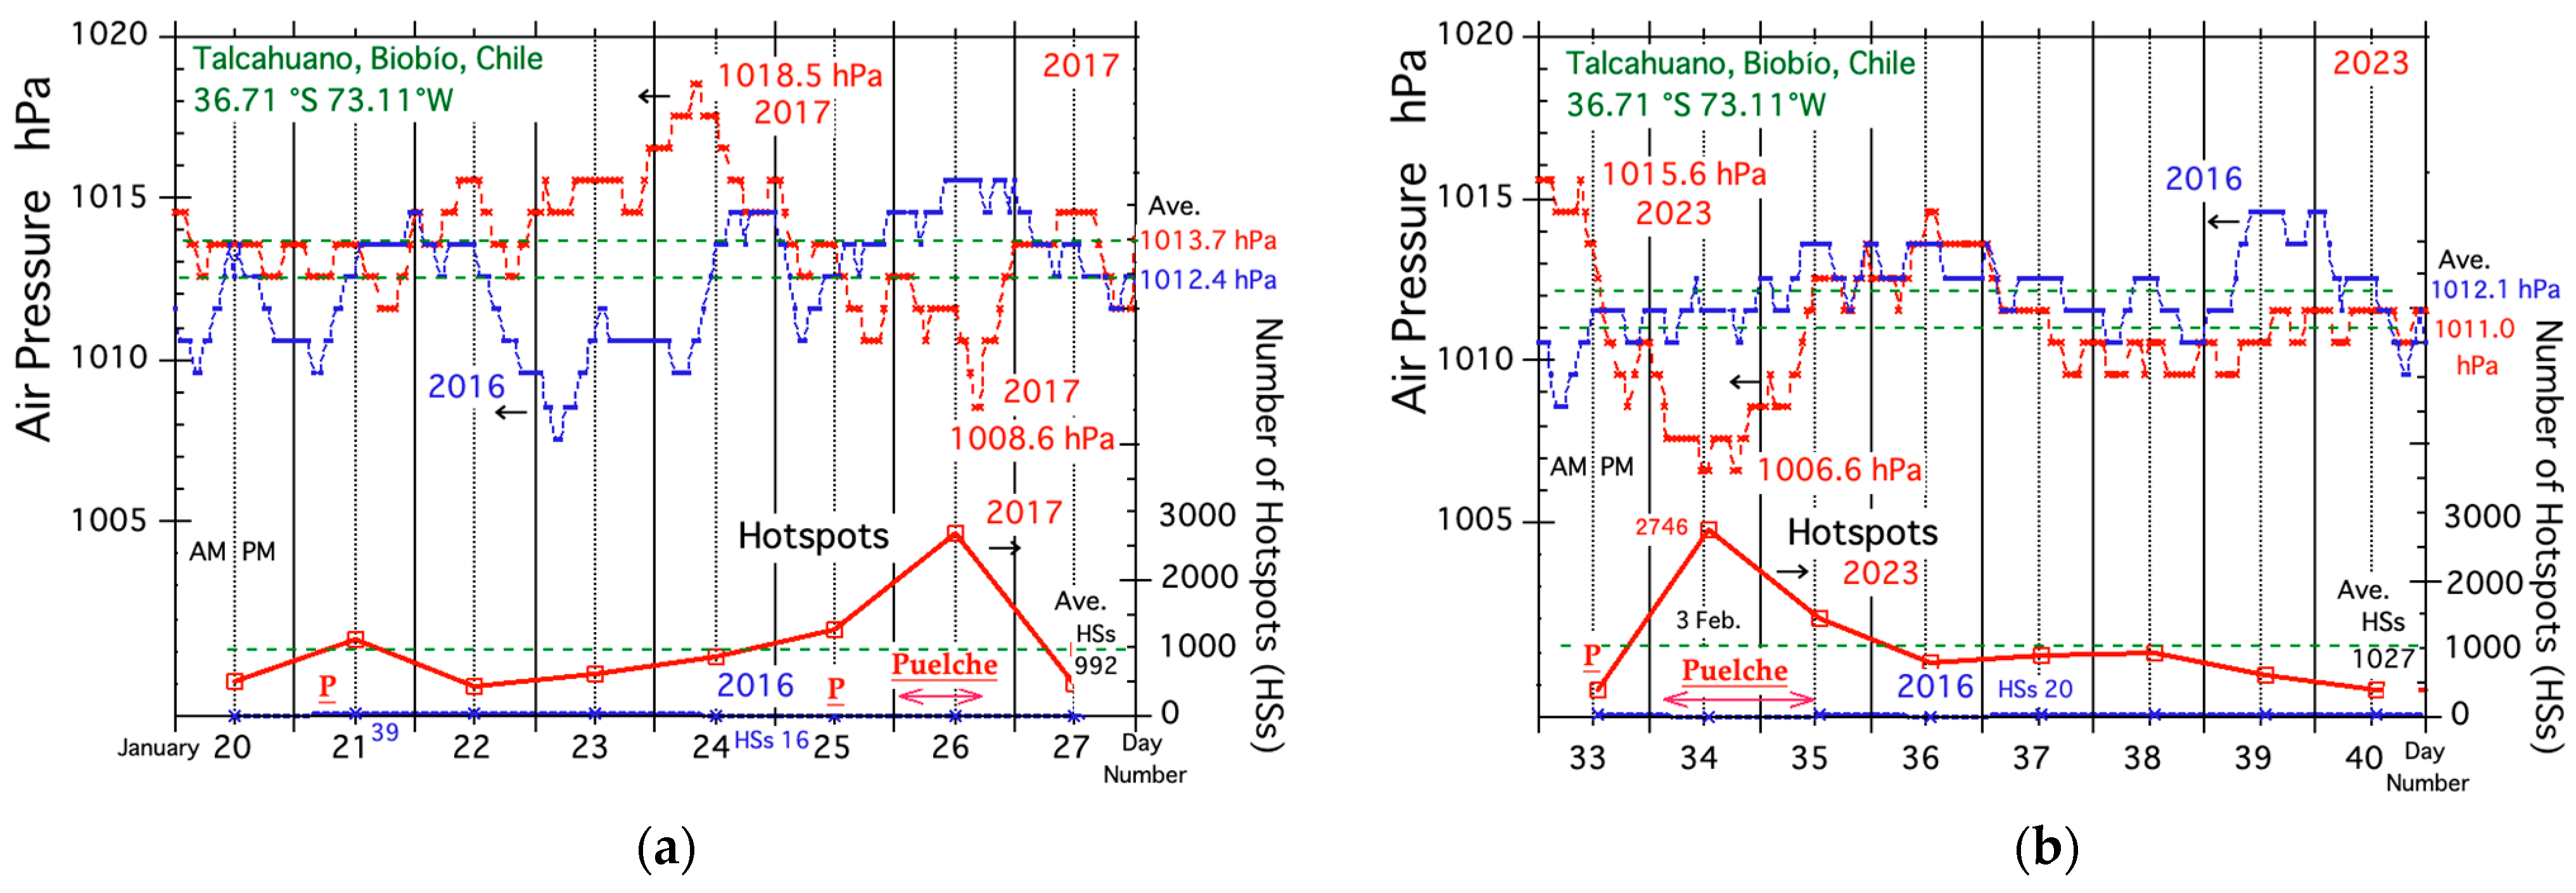
Figure 9a,b shows diurnal changes in air pressure (AP) during the fire periods in 2017, 2023, and 2016 along with HSs and Puelche wind events. The first thing to note in Figure 9a,b is that the largest HSs (HS peak fire days of 26 January 2017 and 3 February 2023) occurred under Puelche winds and after a relatively large air pressure drop of about 10 hPa. These large air pressure drops just before the largest HSs suggest that the extreme fires of 2017 and 2023 occurred related to the development of low-pressure systems over the study area, as shown in Figure 7f and Figure 8f.
Figure 9a shows that the Puelche winds occurred at 00Z on 26 January 2017 (HS peak fire day) and continued to blow for approximately 15 h. A relatively large air pressure drop of about 10 hPa from 1018.55 hPa at 9 a.m. on 24 January to 1008.56 hPa at 4 p.m. on 26 January in 2017 (the average decrease rate = −0.182 hPa h−1) was observed.
Figure 9b shows that the Puelche winds occurred at 03Z on 26 January 2017 (HS peak fire day) and continued to blow for approximately 33 h. A relatively large air pressure drop of about 9 hPa from 1015.55 hPa at 09Z on 2 February to 1006.57 hPa at 16Z on 3 February in 2023 (the average decrease rate = −0.345 hPa h−1) was observed.
  • Strong southeasterly winds;
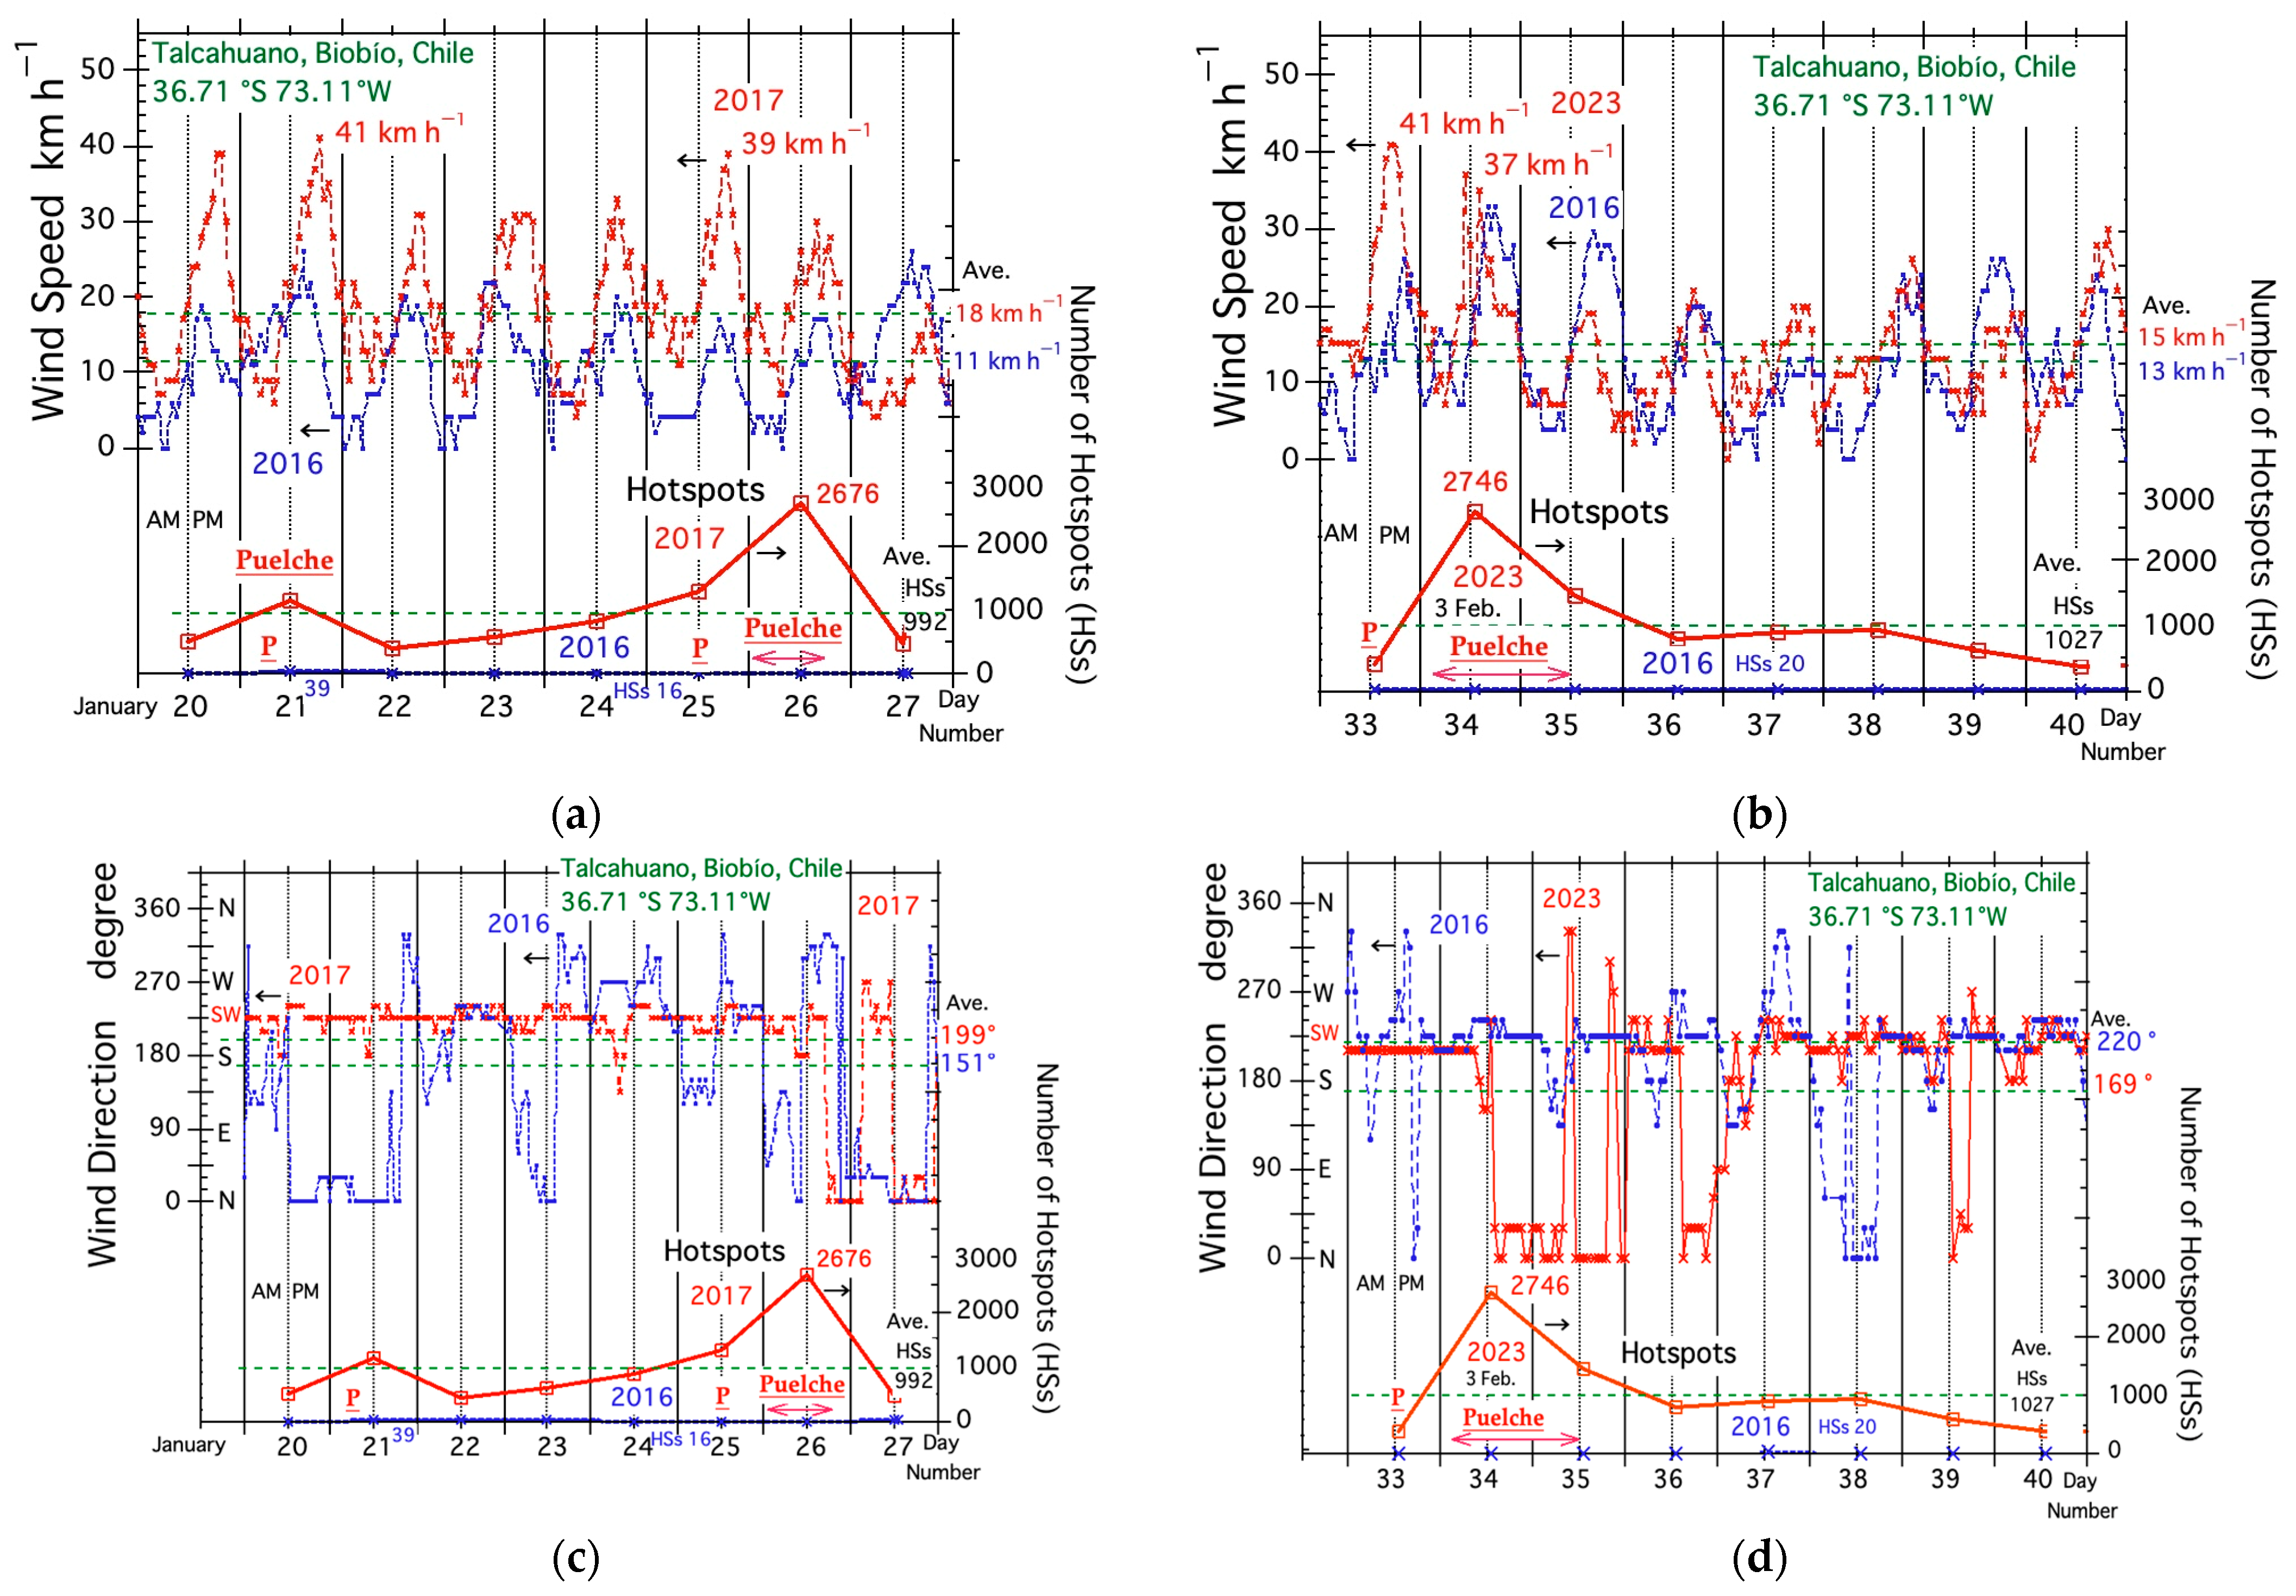
Figure 10 shows diurnal changes in wind speed (WS) and wind direction (WD) during the fire periods in 2017, 2023, and 2016, along with HSs and Puelche winds events. The first thing to notice in Figure 10a,b is that wind speeds exceeding 40 km h−1 (>38.5 km h−1, classified as a “strong breeze” on the Beaufort scale) were observed in 2017 and 2023. We may say that very active fires occurred in both years under very strong winds.
Figure 10a shows that active fires in 2017 occurred under very strong wind-speed conditions (“fresh breeze” (>28.8 km h−1) and “strong breeze”) from 20 to 26 January. Very strong wind speeds of 41 and 39 km h−1 were observed on 21 and 25 January, but both Puelche winds events did not last very long, only a few hours. The average wind speed of 18.3 km h−1 in 2017 was 7.3 km h−1 higher than the average 11.0 km h−1 in 2016. Figure 10b shows that active fires in 2023 occurred mainly under very strong wind speed conditions on 2 and 3 February. A very strong wind speed of 41 km h−1 was observed on 2 February, but Puelche winds event did not last very long, only a few hours. A very strong WS of 37 km h−1 on 3 February occurred during Puelche winds event.
Figure 10c,d show diurnal changes in wind direction during the fire period in 2017, 2023, and 2016 along with HSs. The first thing to notice in Figure 10c,d is that southwesterly (SW) wind predominates during the 2017 and 2023 fire periods (SW is the prevailing wind direction in central Chile). Figure 10c shows that the active fires in 2017 occurred primarily under southwesterly winds (the average wind direction = 199°), except the night time of 26–27 January. Figure 10d shows that active fires in 2023 on 2 and 3 February occurred mainly under southwesterly winds (the constant wind direction = 210°), except from 10 a.m. on 3 February.
Lastly, the changes in wind direction from SW to N for the 2017 and 2023 peak fire dates (26 January) indicate that the change in wind direction from SW to N on the fire peak dates of 2017 and 2023 (26 January 2017 and 3 February 2023) occurred in relation to the respective low-pressure systems, as shown in Figure 7f and Figure 8f.
  • High temperatures and low relative humidity.
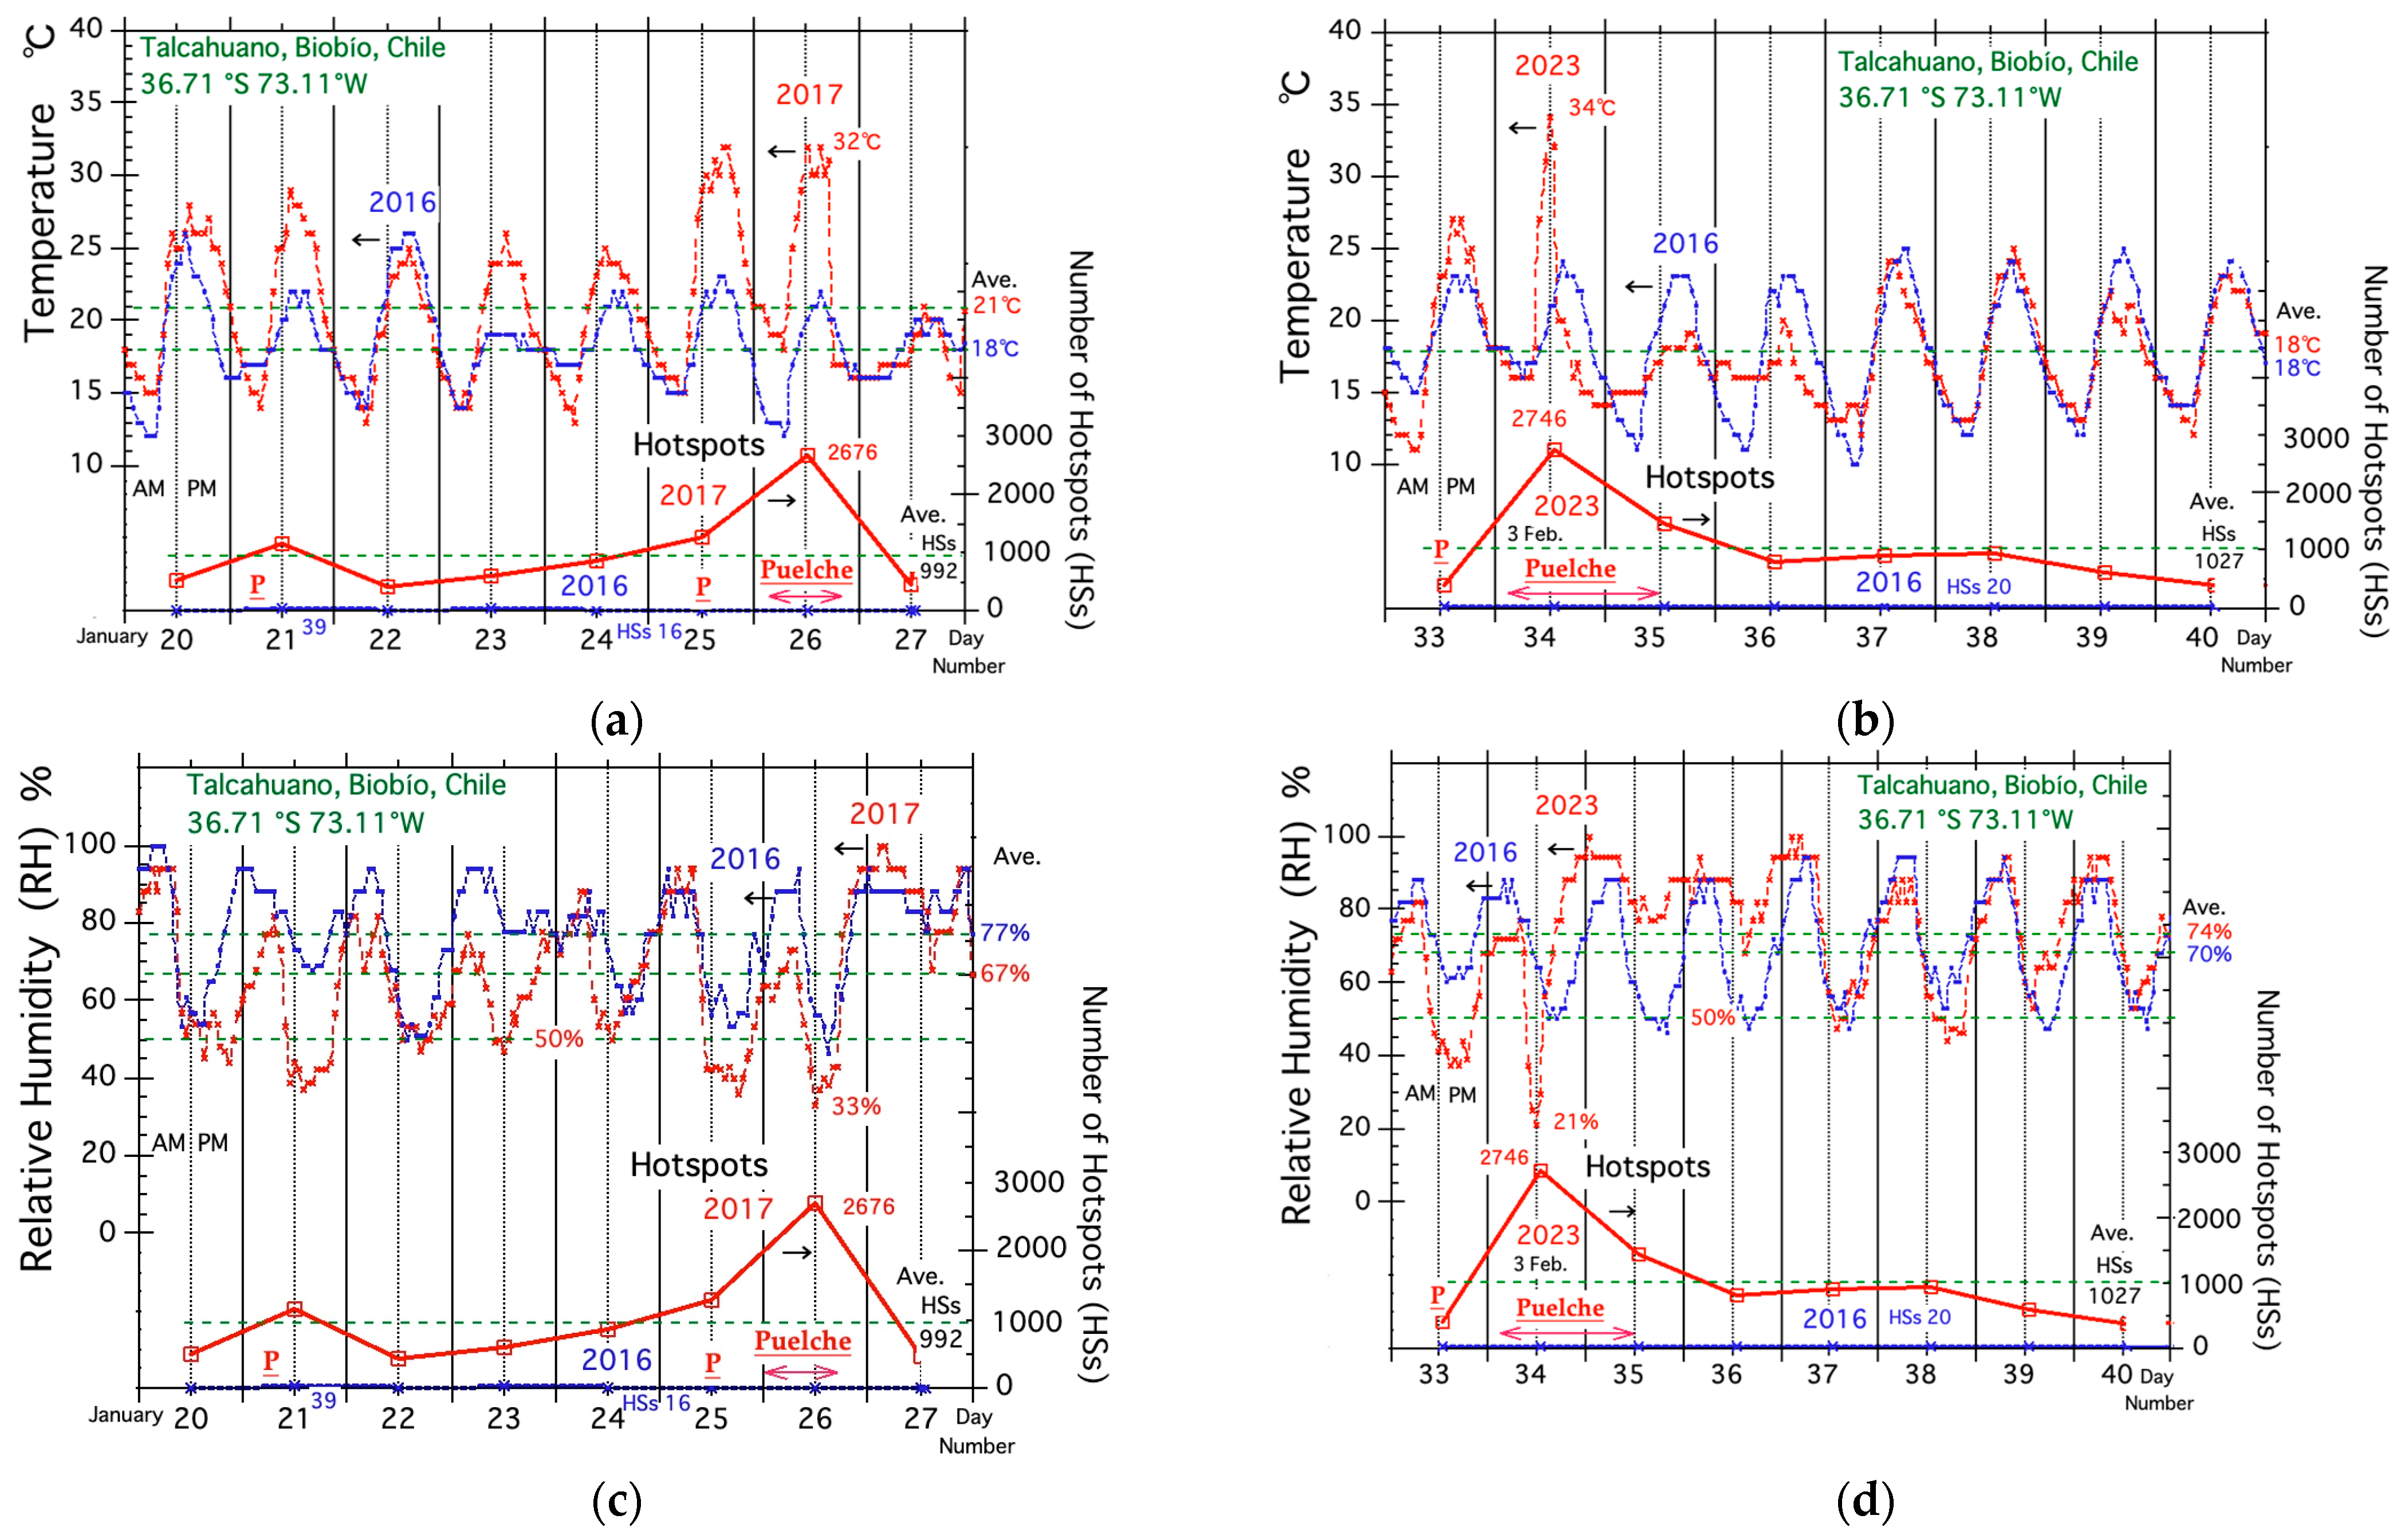
Figure 11a,b shows diurnal changes in air temperature (AT) and daily changes in HSs during the active fire periods in 2017, 2023, and 2016, along with HSs and Puelche winds events. In Figure 11a,b, first note the high air temperature on 26 January 2017 and 3 February 2023 of each peak fire day. High air temperatures of 32 °C and 34 °C on each day may be related to Puelche winds. Large air temperature increases from 8 to 10 am on the peak fire days in 2017 and 2023 were 3 °C h−1 and 5.5 °C h−1, respectively. Those large air temperature increases in the morning hours may be related to Puelche winds, strong summer radiation without clouds, and dry ground conditions without rainfall during the active fire periods in 2017 and 2023.
In the afternoon of the 2017 and 2023 peak fire days, large air temperature drops of about 17 °C (from 32–34 °C to 15–17 °C) occurred. Those air temperature drops were commonly caused by the low-pressure systems in Figure 7f and Figure 8f that shifted wind directions from southwesterly to northerly.
Figure 11c,d shows diurnal changes in relative humidity (RH) and the daily change of HSs during the active fire periods in 2017, 2023, and 2016, along with HSs and Puelche winds events. In Figure 11c,d, first note the low relative humidities on 26 January 2017 and 3 February 2023 of each peak fire day. Relative humidities at 12 pm were 33% and 21% under high relative humidities (32 °C and 34 °C) on each peak fire day.

4. Discussion

4.1. Research on Local Winds and Fires in Chile

Several papers have already been published regarding fires in Chile [11,12,13,14,15,16,17,18,19,20,21,22,23,24,25,26,27] and local winds (Puelche) in southern Chile [28]. However, very few papers have been written on the relationship between fires and local winds in Chile. In this section, the results of this study are compared with those of previous studies on wind and fire.

4.1.1. Research on Local Winds in Chile

One paper on local winds (Puelche) in CC by Montecinos et al. characterized the foehn-like winds called Puelche winds [28]. Their analysis was based on 36 years of CFSR-NCEP daily reanalysis data and showed the climatology of Puelche winds. They reported that Puelche winds are present all year round. They speculated that the air could cross from east to west under a migratory high-pressure system over Argentina due to the low altitude of the Andes mountains south of 35°S. This is consistent with some of the results of this paper. However, there was no mention of fire in their paper.
This paper has identified the relationship between fire and Puelche winds and the weather conditions for Puelche winds development. Figure 9, Figure 10 and Figure 11 show that the Puelche winds continued to blow more than half a day on the peak fire dates in 2017 and 2023. The synoptic scale meteorological conditions for Puelche winds are shown in Figure 5, Figure 7 and Figure 8, and the area of influence of Puelche winds is shown in Figure 6. This paper’s results may help to prevent large fires caused by local winds.

4.1.2. Research on Fires in Chile

Among various papers on fire, one paper by McWethy et al. [27] evaluated synoptic atmospheric conditions and monthly burned area data (1984–2018) for south-central Chile (ca. 32–41°S) from the Chilean Forest Service (CONAF). Their main conclusions are drawn primarily from the results of the monthly analysis, but some of their conclusions (key parameters) are consistent with the results of this paper. This will suggest active fires in 2017 and 2023 occurred under well-known fire-prone conditions in CC.
The second conclusion of McWethy et al. is as follows: “Active fire months are associated with warm surface conditions (maximum temperature) throughout a large area (ca. 34–45°S) of south-central Chile,” meeting high-temperature conditions as shown in Figure 6d,e and Figure 11a,c. Their third conclusion is that “Active fire months are associated with easterly surface wind anomalies linked to reduced onshore westerly ventilation of cooler oceanic winds to the south-central Chilean land surface,” but the relationship between easterly and westerly winds could not be clarified in this paper. The characteristics of the easterly winds need detailed analysis as they are related to the local winds. The other two conclusions of McWethy et al. are discussed in the next section.

4.2. Additional Indication for Puelche Winds

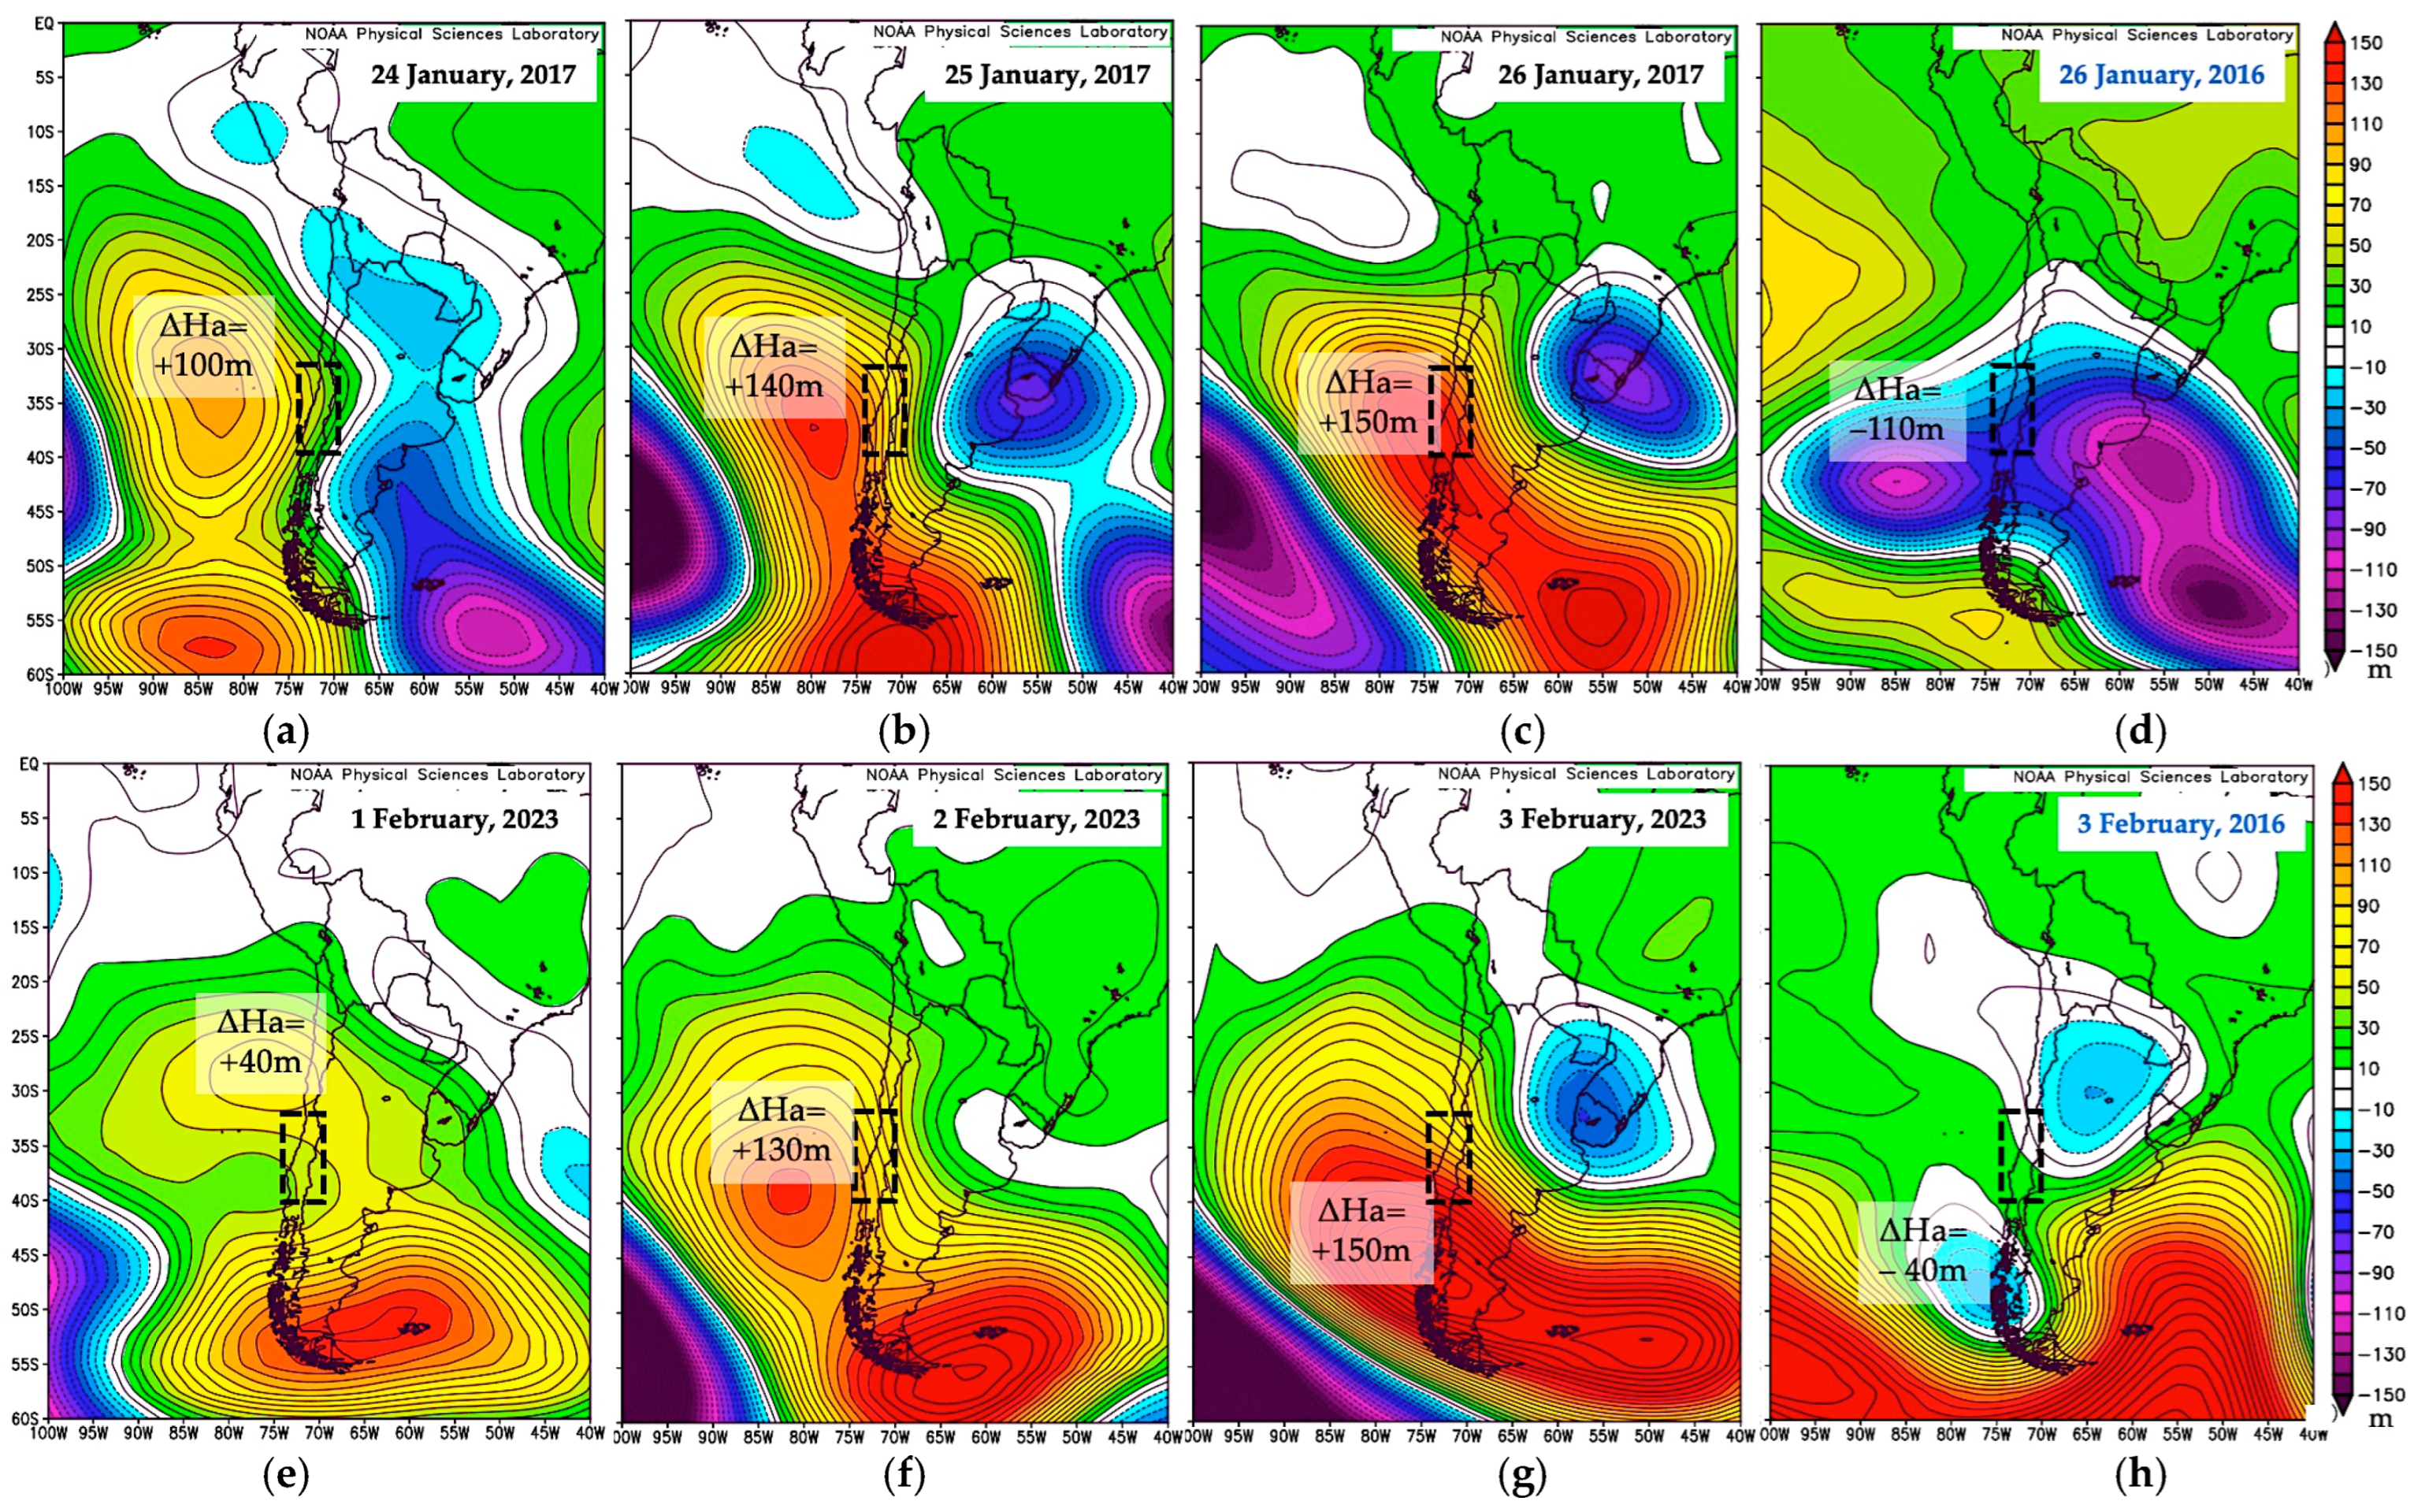
The analysis results in this paper showed synoptic-scale fire-prone conditions related to Puelche winds, which will be one of the indications for active fire occurrences in CC. In addition to the above indications, the average height anomaly (ΔHa for short) at the upper air layer (500 hPa) around CC is discussed here. Figure 12 shows the ΔHa map at the upper air layer (500 hPa) around CC in a few days in 2017, 2023, and 2016 (reference year).
Figure 12a–c shows ΔHa changes around CC from 24–26 January 2017. The ΔHa changed from +100 m on 24 January to +150 m on 26 January (HS peak fire day). In contrast, the 2016 ΔHa on 26 January in Figure 12d was −110 m. Similarly, ΔHa in 2023 increased significantly from +40 m to +150 m, as shown in Figure 12e–g. On the other hand, the 2016 ΔHa in Figure 12h was −40 m. Figure 12c,g on the HS peak fire date shows large ΔHa areas from the study area to the south off the coast of Argentina at 55°S, which will be one of the good indications of Puelche winds.
The first conclusion of McWethy et al. [27], “Active fire months are associated with the persistence of anticyclonic anomalies (high-pressure systems) located over the southeast Pacific Ocean off southern Chile”, supports the occurrence of active fires in 2017 and 2023 under high-pressure systems at upper- and lower-air levels, as shown in Figure 11c,d. Their fourth conclusion, “Active fire months are associated with a circumpolar chain of high-pressure systems at subtropical latitudes and low-pressure around the Antarctic periphery”, meets partially with low- and high-pressure systems shown in Figure 7, Figure 8 and Figure 11c–g. More detailed studies are needed on synoptic-scale weather conditions associated with fires in CC.
Lastly, as this paper shows that the high-temperature zone caused by the Puelche winds event was localized and the event was of short duration, future fire studies may need to be analyzed with high spatial and temporal resolution to prevent large fires caused by local winds.

5. Conclusions

In this paper, fire weather conditions of very active fires under Puelche winds in CC that occurred in 2017 and 2023 were analyzed using satellite-derived fire data, wind streamlines, distribution maps of wind flow and temperature, and various synoptic-scale weather maps.
Major results are summarized as follows below:
  • Fires under Puelche winds.
    • The number of HSs on peak fire days (26 January 2017 and 3 February 2023) were 2676 and 2746. Those numbers were about 90 times larger than the average (30).
    • The occurrence of Puelche winds was confirmed by streamlines from high-pressure systems offshore of Argentina to the study area on the synoptic-scale weather maps.
    • Fires occurred mainly in areas of high winds (>35 km h−1) and high temperatures (>32 °C) made by Puelche winds.
  • Fire weather conditions on synoptic scale weather maps.
    • High-pressure systems offshore of Argentina were so-called migratory high-pressure systems. Their origins were ridges from persistent high-pressure systems in the southeast Pacific Ocean offshore of southern Chile.
    • Large jet stream meandering occurred due to persistent high-pressure systems in the southeast Pacific Ocean offshore of southern Chile.
    • Cut-off low-pressure systems caused by the large jet stream meandering may assist Puelche winds because of the large height difference with high-pressure systems offshore of Argentina.
  • Several indications for Puelche winds.
    • Indications at the weather station: Large temperature increases in the morning hours, high temperatures above 30 °C, strong wind speeds higher than 20 km h−1, and low relative humidity of less than 50%.
    • Several indications from the earth-satellite observations and synoptic-scale weather maps are as follows: streamlines from high-pressure systems offshore of Argentina, strong wind and high-temperature areas, the development of persistent high-pressure systems in the southeast Pacific Ocean, the development of high-pressure systems offshore of Argentina, the development of low-pressure systems in CC, and height anomalies from southern Chile to the south, offshore of Argentina.
Lastly, I do hope this paper’s results will help to prevent future active fire occurrences under Puelche winds in Central Chile.

Funding

This research received no external funding.

Data Availability Statement

All data used in this paper are publicly available on the Internet. Fire (Hotspot) data: MODIS Collection 6.1, https://firms2.modaps.eosdis.nasa.gov/download/, accessed on 15 May 2023. Rainfall data: JAXA, https://sharaku.eorc.jaxa.jp/GSMaP_CLM/index.htm, accessed on 1 October 2023. Hourly weather data: Weather Underground, Talcahuano: https://www.wunderground.com/history/daily/cl/talcahuano/SCIE/date/2017-1-17 (accessed on 1 October 2023). NCEP/NCAR 40-year reanalysis data: https://psl.noaa.gov/data/composites/day/, accessed on 9 May 2024. Climate data (Climate and Average Weather YearRound): Talcahuano, https://weatherspark.com/y/24149/Average-Weather-in-Talcahuano-Chile-Year-Round, accessed on 1 October 2023. Wind and temperature maps from Earth (https://earth.nullschool.net/jp/about.html, accessed on 9 February 2024).

Acknowledgments

I would like to thank the following institutes and various earth data sites and English translator sites: (1) Various weather maps from the Twentieth-Century Reanalysis Project version 3 dataset provided by the U.S. Department of Energy, Office of Science Biological and Environmental Research (BER), by the National Oceanic and Atmospheric Administration Climate Program Office, and by the NOAA Physical Sciences Laboratory. (2) Rainfall data from the JAXA (https://sharaku.eorc.jaxa.jp/GSMaP_CLM/index.htm, accessed on 1 October 2023). (3) Hourly weather data from Weather Underground (https://www.wunderground.com/history/daily/my/malacca/WMKM/date/2019-3-6, accessed on 11 August 2023). (4) Various maps from Google Map Pro by Google LLC. (5) Various imagery from NASA’s Worldview application (https://worldview.earthdata.nasa.gov, accessed on 1 October 2023), part of NASA’s Earth Observing System Data and Information System (EOSDIS). (6) Climate data from “Climate and Average Weather Year Round” (Weather Spark, https://weatherspark.com/y/24149/Average-Weather-in-Talcahuano-Chile-Year-Round (accessed on 1 October 2023)). (8) Wind maps from earth (https://earth.nullschool.net/jp/about.html, accessed on 8 February 2024).

Conflicts of Interest

The author declares no conflicts of interest.

References

  1. Seneviratne, S.I.; Zhang, X.; Adnan, M.; Badi, W.; Dereczynski, C.; Di Luca, A.; Ghosh, S.; Iskandar, I.; Kossin, J.; Lewis, S.; et al. Weather and Climate Extreme Events in a Changing Climate. In Climate Change 2021: The Physical Science Basis. Contribution of Working Group I to the Sixth Assessment Report of the Intergovernmental Panel on Climate Change 2021; Cambridge University Press: Cambridge, UK; New York, NY, USA, 2021; pp. 1513–1766. Available online: https://www.ipcc.ch/report/ar6/wg1/downloads/report/IPCC_AR6_WGI_Chapter11.pdf (accessed on 1 October 2023). [CrossRef]
  2. UN Environment Program. UN Report Spreading Like Wildfire/The Rising Threat. Available online: https://www.unep.org/resources/report/spreading-wildfire-rising-threat-extraordinary-landscape-fires (accessed on 13 December 2023).
  3. Benali, A.; Mota, B.; Carvalhais, N.; Oom, D.; Miller, L.M.; Campagnolo, M.L.; Pereira, J.M.C. Bimodal fire regimes unveil a global-scale anthropogenic fingerprint. Glob. Ecol. Biogeogr. 2017, 26, 799–811. [Google Scholar] [CrossRef]
  4. Morton, D.C.; Defries, R.S.; Randerson, J.T.; Giglio, L.; Schroeder, W.; Vanderwerf, G.R. Agricultural intensification increases deforestation fire activity in Amazonia. Glob. Chang. Biol. 2008, 14, 2262–2275. [Google Scholar] [CrossRef]
  5. Ward, D.S.; Kloster, S.; Mahowald, N.M.; Rogers, B.M.; Randerson, J.T.; Hess, P.G. The changing radiative forcing of fires: Global model estimates for past, present and future. Atmos. Chem. Phys. 2012, 12, 10857–10886. [Google Scholar] [CrossRef]
  6. Giorgi, F.; Jones, C.; Asrar, G. Addressing climate information needs at the regional level: The CORDEX framework. WMO Bull. 2009, 58, 175–183. [Google Scholar]
  7. Giorgi, F.; Raffaele, F.; Coppola, E. The response of precipitation characteristics to global warming from climate projections. Earth Syst. Dyn. 2019, 10, 73–89. [Google Scholar] [CrossRef]
  8. Giorgi, F.; Coppola, E.; Raffaele, F.; D Diro, G.T.; Fuentes-Franco, R.; Giuliani, G.; Mamgain, A.; Llopart, M.P.; Mariotti, L. Changes in extremes and hydroclimatic regimes in the CREMA ensemble projections. Clim. Chang. 2014, 125, 39–51. [Google Scholar] [CrossRef]
  9. Page, S.E.; Siegert, F.; Rieley, J.O.; Boehm, H.-D.V.; Adi, J.; Limin, S. The amount of carbon released from peat and forest fires in Indonesia during 1997. Nature 2002, 420, 61–65. [Google Scholar] [CrossRef]
  10. Page, S.; Rieley, J.; Hoscilo, A.; Spessa, A.; Weber, U. Current fire regimes, impacts and the likely changes-IV, Tropical Southeast Asia. In Vegetation Fires and Global Change Challenges for Concerted International Action A White Paper Directed to the United Nations and International Organizations; Publishing House: Amsterdam, The Netherlands, 2013. [Google Scholar]
  11. Miller, E.A.; Baughman, C.A.; Jones, B.M.; Jandt, R.R. Biophysical effects of an old tundra fire in the Brooks Range Foothills of Northern Alaska, U.S.A. Polar Sci. 2024, 39, 100984. [Google Scholar] [CrossRef]
  12. González, M.E.; Gómez-González, S.; Lara, A.; Garreaud, R.; Díaz-Hormazábal, I. The 2010–2015 Megadrought and its influence on the fire regime in central and south-central Chile. Ecosphere 2018, 9, e02300. [Google Scholar] [CrossRef]
  13. Urrutia-Jalabert, R.; González, M.E.; González-Reyes, Á.; Lara, A.; Garreaud, R. Climate variability and forest fires in central and south-Central Chile. Ecosphere 2018, 9, e02171. [Google Scholar] [CrossRef]
  14. Soto, M.E.C. Diagnosis of Forest Fires in Chile. In Wildland Fires—A Worldwide Reality; Gonçalves, A.J.B., Vieira, A.A.B., Eds.; Nova Science Publishers, Inc.: Hauppauge, NY, USA, 2015; ISBN 978-1-63483-397-4. Available online: https://www.researchgate.net/publication/296950940_Diagnosis_of_forest_fires_in_Chile (accessed on 18 December 2023).
  15. McWethy, D.B.; Pauchard, A.; García, R.A.; Holz, A.; González, M.E.; Veblen, T.T. Landscape drivers of recent fire activity (2001–2017) in south-central Chile. PLoS ONE 2018, 13, e0201195. [Google Scholar] [CrossRef] [PubMed]
  16. Braun ACh Faßnacht, F.; Valencia, D.; Sepulveda, M. Consequences of land-use change and the wildfire disaster of 2017 for the central Chilean biodiversity hotspot. Reg. Environ. Chang. 2021, 21, 37. [Google Scholar] [CrossRef]
  17. Peña, E.; Valenzuela, L. Incremento de los incendios forestales en bosques naturales y plantaciones forestales en Chile. In Memorias del Segundo Simposio Internacional sobre Políticas, Planificación y Economía de los Programas de Protección Contra Incendios Forestales; González, A., Ed.; Una Visión Global, USDA Forest Service GTR-PSW-208; USDA: Washington, DC, USA, 2008; pp. 595–612. [Google Scholar]
  18. Garfias, R.; Castillo, M.E.; Ruiz, F.; Julio, G.H.; Quintanilla, V.; Antúnez, J. Caracterización socioeconómica de la población en áreas de riesgo de incendios forestales. Estudio de caso, interfaz urbanoforestal. Provincia de Valparaíso. Chile Cent. Territ. 2012, 19, 101–109. [Google Scholar] [CrossRef]
  19. Bowman, D.M.J.S.; Williamson, G.J.; Prior, L.D.; Murphy, B.P. The relative importance of intrinsic and extrinsic factors in the decline of obligate seeder forests. Glob. Ecol. Biogeogr. 2016, 25, 1166–1172. [Google Scholar] [CrossRef]
  20. Ubeda, X.; Sarricolea, P. Wildfires in Chile: A review. Glob. Planet. Chang. 2016, 146, 152–161. [Google Scholar] [CrossRef]
  21. Curt, T.; Frejaville, T. Wildfire policy in Mediterranean France: How far is it efficient and sustainable? Risk Anal. 2018, 38, 472–488. [Google Scholar] [CrossRef] [PubMed]
  22. Stewart, S.I.; Radeloff, V.C.; Hammer, R.B.; Hawbaker, T.J. Defining the wildland urban interface. J. For. 2007, 105, 201–207. [Google Scholar]
  23. Sarricolea, P.; Herrera-Ossandon, M.; Meseguer-Ruiz, Ó. Climatic regionalisation of continental Chile. J. Maps 2017, 13, 66–73. [Google Scholar] [CrossRef]
  24. Sarricolea, P.; Serrano-Notivoli, R.; Fuentealbac, M.; Hernández-Morad, M.; Barrerae, F.; Smitha, P.; Meseguer-Ruizh, Ó.; Sarricolea, P. Recent wildfires in Central Chile: Detecting links between burned areas and population exposure in the wildland urban interface. Sci. Total Environ. 2020, 706, 135894. [Google Scholar] [CrossRef]
  25. Cordero, R.R.; Feron, S.; Damiani, A.; Carrasco, J.; Karas, C.; Wang, C.; Kraamwinkel, C.T.; Beaulieu, A. Extreme fire weather in Chile driven by climate change and El Niño–Southern Oscillation (ENSO). Sci. Rep. 2024, 14, 1974. [Google Scholar] [CrossRef]
  26. Valdivia, J.; Avila, I.; Auat-Cheein, F.; Fuentes, A.; Reszka, P. Anatomy of the Las Máquinas wildfire using remote sensing tools. In Advances in Forest Fire Research 2022; Viegas, D.X., Ribeiro, L.M., Eds.; Chapter 2—Fire at the Wildland Urban Interface; Universidade de Coimbra: Lisbon, Portugal, 2022; p. 517. [Google Scholar] [CrossRef]
  27. McWethy, D.B.; Garreaud, R.D.; Holz, A.; Pederson, G.T. Broad-Scale Surface and Atmospheric Conditions during Large Fires in South-Central Chile. Fire 2021, 4, 28. [Google Scholar] [CrossRef]
  28. Montecinos, A.; Muñoz, R.C.; Oviedo, S.; Martínez, A.; Víllagrán, V. Climatological Characterization of Puelche Winds down the Western Slope of the Extratropical Andes Mountains Using the NCEP Climate Forecast System. J. Appl. Meteorol. Climatol. 2017, 56, 677–696. [Google Scholar] [CrossRef]
  29. Escribano, R.; Hidalgoa, P.; Fuentes, M.; Donoso, K. Zooplankton time series in the coastal zone off Chile: Variation in upwelling and responses of the copepod community. Prog. Oceanogr. 2012, 97–100, 174–186. [Google Scholar] [CrossRef]
  30. Valderrama, L.; Contreras-Reyes, J.E.; Carrasco, R. Raúl Carrasco Ecological Impact of Forest Fires and Subsequent Restoration in Chile. Resources 2018, 7, 26. [Google Scholar] [CrossRef]
  31. Hoinka, K.P. What is a foehn clearance? Bull. Am. Meteor. Soc. 1985, 66, 1123–1132. [Google Scholar] [CrossRef]
  32. Hayasaka, H.; Tanaka, H.L.; Bieniek, P.A. Synoptic-scale fire weather conditions in Alaska. Polar Sci. 2016, 10, 217–226. [Google Scholar] [CrossRef]
  33. Hayasaka, H. Fire Weather Conditions in Boreal and Polar Regions in 2002–2021. Atmosphere 2022, 13, 1117. [Google Scholar] [CrossRef]
Figure 1. Maps of Chile and the study area in central Chile (CC). The study area is shown by the yellow rectangle. (a) Map of Chile. The base map is a NASA Worldview image on 26 January 2017 (https://worldview.earthdata.nasa.gov, accessed on 18 April 2024). The boundary of Chile is shown by the thin white zigzag line. The Tropic of Capricorn is shown as a red dashed line. Ocean currents are indicated by blue and green-yellow arrows indicating the direction of flow. (b) The study area in CC (32–40°S, 70–74°W). The boundary of Chile is shown by the thin yellow zigzag line. The area of a 1° grid cell (yellow dashed line rectangle at 33–34°S) is about 10,000 km2. Yellow figures such as 267, 541, and so on show the average number of hotspots (HSs year−1, excluding 2017 and 2023 HS data) in each 1° grid cell. Two red numbers 3405 and 3297 are the number of hotspots in each 1° grid cell in 2017 and 2023, respectively. Talcahuano (36.71°S, 73.11°W) is located approximately 14 km northwest of Concepción. Base map: Google Earth Pro.
Remotesensing 16 02605 g001
Figure 2. Average dry period and fire periods in CC. (a) Average dry and rainy periods. (b) Average fire period. Ave.: Average, Tran.: Transition, J: January, F: February, M: March, A: April, M: May, J: June, J: July, A: August, S: September, O: October, N: November, D: December.
Remotesensing 16 02605 g002
Figure 3. Recent annual fire trends in Chile from 2003 to 2023. σ: standard deviation.
Remotesensing 16 02605 g003
Figure 4. Fire trends in 2017, 2023, and 2016 (reference year). The red, green, and blue solid lines show the daily HSs in 2017, 2023, and 2016, respectively. The red, green, and blue broken lines indicate the daily HS for 2017, 2023, and 2016, respectively. The two red lines with arrows show the active fire periods in 2017 and 2023.
Remotesensing 16 02605 g004
Figure 5. Worldview satellite images with HSs and MERRA-2 weather maps. (a) Satellite image on 26 January 2017. (b) Satellite image on 3 February 2023. (c) Satellite image on 3 February 2016. The yellow rectangles show the study area. HS is showed by red spots. Very active fire areas in 2017 and 2023 are indicated by the yellow dotted ovals in (a) and (b). The yellow circles are the location of the weather station (Talcahuano). (d) Weather map at 12Z on 26 January 2017. (e) Weather map at 12Z on 3 February 2023. (f) Weather map at 12Z on 3 February 2016. The wind streamlines toward the study area are shown by red color. The blue rectangles show the study area. H and L in (df) represent high-pressure systems and low-pressure systems.
Remotesensing 16 02605 g005aRemotesensing 16 02605 g005b
Figure 6. Strong winds and high-temperature areas at ground level in CC made by Earth. (a) Strong wind areas at 12Z on 26 January 2017. (b) Strong wind areas at 12Z on 3 February 2023. (c) Strong wind areas at 12Z on 3 February 2016. (d) High-temperature areas at 12Z on 26 January, 2017. (e) High-temperature areas at 12Z on 3 February 2023. (f) High-temperature areas at 12Z on 3 February 2016. Areas of strong winds and high temperatures in CC are indicated by white-dashed circles. The red-dashed rectangles, small light-green circles (〇), and white-dashed curves in (af) are the study area, location of the weather station (Talcahuano), and major wind streamlines toward the study area, respectively.
Remotesensing 16 02605 g006aRemotesensing 16 02605 g006b
Figure 7. Weather maps of average height (AH) at 12Z on from 24–27 January 2017. (a) AH on 24 January, (b) AH on 25 January, (c) AH on 26 January. AH at the upper-air level (500 hPa). The white rectangle indicates the study area. (d) AH on 24 January, (e) AH on 25 January, (f) AH on 26 January. AH at the lower-air level (1000 hPa). The red rectangle indicates the study area. H and L represent high-pressure systems and low-pressure systems with their height (m). The blue lines and grey dashed lines are ridges and troughs.
Remotesensing 16 02605 g007
Figure 8. Weather maps of average height (AH) at 12Z on from 1–3 February 2023. (a) AH on 1 February, (b) AH on 2 February, (c) AH on 3 February. AH at the lower-air level (1000 hPa). White rectangle indicates the study area. (d) AH on 1 February, (e) AH on 2 February, (f) AH on 3 February. AH at the upper-air level (500 hPa). Red rectangle indicates the study area. H and L represent high-pressure systems and low-pressure systems with their height (m). The blue and grey dashed lines are ridges and troughs.
Remotesensing 16 02605 g008
Figure 9. Air pressure (AP), HSs, and the Puelche winds in 2017, 2023, and 2016 (reference year). The red curves are for AP in 2017 and 2023. The blue dashed curves are for AP in 2016. The two green dashed lines at the top of the figure are the average AP values for 2017, 2023, and 2016. The green dashed line at the bottom of the figure is the average HSs value for 2017, 2023, and 2016. The Puelche wind events are indicated using straight lines with arrows at both ends, Puelche, and P. (a) AP and HSs in 2017 and 2016. (b) AP and HSs in 2023 and 2016.
Remotesensing 16 02605 g009
Figure 10. Wind speed (WS), wind direction (WD), and hotspots in 2017, 2023, and 2016 (reference year). The red curves are for WS and WD in 2017 and 2023. The blue dashed curves are for WS and WD in 2016. The two green dashed lines near the top of the figure are the average values of WS and WD for 2017 and 2023. The green dashed line near the bottom of the figure is the average WS and WD values for 2016. The Puelche winds events are indicated using straight lines with arrows at both ends, Puelche, and P. (a) WS and HSs in 2017 and 2016. (b) WS and HSs in 2023 and 2016. (c) WD and HSs in 2017 and 2016. (d) WD and HSs in 2023 and 2016.
Remotesensing 16 02605 g010
Figure 11. Air temperature (AT), relative humidity (RH), and hotspots (HSs) in 2017, 2023, and 2016 (reference year). The red curves are for AT and RH in 2017 and 2023. The blue dashed curves are for AT and RH in 2016. The two green dashed lines near the top of the figure are the average values of AT and RH for 2017 and 2023. The green dashed line near the bottom of the figure is the average AT and RH values for 2016. The Puelche winds events are indicated using straight lines with arrows at both ends, Puelche, and P. (a) Air temperature and HSs in 2017 and 2016. (b) Air temperature and HSs in 2023 and 2016. (c) RH and HSs in 2017 and 2016. (d) RH and HSs in 2023 and 2016.
Remotesensing 16 02605 g011
Figure 12. Weather maps of average height anomaly (m) at the upper- and lower-air level. The black-dashed line rectangle indicates the study area. ΔHa: average height anomaly (m) from 1991–2020 climatology, (a) 24 January 2017, (b) 25 January 2017, (c) 26 January 2017 (HS peak fire day), (d) 26 January 2016 (reference year), (e) 1 February 2023, (f) 2 February 2023, (g) 3 February 2023 (HS peak fire day), (h) 3 February 2016 (reference year).
Remotesensing 16 02605 g012
Disclaimer/Publisher’s Note: The statements, opinions and data contained in all publications are solely those of the individual author(s) and contributor(s) and not of MDPI and/or the editor(s). MDPI and/or the editor(s) disclaim responsibility for any injury to people or property resulting from any ideas, methods, instructions or products referred to in the content.