Article

A Method for Estimating Soybean Sowing, Beginning Seed, and Harvesting Dates in Brazil Using NDVI-MODIS Data

by
Cleverton Tiago Carneiro de Santana
1,2,*,
Ieda Del’Arco Sanches
1,3,
Marcellus Marques Caldas
4 and
Marcos Adami
1,3
1
Remote Sensing Graduate Program (PGSER), Coordination of Teaching, Research and Extension (COEPE), National Institute for Space Research (INPE), Av. dos Astronautas, 1.758, São José dos Campos 12227-010, SP, Brazil
2
Management of Crop Monitoring (GEASA), Superintendence of Agricultural Information (SUINF), Directorate of Agricultural Policy and Information (DIPAI), National Food Supply Company (CONAB), SGAS I Setor de Grandes Áreas Sul 901 s/n, Asa Sul, Brasília 70390-010, DF, Brazil
3
Earth Observation and Geoinformatics Division (DIOTG), General Coordination of Earth Science (CG-CT), National Institute for Space Research (INPE), Av. dos Astronautas, 1.758, São José dos Campos 12227-010, SP, Brazil
4
Department of Geography and Geospatial Sciences, Kansas State University, 1001 Seaton Hall, Manhattan, KS 66506-1111, USA
*
Author to whom correspondence should be addressed.
Remote Sens. 2024, 16(14), 2520; https://doi.org/10.3390/rs16142520
Submission received: 22 May 2024 / Revised: 6 July 2024 / Accepted: 7 July 2024 / Published: 9 July 2024
(This article belongs to the Special Issue Cropland Phenology Monitoring Based on Cloud-Computing Platforms)

Abstract

:
Brazil, as a global player in soybean production, contributes about 35% to the world’s supply and over half of its agricultural exports. Therefore, reliable information about its development becomes imperative to those who follow the market. Thus, this study estimates three phenological stages of soybean crops (sowing, beginning seed, and harvesting dates), identifying spatial–temporal patterns of soybean phenology using phenological metric extraction techniques from Normalized Difference Vegetation Index (NDVI) time-series data from the Moderate Resolution Imaging Spectroradiometer (MODIS) sensor. Focused on the state of Paraná, this study validates the methodology using reference data from the Department of Rural Economics (DERAL). Subsequently, the model was applied to the major Brazilian soybean area cultivation. The results demonstrate strong agreement between the phenological estimates and reference data, showcasing the reliability of phenological metrics in capturing the stages of the soybean cycle. This study represents the first attempt, to the best of our knowledge, to correlate the vegetative peak of soybeans with the beginning seed stage at a large scale within Brazilian territory. Amidst the urgent need for the accurate estimation of agricultural crop phenological stages, particularly considering extreme weather events threatening global food security, this research emphasizes the continual importance of advancing techniques for soybean monitoring.

1. Introduction

Global grain production exceeded the 3-billion-ton threshold in 2021, and Brazil reached around 250 million tons, positioning Brazil as the world’s fourth-largest producer. Within this nation’s agricultural sector, soybeans are particularly prominent, constituting about half of its total agricultural output. This country has recently ascended to the forefront of global soybean production and exportation, accounting for around 35% of worldwide production and 53% of its total exports [1]. This leadership in soybean production and international trade significantly contributes to enhancing the nation’s economic landscape. It also plays a crucial role in creating jobs and income [2], distributed throughout its diverse regions.
Given the significant importance of soybean cultivation to Brazil’s economy, generating reliable information about its development becomes indispensable to guide critical decisions throughout the production chain [3]. Among the physiological factors influencing the productive cycle’s development, the sowing period, the maturation groups, and the duration of phenological stages stand out. These elements have a direct impact on soybean development and, when adequately monitored, significantly contribute to assertive decision-making across the agricultural production chain. However, in a country such as Brazil, with continental dimensions, great edaphic–climatic variations, and different combinations of technologies adopted by farmers, monitoring the crop’s agricultural calendar is challenging.
Brazilian soybean sowing typically occurs predominantly from October to December, with harvesting taking place from January to May. However, it is important to note that these periods vary considerably across different regions of the country. As an example, while the Paraná (Southern Brazil) and the Mato Grosso (Central-West Brazil) states follow the predominant period, in the states of Roraima (Northern Brazil) and Alagoas (Northeastern Brazil), the sowing period extends from April to June, and the harvest occurs from August to October [4].
In addition to the variability in the agricultural calendar, soybean also exhibits a remarkable diversity of cultivars, classified according to maturation groups. Maturation groups are categories used to classify different soybean varieties based on their maturation characteristics. Maturation groups situated below 6.0 are used to classify extra-early cultivars (cycles shorter than 90 days). Those classified between 6.0 and 6.5 are considered early (cycles ranging from 90 to 110 days), while those close to 7.0 follow a normal cycle (cycles ranging from 110 to 120 days). Late cultivars, encompassing maturation groups greater than 8, have longer cycles, exceeding 130 days [5]. In other words, the higher the maturation group value, the longer the crop cycle duration. This classification is based on the characterization of soybean as a short-day plant because it induces flowering when the day length is shorter than its critical photoperiod [6]. Thus, if soybean sowing is carried out later, its productive cycle decreases, because each cultivar has a specific number of light hours, known as the critical photoperiod, above which flowering is delayed.
Moreover, soybean demonstrates significant dynamics among its phenological stages, with its progression associated with temperature variations [7]. These variations directly influence the transition period between phenological stages, which can range from 1 to 30 days [8], manifesting significant changes in plant biomass within just a week [9]. Among the various phenological stages, emergence (VE), beginning seed (R5), and full maturity (R8) are critical in the agricultural monitoring of this crop, as they are determinants for decision-making along the supply chain.
The identification of emergence, for example, enables the estimation and modeling of sowing behavior, and this information can be used as a parameter in crop simulation models for productivity estimation. It is also possible to verify compliance with the Brazilian soybean sanitary vacuum period and the Agricultural Climate Risk Zoning (ZARC). The sanitary vacuum period (60 to 90 days) is a time during which the presence of live soybean plants is not allowed to control Asian soybean rust [10]. ZARC is an agricultural policy and risk management tool that defines sowing windows to minimize risks related to climatic adversities and is an integral part of the criteria for granting agricultural credit and rural insurance [11]. And the beginning seed is a crucial stage in the soybean development cycle, where there is the accumulation of nutrients in the grains, directly influencing the final crop yield. If the plant is subjected to stress (high temperatures and/or low precipitation), the loss of productivity becomes irreversible. Monitoring full maturity, in turn, enables the estimation of the ideal time for harvest [12], logistical planning (transport and storage), and the assessment of the commodity price impact.
However, a hurdle in modeling large-scale soybean plantations is the lack of data, such as phenological information [13]. Even in developed countries, the necessary data are not always available with adequate geospatial details [14]. To overcome this problem, in Brazil, the National Food Supply Company (CONAB) conducts subjective surveys to generate weekly estimates of the percentage of soybean sowing, beginning seed (R5), and harvesting at the national level. Similar data are estimated at the state level by other entities, such as the Department of Rural Economics (DERAL) of the Paraná State Secretariat of Agriculture and Supply (SEAB). However, these surveys do not offer the possibility of quantifying the errors of the estimates because they are based on the opinions of market agents [15]. Additionally, the reports released present the cumulative total for each state or region within the state, where the development stages of the crop are reported in cumulative percentages for each week. This is important information for crop monitoring at the national or regional level, but spatial variability within the statistical unit is not captured, which limits the ability to quantify dates with a sufficient spatial–temporal resolution to identify detailed patterns in regional soybean phenology. Therefore, these data are not suitable to be used in crop growth models and to assess the climatic and socioeconomic impact on the behavior of soybean sowing and harvesting [16]. Furthermore, the cumulative percentage for the crops to reach 100% of a certain stage demands a prolonged period, which suggests high variability within the statistical units [17].
Thus, the criteria used to identify the periods of sowing, beginning seed, and harvesting must encompass the influences of all factors impacting their development, whether from management or the environment. However, this is a significant challenge, as most data are obtained through interviews with agents in the production chain, and adequate monitoring throughout the phenological cycle demands data on at least a weekly basis [18,19]. Conducting in situ samplings (visual surveys of phenology) could be an alternative, as it provides objective measures. But this method is costly, requires skilled labor, demands rigorous statistical rigor in sampling, and may present low accuracy if not properly applied [20].
In this context, the agricultural crop monitoring techniques that use remote sensing data gain importance, which are primarily based on metrics that most effectively capture phenological variations [21]. These are periodic events in vegetation development that are linked to environmental conditions, such as temperature, humidity, and precipitation [22]. The detection of phenological development stages from phenological metrics, especially in agricultural crops, has been carried out by adjusting time-series data [23,24,25,26]. These phenological metrics are particularly important for agricultural applications, as they can provide crucial insights into the various developmental stages of crops [27,28].
Therefore, the present study aims to estimate three key phenological stages of soybean crops addressing some of the abovementioned issues by leveraging satellite data processing techniques. The objective is to evaluate the sowing, beginning seed, and harvesting dates of soybeans in Brazil to identify the spatial–temporal patterns of soybean phenology based on the application of phenological metric extraction techniques (Start of Season (SOS), Peak of Season (POS), and End of Season (EOS), respectively) from Normalized Difference Vegetation Index (NDVI) time series from the Moderate Resolution Imaging Spectroradiometer (MODIS) sensor. To our knowledge, this is the first attempt to correlate the vegetative peak of soybeans with the beginning seed stage, on a large scale, in Brazilian territory. The methodology presented is a contribution to the advancement of more precise and reliable methods for estimating crop phenological stages. Also, it can be used to assist in the monitoring of other annual crops due to its performance and methodological approach.

2. Material and Methods

2.1. Study Area
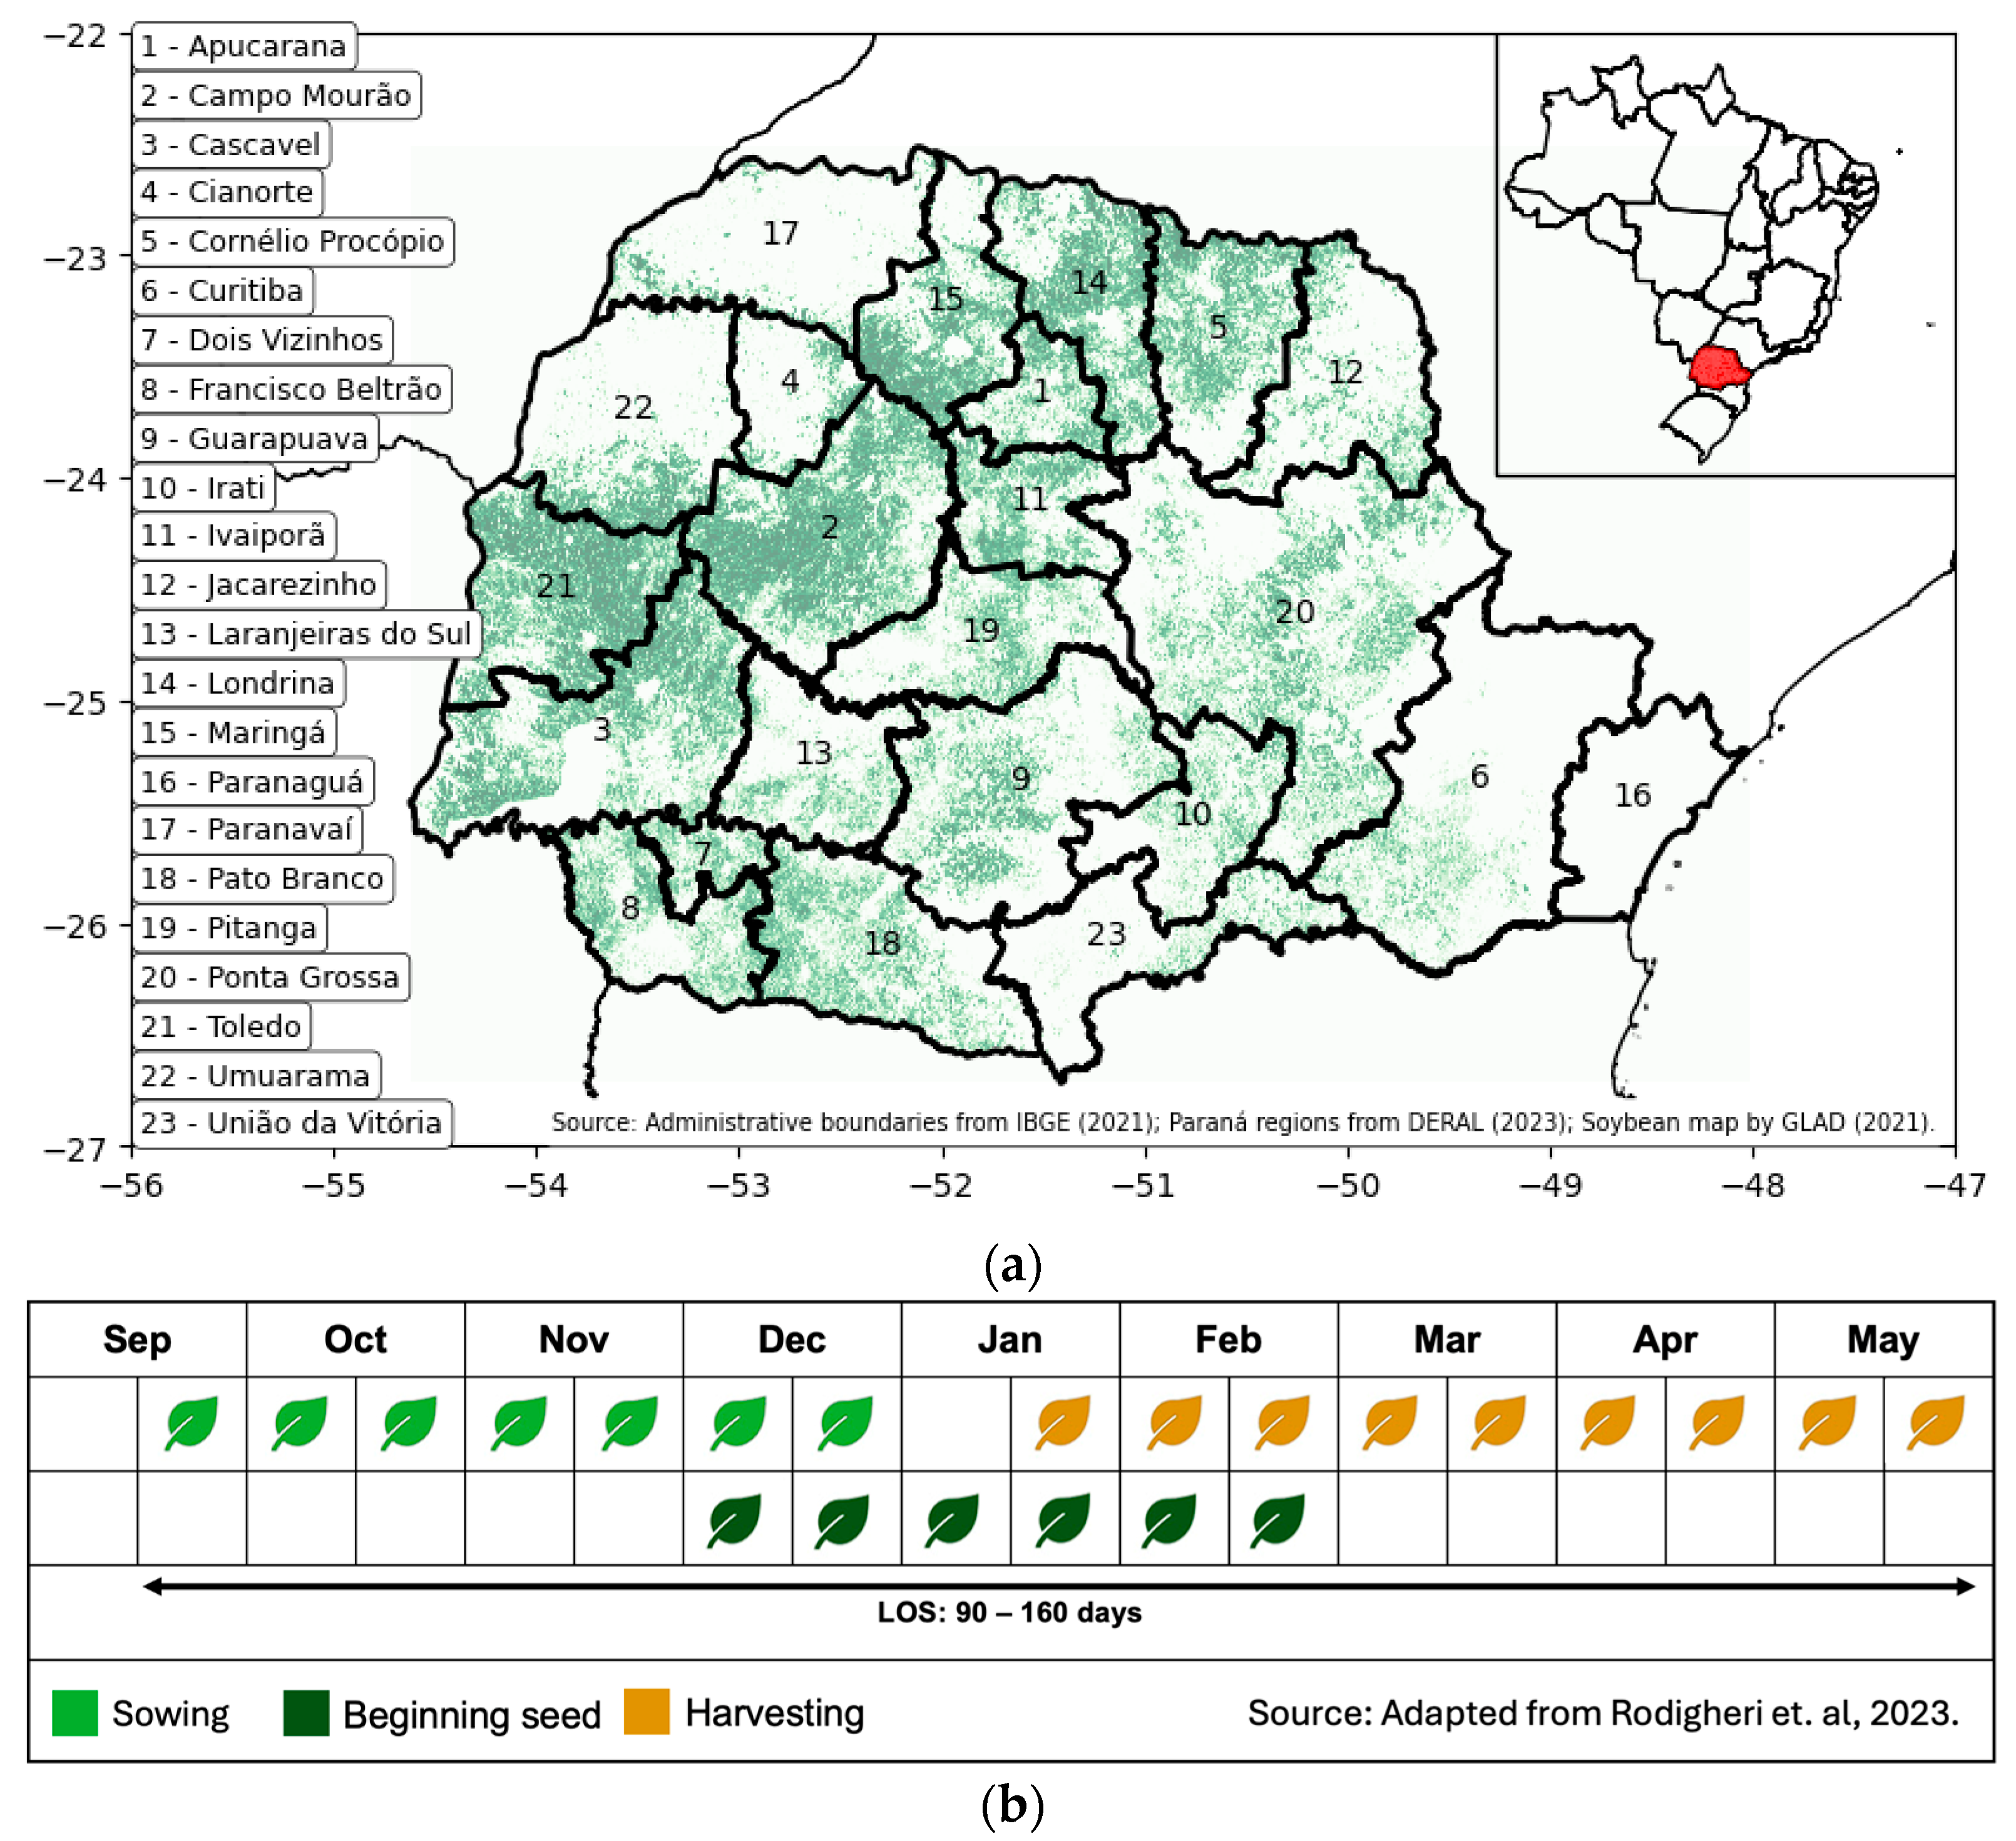
The study area spreads across the entire Paraná state (Figure 1a), considering the significance of this region for soybean agricultural production in Brazil. Paraná is in Southern Brazil and, despite being the third-largest planted area in the country, it is the second largest in production volume [29]. In this state, the Atlantic Forest Biome predominates, with a few areas of Cerrado biome (Brazilian Savanna) [30]. The soybean cultivation follows the ZARC recommendation and respects the sanitary vacuum period. This synchronization between the climatic cycle and sanitary management practices is fundamental for the sustainability and efficacy of soybean production in the country.
Soybean sowing generally takes place from mid-September to the end of December, with a greater concentration between the end of October and the beginning of November (Figure 1b). Harvesting is usually carried out from mid-January to the end of May (Figure 1b), with the crop cycle in most regions ranging from 120 to 140 days [4,31,32,33,34,35] but with the occurrence of sowing of extra-early cultivars with 90 days and longer-cycle cultivars with 160 days [31,35].
Figure 1. Paraná state, Brazil. The soybean areas in 2021 and the DERAL regions (a). The soybean crop calendar and Length of Season (LOS) for the Paraná state (b), [35].
Remotesensing 16 02520 g001

2.2. Soybean Mapping Processing

The soybean map used to extract sowing, beginning seed, and harvesting dates for the 2020/2021 season was produced by the Commodity Crop Mapping and Monitoring in South America project by Global Land Analysis and Discovery (GLAD) with a 30 m spatial resolution [36].
These data were pre-processed to enhance the quality and accuracy of the phenological stage estimates by mitigating the influence of the spectral properties of adjacent pixels [37]. First, to remove the soybean map edge pixels, we applied a filter using a 3 × 3-pixel window eroding the map, which is essential to mitigate contamination by pixels not corresponding to soybean cultivation. Additionally, this process removed small polygons, which often represent non-soybean areas such as small fields or gaps in the data that could lead to misclassification. In Paraná, very small areas (less than 30 hectares) are generally cultivated with beans, which spectrally resemble soybeans and could be mistakenly included. Therefore, rather than monitoring the entirety of the soybean areas, we opted to obtain a reliable sample that would exclusively represent soybean areas. This method reduced the spectral confusion and false positives, ensuring higher confidence in the soybean pixel data.
Next, we proceeded to adjust the pixel spatial resolution, an essential step to align the mapping data (30 m) with the MODIS sensor standards (250 m), enabling a more accurate comparison and reducing spatial discrepancies. This resizing was carried out by selecting only the 250 × 250 m MODIS pixels that were completely contained within the GLAD mapping after the elimination of edges and noise. This step was crucial to further mitigate spectral mixing issues and to ensure data consistency throughout this study. Thus, we created the soybean map MODIS mask with a spatial resolution of 250 m.

2.3. MYD09Q1 Product

A time series of MODIS 8-day composite 250 m surface reflectance images (MYD09Q1) were obtained via Google Earth Engine for the period from 1 September 2020 to 1 September 2021 to capture the growing season of all the regions in the study area. This temporal resolution is detailed enough to enable an almost weekly monitoring of the soybean sowing and harvesting evolution, which is crucial for accurate agricultural analyses. All the MODIS images were processed for the calculation of the NDVI [38] and converted to the GeoTIFF format. The Day of Year (DOY) for each MODIS image represents the first day of the 8-day composite period [39].
Among the sensors used for data collection, MODIS has played a central role, being widely used for estimating the phenology of agricultural crops such as rice, soybean, corn, wheat, and sunflower [21,24,35,40,41,42,43]; providing consistent spatial–temporal data [44]; and enabling comprehensive monitoring of the Earth’s surface on a daily basis [45].
The NDVI was chosen for this study for its effectiveness in large-scale monitoring of agricultural crops and for being the most widely used in studies for determining the phenology of agricultural crops [46,47,48,49,50,51,52]. This is because the NDVI is directly related to biomass production, being more sensitive to the presence of chlorophyll and other vegetation pigments responsible for absorbing photosynthetically active radiation [52], and it does not show significant differences in extracting sowing and harvesting dates when compared to other indices, such as the Enhanced Vegetation Index (EVI) [53].
After calculating the NDVI, we performed a clipping of the study area. This process ensures that only the data relevant to the studied area are considered, optimizing processing and ensuring the accuracy of the results. This step was followed by stacking the processed images, with each band representing a specific date in the time series, allowing for the construction of a detailed time series that reflects vegetation variations throughout the agricultural year. Finally, the data were stored in the GeoTIFF format, facilitating data storage and retrieval.

2.4. Vegetation Index Time-Series Processing

We applied the soybean map MODIS mask to obtain a NDVI data cube focusing exclusively on soybean cultivation areas. This approach ensured an accurate and focused analysis of the NDVI, strictly limiting it to the areas of interest and eliminating potential interference from other land uses and land covers presented in the study area as specified in the Section 2.2 topic.
For each pixel in the MYD09Q1 product, a value was selected from all the acquisitions within the 8-day composite period. This is an efficient technique for removing noise present in daily time series, but it is not sufficient to eliminate all noise, especially during the soybean development period in tropical regions. This is due to the increase in precipitation volume and, consequently, cloud incidence, as observed in Brazil [54]. Therefore, we developed an automated method for detecting abrupt drops that defines the window length and acceptable thresholds to achieve the highest identification accuracy. The detection of abrupt drops in the NDVI time series is a crucial technique for identifying anomalies in the data, particularly those caused by interferences, such as cloud presence. In remote sensing studies, sudden fluctuations in vegetation indices can indicate obstructions in the data capture, such as the presence of clouds and/or cloud shadows, which distort the actual NDVI values.
To address this issue, we used a function to identify and fix abrupt drops in the NDVI time series [55]. This function operates on the premise that significant variations between consecutive points in the time series, exceeding a defined threshold, are indicative of data distortions. Upon detecting such variations, the function replaces the affected value with the average of the neighboring data, mitigating the impact of these anomalies. To enhance the processing of NDVI data, the technique was adjusted to apply a threshold of two standard deviations from the mean, followed by a threshold of one standard deviation. This is performed to avoid excessive or insufficient corrections. The function iterates over the data, fixing abrupt drops between consecutive points that exceed these thresholds. First, the broader threshold is applied to correct the largest variations and then the more restrictive threshold is applied for finer adjustments.

2.5. Identification of Vegetative Peak

Brazilian soybean-producing regions exhibit a diversified sowing cycle, with multiple crops throughout the year [4,31,32,34,56]. This implies that when using annual time series, there can be a misidentification of the vegetative peak of soybean by confusing it with the peak of other crops planted in succession, such as corn, wheat, or cover crops, which are common after soybean harvest. Therefore, establishing an agricultural calendar that accurately defines the restricted period of the soybean vegetative peak is essentially important.
Thus, we focused on identifying the period of the soybean vegetative peak. Initially, we estimated the starting and ending dates of the vegetative period based on historical data and sowing patterns. Subsequently, we used these dates to extract the POS from each time series. Then, we calculated the average and the standard deviation of the vegetative peak dates. Based on this analysis, we recalculated the limits of the vegetative peak period for each municipality, establishing a range of two standard deviations from the mean. This procedure ensures that the start and the end of the vegetative peak period identified accurately reflects the actual vegetative peak period of soybean, considering local variability. Once the soybean vegetative peak period was established, the analysis proceeded to calculate the POS within this specific time interval. The function analyzes the NDVI values for each pixel during the delimited period, identifying the point of the maximum NDVI value, which represents the POS.

2.6. Identification of Inflection Points and Temporal Delimitation

The next step was identifying the inflection points (ascending and descending) of the POS in the NDVI time series. These points are important parameters for estimating crop development [57] and their definition is a crucial step in correctly delineating the soybean crop window. This procedure is key for the effective application of smoothing models, such as the double-logistic function, which requires restricted and complete data for the specific crop season period to produce accurate results. All traditional approaches have a strong relationship with the temporal evolution of plant development and typically require a complete development period to determine seasonal changes [58]. Furthermore, the presence of NDVI data related to other crops or subsequent cultures to soybean cultivation can significantly distort the shape of the curve modeled by the double-logistic function.
The identification of these inflection points was carried out through a detailed analysis of the NDVI time series, with a focus on locating the points before and after the vegetative peak where the NDVI curve starts to change its direction significantly. By finding these points, it was possible to delimit the time series to focus strictly on the soybean cropping period.
It is important to note that, by identifying the vegetative peak based on the date of the highest NDVI value, it was established that the inflection points should not occur within a 30-day range before or after this peak, nor should they exceed 100 days from the vegetative peak. This 30-day restriction considers the soybean growth cycle, recognizing that even the shortest cycle varieties need at least 30 days from emergence to reach the vegetative peak and, similarly, at least 30 days after the peak for the maturation and harvesting stage. Therefore, by applying this 30-day window, the inflection points identified to the left and right of the vegetative peak are adjusted to state the effective period of the soybean crop more accurately.
The definition of a 100-day window before and after the vegetative peak is strategic, considering that the longest-cycle soybean varieties can last up to 160 days [31]. This provides a sufficient margin to cover the entire period from sowing to harvest, even for longer-cycle varieties. Thus, the 200-day window (100 days before and after) ensures complete coverage of the soybean life cycle, allowing for an accurate analysis of the inflection points related to plant development, without interference from other crops [41].

2.7. Application of Growing Season Window and Double-Logistic Function

After identifying the inflection points to the left and right of the vegetative peak, the next step involved replicating the values found at the inflection points for all the data prior to and following these points, respectively, converting these parts of the time series into a straight line, and establishing a specific temporal window for the soybean growth cycle estimation. Through this technique, the NDVI data outside the identified period are effectively disregarded, thereby avoiding distortions in the subsequent analysis. This meticulous approach is crucial for focusing the analysis on the specific characteristics of the soybean growth cycle, eliminating the influence of other crops or subsequent harvests that could compromise the accuracy of the results. According to [41], the VI values of the reference curve outside the growth period should be replaced by fixed values.
Subsequently, the double-logistic function [59] was applied to the NDVI time series, where the data were fitted around the maxima and minima of the entire time series. Double-logistic functions have been used to describe seasonal variation in the NDVI of agricultural crops [57,60,61]. This function is notable for its ability to accurately model vegetative growth, capturing the stages of acceleration and deceleration in plant development.
The double-logistic function assumes that the phenological development of the plant over the agricultural year can be represented using two logistic functions, one for the ascending direction of the time series and another for the descending direction [60]. With this double-logistic function, it is possible to estimate up to six parameters that can be related to the phenology of soybeans and corn [61].

2.8. Extraction of Phenological Metrics and Estimation of Phenology

In this study, we extracted three phenological metrics, the SOS, POS, and EOS, which correspond, respectively, to the beginning of the agricultural crop, the vegetative peak, and the end of the agricultural crop [62]. Initially, we recalculated the POS after smoothing the data, making it possible to extract the actual data from this phenological metric, defined as per the previous step, as the highest NDVI value in the time series within a specific window for the Paraná state. The SOS was defined at the point where the curve value increases by 10% of the distance between the minimum level to the left and the maximum to the right of the curve [63]. Furthermore, the sowing dates were subsequently defined as the SOS minus 10 days, given that the SOS corresponds to a point of vegetative development and not to the sowing moment itself because this is the average time when soybean plants emerge and become visible to satellites [64]. Algorithms for estimating phenology from remote sensing data have shown that soybean stages can be detected around the V3–V4 vegetative stage [12].
Similarly, the EOS was determined at the point where there is a 90% reduction in the distance between the maximum level to the left and the minimum to the right of the curve [63]. We identified the need to refine the EOS calculation method to ensure greater accuracy. In this study, we began by extracting data for the period from 1 September 2020 to 1 September 2021. This was performed to cover the entire soybean cycle in Paraná (from September 2020 to May 2021) (Figure 1b). When using the double-logistic function to smooth the data, we encountered the following problem: before soybean planting, there is a fallow period during which the vegetation cover is desiccated (killed) or the soil is tilled. This causes NDVI values to drop to levels that allow for the logistic curve to find a well-defined inflection point, enabling the definition of the SOS without any adjustments.
However, after the soybean harvest, farmers tend to plant a second crop (notably corn or wheat) in the same agricultural year. It was necessary to remove the second crop data from this time series so that the double-logistic function could fit the data correctly. Due to a limitation of the method, the double-logistic curve smooths the data until the end of the series (1 September 2021). Originally, we determined the EOS (End of Season) as the 90% reduction in the distance between the maximum level (POS) and the minimum to the right of the curve. However, we noticed that this often resulted in an EOS with a significant deviation from the vegetative peak (over 100 days), which was not expected for soybeans.
To overcome this problem, we adopted a new approach, considering the inflection point to the right in the unsmoothed time series. Thus, the EOS was then defined as 90% of the distance between the vegetative peak (in the smoothed series) and the inflection point (in the original series). This modification allowed for a more precise identification of the end of the vegetative season, improving the monitoring of the phenological changes in soybeans. In addition, we assumed the EOS dates as the harvest dates.

2.9. Reference Data

The statistical data provided by the DERAL of Paraná state were used as reference data. The DERAL divides the agricultural lands of Paraná into 23 regions. However, phenological statistics for soybeans are available for only 20 of these regions. Specifically, Cianorte (Region 4), Dois Vizinhos (Region 7), and Paranaguá (Region 16) do not have observed soybean phenology data, and therefore, it was not possible to perform the comparative analysis with the estimated data for these regions. The sowing, beginning seed, and harvesting dates in each cultivation zone are recorded in the weekly crop progress report [65]. We used these data to evaluate the performance of our new method for detecting the phenological stages observed in the 2020/2021 crop season.

2.10. Data Analysis

All the NDVI values and dates for the SOS, POS, and EOS were extracted for the soybean map MODIS mask and aggregated according to each DERAL region (Figure 1), facilitating an equivalence analysis. To evaluate the agreement between this work’s SOS, POS, and EOS dates and the DERAL’s estimation for each region, a non-parametric Kruskal–Wallis’s test [66] for the dates was applied (significance level, p ≤ 0.05). The choice of this non-parametric test is justified by its suitability for samples that do not follow a normal distribution and by its independence regarding the homogeneity of variances among the analyzed groups. These tests use median values for the data and can accommodate unequal numbers of samples, as in the case investigated in this study, where different regions have a greater or lesser presence of soybean areas, ranging from 54,534 hectares (Paranavaí region) to 638,522 hectares (Campo Mourão region). All the data processing, statistical analyses, and data visualizations were performed using Python, version 3.8.18.
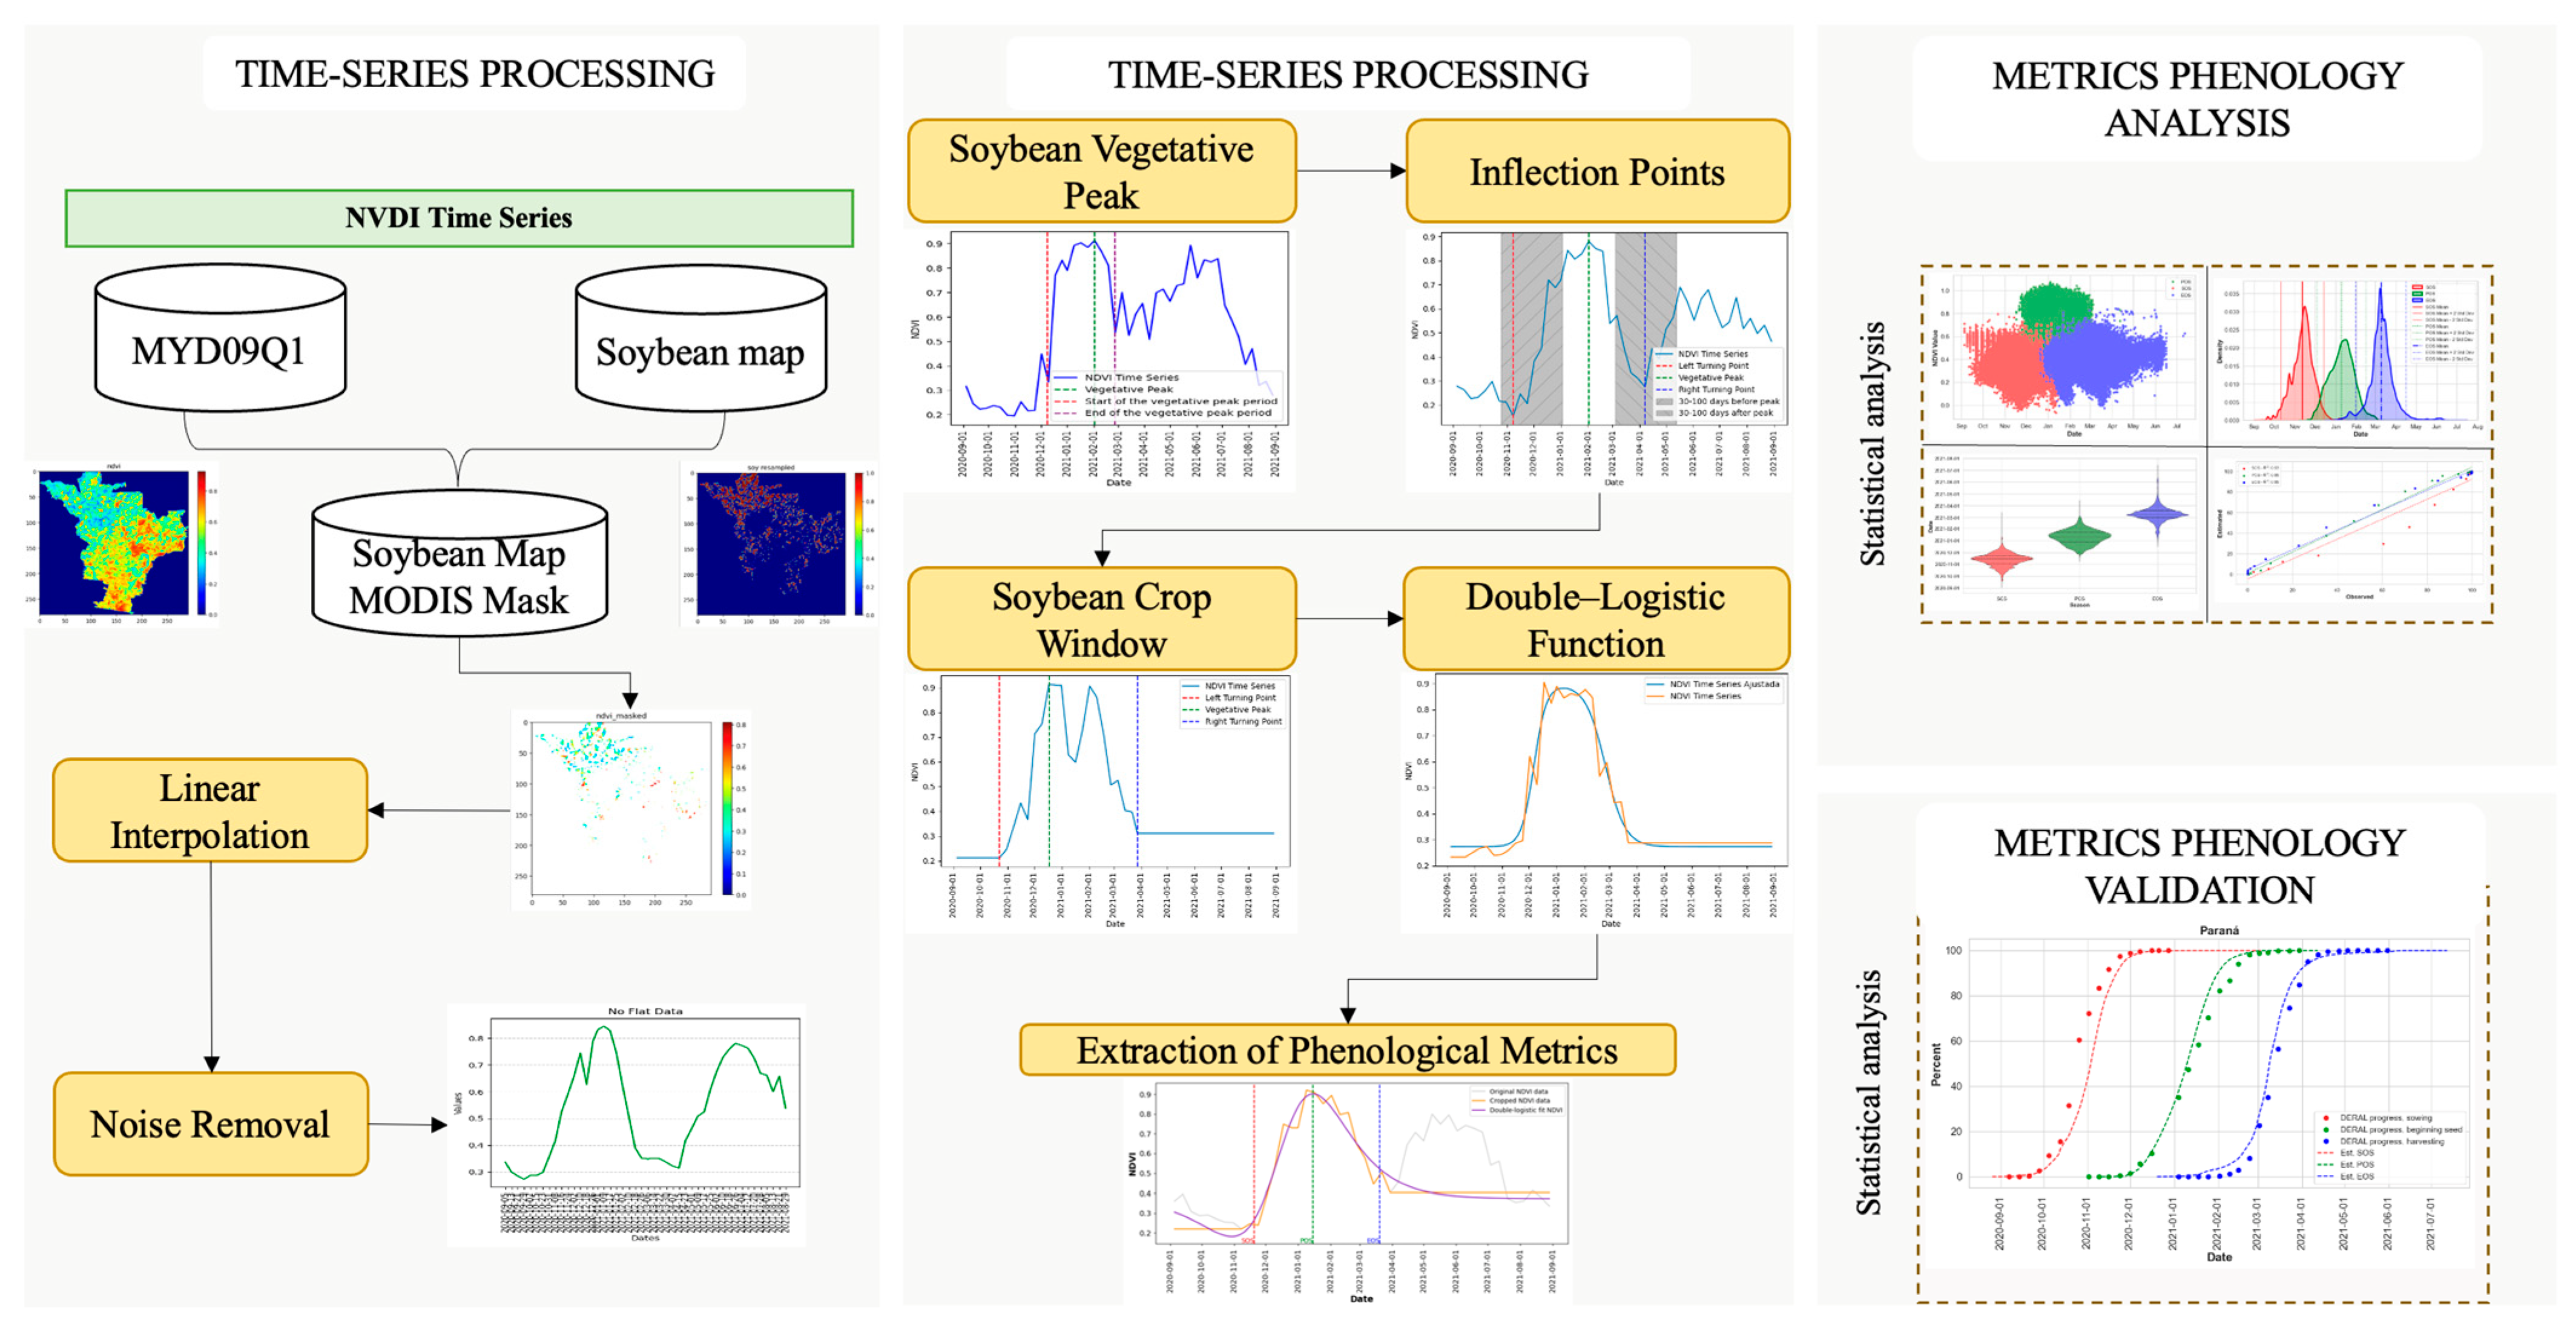
For each region, we calculated the Mean Bias, Standard Deviation of Bias (S.D. of Bias), Root Mean Square Error (RMSE), and Median Error (ME) using the reference data for the target region. The comparison results were summarized using the median of the regional statistics. Mean Bias is a measure that indicates how far, on average, the predictions of a model are from the reference data. The S.D. of Bias measures the variability in the bias around the mean, and if it presents a low value, it means that the differences between the predictions and the reference data are consistently close to the Mean Bias, indicating more reliable predictions. On the other hand, a high standard deviation indicates that the differences vary widely, suggesting lower reliability in the predictions. Considering the presence of outliers and, consequently, the possibility of data bias, we opted to use the median RMSE and ME. Calculating the error using the median of the differences between the predicted and reference data, instead of using the mean, results in a measure more resistant to outliers because the median is less affected by extreme values than the mean. The roadmap for extracting the phenological metrics is presented in Figure A1.

3. Results

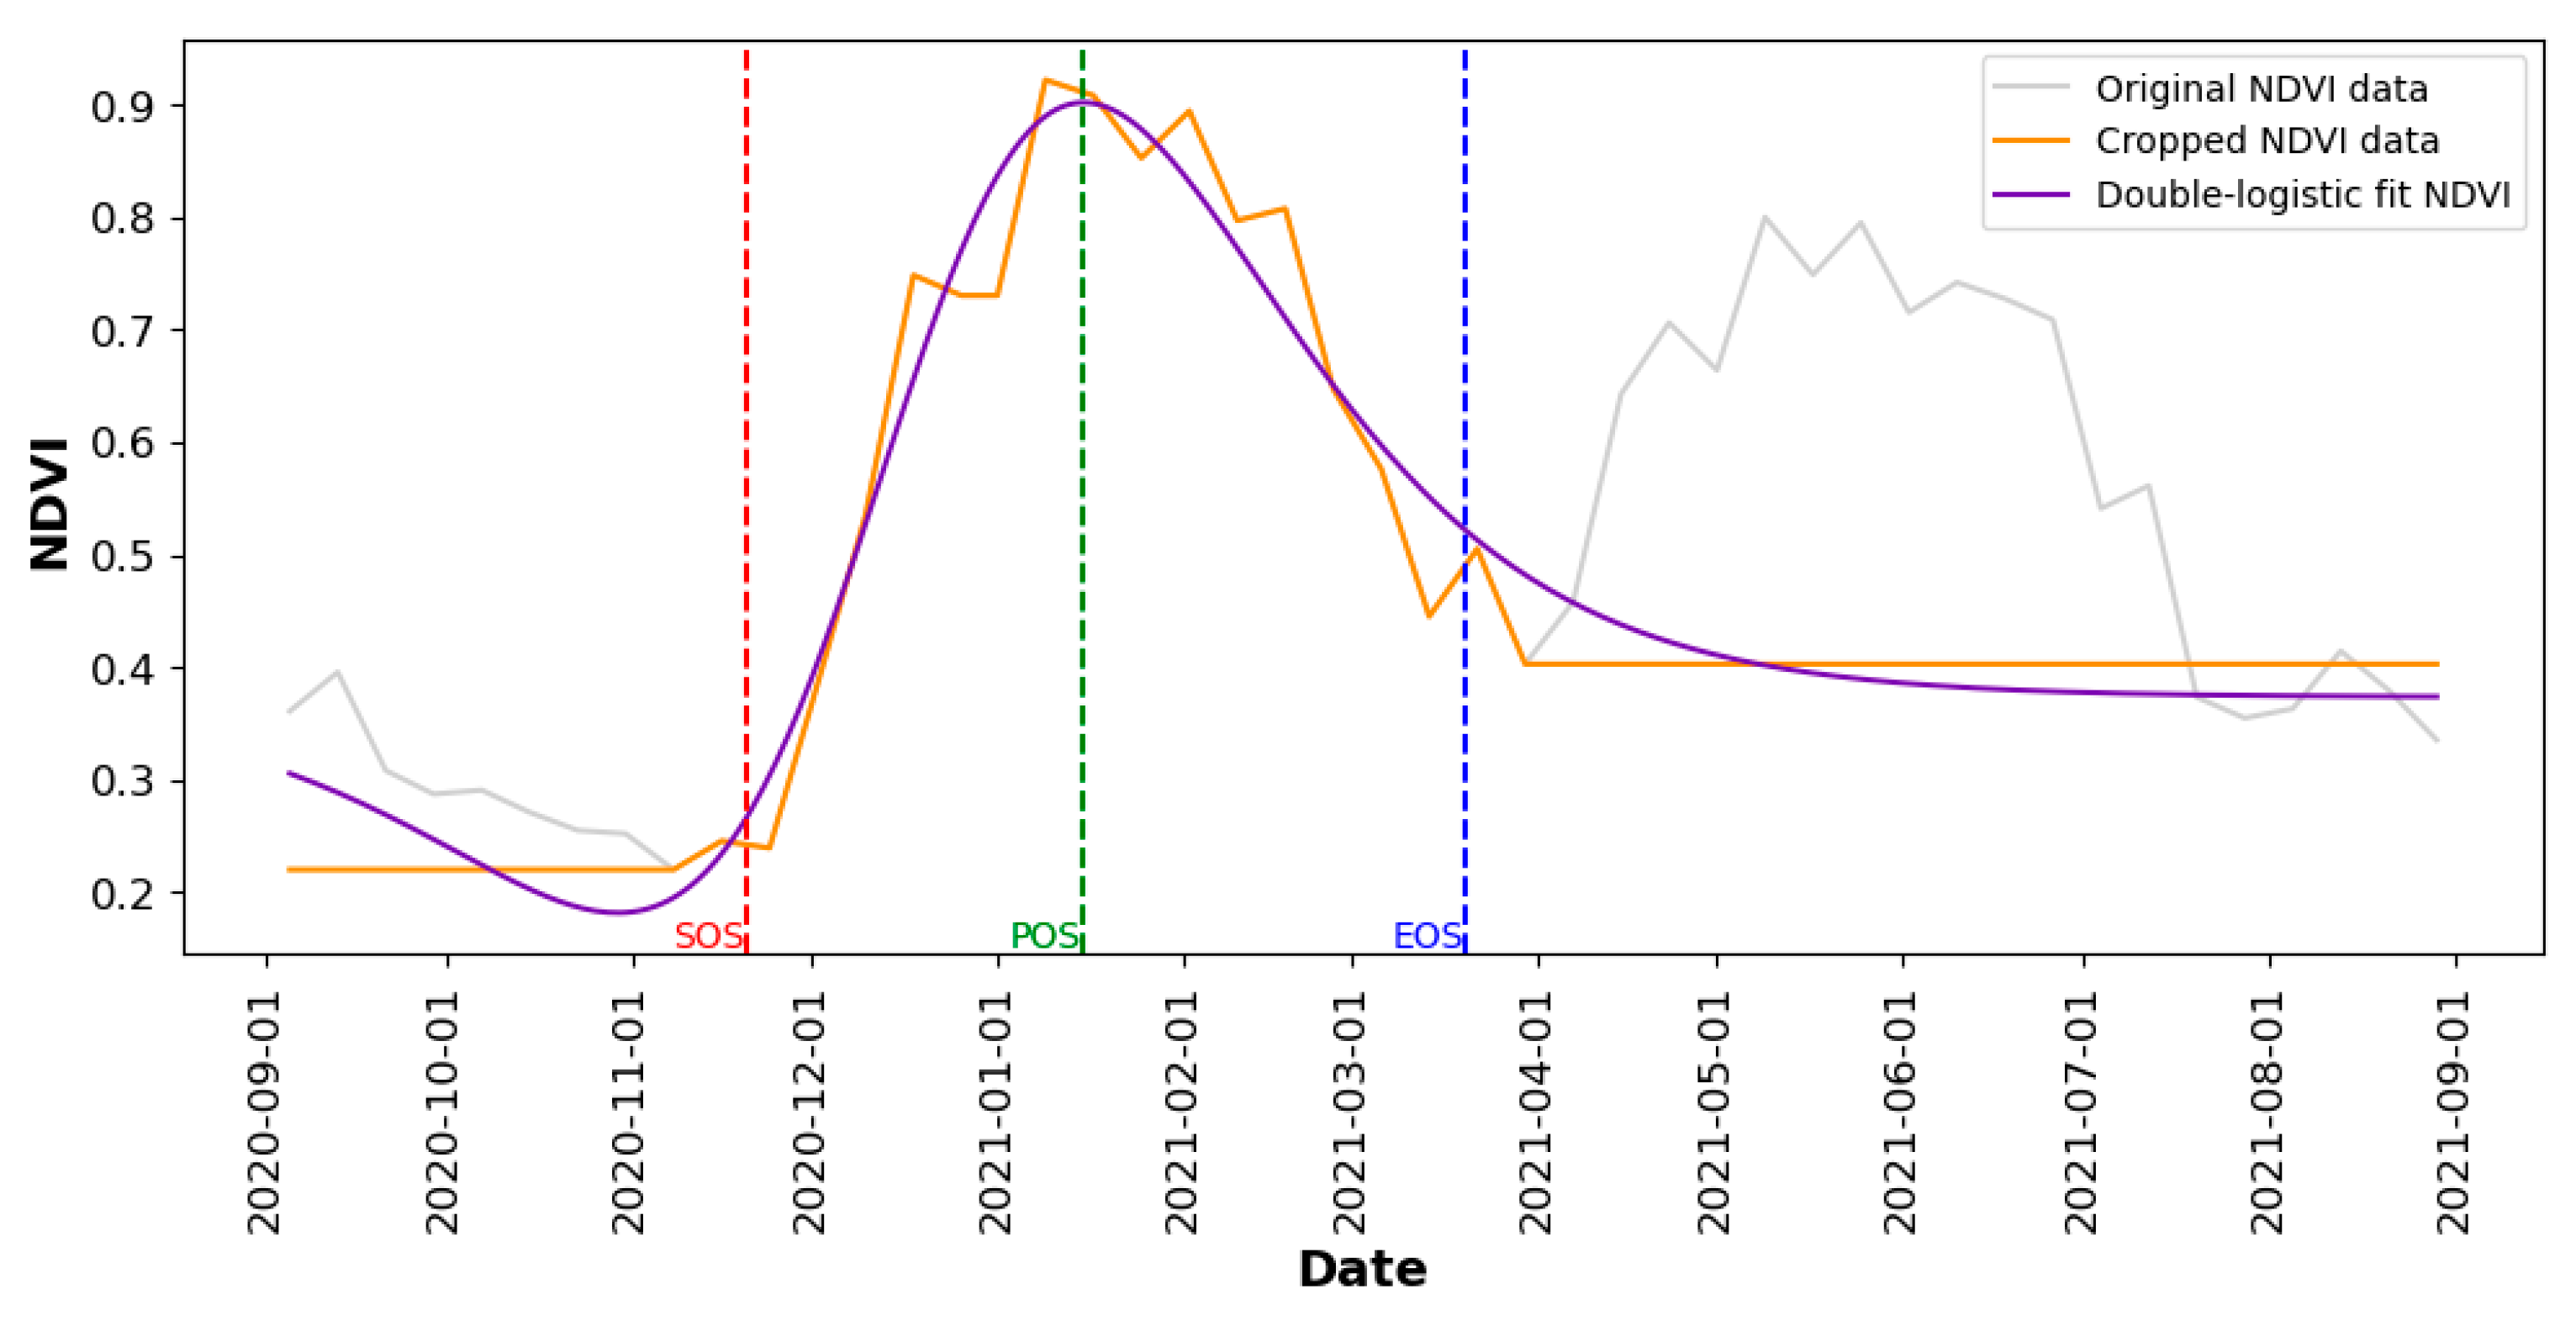
The function developed for replacing values with significant variation in the NDVI time series ensured the stability of the temporal series, correcting only significant variations (original NDVI) and preserving its integrity (filtered NDVI). This approach enabled the identification and correction of abrupt drops in the NDVI time series, ensuring that data distortions are effectively mitigated without changing its shape compromising its accuracy and reliability (Figure 2).
Following the successful filtering of abrupt drops in the NDVI temporal series, the next step was to identify the POS (Figure 2) for each temporal series. This enables distinguishing the specific soybean growing season within each period. As a result, the influences of the second and third crop cycles present in the temporal series were effectively mitigated, ensuring that the analysis focused exclusively on the soybean growth cycle, thereby avoiding data distortions caused by the overlap of other cropping cycles occurring in the same area throughout the season.
Subsequently, defining the temporal windows to the left and right allowed for a more precise identification of inflection points (Figure 2), ensuring that these points were not identified too far or too close to the peak vegetative period, which would misrepresent the phenological curve of an annual agricultural crop cycle. This change indicates an important transition in plant growth, either initiating the period of accelerated growth or ending in the maturation stage.
The implementation of sophisticated analytical and corrective techniques on NDVI data has culminated in a notable enhancement of phenological stage estimation for soybean crops. Figure 3 illustrates it, distinctly depicting both the filtered original NDVI trajectories and the amended curves post data refinement, which includes trimming and smoothing procedures. The employment of a double-logistic curve model allows for an improved congruence with empirical NDVI observations, thereby streamlining the demarcation of soybean phenological transitions. As exemplified in Figure 3, the method is appropriate in yielding coherent information about the crop progression throughout the growing season.
Figure 4 shows the distributions of the three estimated crop phenology metrics (SOS, POS, and EOS). Distinct patterns emerged that align with the anticipated plant growth dynamics in the analysis of the NDVI values (Figure 4a). Specifically, the NDVI values for the SOS predominantly clustered around 0.33, indicating initial vegetative growth. For the POS, the NDVI values were notably higher, centering around 0.82, reflective of the peak vegetative biomass and health of the crop. Conversely, the NDVI values for the EOS were observed to converge around 0.37, signifying the onset of senescence and readiness for harvest.
The subsequent data analysis of the sowing and harvesting calendar revealed the presence of outliers (Figure 4b). The records after 1 January 2021 were identified as outliers for the SOS. Similarly, the POS values after 1 March 2021 and the EOS values after 1 May 2021 were considered outliers. The detection and correction of these outliers are crucial for the accuracy of the sowing and harvesting calendar, reducing bias in the phenological metrics analysis. Although the initial analysis of the distribution plots indicated the presence of outliers, a detailed investigation found that they did not significantly impact the overall results.
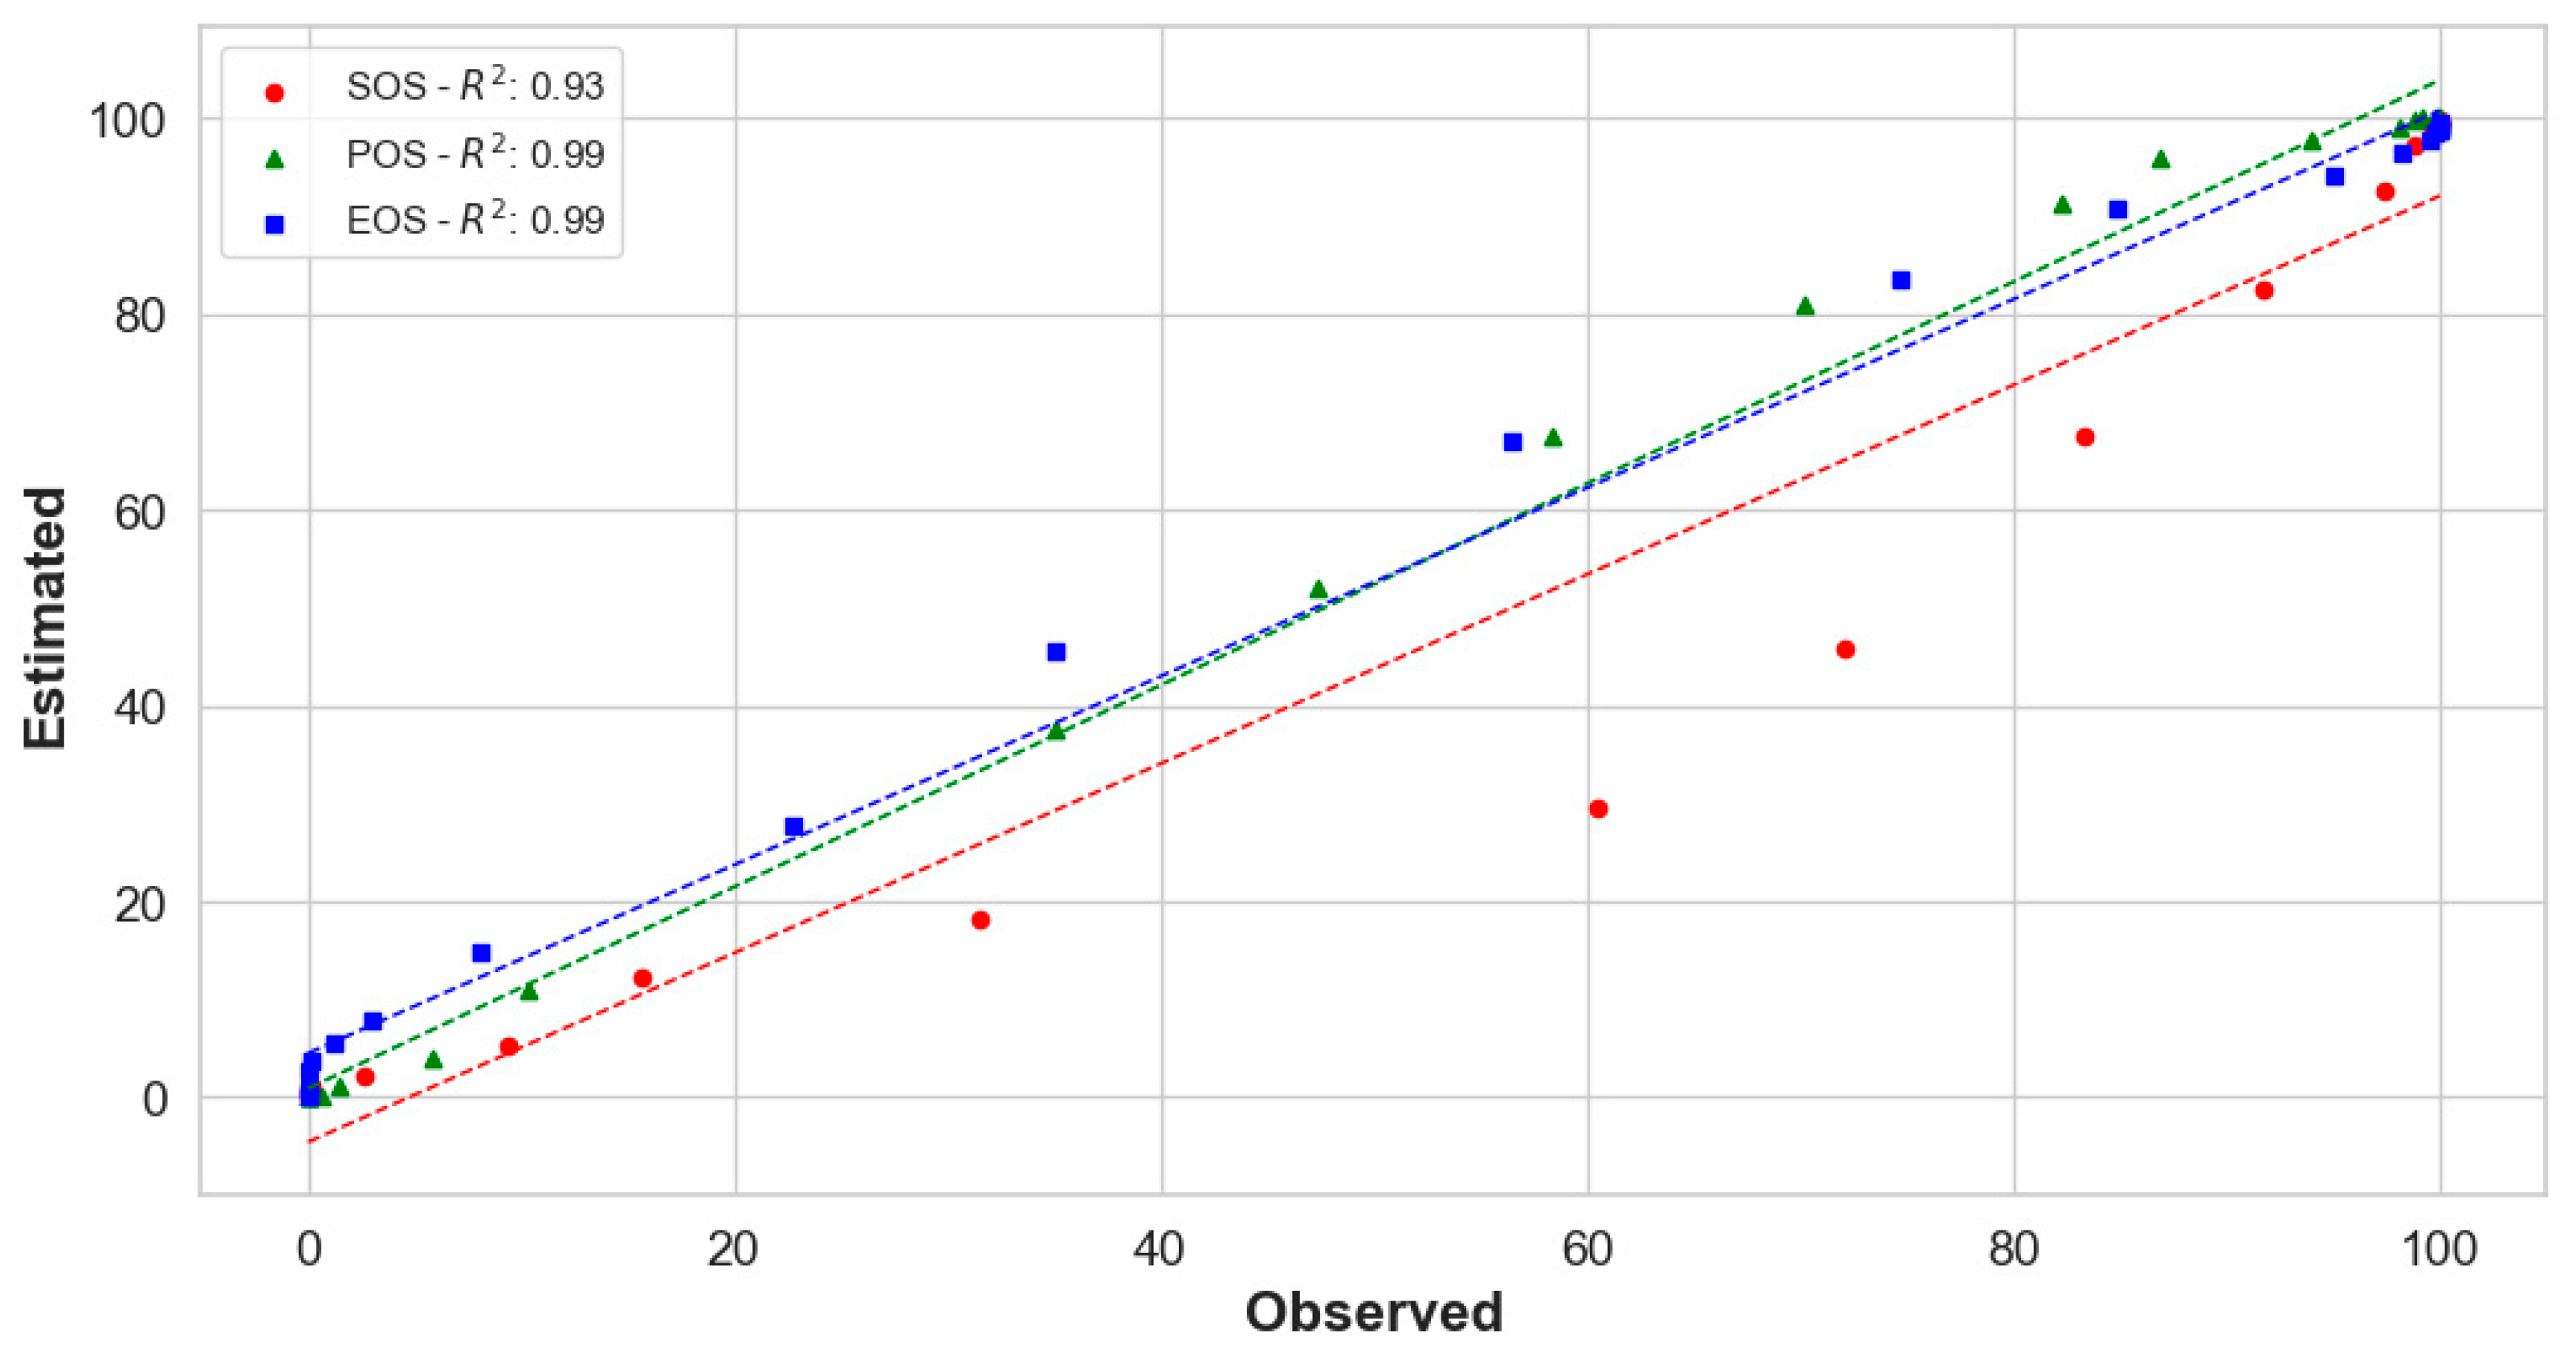
The high correlations found between the estimated phenological dates and reference data, with correlation coefficients of r = 0.93 for the SOS, r = 0.99 for the POS, and r = 0.99 for the EOS (Figure 5), indicate that the phenological estimates provide a faithful representation of the soybean phenology in the study area. These values suggest a high degree of agreement and validate the accuracy of the phenological estimates in capturing the temporal dynamics of soybeans. Figure 5 uses a cumulative scale (0 to 100%) for the comparisons between the estimated and observed data due to the weekly nature of the DERAL data. The comparisons were made only for the dates with observed data from the DERAL. This approach allows for a clearer visualization of the correlation between the datasets despite the different temporal resolutions.
The density plots for the SOS, POS, and EOS (Figure 6), with the means represented by solid lines and the confidence intervals (corresponding to two standard deviations) by dotted lines, show a significant concentration of data around the means. However, the distributions deviate markedly from normality, as indicated by the asymmetry and substantial deviations. The pronounced peaks and extended tails, particularly noticeable in the EOS distribution, suggest a violation of normality assumptions. Given this non-normality and the potential for non-homogeneously distributed data, the Kruskal–Wallis test was chosen.
Based on the results of the Kruskal–Wallis test (Table 1), we observe that there are no significant differences between the observed and estimated dates for the SOS, POS, and EOS in each DERAL region, using a significance level of 0.05. This finding indicates that the satellite-derived estimates are consistent with the ground-truth data collected by the DERAL. The lack of significant differences suggests that the conditions for these crop cycle stages are similar across the analyzed regions, supporting the reliability of our remote sensing methodology for monitoring phenological events.
In analyzing the difference range between the phenological estimates and the reference data, the Mean Bias revealed that the estimates tend to be lower than the reference data for the SOS and EOS, evidenced by the negative values in most of the regions analyzed. The biases observed in estimating varied significantly, with the Mean Bias ranging from −13 to 5.1 days for the SOS, −6.2 to 18.5 days for the POS, and −4.3 to 11.4 days for the EOS (Table 1). These variations, although they reflect regional disparities that may result from delays in data collection or the limited representativeness of the soybean cultivation areas monitored by the DERAL, do not compromise the accuracy of the indicators at the state level. For the Paraná state, the Mean Bias was only −6.5 days for the SOS, 2.5 days for the POS, and 2.5 days for the EOS.
Excluding the regions of Irati and União da Vitória, which showed deviations of 5.1 days and 1.2 days, respectively, all the other regions demonstrated a tendency for earlier estimates for the SOS (Table 1). For the EOS, however, most regions indicated delayed estimates compared to the reference data, with only Londrina, Apucarana, and Cornélio Procópio showing tendencies toward earlier estimates, with deviations of −4.3, −1.3, and −0.7 days, respectively. The POS exhibits a divergent pattern, with 11 out of 20 regions showing positive deviations and 9 regions displaying negative deviations, indicating no consistent trend toward a delay or an advancement in the estimates.
The analyzed data for the state of Paraná, as measured by the S.D. of Bias, indicated average deviations of 9.7 days for the SOS, 3.9 days for the POS, and 4.1 days for the EOS (Table 1). The data show that for the SOS, the variability remained below 11 days in 11 out of 20 regions, with the Laranjeiras do Sul region showing just 3.5 days. Regarding the POS, it was observed that the Pato Branco region exhibited the lowest variability, at 2.7 days, with 14 out of 20 regions showing variability of less than 11 days. For the EOS, the Francisco Beltrão region showed a variability of 2.6 days, with 19 out of 20 regions displaying variability of less than 11 days.
For the Paraná state, the RMSE for the SOS was 1.6 days, a value that equals the ME, which is also 1.6 days (Table 1). In the disaggregated analysis by regions, Francisco Beltrão, Laranjeiras do Sul, Londrina, and Toledo stood out with the lowest RMSE, recording values below 1 day, while 19 regions showed values below 8 days, with the Curitiba region standing out due to its RMSE of 12.1 days. Regarding the state of Paraná, the analysis revealed an RMSE and ME of 0.9 days for the POS. Within the detailed regional assessment, 17 regions showed RMSE values under 8 days, with the Maringá region standing out due to its RMSE of 0.7 days. As for the EOS, for the state of Paraná, the indicators showed an RMSE and ME of 1.7 days. Among the regions, Francisco Beltrão presented the lowest RMSE, with 0.4 days, and 19 regions recorded values below 8 days. These results reflect the accuracy of phenological estimates in capturing the timing of the sowing, beginning seed, and harvesting stages, with a relatively low margin of error for the SOS, POS, and EOS throughout the state.
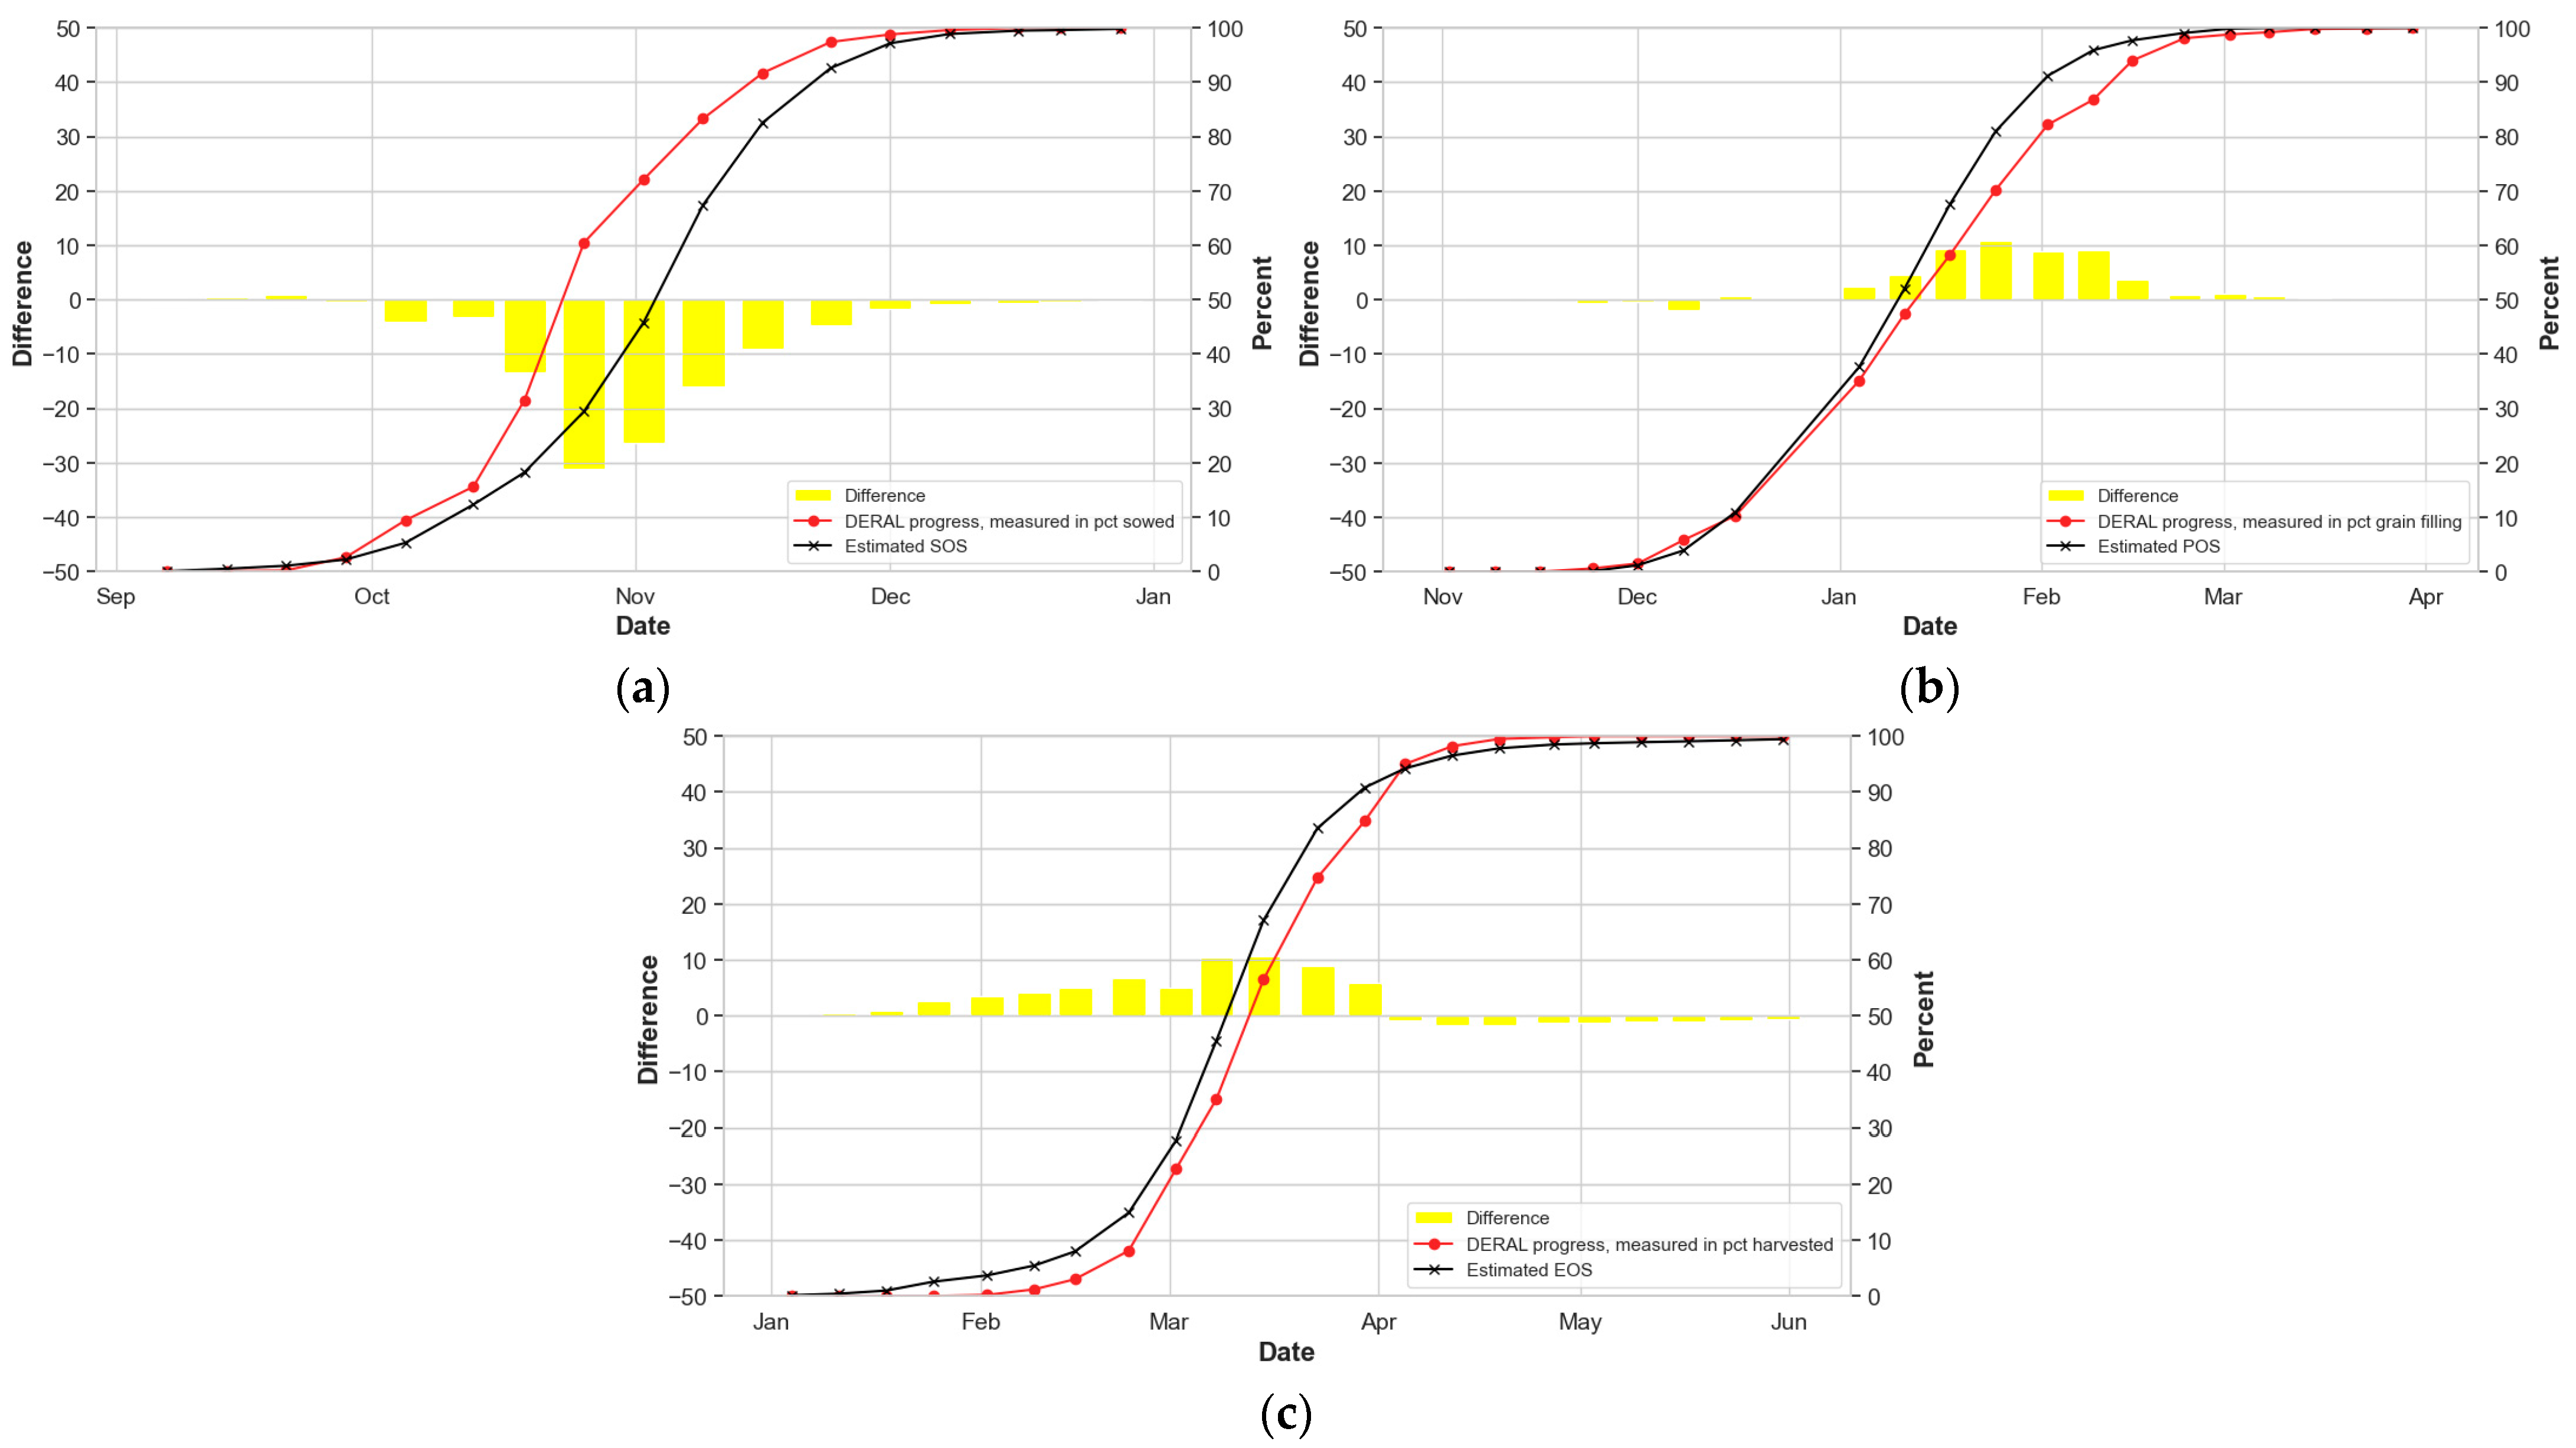
Overall, the estimated phenology for the Paraná state (represented by the circles on the solid red lines in Figure 7) showed good correspondence with the reference data (indicated by the asterisks on the solid black lines). However, despite this broad agreement, some regional variations were observed, with growth phenomena being recorded earlier or later than the period observed, particularly concerning the SOS. In União da Vitória, for example, the estimated occurred significantly earlier than observed, while in Toledo, phenological estimates were shown to be more delayed compared to the reference data. On the other hand, the data regarding the POS for these same regions do not exhibit the same trend observed for the SOS and EOS. In Jacarezinho, for example, the congruence between the estimated and reference data was notably precise to the SOS and EOS. However, it varied significantly for the POS, with a deviation of 18.5 days.
The accumulated percentage per region offers a detailed perspective on the evolution of sowing and harvesting seasons by region (Figure A2). The cumulative curve related to the SOS displays a smooth and linear progression, culminating at 100%, indicating the complete conclusion of sowing. Similarly, the curve associated with the POS and EOS reveals a gradual and continuous increase until the full completion of the beginning seed and harvesting stages.
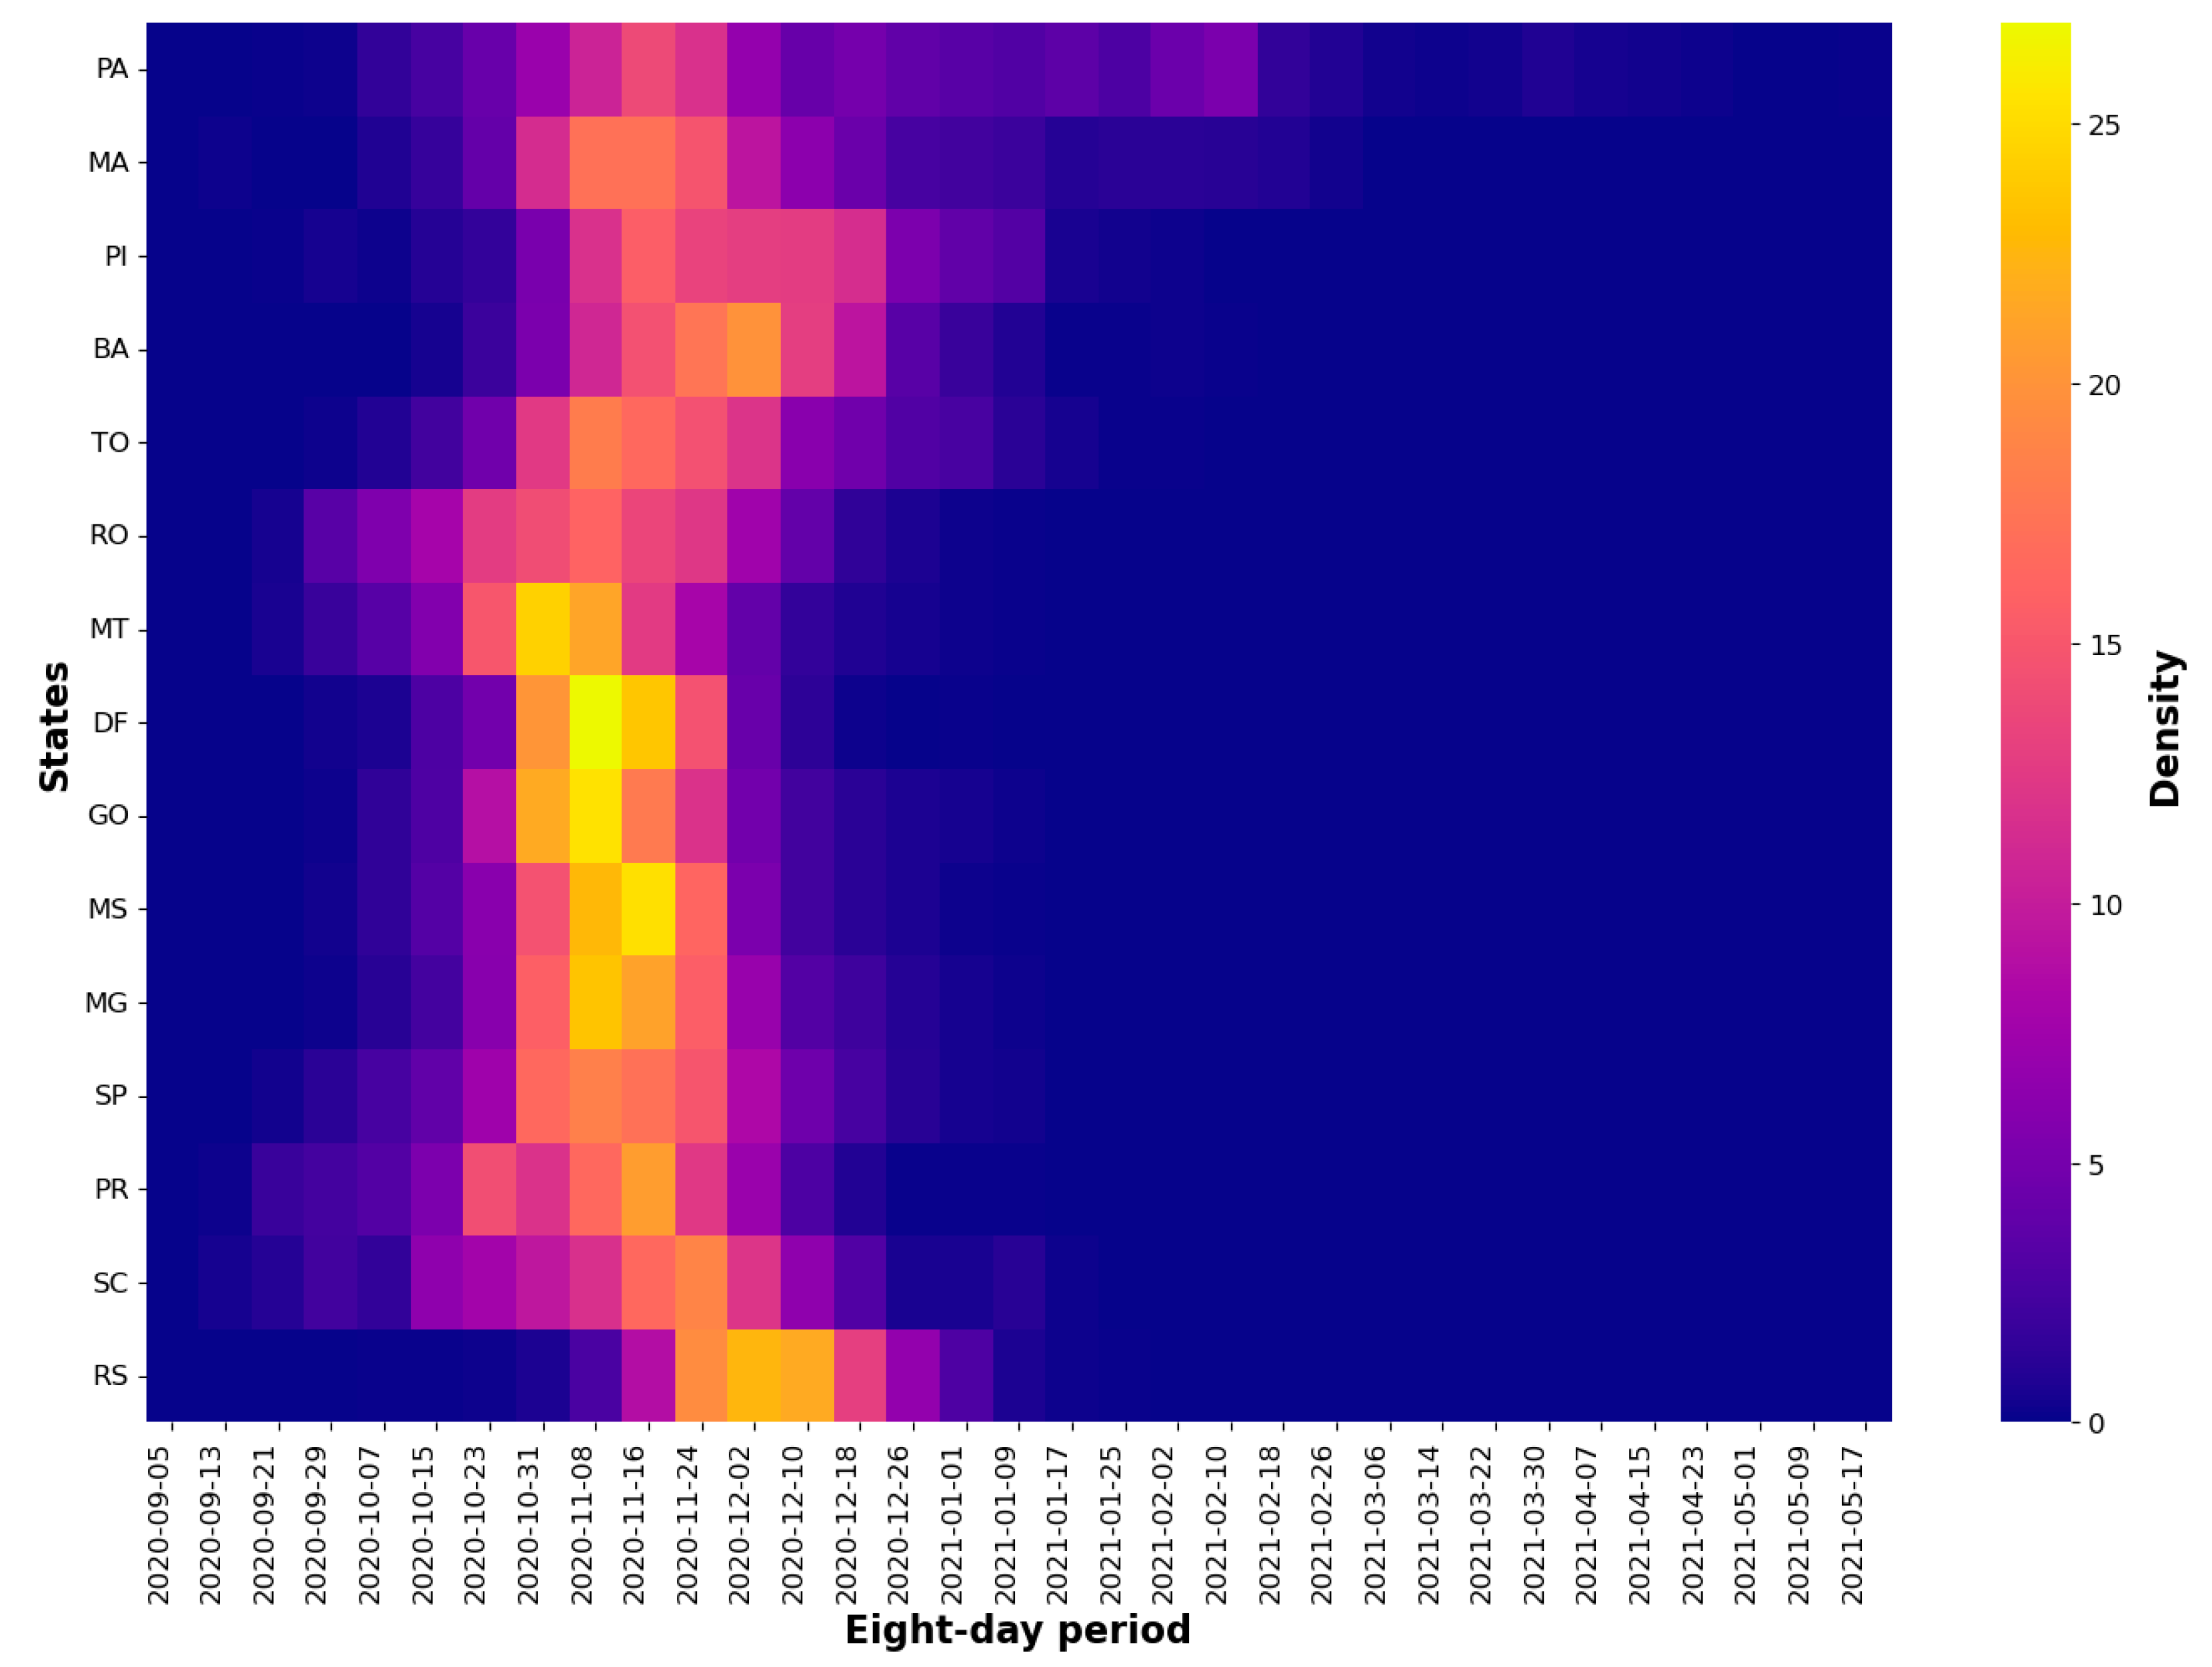
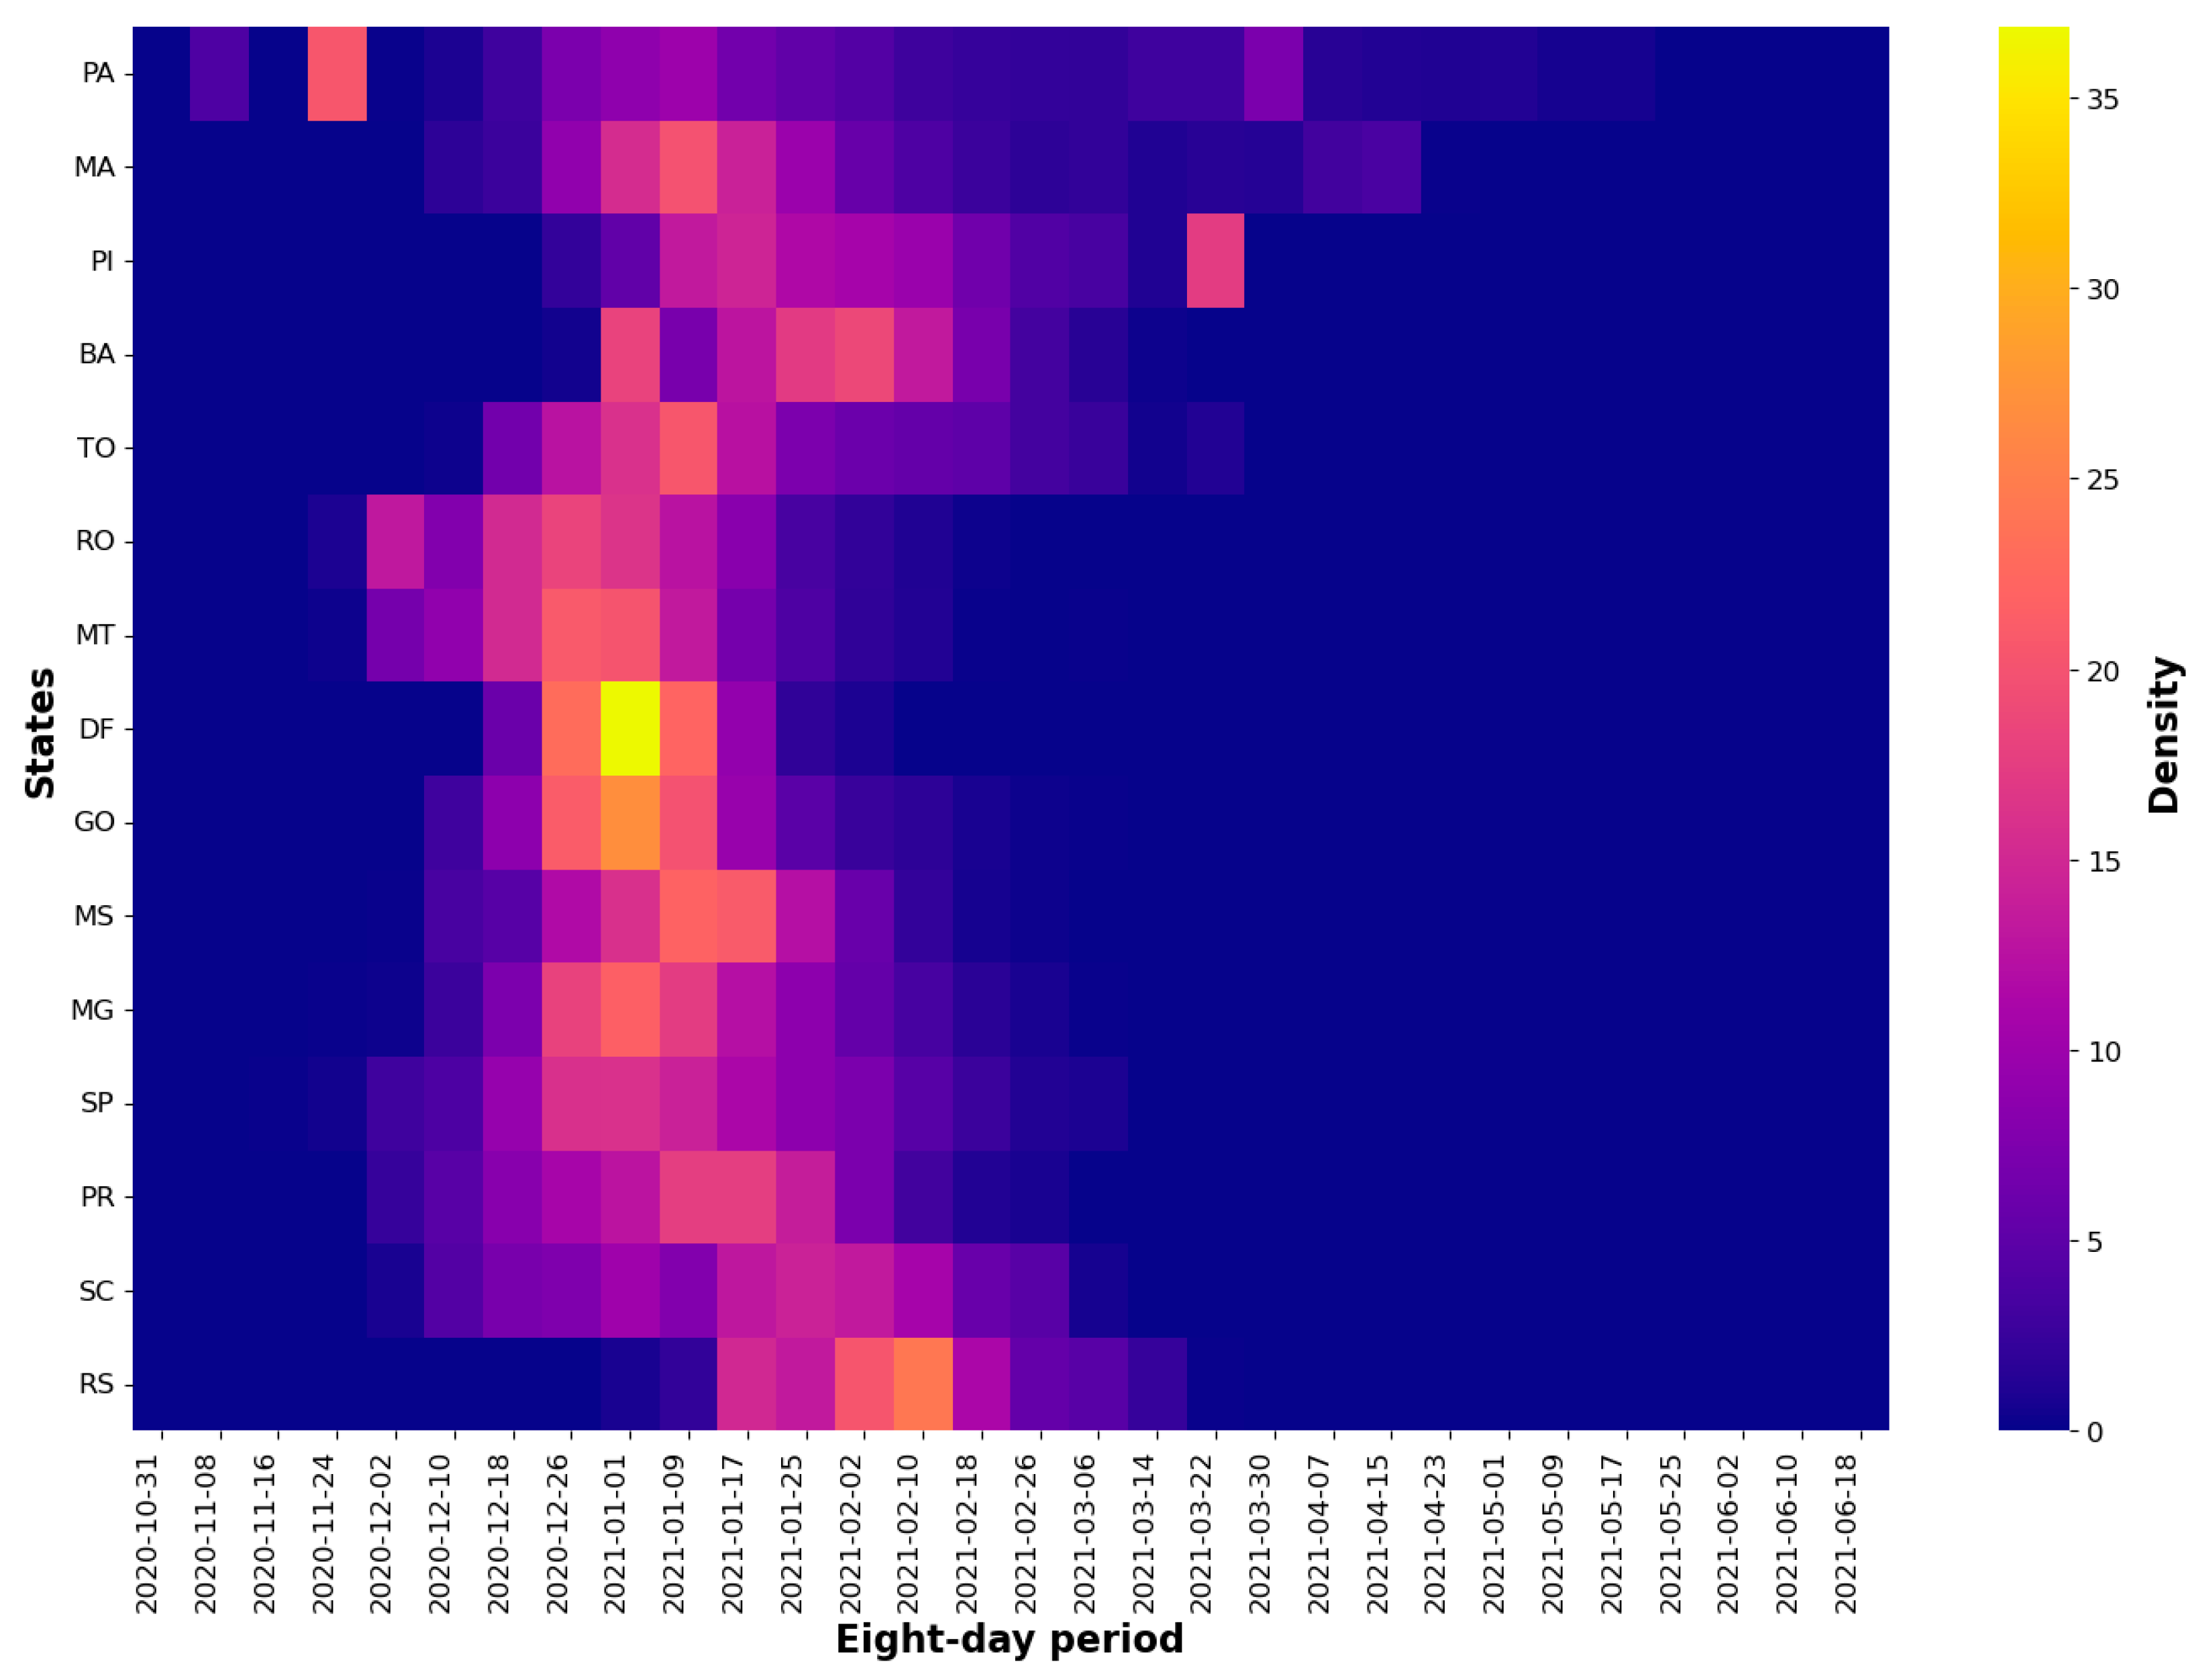
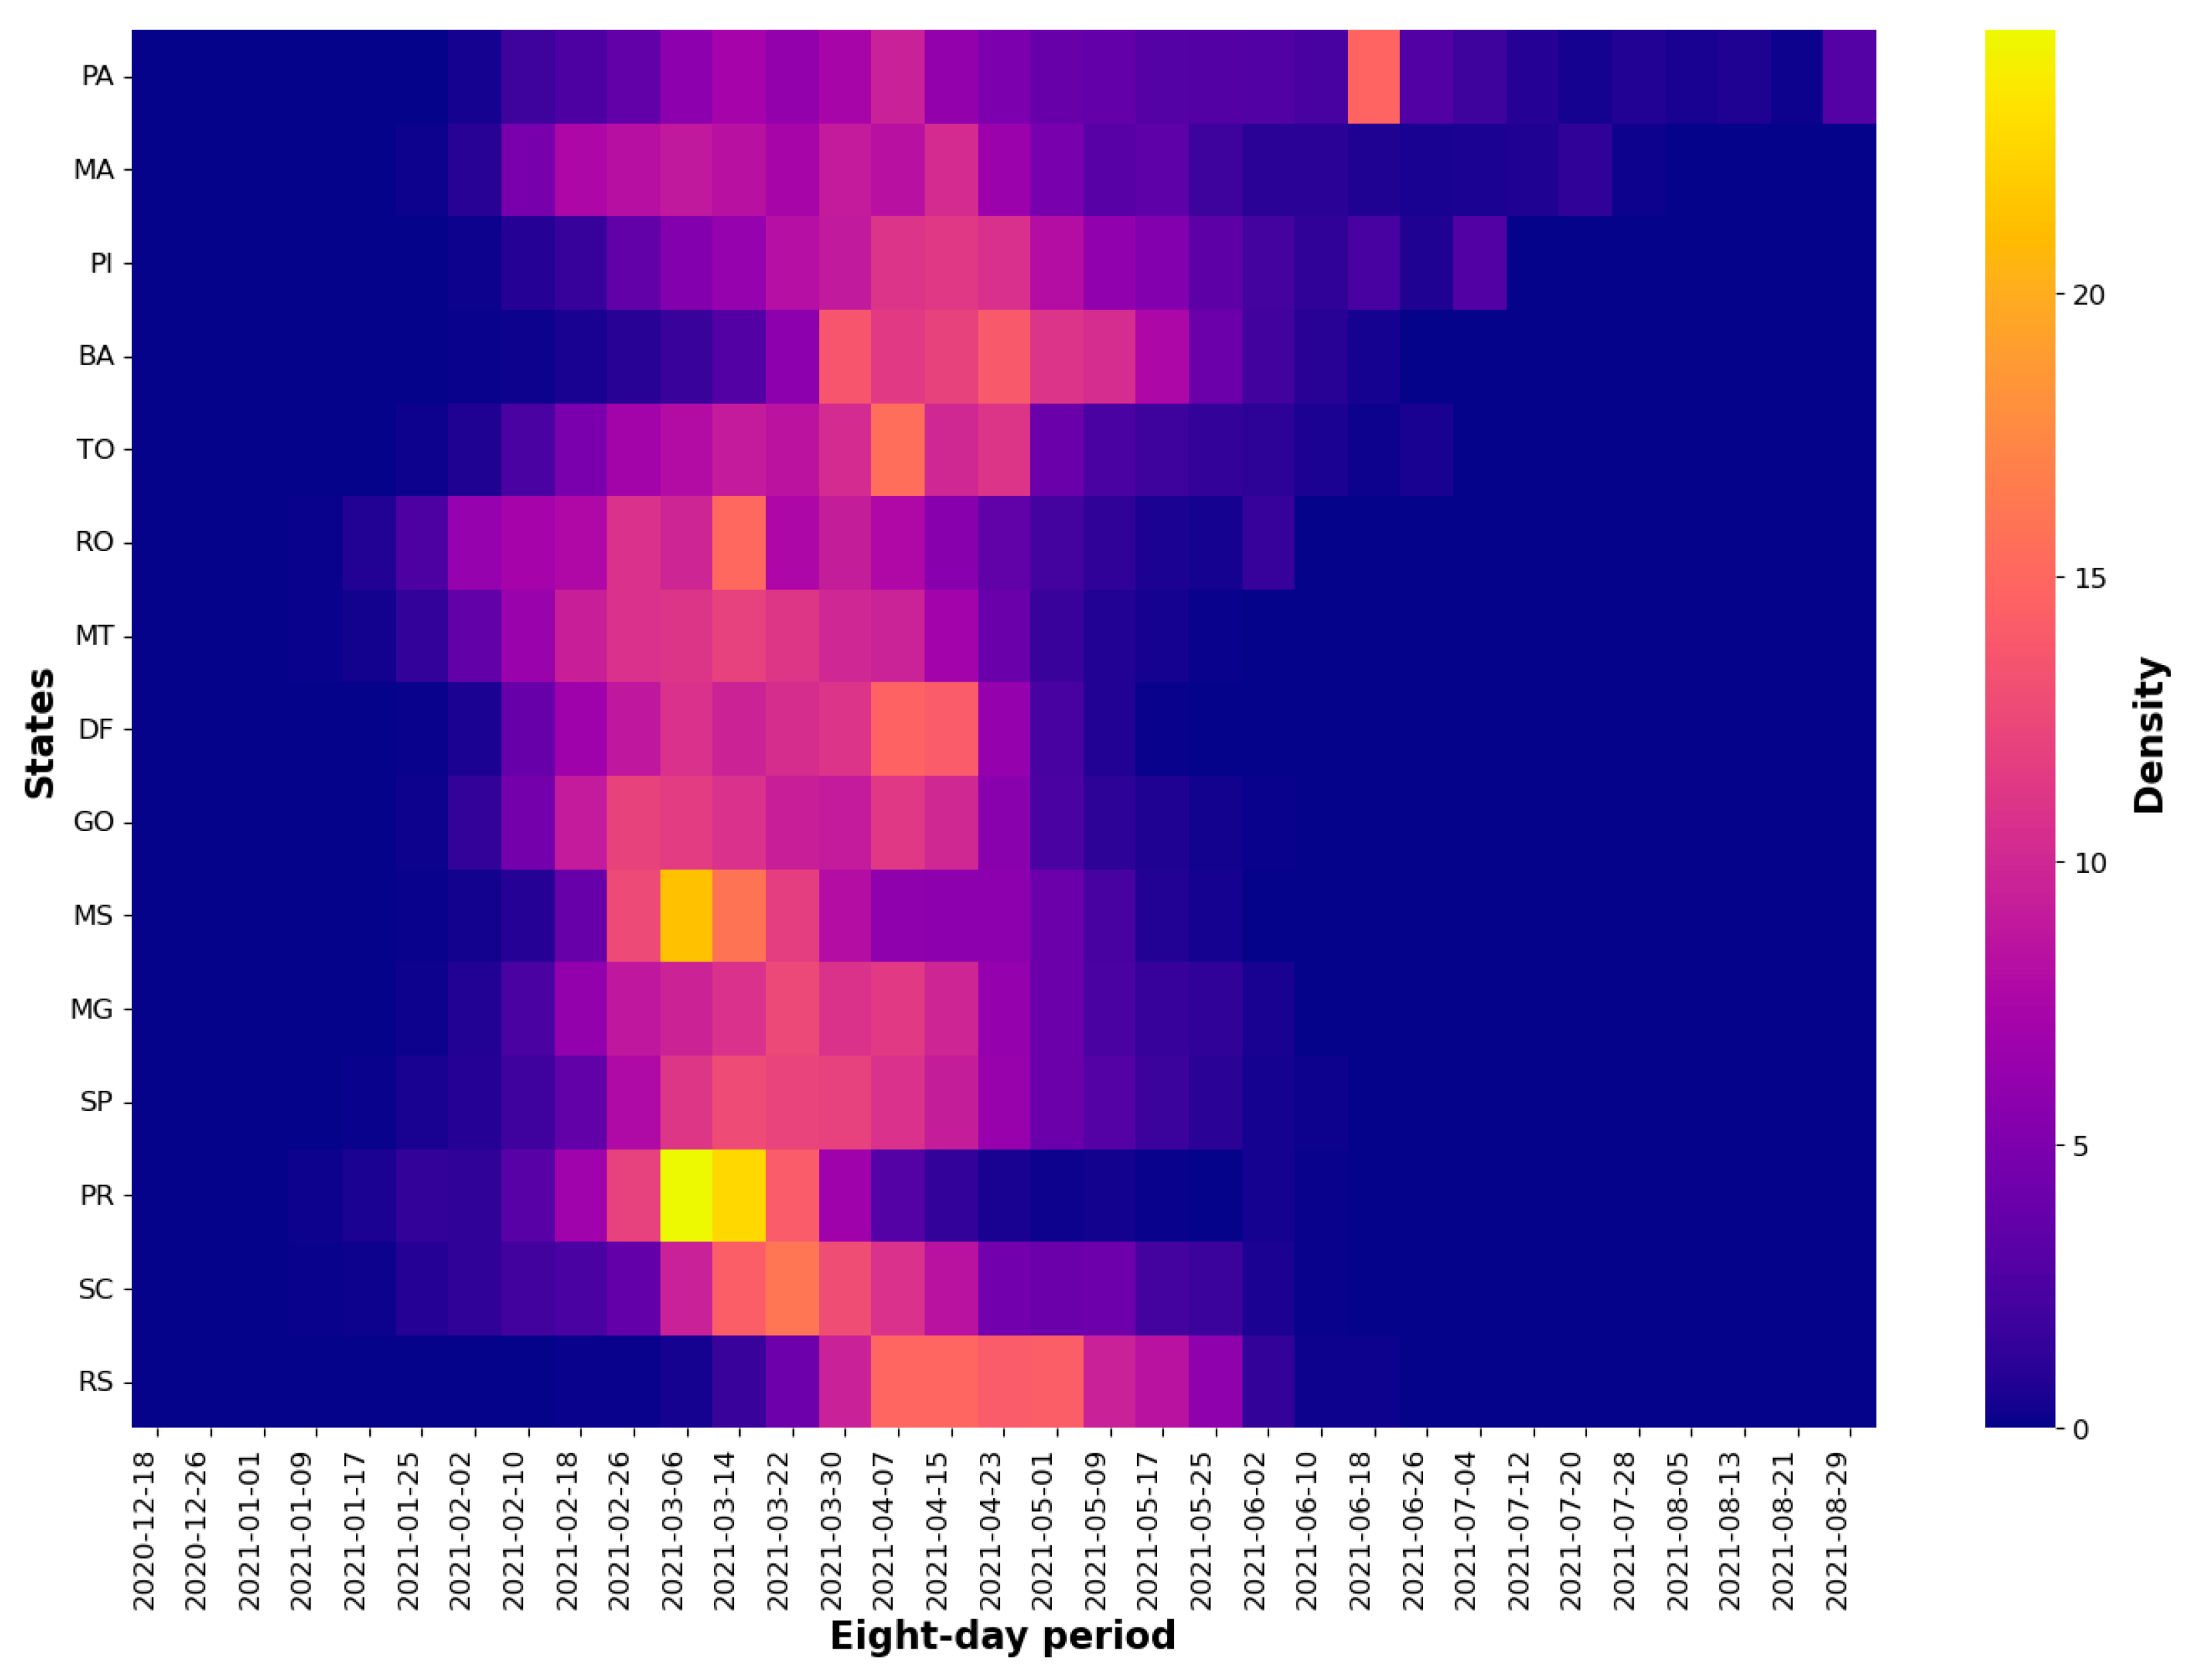
The method for estimating soybean phenology demonstrates scalability and can be applied across all major producing regions in Brazil for estimating the SOS (Figure A3), POS (Figure A4), and EOS (Figure A5). This adaptability is crucial, as it allows for the methodology to be implemented under varying regional conditions, encompassing the vast agricultural diversity of the country. Such flexibility is essential, as it confirms that the method is not only effective across different locales but also robust enough to provide consistent and reliable insights into the cropping cycle across various geographical and climatic contexts in Brazil.

4. Discussion

4.1. Potential of Phenological Metrics for Crop Monitoring Applications

Remote sensing-based techniques hold considerable potential for characterizing spatial–temporal patterns on a regional scale, as well as variations in the key phenological stages of soybeans [41]. In conjunction with modeling tools, the use of remote sensing stands out as the most efficient way to obtain timely and unbiased information over large areas [67]. The advantage of that information for this application lies in the fact that this technique meets the four essential requirements for identifying plant phenological stages: high temporal resolution (continuous information over time), rapid data distribution (near-real-time monitoring), adequate spatial resolution (monitoring of plots), and feasible integration with meteorological information [68]. The use of time series of vegetation indices calculated from data obtained through orbital remote sensing represents a promising approach to overcome the challenges of estimating phenological stages in continental-sized countries [61], where the variability in soil, climate, crops, and applied technology is significant.
Within this framework, phenological metrics have been increasingly used to obtain information on crop phenology [21] and can be estimated based on in situ observed information, statistical data, and empirical knowledge, allowing for the derivation of phenological stages [21,24,40,41,42,43,69]. By calibrating and validating these stages in relation to the reference sowing and harvesting dates, for instance, the vegetation indices observed by satellites can be correlated to ground-level behavior. These approaches using MODIS data have been successfully applied in soybean production in the United States [52,55,61,70,71,72] and South America [31,32,34,54], where about 90% of the world’s soybean production is concentrated.

4.2. Challenges and Solutions in Remote Sensing Data

The intrinsic variability among MODIS pixels within the same agricultural plot, due to spectral mixing, poses a significant obstacle [35]. Our methodology for selecting pure pixels from soybean areas to mitigate this variability proved to be robust and allowed for the construction of NDVI curves with characteristic spectral signatures for soybean areas. The use of images with better spatial resolution can be an alternative to mitigate problems associated with mixed pixels. While in our approach we chose to use pixels containing 100% soybean, some authors have achieved good results using pixels containing >80% [58] and >90% soybean [73].
We acknowledge that achieving an exact match between crop phenology and its spectral responses is statistically challenging, especially using data of moderate spatial resolution, such as MODIS. Despite good results, discrepancies between estimated phenological data and reference data of crop progress provided by the DERAL were still identified. Therefore, exploring the use of higher spatial resolution imagery (e.g., China–Brazil Earth Resources Satellite program (CBERS), Landsat, Sentinel, etc.) and the integration of data from multiple sensors, such as the Harmonized Landsat and Sentinel-2 (HLS) [74], to monitor crop growth emerges as a promising field for future investigations [75]. This multidimensional approach could offer more accurate and detailed insights into crop dynamics, contributing to the evolution of agricultural monitoring techniques and helping to reduce the effects of clouds and its shadows on the phenology monitoring, improving the remote sensing monitoring capacity over tropical regions, such as South America [54].

4.3. Importance of Smoothing Filters and Fitting Methods

With advancements in the spectral, spatial, and temporal resolutions of satellite imagery, the implementation of smoothing filters has become crucial for the efficient processing of large volumes of data in the field of digital image processing [76]. These smoothing techniques are particularly useful when applied to time series of vegetation indices, aiming to mitigate interferences, such as the presence of clouds and other atmospheric components [77]. Such an approach is essential to ensure that the collected data accurately and reliably represent the behavior of agricultural crops, minimizing noise and enhancing the accuracy of the derived information.
The application of mathematical functions is the most prevalent method for detecting phenological phenomena, primarily aiming at noise elimination in the data. These mathematical functions are used to model the temporal evolution of the development of agricultural crops, offering the flexibility to be adapted to a variety of contexts without the need for setting specific thresholds or imposing empirical restrictions. However, the accuracy of the fit of these functions has a direct impact on the accuracy and fidelity with which phenological characteristics are extracted, because the temporal curves of vegetation indices often exhibit irregularities. Such a situation can contribute to discrepancies in the estimated data of phenological metrics, especially when the extraction is carried out in time series whose smoothed curves do not exhibit adequate regularity [28].
The choice of the fitting method is crucial for the successful extraction of phenological events from smoothed time series, significantly affecting the performance of the process [78]. Therefore, the double-logistic function was adopted in our study due to its recognized effectiveness in fitting the temporal curves of vegetation indices [59]. This function is implemented as an interpolation method commonly used in phenology studies. The algorithm employs a double-sigmoidal model by combining two sigmoid functions to characterize phenological metrics of different vegetation indices. This method excels in adjusting the data around the peaks and troughs throughout the time series [63], allowing for the model functions to locally adapt to the data in the intervals close to the critical points of the phenological stages. One of the main advantages of this approach is that there is no need for predefining thresholds for the analysis [12], enabling the direct extraction of phenological transition dates from the fitted curve [79]. Its use allows for the efficient capture of phenological patterns in vegetation time series, which is crucial for the accurate analysis of crop phenology and crop monitoring [80].
However, inherent differences in the scale and content of observations between remote sensing methods and ground observations can limit the direct extrapolation of these data. These limitations can include data loss due to cloud cover, calibration issues between specific satellites, and calibration drift within the sensor, as well as complex data interpretations. These challenges make the phenological metrics identified by remote sensing not always suitable for direct extrapolation from ground observational experience due to the differences in scales and observation contents [81,82].
Nevertheless, this behavior is not observed in agricultural crops, such as soybeans. Unlike forest species, soybeans have a shorter phenological cycle and well-defined stages. These clearly marked stages allow for the phenological phases identified by remote sensing to be directly extrapolated from observational experience. This characteristic makes remote monitoring an effective tool for agricultural crops, enabling the precise and efficient tracking of plant development throughout their cycle.
Because the double-logistic function adapts to temporal dynamics, it stands out in the phenological monitoring of agricultural crops, specifically for annual agricultural crops, which characteristically have short development cycles and rapid vigor transitions. Its performance in representing short development cycles, without artificially prolonging the growing season’s duration, is a determining factor for its selection in recent studies. The double-logistic function can reduce the impact of spurious observations in the model-fitting process, by replacing all lower VI values of the off-season (period before or after the agricultural cycle) with the off-season VI value [59].
The effective applicability of the double-logistic function for smoothing NDVI time series stands out as a critical component in the accuracy of this model. This remarkable modeling capability, evidenced by the presence of regions with both underestimated and overestimated estimates, not only attests to the robustness of this method but also mitigates the possibility of a systematic underestimation bias. It demonstrates that the method is impartial and unbiased, given that there is no uniform predisposition toward the overestimation of data across all analyzed regions, thus underscoring the accuracy and reliability of this method in phenological analyses.

4.4. Methodological Limitations and Future Directions

One of the limitations in using the double-logistic function is that it does not allow for the estimation of phenological stages throughout the development of the agricultural crop [83]. The requirement for a complete seasonal curve for the application of the double-logistic function complicates the precise determination of phenological metrics during crop development. This limitation is not unique to the smoothing method in question and is a common obstacle to various curve-fitting techniques in phenology. A possible solution would be to modify the detection method to operate with only part of the seasonal curve, thus allowing for earlier estimates, or to use threshold-based models [28]. Alternatively, one could consider estimating the harvest date based solely on the vegetative peak [33]. In this scenario, the adoption of multiple phenological estimation techniques, particularly more simplified ones, could provide additional benefits, allowing for a more adaptable and comprehensive approach in phenological analysis.
It is important to highlight that, despite being widely used in phenological studies on Google Earth Engine (GEE) and being a well-established methodology for smoothing and fitting time series, the double-logistic function demonstrates an inability to distinguish between multiple seasonal cycles within a single year. This limitation is especially critical in high-intensity agricultural regions where crop rotation schemes and multiple annual growth cycles are common. The half-maximum criterion method employed by the double-logistic model fails to accurately capture these complex phenological patterns, underscoring the need for more advanced and adaptive approaches to phenological analysis in such contexts [83].
The implementation of the vegetative peak calendar specifically for soybean crops in the state of Paraná has proven to be an effective tool for differentiating the main soybean season from subsequent second-crop cultivations in NDVI time series. Given the agricultural landscape in Brazil, where the practice of multiple harvests is common, with up to three annual productive cycles in the same area, precise monitoring of the growth stages of specific crops presents a significant challenge for remote sensing. The overlap of these cycles can cause notable distortions in the collected data, thus requiring meticulous adjustments. The methodology employed in this study, which focuses on the accurate identification of the POS within a predefined window, was crucial for isolating the soybean growth cycle, thereby minimizing the influences of other crops during the same period. This approach proved to be key in ensuring a rigorous and representative assessment of the soybean phenological phenomenon, navigating the complexities posed by the frequent succession of crops in Brazilian agriculture.
This NDVI trajectory from the SOS through the POS to the EOS is characteristic of soybean growth patterns, where initial low values rise with vegetative development and then decline as the crop matures toward harvest. The presence of non-zero NDVI values at the SOS suggests the existence of crop residue or stubble on the soil surface, a common scenario in no-till soybean cultivation practices prevalent in Paraná, where over 81.7% of the area is seeded via no-tillage [84]. The distribution of NDVI values for each metric further substantiates the robustness of the methodology used. The data align with anticipated patterns: The SOS and EOS predominantly exhibit NDVI values ranging between 0.2 and 0.6, reflective of the beginning and end of the growth cycle where the vegetation is less dense. Conversely, the POS shows most values between 0.6 and 1.0, indicative of the peak vegetative state where the crop is at its densest. These distributions not only validate the methodology but also reinforce the predictive capacity of NDVI metrics to delineate the distinct stages of crop development accurately. The clustering of NDVI values around these expected ranges demonstrates the method’s efficacy in capturing the true phenological essence of the soybean cycle.
Regarding the distribution of dates for the SOS, POS, and EOS, although some outlier values are present, the central tendency of the data remains robust and reliable. This confirms the solidity of the methodological approach adopted and reinforces the trust in the observed phenological patterns. Such findings highlight the efficacy of the employed methodology, which sets the expected ranges for the SOS, POS, and EOS, thus minimizing the influence of outliers on the estimates. The presence of outliers does not impede the favorable outcomes, affirming that the method is resilient to sporadic variations. Consequently, no post-processing was conducted to eliminate them, demonstrating the robustness of the model in dealing with discrepancies without compromising the integrity of the phenological results. However, if the objective is to use the data for generating official crop progress reports, we suggest adopting certain deadline dates to eliminate data, as they reflect errors in the final product [73].

4.5. Statistical Analysis

The Kruskal–Wallis test results indicate consistency in both the collected and satellite-estimated data, suggesting that conditions for these stages of the crop cycle are uniform across the examined regions. Such a rigorous approach significantly reduces the likelihood of erroneously affirming the effectiveness of the model, thereby bolstering the reliability of our conclusions. Precise estimations of soybean phenology are pivotal for agricultural planning, harvest logistics, storage, and even impacting commodity markets. Inaccuracies in forecasting the harvest progression can precipitate erroneous decisions with substantial financial repercussions, underscoring the imperative for statistical rigor in the analysis of data.
The p-value result points to consistency in the data collected and estimated via satellite, suggesting that conditions for these crop cycle stages are similar across the analyzed regions. Such homogeneity might be indicative of standardized agricultural practices or similar climatic conditions that uniformly influence the sowing and harvest in these areas. On the other hand, the discrepancy observed between the reference data and estimated data during the beginning seed stage suggests that satellite estimates have a notable capacity to standardize this information, seemingly minimizing the regional variations observed in the reference data. This indicates that the use of remote sensing in obtaining estimates for the beginning seed stage may be particularly well tuned to effectively capture the essential characteristics of this stage, offering a more homogeneous view compared to data obtained through direct field observations.

4.5.1. Correlation Analysis

The high correlation coefficients (>0.9) achieved between the estimated and reference phenological dates underscore the method’s precision in reflecting soybean phenology. This is consistent with the findings of a study that utilized the Enhanced Vegetation Index (EVI), which achieved an R value of 0.8 in research conducted across four Brazilian states (São Paulo, Goiás, Paraná, and Minas Gerais) during the 2019/2020 growing season [35] Similarly, the use of the 16-day MODIS NDVI in studies across Iowa and Illinois, USA, from 2003 to 2016, yielded an R mean of 0.96 [52]. These substantial correlations attest to the method’s reliability in capturing the temporal dynamics of the soybean life cycle. Such strong agreement between estimated and reference data not only confirms the accuracy of produced phenological timings but also suggests its potential scalability. Given its robustness and precision, this approach holds significant promise for informing and refining soybean agricultural calendars throughout Brazil.
The comparability between satellite-derived estimates and reference data in Paraná regarding the onset and conclusion of soybean growth stages is remarkably evident across all three metrics. This consistency, particularly at the beginning (0–20%) and end (90–100%) stages of sowing, germination, and harvesting, underscores the precision with which these crucial agricultural timings can be identified. The DERAL’s intimate regional knowledge and direct communication with local farmers ensure highly accurate reports on the initiation and completion of each stage. However, greater variance is observed in the progression and rate of each stage (between 20 and 90%), indicating that while the extremes of growth stages are well defined, the duration and pace of intermediate stages are more variable, as found in other studies with similar objectives [52,58].

4.5.2. Mean Bias

The negative Mean Bias of −6.5 days for the SOS implies that the satellite-based estimates are generally lagging when compared to the reference data [34] despite a standard 10-day reduction from emergence to estimate sowing time as established in the scientific literature. However, in certain regions, extending this offset to 20 days may yield improved alignment. This discrepancy could be attributed to two factors: potential issues in data collection, such as premature reporting of sowing or unaccounted replanting events, and variations in sowing depth by some farmers, leading to delayed emergence. Therefore, it is essential to consider the distinction between sowing and crop emergence. Furthermore, other studies have also conducted a re-scaling of the SOS to derive sowing dates by subtracting a certain number of days, demonstrating the potential effectiveness of this approach [85,86].
The estimation of the POS, linked to the beginning seed stage (R5), presents additional challenges, being the only phenological metric that showed biases exceeding 14 days in some regions. Unlike the sowing (SOS) and harvesting (EOS) stages, which are clearly observable from a distance, the grain filling stage often requires direct field inspection to accurately determine this phenological stage. Therefore, field agents can assess the sowing and harvesting stages from a moving vehicle, thus covering a larger area more efficiently. On the other hand, the average bias observed for the POS was only 2.5 days. This can be attributed to the fact that the duration soybean remains in the R5 stage can vary from 11 to 20 days; hence, even if the algorithm has a bias of ±10 days, it can still accurately determine the grain filling stage. In contrast, the sowing and harvesting steps occur at specific moments (a single date), not extending over several days like the beginning stage of the crop.
As for the EOS, the positive Mean Bias of 2.5 days is relatively minor, and the correlation between the estimated and reference data remains high, as reflected by the correlation coefficient of 0.99. The slight delay in EOS estimates does not significantly detract from the overall accuracy, presenting the methodology as a viable candidate for refining phenological models. The discrepancy between the estimated and reference data for these same regions suggests that the ground truth may contain inherent inaccuracies in the collection process because, in the absence of errors, a similar pattern of behavior would be expected for the SOS and EOS. This finding points to the possibility of uncontrolled variables or methodological inconsistencies in the acquisition of reference data, reinforcing the importance of using remote sensing data for monitoring and tracking crop phenology more accurately and reliably. The results are in line with authors who found an average bias of 5.4 days for the SOS, −3.9 days for the POS, and −1 day for the EOS [52].

4.5.3. Standard Deviation of Bias (S.D. of Bias)

The found values of the S.D of Bias (EOS < SOS < POS) are consistent with expectations, considering that there is greater variability inherent in the sowing and beginning seed stages compared to the harvest. Soybean sowing is influenced by a range of factors: it must occur outside the sanitary vacuum period; must comply with the ZARC; and is contingent on the availability of inputs (especially seeds), the availability of agricultural machinery, adequate soil moisture, and favorable weather conditions, as excessive rainfall can interrupt sowing. Another point is that differences in seed quality can impact the estimate of the SOS, as low-quality seeds may germinate later, creating noisy information in the time series [34].
Thus, farmers are subject to various socioeconomic constraints that influence dynamic behavior in sowing. Variations in sowing dates can be observed on scales as small as crop fields, reflecting factors such as risk aversion, access to equipment and labor, use of irrigation, desired intensity of cultivation, and soil characteristics. In turn, interannual variations reflect climate volatility, fluctuations in commodity prices, equipment availability, and technological advancements. All these factors demonstrate the heterogeneity of soybean cultivation in a continent-sized country and pose a considerable challenge in generating phenological estimates [80]. Moreover, the sowing date is one of the necessary parameters in crop simulation models as input for productivity estimation. In the case of models, one of the difficulties of application at larger scales and that reduces the confidence in the results is the lack of field data, such as the sowing date [13], and even in developed countries, the necessary data are not always available with adequate geospatial details [14].
The beginning seed stage is a process that occurs in the plant over a period, which can last from 11 to 20 days. Thus, despite the inference we make where the POS is equivalent to the beginning seed stage, we know there is variability among different soybean cultivars, which can result in greater variability in the estimated data. As soybeans have determinate and indeterminate growth cultivars, the POS in the soybean temporal curve can vary between R5 (beginning seed) and R6 (full seed), producing greater data variability [41].
On the other hand, soybean harvesting is essentially affected by weather conditions (excess rain halts the harvest) and the availability of harvesters, with the determination of the occurrence date being important for managing the product supply, having a direct effect on the country’s logistic chain. Considering that most soybean producers own their machinery, the variability in harvesting is predominantly determined by suitable weather conditions. Moreover, most of the harvest occurs when there are still occurrences of high volumes of precipitation, prompting producers to quickly conduct the harvest. Otherwise, the grain rots on the plant and becomes unfit for consumption. Another point to consider is that Brazilian producers have a low statistical capacity for grain storage (80% of production compared to 131% in the USA), and as most also cultivate a second crop of corn or wheat after soybean harvest, there is an even greater need for the harvest to occur promptly. These factors contribute to a uniform and rapid harvest, reducing the variability between estimated and reference data.
It is worth noting that the cumulative curve related to estimated data, which displays a smooth and linear progression, differs from reference data, which sometimes show variations in the pace of sowing and harvesting, including unexpected slowdowns or accelerations, highlighting the advantage of cumulative data for a more stable and predictable interpretation of crop cycles. It is important to note that during the 2020/21 season, sowing was affected by delays due to low precipitation levels recorded at the beginning of the period [65]. These delays were equally reflected in the estimated data.
Thus, we emphasize that the precise definition of soybean phenological stages allows for the analysis of critical events in the production chain, such as the availability of soybeans for consumption, processing, and export. This information can also play a crucial role in the development of public policies aimed at food security [3], covering aspects such as storage policy, agricultural credit, and insurance, enabling more efficient resource allocation, more effective logistical planning, and ultimately contributing to the stability of the food supply and the sustainability of the agricultural industry.

4.5.4. Root Mean Square Error (RMSE)

Finally, the RMSEs found at the regional scale are comparable to those of other satellite-based estimates of soybean phenology in the USA, validated with data from the National Agricultural Statistics Service (NASS) of the United States Department of Agriculture (USDA) county-level crop progress reports [26,41], and in Brazil, validated with field data [35] and with crop progress reports by the Mato Grosso Institute of Agricultural Economics (IMEA-MT) [34]. Similarly, the RMSE values at the state level were also similar to those found for soybean phenology in the USA, validated with data from the USDA-NASS state-level crop progress reports [52,87], and in Brazil, validated with field data [35].
Some researchers have employed a Two-Step Filtering (TSF) approach to detect the phenological stages of corn and soybeans using WDRVI data derived from the MODIS sensor [41]. The TSF method involves smoothing the WDRVI time series with a wavelet-based filter and deriving parameters. This method accurately estimated the dates for four main phenological stages of corn (V2: second leaf; R1: silking; R5: dent stage; and R6: physiological maturity) and soybean (V1: first node; R5: beginning of seed filling; R6: full green seed; and R7: beginning of maturity). The RMSE for phenological stage estimation ranged from 2.9 (R1) to 7.0 (R5) days for corn and from 3.2 (R6) to 6.9 (R7) days for soybean. Additionally, the TSF method’s capability to characterize the spatiotemporal patterns of these phenological stages was tested over a larger geographic area, and the MODIS-derived dates showed a good correlation with the crop progress statistical data reported by the USDA-NASS for the three agricultural statistical districts in eastern Nebraska.
A refinement of the Shape Model-Fitting (SMF) method was proposed to enhance its applicability across a variety of U.S. agricultural crops [70]. The refined SMF method allowed for the estimation of the period for 36 phenological development stages of major U.S. crops, including soybeans. The calibration process for this method was conducted using only publicly accessible data, which are used as coefficients in the equation, without the need for long-term field observation data to calibrate specific crop phenological parameters. The calibration was carried out in two stages. In the first, national common phenological parameters were calibrated using 2008 statistical data, called the rSMF [base] method. The second stage was an additional calibration to obtain regionally adjusted phenological parameters for each state, using additional statistical data from 2015 and 2016, called the rSMF [local] method. The RMSE of the estimates derived from the rSMF [base] was 11.6 days for sowing, 7.1 days for pod setting, and 8.1 days for harvesting. The RMSE of the estimates derived from the rSMF [local] was 7.1 days for sowing, 5.2 days for pod setting, and 8.8 days for harvesting.
Phenology matching methods have the advantage of estimating specific crop development stages, minimizing the influence of errors and noise in NDVI data [41], but the accuracy of the estimates may be reduced if there is considerable variability in phenological stages across different crop years and/or different locations used to calibrate the matching method [21,26].
Moreover, this method is generally based on the entire time series, meaning that increased variability among crop years for a phenological stage can increase the uncertainty of the estimates. Finally, the accuracy and precision of in situ observations, as well as the sample size of observations (location and dates), can influence the accuracy of phenology detection [28].

5. Conclusions

We found a high correlation between the grain filling dates and the POS, followed by a strong association of EOS dates with harvesting, and SOS dates with sowing. These results highlight the accuracy of the temporal associations in our study. Notably, the POS and EOS exhibited significantly less variability compared to the SOS. After two decades of methodological refinement, the average errors associated with the estimates of sowing, grain filling, and harvesting dates were reduced to less than 7 days. The strong agreement between the phenological estimates and reference data underscores the reliability of phenological metrics in capturing the critical stages of the soybean growth cycle. These findings reinforce the potential of employing remote sensing techniques for the precise determination of the agricultural calendar across the Brazilian territory, solidifying the applicability of these methodologies in agricultural planning and management.
There is an urgent need to accurately estimate the phenological stages of agricultural crops, especially in the face of extreme weather events that pose a threat to global food security. We demonstrate the potential to improve remote sensing of soybean phenological stages in southern Brazil. One of the notable innovations of our study is the implementation of the vegetative peak calendar specifically for soybean crops. This approach has proven effective in differentiating the main soybean season from subsequent second-crop cultivations within the NDVI time series. Given the complex agricultural landscape in Brazil, where multiple harvests are common and can overlap within a single year, this methodology is crucial for the precise monitoring of crop growth stages. By accurately identifying the POS within a predefined window, we were able to isolate the soybean growth cycle, minimizing the influence of other crops. This advancement addresses the challenge of capturing phenological stages in high-intensity agricultural regions, demonstrating the potential for more accurate and representative assessments using remote sensing techniques. Overall, the results show a good correlation with the state-level soybean development calendar. Thus, the applicability of the proposed methodology can be utilized for decision-making at the state and/or national level.
However, there is still room for improvement, such as false alarms (outliers) and delays in prediction timing. Further studies could be conducted using harmonized products of Virtual Constellations, such as the NASA HLS, with the aim of increasing the temporal and spatial resolution, which can further improve the estimates. Additionally, the use of field-measured data (ground truth) and the application of this algorithm to other annual crops and regions can also help assess the robustness of the model.
The early detection of anomalies in the soybean agricultural calendar can significantly influence food security policies. Monitoring the phenological development of agricultural crops is important, and if diagnosed reliably, such information can be useful for addressing food shortages or surpluses in advance.
The lack of significant variations in the estimated percentages across various regions, according to the Kruskal–Wallis test, suggests that the methodology employed for estimation, based on the analysis of the NDVI curve from MODIS data, can be consistently applied in different geographic areas without introducing a significant bias that benefits or disadvantages any specific region. This finding is promising for the application of remote sensing technologies in the agricultural sector, indicating that such techniques can be effectively used in various regional contexts to monitor the different stages of the crop cycle.
In addition to enabling more accurate forecasting of soybean phenology, this information also provides essential insights for addressing challenges, such as climate impacts, seasonal variations, and fluctuations in commodity prices. Adequate monitoring not only optimizes logistical planning and resource management but also plays a crucial role in formulating risk mitigation strategies, ensuring the stability of food supply and the sustainability of the agricultural industry in the face of economic and climatic variables.
High-performance computing is rapidly advancing, and even for large study areas, it is feasible to apply our algorithms. The waiting time for the MODIS product to be made available on the Google Earth Engine (GEE) is less than ten days, and the computing time for our algorithm was approximately less than 24 h on a consumer desktop (Apple M2, 8 GB of RAM) for the study site (199,310 km2).

Author Contributions

Conceptualization, C.T.C.d.S., I.D.S. and M.A.; methodology, C.T.C.d.S., I.D.S. and M.A.; software, C.T.C.d.S. and M.A.; validation, C.T.C.d.S., I.D.S., M.M.C. and M.A.; formal analysis, C.T.C.d.S. and M.A.; investigation, C.T.C.d.S., I.D.S., M.M.C. and M.A.; resources, C.T.C.d.S., I.D.S., M.M.C. and M.A.; data curation, C.T.C.d.S., I.D.S. and M.A.; writing—original draft preparation, C.T.C.d.S.; writing—review and editing, C.T.C.d.S., I.D.S., M.M.C. and M.A.; visualization, C.T.C.d.S., I.D.S., M.M.C. and M.A.; supervision, I.D.S. and M.A.; project administration, I.D.S. and M.A.; funding acquisition, C.T.C.d.S. and I.D.S. All authors have read and agreed to the published version of the manuscript.

Funding

This study was financed in part by the Coordenação de Aperfeiçoamento de Pessoal de Nível Superior (CAPES), Brazil; Finance Code 001. The authors are grateful to the Brazilian National Council of Scientific and Technological Development (CNPq) for the Research Productivity Fellowship of Sanches, I.D [310042/2021-6] and Adami, M. [PQ 309045/2023-1].

Data Availability Statement

Data are contained within the article.

Conflicts of Interest

The author Cleverton Tiago Carneiro de Santana is employed by the National Food Supply Company. All authors declare that the research was conducted in the absence of any commercial or financial relationships that could be construed as potential conflicts of interest.

Correction Statement

This article has been republished with a minor correction to remove a duplicated paragraph and authors' citation format. This change does not affect the scientific content of the article.

Appendix A

Figure A1. A roadmap of the three stages of extraction of the phenological metrics.
Remotesensing 16 02520 g0a1
Figure A2. Regional breakdown of cumulative sowing, beginning seed, and harvesting percentages: detailed seasonal evolution by region of Paraná state.
Remotesensing 16 02520 g0a2aRemotesensing 16 02520 g0a2b
Figure A3. Temporal distribution of Start of Season (SOS) by eight-day periods across Brazilian states.
Remotesensing 16 02520 g0a3
Figure A4. Temporal distribution of Peak of Season (POS) by eight-day periods across Brazilian states.
Remotesensing 16 02520 g0a4
Figure A5. Temporal distribution of End of Season (EOS) by eight-day periods across Brazilian states.
Remotesensing 16 02520 g0a5

References

  1. FAO—Food and Agriculture Organization of the United Nations. Faostat. 2023. Available online: http://www.fao.org/faostat/en/#data (accessed on 26 October 2023).
  2. CEPEA—Centro de Estudos Avançados em Economia Aplicada—CEPEA-Esalq/USP. Available online: https://www.cepea.esalq.usp.br/br/mercado-de-trabalho-do-agronegocio.aspx (accessed on 26 October 2023).
  3. Dias, L.C.P.; Pimenta, F.M.; Santos, A.B.; Costa, M.H.; Ladle, R.J. Patterns of land use, extensification, and intensification of Brazilian agriculture. Glob. Chang. Biol. 2016, 22, 2887–2903. [Google Scholar] [CrossRef] [PubMed]
  4. CONAB—Companhia Nacional de Abastecimento. Calendário de Plantio e Colheita de Grãos no Brasil. 2022. Available online: https://www.conab.gov.br/institucional/publicacoes/outras-publicacoes (accessed on 26 October 2023).
  5. Paschal, H.; Berger, G.; Nari, C. Soybean breeding in South America. In Proceedings of the American Seed Trade Association Conference, 30th ASTA, Chicago, IL, USA, 7–10 December 2000; pp. 11–18. [Google Scholar]
  6. Bergamaschi, H. O clima como fator determinante da fenologia das plantas. In Fenologia: Ferramenta para Conservação, Melhoramento e Manejo de Recursos Vegetais Arbóreos, 1st ed.; Embrapa Florestas: Colombo, Brazil, 2007; pp. 291–310. [Google Scholar]
  7. Sediyama, T.; Oliveira, R.C.T.; Sediyama, H.A. A Soja. In Produtividade da Soja, 2nd ed.; Sediyama, T., Ed.; Mecenas: Londrina, Brasil, 2016; pp. 11–18. [Google Scholar]
  8. Fehr, W.R.; Caviness, C.E. Stages of Soybean Development, 1st ed.; Iowa State University of Science and Technology: Ames, IA, USA, 1977; pp. 1–11. [Google Scholar]
  9. Duveiller, G.; López-Lozano, R.; Seguini, L.; Bojanowski, J.S.; Baruth, B. Optical Remote Sensing Requirements for Operational Crop Monitoring and Yield Forecasting in Europe. In Proceedings of the Sentinel-3 OLCI/SLSTR and MERIS/(A)ATSR Workshop, ESA SP-711, Frascati, Italy, 15–19 October 2012. [Google Scholar]
  10. Embrapa—Empresa Brasileira de Pesquisa Agropecuária. Tecnologias de Produção de Soja: Região Central do Brasil 2012–2013, 1st ed.; Embrapa Soja: Londrina, Brazil, 2011; pp. 1–262. [Google Scholar]
  11. Brazil. Dispõe sobre o Programa Nacional de Zoneamento Agrícola de Risco Climático; Decreto No. 9.841, de 18 de Junho de 2019; Ministério da Agricultura e Pecuária: Brasília, Brazil, 2019. [Google Scholar]
  12. Gao, F.; Anderson, M.C.; Zhang, X.; Yang, Z.; Alfieri, J.G.; Kustas, W.P.; Mueller, R.; Johnson, D.M.; Prueger, J.H. Toward Mapping Crop Progress at Field Scales through Fusion of Landsat and MODIS Imagery. Remote Sens. Environ. 2017, 188, 9–25. [Google Scholar] [CrossRef]
  13. Dente, L.; Satalino, G.; Mattia, F.; Rinaldi, M. Assimilation of Leaf Area Index Derived from ASAR and MERIS Data into CERES-Wheat Model to Map Wheat Yield. Remote Sens. Environ. 2008, 112, 1395–1407. [Google Scholar] [CrossRef]
  14. Van Ittersum, M.K.; Cassman, K.G.; Grassini, P.; Wolf, J.; Tittonell, P.; Hochman, Z. Yield Gap Analysis with Local to Global Relevance—A Review. Field Crops Res. 2013, 143, 4–17. [Google Scholar] [CrossRef]
  15. Santos, J.S.; Fontana, D.C.; Silva, T.S.F.; Rudorff, B.F.T. Identificação da dinâmica espaço-temporal para estimar área cultivada de soja a partir de imagens MODIS no Rio Grande do Sul. Rev. Bras. Eng. Agríc. Ambient. 2014, 18, 54–63. [Google Scholar] [CrossRef]
  16. Hufkens, K.; Melaas, E.K.; Mann, M.L.; Foster, T.; Ceballos, F.; Robles, M.; Kramer, B. Monitoring crop phenology using a smartphone based near-surface remote sensing approach. Agric. For. Meteorol. 2019, 265, 327–337. [Google Scholar] [CrossRef]
  17. Gao, F.; Anderson, M.; Daughtry, C.; Karnieli, A.; Hively, D.; Kustas, W. A within-season approach for detecting early growth stages in corn and soybean using high temporal and spatial resolution imagery. Remote Sens. Environ. 2020, 242, 111752. [Google Scholar] [CrossRef]
  18. Whitcraft, A.K.; Becker-Reshef, I.; Justice, C.O. Agricultural growing season calendars derived from MODIS surface reflectance. Int. J. Digit. Earth 2015, 8, 173–197. [Google Scholar] [CrossRef]
  19. Whitcraft, A.K.; Vermote, E.F.; Becker-Reshef, I.; Justice, C.O. Cloud cover throughout the agricultural growing season: Impacts on passive optical earth observations. Remote Sens. Environ. 2015, 156, 438–447. [Google Scholar] [CrossRef]
  20. Carletto, C.; Dillon, A.; Zezza, A. Agricultural data collection to minimize measurement error and maximize coverage. In Handbook of Agricultural Economics, 5th ed.; Elsevier: Amsterdam, The Netherlands, 2021; Volume 5, pp. 4407–4480. [Google Scholar]
  21. Xu, X.; Conrad, C.; Doktor, D. Optimising phenological metrics extraction for different crop types in Germany using the Moderate Resolution Imaging Spectrometer (MODIS). Remote Sens. 2017, 9, 254. [Google Scholar] [CrossRef]
  22. Lieth, H. Introduction to phenology and modeling of seasonality. In Phenology and Seasonality Modeling, 8th ed.; Lieth, H., Ed.; Springer: Berlin, Germany, 1974; Volume 8, pp. 3–19. [Google Scholar]
  23. Jönsson, P.; Eklundh, L. Seasonality extraction by function fitting to time-series of satellite sensor data. IEEE Trans. Geosci. Remote Sens. 2002, 40, 1824–1832. [Google Scholar] [CrossRef]
  24. Sakamoto, T.; Yokozawa, M.; Toritani, H.; Shibayama, M.; Ishitsuka, N.; Ohno, H. A crop phenology detection method using time-series MODIS data. Remote Sens. Environ. 2005, 96, 366–374. [Google Scholar] [CrossRef]
  25. Zhang, X.; Friedl, M.A.; Schaaf, C.B. Global vegetation phenology from Moderate Resolution Imaging Spectroradiometer (MODIS): Evaluation of global patterns and comparison with in situ measurements. J. Geophys. Res. Biogeosci. 2006, 111, JG000217. [Google Scholar] [CrossRef]
  26. Zeng, L.; Wardlow, B.D.; Wang, R.; Shan, J.; Tadesse, T.; Hayes, M.J.; Li, D. A hybrid approach for detecting corn and soybean phenology with time-series MODIS data. Remote Sens. Environ. 2016, 181, 237–250. [Google Scholar] [CrossRef]
  27. Bajocco, S.; Raparelli, E.; Teofili, T.; Bascietto, M.; Ricotta, C. Text mining in remotely sensed phenology studies: A review on research development, main topics, and emerging issues. Remote Sens. 2019, 11, 2751. [Google Scholar] [CrossRef]
  28. Zeng, L.; Wardlow, B.D.; Xiang, D.; Hu, S.; Li, D. A review of vegetation phenological metrics extraction using time-series, multispectral satellite data. Remote Sens. Environ. 2020, 237, 111511. [Google Scholar] [CrossRef]
  29. CONAB—Companhia Nacional de Abastecimento. Séries Históricas das Safras, Grãos, Soja. Available online: https://www.conab.gov.br/info-agro/safras/serie-historica-das-safras (accessed on 12 January 2024).
  30. IBGE—Instituto Brasileiro de Geografia e Estatística. Biomas e Sistema Costeiro-Marinho do Brasil. 2019. Available online: https://www.ibge.gov.br/geociencias/informacoes-ambientais/vegetacao/15842-biomas.html (accessed on 18 July 2023).
  31. Johann, J.A.; Becker, W.R.; Uribe-Opazo, M.A.; Mercante, E. Uso de imagens do sensor orbital MODIS na estimação de datas do ciclo de desenvolvimento da cultura da soja para o Estado do Paraná—Brasil. Eng. Agríc. 2016, 36, 126–142. [Google Scholar] [CrossRef]
  32. Becker, W.R.; Richetti, J.; Mercante, E.; Esquerdo, J.C.D.M.; da Silva Junior, C.A.; Paludo, A.; Johann, J.A. Agricultural soybean and corn calendar based on moderate resolution satellite images for southern Brazil. Semina Ciênc. Agrár. 2020, 41, 2419–2428. [Google Scholar] [CrossRef]
  33. Becker, W.R.; Silva, L.C.D.A.; Richetti, J.; Ló, T.B.; Johann, J.A. Harvest date forecast for soybeans from maximum vegetative development using satellite images. Int. J. Remote Sens. 2021, 42, 1121–1138. [Google Scholar] [CrossRef]
  34. Zhang, M.; Abrahao, G.; Cohn, A.; Campolo, J.; Thompson, S. A MODIS-based scalable remote sensing method to estimate sowing and harvest dates of soybean crops in Mato Grosso, Brazil. Heliyon 2021, 7, e07436. [Google Scholar] [CrossRef]
  35. Rodigheri, G.; Sanches, I.D.A.; Richetti, J.; Tsukahara, R.Y.; Lawes, R.; Bendini, H.D.N.; Adami, M. Estimating crop sowing and harvesting dates using satellite vegetation index: A comparative analysis. Remote Sens. 2023, 15, 5366. [Google Scholar] [CrossRef]
  36. Song, X.P.; Hansen, M.C.; Potapov, P.; Adusei, B.; Pickering, J.; Adami, M.; Lima, A.; Zalles, V.; Stehman, S.V.; Di Bella, C.M.; et al. Massive soybean expansion in South America since 2000 and implications for conservation. Nat. Sustain. 2021, 4, 784–792. [Google Scholar] [CrossRef] [PubMed]
  37. Townshend, J.R.G.; Huang, C.; Kalluri, S.N.V.; Defries, R.S.; Liang, S.; Yang, K. Beware of per-pixel characterization of land cover. Int. J. Remote Sens. 2000, 21, 839–843. [Google Scholar] [CrossRef]
  38. Rouse, J.W.; Hass, R.H.; Schell, J.A.; Deering, D.W. Monitoring vegetation systems in the great plains with ERTS. In Proceedings of the Third ERTS Symposium, Washington, DC, USA, 10–14 December 1973; pp. 309–317. [Google Scholar]
  39. Guindin-Garcia, N.; Gitelson, A.A.; Arkebauer, T.J.; Shanahan, J.; Weiss, A. An evaluation of MODIS 8- and 16-day composite products for monitoring maize green leaf area index. Agric. For. Meteorol. 2012, 161, 15–25. [Google Scholar] [CrossRef]
  40. Boschetti, M.; Stroppiana, D.; Brivio, P.A.; Bocchi, S. Multi-year monitoring of rice crop phenology through time series analysis of MODIS images. Int. J. Remote Sens. 2009, 30, 4643–4662. [Google Scholar] [CrossRef]
  41. Sakamoto, T.; Wardlow, B.D.; Gitelson, A.A.; Verma, S.B.; Suyker, A.E.; Arkebauer, T.J. A two-step filtering approach for detecting maize and soybean phenology with time-series MODIS data. Remote Sens. Environ. 2010, 114, 2146–2159. [Google Scholar] [CrossRef]
  42. Zhao, H.; Yang, Z.; Di, L.; Pei, Z. Evaluation of temporal resolution effect in remote sensing based crop phenology detection studies. In Proceedings of the 5th IFIP TC 5/SIG 5.1 Conference on Computer and Computing Technologies in Agriculture (CCTA 2011), Beijing, China, 29–31 October 2011. [Google Scholar] [CrossRef]
  43. Castro, A.I.; Six, J.; Plant, R.E.; Peña, J.M. Mapping crop calendar events and phenology-related metrics at the parcel level by Object-Based Image Analysis (OBIA) of MODIS-NDVI time-series: A Case Study in Central California. Remote Sens. 2018, 10, 1745. [Google Scholar] [CrossRef]
  44. Siłuch, M.; Bartminski, P.; Zgłobicki, W. Remote sensing in studies of the growing season: A bibliometric analysis. Remote Sens. 2022, 14, 1331. [Google Scholar] [CrossRef]
  45. Justice, C.O.; Vermote, E.; Townshend, J.R.G.; Defries, R.; Roy, D.P.; Hall, D.K.; Salomonson, V.V.; Privette, J.L.; Riggs, G.; Strahler, A.; et al. The Moderate Resolution Imaging Spectroradiometer (MODIS): Land remote sensing for global change research. IEEE Trans. Geosci. Remote Sens. 1998, 36, 1228–1249. [Google Scholar] [CrossRef]
  46. Hogda, K.A.; Karlsen, S.R.; Solheim, I. Climatic change impact on growing season in Fennoscandia studied by a time series of NOAA AVHRR NDVI data. In Proceedings of the International Geoscience and Remote Sensing Symposium, Sidney, Australia, 9–13 July 2001; IGARSS 2001; pp. 1338–1340. [Google Scholar] [CrossRef]
  47. Wagenseil, H.; Samimi, C. Assessing spatio-temporal variations in plant phenology using Fourier analysis on NDVI time series: Results from a dry savannah environment in Namibia. Int. J. Remote Sens. 2006, 27, 3455–3471. [Google Scholar] [CrossRef]
  48. Kariyeva, J.; Van Leeuwen, W.J.D. Environmental drivers of NDVI-based vegetation phenology in Central Asia. Remote Sens. 2011, 3, 203–246. [Google Scholar] [CrossRef]
  49. Hou, X.; Gao, S.; Zheng, N.; Xu, Z. Extracting grassland vegetation phenology in North China based on cumulative SPOT-VEGETATION NDVI data. Int. J. Remote Sens. 2014, 35, 3316–3330. [Google Scholar] [CrossRef]
  50. Pan, Z.; Huang, J.; Zhou, Q.; Wang, L.; Cheng, Y.; Zhang, H.; Blackburn, G.A.; Yan, J.; Liu, J. Mapping crop phenology using NDVI time-series derived from HJ-1 A/B data. Int. J. Appl. Earth Obs. Geoinf. 2015, 34, 188–197. [Google Scholar] [CrossRef]
  51. Wu, C.; Peng, D.; Soudani, K.; Siebicke, L.; Gough, C.M.; Arain, M.A.; Bohrer, G.; Lafluer, P.M.; Peichl, M.; Gonsamo, A.; et al. Land surface phenology derived from normalized difference vegetation index (NDVI) at global FLUXNET sites. Agric. For. Meteorol. 2017, 233, 171–182. [Google Scholar] [CrossRef]
  52. Seo, B.; Lee, J.; Lee, K.-D.; Hong, S.; Kang, S. Improving remotely-sensed crop monitoring by NDVI-based crop phenology estimators for corn and soybeans in Iowa and Illinois, USA. Field Crops Res. 2019, 238, 113–128. [Google Scholar] [CrossRef]
  53. Adami, M. Estimativa da Data de Plantio da Soja Por Meio de Séries Temporais de Imagens MODIS; Doutorado em Sensoriamento Remoto, Instituto Nacional de Pesquisas Espaciais: São José dos Campos, Brasil, 2010. [Google Scholar]
  54. Prudente, V.H.R.; Martins, V.S.; Vieira, D.C.; Silva, N.R.F.; Adami, M.; Sanches, I.D.A. Limitations of cloud cover for optical remote sensing of agricultural areas across South America. Remote Sens. Appl. Soc. Environ. 2020, 20, 100414. [Google Scholar] [CrossRef]
  55. Wardlow, B.D.; Kastens, J.H.; Egbert, S.L. Using USDA Crop Progress Data for the Evaluation of Greenup Onset Date Calculated from MODIS 250-Meter Data. Photogramm. Eng. Remote Sens. 2006, 72, 1225–1234. [Google Scholar] [CrossRef]
  56. Vieira, D.C.; Sanches, I.D.A.; Montibeller, B.; Prudente, V.H.R.; Hansen, M.C.; Baggett, A.; Adami, M. Cropland expansion, intensification, and reduction in Mato Grosso state, Brazil, between the crop years 2000/01 to 2017/18. Remote Sens. Appl. Soc. Environ. 2022, 28, 100841. [Google Scholar] [CrossRef]
  57. Fischer, A. A simple model for the temporal variations of NDVI at regional scale over agricultural countries. Validation with ground radiometric measurements. Int. J. Remote Sens. 1994, 15, 1421–1446. [Google Scholar] [CrossRef]
  58. Liu, L.; Zhang, X.; Yu, Y.; Gao, F.; Yang, Z. Real-time monitoring of crop phenology in the Midwestern United States using VIIRS observations. Remote Sens. 2018, 10, 1540. [Google Scholar] [CrossRef]
  59. Beck, P.S.A.; Atzberger, C.; Høgda, K.A.; Johansen, B.; Skidmore, A.K. Improved monitoring of vegetation dynamics at very high latitudes: A new method using MODIS NDVI. Remote Sens. Environ. 2006, 100, 321–334. [Google Scholar] [CrossRef]
  60. Zhang, X.; Friedl, M.A.; Schaaf, C.B.; Strahler, A.H.; Hodges, J.C.F.; Gao, F.; Reed, B.C.; Huete, A. Monitoring vegetation phenology using MODIS. Remote Sens. Environ. 2003, 84, 471–475. [Google Scholar] [CrossRef]
  61. Diao, C. Remote sensing phenological monitoring framework to characterize corn and soybean physiological growing stages. Remote Sens. Environ. 2020, 248, 111960. [Google Scholar] [CrossRef]
  62. Duarte, L.; Teodoro, A.C.; Monteiro, A.T.; Cunha, M.; Gonçalves, H. QPhenoMetrics: An open source software application to assess vegetation phenology metrics. Comput. Electron. Agric. 2018, 148, 82–94. [Google Scholar] [CrossRef]
  63. Jönsson, P.; Eklundh, L. TIMESAT—A program for analyzing time-series of satellite sensor data. Comput. Geosci. 2004, 30, 833–845. [Google Scholar] [CrossRef]
  64. Rezaei, E.E.; Ghazaryan, G.; González, J.; Cornish, N.; Dubovyk, O.; Siebert, S. The use of remote sensing to derive maize sowing dates for large-scale crop yield simulations. Int. J. Biometeorol. 2021, 65, 565–576. [Google Scholar] [CrossRef]
  65. SEAB, Secretaria de Estado da Agricultura e do Abastecimento, and Departamento de Economia Rural DERAL. 2019. Estimativa Mensal de Plantio, Colheita e Comercialização Das Culturas. Available online: http://www.agricultura.pr.gov.br/deral/safras (accessed on 12 November 2023).
  66. Kruskal, W.H.; Wallis, W.A. Use of ranks in one-criterion variance analysis. J. Am. Stat. Assoc. 1952, 47, 583–621. [Google Scholar] [CrossRef]
  67. Choudhary, K.; Shi, W.; Boori, M.S.; Corgne, S. Agriculture phenology monitoring using NDVI time series based on remote sensing satellites: A case study of Guangdong, China. Opt. Mem. Neural Netw. 2019, 28, 204–214. [Google Scholar] [CrossRef]
  68. Atzberger, C. Advances in remote sensing of agriculture: Context description, existing operational monitoring systems and major information needs. Remote Sens. 2013, 5, 949–981. [Google Scholar] [CrossRef]
  69. Zhang, X.; Jayavelu, S.; Liu, L.; Friedl, M.A.; Henebry, G.M.; Liu, Y.; Schaaf, C.B.; Richardson, A.D.; Gray, J. Evaluation of land surface phenology from VIIRS data using time series of PhenoCam imagery. Agric. For. Meteorol. 2018, 256, 137–149. [Google Scholar] [CrossRef]
  70. Sakamoto, T. Refined shape model fitting methods for detecting various types of phenological information on major U.S. crops. ISPRS J. Photogramm. Remote Sens. 2018, 138, 176–192. [Google Scholar] [CrossRef]
  71. Urban, D.; Guan, K.; Jain, M. Estimating sowing dates from satellite data over the US Midwest: A comparison of multiple sensors and metrics. Remote Sens. Environ. 2018, 211, 400–412. [Google Scholar] [CrossRef]
  72. Yang, Y.; Ren, W.; Tao, B.; Ji, L.; Liang, L.; Ruane, A.C.; Fisher, J.B.; Liu, J.; Sama, M.; Li, Z.; et al. Characterizing spatiotemporal patterns of crop phenology across North America during 2000–2016 using satellite imagery and agricultural survey data. ISPRS J. Photogramm. Remote Sens. 2020, 170, 156–173. [Google Scholar] [CrossRef]
  73. Bolton, D.K.; Friedl, M.A. Forecasting crop yield using remotely sensed vegetation indices and crop phenology metrics. Agric. For. Meteorol. 2013, 173, 74–84. [Google Scholar] [CrossRef]
  74. Claverie, M.; Ju, J.; Masek, J.G.; Dungan, J.L.; Vermote, E.F.; Roger, J.C.; Skakun, S.V.; Justice, C. The Harmonized Landsat and Sentinel-2 surface reflectance data set. Remote Sens. Environ. 2018, 219, 145–161. [Google Scholar] [CrossRef]
  75. Gao, F.; Zhang, X. Mapping crop phenology in near real-time using satellite remote sensing: Challenges and opportunities. J. Remote Sens. 2021, 2021, 8379391. [Google Scholar] [CrossRef]
  76. Kennedy, H.L. Multidimensional digital smoothing filters for target detection. Signal Process. 2015, 114, 251–264. [Google Scholar] [CrossRef]
  77. Tian, J.; Zhu, X.; Chen, J.; Wang, C.; Shen, M.; Yang, W.; Li, Z. Improving the accuracy of spring phenology detection by optimally smoothing satellite vegetation index time series based on local cloud frequency. ISPRS J. Photogramm. Remote Sens. 2021, 180, 29–44. [Google Scholar] [CrossRef]
  78. Kandasamy, S.; Baret, F.; Verger, A.; Neveux, P.; Weiss, M. A comparison of methods for smoothing and gap filling time series of remote sensing observations—Application to MODIS LAI products. Biogeosciences 2013, 10, 4055–4071. [Google Scholar] [CrossRef]
  79. Zhong, L.; Hu, L.; Yu, L.; Gong, P.; Biging, G.S. Automated mapping of soybean and corn using phenology. ISPRS J. Photogramm. Remote Sens. 2016, 119, 151–164. [Google Scholar] [CrossRef]
  80. Belda, S.; Pipia, L.; Morcillo-Pallarés, P.; Rivera-Caicedo, J.P.; Amin, E.; De Grave, C.; Verrelst, J. DATimeS: A machine learning time series GUI toolbox for gap-filling and vegetation phenology trends detection. Environ. Model. Softw. 2020, 127, 104666. [Google Scholar] [CrossRef] [PubMed]
  81. Schwartz, M.D.; Reed, B.C.; White, M.A. Assessing satellite-derived start-of-season measures in the conterminous USA. Int. J. Climatol. 2002, 22, 1793–1805. [Google Scholar] [CrossRef]
  82. Fisher, J.I.; Mustard, J.F.; Vadeboncoeur, M.A. Green leaf phenology at Landsat resolution: Scaling from the field to the satellite. Remote Sens. Environ. 2006, 100, 265–279. [Google Scholar] [CrossRef]
  83. Amin, E.; Belda, S.; Pipia, L.; Szantoi, Z.; El Baroudy, A.; Moreno, J.; Verrelst, J. Multi-Season Phenology Mapping of Nile Delta Croplands Using Time Series of Sentinel-2 and Landsat 8 Green LAI. Remote Sens. 2022, 14, 1812. [Google Scholar] [CrossRef] [PubMed]
  84. IBGE/SIDRA—Sistema IBGE de Recuperação Automática. Censo Agropecuário 2017: Resultados Definitivos. Rio de Janeiro: IBGE, 2024. Available online: https://sidra.ibge.gov.br/pesquisa/censo-agropecuario/censo-agropecuario-2017 (accessed on 12 January 2024).
  85. Lobell, D.B.; Ortiz-Monasterio, J.I.; Sibley, A.M.; Sohu, V.S. Satellite detection of earlier wheat sowing in India and implications for yield trends. Agric. Syst. 2013, 115, 137–143. [Google Scholar] [CrossRef]
  86. Vyas, S.; Nigam, R.; Patel, N.K.; Panigrahy, S. Extracting regional pattern of wheat sowing dates using multispectral and high temporal observations from Indian geostationary satellite. J. Indian Soc. Remote Sens. 2013, 41, 855–864. [Google Scholar] [CrossRef]
  87. Ren, J.; Campbell, J.B.; Shao, Y. Estimation of SOS and EOS for Midwestern US corn and soybean crops. Remote Sens. 2017, 9, 722. [Google Scholar] [CrossRef]
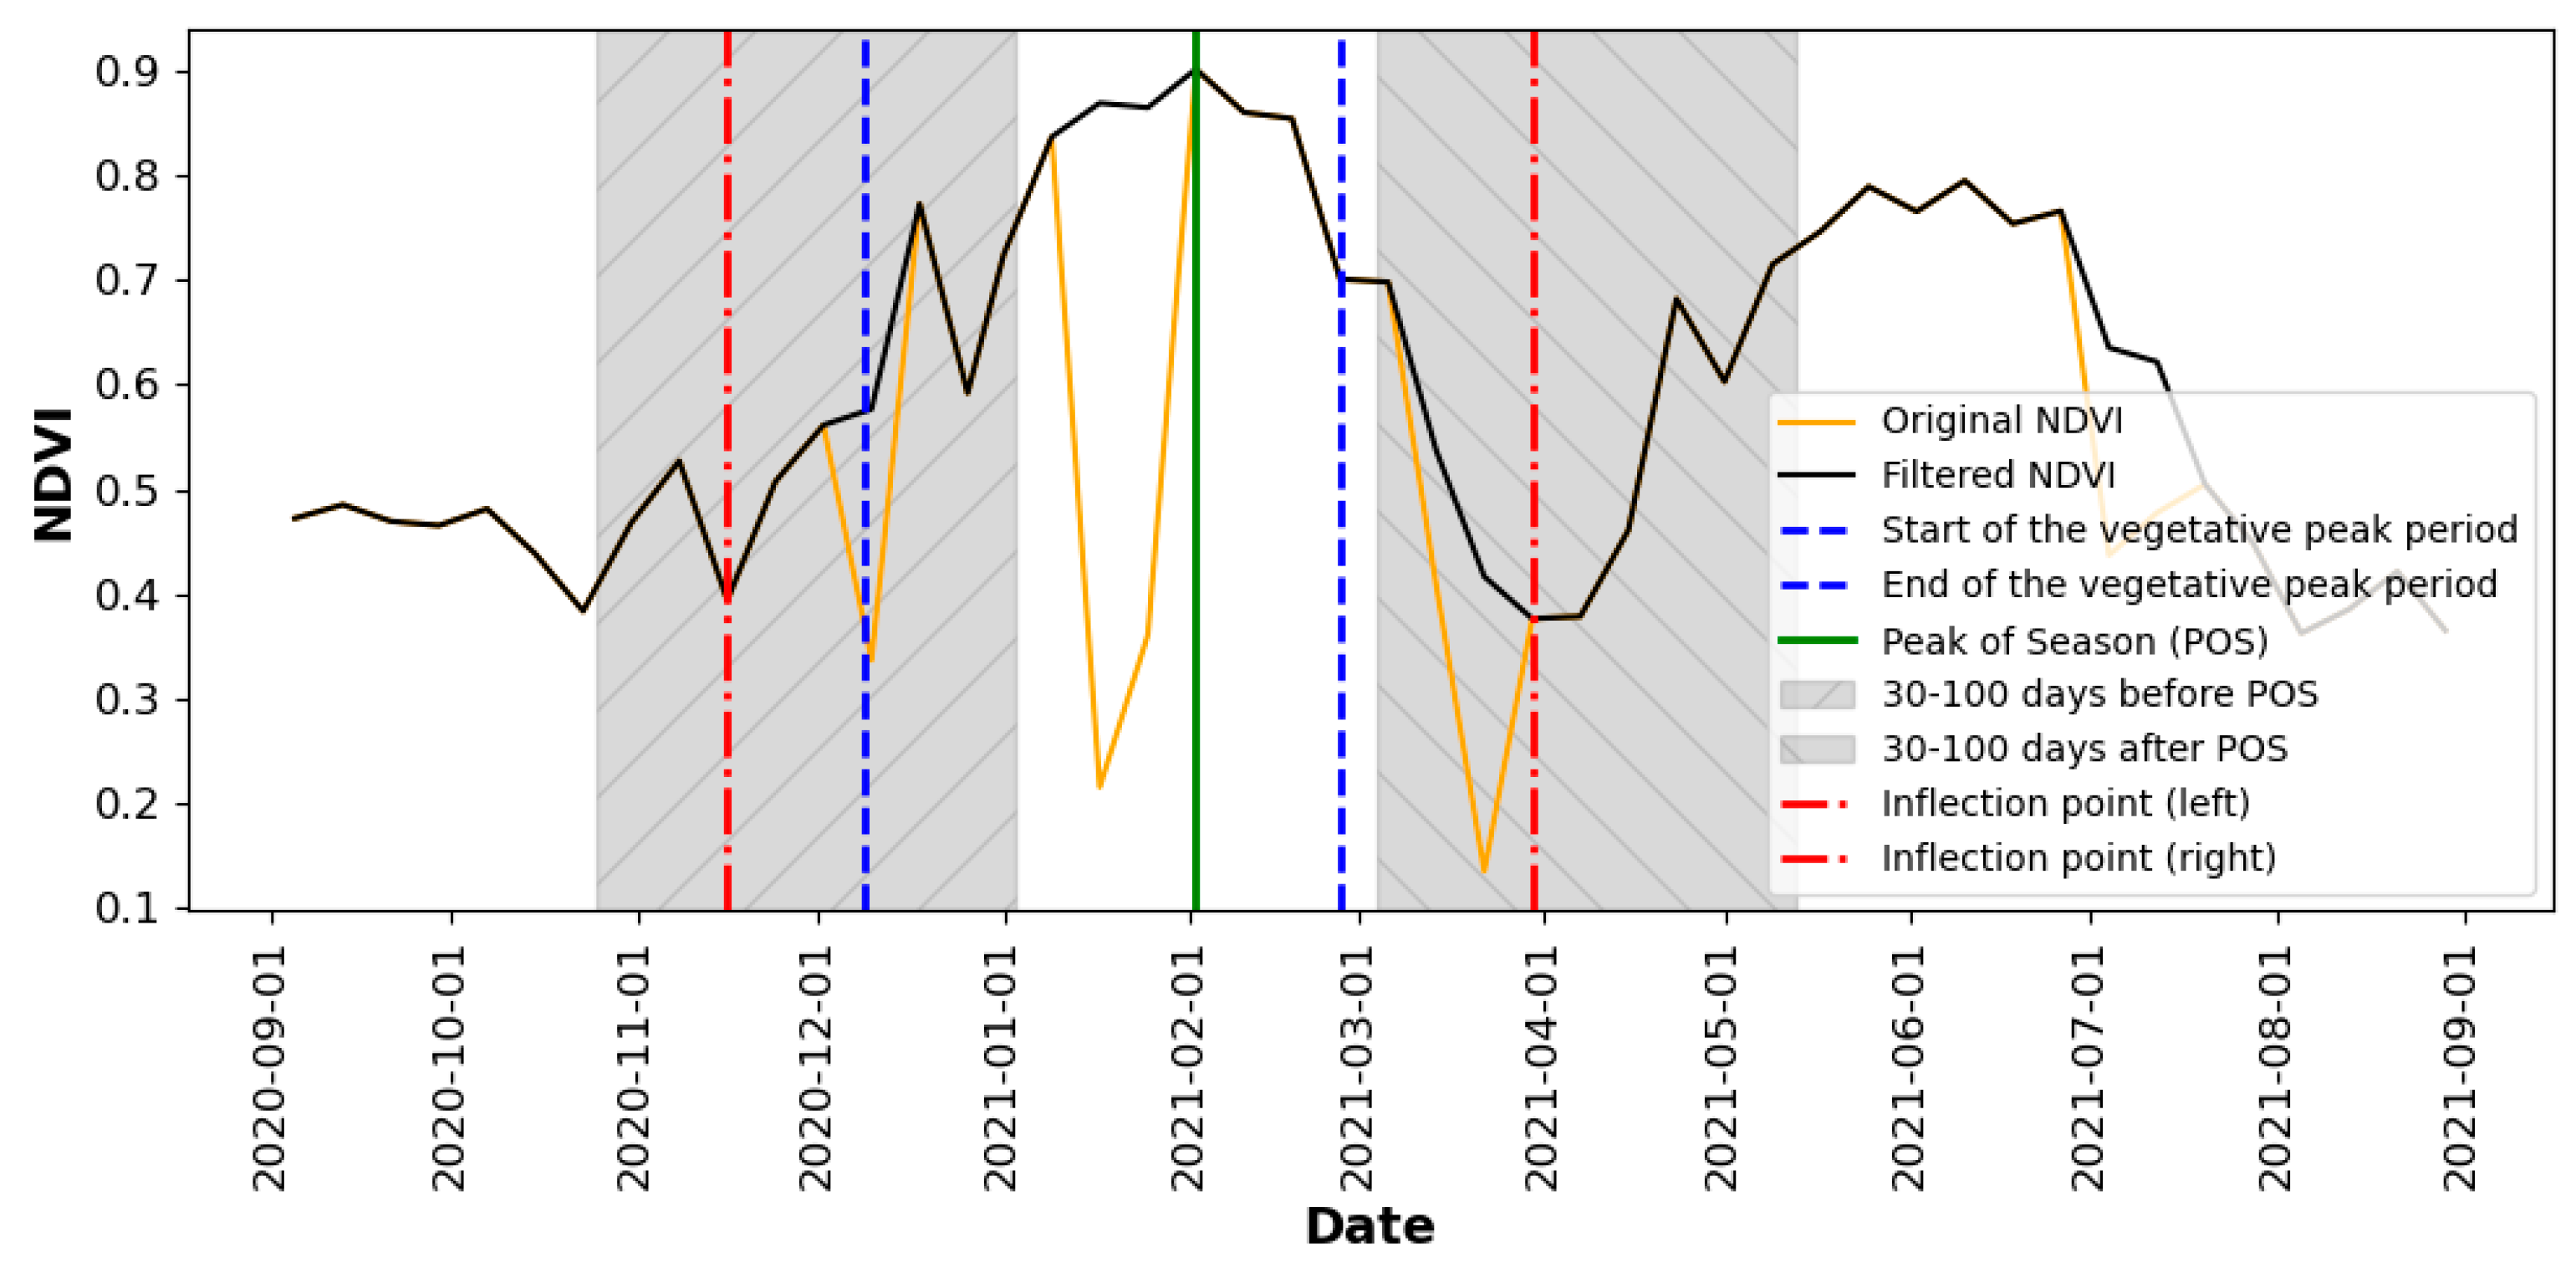
Figure 2. Original and filtered NDVI time-series sample with key soybean phenological events identification.
Remotesensing 16 02520 g002
Figure 3. An example of the phenology metrics Start of Season (SOS), Peak of Season (POS), and End of Season (EOS) (dotted lines) derived by the double-logistic method applied to a seasonal 8-day NDVI filtered and cropped curve.
Remotesensing 16 02520 g003
Figure 4. NDVI value variability for Start of Season (SOS), Peak of Season (POS), and End of Season (EOS): (a) scatter distribution and (b) violin plot of phenological event dates.
Remotesensing 16 02520 g004
Figure 5. The correlation between the observed and estimated dates for the Start of Season (SOS), Peak of Season (POS), and End of Season (EOS) accumulated (0–100%). For each phenological metric, the points represent the accumulated value for the reference date when the DERAL conducts field surveys.
Remotesensing 16 02520 g005
Figure 6. Distribution of dates for Start of Season (SOS), Peak of Season (POS), and End of Season (EOS).
Remotesensing 16 02520 g006
Figure 7. Comparative accumulation percentual values of Start of Season (SOS) (a), Peak of Season (POS) (b), and End of Season (EOS) (c): MODIS data vs. DERAL (reference) data with percentage differences for Paraná state.
Remotesensing 16 02520 g007
Table 1. Summary of average errors in estimated soybean phenology metrics: p-value, Mean Biases, S.D. of Biases, median RMSE, and median ME.
RegionArea (ha)Percentualp-ValueBias
(Mean)
S.D. of BiasRMSE
(Median)
|ME|
(Median)
Start of Season (SOS)
Apucarana127,7502%0.38−10.516.81.31.3
Campo Mourão690,00012%0.46−0.711.83.23.2
Cascavel516,0009%0.36−10.614.52.62.6
Cornélio Procópio352,5006%0.64−9.612.64.44.4
Curitiba169,1603%0.42−10.98.412.112.1
Francisco Beltrão281,1305%0.40−7.010.10.30.3
Guarapuava288,7505%0.67−8.311.71.41.4
Irati190,0003%0.745.18.92.52.5
Ivaiporã163,0003%0.39−6.610.81.01.0
Jacarezinho171,5503%0.59−3.24.61.11.1
Laranjeiras do Sul138,5002%0.94−0.93.50.60.6
Londrina324,6006%0.64−5.910.50.90.9
Maringá296,5005%0.42−13.020.02.62.5
Paranavaí66,7461%0.31−11.916.84.44.4
Pato Branco321,1306%0.31−11.314.33.13.1
Pitanga162,2503%0.64−6.27.82.92.9
Ponta Grossa558,20010%0.57−7.27.94.94.9
Toledo487,4209%0.52−9.719.00.90.9
Umuarama186,5113%0.43−5.69.81.51.5
União da Vitória90,0002%0.961.25.93.03.0
Paraná5,581,697100%0.62−6.59.71.61.6
Peak of Season (POS)
Apucarana127,7502%0.82−1.74.61.71.4
Campo Mourão690,00012%0.3813.119.32.22.2
Cascavel516,0009%0.60−6.27.53.33.2
Cornélio Procópio352,5006%0.89−0.813.51.81.8
Curitiba169,1603%0.2410.811.18.58.0
Francisco Beltrão281,1305%0.941.89.75.25.2
Guarapuava288,7505%0.90−0.76.71.21.2
Irati190,0003%0.2414.615.013.813.8
Ivaiporã163,0003%0.495.77.33.83.8
Jacarezinho171,5503%0.1018.518.514.914.2
Laranjeiras do Sul138,5002%0.792.05.34.64.6
Londrina324,6006%0.636.19.22.12.0
Maringá296,5005%0.97−0.65.00.70.7
Paranavaí66,7461%0.5310.816.90.80.7
Pato Branco321,1306%0.93−1.62.70.80.8
Pitanga162,2503%0.990.54.21.41.4
Ponta Grossa558,20010%0.81−0.64.52.22.2
Toledo487,4209%0.59−2.95.72.72.7
Umuarama186,5113%0.85−0.48.96.76.7
União da Vitória90,0002%0.754.87.34.44.4
Paraná5,581,697100%0.702.53.90.90.9
End of Season (EOS)
Apucarana127,7502%0.71−1.33.71.81.8
Campo Mourão690,00012%0.835.48.61.71.7
Cascavel516,0009%0.570.13.01.71.7
Cornélio Procópio352,5006%0.89−0.75.91.31.3
Curitiba169,1603%0.455.76.07.06.7
Francisco Beltrão281,1305%0.921.52.60.40.4
Guarapuava288,7505%0.981.95.82.02.0
Irati190,0003%0.984.39.52.82.8
Ivaiporã163,0003%0.813.25.41.61.6
Jacarezinho171,5503%0.764.28.01.21.2
Laranjeiras do Sul138,5002%0.567.79.23.13.1
Londrina324,6006%0.76−4.37.62.12.1
Maringá296,5005%0.891.03.41.11.1
Paranavaí66,7461%0.921.64.91.41.4
Pato Branco321,1306%0.831.03.11.00.9
Pitanga162,2503%0.836.18.93.43.3
Ponta Grossa558,20010%0.741.04.12.72.7
Toledo487,4209%0.670.22.91.71.7
Umuarama186,5113%0.744.07.11.51.5
União da Vitória90,0002%0.3611.413.28.47.8
Paraná5,581,697100%0.872.54.11.71.7
Disclaimer/Publisher’s Note: The statements, opinions and data contained in all publications are solely those of the individual author(s) and contributor(s) and not of MDPI and/or the editor(s). MDPI and/or the editor(s) disclaim responsibility for any injury to people or property resulting from any ideas, methods, instructions or products referred to in the content.