Multi-Decadal Trends in Aerosol Optical Depth of the Main Aerosol Species Based on MERRA-2 Reanalysis: A Case Study in the Baltic Sea Basin
Abstract
1. Introduction
2. Materials and Methods
2.1. Study Region: Economic, Population and Energy Statistics
2.2. MERRA-2
| Coverage period | 1980–present |
| Spatial resolution | 0.5° × 0.625° (∼50 km) |
| Assimilation system | 3DVar Gridpoint Statistical Interpolation [26,27] |
| Meteorology | GEOS-5 [24,25] |
| Chemistry | GOCART [29,30] |
| Anthropogenic emissions | AeroCom Phase II (HCA0 v1; [35]), EDGARv4.2 [36,37] |
| Biomass burning emissions | RETRO v2 [38], GFEDv3.1 [39,40], QFED 2.4-r6 [41] |
| Biogenic emissions | Biogenic non-methane volatile organic compounds [42] |
| Volcanic emissions | AeroCom Phase II (HCA0 v2; [35]) |
| Assimilated aerosol products | AVHRR, AERONET, MISR, MODIS |
Methodology for Emission Sources in MERRA-2
2.3. MODIS and MISR
2.4. Statistical Analysis and Calculations
3. Results
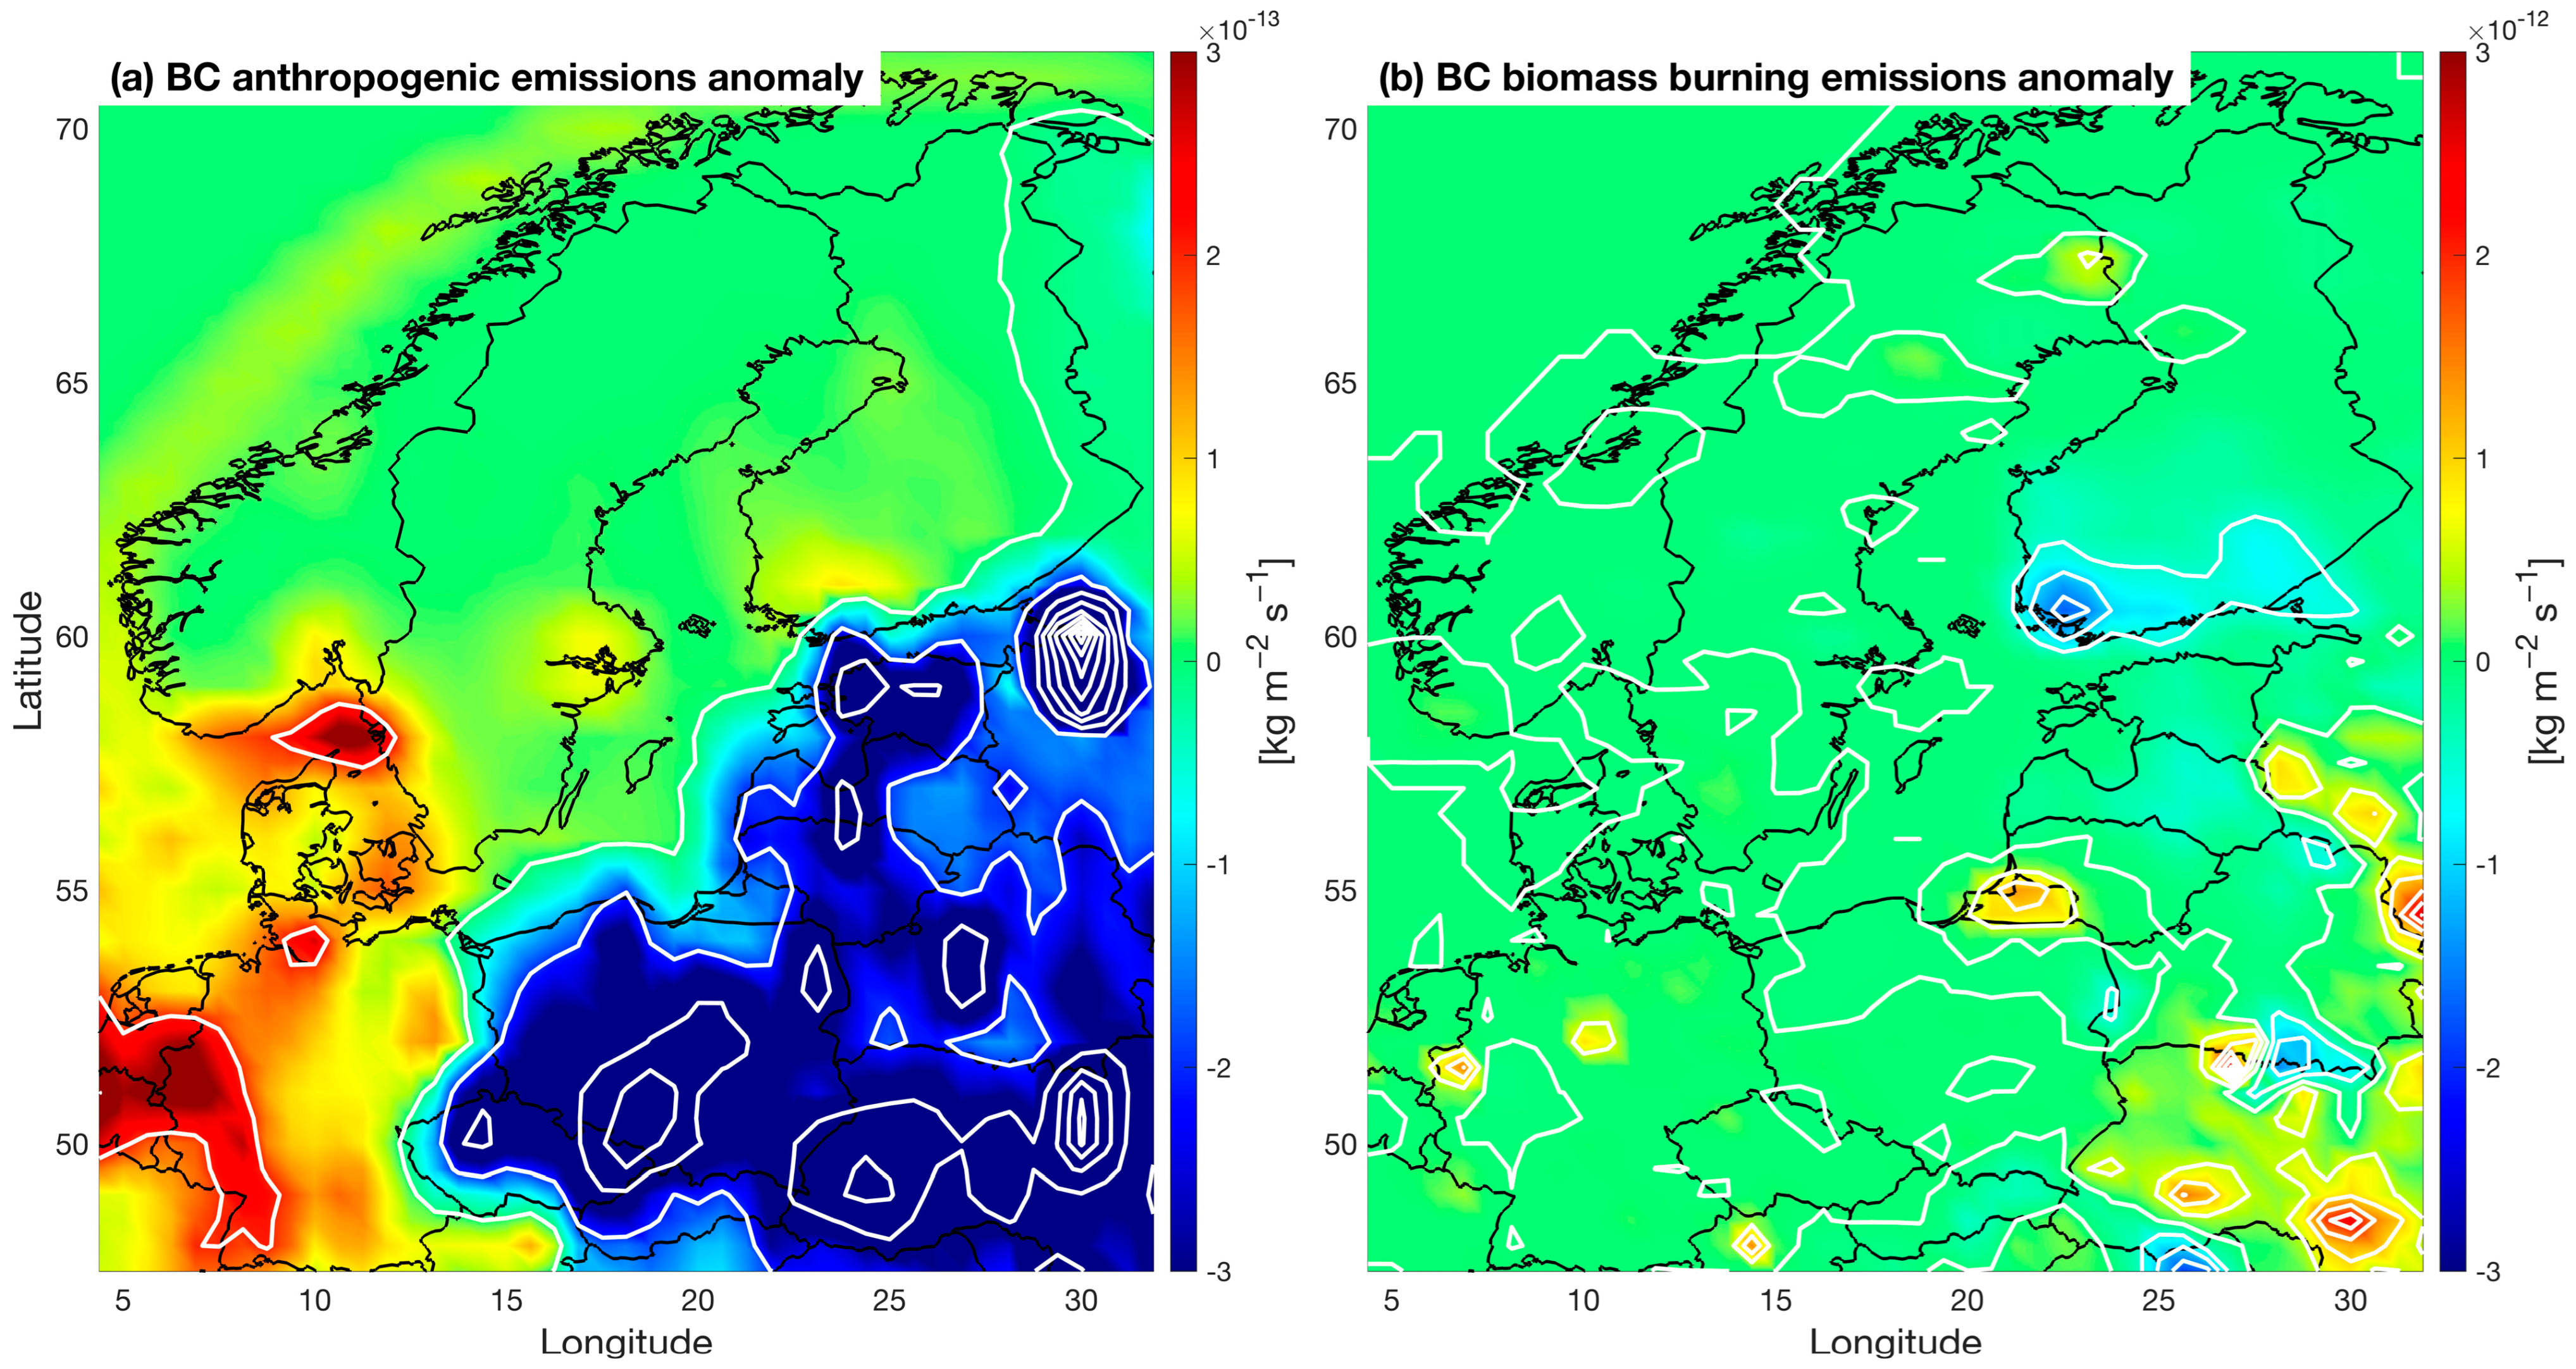
3.1. Spatial Distribution of Anomalies in Sulphur Oxides, Organic, and Black Carbon Emissions from MERRA-2 Database between 2019 and 1989–2018
3.2. Spatial Distribution of Mean Total and Main Aerosol Species AODs
3.3. Yearly Mean AOD of Total Aerosol and the Main Aerosol Species
3.4. Percentage Contributions of the Main Aerosol Species to Total AOD
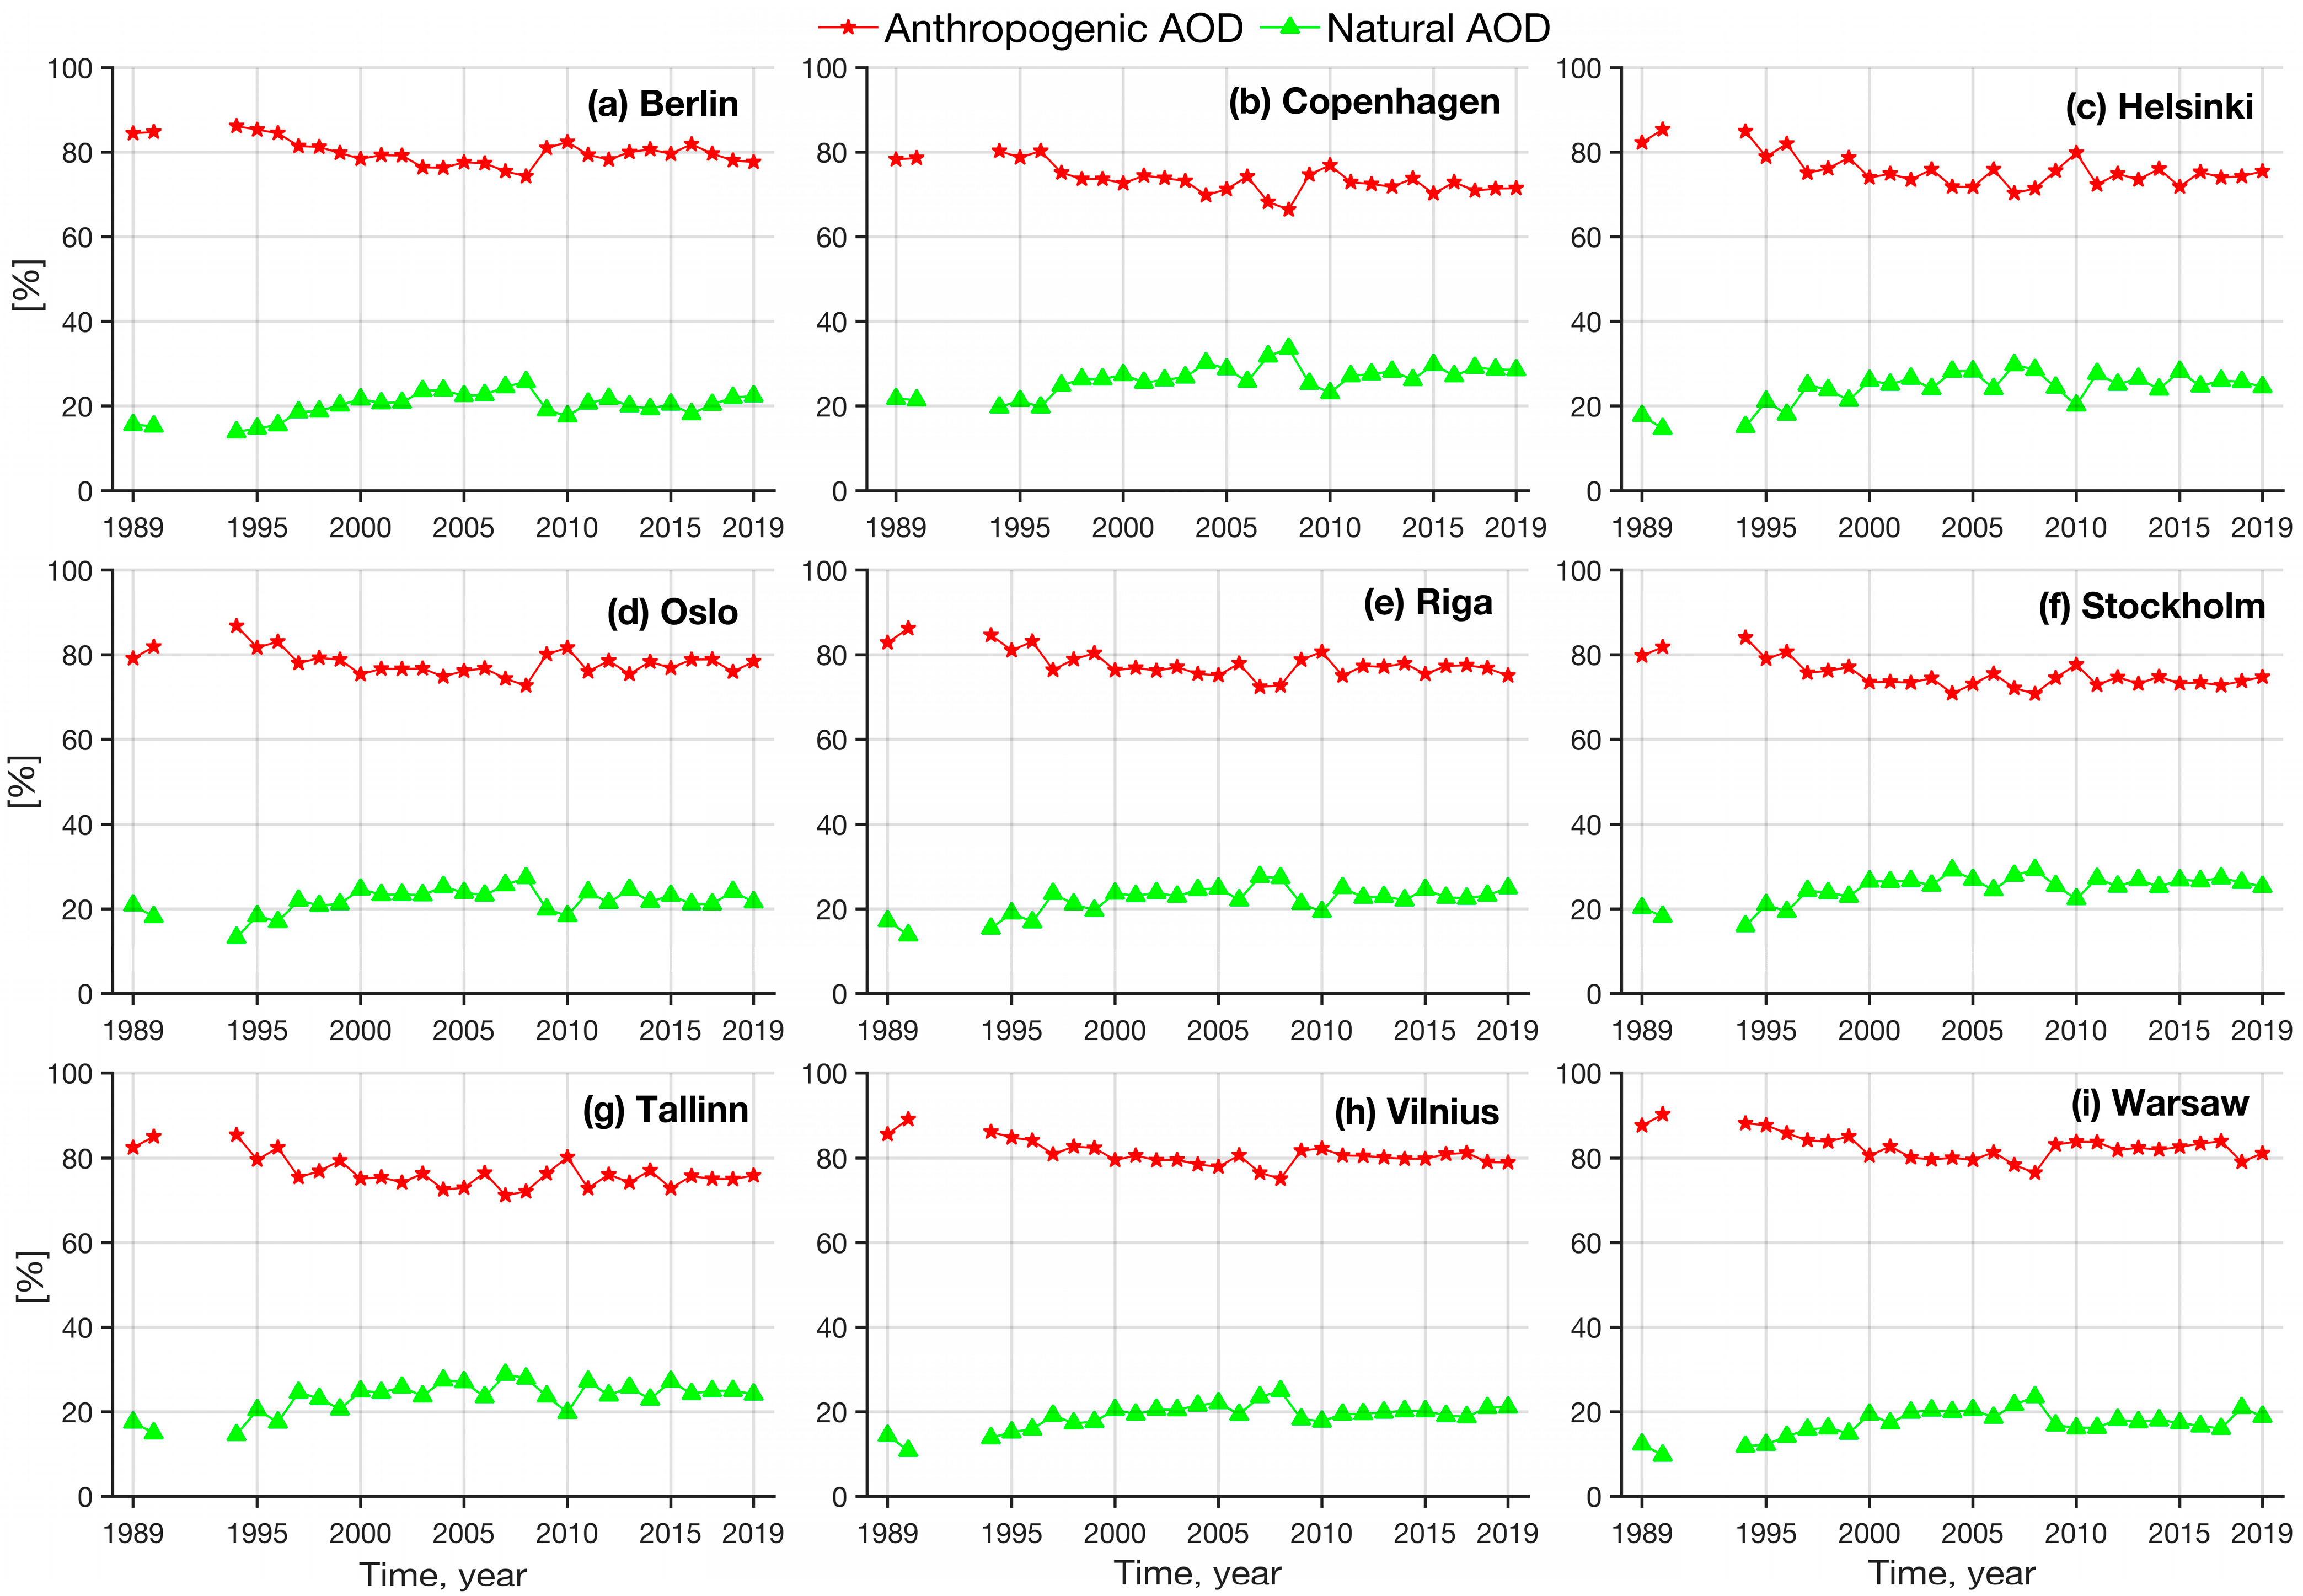
3.5. Percentage Contributions of the Main Aerosol Species of Anthropogenic and Natural Origins to Total AOD
3.6. Annual Trends
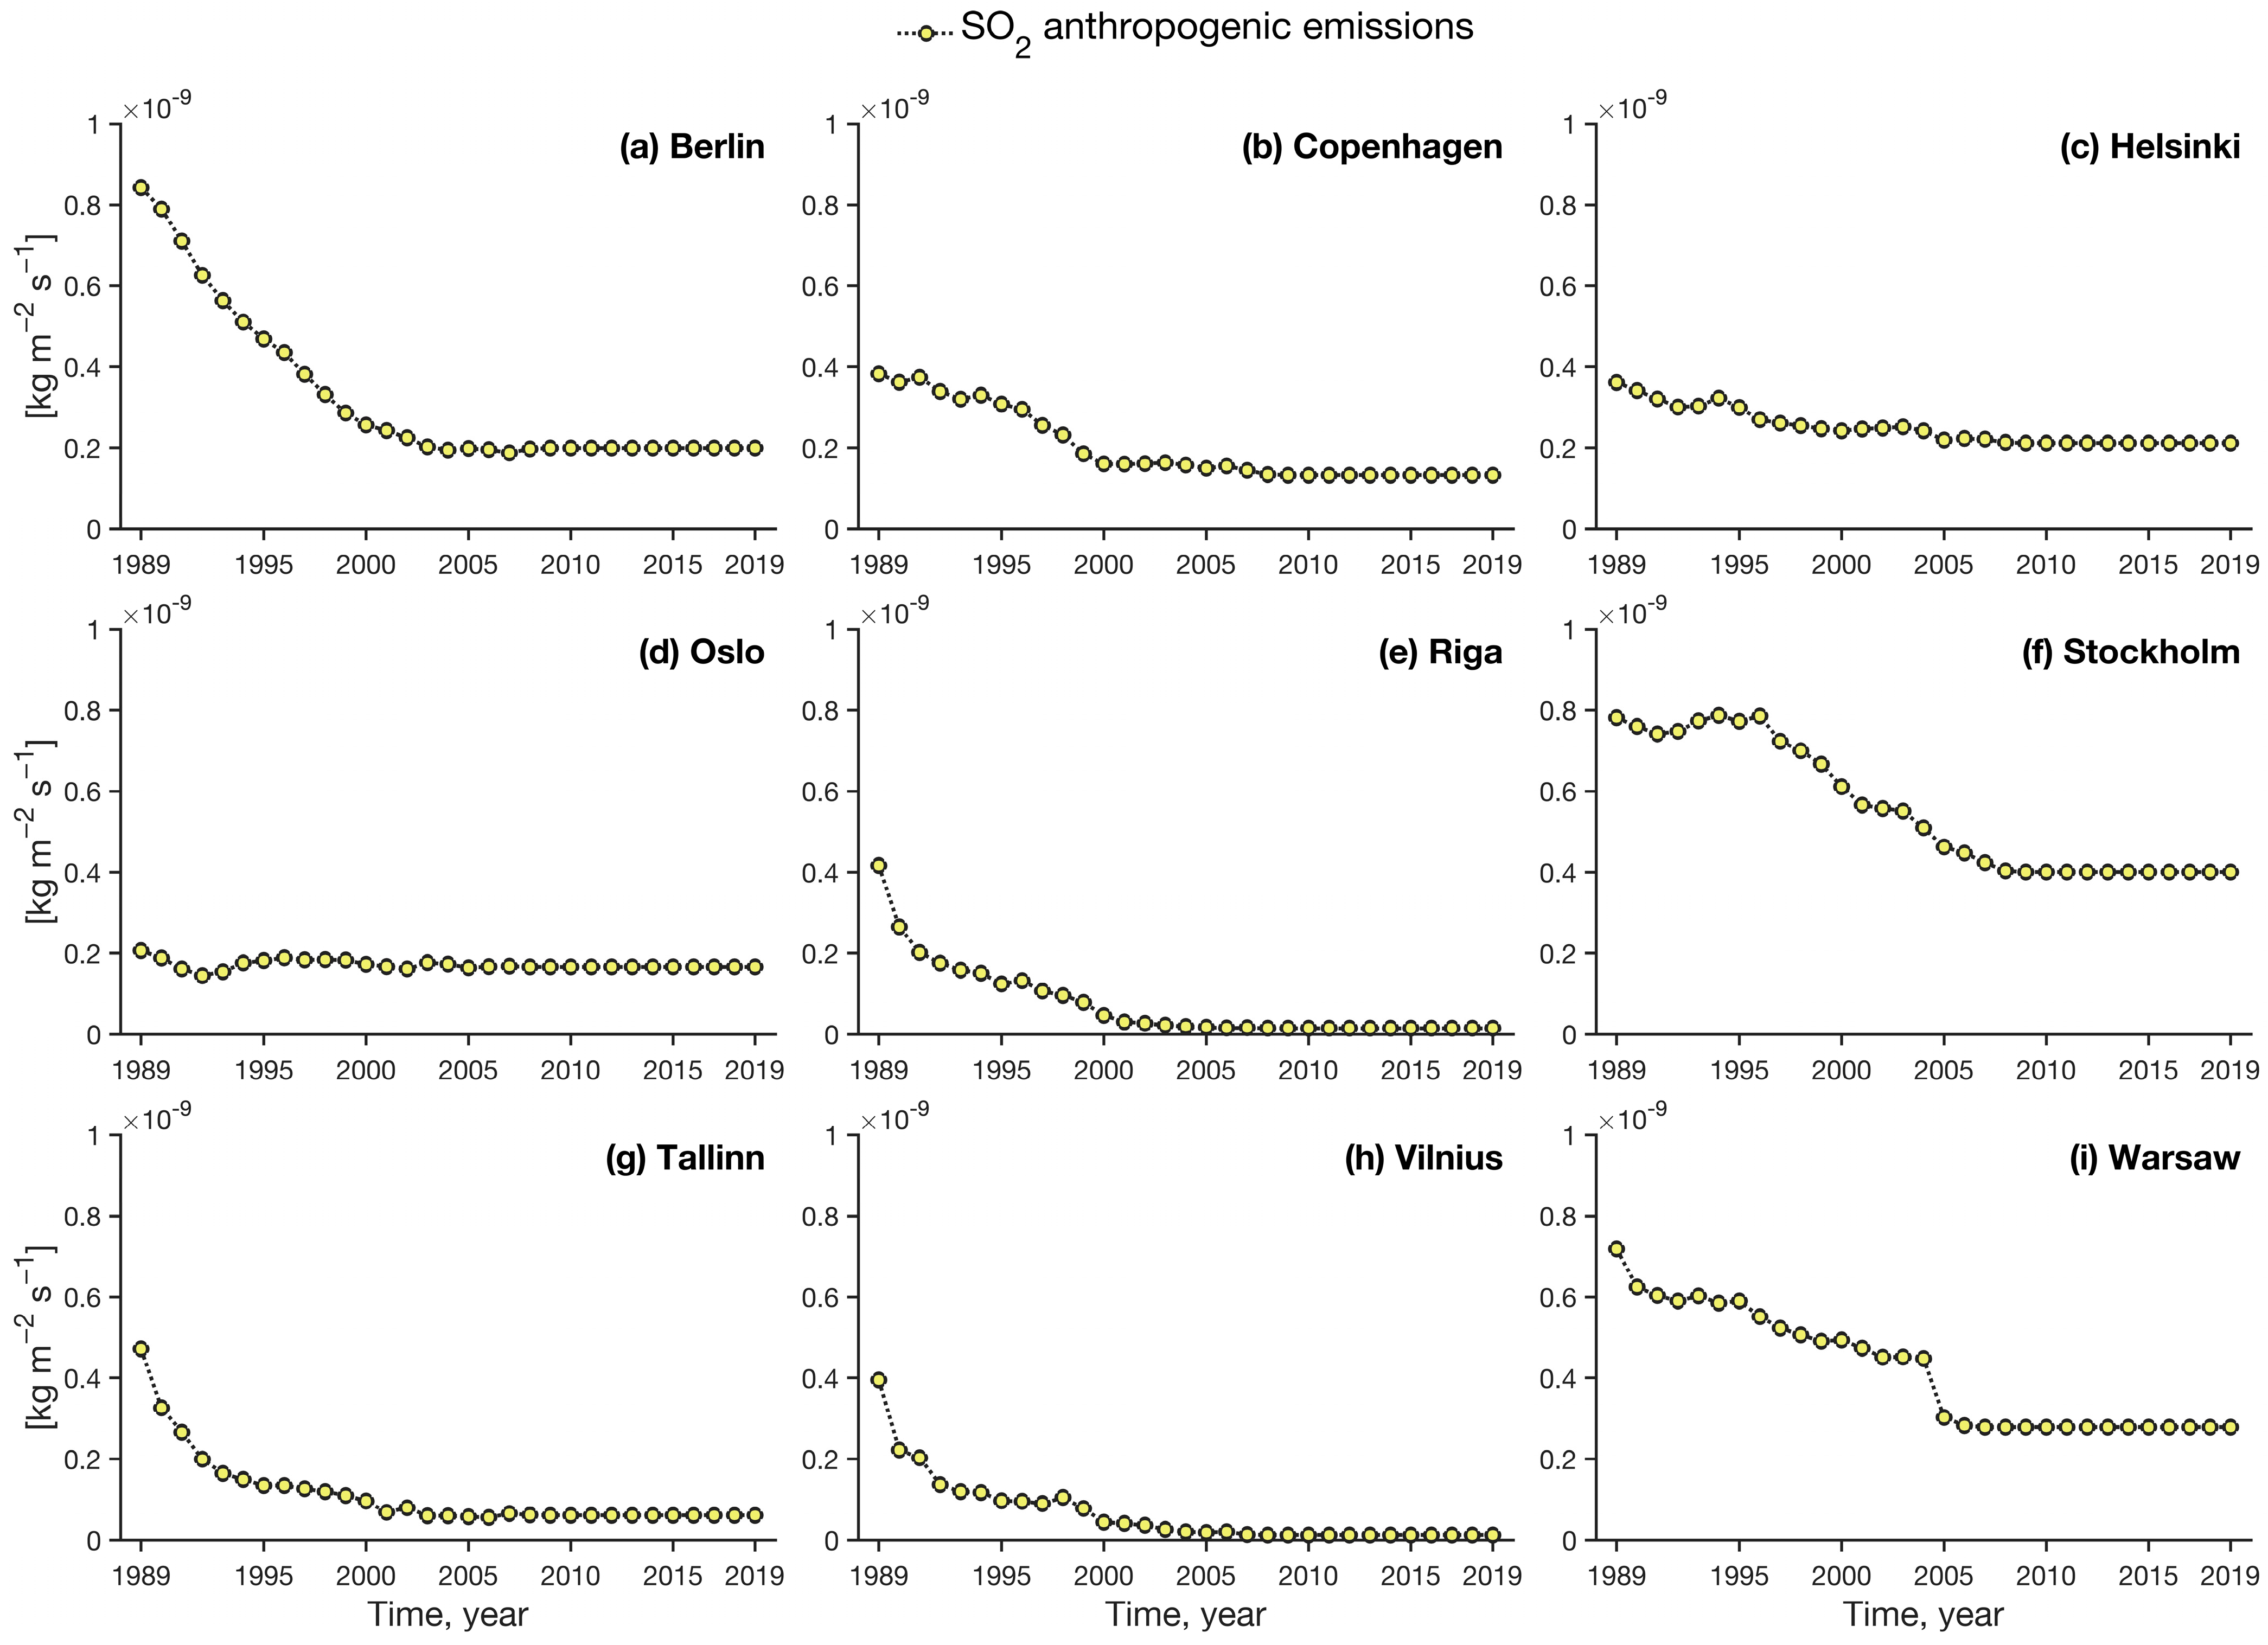
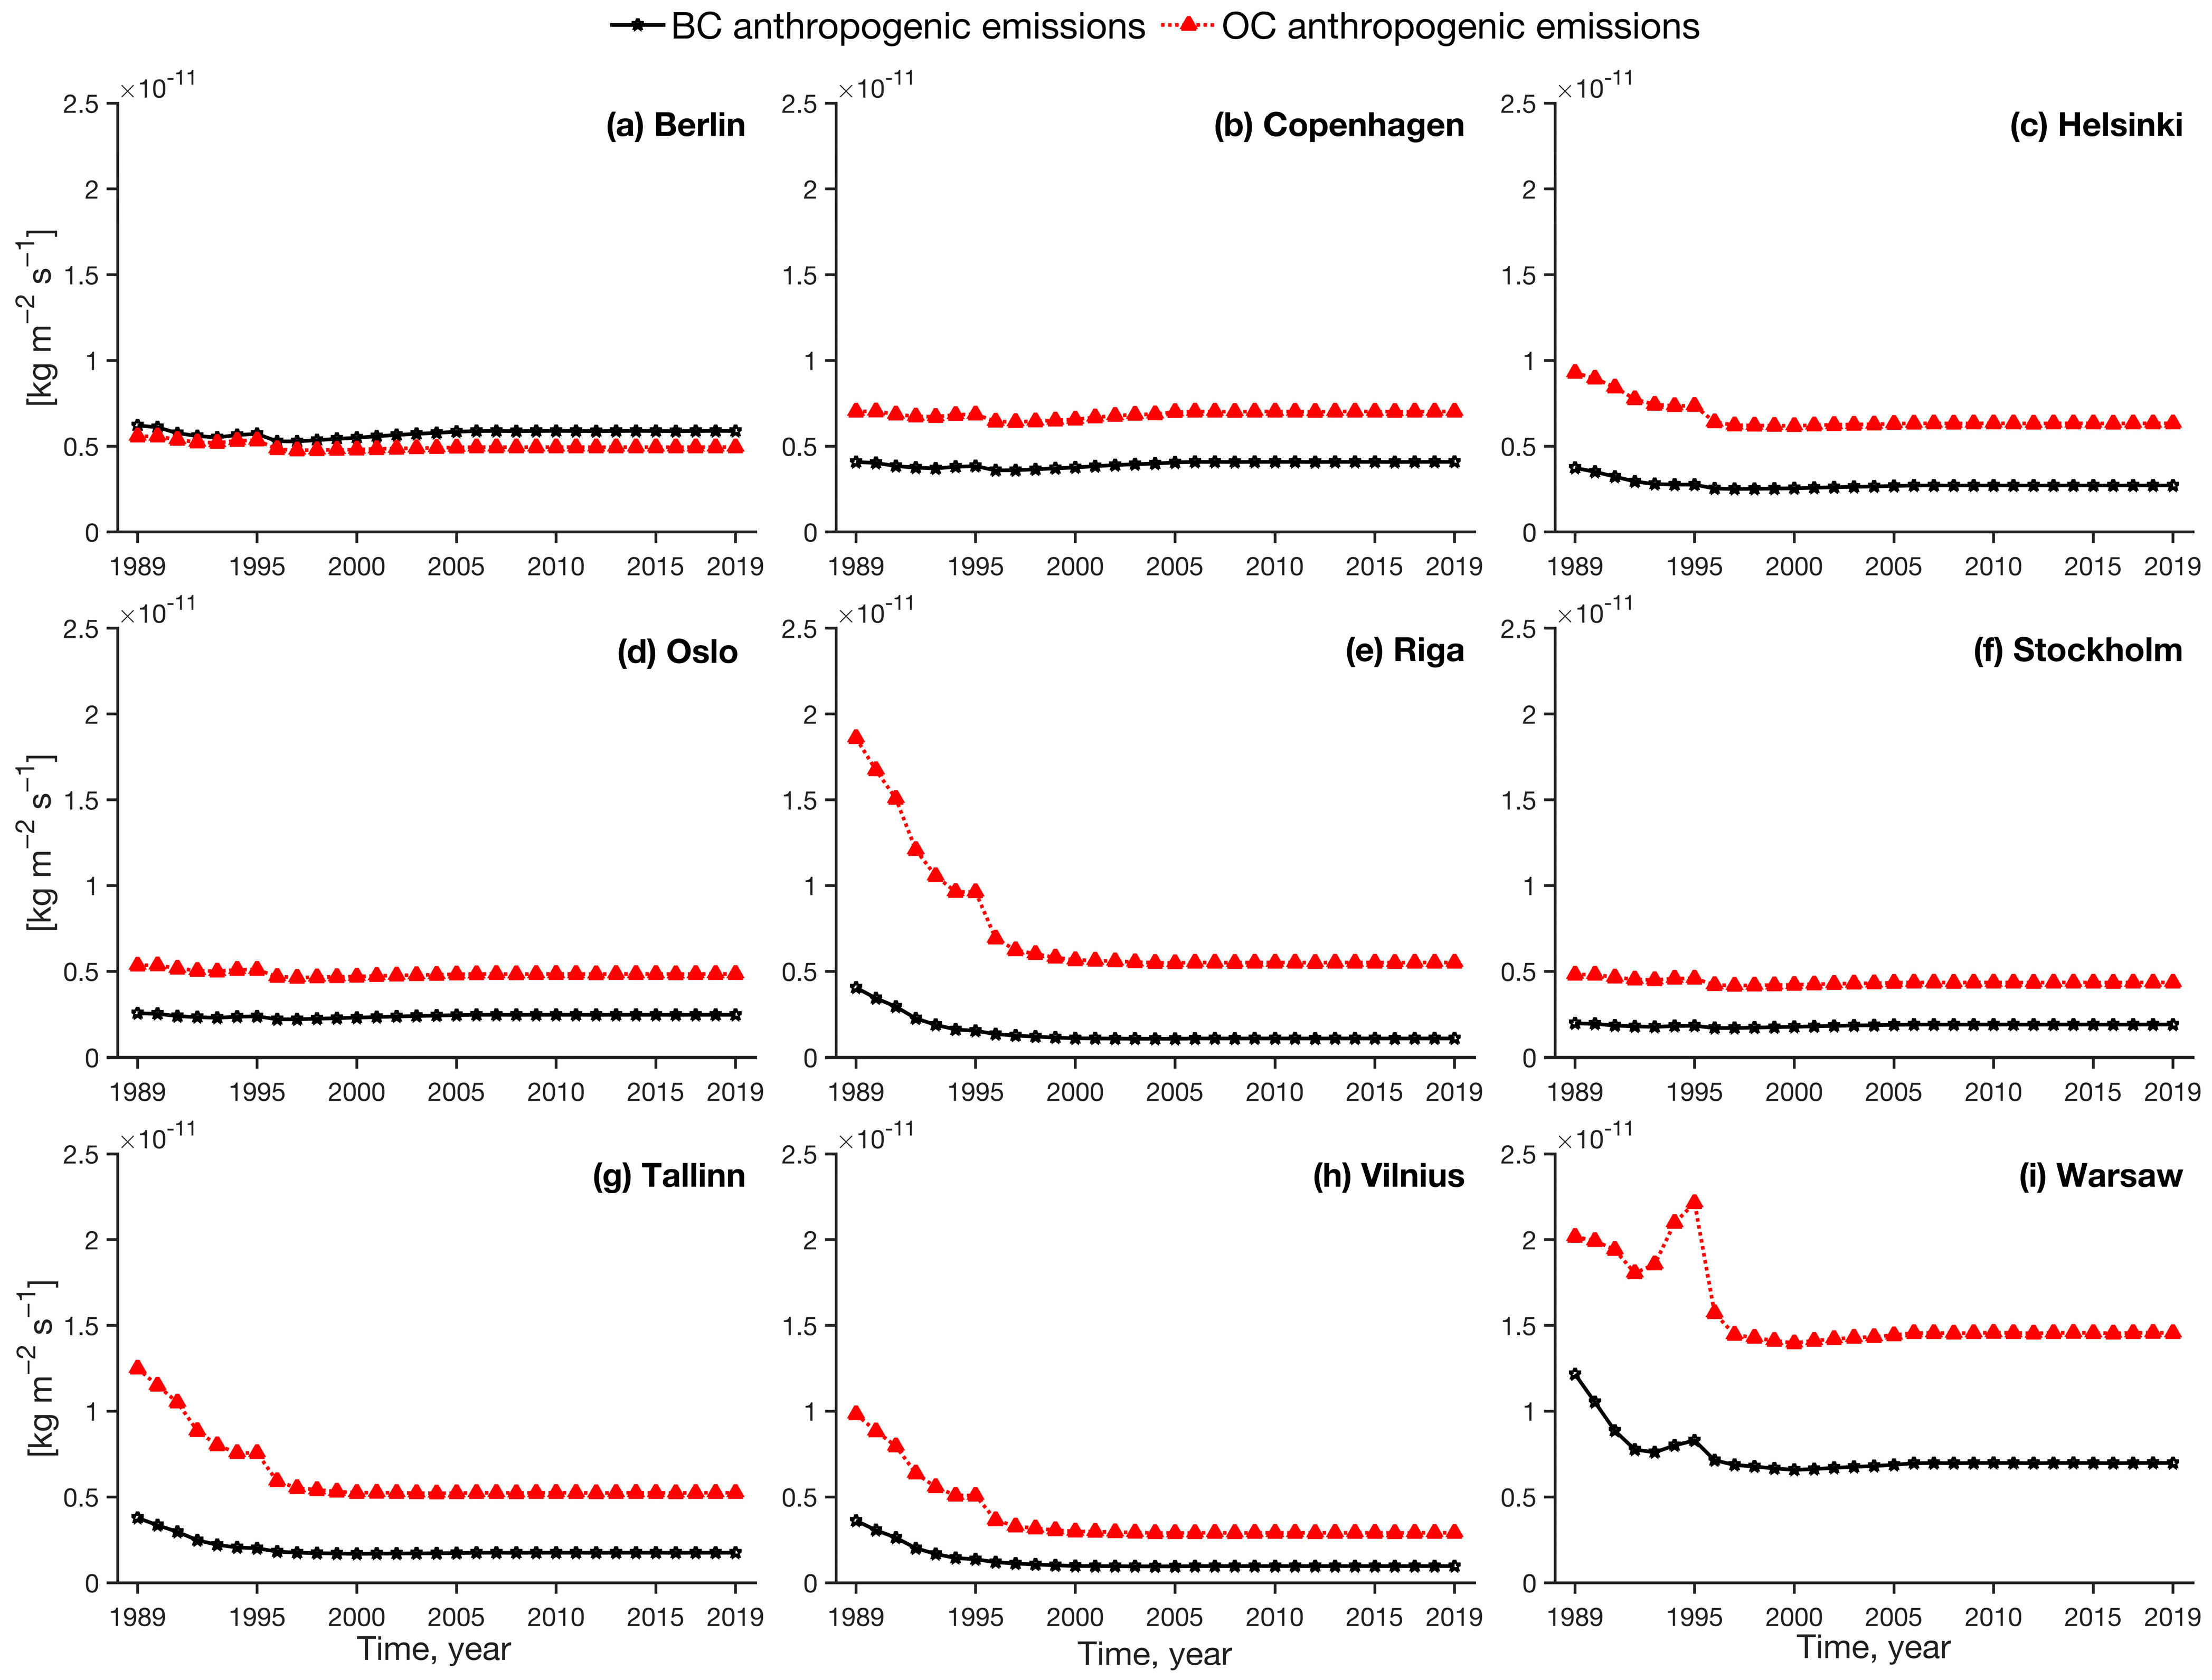
3.6.1. Annual Trends in MERRA-2 Anthropogenic Emissions of SO2, Black Carbon, and Organic Carbon
3.6.2. Annual Trends in the Main Aerosol Species and Total AODs
3.6.3. Annual Trends in the Percentage Contributions of the Main Aerosol Species to the Total AOD
3.6.4. Annual Trends in the Percentage Contributions of Anthropogenic and Natural AOD to the Total AOD
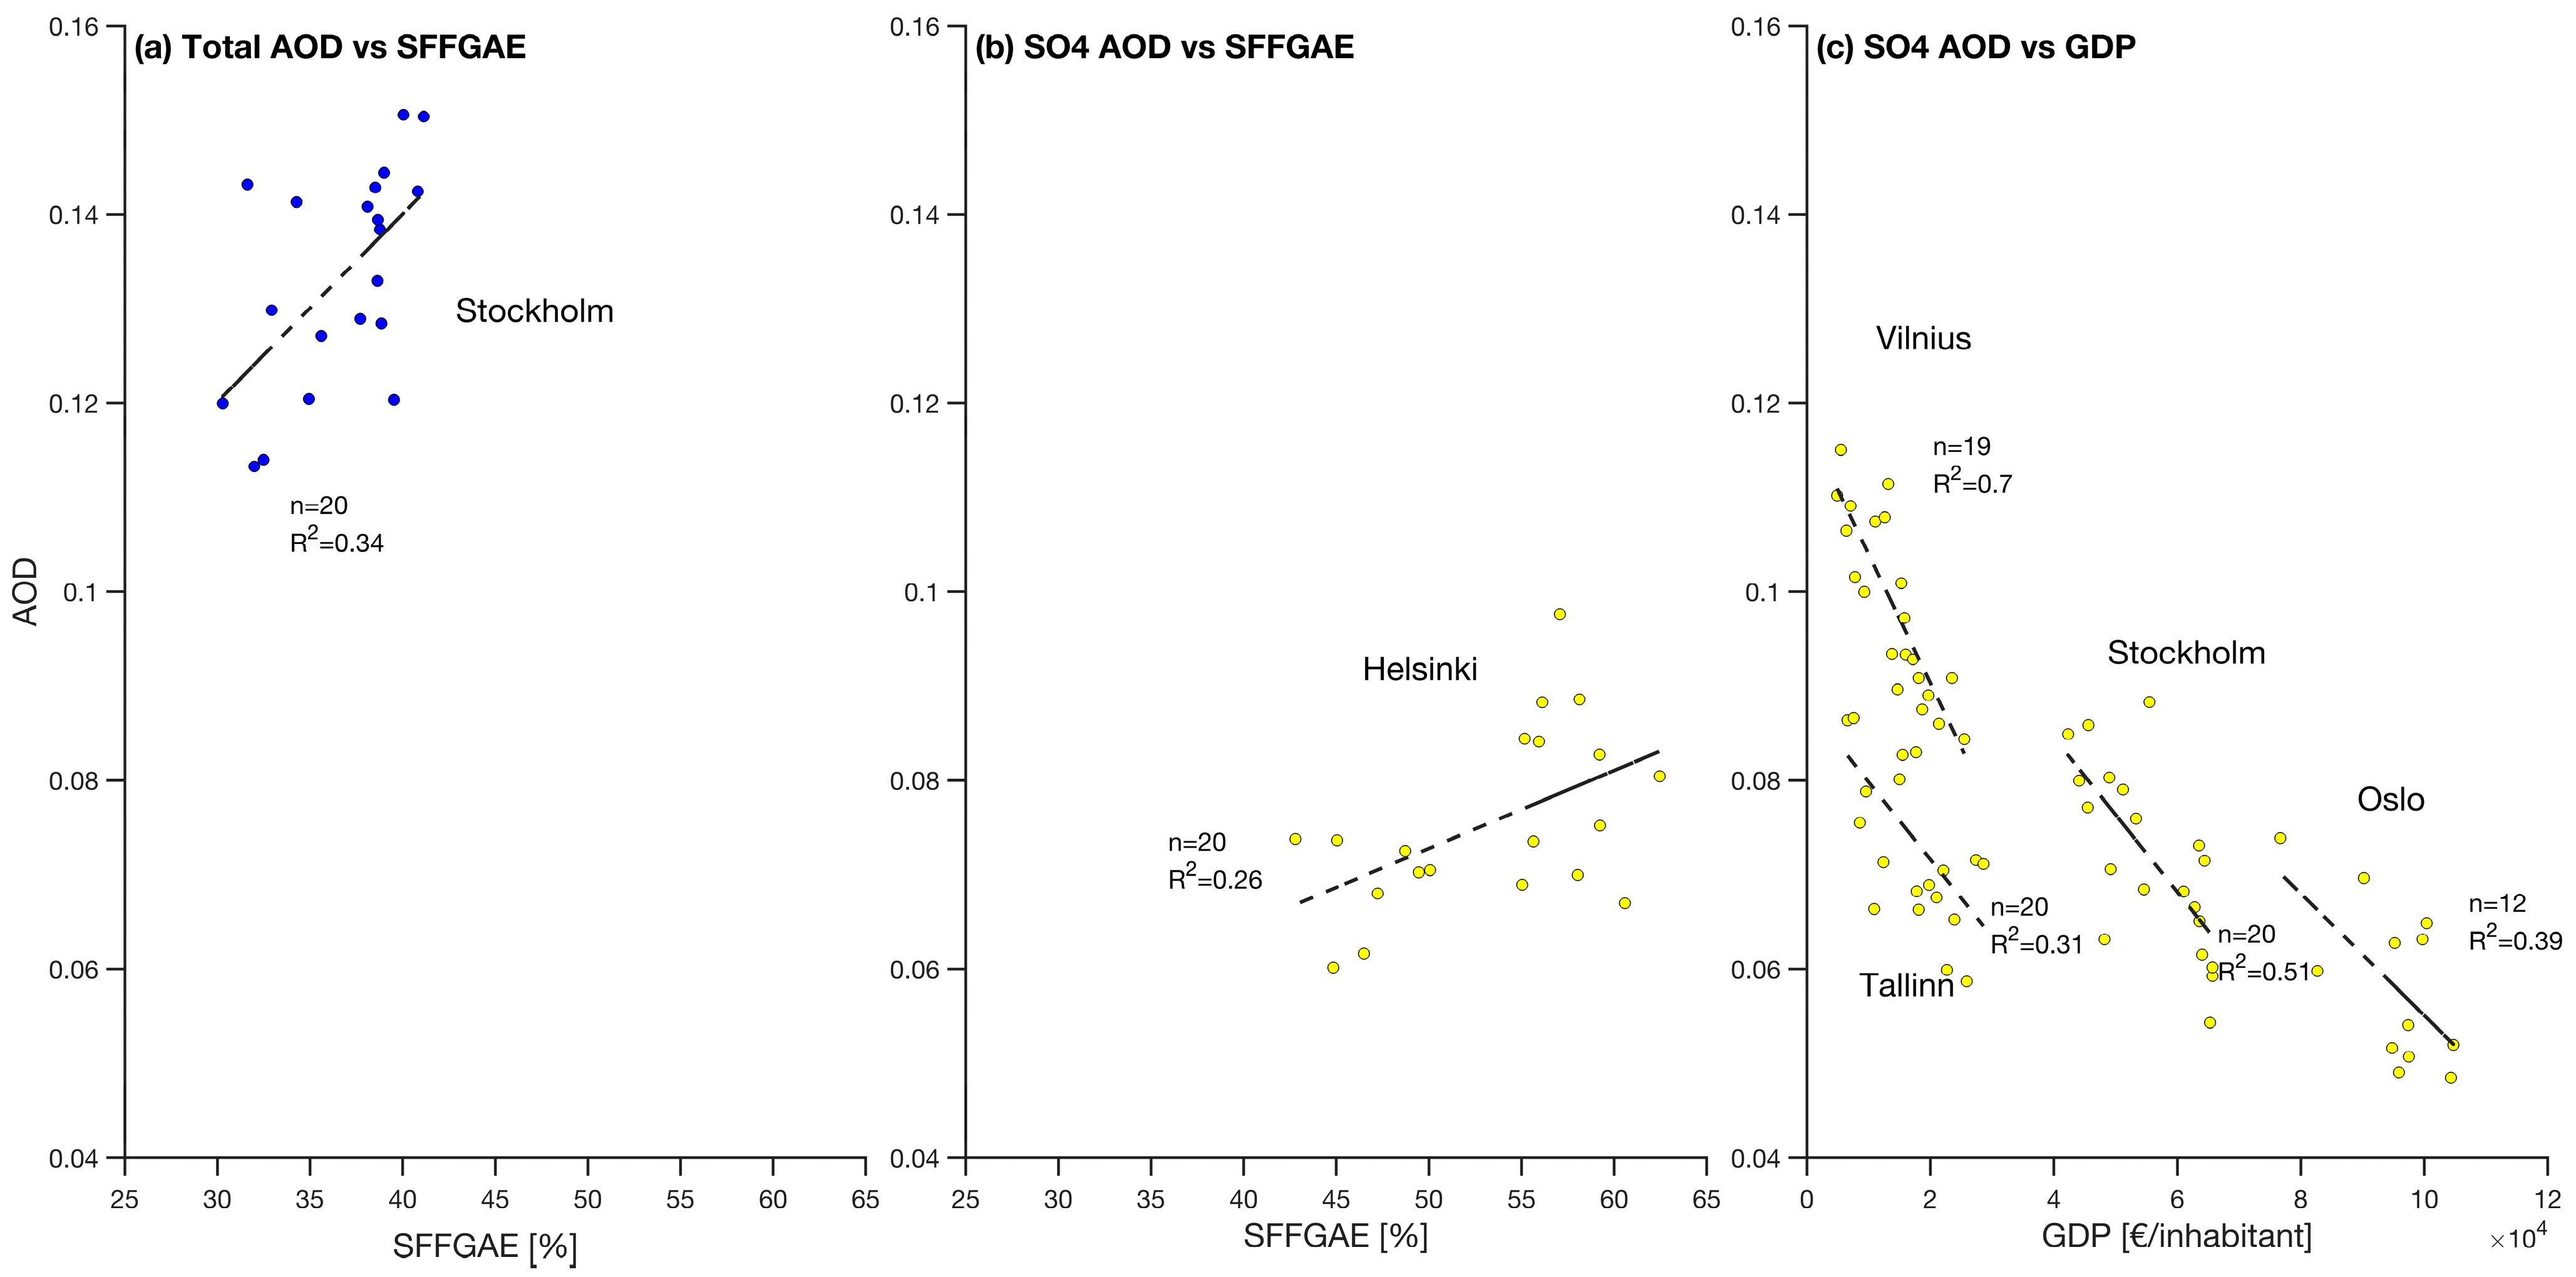
3.6.5. Annual Trends in the Total and SO4 AOD Described with Predictive Variables
4. Conclusions
Author Contributions
Funding
Data Availability Statement
Acknowledgments
Conflicts of Interest
Appendix A
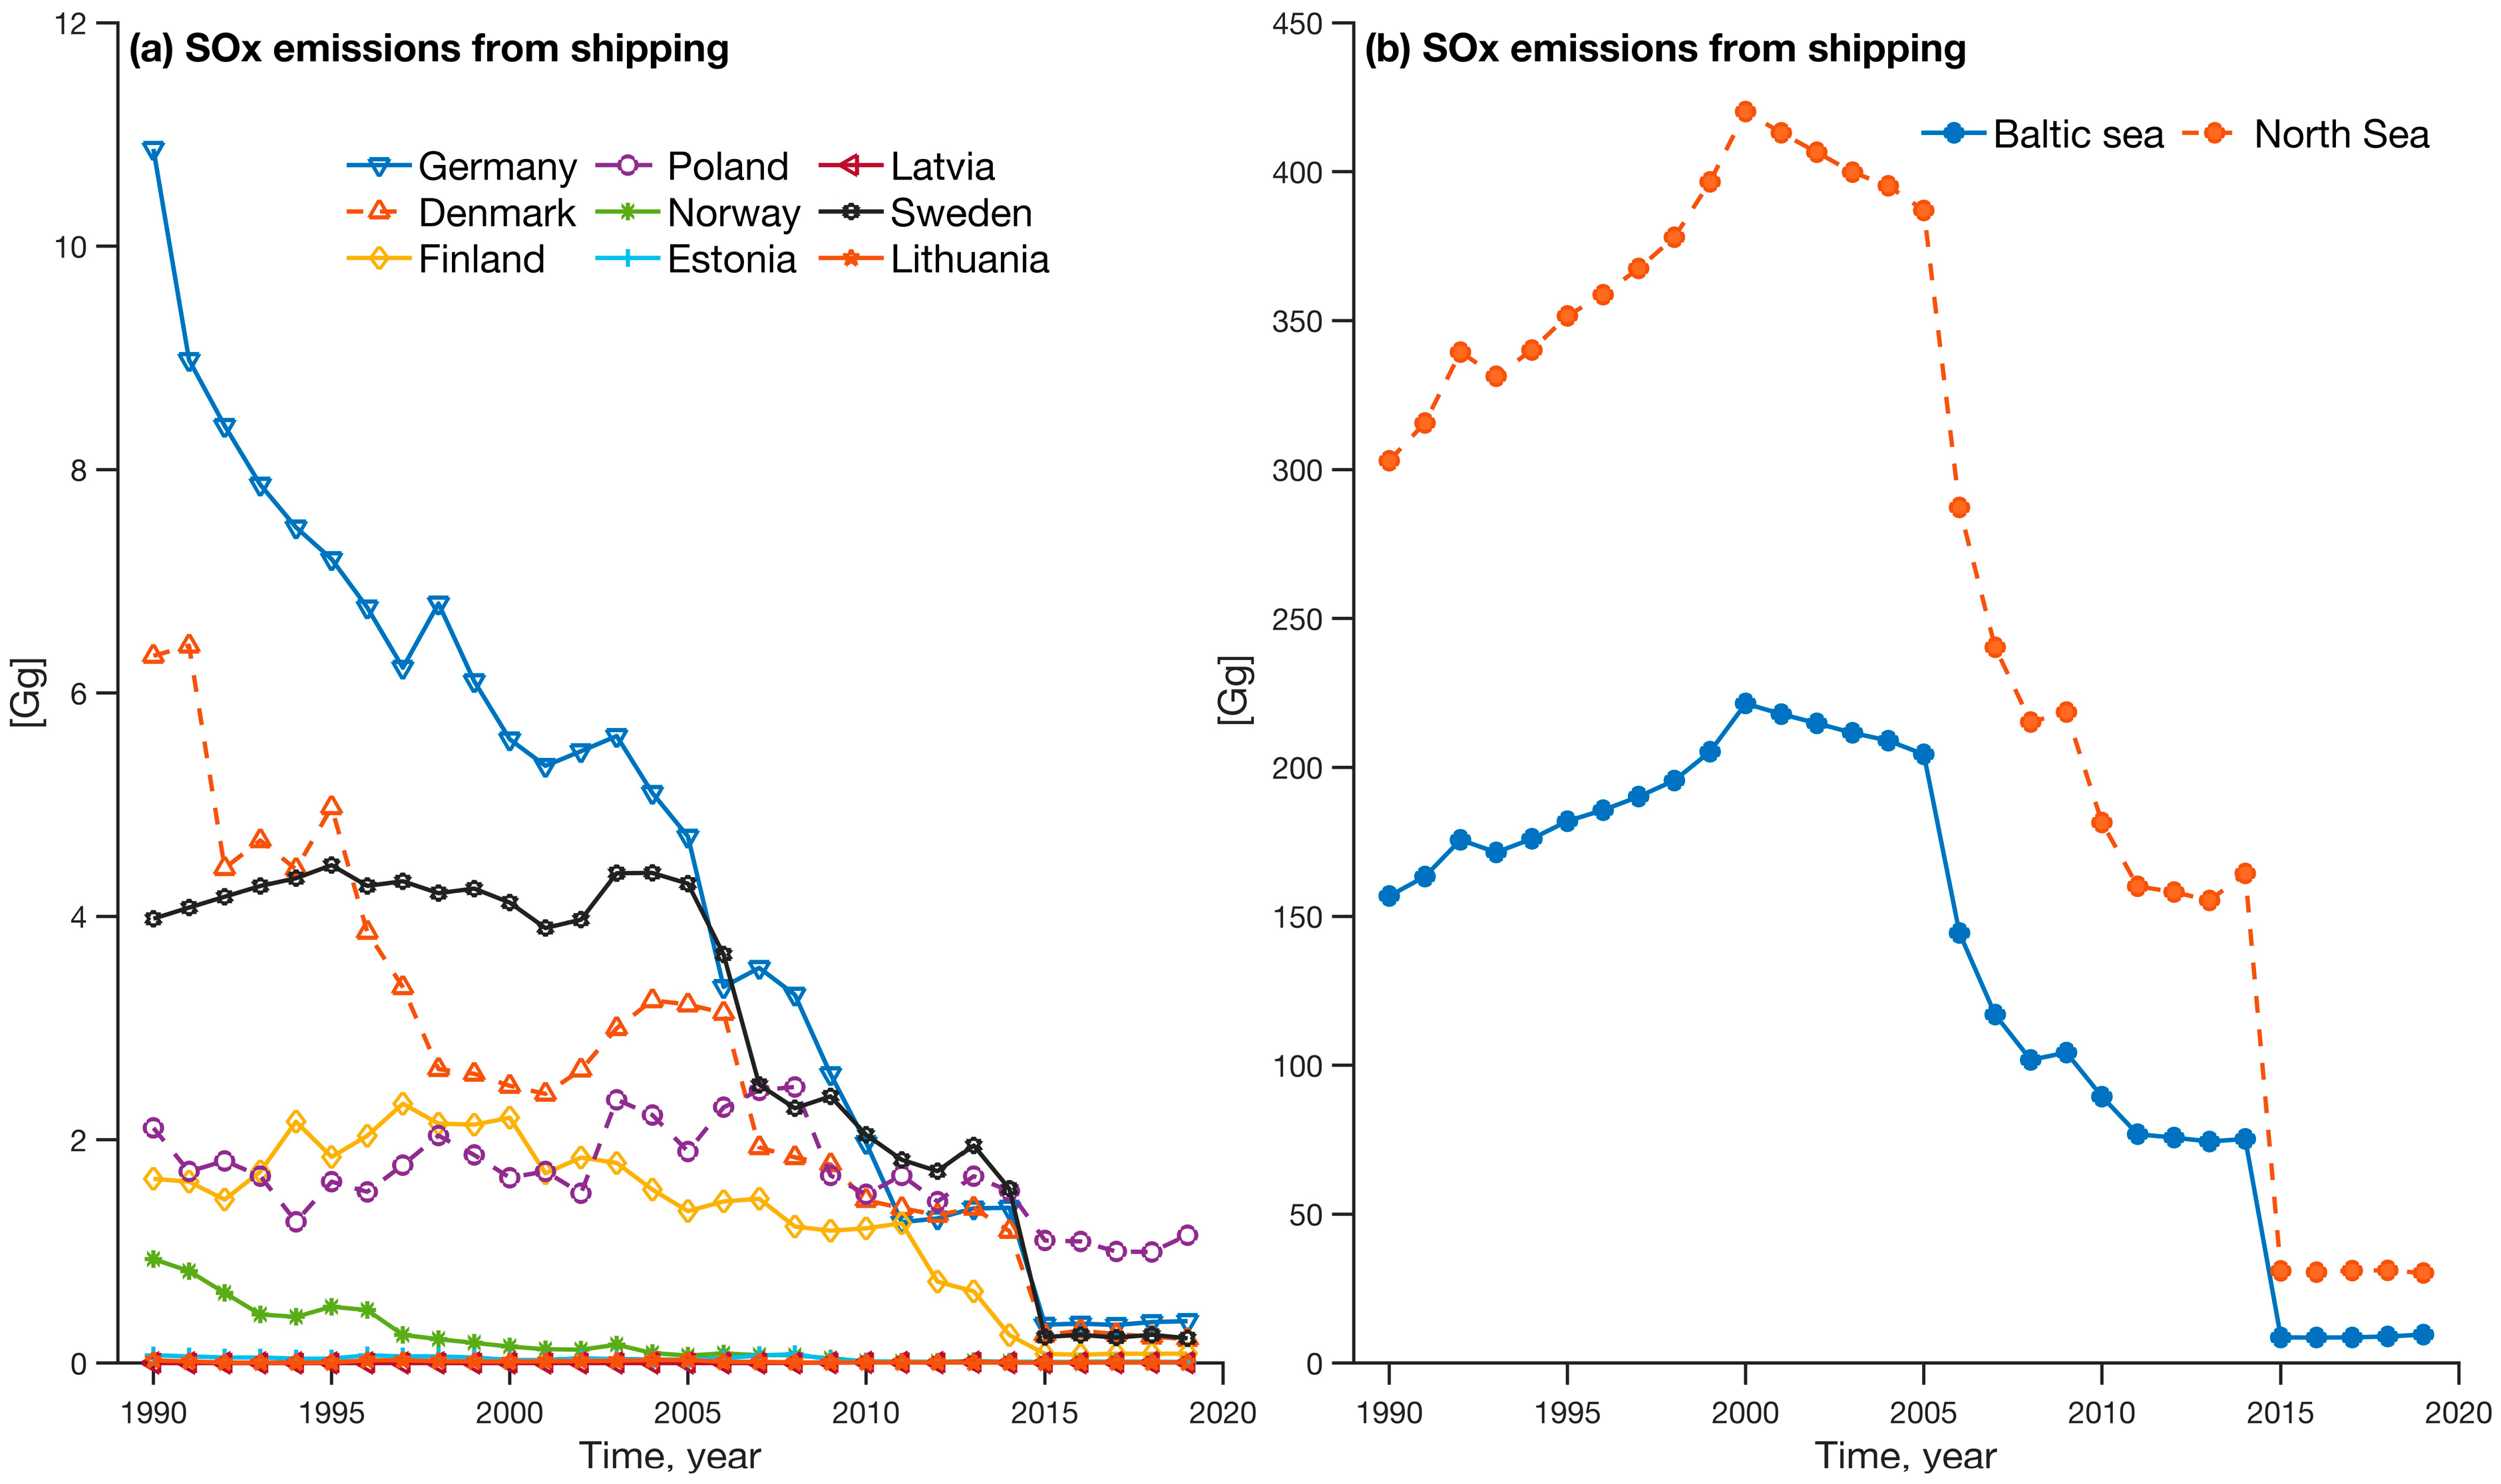

| NUTS1 | NUTS3 | |||||
|---|---|---|---|---|---|---|
| City | NUTS1 | Energy Efficiency [Million Tonnes of Oil Equivalent] | Share of Fossil Fuel in Gross Available Energy [%] | NUTS3 | Population [–] | GDP [EUR/Capita] |
| Copenhagen | Denmark | 19.08 (16.79–22.26) | 84.73 (64.14–99.5) | City of Copenhagen (province) | 716,243 (648,889–784,618) | 60,605 (46,300–74,300) |
| Berlin | Germany | 313.52 (285.24–332.75) | 83.649 (80.02–87.72) | Berlin (district) | 3,432,013 (3,278,346–3,644,826) | 31,810 (25,900–43,100) |
| Helsinki | Finland | 32.07 (25.58–36.67) | 55.93 (42.79–63.83) | Helsinki-Uusimaa (region) | 1,439,831 (1,219,864–1,671,024) | 46,720 (36,300–56,800) |
| Oslo | Norway | 24.99 (19.02–31.0) | 56.66 (51.98–62.04) | Oslo (county) | 609,141 (529,846–681,067) | 94,958 (76,700–104,700) |
| Riga | Latvia | 4.71 (3.79–7.87) | 67.43 (59.83–83.94) | Riga (statistical region) | 679,524 (632,614–753,006) | 15,760 (6100–26,000) |
| Stockholm | Sweden | 47.15 (43.06–50.47) | 37.68 (30.29–41.14) | Stockholm County (county) | 2,029,720 (1,803,377–2,344,124) | 55,725 (42,300–65,700) |
| Tallinn | Estonia | 5.64 (4.33–10.49) | 91.0 (73.24–103.79) | Northern Estonia (group of counties) | 557,428 (532,800–599,478) | 17,350 (6600–28,600) |
| Vilnius | Lithuania | 8.0 (5.75–16.15) | 63.94 (52.48–77.94) | Vilnius County (county) | 822,094 (805,173–850,668) | 14,090 (4900–25,500) |
| Warsaw | Poland | 93.37 (84.85–104.06) | 94.5 (87.18–98.89) | City of Warsaw (subregion) | 1,686,517 (1,618,468–1,775,986) | 25,795 (13,900–41,000) |
| City | SO2 anthropogenic emissions [kg m−2 s−1] | Rate of variation [kg m−2 s−1 year−1] × 10−2 | |||
| a | b | R2 | p-value | ||
| Berlin | 3.59 × 10⁻⁸ | −1.78 × 10⁻¹¹ | 0.68 | 0.0000 | −2.5 |
| Copenhagen | 1.75 × 10⁻⁸ | −8.62 × 10⁻¹² | 0.78 | 0.0000 | −2.5 |
| Helsinki | 9.1 × 10⁻⁹ | −4.41 × 10⁻¹² | 0.81 | 0.0000 | −1.3 |
| Oslo | 1.16 × 10⁻⁹ | −4.94 × 10⁻¹³ | 0.15 | 0.0314 | −0.6 |
| Riga | 1.65 × 10⁻⁸ | −8.22 × 10⁻¹² | 0.64 | 0.0000 | −3.1 |
| Stockholm | 3.34 × 10⁻⁸ | −1.64 × 10⁻¹¹ | 0.88 | 0.0000 | −1.6 |
| Tallinn | 1.53 × 10⁻⁸ | −7.56 × 10⁻¹² | 0.54 | 0.0000 | −2.8 |
| Vilnius | 1.46 × 10⁻⁸ | −7.25 × 10⁻¹² | 0.61 | 0.0000 | −3.1 |
| Warsaw | 3.04 × 10⁻⁸ | −1.50 × 10⁻¹¹ | 0.89 | 0.0000 | −2.0 |
| City | BC anthropogenic emissions [kg m−2 s−1] | Rate of variation [kg m−2 s−1 year−1] × 10−2 | |||
| a | b | R2 | p-value | ||
| Berlin | −1.27 × 10⁻¹¹ | 9.22 × 10⁻¹⁵ | 0.14 | 0.0378 | −0.2 |
| Copenhagen | −2.16 × 10⁻¹¹ | 1.27 × 10⁻¹⁴ | 0.46 | 0.0000 | 0.0 |
| Helsinki | 2.88 × 10⁻¹¹ | −1.30 × 10⁻¹⁴ | 0.19 | 0.0131 | −0.9 |
| Oslo | −7.30 × 10⁻¹² | 4.84 × 10⁻¹⁵ | 0.23 | 0.0071 | −0.1 |
| Riga | 1.13 × 10⁻¹⁰ | −5.55 × 10⁻¹⁴ | 0.46 | 0.0000 | −2.4 |
| Stockholm | −5.57 × 10⁻¹² | 3.70 × 10⁻¹⁵ | 0.22 | 0.0074 | −0.1 |
| Tallinn | 7.29 × 10⁻¹¹ | −3.54 × 10⁻¹⁴ | 0.4 | 0.0001 | −1.7 |
| Vilnius | 1.01 × 10⁻¹⁰ | −4.96 × 10⁻¹⁴ | 0.46 | 0.0000 | −2.4 |
| Warsaw | 1.57 × 10⁻¹⁰ | −7.45 × 10⁻¹⁴ | 0.32 | 0.0000 | −1.4 |
| City | OC anthropogenic emissions [kg m−2 s−1] | Rate of variation [kg m−2 s−1 year−1] × 10−2 | |||
| a | b | R2 | p-value | ||
| Berlin | 3.11 × 10⁻¹¹ | −1.30 × 10⁻¹⁴ | 0.29 | 0.0017 | −0.4 |
| Copenhagen | −1.77 × 10⁻¹¹ | 1.22 × 10⁻¹⁴ | 0.29 | 0.0017 | 0.0 |
| Helsinki | 1.31 × 10⁻¹⁰ | −6.21 × 10⁻¹⁴ | 0.45 | 0.0000 | −1.0 |
| Oslo | 2.25 × 10⁻¹¹ | −8.77 × 10⁻¹⁵ | 0.2 | 0.0118 | −0.3 |
| Riga | 5.83 × 10⁻¹⁰ | −2.87 × 10⁻¹³ | 0.53 | 0.0000 | −2.3 |
| Stockholm | 2.10 × 10⁻¹¹ | −8.27 × 10⁻¹⁵ | 0.2 | 0.0089 | −0.3 |
| Tallinn | 3.23 × 10⁻¹⁰ | −1.58 × 10⁻¹³ | 0.51 | 0.0000 | −1.9 |
| Vilnius | 3.08 × 10⁻¹⁰ | −1.52 × 10⁻¹³ | 0.53 | 0.0000 | −2.3 |
| Warsaw | 3.72 × 10⁻¹⁰ | −1.78 × 10⁻¹³ | 0.46 | 0.0000 | −0.9 |
| City | Total AOD | Rate of variation [total AOD year−1] × 10−3 | |||
| a | b | R2 | p-value | ||
| Berlin | 4.75 | −0.0023 | 0.54 | 0.0000 | −3.3 |
| Copenhagen | 3.94 | −0.0019 | 0.51 | 0.0000 | −1.8 |
| Helsinki | 5.18 | −0.0025 | 0.49 | 0.0000 | −3.5 |
| Oslo | 2.02 | −0.0010 | 0.29 | 0.0033 | −0.4 |
| Riga | 5.78 | −0.0028 | 0.54 | 0.0000 | −3.9 |
| Stockholm | 4.08 | −0.0020 | 0.55 | 0.0000 | −2.4 |
| Tallinn | 5.07 | −0.0025 | 0.50 | 0.0000 | −3.4 |
| Vilnius | 5.97 | −0.0029 | 0.55 | 0.0000 | −4.5 |
| Warsaw | 6.11 | −0.0029 | 0.60 | 0.0000 | −4.6 |
| City | SO4 AOD | Rate of variation [SO4 AOD year−1] × 10−3 | |||
| a | b | R2 | p-value | ||
| Berlin | 5.29 | −0.0026 | 0.70 | 0.0000 | −3.3 |
| Copenhagen | 4.52 | −0.0022 | 0.69 | 0.0000 | −2.1 |
| Helsinki | 4.37 | −0.0021 | 0.62 | 0.0000 | −2.7 |
| Oslo | 2.63 | −0.0013 | 0.49 | 0.0000 | −0.8 |
| Riga | 5.22 | −0.0026 | 0.68 | 0.0000 | −3.4 |
| Stockholm | 4.05 | −0.0020 | 0.71 | 0.0000 | −1.9 |
| Tallinn | 4.54 | −0.0022 | 0.63 | 0.0000 | −2.8 |
| Vilnius | 5.96 | −0.0029 | 0.72 | 0.0000 | −4.0 |
| Warsaw | 6.37 | −0.0031 | 0.73 | 0.0000 | −4.2 |
| City | BC AOD | Rate of variation [BC AOD year−1] × 10−5 | |||
| a | b | R2 | p-value | ||
| Berlin | −0.174 | 0.0001 | 0.40 | 0.0003 | 3.3 |
| Copenhagen | −0.158 | 0.0001 | 0.44 | 0.0001 | 6.4 |
| Helsinki | 0.007 | – | – | 0.0000 | – |
| Oslo | −0.121 | 0.0001 | 0.50 | 0.0000 | 6.7 |
| Riga | 0.0076 | – | – | 0.0000 | – |
| Stockholm | −0.101 | 0.0001 | 0.31 | 0.0022 | 4.2 |
| Tallinn | 0.007 | – | – | 0.0000 | – |
| Vilnius | 0.008 | – | – | 0.0000 | – |
| Warsaw | 0.011 | – | – | 0.0000 | – |
| City | OC AOD | Rate of variation [OC AOD year−1] × 10−4 | |||
| a | b | R2 | p-value | ||
| Berlin | −0.511 | 0.0003 | 0.28 | 0.0038 | 1.2 |
| Copenhagen | −0.510 | 0.0003 | 0.31 | 0.0022 | 2.3 |
| Helsinki | 0.023 | – | – | 0.0000 | – |
| Oslo | −0.536 | 0.0003 | 0.40 | 0.0003 | 3.2 |
| Riga | 0.0236 | – | – | 0.0000 | – |
| Stockholm | 0.0193 | – | – | 0.0000 | – |
| Tallinn | 0.0218 | – | – | 0.0000 | – |
| Vilnius | 0.0249 | – | – | 0.0000 | – |
| Warsaw | 0.026 | – | – | 0.0000 | – |
| City | SO4 AOD [%] | Rate of variation in SO4 AOD [% year−1] | |||
| a | b | R2 | p-value | ||
| Berlin | 1250.4 | −0.5927 | 0.76 | 0.0000 | 0.6 |
| Copenhagen | 1356.8 | −0.6486 | 0.78 | 0.0000 | 0.6 |
| Helsinki | 963.73 | −0.4524 | 0.53 | 0.0000 | 0.4 |
| Oslo | 1241.1 | −0.5905 | 0.67 | 0.0000 | 0.4 |
| Riga | 1090.7 | −0.5146 | 0.64 | 0.0000 | 0.6 |
| Stockholm | 1311.8 | −0.6259 | 0.77 | 0.0000 | 0.5 |
| Tallinn | 1082.8 | −0.5115 | 0.62 | 0.0000 | 0.5 |
| Vilnius | 1197.8 | −0.5663 | 0.76 | 0.0000 | 0.5 |
| Warsaw | 1160.7 | −0.5468 | 0.61 | 0.0000 | 0.5 |
| City | BC AOD [%] | Rate of variation in BC AOD [% year−1] | |||
| a | b | R2 | p-value | ||
| Berlin | −227.3 | 0.1163 | 0.85 | 0.0000 | 0.1 |
| Copenhagen | −199.3 | 0.1020 | 0.80 | 0.0000 | 0.1 |
| Helsinki | −147.9 | 0.0761 | 0.73 | 0.0000 | 0.1 |
| Oslo | −177.3 | 0.0910 | 0.74 | 0.0000 | 0.1 |
| Riga | −164.3 | 0.0843 | 0.73 | 0.0000 | 0.1 |
| Stockholm | −176.8 | 0.0905 | 0.79 | 0.0000 | 0.1 |
| Tallinn | −157.0 | 0.0806 | 0.73 | 0.0000 | 0.1 |
| Vilnius | −167.4 | 0.0859 | 0.74 | 0.0000 | 0.1 |
| Warsaw | −179.0 | 0.0920 | 0.77 | 0.0000 | 0.1 |
| City | OC AOD [%] | Rate of variation in OC AOD [% year−1] | |||
| a | b | R2 | p-value | ||
| Berlin | −574.1 | 0.2923 | 0.76 | 0.0000 | 0.3 |
| Copenhagen | −571.7 | 0.2911 | 0.74 | 0.0000 | 0.2 |
| Helsinki | 14.77 | – | – | 0.0000 | – |
| Oslo | −705.9 | 0.3600 | 0.71 | 0.0000 | 0.3 |
| Riga | −375.7 | 0.1946 | 0.20 | 0.0166 | 0.2 |
| Stockholm | −562.8 | 0.2876 | 0.63 | 0.0000 | 0.3 |
| Tallinn | −316.1 | 0.1650 | 0.17 | 0.0300 | 0.2 |
| Vilnius | −521.5 | 0.2671 | 0.42 | 0.0002 | 0.2 |
| Warsaw | −479.7 | 0.2457 | 0.61 | 0.0000 | 0.2 |
| City | SS AOD [%] | Rate of variation in SS AOD [% year−1] | |||
| a | b | R2 | p-value | ||
| Berlin | −136.2 | 0.0717 | 0.21 | 0.0137 | 0.1 |
| Copenhagen | −266.3 | 0.1402 | 0.25 | 0.0074 | 0.1 |
| Helsinki | −323.1 | 0.1672 | 0.30 | 0.0025 | 0.2 |
| Oslo | 9.59 | – | – | 0.0000 | – |
| Riga | −186.7 | 0.0977 | 0.17 | 0.0307 | 0.2 |
| Stockholm | −288.7 | 0.1506 | 0.39 | 0.0004 | 0.1 |
| Tallinn | −269.4 | 0.1398 | 0.73 | 0.0000 | 0.1 |
| Vilnius | 5.70 | – | – | 0.0000 | – |
| Warsaw | −91.3 | 0.0477 | 0.23 | 0.0092 | 0.1 |
| City | DU AOD [%] | Rate of variation in DU AOD [% year−1] | |||
| a | b | R2 | p-value | ||
| Berlin | 12.35 | – | – | 0.0000 | 0.0 |
| Copenhagen | −219.6 | 0.1153 | 0.18 | 0.0237 | 0.1 |
| Helsinki | −220.0 | 0.1156 | 0.14 | 0.0469 | 0.1 |
| Oslo | 12.29 | – | – | 0.0000 | – |
| Riga | −264.0 | 0.1380 | 0.22 | 0.0129 | 0.1 |
| Stockholm | 11.53 | – | – | 0.0000 | – |
| Tallinn | −240.36 | 0.1261 | 0.16 | 0.0323 | 0.1 |
| Vilnius | −317.4 | 0.1649 | 0.28 | 0.0040 | 0.1 |
| Warsaw | −310.8 | 0.1613 | 0.23 | 0.0101 | 0.2 |
| City | Natural AOD [%] | Anthropogenic AOD [%] | Trend in AOD Percentage Contribution to Total AOD from 1989 to 2008 | |||||
|---|---|---|---|---|---|---|---|---|
| Anthropogenic AOD | Natural AOD | |||||||
| Mean (Min–Max) | Mean (Min–Max) | R2 | p-Value | Rate of Variation [% Year−1] | R2 | p-Value | Rate of Variation [% Year−1] | |
| Berlin | 20.0 (13.9–25.7) | 80.0 (74.3–86.1) | 0.86 | 9.72 × 10⁻⁸ | −0.6 | 0.86 | 9.72 × 10⁻⁸ | 0.6 |
| Copenhagen | 26.4 (19.7–33.6) | 73.6 (66.4–80.3) | 0.73 | 1.14 × 10⁻⁵ | −0.7 | 0.73 | 1.14 × 10⁻⁵ | 0.7 |
| Helsinki | 24.1 (14.6–29.7) | 75.9 (70.3–85.4) | 0.77 | 4.25 × 10⁻⁶ | −0.6 | 0.77 | 4.25 × 10⁻⁶ | 0.6 |
| Oslo | 21.9 (13.2–27.4) | 78.1 (72.6–86.8) | 0.6 | 0.0003 | −0.4 | 0.6 | 0.0003 | 0.4 |
| Riga | 22.1 (13.8–27.6) | 77.9 (72.4–86.2) | 0.78 | 2.65 × 10⁻⁶ | −0.6 | 0.78 | 2.65 × 10⁻⁶ | 0.6 |
| Stockholm | 24.8 (16.0–29.3) | 75.2 (70.7–84.0) | 0.73 | 1.43 × 10⁻⁵ | −0.5 | 0.73 | 1.43 × 10⁻⁵ | 0.5 |
| Tallinn | 23.4 (14.6–28.8) | 76.6 (71.2–85.4) | 0.76 | 5.2 × 10⁻⁶ | −0.6 | 0.76 | 5.2 × 10⁻⁶ | 0.6 |
| Vilnius | 19.0 (10.8–24.9) | 81.0 (75.0–89.2) | 0.86 | 8.52 × 10⁻⁸ | −0.6 | 0.86 | 8.52 × 10⁻⁸ | 0.6 |
| Warsaw | 17.2 (9.7–23.5) | 82.8 (76.5–90.3) | 0.88 | 2.85 × 10⁻⁸ | −0.7 | 0.86 | 9.72 × 10⁻⁸ | 0.7 |
| City | n | y | a | b | x [Unit of Measurement] | R2 | p-Value |
|---|---|---|---|---|---|---|---|
| Berlin | 20 | Total AOD | 3.30 | −0.0016 | Time [year] | 0.40 | 0.0027 |
| 20 | SO4 AOD | 2.98 | −0.0014 | Time [year] | 0.55 | 0.0002 | |
| Helsinki | 20 | SO4 AOD | 0.031 | 0.0008 | SFFGAE [%] | 0.26 | 0.0211 |
| Oslo | 12 | SO4 AOD | 0.120 | −6.4641 × 10⁻⁷ | GDP [EUR/capita] | 0.39 | 0.0292 |
| Stockholm | 20 | Tot AOD | 0.060 | 0.0020 | SFFGAE [%] | 0.34 | 0.0075 |
| 20 | SO4 AOD | 0.117 | −8.196 × 10⁻⁷ | GDP [EUR/capita] | 0.51 | 0.0004 | |
| Tallinn | 20 | SO4 AOD | 0.088 | −8.205 × 10⁻⁷ | GDP [EUR/capita] | 0.31 | 0.011 |
| Vilnius | 19 | SO4 AOD | 0.118 | −1.3768 × 10⁻⁶ | GDP [EUR/capita] | 0.70 | 0.0000 |
| Warsaw | 20 | Total AOD | 3.67 | −0.0017 | Time [year] | 0.58 | 0.0001 |
| 20 | SO4 AOD | 3.29 | −0.0016 | Time [year] | 0.67 | 0.0000 |
References
- Provençal, S.; Kishcha, P.; da Silva, A.M.; Elhacham, E.; Alpert, P. AOD distributions and trends of major aerosol species over a selection of the world’s most populated cities based on the 1st version of NASA’s MERRA Aerosol Reanalysis. Urban Clim. 2017, 20, 168–191. [Google Scholar] [CrossRef] [PubMed]
- Rizza, U.; Mancinelli, E.; Morichetti, M.; Passerini, G.; Virgili, S. Aerosol Optical Depth of the Main Aerosol Species over Italian Cities Based on the NASA/MERRA-2 Model Reanalysis. Atmosphere 2019, 10, 709. [Google Scholar] [CrossRef]
- Mehta, M.; Singh, N.; Anshumali. Global trends of columnar and vertically distributed properties of aerosols with emphasis on dust, polluted dust and smoke—Inferences from 10-year long CALIOP observations. Remote Sens. Environ. 2018, 208, 120–132. [Google Scholar] [CrossRef]
- Mehta, M.; Singh, R.; Singh, A.; Singh, N. Recent global aerosol optical depth variations and trends—A comparative study using MODIS and MISR level 3 datasets. Remote Sens. Environ. 2016, 181, 137–150. [Google Scholar] [CrossRef]
- Filonchyk, M.; Hurynovich, V.; Yan, H. Trends in aerosol optical properties over Eastern Europe based on MODIS-Aqua. Geosci. Front. 2020, 11, 2169–2181. [Google Scholar] [CrossRef]
- Filonchyk, M.; Hurynovich, V.; Yan, H.; Zhou, L.; Gusev, A. Climatology of aerosol optical depth over Eastern Europe based on 19 years (2000–2018) MODIS TERRA data. Int. J. Climatol. 2020, 40, 3531–3549. [Google Scholar] [CrossRef]
- Di Antonio, L.; Di Biagio, C.; Foret, G.; Formenti, P.; Siour, G.; Doussin, J.F.; Beekmann, M. Aerosol optical depth climatology from the high–resolution MAIAC product over Europe: Differences between major European cities and their surrounding environments. Atmos. Chem. Phys. 2023, 23, 12455–12475. [Google Scholar] [CrossRef]
- Gupta, G.; Ratnam, M.V.; Madhavan, B.L.; Narayanamurthy, C.S. Long-term trends in Aerosol Optical Depth obtained across the globe using multi-satellite measurements. Atmos. Environ. 2022, 273, 118953. [Google Scholar] [CrossRef]
- Gupta, G.; Ratnam, M.V.; Madhavan, B.L.; Jayaraman, A. Global trends in the aerosol optical, physical, and morphological properties obtained using multi-sensor measurements. Atmos. Environ. 2023, 295, 119569. [Google Scholar] [CrossRef]
- Winker, D.M.; Vaughan, M.A.; Omar, A.; Hu, Y.; Powell, K.A.; Liu, Z.; Hunt, W.H.; Young, S.A. Overview of the CALIPSO Mission and CALIOP Data Processing Algorithms. J. Atmos. Ocean. Technol. 2009, 26, 2310–2323. [Google Scholar] [CrossRef]
- Gupta, G.; Ratnam, M.V.; Madhavan, B.L. Changing patterns in the highly contributing aerosol types/species across the globe in the past two decades. Sci. Total Environ. 2023, 897, 165389. [Google Scholar] [CrossRef] [PubMed]
- Gelaro, R.; McCarty, W.; Suárez, M.J.; Todling, R.; Molod, A.; Takacs, L.; Wargan, K. The modern-era retrospective analysis for research and applications, version 2 (MERRA-2). J. Clim. 2017, 30, 5419–5454. [Google Scholar] [CrossRef] [PubMed]
- Rienecker, M.M.; Suarez, M.J.; Gelaro, R.; Todling, R.; Bacmeister, J.; Liu, E.; Bosilovich, M.G. MERRA: NASA’s modern-era retrospective analysis for research and applications. J. Clim. 2011, 24, 3624–3648. [Google Scholar] [CrossRef]
- Markowicz, K.M.; Stachlewska, I.S.; Zawadzka-Manko, O.; Wang, D.; Kumala, W.; Chilinski, M.T.; Makuch, P.; Markuszewski, P.; Rozwadowska, A.K.; Petelski, T.; et al. A Decade of Poland-AOD Aerosol Research Network Observations. Atmosphere 2021, 12, 1583. [Google Scholar] [CrossRef]
- Naqvi, A. Decoupling trends of emissions across EU regions and the role of environmental policies. J. Clean. Prod. 2021, 323, 129130. [Google Scholar] [CrossRef]
- Qin, W.; Liu, Y.; Wang, L.; Lin, A.; Xia, X.; Che, H.; Bilal, M.; Zhang, M. Characteristic and driving factors of aerosol optical depth over mainland China during 1980–2017. Remote Sens. 2018, 10, 1064. [Google Scholar] [CrossRef]
- Papachristopoulou, K.; Raptis, I.P.; Gkikas, A.; Fountoulakis, I.; Masoom, A.; Kazadzis, S. Aerosol optical depth regime over megacities of the world. Atmos. Chem. Phys. 2022, 22, 15703–15727. [Google Scholar] [CrossRef]
- Lyapustin, A.; Wang, Y.J.; Korkin, S.; Huang, D. MODIS Collection 6 MAIAC algorithm. Atmos. Meas. Tech. 2018, 11, 5741–5765. [Google Scholar] [CrossRef]
- Remer, L.A.; Kaufman, Y.J.; Tanre, D.; Mattoo, S.; Chu, D.A.; Martins, J.V.; Li, R.R.; Ichoku, C.; Levy, R.C.; Kleidman, R.G.; et al. The MODIS aerosol algorithm, products, and validation. J. Atmos. Sci. 2005, 62, 947–973. [Google Scholar] [CrossRef]
- Levy, R.C.; Remer, L.A.; Mattoo, S.; Vermote, E.F.; Kaufman, Y.J. Second-generation operational algorithm: Retrieval of aerosol properties over land from inversion of Moderate Resolution Imaging Spectroradiometer spectral reflectance. J. Geophys. Res. Atmos. 2007, 112, D13211. [Google Scholar] [CrossRef]
- European Commission. Commission Delegated Regulation 2019/1755 of 8 August 2019 amending the Annexes to Regulation (EC) No 1059/2003 of the European Parliament and of the Council on the Establishment of a Common Classification of Territorial Units for Statistics (NUTS). C/2019/5841. Document 32019R1755. 2019. Available online: http://data.europa.eu/eli/reg_del/2019/1755/oj (accessed on 22 January 2024).
- Purvins, A.; Fulli, G.; Covrig, C.-F.; Chaouachi, A.; Bompard, E.; Carpaneto, E.; Huang, T.; Pi, R.J.; Mutule, A.; Oleinikova, I.; et al. The Baltic Power System between East and West Interconnections; Publications Office of the European Union: Luxembourg, 2016; Available online: https://data.europa.eu/doi/10.2790/411653 (accessed on 8 May 2024).
- Štreimikienė, D.; Balezentis, T. Kaya identity for analysis of the main drivers of GHG emissions and feasibility to implement EU “20–20–20” targets in the Baltic States. Renew. Sustain. Energy Rev. 2016, 58, 1108–1113. [Google Scholar] [CrossRef]
- Rienecker, M.; Suarez, M.; Todling, R.; Bacmeister, J.; Takacs, L.; Liu, H.-C.; Gu, W.; Sienkiewicz, M.; Koster, R.; Gelaro, R. The GEOS-5 Data Assimilation System—Documentation of Versions 5.0.1, 5.1.0, and 5.2.0; Technical Report Series on Global Modeling and Data Assimilation; NASA: Washington, DC, USA, 2008. [Google Scholar]
- Molod, A.; Takacs, L.; Suarez, M.; Bacmeister, J.; Song, I.-S.; Eichmann, A. The GEOS-5 Atmospheric General Circulation Model: Mean Climate and Development from MERRA to Fortuna; NASA: Washington, DC, USA, 2012. [Google Scholar]
- Wu, W.-S.; Purser, R.J.; Parrish, D.F. Three-dimensional variational analysis with spatially inhomogeneous covariances. Mon. Wea. Rev. 2002, 130, 2905–2916. [Google Scholar] [CrossRef]
- Kleist, D.T.; Parrish, D.F.; Derber, J.C.; Treadon, R.; Wu, W.-S.; Lord, S. Introduction of the GSI into the NCEP Global Data Assimilation System. Weather Forecast. 2009, 24, 1691–1705. [Google Scholar] [CrossRef]
- Putman, W.M.; Lin, S.J. Finite-volume transport on various cubed-sphere grids. J. Comput. Phys. 2007, 227, 55–78. [Google Scholar] [CrossRef]
- Chin, M.; Ginoux, P.; Kinne, S.; Torres, O.; Holben, B.N.; Duncan, B.N.; Martin, R.V.; Logan, J.A.; Higurashi, A.; Nakajima, T. Tropospheric aerosol optical thickness from the GOCART model and comparisons with satellite and Sun photometer measurements. J. Atmos. Sci. 2002, 59, 461–483. [Google Scholar] [CrossRef]
- Colarco, P.; da Silva, A.; Chin, M.; Diehl, T. Online simulations of global aerosol distributions in the NASA GEOS-4 model and comparisons to satellite and ground-based aerosol optical depth. J. Geophys. Res. Atmos. 2010. [Google Scholar] [CrossRef]
- Heidinger, A.K.; Cao, C.; Sullivan, J.T. Using Moderate Resolution Imaging Spectrometer (MODIS) to calibrate Advanced Very High Resolution Radiometer reflectance channels. J. Geophys. Res. 2002, 107, 4702. [Google Scholar] [CrossRef]
- Kahn, R.A.; Gaitley, B.J.; Martonchik, J.V.; Diner, D.J.; Crean, K.A.; Holben, B. Multiangle Imaging Spectroradiometer (MISR) global aerosol optical depth validation based on 2 years of coincident Aerosol Robotic Network (AERONET) observations. J. Geophys. Res. Atmos. 2005, 110, D10S04. [Google Scholar] [CrossRef]
- Holben, B.N.; Eck, T.F.; Slutsker, I.; Tanré, D.; Buis, J.P.; Setzer, A.; Vermote, E.; Reagan, J.A.; Kaufman, Y.J.; Nakajima, T.; et al. AERONET—A Federated Instrument Network and Data Archive for Aerosol Characterization. Remote Sens. Environ. 1998, 66, 1–16. [Google Scholar] [CrossRef]
- Lacima, A.; Petetin, H.; Soret, A.; Bowdalo, D.; Jorba, O.; Chen, Z.; Méndez Turrubiates, R.F.; Achebak, H.; Ballester, J.; Pérez García-Pando, C. Long-term evaluation of surface air pollution in CAMSRA and MERRA-2 global reanalyses over Europe (2003–2020). Geosci. Model Dev. 2023, 16, 2689–2718. [Google Scholar] [CrossRef]
- Diehl, T.; Heil, A.; Chin, M.; Pan, X.; Streets, D.; Schultz, M.; Kinne, S. Anthropogenic, biomass burning, and volcanic emissions of black carbon, organic carbon, and SO2 from 1980 to 2010 for hindcast model experiments. Atmos. Chem. Phys. Discuss. 2012, 12, 24895–24954. [Google Scholar] [CrossRef]
- Janssens-Maenhout, G.; Crippa, M.; Guizzardi, D.; Muntean, M.; Schaaf, E. Joint Research Centre Data Catalogue—Emissions Database for Global Atmospheric Research, version v4.2 (time-series). European Commission, Joint Research Centre (JRC) [data set]. Available online: http://data.europa.eu/89h/jrc-edgar-emissiontimeseriesv42 (accessed on 9 May 2024).
- Janssens-Maenhout, G. Joint Research Centre Data Catalogue—EDGARv4.2 Emission Maps. European Commission, Joint Research Centre (JRC) [data set]. Available online: http://data.europa.eu/89h/jrc-edgar-emissionmapsv42 (accessed on 9 May 2024).
- Duncan, B.N.; Martin, R.V.; Staudt, A.C.; Yevich, R.; Logan, J.A. Interannual and seasonal variability of biomass burning emissions constrained by satellite observations. J. Geophys. Res. Atmos. 2003, 108, ACH-1. [Google Scholar] [CrossRef]
- Randerson, J.T.; Liu, H.; Flanner, M.G.; Chambers, S.D.; Jin, Y.; Hess, P.G.; Pfister, G.; Mack, M.C.; Treseder, K.K.; Welp, L.R.; et al. The impact of boreal forest fire on climate warming. Science 2006, 314, 1130–1133. [Google Scholar] [CrossRef] [PubMed]
- van der Werf, G.R.; Randerson, J.T.; Giglio, L.; Collatz, G.J.; Kasibhatla, P.S.; Arellano, A.F., Jr. Interannual variability in global biomass burning emissions from 1997 to 2004. Atmos. Chem. Phys. 2006, 6, 3423–3441. [Google Scholar] [CrossRef]
- Darmenov, A.; Silva, A. The Quick Fire Emissions Dataset (QFED): Documentation of Versions 2.1, 2.2 and 2.4; Technical Report Series on Global Modeling and Data Assimilation; NASA: Washington, DC, USA, 2015; Volume 38. Available online: http://gmao.gsfc.nasa.gov/pubs/docs/Darmenov796.pdf (accessed on 4 September 2023).
- Guenther, A.; Hewitt, C.N.; Erickson, D.; Fall, R.; Geron, C.; Graedel, T.; Harley, P.; Klinger, L.; Lerdau, M.; Mckay, W.A.; et al. A global model of natural volatile organic compound emissions. J. Geophys. Res. Atmos. 1995, 100, 8873–8892. [Google Scholar] [CrossRef]
- Randles, C.A.; da Silva, A.; Buchard, V.; Colarco, P.R.; Darmenov, A.S.; Govindaraju, R.C.; Smirnov, A.; Ferrare, R.A.; Hair, J.W.; Shinozuka, Y.; et al. The MERRA-2 Aerosol Reanalysis, 1980-onward, Part I: System Description and Data Assimilation Evaluation. J. Clim. 2017, 30, 6823–6850. [Google Scholar] [CrossRef] [PubMed]
- Randles, C.A.; da Silva, A.M.; Buchard, V.; Darmenov, A.; Colarco, P.R.; Aquila, V.; Bian, H.; Nowottnick, E.P.; Pan, X.; Smirnov, A.; et al. The MERRA-2 Aerosol Assimilation; NASA Technical Report Series on Global Modeling and Data Assimilation; NASA: Washington, DC, USA, 2016; Volume 45, p. 143. [Google Scholar]
- Crippa, M.; Guizzardi, D.; Muntean, M.; Schaaf, E.; Dentener, F.; Van Aardenne, J.A.; Monni, S.; Doering, U.; Olivier, J.G.; Pagliari, V.; et al. Gridded emissions of air pollutants for the period 1970–2012 within EDGAR v4.3.2. Earth Syst. Sci. Data 2018, 10, 1987–2013. [Google Scholar] [CrossRef]
- Eyring, V.; Köhler, H.W.; van Aardenne, J.; Lauer, A. Emissions from international shipping: 1. The last 50 years. J. Geophys. Res. Atmos. 2005, 110, D17305. [Google Scholar] [CrossRef]
- Marticorena, B.; Bergametti, G. Modeling the atmospheric dust cycle: 1. Design of a soil-derived dust emission scheme. J. Geophys. Res. Atmos. 1995, 100, 16415–16430. [Google Scholar] [CrossRef]
- Gong, S.L. A parameterization of sea-salt aerosol source function for sub- and super-micron particles. Glob. Biogeochem. Cycles 2003, 17, 1097. [Google Scholar] [CrossRef]
- Jaeglé, L.; Quinn, P.K.; Bates, T.S.; Alexander, B.; Lin, J.-T. Global distribution of sea salt aerosols: New constraints from in situ and remote sensing observations. Atmos. Chem. Phys. 2011, 11, 3137–3157. [Google Scholar] [CrossRef]
- Hsu, N.C.; Herman, J.R.; Bhartia, P.K.; Seftor, C.J.; Torres, O.; Thompson, A.M.; Gleason, J.F.; Eck, T.F.; Holben, B.N. Detection of biomass burning smoke from TOMS measurements. Geophys. Res. Lett. 1996, 23, 745–748. [Google Scholar] [CrossRef]
- Arino, O.; Simon, M.; Piccolini, I.; Rosaz, J.-M. The ERS-2 ATSR-2 World Fire Atlas and the ERS-2 ATSR-2 World Burnt Surface Atlas Projects. In Proceedings of the 8th ISPRS Conference on Physical Measurement & Signatures in Remote Sensing, Aussois, France, 8–12 January 2001. [Google Scholar]
- Giglio, L.; Schroeder, W.; Justice, C.O. The Collection 6 MODIS Active Fire Detection Algorithm and Fire Products. Remote Sens. Environ. 2016, 178, 31–41. [Google Scholar] [CrossRef] [PubMed]
- Justice, C.O.; Townshend, J.R.G.; Vermote, E.F.; Masuoka, E.; Wolfe, R.E.; Saleous, N.; Roy, D.P.; Morisette, J.T. An overview of MODIS Land data processing and product status. Remote Sens. Environ 2002, 83, 3–15. [Google Scholar] [CrossRef]
- Hsu, N.C.; Tsay, S.C.; King, M.D.; Herman, J.R. Aerosol properties over bright-reflecting source regions. IEEE Trans. Geosci. Remote Sens. 2004, 42, 557–569. [Google Scholar] [CrossRef]
- Levy, R.C.; Mattoo, S.; Munchak, L.A.; Remer, L.A.; Sayer, A.M.; Patadia, F.; Hsu, N.C. The Collection 6 MODIS aerosol products over land and ocean. Atmos. Meas. Tech. 2013, 6, 2989. [Google Scholar] [CrossRef]
- Sayer, A.M.; Munchak, L.A.; Hsu, N.C.; Levy, R.C.; Bettenhausen, C.; Jeong, M.-J. MODIS Collection 6 aerosol products: Comparison between Aqua’s e-Deep Blue, Dark Target, and “merged” data sets, and usage recommendations. J. Geophys. Res. Atmos. 2014, 119, 13965–13989. [Google Scholar] [CrossRef]
- Diner, D.J.; Beckert, J.C.; Reilly, T.H.; Bruegge, C.J.; Conel, J.E.; Kahn, R.A.; Martonchik, J.V.; Ackerman, T.P.; Davies, R.; Gerstl, S.A.; et al. Multi-angle Imaging SpectroRadiometer (MISR) instrument description and experiment overview. IEEE Trans. Geosci. Remote Sens. 1998, 36, 1072–1087. [Google Scholar] [CrossRef]
- Mancinelli, E.; Canestrari, F.; Graziani, A.; Rizza, U.; Passerini, G. Sustainable Performances of Small to Medium-Sized Airports in the Adriatic Region. Sustainability 2021, 13, 13156. [Google Scholar] [CrossRef]
- Smith, G. Step away from stepwise. J. Big Data 2018, 5, 32. [Google Scholar] [CrossRef]
- Draper, N.R.; Smith, H. Applied Regression Analysis; John Wiley & Sons: Hoboken, NJ, USA, 1998; Volume 326, pp. 307–312. [Google Scholar]
- Yang, Y.; Lou, S.; Wang, H.; Wang, P.; Liao, H. Trends and source apportionment of aerosols in Europe during 1980–2018. Atmos. Chem. Phys. 2020, 20, 2579–2590. [Google Scholar] [CrossRef]
- Saponaro, G.; Kolmonen, P.; Sogacheva, L.; Rodriguez, E.; Virtanen, T.; de Leeuw, G. Estimates of the aerosol indirect effect over the Baltic Sea region derived from 12 years of MODIS observations. Atmos. Chem. Phys. 2017, 17, 3133–3143. [Google Scholar] [CrossRef]
- Zhao, B.; Jiang, J.H.; Diner, D.J.; Su, H.; Gu, Y.; Liou, K.-N.; Jiang, Z.; Huang, L.; Takano, Y.; Fan, X. Intra-annual variations of regional aerosol optical depth, vertical distribution, and particle types from multiple satellite and ground-based observational datasets. Atmos. Chem. Phys. 2018, 18, 11247–11260. [Google Scholar] [CrossRef]
- Ansmann, A.; Mattis, I.; Wandinger, U.; Wagner, F.; Reichardt, J.; Deshler, T. Evolution of the Pinatubo aerosol: Raman lidar observations of particle optical depth, effective radius, mass, and surface area over Central Europe at 53.4 N. J. Atmos. Sci. 1997, 54, 2630–2641. [Google Scholar] [CrossRef]
- Shantikumar, N.S.; Larson, E.J.; Dumka, U.C.; Estelles, V.; Campanelli, M.; Steve, C. Long-term (1995–2018) aerosol optical depth derived using ground based AERONET and SKYNET measurements from aerosol aged-background sites. Atmos. Pollut. Res. 2019, 10, 608–620. [Google Scholar] [CrossRef]
- Sun, E.; Xu, X.; Che, H.; Tang, Z.; Gui, K.; An, L.; Lu, C.; Shi, G. Variation in MERRA-2 aerosol optical depth and absorption aerosol optical depth over China from 1980 to 2017. J. Atmos. Sol. Terr. Phys. 2019, 186, 8–19. [Google Scholar] [CrossRef]
- Rizza, U.; Donnadieu, F.; Morichetti, M.; Avolio, E.; Castorina, G.; Semprebello, A.; Magazu, S.; Passerini, G.; Mancinelli, E.; Biensan, C. Airspace Contamination by Volcanic Ash from Sequences of Etna Paroxysms: Coupling the WRF-Chem Dispersion Model with Near-Source L-Band Radar Observations. Remote Sens. 2023, 15, 3760. [Google Scholar] [CrossRef]
- Markowicz, K.M.; Zawadzka-Manko1, O.; Posyniak, M. A large reduction of direct aerosol cooling over Poland in the last decades. Int. J. Climatol. 2022, 42, 4129–4146. [Google Scholar] [CrossRef]
- Logothetis, S.A.; Salamalikis, V.; Gkikas, A.; Kazadzis, S.; Amiridis, V.; Kazantzidis, A. 15-Year Variability of Desert Dust Optical Depth on Global and Regional Scales. Atmos. Chem. Phys. 2021, 21, 16499–16529. [Google Scholar] [CrossRef]

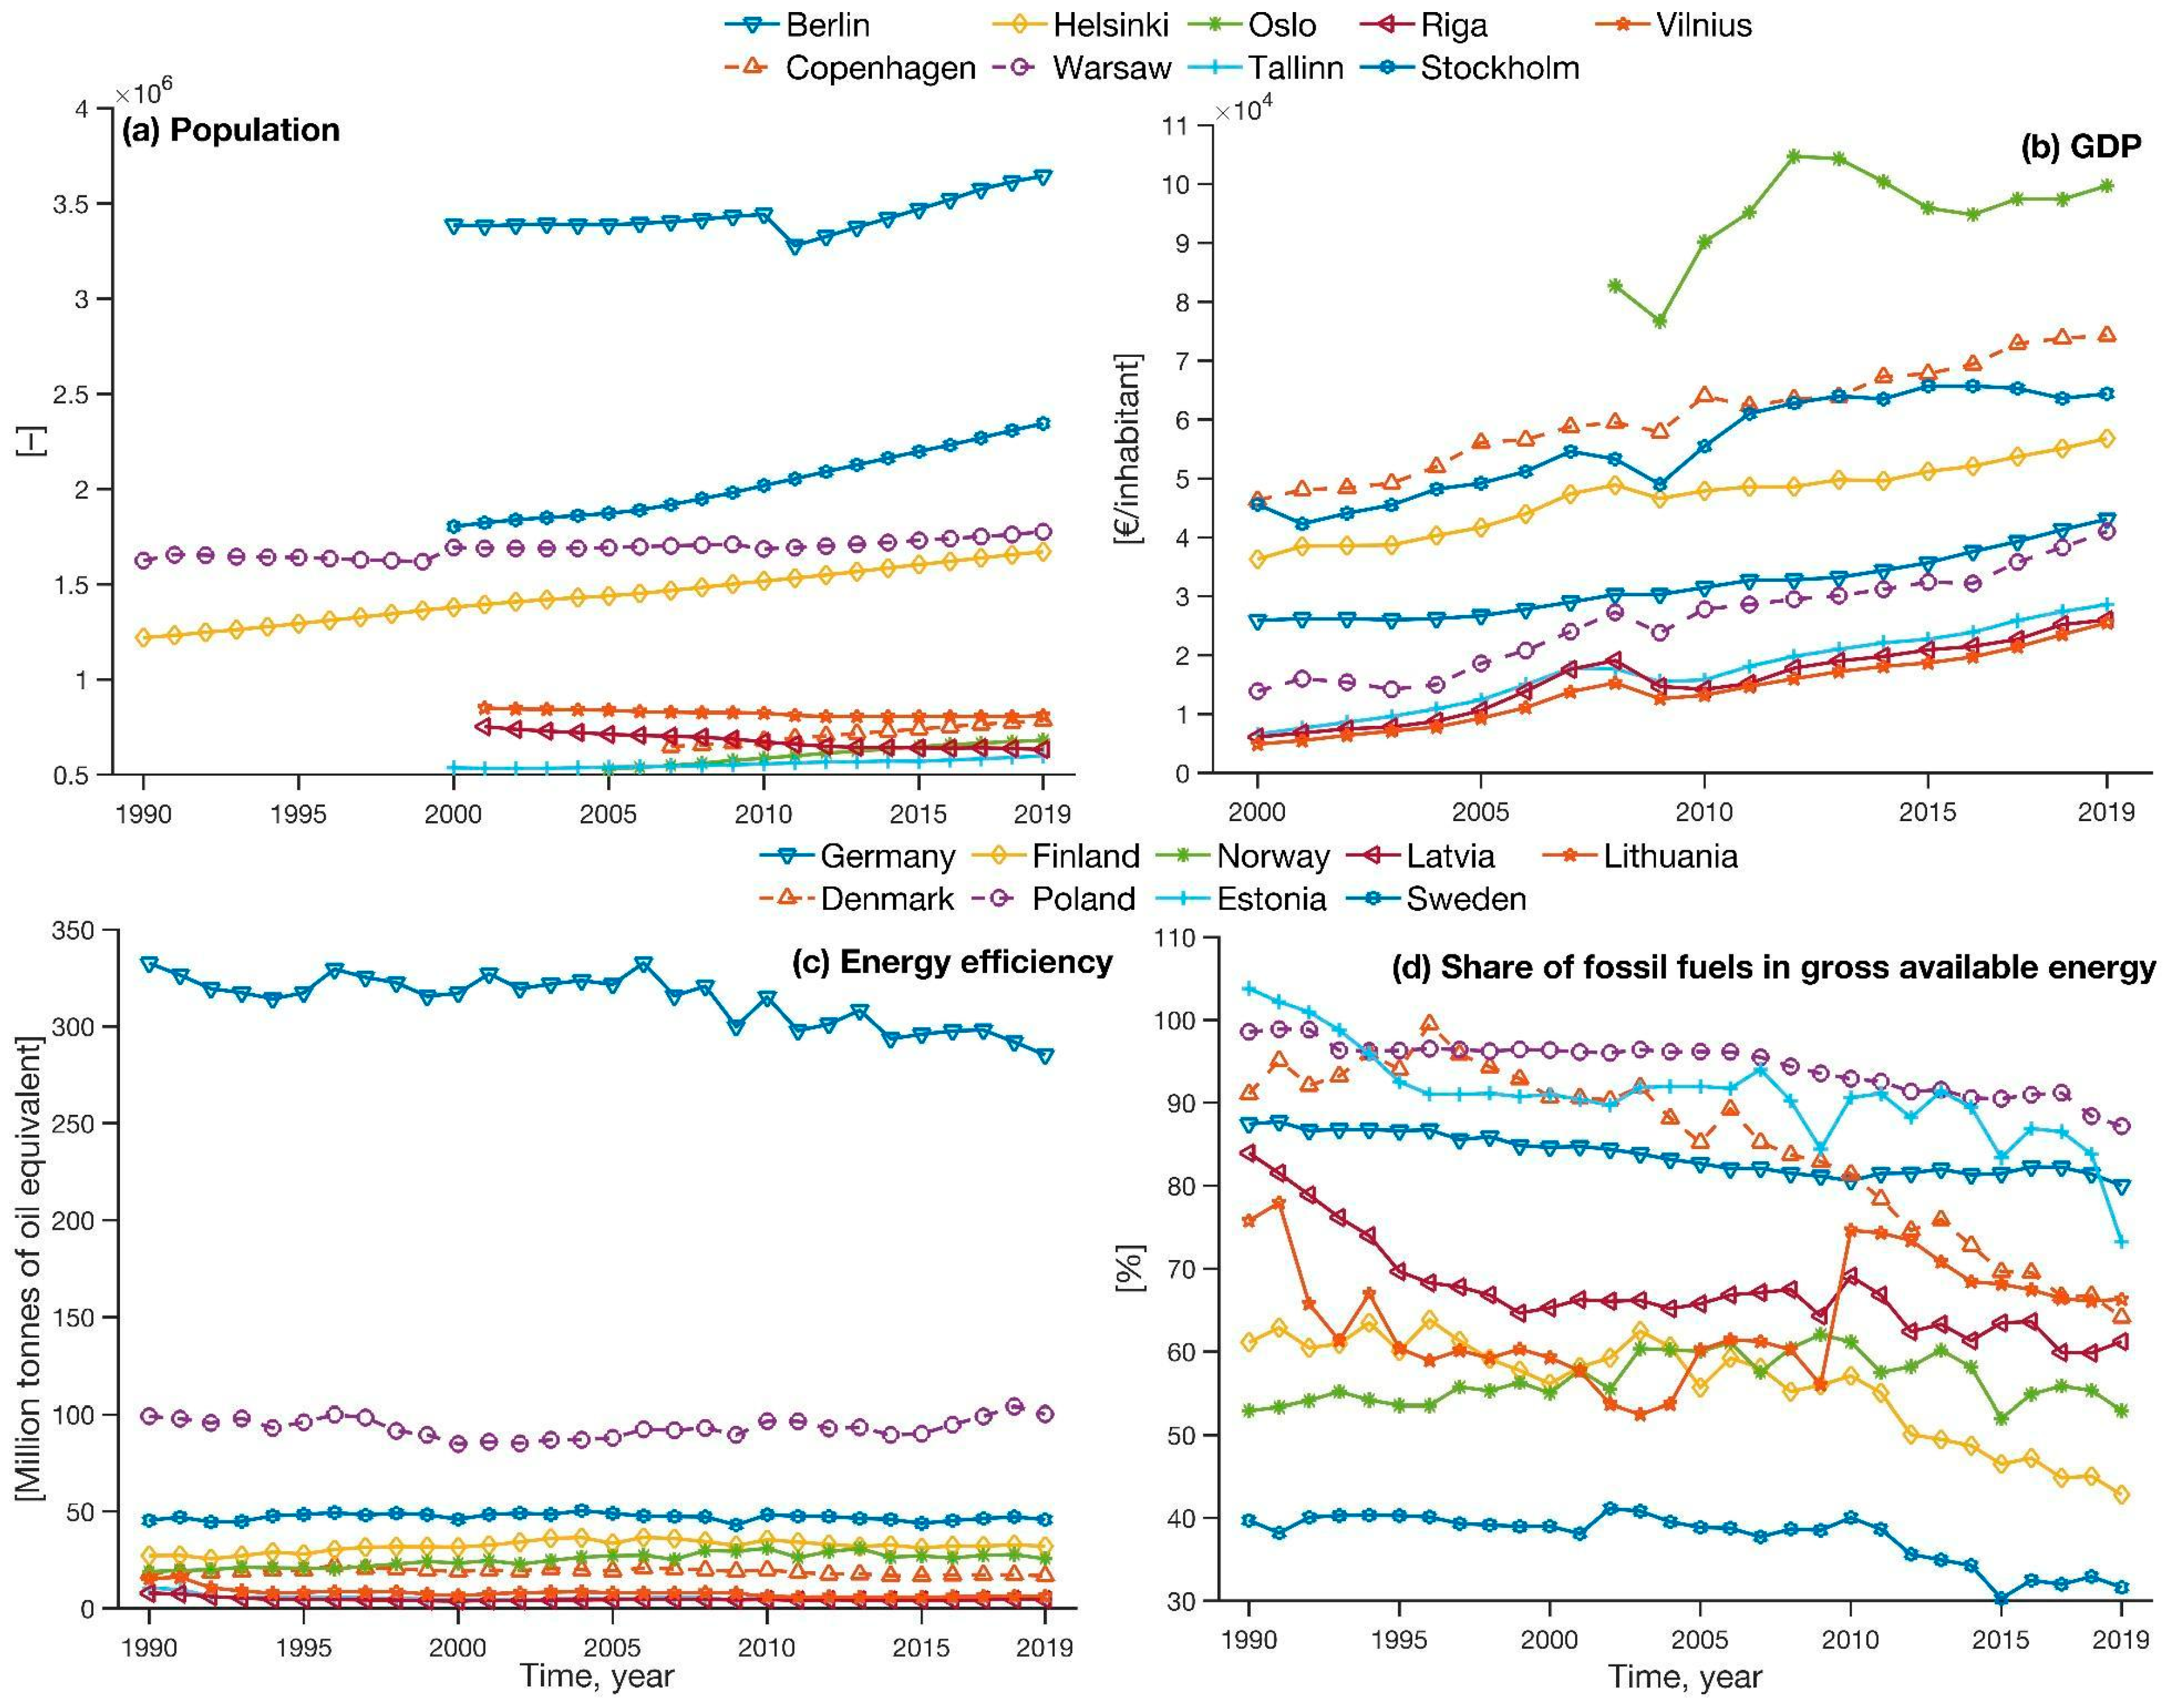
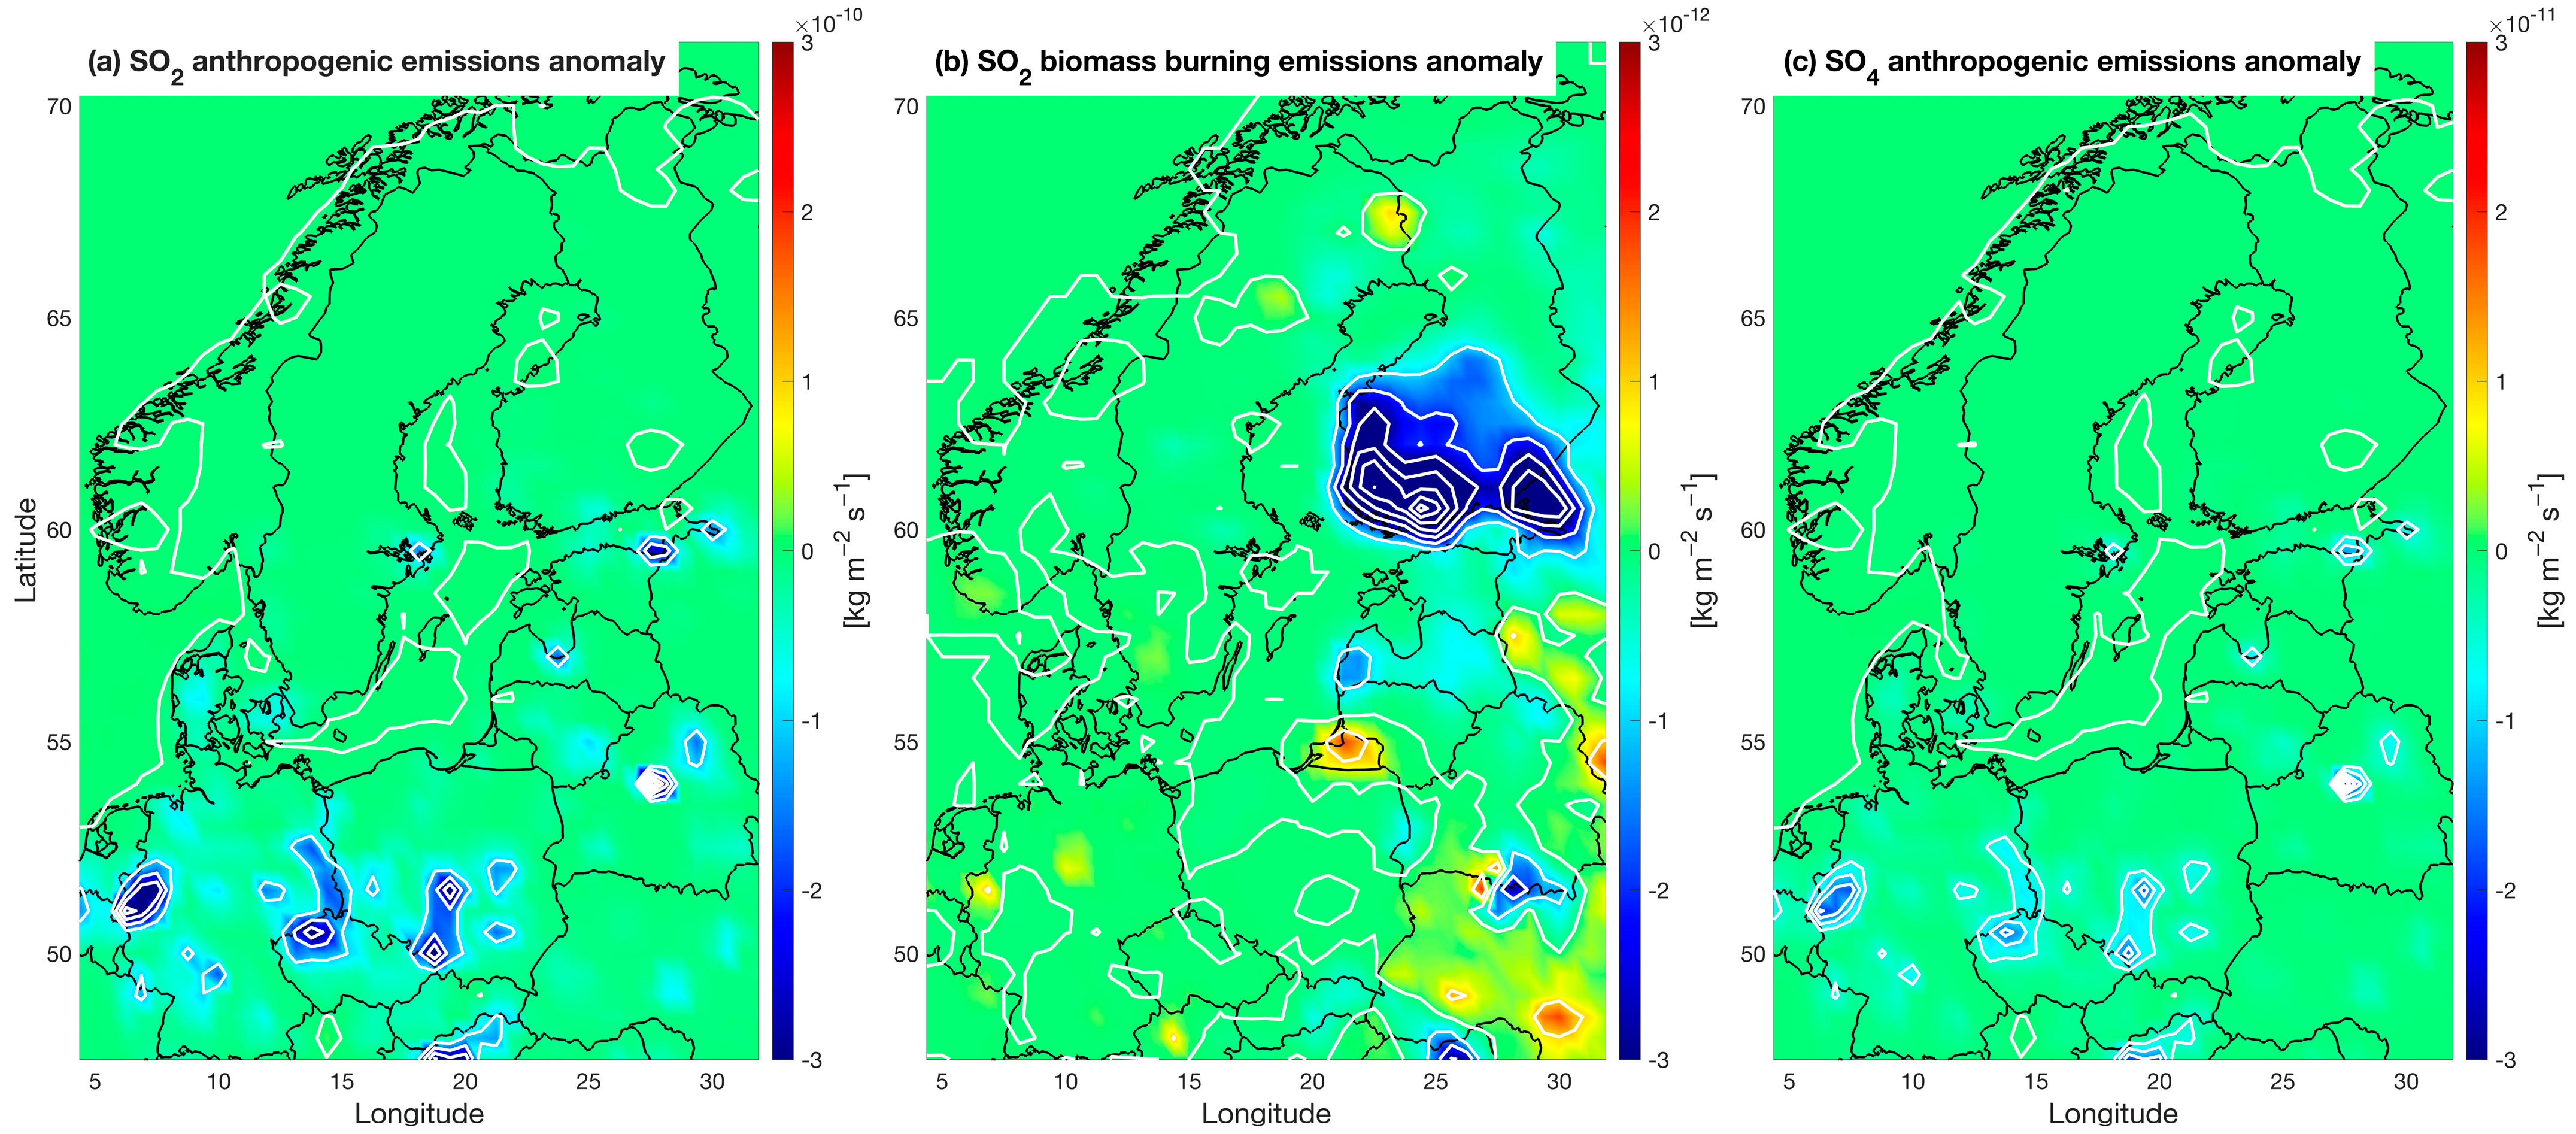
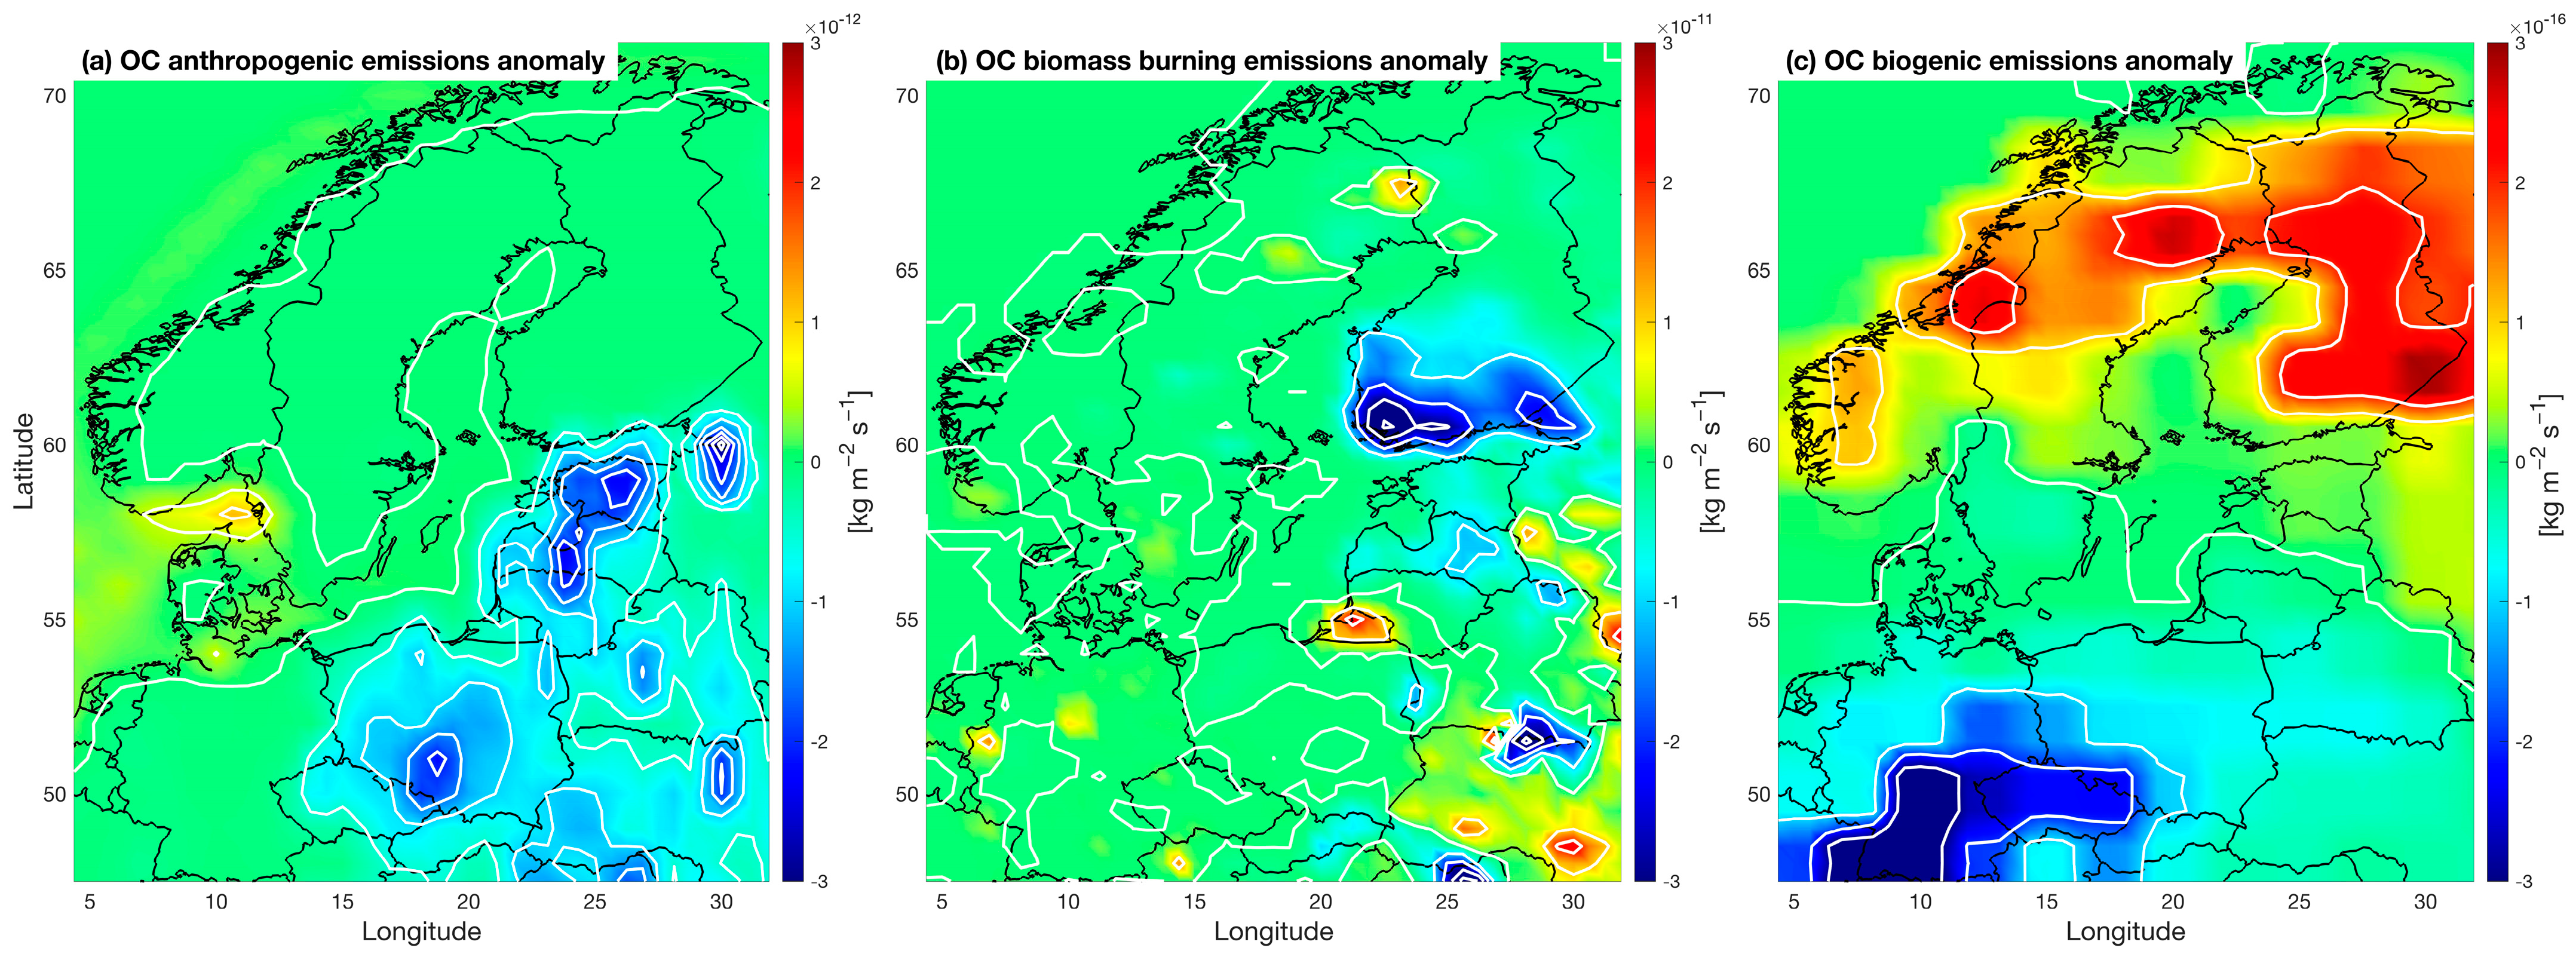
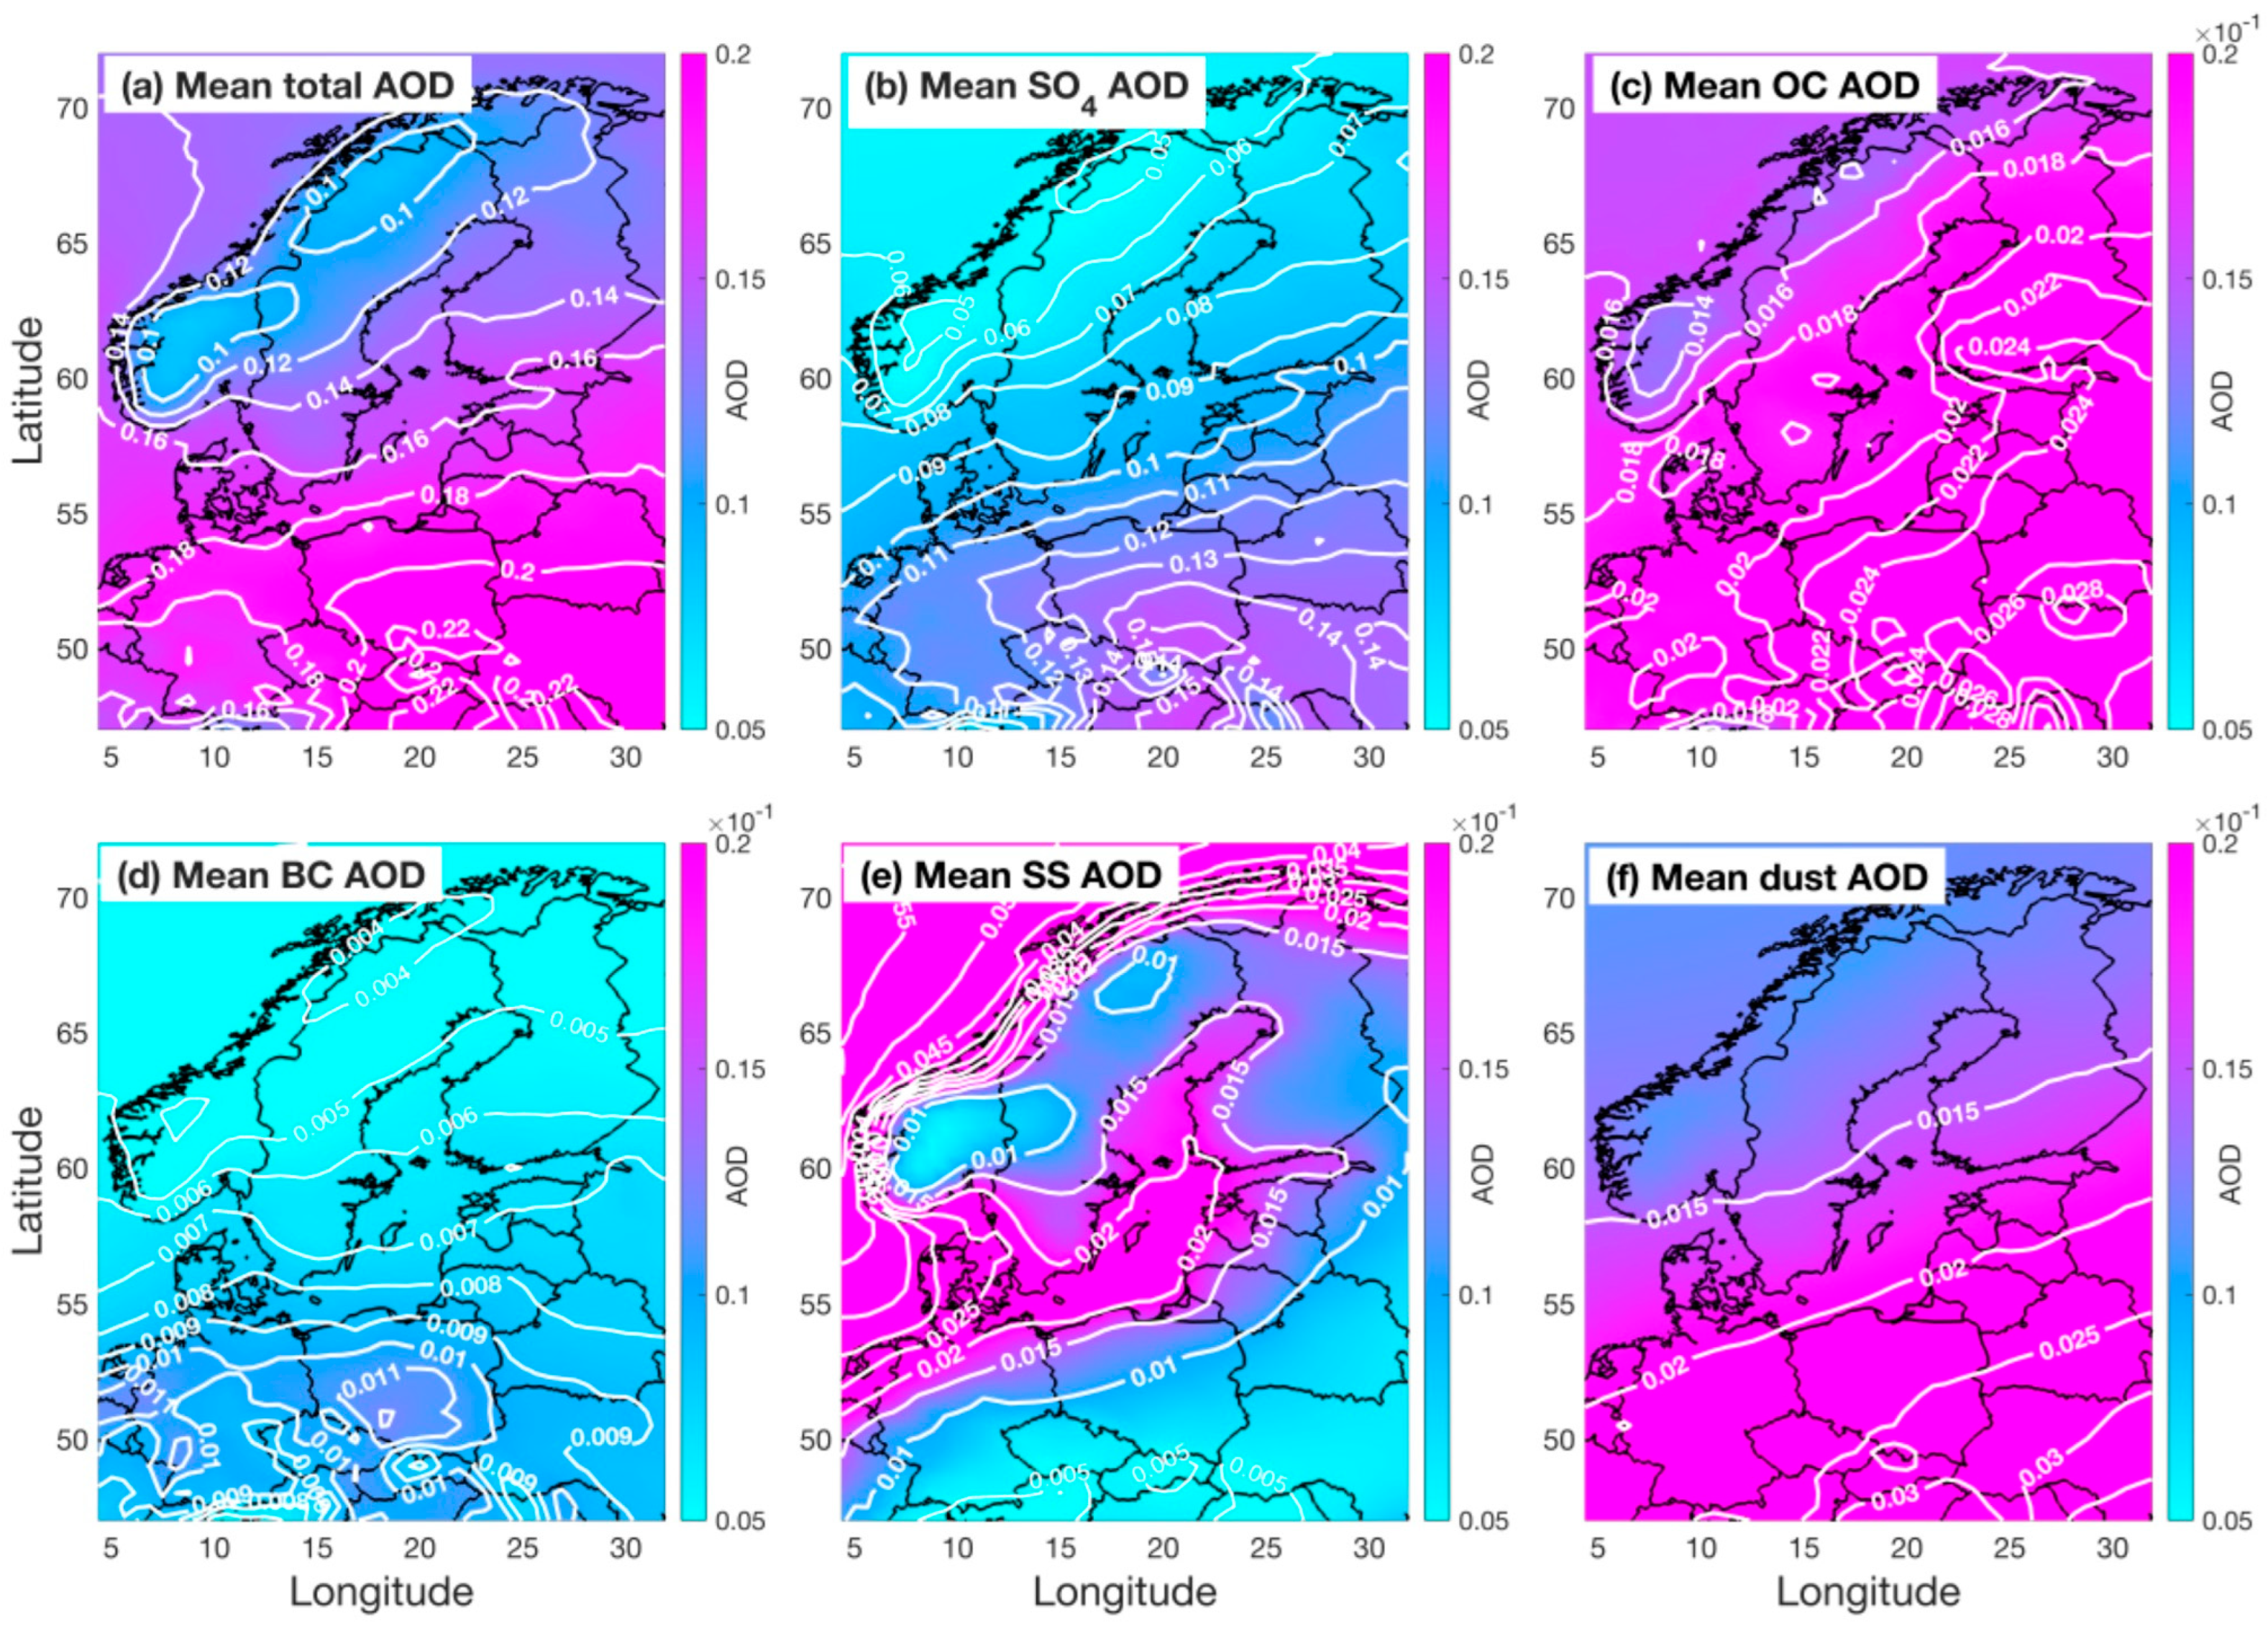


| City | Total AOD | SO4 AOD | BC AOD | OC AOD | Dust AOD | SS AOD |
|---|---|---|---|---|---|---|
| Berlin | 0.191 ± 0.043 (0.149–0.330) | 0.124 ± 0.046 (0.085–0.280) | 0.010 ± 0.001 (0.008–0.012) | 0.021 ± 0.004 (0.013–0.030) | 0.021 ± 0.005 (0.013–0.033) | 0.014 ± 0.002 (0.011–0.018) |
| Copenhagen | 0.174 ± 0.039 (0.135–0.303) | 0.104 ± 0.042 (0.069–0.248) | 0.008 ± 0.001 (0.006–0.010) | 0.019 ± 0.004 (0.012–0.026) | 0.018 ± 0.004 (0.011–0.026) | 0.024 ± 0.003 (0.019–0.031) |
| Helsinki | 0.164 ± 0.048 (0.121–0.312) | 0.098 ± 0.043 (0.060–0.252) | 0.007 ± 0.001 (0.005–0.010) | 0.024 ± 0.011 (0.012–0.063) | 0.017 ± 0.004 (0.010–0.024) | 0.018 ± 0.002 (0.014–0.023) |
| Oslo | 0.125 ± 0.034 (0.095–0.259) | 0.076 ± 0.036 (0.049–0.222) | 0.006 ± 0.001 (0.005–0.007) | 0.018 ± 0.004 (0.011–0.026) | 0.014 ± 0.003 (0.008–0.019) | 0.011 ± 0.002 (0.008–0.014) |
| Riga | 0.174 ± 0.048 (0.132–0.318) | 0.109 ± 0.046 (0.069–0.264) | 0.008 ± 0.001 (0.005–0.011) | 0.023 ± 0.008 (0.012–0.058) | 0.020 ± 0.004 (0.011–0.029) | 0.015 ± 0.003 (0.010–0.020) |
| Stockholm | 0.152 ± 0.039 (0.113–0.283) | 0.092 ± 0.040 (0.054–0.236) | 0.006 ± 0.001 (0.005–0.008) | 0.019 ± 0.004 (0.012–0.027) | 0.016 ± 0.003 (0.009–0.022) | 0.019 ± 0.002 (0.014–0.022) |
| Tallinn | 0.159 ± 0.047 (0.117–0.306) | 0.096 ± 0.044 (0.059–0.252) | 0.007 ± 0.001 (0.005–0.009) | 0.022 ± 0.008 (0.012–0.049) | 0.018 ± 0.004 (0.010–0.025) | 0.016 ± 0.002 (0.012–0.020) |
| Vilnius | 0.190 ± 0.049 (0.152–0.336) | 0.125 ± 0.049 (0.084–0.285) | 0.008 ± 0.001 (0.006–0.011) | 0.024 ± 0.007 (0.013–0.044) | 0.023 ± 0.005 (0.013–0.032) | 0.010 ± 0.002 (0.007–0.014) |
| Warsaw | 0.216 ± 0.049 (0.169–0.354) | 0.145 ± 0.051 (0.103–0.299) | 0.011 ± 0.001 (0.008–0.014) | 0.026 ± 0.005 (0.016–0.037) | 0.025 ± 0.006 (0.014–0.037) | 0.009 ± 0.001 (0.006–0.011) |
| City | SO4 [%] | BC [%] | OC [%] | Dust [%] | SS [%] |
|---|---|---|---|---|---|
| Berlin | 63.8 (55.0–84.8) | 5.7 (2.7–7.2) | 11.5 (4.4–17.8) | 11.7 (3.9–17.5) | 7.4 (4.2–10.1) |
| Copenhagen | 58.2 (47.5–81.9) | 5.0 (2.3–6.3) | 11.6 (4.1–17.3) | 10.9 (3.6–15.8) | 14.3 (8.1–20.3) |
| Helsinki | 58.1 (48.4–80.7) | 4.5 (2.3–5.6) | 14.5 (7.1–26.8) | 11.2 (3.2–16.5) | 11.7 (6.6–18.1) |
| Oslo | 59.1 (48.8–85.8) | 5.0 (2.1–6.4) | 15.0 (4.7–22.7) | 11.6 (3.3–16.2) | 9.2 (4.1–13.1) |
| Riga | 60.6 (51.0–83.1) | 4.5 (2.3–5.7) | 13.8 (5.6–23.2) | 12.1 (3.5–16.9) | 9.0 (4.8–13.5) |
| Stockholm | 58.7 (48.0–83.5) | 4.5 (2.1–5.7) | 13.2 (4.7–19.0) | 10.9 (3.2–15.0) | 12.7 (6.5–17.0) |
| Tallinn | 58.9 (48.9–82.3) | 4.5 (2.3–5.8) | 14.3 (6.2–22.4) | 11.8 (3.4–16.8) | 10.5 (5.9–16.3) |
| Vilnius | 64.0 (53.7–84.9) | 4.6 (2.3–5.9) | 13.3 (5.3–20.5) | 12.6 (3.9–18.1) | 5.5 (2.9–8.5) |
| Warsaw | 65.8 (57.1–84.6) | 5.4 (2.8–6.9) | 12.4 (5.6–18.1) | 12.1 (4.0–18.6) | 4.2 (2.4–6.1) |
Disclaimer/Publisher’s Note: The statements, opinions and data contained in all publications are solely those of the individual author(s) and contributor(s) and not of MDPI and/or the editor(s). MDPI and/or the editor(s) disclaim responsibility for any injury to people or property resulting from any ideas, methods, instructions or products referred to in the content. |
© 2024 by the authors. Licensee MDPI, Basel, Switzerland. This article is an open access article distributed under the terms and conditions of the Creative Commons Attribution (CC BY) license (https://creativecommons.org/licenses/by/4.0/).
Share and Cite
Mancinelli, E.; Passerini, G.; Virgili, S.; Rizza, U. Multi-Decadal Trends in Aerosol Optical Depth of the Main Aerosol Species Based on MERRA-2 Reanalysis: A Case Study in the Baltic Sea Basin. Remote Sens. 2024, 16, 2421. https://doi.org/10.3390/rs16132421
Mancinelli E, Passerini G, Virgili S, Rizza U. Multi-Decadal Trends in Aerosol Optical Depth of the Main Aerosol Species Based on MERRA-2 Reanalysis: A Case Study in the Baltic Sea Basin. Remote Sensing. 2024; 16(13):2421. https://doi.org/10.3390/rs16132421
Chicago/Turabian StyleMancinelli, Enrico, Giorgio Passerini, Simone Virgili, and Umberto Rizza. 2024. "Multi-Decadal Trends in Aerosol Optical Depth of the Main Aerosol Species Based on MERRA-2 Reanalysis: A Case Study in the Baltic Sea Basin" Remote Sensing 16, no. 13: 2421. https://doi.org/10.3390/rs16132421
APA StyleMancinelli, E., Passerini, G., Virgili, S., & Rizza, U. (2024). Multi-Decadal Trends in Aerosol Optical Depth of the Main Aerosol Species Based on MERRA-2 Reanalysis: A Case Study in the Baltic Sea Basin. Remote Sensing, 16(13), 2421. https://doi.org/10.3390/rs16132421


