Abstract
This study assessed the impacts of the land use/cover (LULC) and climate changes on the runoff and sediment flows in the Megech watershed. The Geospatial Water Erosion Prediction Project (GeoWEPP) was used to assess LULC and climate changes’ impact on runoff, soil loss, and sediment yield. The QGIS 2.16.3 plugin module for land use change evaluation (MOLUSCE) tool with the cellular automata artificial neural network (CA-ANN) was used for LULC prediction based on historical data and exploratory maps. Two commonly used representative concentration pathways (RCPs)—4.5 and 8.5—were used for climate projection in the 2030s, 2050s, and 2070s. The LULC prediction analysis showed an expansion of cropland and settlement areas, with the reduction in the forest and rangelands. The climate projections indicated an increase in maximum temperatures and altered precipitation patterns, particularly with increased wet months and reduced dry periods. The average annual soil loss and sediment yield rates were estimated to increase under both the RCP4.5 and RCP8.5 climate scenarios, with a more noticeable increase under RCP8.5. By integrating DEM, soil, land use, and climate data, we evaluated runoff, soil loss, and sediment yield changes on only land use/cover, only climate, and the combined impacts in the watershed. The results revealed that, under all combined scenarios, the sediment yield in the Megech Reservoir was projected to substantially increase by 23.28–41.01%, showing a potential loss of reservoir capacity. This study recommends strong climate adaptation and mitigation measures to alleviate the impact on land and water resources. It is possible to lessen the combined impacts of climate and LULC change through implementing best-management practices and adaptation strategies for the identified scenarios.
1. Introduction
Soil erosion is a natural process that has many impacts throughout the world, and its rate is influenced by many factors. Climate change and land use/cover are considered the two most influential factors that accelerate soil erosion and increase the rates of sediment flow to reservoirs [1,2,3] and affect the overall hydrology of a watershed [4]. Climate change and land use/cover interact with each other, and their combined impacts disturb biodiversity [5,6] and the hydrology of the watershed [6].
Globally, land use/cover (LULC) has altered dramatically because of anthropogenic activities and population growth [7,8], which have increased watershed soil loss, sediment yield, and runoff flow [9]. Soil erosion rates are frequently impacted by land use change, and it has been found that the least developed nations, primarily those found in sub-Saharan Africa, are experiencing a faster pace of increase [10]. In Ethiopia, more than 80% of the population depends on agriculture and lives in the highlands of the country [11,12], which contributes to land dynamism. Studies in Ethiopia have also explored whether the severity of soil erosion has increased due to the expansion of cultivated lands [13,14]. This expansion has occurred at the expense of forests, shrubs, and grazing lands [15,16], which are facilitated by deforestation. For example, Tewabe and Fentahun [17] reported that agricultural and residential lands increased by 13% and 9.1%, respectively, in the last 30 years, with diminishing forest, bush land, and grassland in the Lake Tana Basin. Although the Ethiopian government has been implementing an afforestation initiative for the past ten years, it has not been very successful in bringing about positive changes [18].
As various studies indicate, landscape changes, including land use/cover alterations, are one of the major factors for variations in water and sediment fluxes in watersheds. Understanding the land use/cover changes and predictions can benefit the sediment and water transport studies. Results of such studies can be useful in watershed management planning and intervention measures. Similarly, climate change is responsible for changes in precipitation regime changes as well as for increased air temperatures, which can directly change the hydrologic cycle negatively by increasing the rainfall volume, variability, and intensity. These changes can increase sediment production and transport to receiving water bodies. Berihun et al. [19] reported that population growth and related changes in farming demand are considered major drivers of LULC changes in the Upper Blue Nile Basin. Another major driver of LULC change is the increase in built-up areas due to the expansion of urbanization [20], which impacts the hydrology of the watershed. The LULC changes, for any reason, increased the sediment yields of the watershed through onsite and offsite effluence [21,22,23]. Negese [9] reported that LULC changes and impact studies provide little information on Ethiopian watersheds and in their focus on past land use changes, little attention has been paid to future prediction and planning.
Climate change has had an impact on natural and human systems on all continents in recent years. It is triggered by human activities and is one of the main driving forces for increases in flooding and drought, loss of productive soils and sediment yield, and related pollution. Globally, future climate projections are increasing soil erosion rates [24], sediment yield, deposition, and distribution in watersheds [25]. However, the degree to which climate change impacts the hydrology and soil erosion of a watershed depends on the scenario selected [26]. An increase in precipitation amounts and intensity is expected to impact soil erosion and sediment production in watersheds [25,27,28]. Previous studies on climate change impact assessments used different downscaling methods and models available in the Coupled Model of Inter-comparison Projects (CMIP5) World Climate database. Climate change studies in the Upper Blue Nile River Basin (UBNRB) showed a projected increase in rainfall intensity and maximum and minimum temperatures, while they reported a decrease in annual rainfall depth and river flow [29,30] and an increase in flood and erosivity factors that led to accelerated soil loss and sediment yield [27,31,32]. Moreover, some climate change impact studies have indicated that soil erosion will increase under all RCPs in croplands, with more changes under RCP8.5 [32,33]. According to [24,33], soil erosion under climate change is increasing in Europe and Asia, but in Africa, only a few studies are available.
Climate change studies in the Upper Blue Nile Basin of Ethiopia revealed increases in temperature and precipitation in the rainy season and in runoff in the future due to climate change [34,35]. However, according to Mengistu et al. [36], an increase in surface runoff does not mean an increase in total water yield; rather, the water yield in the basin declines due to climate change under different climate scenarios.
Climate change studies have also shown temperature increases from 0.3 to 0.7 °C. Precipitation and temperature will increase in the future in East Africa under the RCP4.5 and RCP8.5 climate scenarios of the CMIP5 model domain, with a greater relative change under RCP8.5 [37]. Several studies in the Blue Nile Basin (BNB), based on the review by Gelete et al. [38], showed that hydrology will be highly affected in the future by climate change, with a more adverse impact on soil erosion. The authors of [39] concluded that the annual average rainfall will increase in the 2020s, 2050s, and 2080s using RCPs in East Africa. Conversely, Getachew and Manjunatha [40] reported that precipitation did not show a clear trend in the Lake Tana Basin and could be described as either increasing at some stations or decreasing at others.
The high rate of soil erosion in the Lake Tana Basin poses a major problem for reservoir sedimentation and land use/cover, and climate change exacerbates this problem [41]. A modeling approach is common and important for forecasting soil erosion and runoff under future LULC and climate change conditions. Belay and Mengistu [3] reported that climate change has greater impacts on soil erosion than LULC. The combined impacts of LULC and climate change have been studied in many parts of the world, but less attention has been paid to the Megech watershed in the Upper Blue Nile, Ethiopia.
It is necessary to know how LULC and climate changes hasten soil loss and sediment yield rates for proper planning of erosion reduction and offsite sediment impact alleviation measures. The combined land use/cover and climate change studies suggested that, under various scenarios, the watershed hydrology and soil erosion would be significantly changed in the planned future time periods. The combined effects of those changes were highlighted by the studies conducted around different parts of the globe [42,43,44]. To examine the dynamics of LULC in the future scenarios, the QGIS plugin MOLUSCE for LULC change using cellular automata artificial neural network (CA-ANN) algorithms can be applied [45,46,47].
For the robustness of climate change impacts on soil erosion analysis, ensembles of five climate models are recommended [24]. Different numbers of GCM/RCM combinations have been used in climate change studies by different researchers [3,30,34,48,49,50,51]. For this specific study, combinations of GCM/RCM that were previously used in the study region (CanESM2/RCA4, EC-EARTH-RACMO22T, GFDL-ESM2M/RCA4 MPI-ESM-PI/REMO 2009, and NorESM1-M/RCA4) were used to download 0.440 X 0.440-resolution data from Coordinated Experimental (CORDEX) Africa CMIP5 data sources, downscaled and bias-corrected for impact assessment. RCP4.5 and RCP8.5 are commonly used climate emission scenarios for climate change impacts on soil erosion assessments in the Upper Blue Nile River Basin [3,27].
Therefore, the purpose of this study was to understand the impacts of land use/cover, climate change, and combined land use/cover and climate change on soil loss, sediment yield, and river flow using the process and physically based GeoWEPP model. The land use/cover and climate change under the RCP4.5 and 8.5 scenarios was conducted for the 2030s, 2050s, and 2070s timeframes. These timeframes were set by considering the shelf-life of the Megech Dam, which is 50 years. We aimed to (1) predict and detect the land use/cover changes in the study, (2) project climate change under the RCP4.5 and 8.5 climate scenarios, with the ensemble of five climate models for CORDEX Africa data, and (3) identify the impacts of land use and climate changes on soil loss, sediment yield, and runoff using the GeoWEPP soil erosion model.
2. Materials and Methods
2.1. Study Area
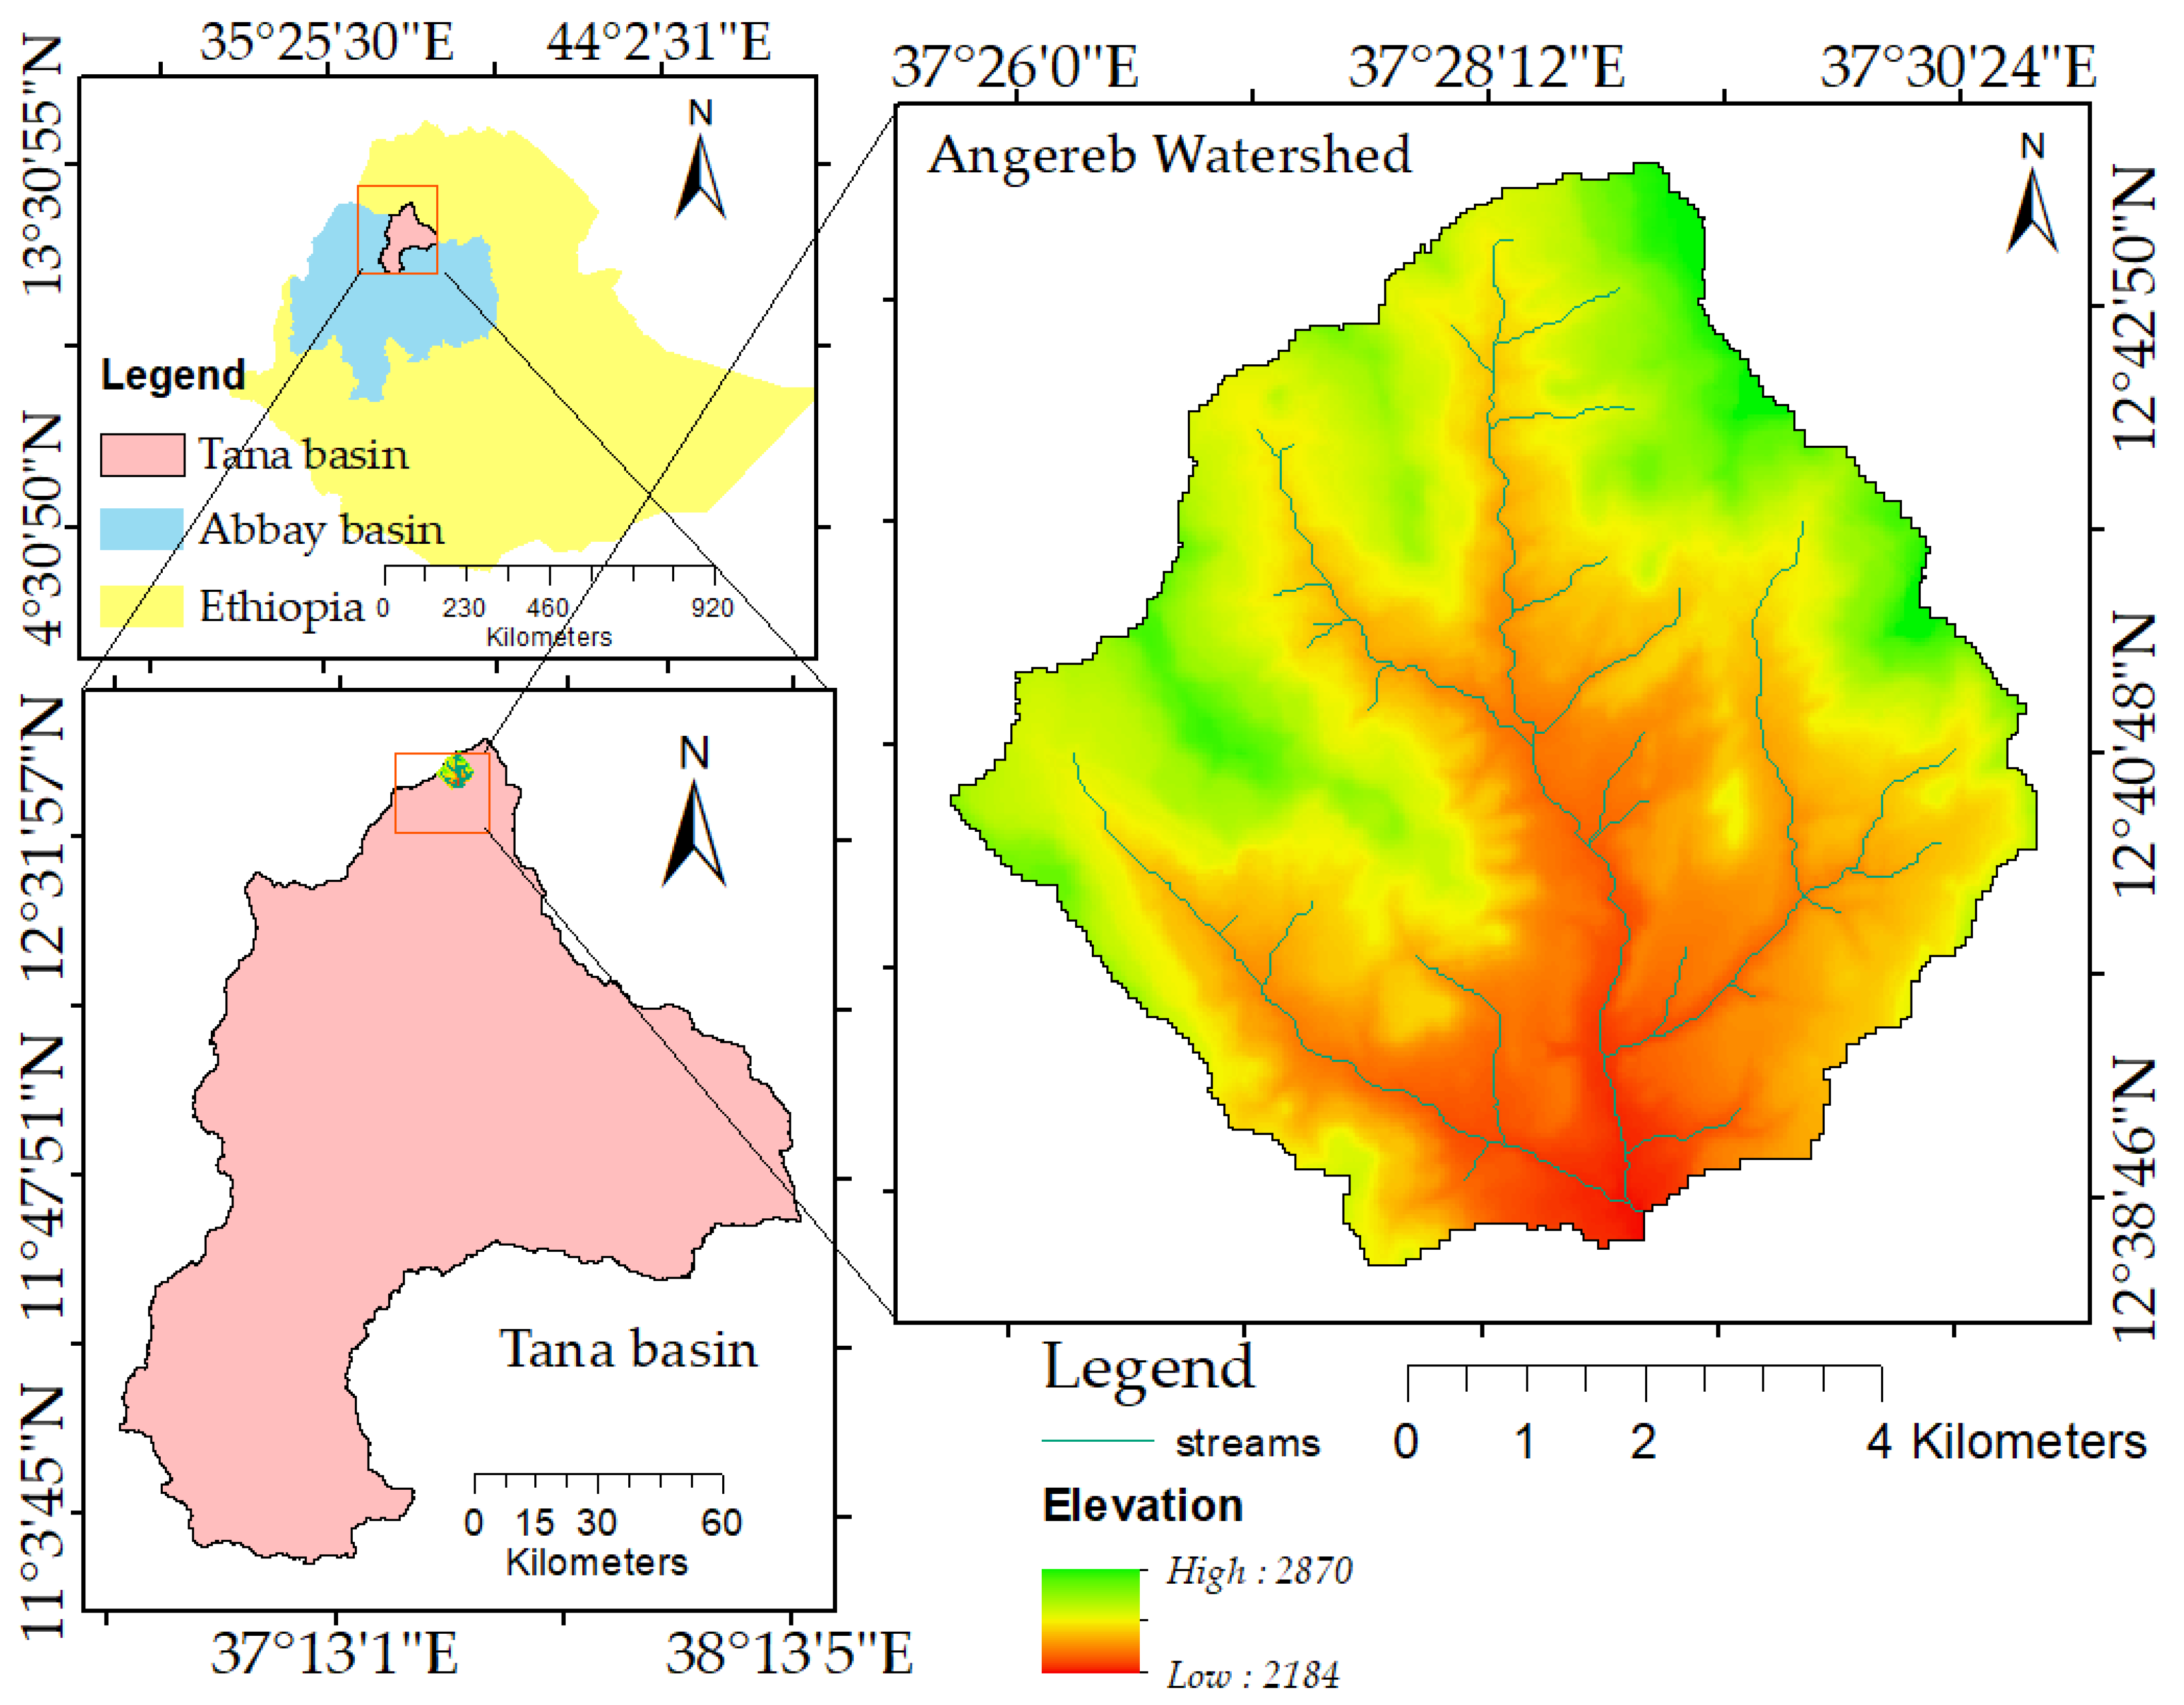
The research area watershed, named the Megech watershed, is located at 11°45′40″ and 12°44′57″N latitude and 37°24′2″ and 37°37′21″E longitude in the Upper Blue Nile Basin of the tributary of Lake Tana, the largest lake in Ethiopia (Figure 1). The Megech watershed covers 424 km2 at the dam site, with a mean annual flow of 5.6 m³/s. The watershed is characterized as a mountainous, wedge-shaped, and steeply sloping watershed. The study site has two distinctive seasons: a rainy season from May to October and a dry season that extends from November to April. The monthly rainfall varies from 67 mm in October to 306 mm in July, and the mean annual precipitation is approximately 1100 mm. The mean monthly minimum and maximum temperatures are approximately 14.16 °C and 27.63 °C, respectively. The Angereb watershed at the gauge site is located at 37°28′5″ to 37°32′56″E longitude and 12°38′26″ to 12°43′31″N latitude (WGS_1984 Lat/Long). The watershed area at the gauge site covers 49.74 km2.
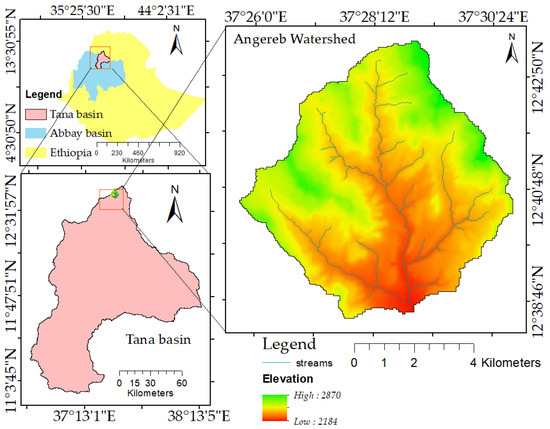
Figure 1.
Study area map.
2.2. Datasets
2.2.1. Land Use/Land Cover Data
The data used in this research were the digital elevation model (DEM), soil maps, land use/cover maps, and climate data for the baseline period. The 12.5 m high-resolution, terrain-adjusted ALOS PALSAR geotiff DEM data were downloaded from https://search.asf.alaska.edu/ (accessed on 5 January 2023) and resampled to 30 m resolution for the modeling. This high-resolution DEM is radiometric-terrain-corrected, which removes geometric and radiometric distortion and has very good vertical and horizontal accuracy. The FAO-based soil raster file was collected from the Ministry of Water and Energy (MoWE). Land use/land cover (LULC) data for the years 2012, 2017, 2019, and 2022 were collected from the Ethiopian Mapping Agency, the Water and Land Resources Centre (WLRC), and the Ministry of Water and Energy (MoWE), and more than 50% of the area was covered with cropland for all four time periods of land use data (Table 1). The land use/cover data of 2017, 2019, and 2022 gathered from those organizations were acquired from the Sentinel-2, 10 m resolution map, and ground truthing was performed to adjust the cloud cover errors, while the 2012 land use map was of 30 m resolution, sourced from the FAO catalog resourced from the Ethiopian Mapping Agency (EMA). Phiri et al. [52] stated that because Sentinel-2 data employs machine-learning classifiers, such as random forest (RF) and support vector machine (SVM), the classification accuracy is high (>80%).

Table 1.
Percent of area coverage by different land use/cover types for 2012, 2017, 2019, and 2022.
2.2.2. Climate Data
Climate data, such as precipitation and maximum and minimum temperatures for the baseline period, were collected from the Ethiopian National Meteorological Agency (NMA), and the number of wet days was calculated from daily precipitation, with a 1 mm depth as a threshold value.
The observed precipitation and maximum and minimum temperature data were collected from the National Meteorological Agency (NMA) for 28 years (1986–2014) of records for the stations in the study areas. The precipitation and temperature (maximum and minimum) climate data under the RCP4.5 and RCP8.5 climate scenarios and historical data for 1986 to 2005, with an overlap of more than 70%, were downloaded from: https://esgfdata.dkrz.de/search/esgf-dkrz/ (accessed on 20 January 2023). The model domain was AFR-44, the daily time step data resembled those of r1i1p1, and the selected experiments included historical, RCP4.5, and RCP8.5 data.
2.3. Methods
The methods employed in this study included predicting land use/cover using the QGIS2.16.3 software plugin, named the MOLUSCE, based on the cellular automata artificial neural network (CA-ANN) algorithm. Land use/cover prediction was performed for the years of 2035, 2055, and 2075 when the near, middle, and far future impact assessment of flow and sediment was performed. Then, using GCM/RCM climate models, future climatic projections were performed for the periods that were necessary to assess soil erosion and sediment output of the impact analysis. Finally, soil loss, sediment yield, and flow estimation were conducted using the GeoWEPP model. The impacts were identified by comparing the near, middle, and far future results with the baseline results for all metrics.
2.3.1. Modeling Approach
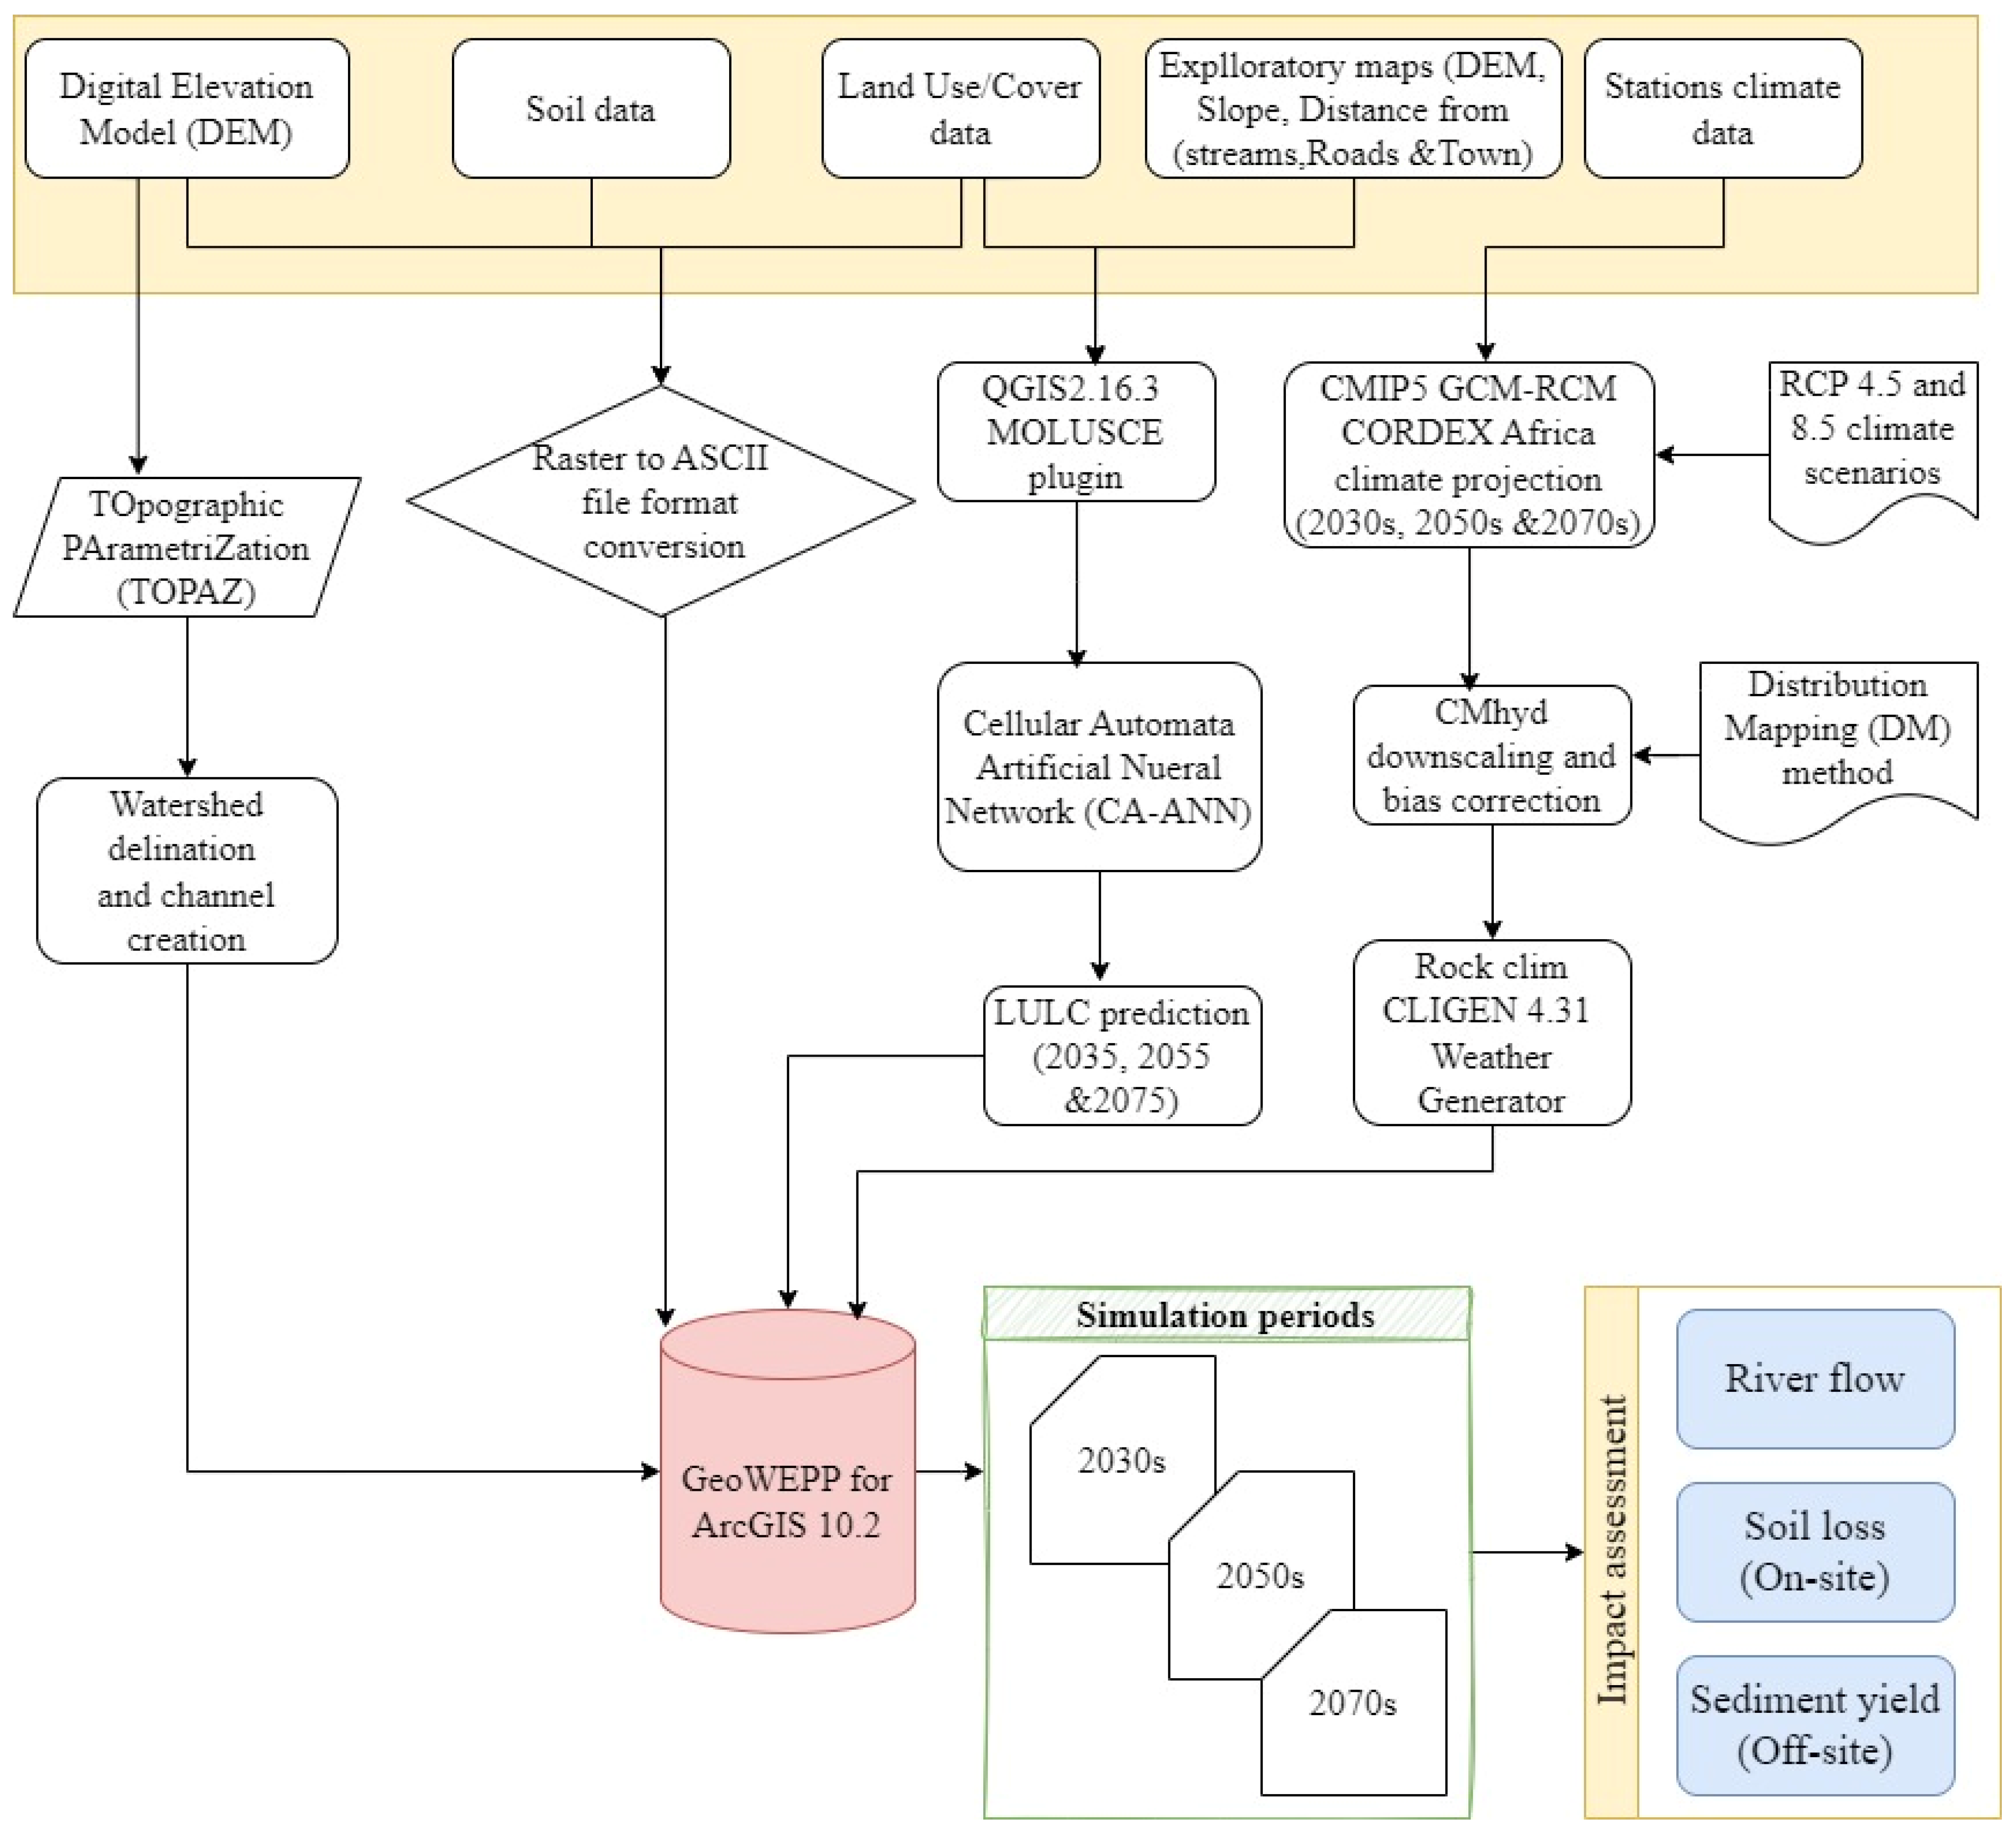
This study utilized modeling of land use/cover prediction, climate projection, soil loss, sediment yield, and runoff simulation. Changes in soil loss, sediment yield, and flow were evaluated by comparing the baseline time results with projected simulations, and impacts were identified. To do this, the data, such as climate, flow, sediment, land use/cover, soil, and road and stream networks, were collected, checked for errors, and corrected before application. The overall conceptual framework for the methods employed for this study is presented below (Figure 2).
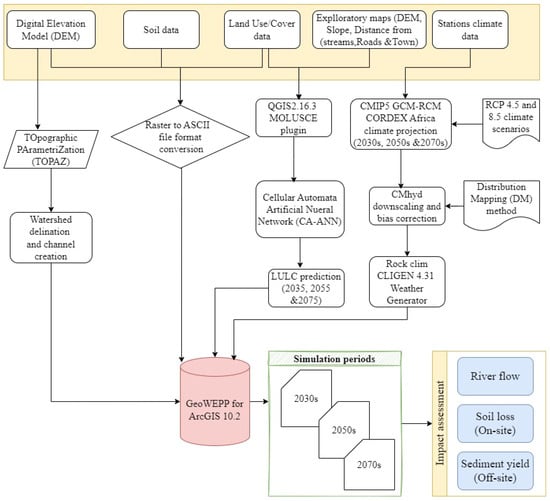
Figure 2.
Land use/cover and climate change impact framework diagram.
2.3.2. Land Use/Cover Forecasting
We employed the Quantum Geographic Information System (QGIS 2.16.3) spatial analysis software with a wide range of applications, including the plugin Modules for Land Use Change Evaluation (MOLUSCE), which provides a set of algorithms for land use change simulations, such as ANN (artificial neural network), LR (logistic regression), WoE (weight of evaluation), and multi-criteria evaluation for modeling and simulation of land use change. The MOLUSCE plugin uses either Pearson’s correlation or Cramer’s coefficient to evaluate the correlation between land use/cover and exploratory variables. After creating the correlation land use data with spatial variables, a transition matrix table was generated, land use change maps were created, and finally, the future land use map was predicted.
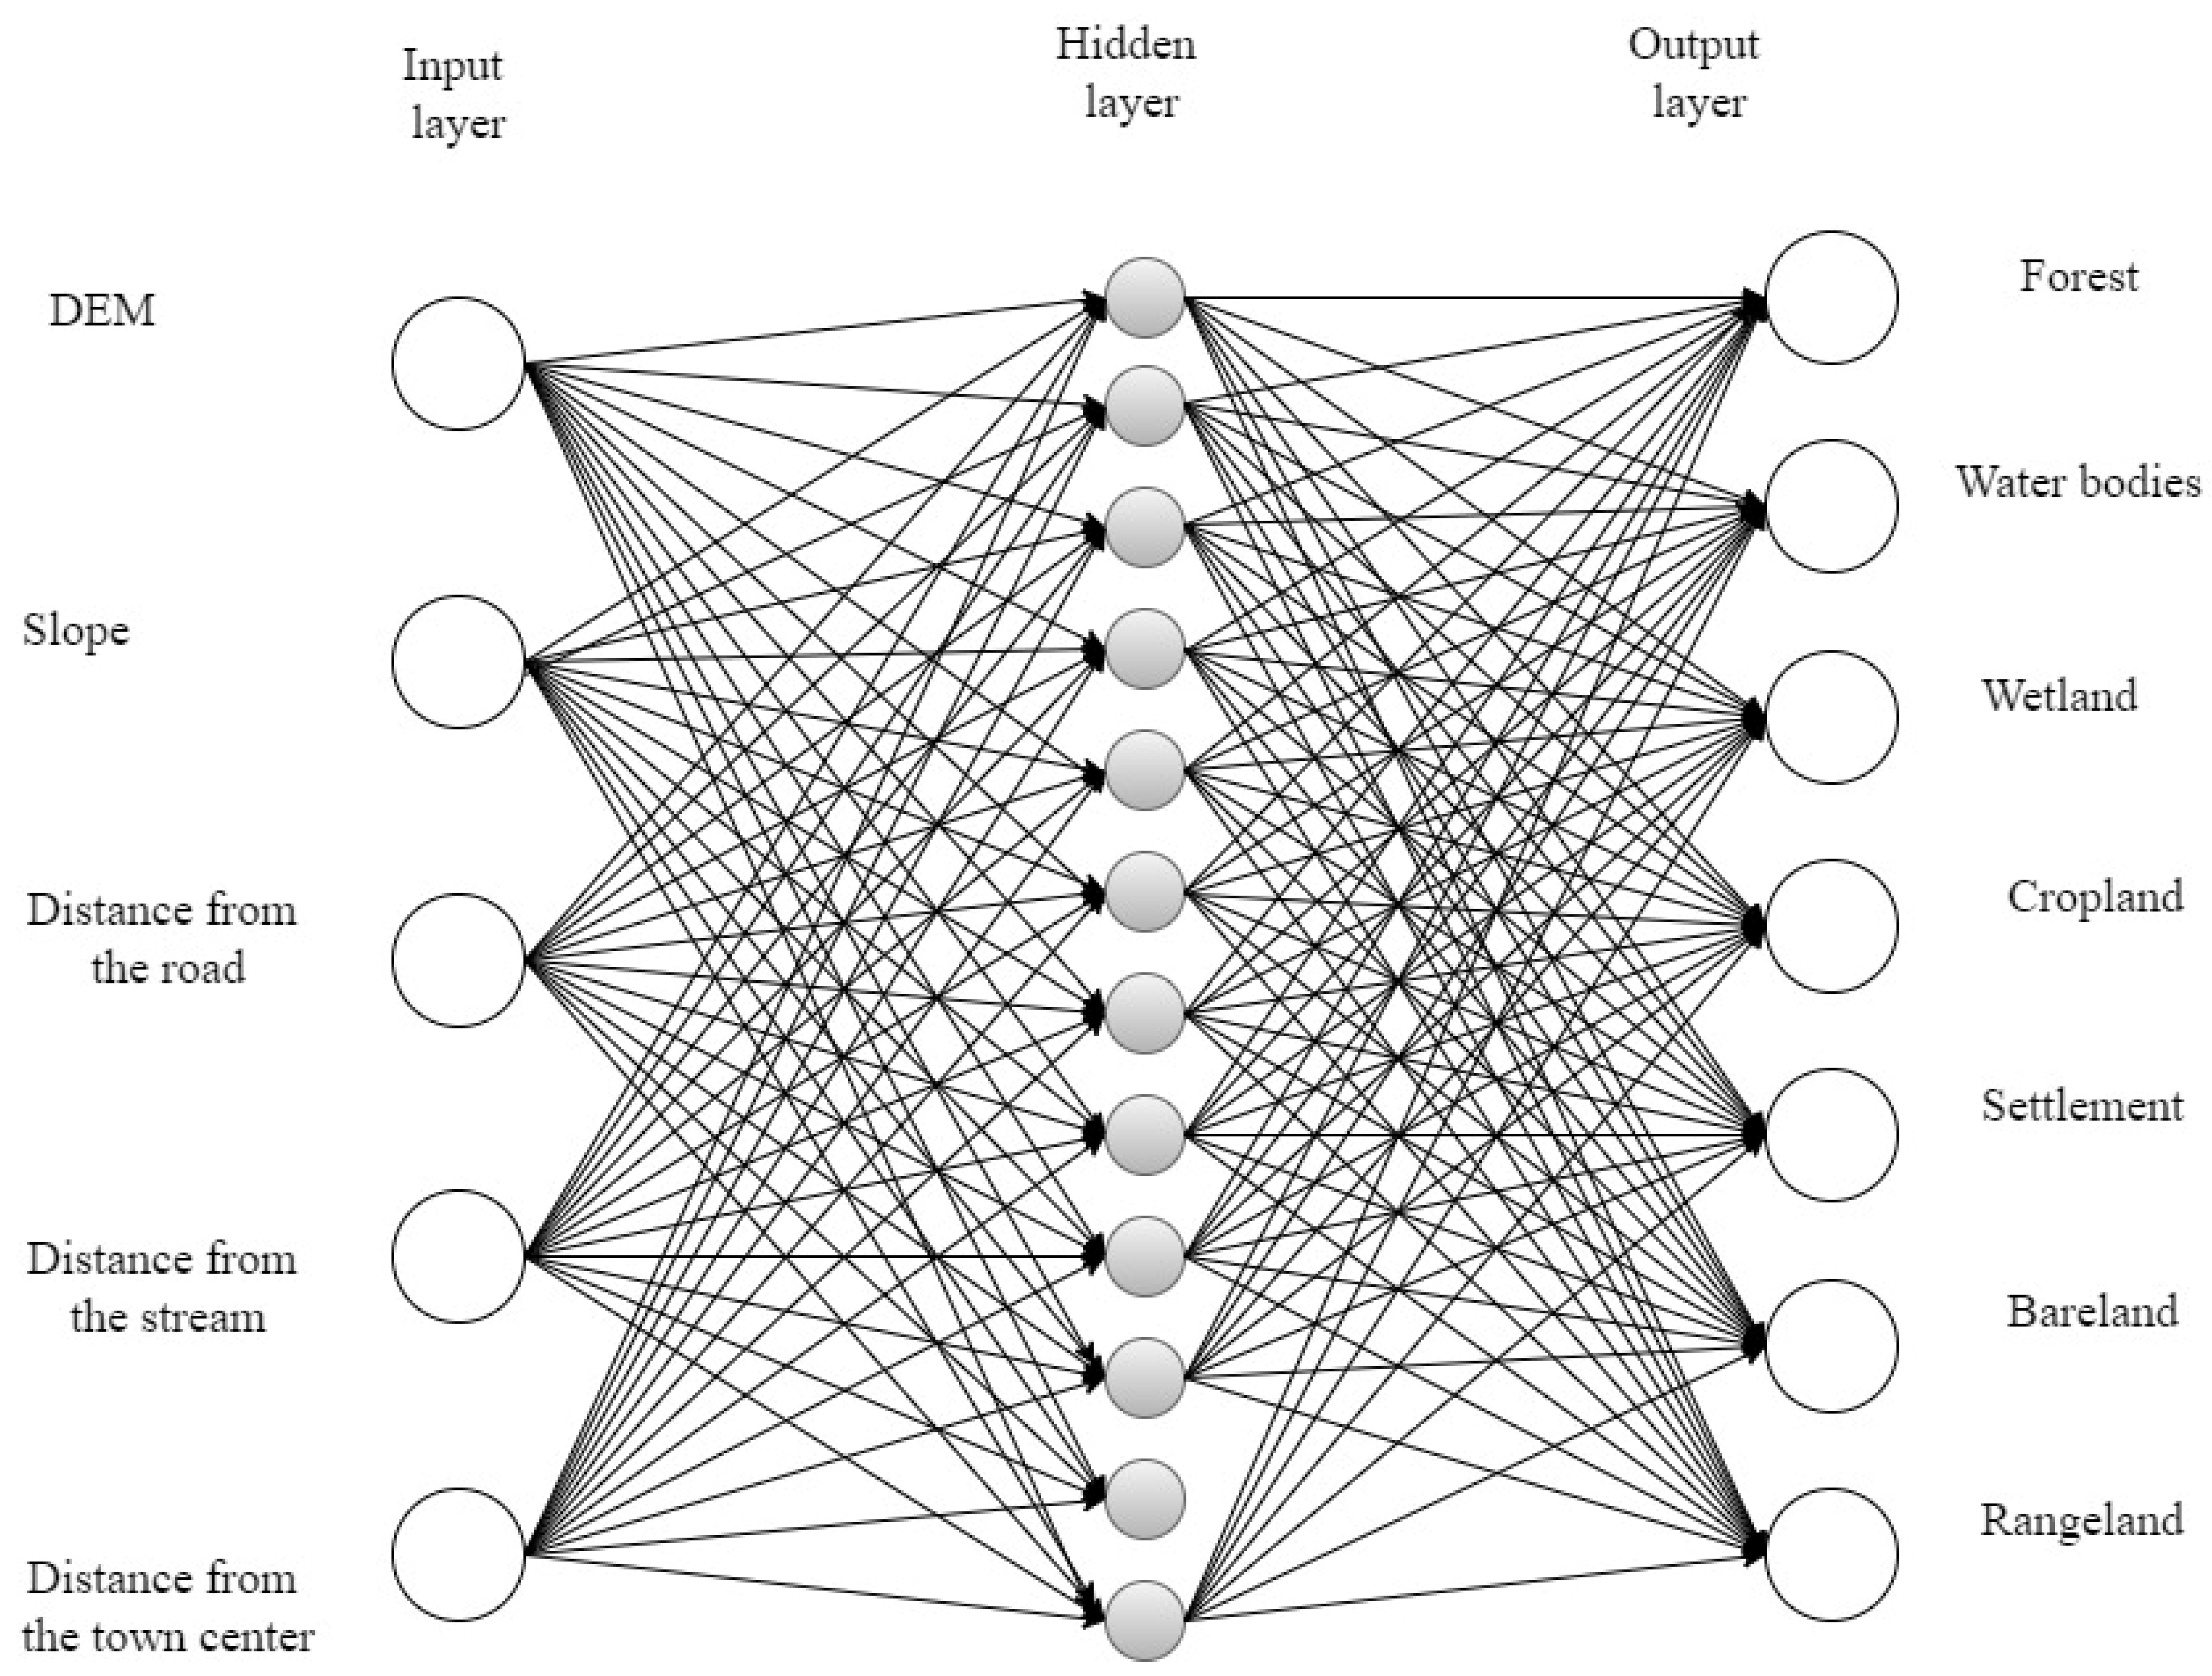
The future LULC spatial data for the 2035, 2055, and 2075 datasets were predicted using the cellular automata artificial neural network (CA-ANN) algorithm. Setting the frames of 2030s, 2050s, and 2070s was selected by considering the useful life of the Megech Dam in the research watershed. The CA-ANN algorithm was chosen because of its ability to simulate complicated land use change patterns and a range of land covers, as well as its high efficiency with minimal data and ease of calibration [7,45]. For this study, generation of the transition matrix and model validation was performed for the years 2017–2022. Then, the processes were repeated for the three timeframes to generate the future land use/cover changes. In the MLP-CA-ANN algorithm, neurons or nodes are interconnected to create a complex neural network that is composed of layers, including an input layer, hidden layers, and an output layer (Figure 3).
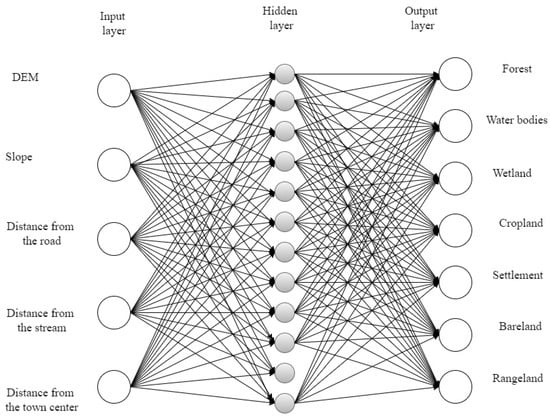
Figure 3.
Structural map of the multilayer neural network.
2.3.3. Climate Modeling
Five climate models were selected based on their appropriateness in the Upper Blue Nile Basin. The selected GCMs included CanESM2, EC-EARTH, GFDL-ESM2M, MPI-ESM-PI, and NorESM1-M. Three regional climate models (RCMs), named RCA4, REMO2009, and RACMO22T, were used from the Coordinated Regional Climate Downscaling Experiment (CORDEX), Africa. The combinations of GCM/RCM (CanESM2/RCA4, EC-EARTH/RACMO22T, GFDL-ESM2M/RCA4, MPI-ESM-PI/REMO2009, and NorESM1-M/RCA4) were considered to download daily precipitation, and maximum and minimum temperature climate variables, with a resolution of 0.440 × 440, or an approximately 50 × 50 km grid size. Note that the middle-level scenario (RCP4.5) and the worst-case scenario in terms of greenhouse gas emissions (RCP8.5), with no clear climate policy that shows a radiative forcing pathway leading to 8.5 w/m2 (greater than 1370 ppm CO2-equivalent) in 2100 [53], were used to examine the impacts of climate change on the soil erosion and sediment yield in the study area.
2.3.4. Bias Correction Method
Using the climate model for the hydrological modeling tool (CMhyd) at the station level, bias correction of the RCM simulations was carried out in this study. The distribution mapping [53] bias correction method, which can better transfer the observed precipitation and temperature statistics to the raw ensemble GCM/RCM CORDEX-Africa RCP4.5 and RCP8.5 climate scenarios, was employed. The climate model data for the hydrologic modeling (CMhyd) tool were used for future data extraction and bias correction.
2.3.5. Soil Erosion Model Description
The geospatial water erosion prediction project (GeoWEPP) model is an erosion model from the continuous simulation and process-based water erosion prediction project (WEPP) [54,55]. This model was employed as an impact model to identify the changes in flow and soil erosion due to LULC and climate change individually, as well as in combination. The GeoWEPP model was developed to integrate the advanced features of geographical information systems (GISs) within the WEPP model, such as processing digital data sources and generating digital outputs [56]. The movement of the sediment along the hill slope is described based on the steady-state sediment continuity equation, which applies flow conditions [57]:
where G is the sediment load (kg s−1 m−1), X is the distance downslope, Di is the interrill erosion rate (kg s−1 m−1), and Dr is the rill erosion rate (kg s−1 m−1):
where Ki is the adjusted interrill erodibility (kg s/m4), Ie is the effective rainfall intensity (mm/h), σir is the interrill runoff rate (mm/h), SDRRR is the interrill sediment delivery ratio, Fnozzle is the adjustment factor for the sprinkler irrigation nozzle impact energy variation, Rs is the rill spacing, and W is the width of the rill. Since there is no sprinkler irrigation in the study areas, the factor was taken as a unit:
where Kr is the adjusted soil erodibility parameter (s/m), τf is the flow shear stress (kg/m/s2), τc is the adjusted critical shear stress of the rill surface (kg/m/s2), and Tc is the sediment transport capacity of the rill flow (kg/m/s). Tc was calculated as follows:
where Ktr is a constant parameter, qw is the flow discharge per unit width (m2/s), and S is the slope (%). The GeoWEPP model can be used to capture changes in soil loss, runoff, and sediment delivery rates in watersheds caused by changes in land use/cover [58]. According to Luetzenburg et al. [59], the model is a useful tool for depicting the impacts on soil erosion, flow, and sediment delivery under climate and land use/cover change scenarios to design possible mitigation measures at the watershed level.
2.4. Scenario Development
Three future time window scenarios for the 2030s, 2050s, and 2070s were selected to identify the impacts of LULC changes and climate change on flow, soil loss, and sediment yield. These years were selected based on the life of the Megech Dam and considering time intervals for significant changes in land use and climate. Input data for the GeoWEPP model were collected from the Ministry of Water and Energy [60], Abay Basin Development [61], National Meteorological Agency (NMA), and the Water and Land Resources Center (WLRC). Based on the collected data, future LULC forecasting was performed using the CA-ANN algorithm.
Scenario 1: time window of the 2030s—only land use/cover change (climate is constant), only climate change (land use/cover is constant), and both climate and LULC changes (synchronizing both).
Scenario 2: time window of the 2050s—only land use/land cover change (climate is constant), only climate change (land use/cover is constant), and both climate and LULC changes (synchronizing both).
Scenario 3: time window of the 2070s—only land use/cover change (climate is constant), only climate change (land use/land cover is constant), and both climate and LULC changes (synchronizing both).
3. Results
3.1. Precipitation and Temperature
According to [62], the Intergovernmental Panel on Climate Change (IPCC) recently revealed that the global surface air temperature has risen considerably, by about 1.53 °C on average, for the time period of 1850–1900. In the 2050s, the warming may even increase by 2 °C (medium confidence) and 3 °C (low confidence) [62]. The projected climate data were based on five global circulation models (GCMs) (CanESM2/RCA4, EC-EARTH/RACMO22T, GFDL-ESM2M/RCA4, MPI-ESM-PI/REMO 2009, and NorESM1-M/RCA4), and downscaling and bias correction were performed using the distribution mapping [53] algorithm method for the RCP4.5 and RCP8.5 scenarios at representative stations. In Megech watershed, the average increases in maximum temperature in the 2050s were 1.94 °C and 2.63 °C for the RCP4.5 and RCP8.5, respectively. In this study, a maximum of 5.80 °C temperature change was identified for the far future time period for the worst-case scenario. The multi-model ensemble average of the downscaled and bias-corrected future climate data from five climate models was used to feed the RockClime (CLIGEN4.31) stochastic weather generator model to produce a climate PAR file, which was used as climate input for the GeoWEPP impact assessment erosion model.
3.2. Climate Change
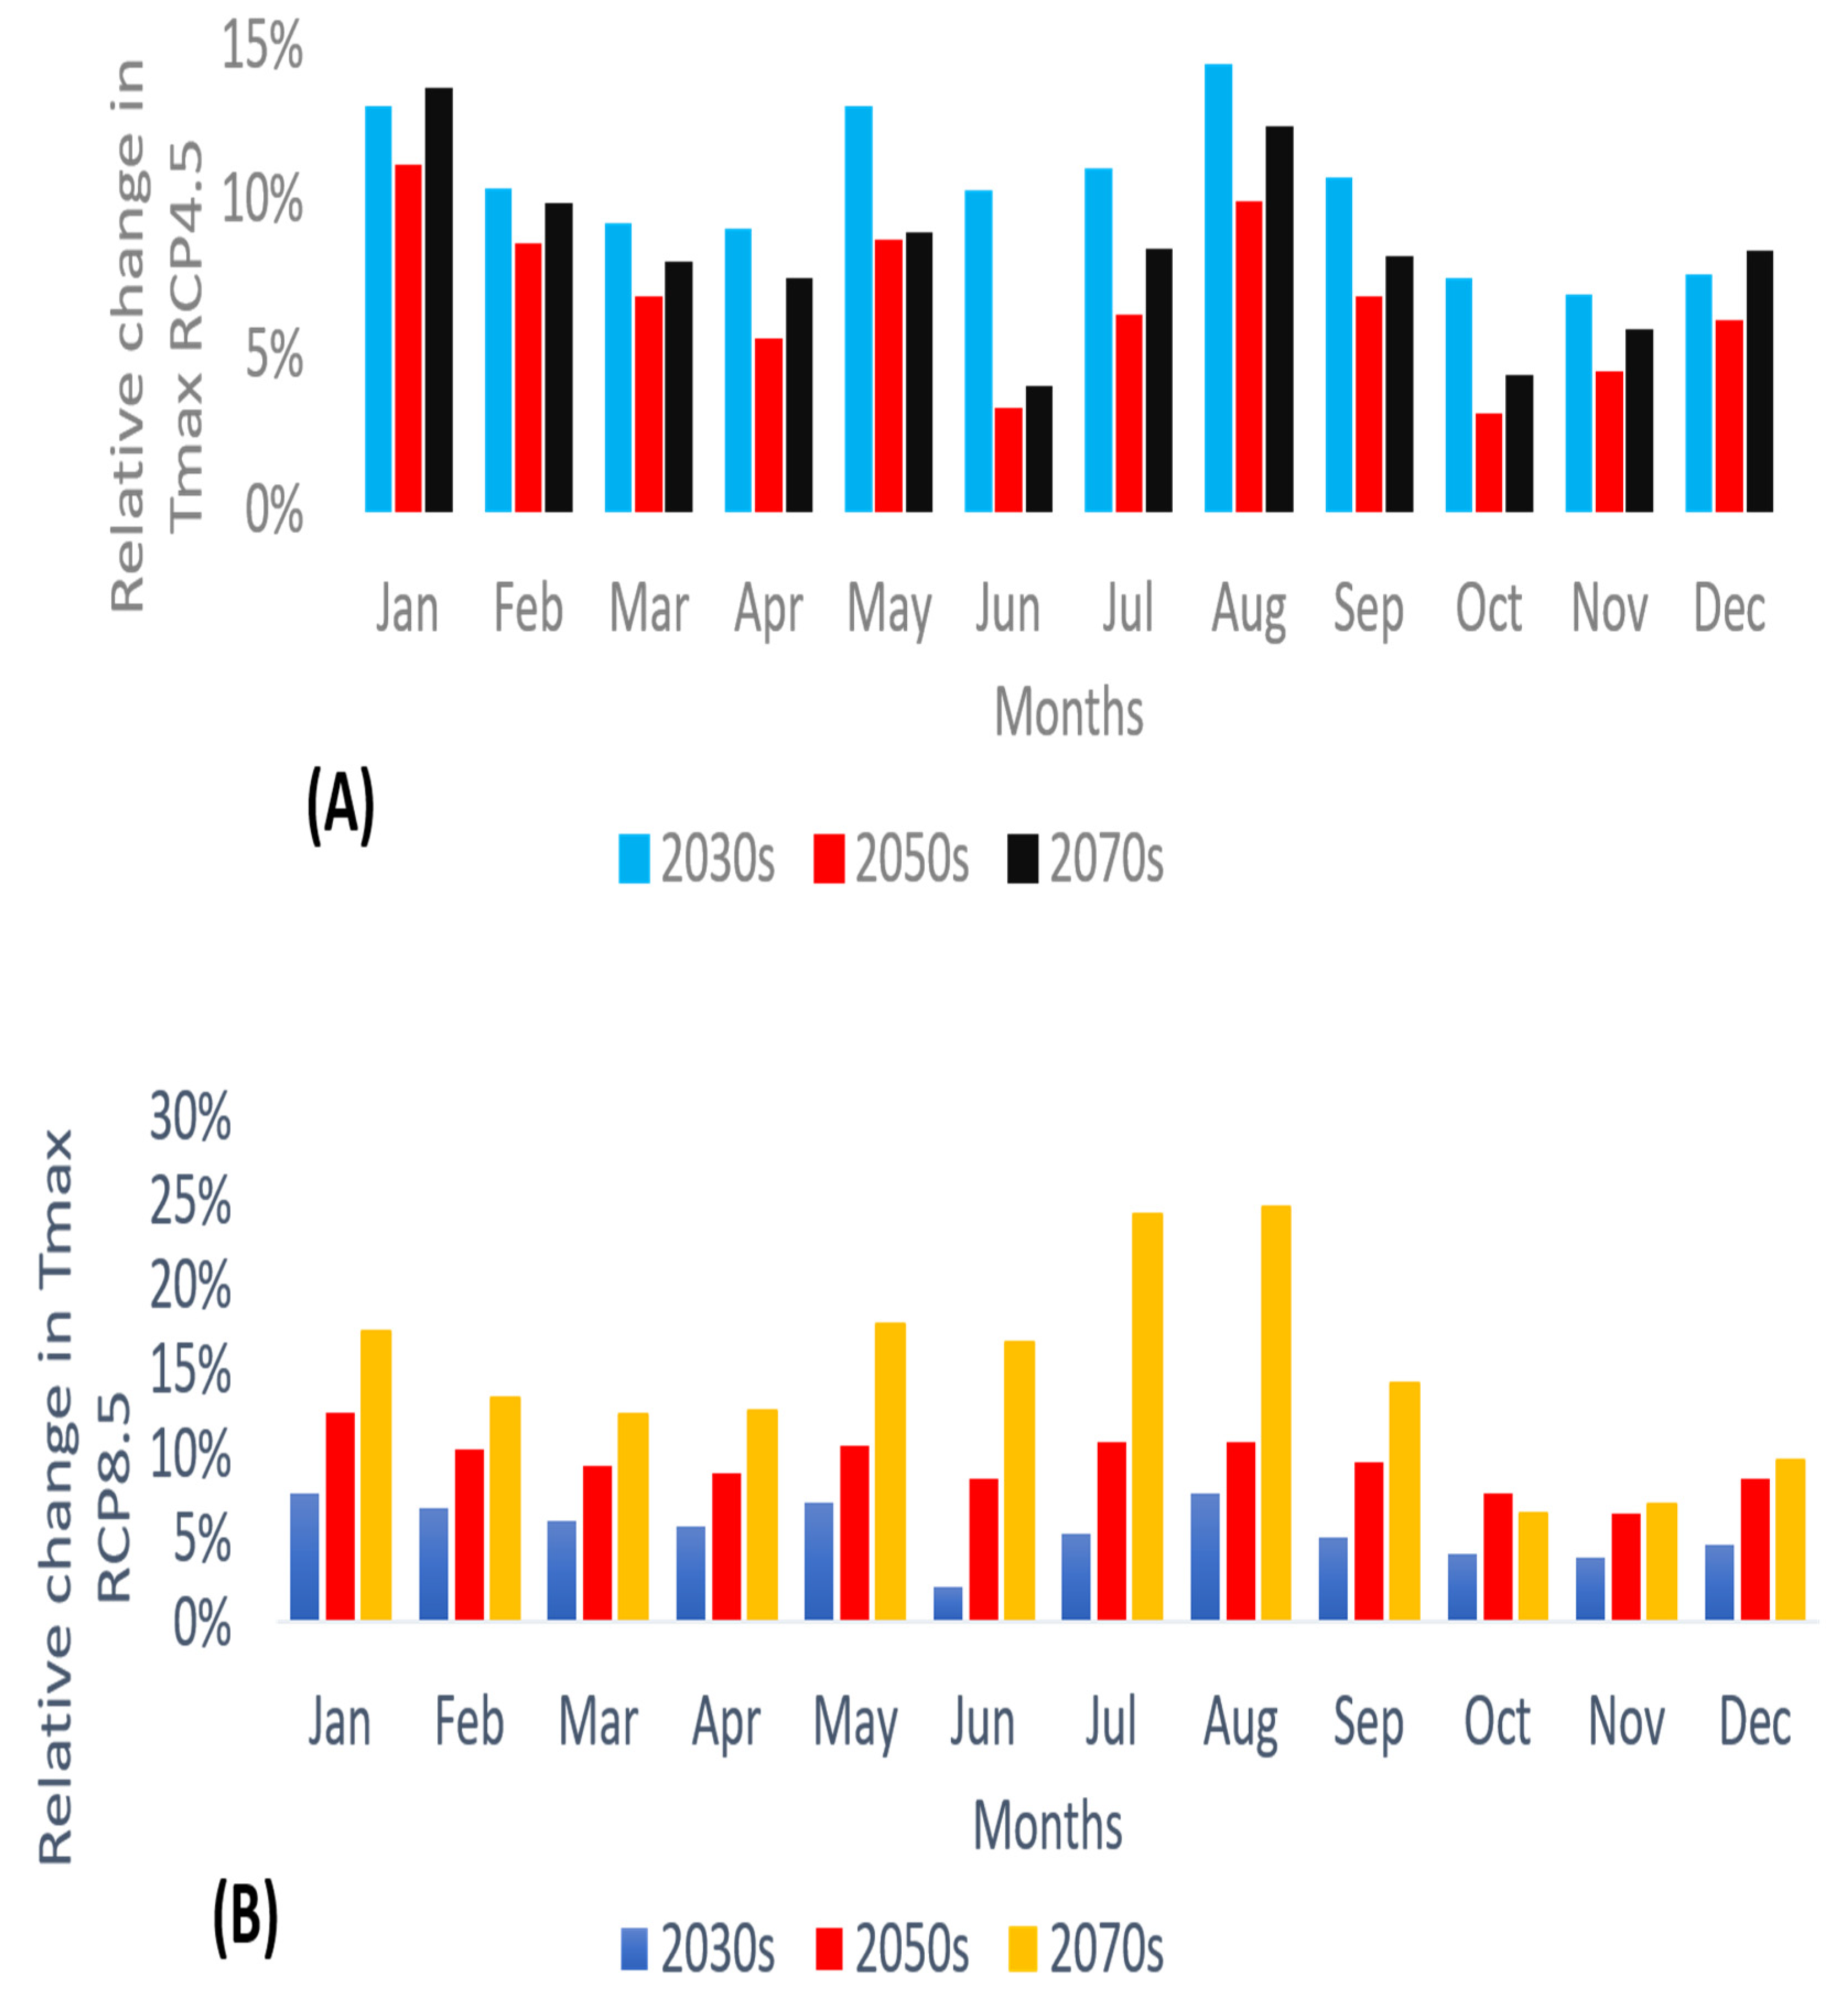
The projected ensemble maximum temperatures under the RCP4.5 climate scenario for the 2030s, 2050s, and 2070s timeframes increased from 1.860 °C to 3.720 °C, 0.80 °C to 3.08 °C, and 0.90 °C to 3.89 °C, respectively. For the RCP8.5 scenario, the maximum temperatures increased for all months, with ranges of 0.45 °C to 2.15 °C, 1.78 °C to 3.48 °C, and 1.71 °C to 5.80 °C for the 2030s, 2050s, and 2070s, respectively. The relative percentage change in maximum temperature for RCP4.5 compared with the baseline climate varied from 6.79 to 14.28%, 3 to 11.01%, and 3.85 to 13.52% for the 2030s, 2050s, and 2070s, respectively. For the RCP8.5 climate scenario, relative percentage increases of 3.80–7.70%, 6.48–12.42%, and 6.98–24.57% were observed for the 2030s, 2050s, and 2070s, respectively (Figure 4A,B).
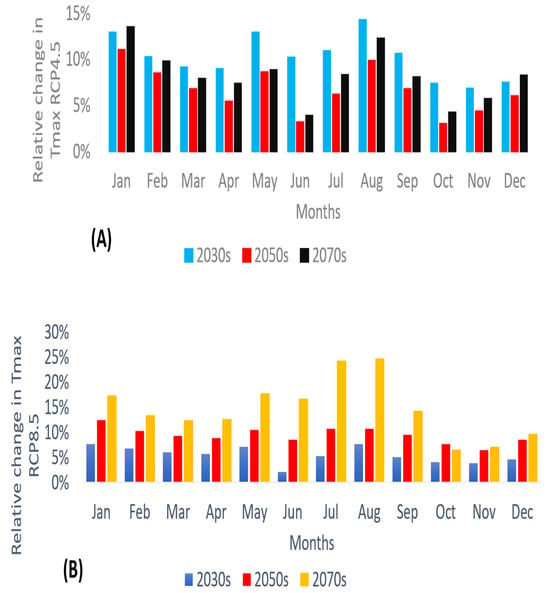
Figure 4.
Future seasonal maximum temperature changes under the (A) RCP4.5 and (B) RCP8.5 scenarios.
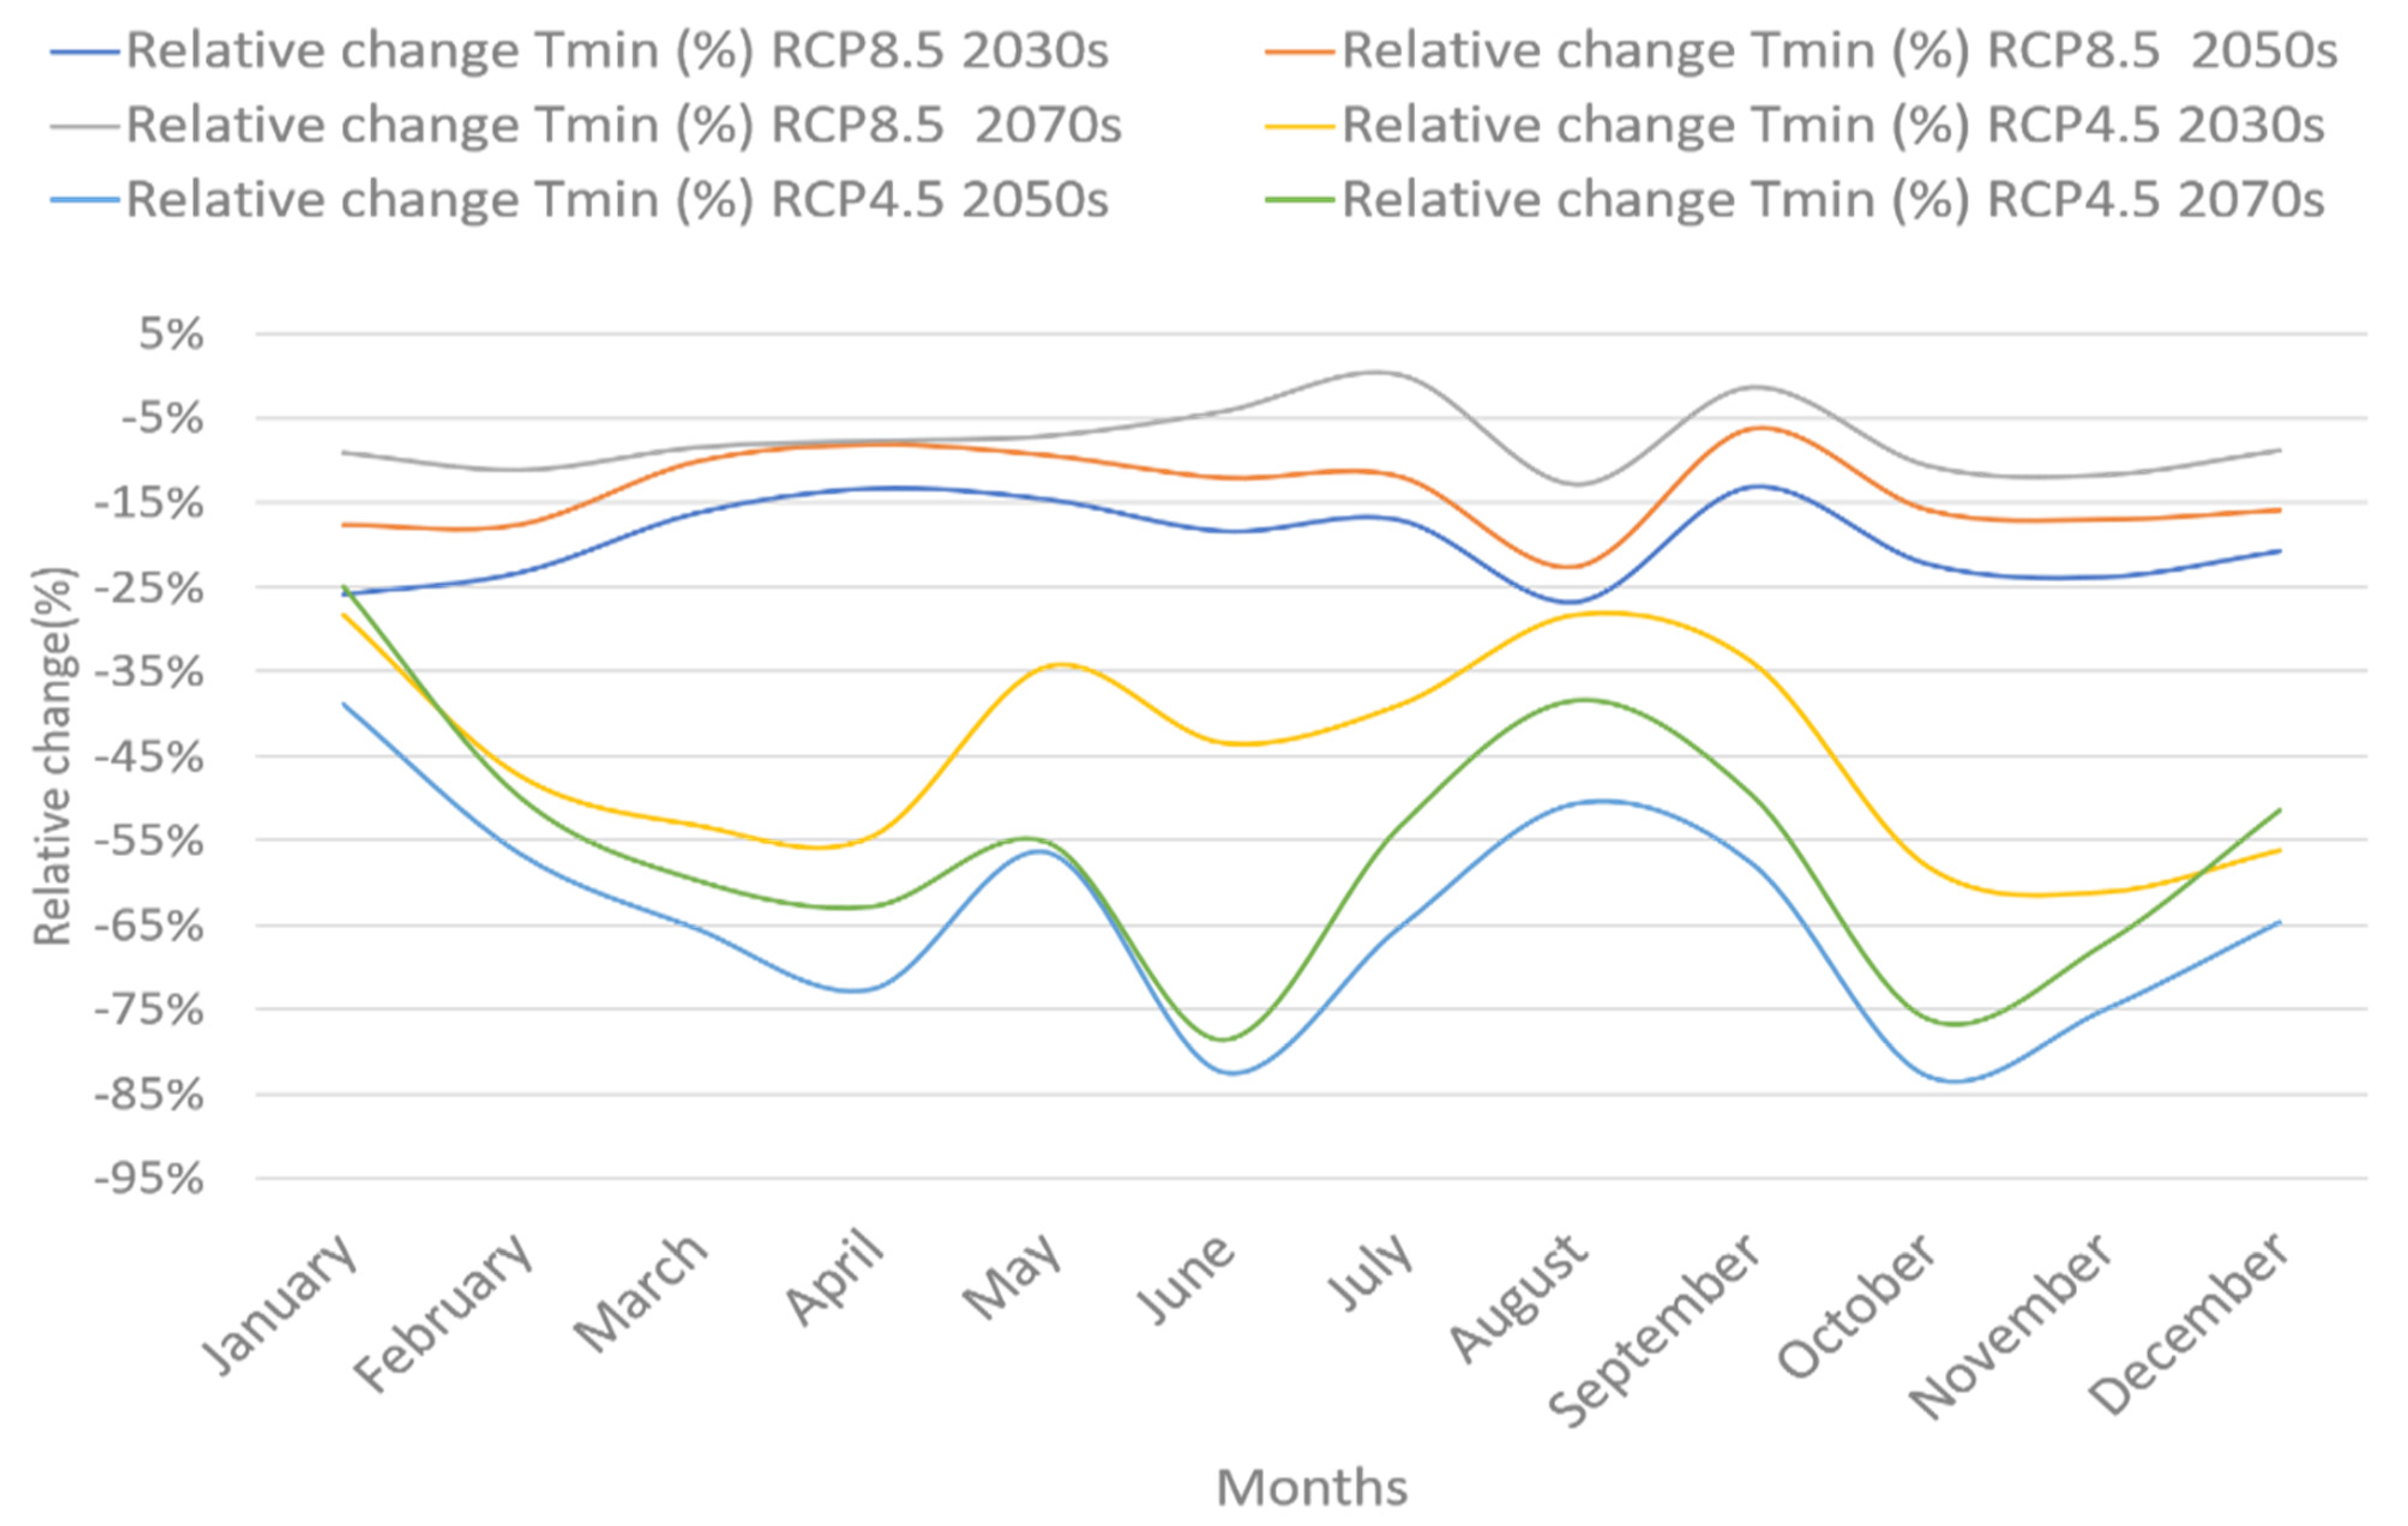
The relative changes in the minimum temperature showed that forecasted monthly values decreased for the 2030s, 2050s, and 2070s compared to the base period for all RCP4.5 and RCP8.5 climate scenarios (Figure 5).
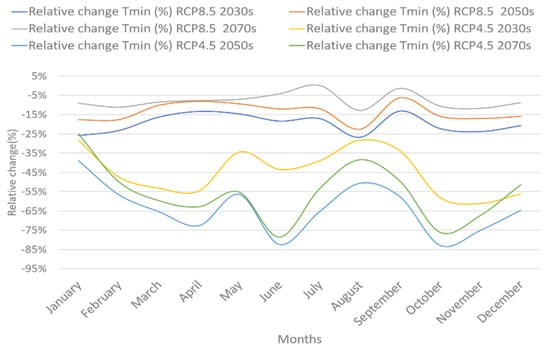
Figure 5.
Relative changes in minimum temperature for the 2030s, 2050s, and 2070s for both the RCP4.5 and RCP8.5 scenarios.
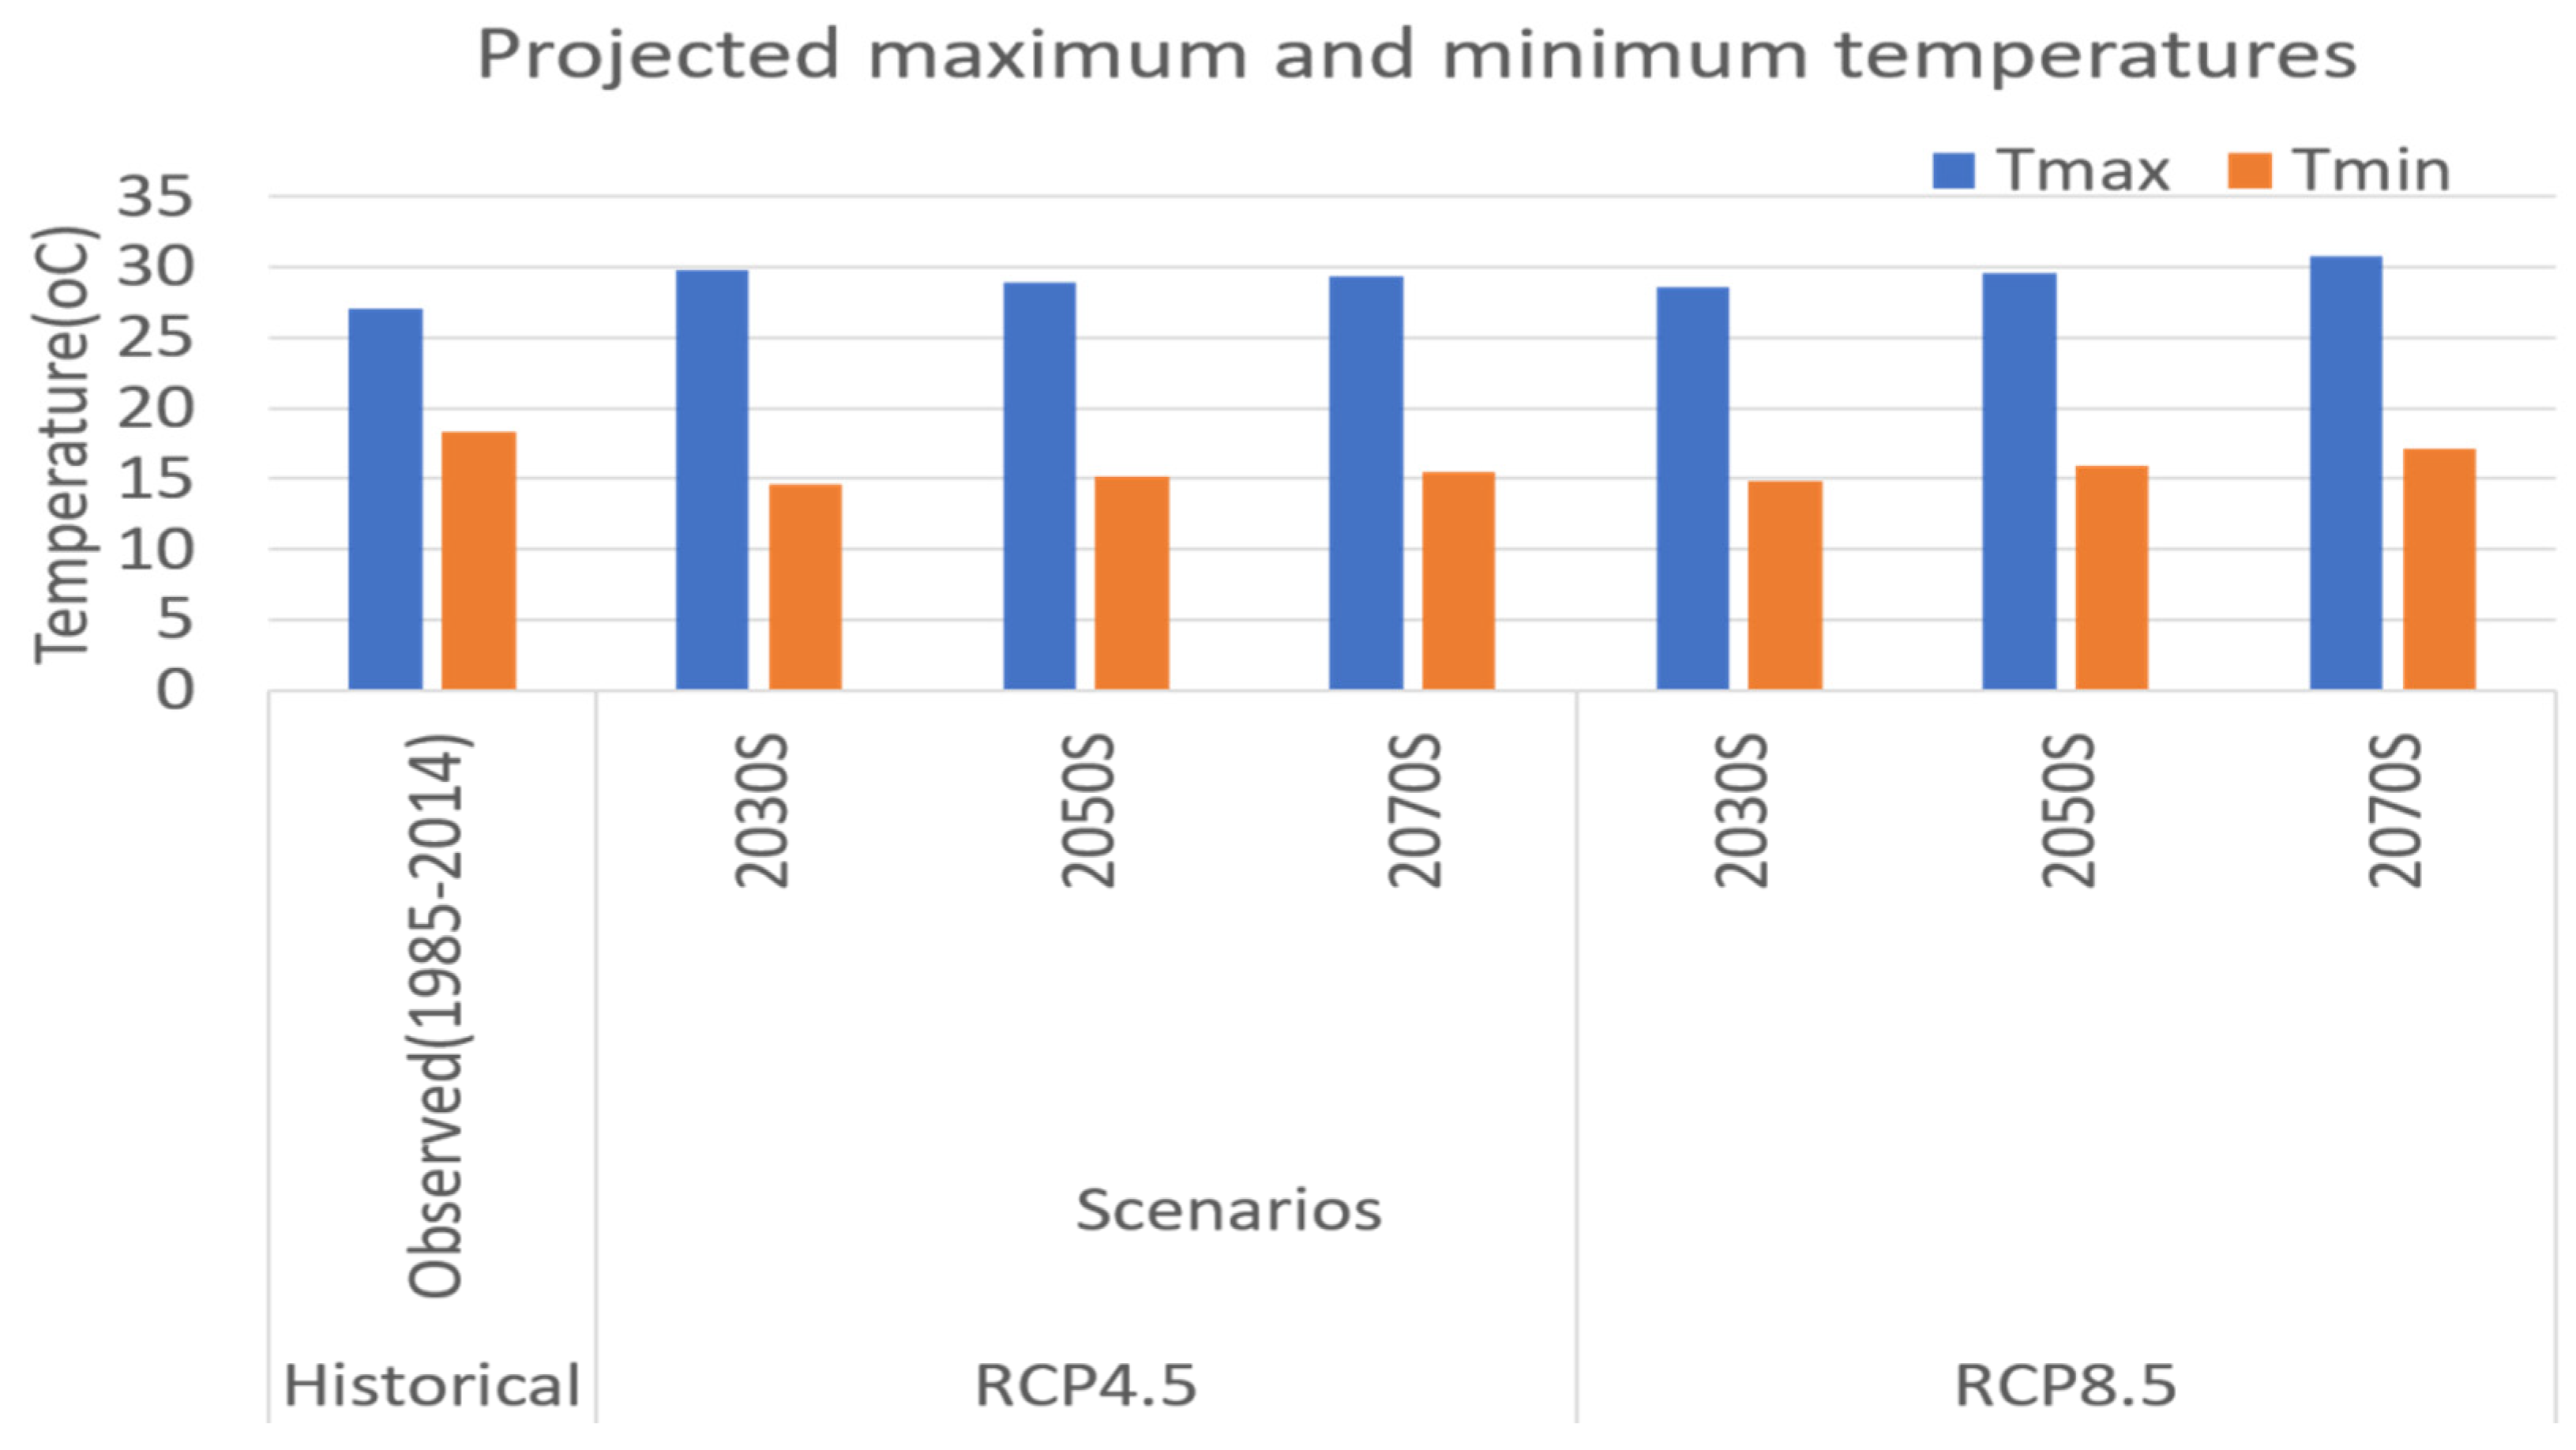
The projected maximum temperatures in the 2030s, 2050s, and 2070s at the Gondar Station increased compared with those in the baseline period (1985–2014), while the minimum temperature decreased under both RCP4.5 and RCP8.5 under all the time window scenarios (Figure 6).
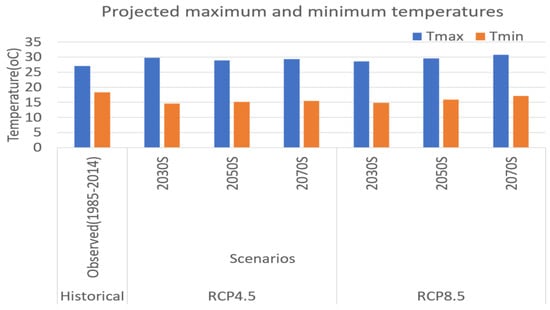
Figure 6.
Projected mean annual maximum and minimum temperatures compared with historical records.
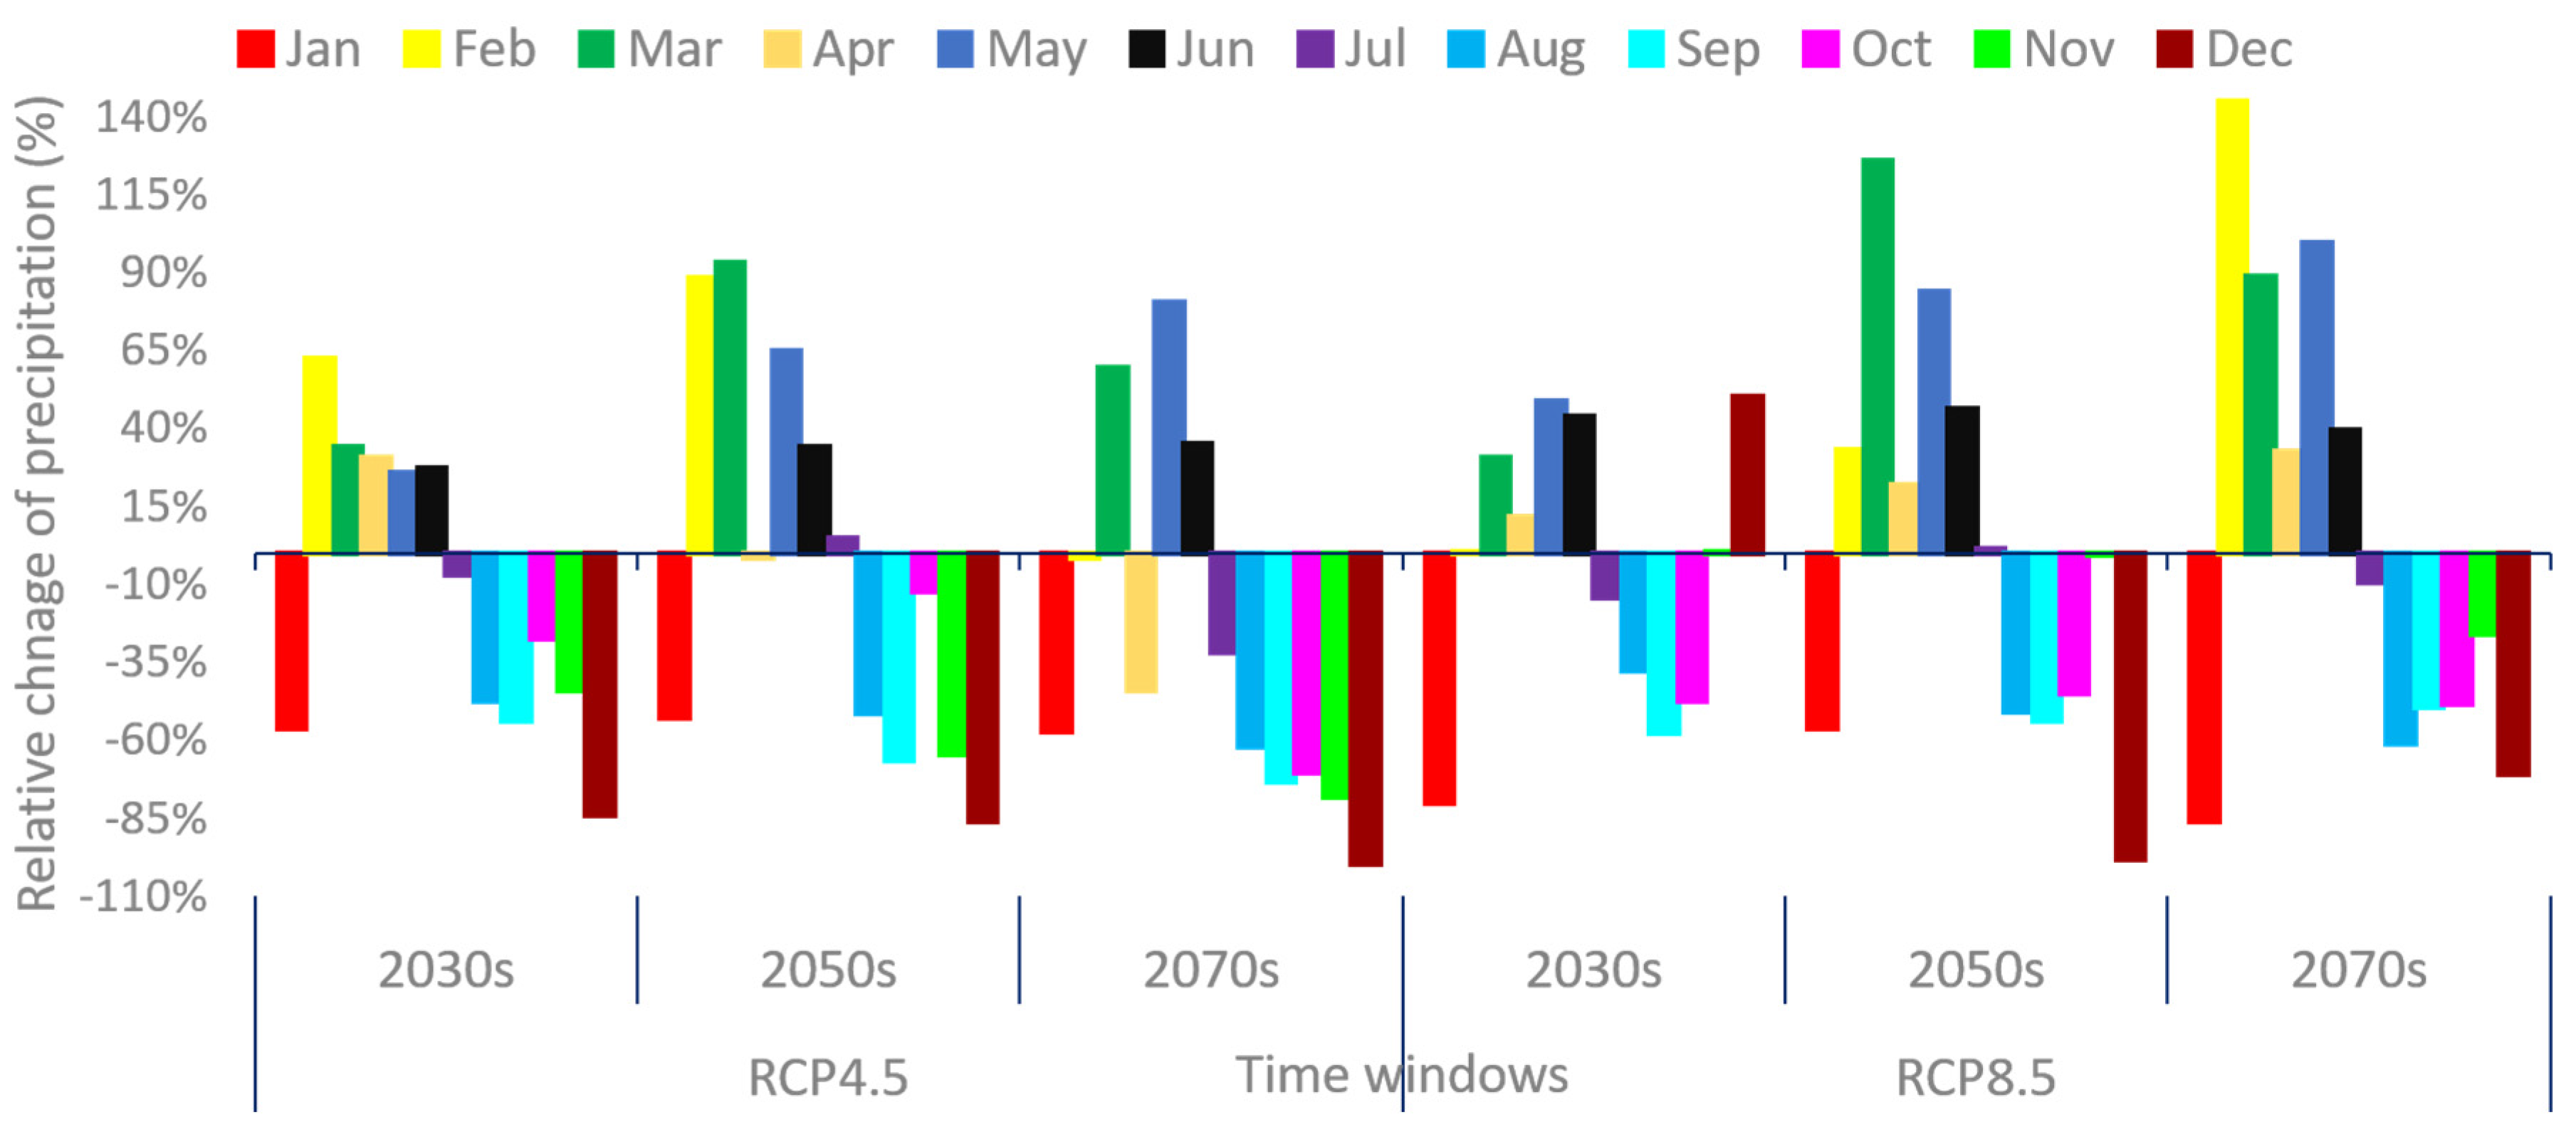
The projection of the ensemble precipitation results from the five GCM/RCM model combinations did not show a consistent pattern for all three timeframes of the 2030s, 2050s, and 2070s. This irregular pattern was observed for both the RCP4.5 and RCP8.5 climate scenarios. Figure 7 demonstrates that precipitation was as high as two-fold for some months, or 1.5 times the observed baseline value for other months. In contrast, for other months, precipitation was lower compared with the baseline, as verified by the negative relative change. This characteristic was observed for all time domains and RCP scenarios, which indicated that precipitation did not have consistent characteristics due to climate change in the watershed.
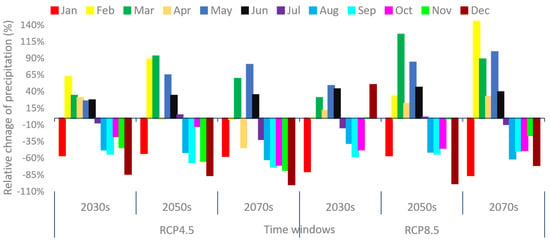
Figure 7.
Precipitation relative changes for the RCP4.5 and RCP8.5 climate scenarios.
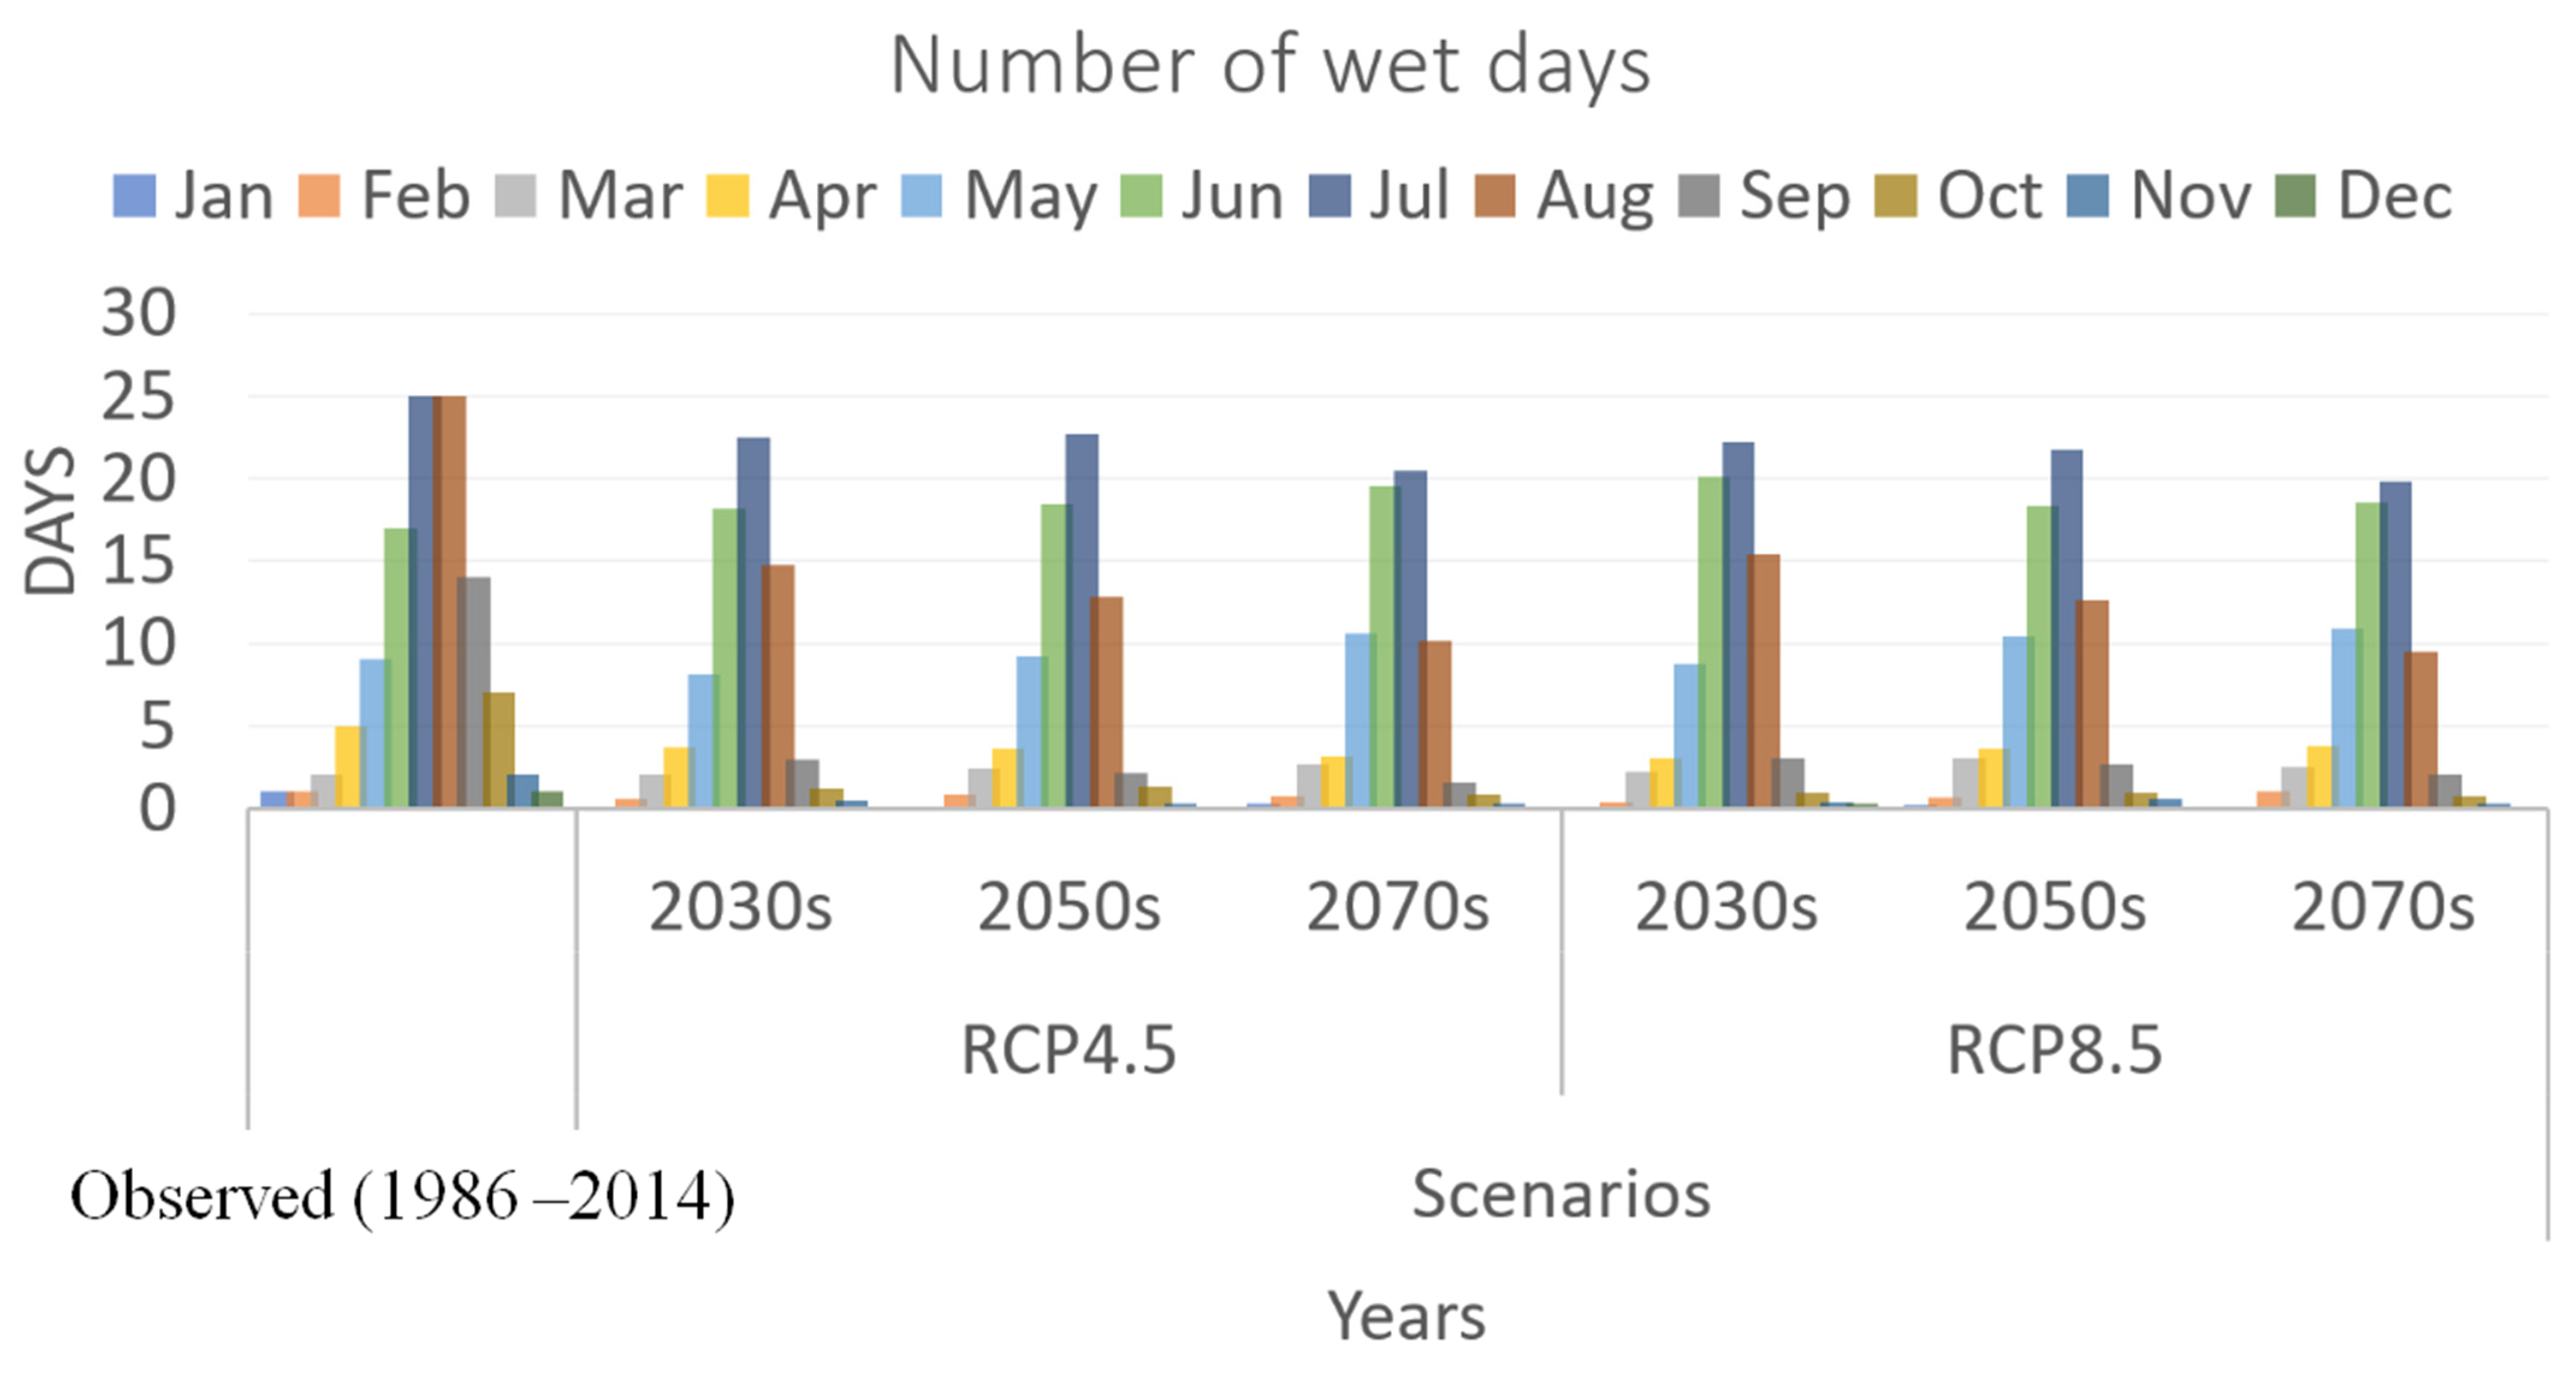
The monthly number of wet days, calculated based on the criterion of a depth greater than 1 mm [63] in the study region from the projected ensemble precipitation, indicated fewer wet days than in the base period, especially for the rainy months (Figure 8). The mean monthly depth of precipitation and the number of wet days were used to generate weather/climate inputs to the GeoWEPP model.
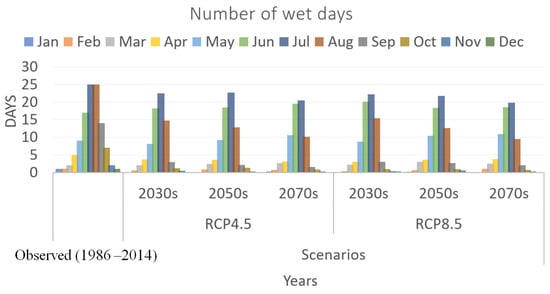
Figure 8.
Projected wet days for the 2030s, 2050s, and 2070s for RCP4.5 and RCP8.5.
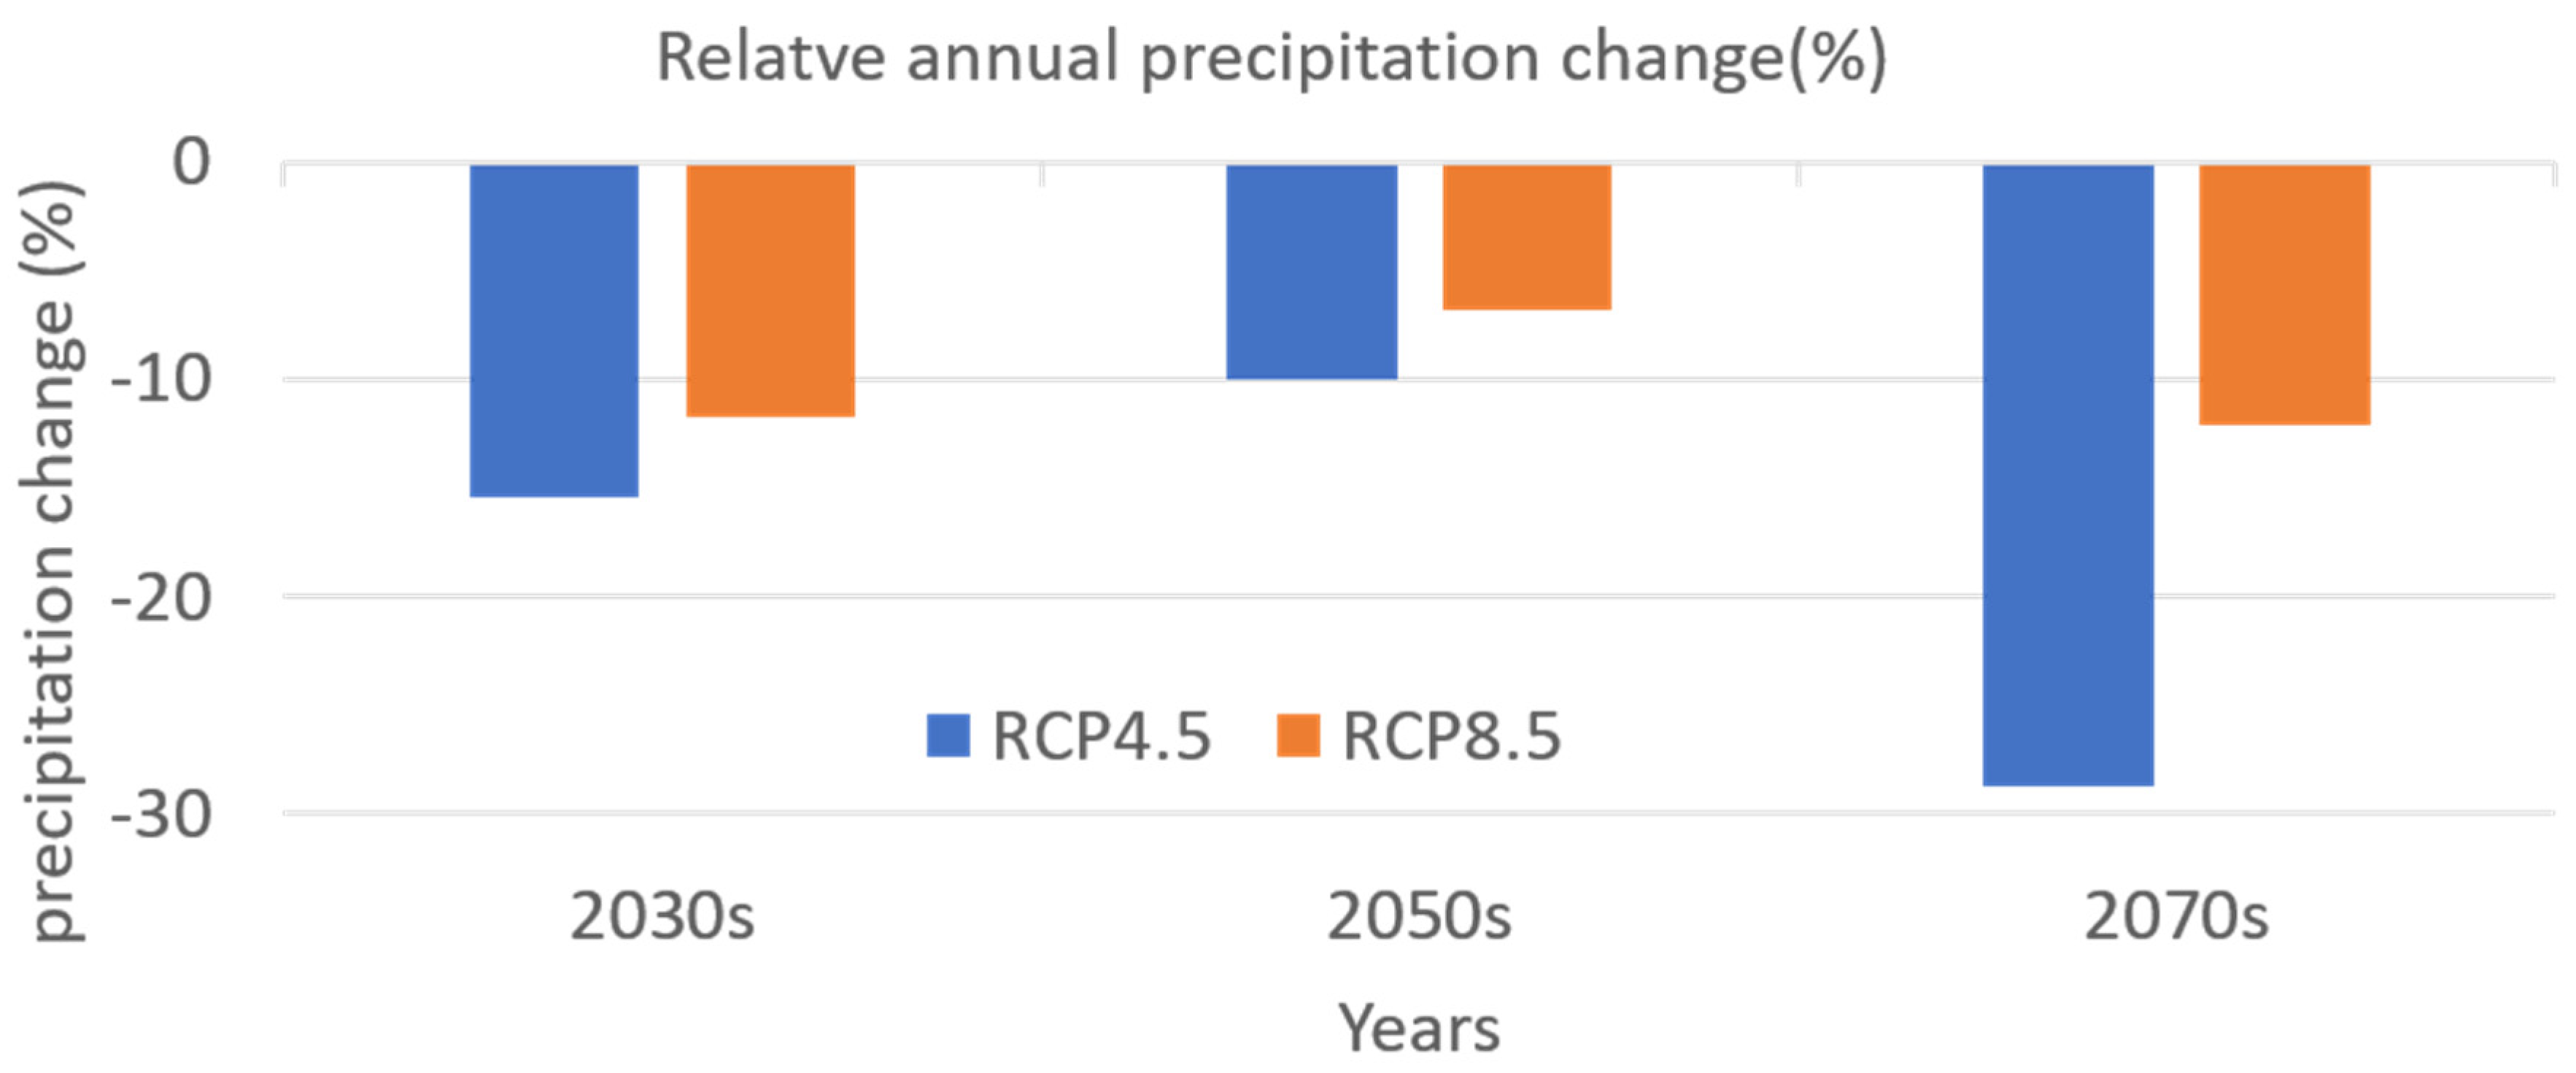
In the RCP4.5 and RCP8.5 climatic scenarios, the ensemble annual precipitation forecasts for the 2030s, 2050s, and 2070s decreased relative to those in the base period, with ranges from 6 to 28%, even though the monthly values occasionally showed increasing and decreasing trends (Figure 9).
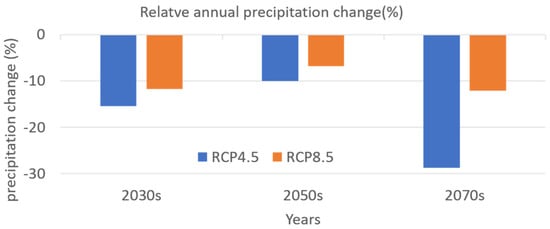
Figure 9.
Relative change percentage of precipitation.
3.3. Land Use/Cover Prediction
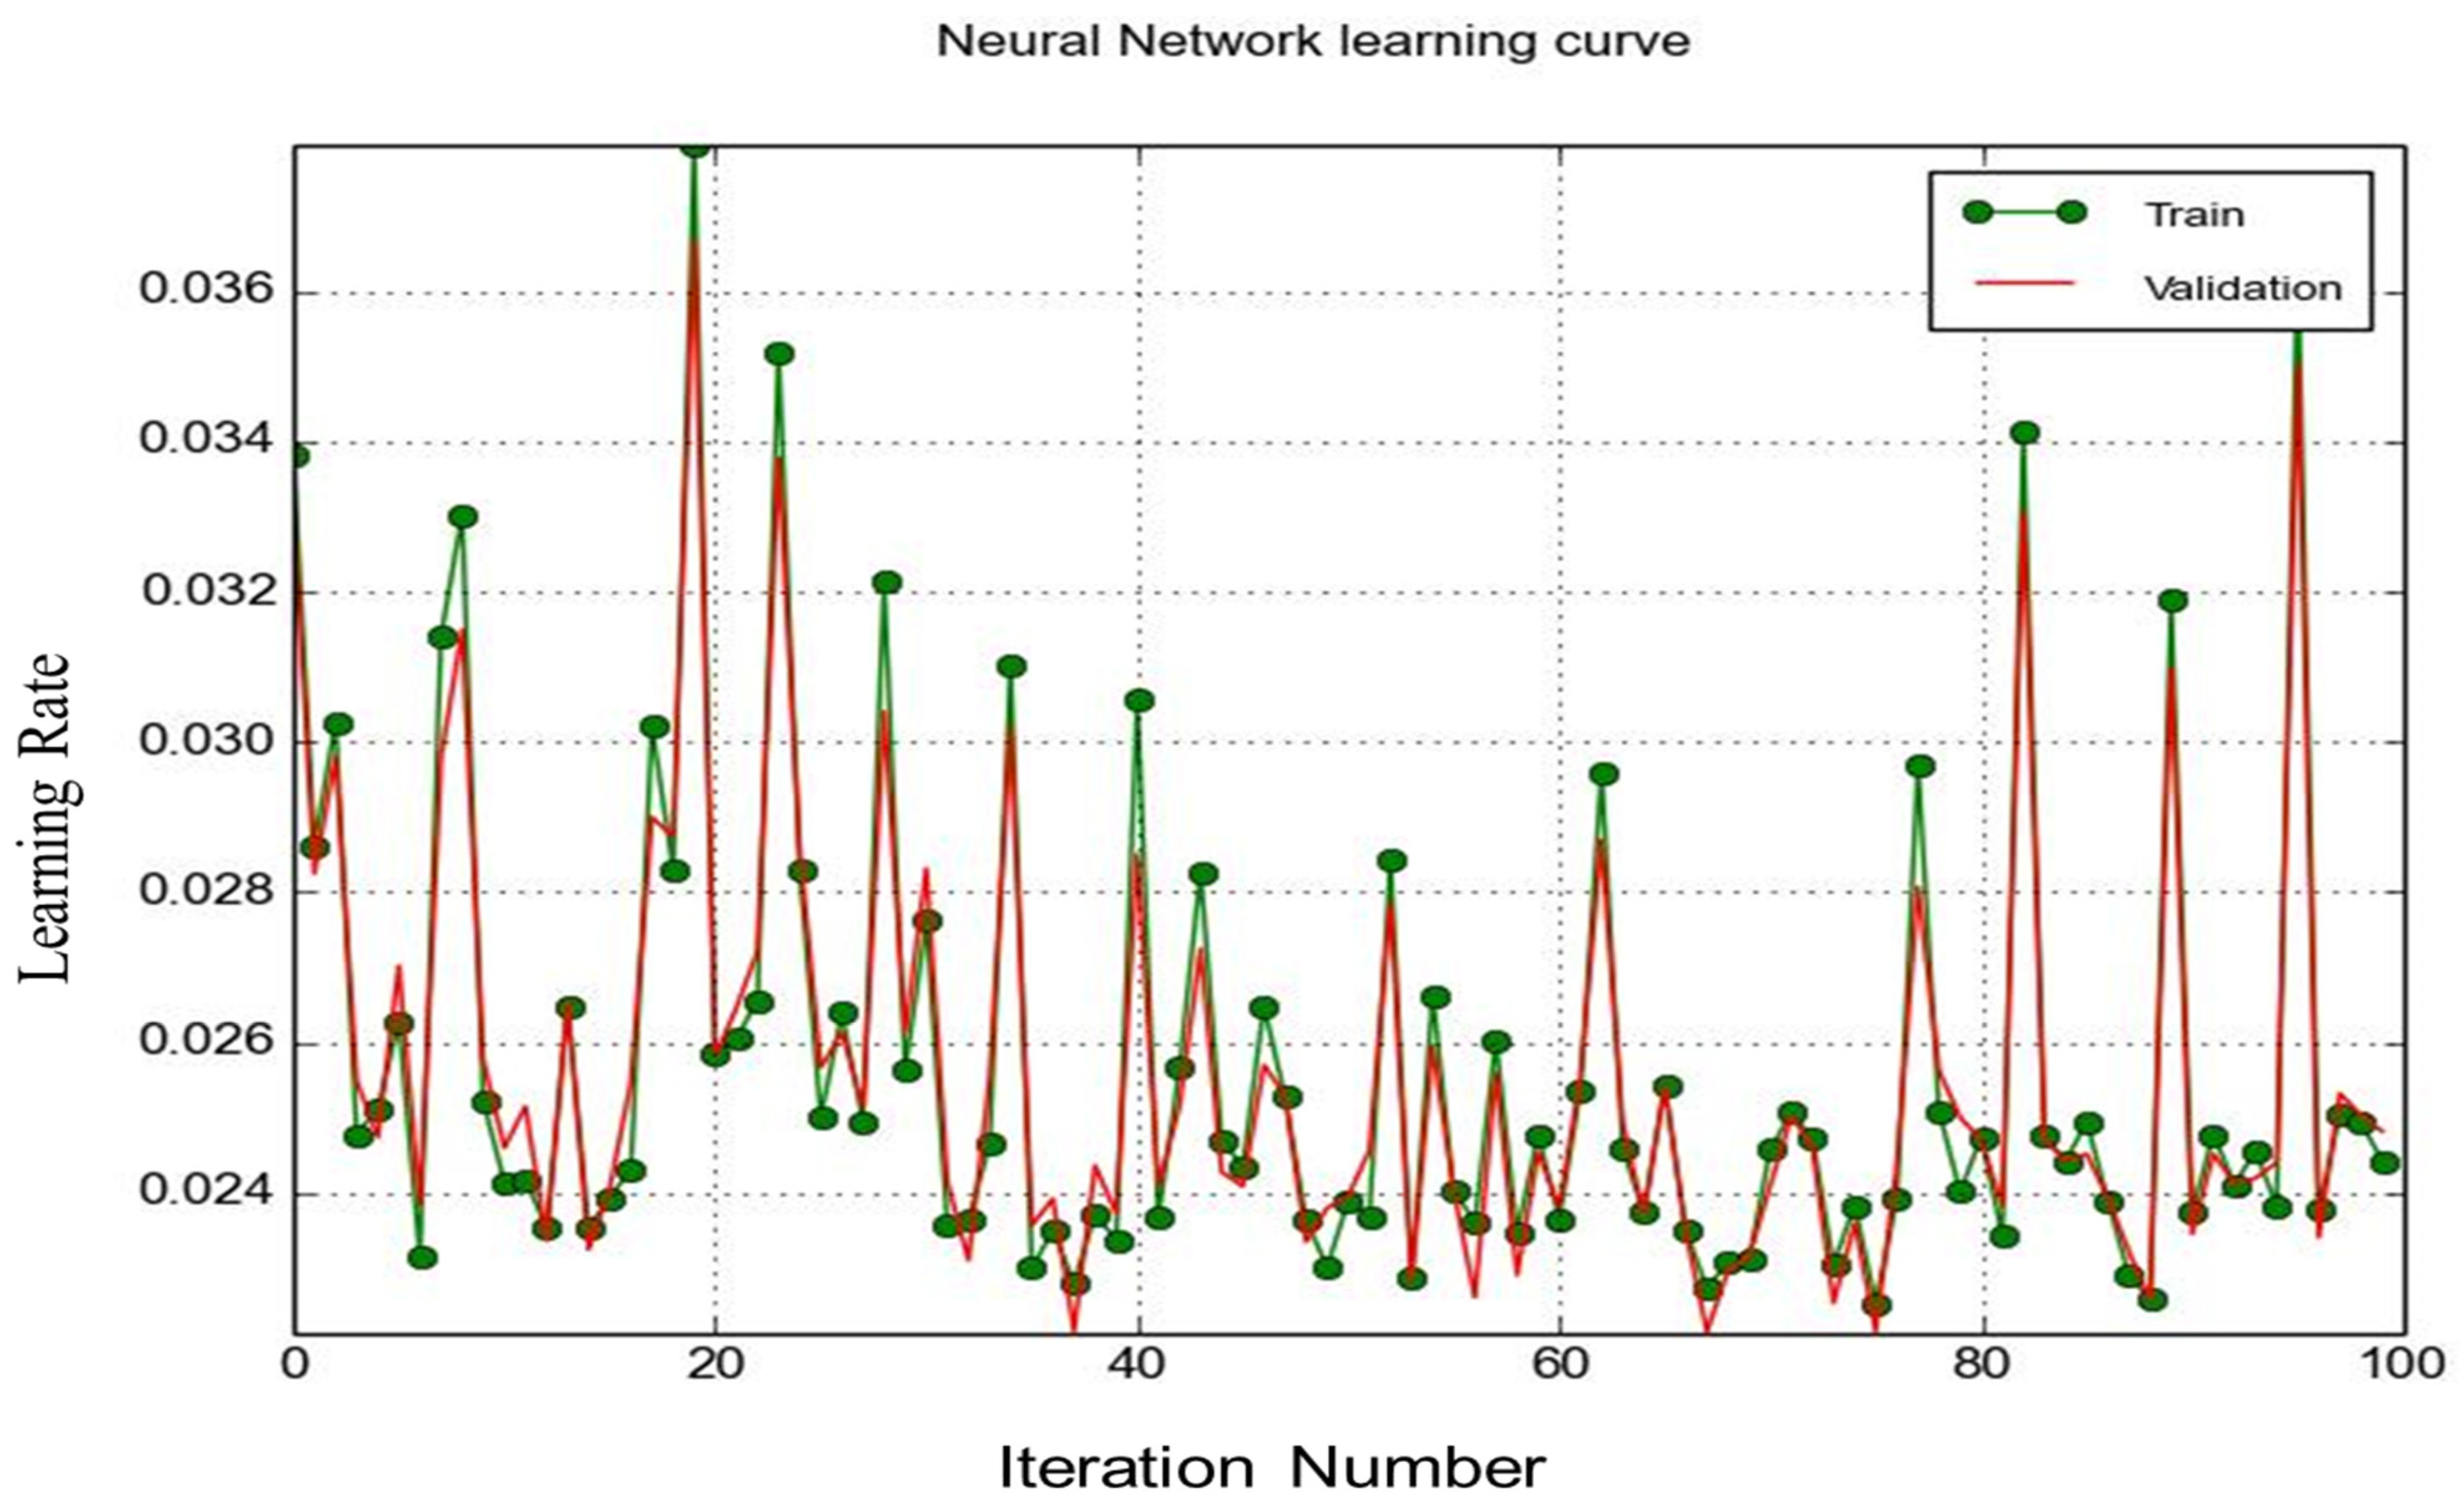
The land use/cover change prediction was performed using QGIS 2.16.3 software with the modules for land use change evaluation (MOLUSCE-version 3.0.13) plugin software. The plugin provides a set of algorithms for land use/cover change simulations, such as the cellular automata artificial neural network (CA-ANN). Because of its dynamic simulation capacity, high efficiency with limited data, simple calibration, and ability to reproduce different land covers and complicated patterns, CA-ANN was chosen to simulate land use in the future [45]. The learning algorithm analyzes the reached accuracy on training and validation sets of samples and stores the best neural network in memory. The training process finishes when the best accuracy is reached (Figure 10).
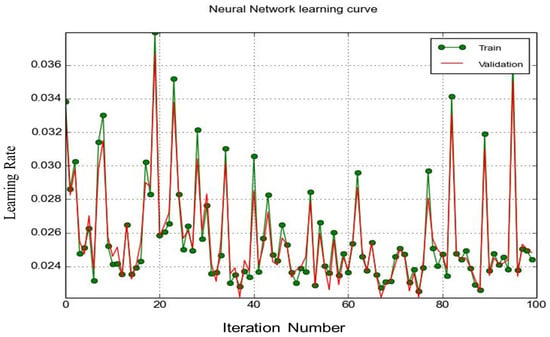
Figure 10.
Cellular automata artificial neural network learning curve for 2012 and 2017 to predict the land use/cover map of 2022.
During the validation process, a multiple-resolution budget method was used in the MOLUSCE plugin. By selecting one hundred iterations, the reference and simulated maps of the same period were validated (Figure 10). In the model, performance measures, such as kappa, the overall accuracy (% of correctness), kappa (overall), kappa (historical), and kappa (location) can be calculated.
Cellular Automata Simulation
Future land use/cover was forecasted using the cellular automata simulation (CA-ANN) method based on historical land use data for 2012, 2017, 2019, and 2022. Spatial exploratory maps of elevation, aspect, slope, distance from the city center, distance from streams, and distance from the road were generated, and then a transition matrix was generated. Model validation for 2022 between the observed and simulated land use/cover maps of the Megech watershed resulted in a kappa value of 0.76 and an overall correctness of 82.64%.
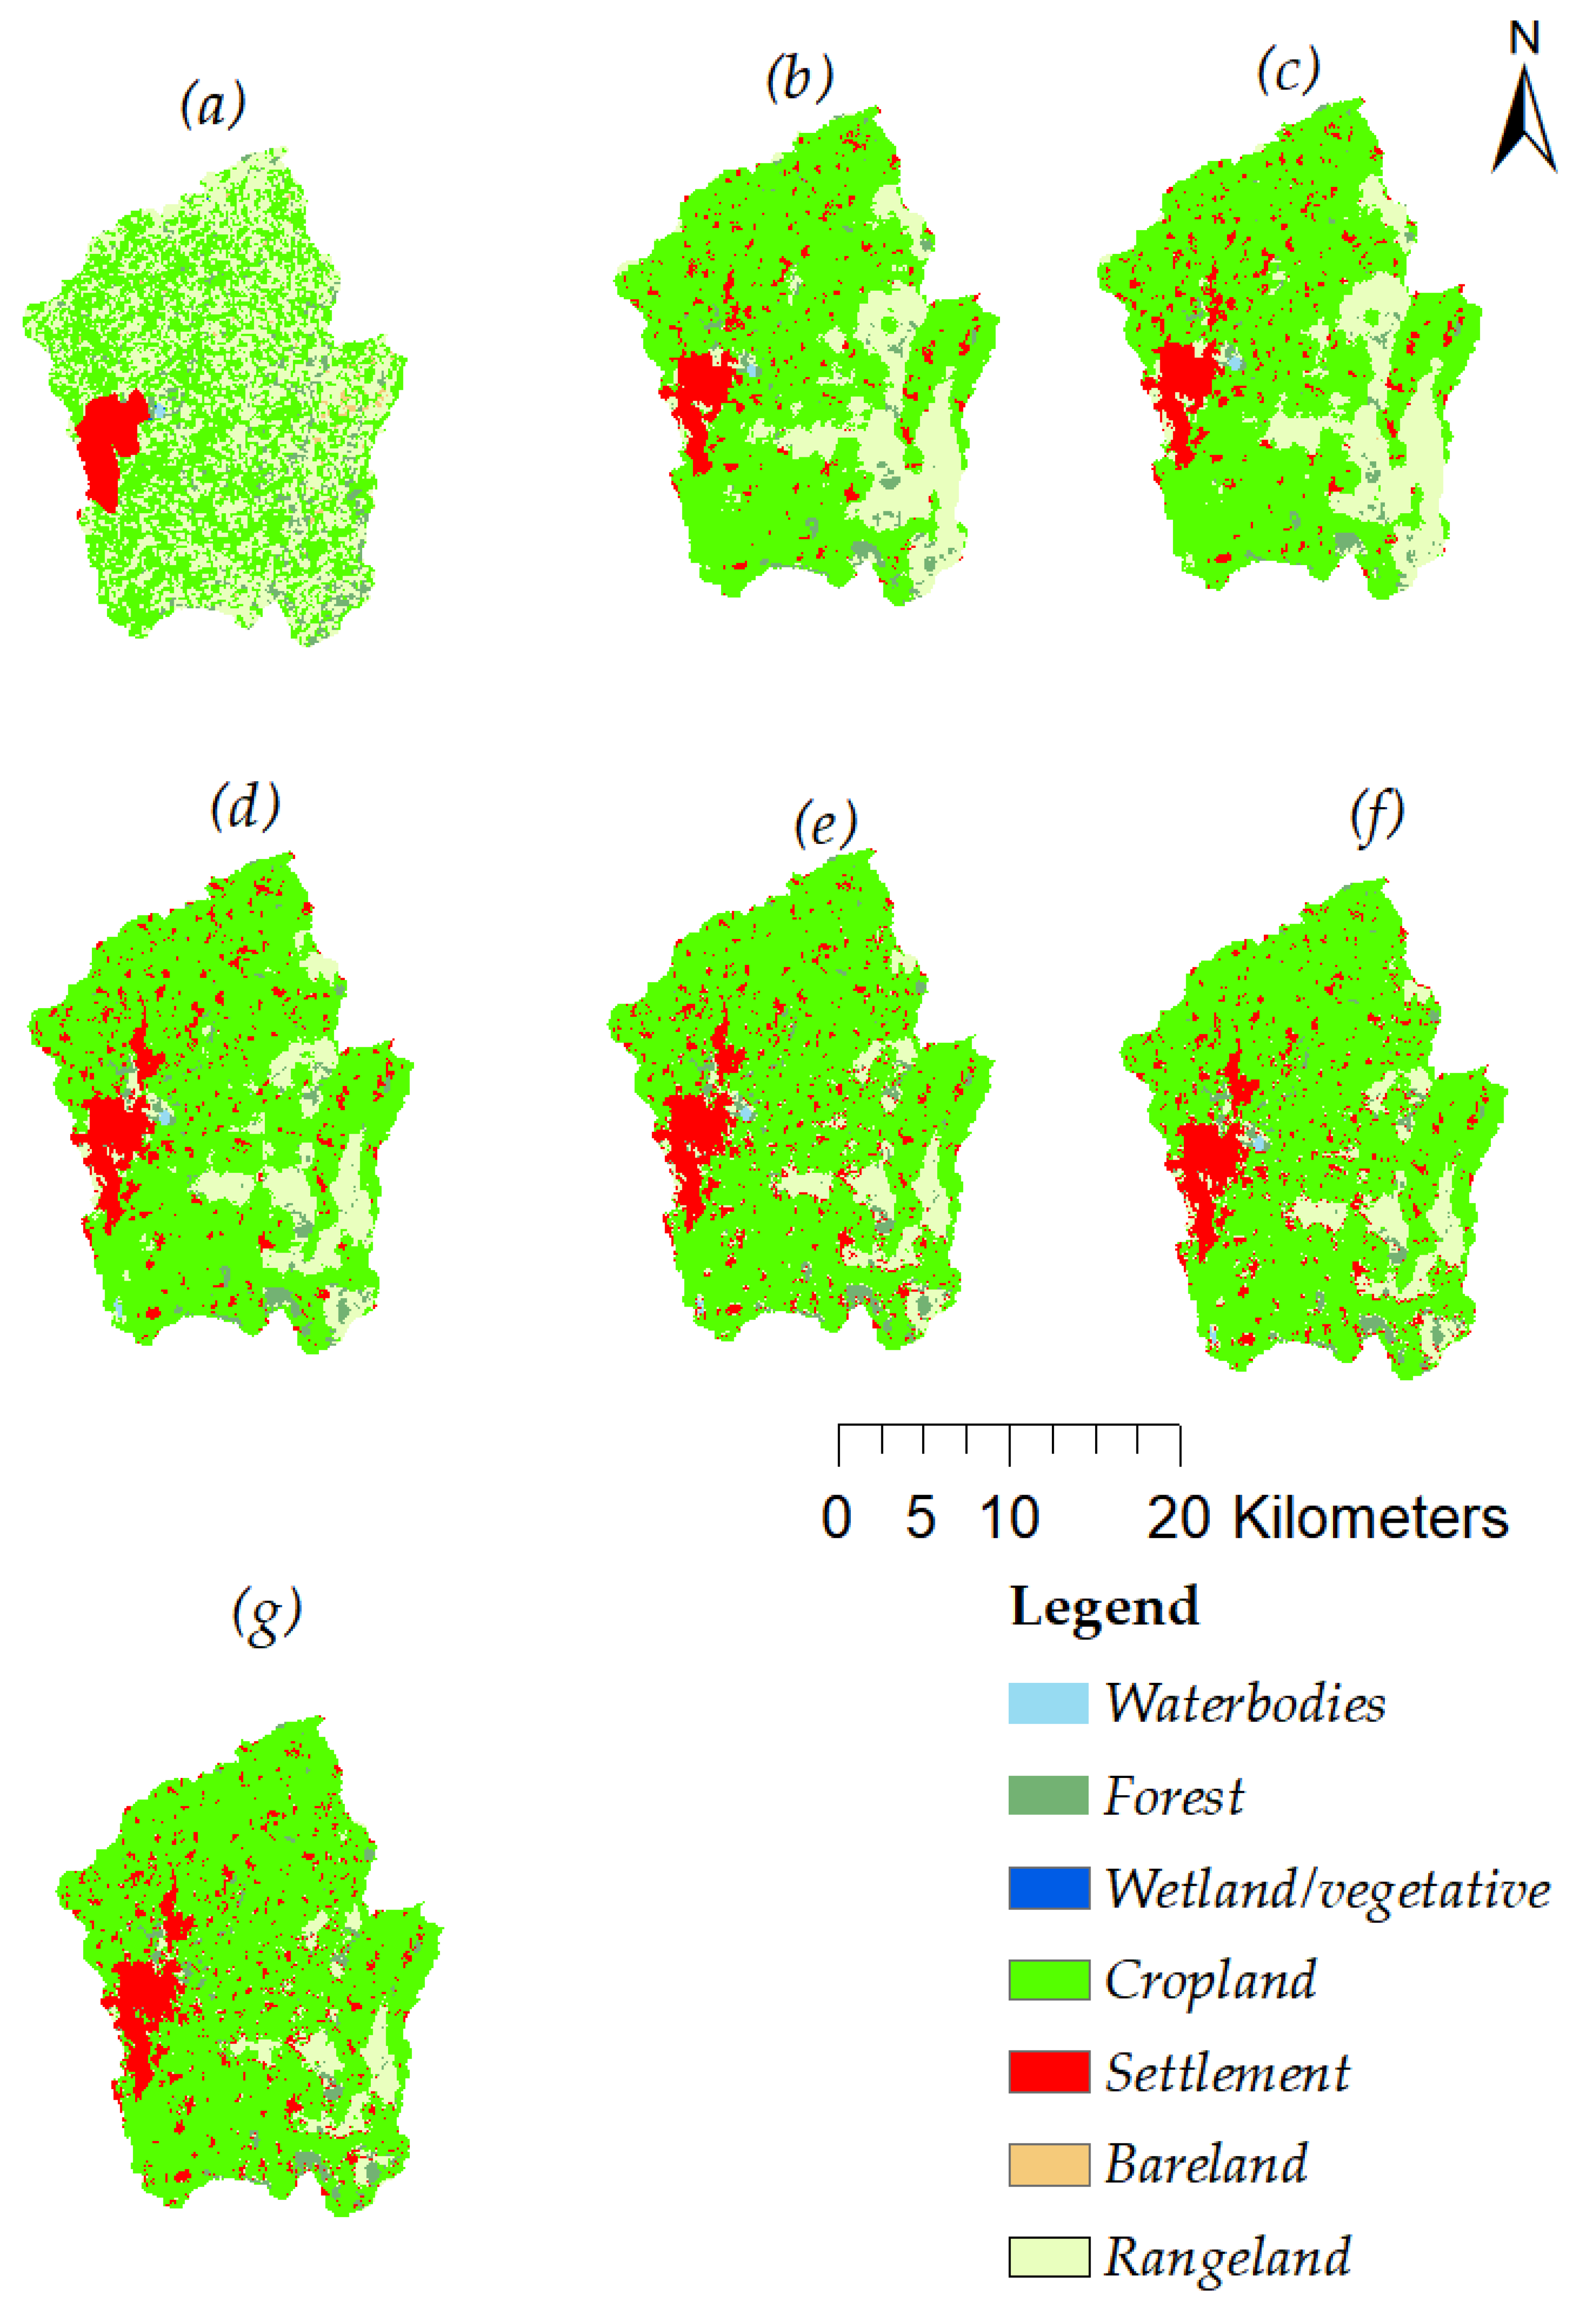
The predicted land use/cover maps for 2035 were produced after generating the 2026 maps from the transitions of 2018 and 2022 and the explanatory variables, with a kappa of 0.82 rom the transition matrix of the 2017 and 2026 maps. The 2055 map was predicted with the same procedure using the simulated map of 2037 and the observed map of 2019, with a kappa of 0.78, and the spatial variables and the transition matrix were used to simulate this map. To forecast the land use/cover map of 2075, the predicted maps of 2035 and 2055 were used, and spatial variables and a transition matrix with a kappa value of 0.68 were used. Cropland and settlement/built-up areas were shown to be increasing for all time projections, with diminishing forest and rangelands. Compared with the baseline data, other land use/cover classes, such as wetlands, bare lands, and waterbodies, exhibited non-significant changes under all the prediction scenarios (Table 2 and Figure 11).

Table 2.
Class statistics of land use/cover for 2017, 2035, 2055, and 2075.
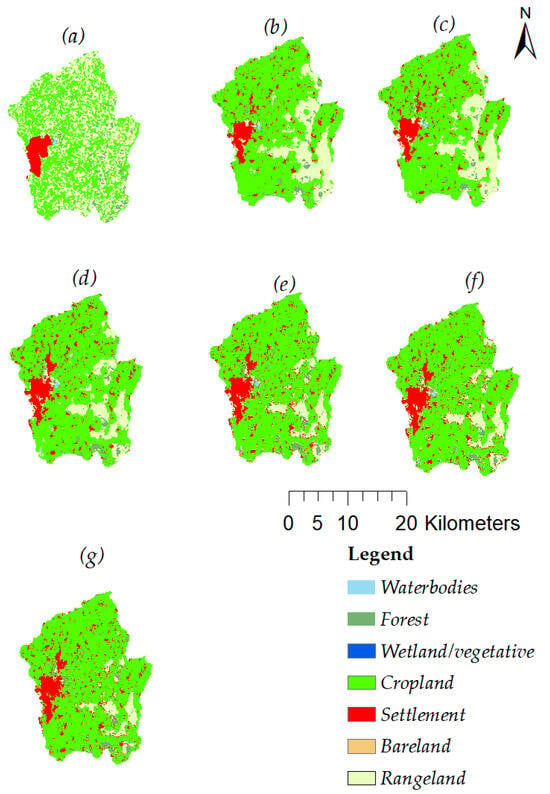
Figure 11.
Land use/land cover maps observed in the Megech Dam watershed in (a) 2012, (b) 2017, (c) 2019, and (d) 2022 and in (e) 2035, (f) 2055, and (g) 2075.
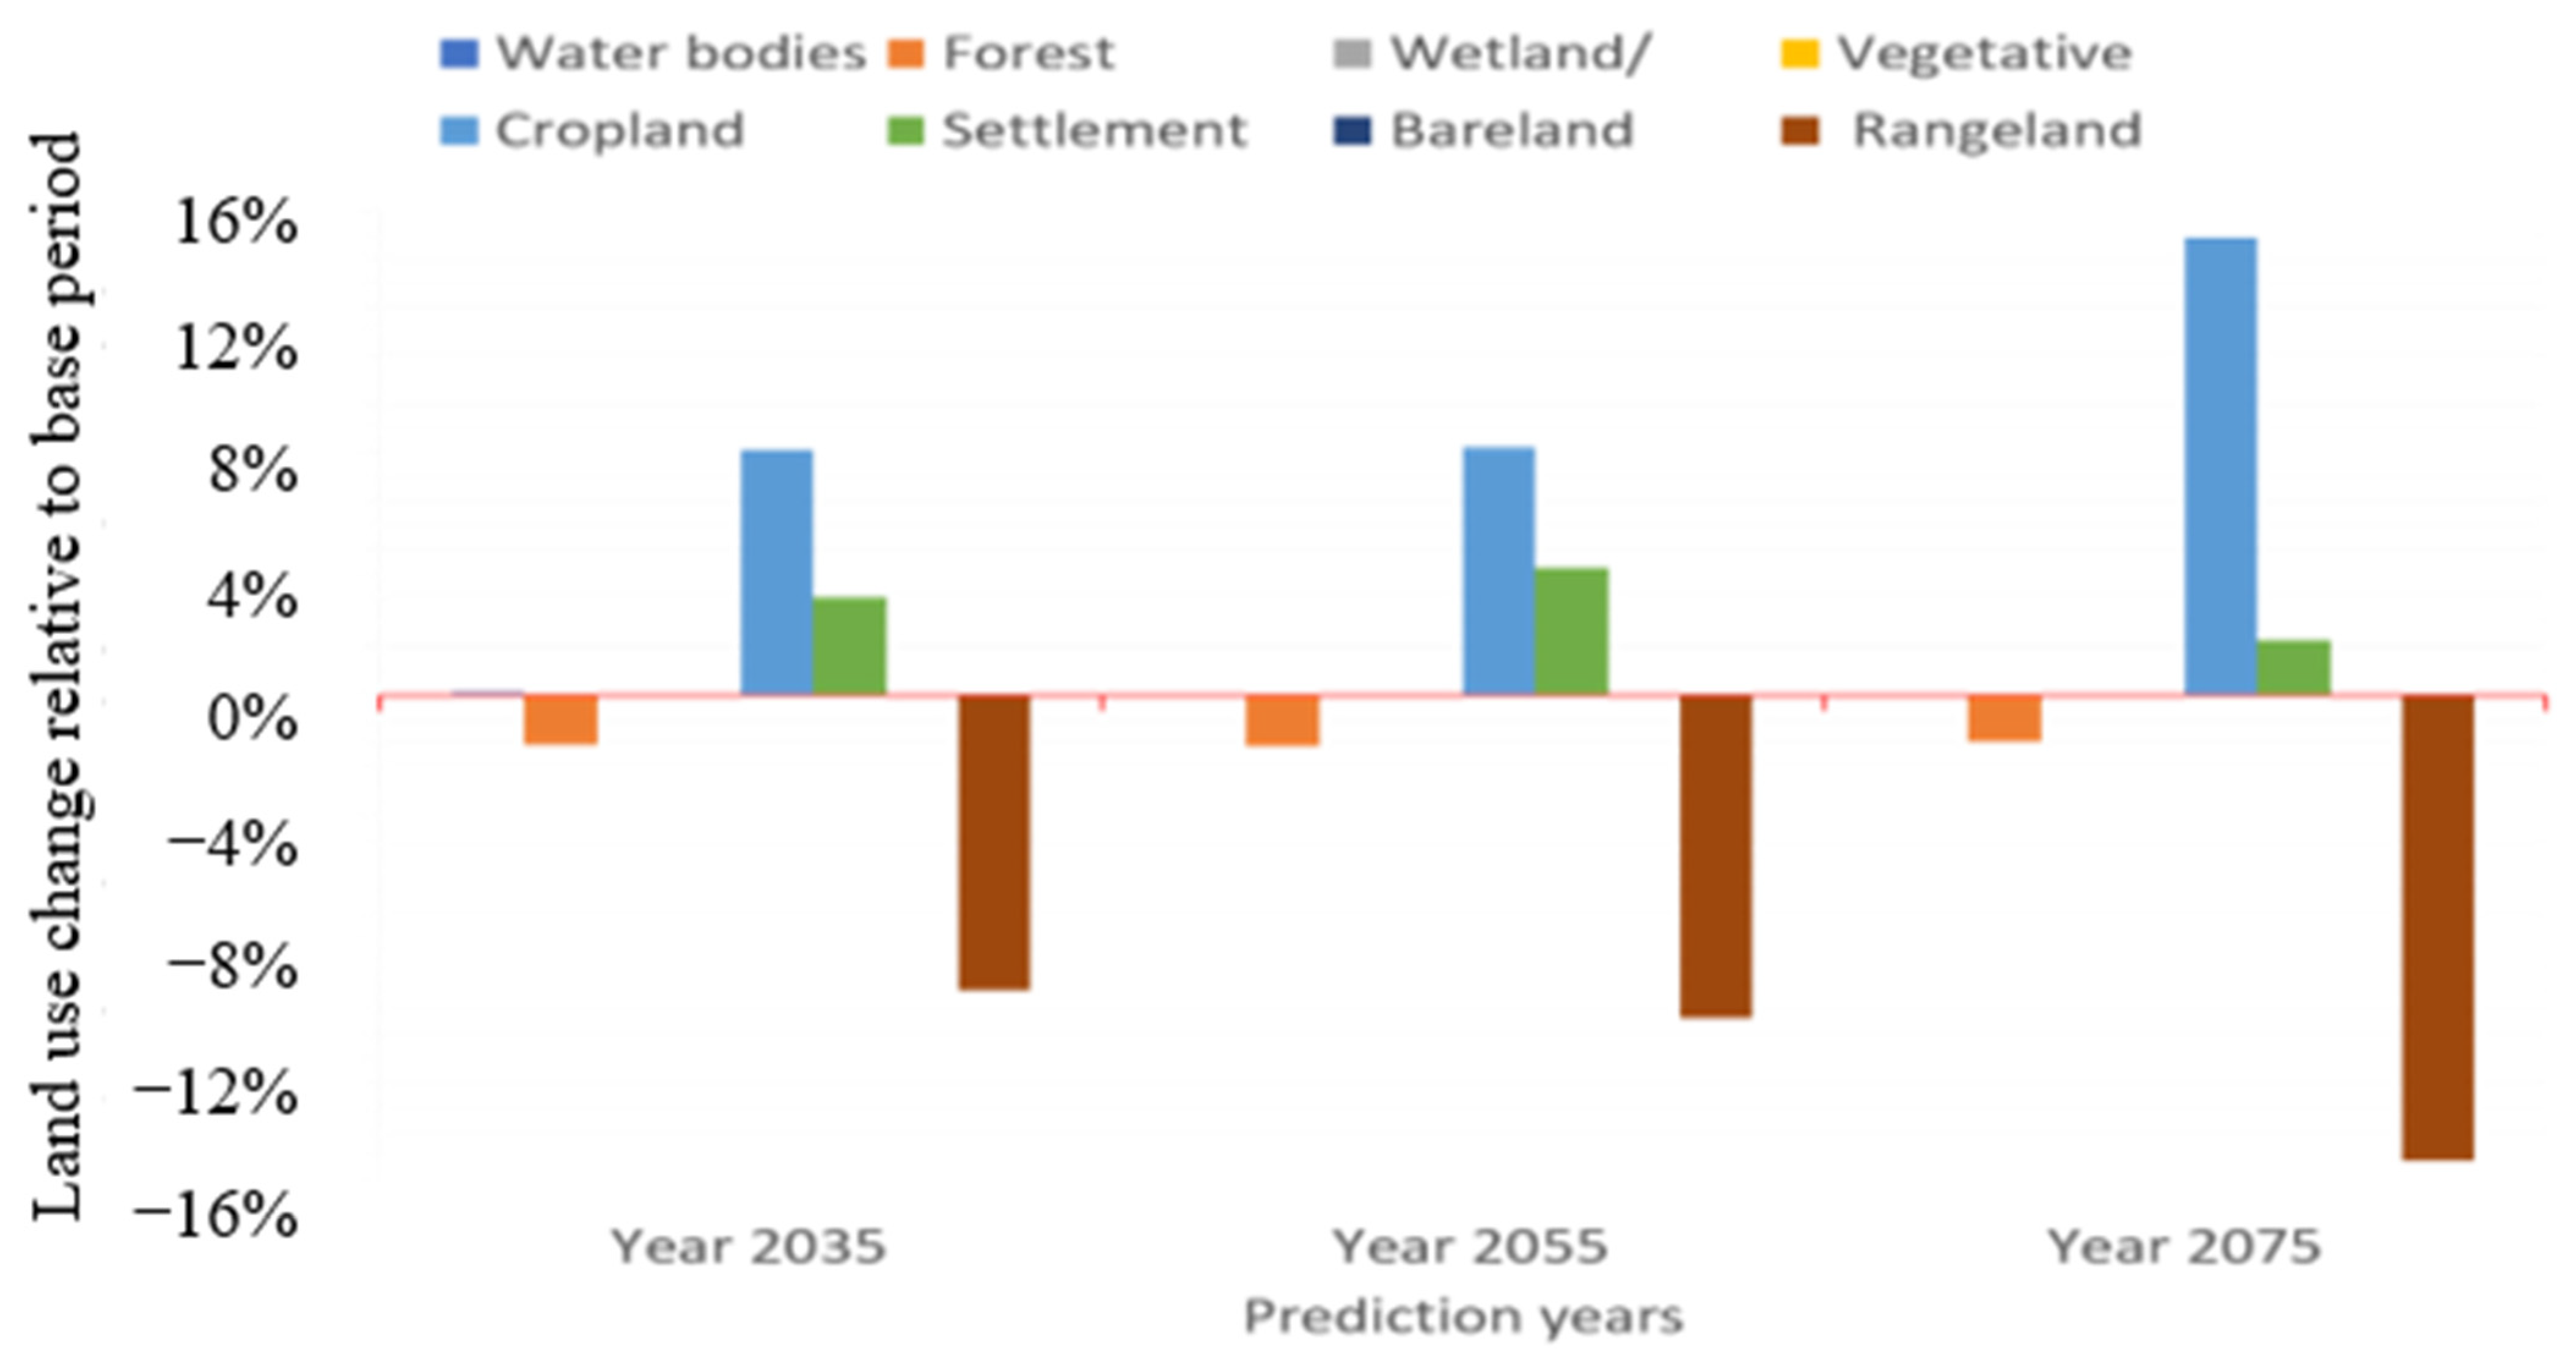
From the land use/cover prediction to future time scenarios, cropland and settlement areas increased, while range lands and forests decreased in the Megech watershed. For 2035, 2055, and 2075, the cropland and settlement areas increased by 8.07%, 8.18%, and 15.06% and 3.21%, 4.18%, and 1.80%, respectively. For 2035, 2055, and 2075, the percentage of rangeland decreased by 9.71%, 10.65%, and 15.33%, respectively, whereas that of forests decreased by 1.63%, 1.71%, and 1.56%, respectively (Figure 12). The relative changes in other land use/cover classes, such as water bodies, wetlands, and bare lands, were insignificant. To ascertain the relative changes, data from the chosen baseline period of 2022 land use/cover data were compared with predicted land use/cover data.
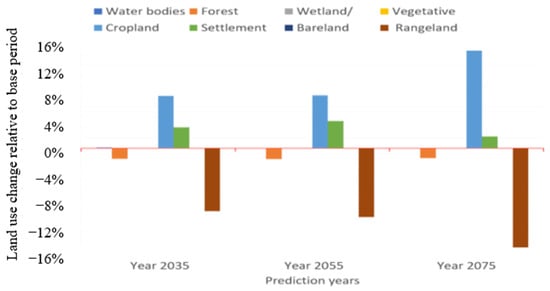
Figure 12.
Relative change in predicted land use/cover.
However, after the dam commenced, the land use/cover in the reservoir area changed to water bodies, and the relative percentage shift changed with the change in value throughout the season and throughout the year due to the variation in the reservoir level. In this study, such variation is not included since the land use/land cover impact study focused on the upstream sub-watersheds. Another factor contributing to the study’s limitations is the dynamic nature of the reservoir size, which is roughly 8.9 km2 when the water reservoir is at the NWL and lowers with the water level decline during the dry and high-water-intake seasons.
3.4. GeoWEPP Model Simulations
Through sensitivity analysis of parameters controlling surface runoff, soil loss, and sediment yield rates from the hill slope, such as hydraulic conductivity (K), interrill erodibility (Ki), rill erodibility, and critical shear stress (τc), the performance of the GeoWEPP model simulation in the studied watershed was verified. Following the selection of the sensitive factors, the statistical metrics of coefficient of determination, Nash–Sutcliffe, and percent of bias were calibrated and validated for runoff and sediment yield [64,65]. According to Moriasi et al. [66], the aforementioned statistical indicators’ results demonstrated how effectively the simulations reproduced the reported values (Table 3). Model calibration and validation were performed at three and two years, respectively, for both water and sediment flows.

Table 3.
Statistical metric values for calibration and validation periods.
The GeoWEPP model simulation was based on climate data generated using RockClime (CLIGEN 4.31) stochastic weather generator software for the data collected from stations for the baseline period and projected climate data for the future scenario assessment. Weather generated by long-duration simulation data, which is the input format for the GeoWEPP model in the daytime step and includes precipitation depth, intensity, time to peak, peak intensity, dew point, maximum and minimum temperature, radiation, wind velocity, and direction, can provide us with a long-term assessment of runoff, soil loss, and sediment yield in the study watershed.
3.4.1. Impacts of Land Use/Cover Change on Flow, Soil Loss, and Sediment Yield
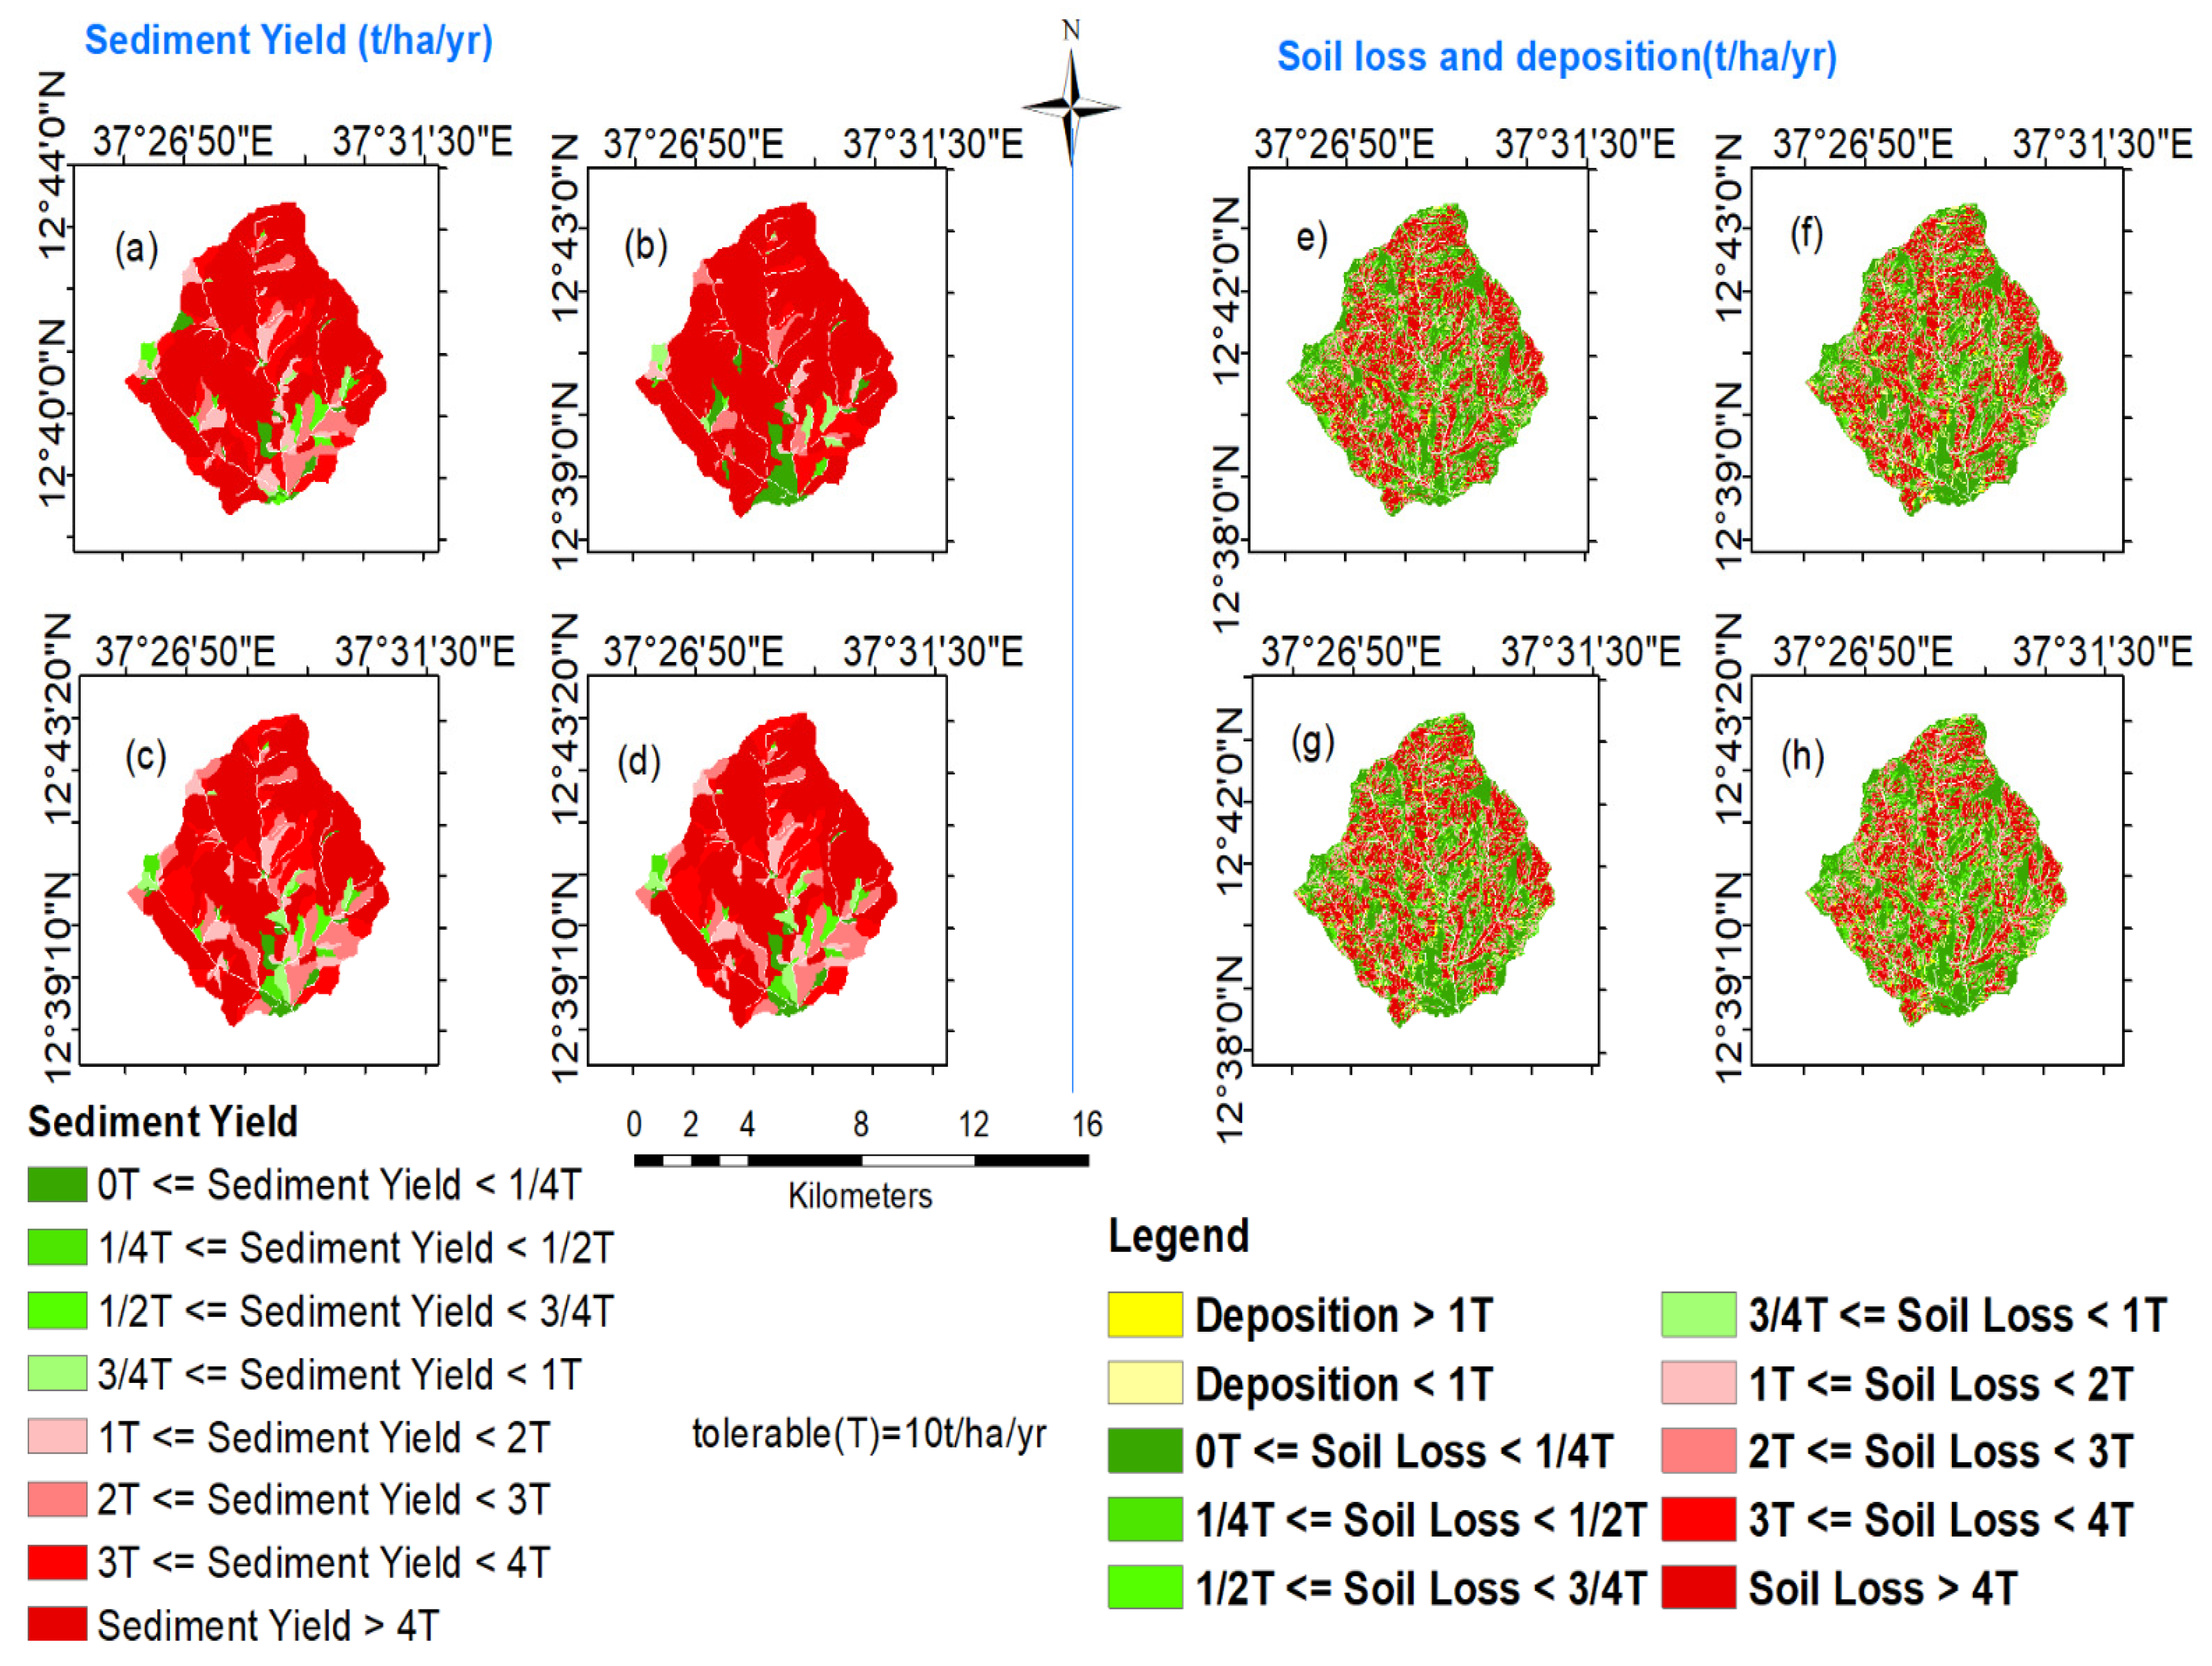
Land use/cover change may increase or decrease runoff, soil loss, and sediment delivery rates in watersheds. The value of the effective hydraulic conductivity (Ke) changed, while other soil parameters, such as the critical shear stress (τc), rill erodibility [53], and interrill erodibility (Ki), and climate factors, such as the effective intensity (Ie) and interrill flow rate (σr), remained unchanged during the evaluation of land use/cover change effects on soil erosion and flow using the GeoWEPP model. Compared with those in the baseline period (2017), cultivated land and built-up areas increased by 8.1–15.1% and 1.8 to 4.18%, respectively, for 2035, 2055, and 2075 due to the reduction in forest and rangelands. The land use/cover change sediment alteration model simulated 4.06–7.67%, 8.26–18.86%, and 5.23–15.94% of the runoff, hill slope soil loss, and yield, respectively (Table 4). The changes in land use/cover varied the distribution of effective hydraulic conductivity and impacted the model results. Figure 13 illustrates that the Angereb sub-watershed sediment yield distribution was greater than the tolerable soil loss (T = 10 t/ha/year) for the baseline year of 2017 and for the future (2035, 2055, and 2075) predicted land use/cover changes. According to the distribution of soil loss (flow path technique) and sediment yield (watershed method) model simulation results, the severity level and its spatial extent increased from the near to far future land use/cover change analysis, in comparison with the acceptable loss (T = 10 t/ha/yr.) as a reference for comparison (Figure 13).

Table 4.
Watershed method simulation results under land use/cover change.
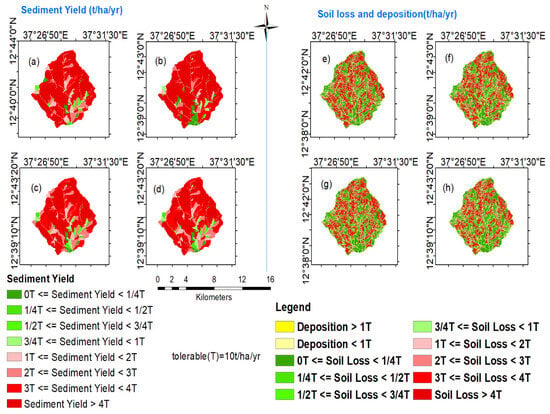
Figure 13.
Under land use/cover change, watershed sediment yield for (a) 2017, (b) 2035, (c) 2055, and (d) 2075 and soil loss for (e) 2017, (f) 2035, (g) 2055, and (h) 2075.
3.4.2. Impacts of Climate Change on Flow, Soil Loss, and Sediment Yield
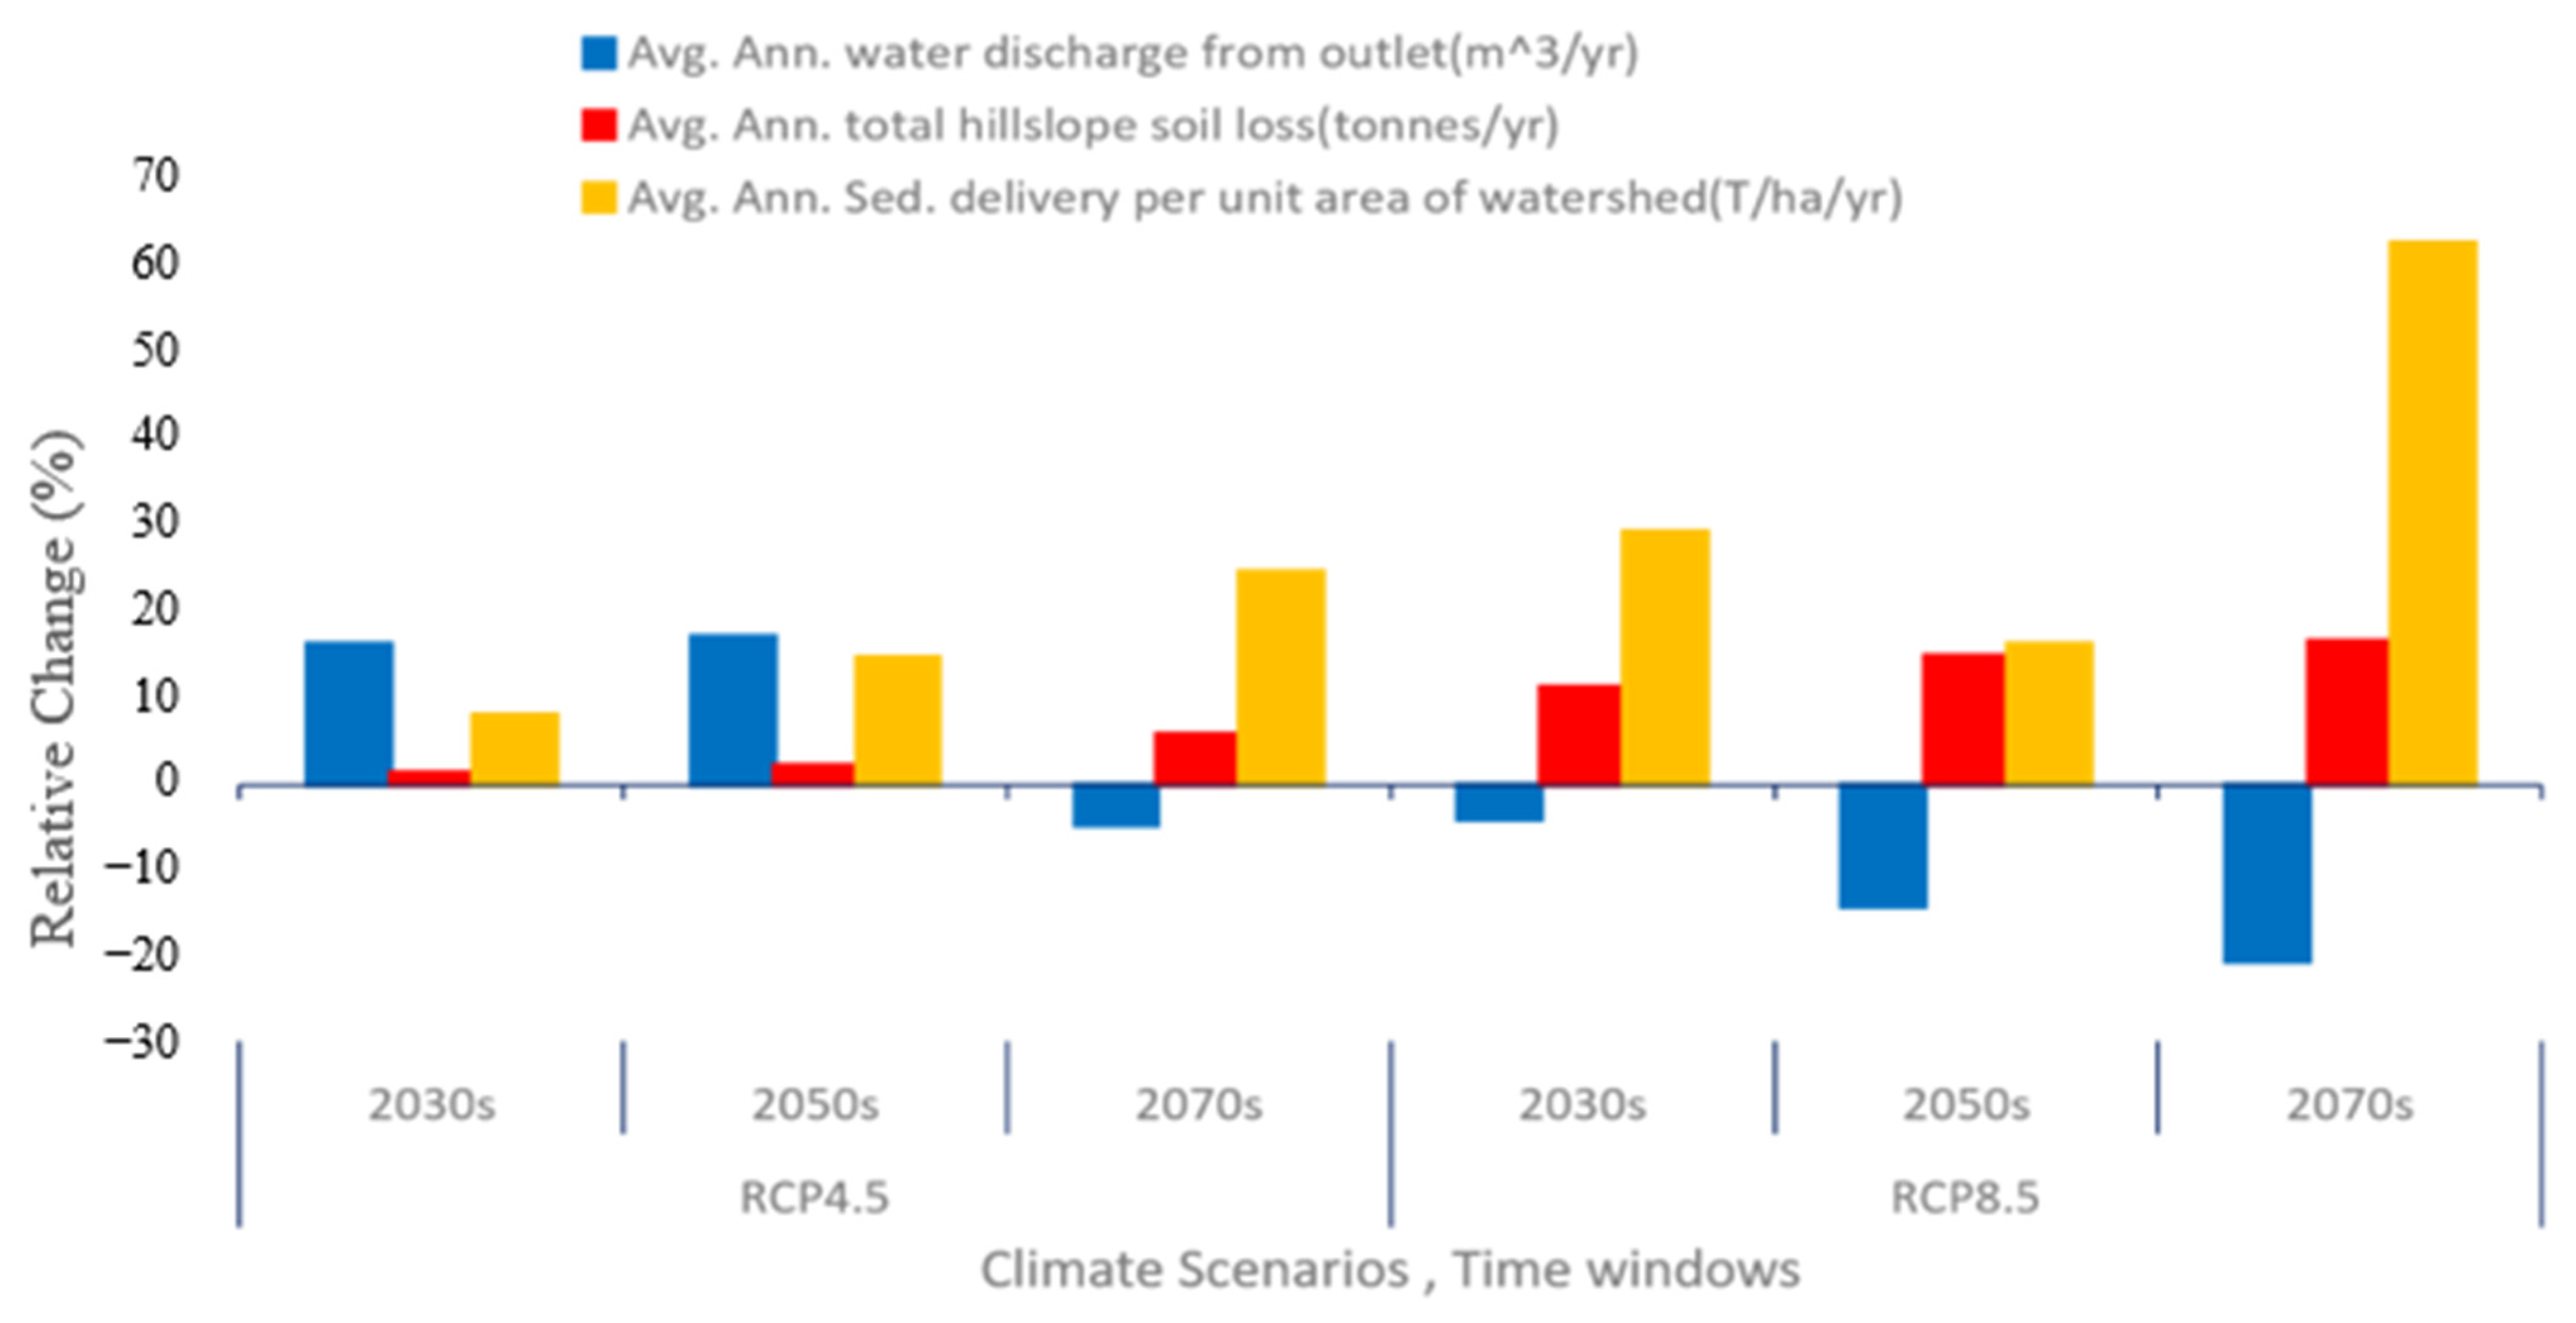
RockClime or CLIGEN version 4.31 was used to create climate PAR files to analyze the effects of climate change on runoff, soil loss, and sediment yield. The monthly maximum and minimum temperatures, monthly precipitation, and wet days projected for the 2030s, 2050s, and 2070s under the RCP4.5 and RCP8.5 climate scenarios were used as inputs to create par files that served as inputs to the GeoWEPP model. The computed water flow for the projected climate for the 2030s, 2050s, and 2070s was compared with the baseline and indicated an increase in RCP4.5 for the 2030s and 2050s and a decrease for the 2070s. For RCP8.5, the decreasing stream flow pattern ranged from 4.01 to 20.65%. The sediment yield rates exhibited an increasing trend for all time windows, with values ranging from 4.1 to 24.95% for RCP4.5 and from 16.51 to 63.55% for RCP8.5, which may be due to an increase in rainfall intensity during the wet season (Figure 14). Climate-change-related increases in sediment yield put the reservoir storage capacity of the Megech Dam under greater stress unless appropriate measures are taken to address them. Onsite soil loss is predicted to increase under the RCP4.5 and RCP8.5 climate scenarios, with ranges of 1.26–5.90% and 11.44–16.86%, respectively.
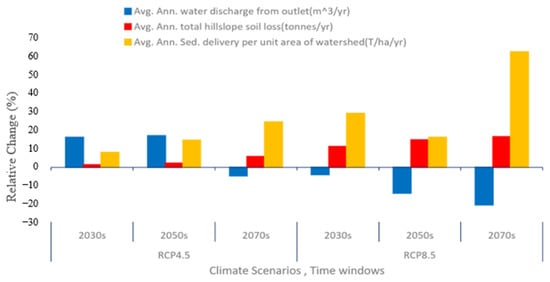
Figure 14.
Relative percent change in discharge, hill slope soil loss, and sediment yield rates for the Angereb watershed.
4. Discussion
Megech River is an important source of water supply for Gondar Town and irrigation use in the Megech watershed. Therefore, evaluating soil loss, sediment yield, and flow as well as assessing climate and land use/cover changes’ impacts are very important. In mountainous areas, such as the Upper Blue Nile Basin, onsite soil loss and offsite sedimentation are the most complex problems threatening agricultural productivity and dam productivity [67,68]. This study examined isolated land use, climate change, and the combined impacts of changing land use/cover and climate on runoff, soil loss, and sediment yield for the Megech watershed. Study results indicated increasing cropland and settlement areas with reductions in forest and rangelands. Studies by Gashaw et al. [69] and Tadesse et al. [70] showed similarity on land use changes in the region, indicating the intensification of soil erosion and sediment yield rates over time in the Upper Blue Nile, Ethiopia. In addition, this study identified climate change and combined scenarios on the impact assessment of watershed soil loss, sediment yield, and flow. The study results of climate change and combined land use/cover and climate changes on soil loss and sediment yield indicated that soil loss and sediment yield rates had higher impacts than land use/cover change for all 2030, 2050, and 2070 timeframes.
4.1. Impact of Land Use Change on Soil Loss, Sediment Yield, and Flow
The findings of this study showed that land use/cover change highly altered soil loss, sediment yield, and river flow of the Megech watershed. To understand land use change patterns and their impacts on the watershed’s hydrology in the Upper Blue Nile Basin, several studies have been performed and reported [13,69,71]. Our study focused on land use/cover change based on the CA-ANN model, and the predictions were for the years 2035, 2055, and 2075, which indicated an increase in cropland and settlement areas with the loss of forest and rangeland in the Megech watershed. Such an increase in cropland and built-up areas and loss of rangeland and forest areas is consistent with other findings reported in the study region [69,72,73] that impacted the soil erosion and flow of the watershed. However, this study integrated land use/cover changes with climate change (RCP4.5 and 8.5) scenarios and employed the process-based GoeWEPP model for the impact analysis. By employing the CA-ANN algorithm for the land use/cover change prediction, this study contributed the technique of applying land use maps and spatial variables to capture the watershed land use dynamics. Additionally, the results of land use change and impacts on soil loss, sediment yield, and flow are useful for sustainable land use planning and implementation of improved soil and water conservation practices to prevent the adverse impacts. Nevertheless, population density data are not directly incorporated into the artificial neural network’s learning process for land use/cover prediction. However, the influence of demography on land use/cover change is indirectly accounted for through spatial variables, such as distance from the city and distance from roads. It is important to note that the model’s prediction results may undergo significant variation due to changing governmental plans, such as the construction of dams and the expansion of agricultural areas, which should be the focus of future studies.
4.2. Impact of Climate Change on Soil Loss, Sediment Yield, and Runoff
In the Megech Dam watershed, we found that climate change had an overall negative impact on soil loss and sediment yield. The maximum temperature showed an increasing trend, while the minimum temperature decreased compared with that in the base period. The projected precipitation showed an increase for some months (wet months) and a decrease for others (dry months), with time windows of the 2030s, 2050s, and 2070s under the RCP4.5 and 8.5 climate scenarios. The studies by Tariku et al. [74] and Getachew and Manjunatha [40] showed similar patterns of temperature, precipitation, and runoff in the study region. These changes result in amplified intensity, consequently leading to an increase in rill erodibility (Kr) and interrill erodibility (Ki), thus increasing soil loss and sediment yield rates over the predicted timeframe. The annual sediment yield rates of the Angereb watershed showed an increasing trend for the RCP4.5 and RCP8.5 climate scenarios for all time windows of the 2030s, 2050s, and 2070s, which implied that climate change will decrease the live storage of dams. Studies in the region also indicated that the RCP8.5 climate scenario produced higher sediment yield and soil loss rates as compared to RCP4.5 [3]. As we projected further into the future, specifically examining scenarios for the near future (2030s), middle future (2050s), and far future (2070s), the intensification of climate change impacts became increasingly evident [40]. This situation was observed across various simulated metrics of runoff, soil loss, and sediment yield. Therefore, in the far future, particularly by the 2070s, climate change impacts are projected to escalate significantly, underscoring the urgent need for proactive measures to mitigate its consequences. This study provided important insights, though it is limited in that only a single method (distribution mapping) was employed in the climate data downscaling and bias corrections, with the ensemble of the five GCM/RCM CORDEX-Africa data, in which a similar weightage was employed, which should be the main focus area of future studies to enhance the accuracy of climate projections.
4.3. Combined LULC and Climate Change Impacts
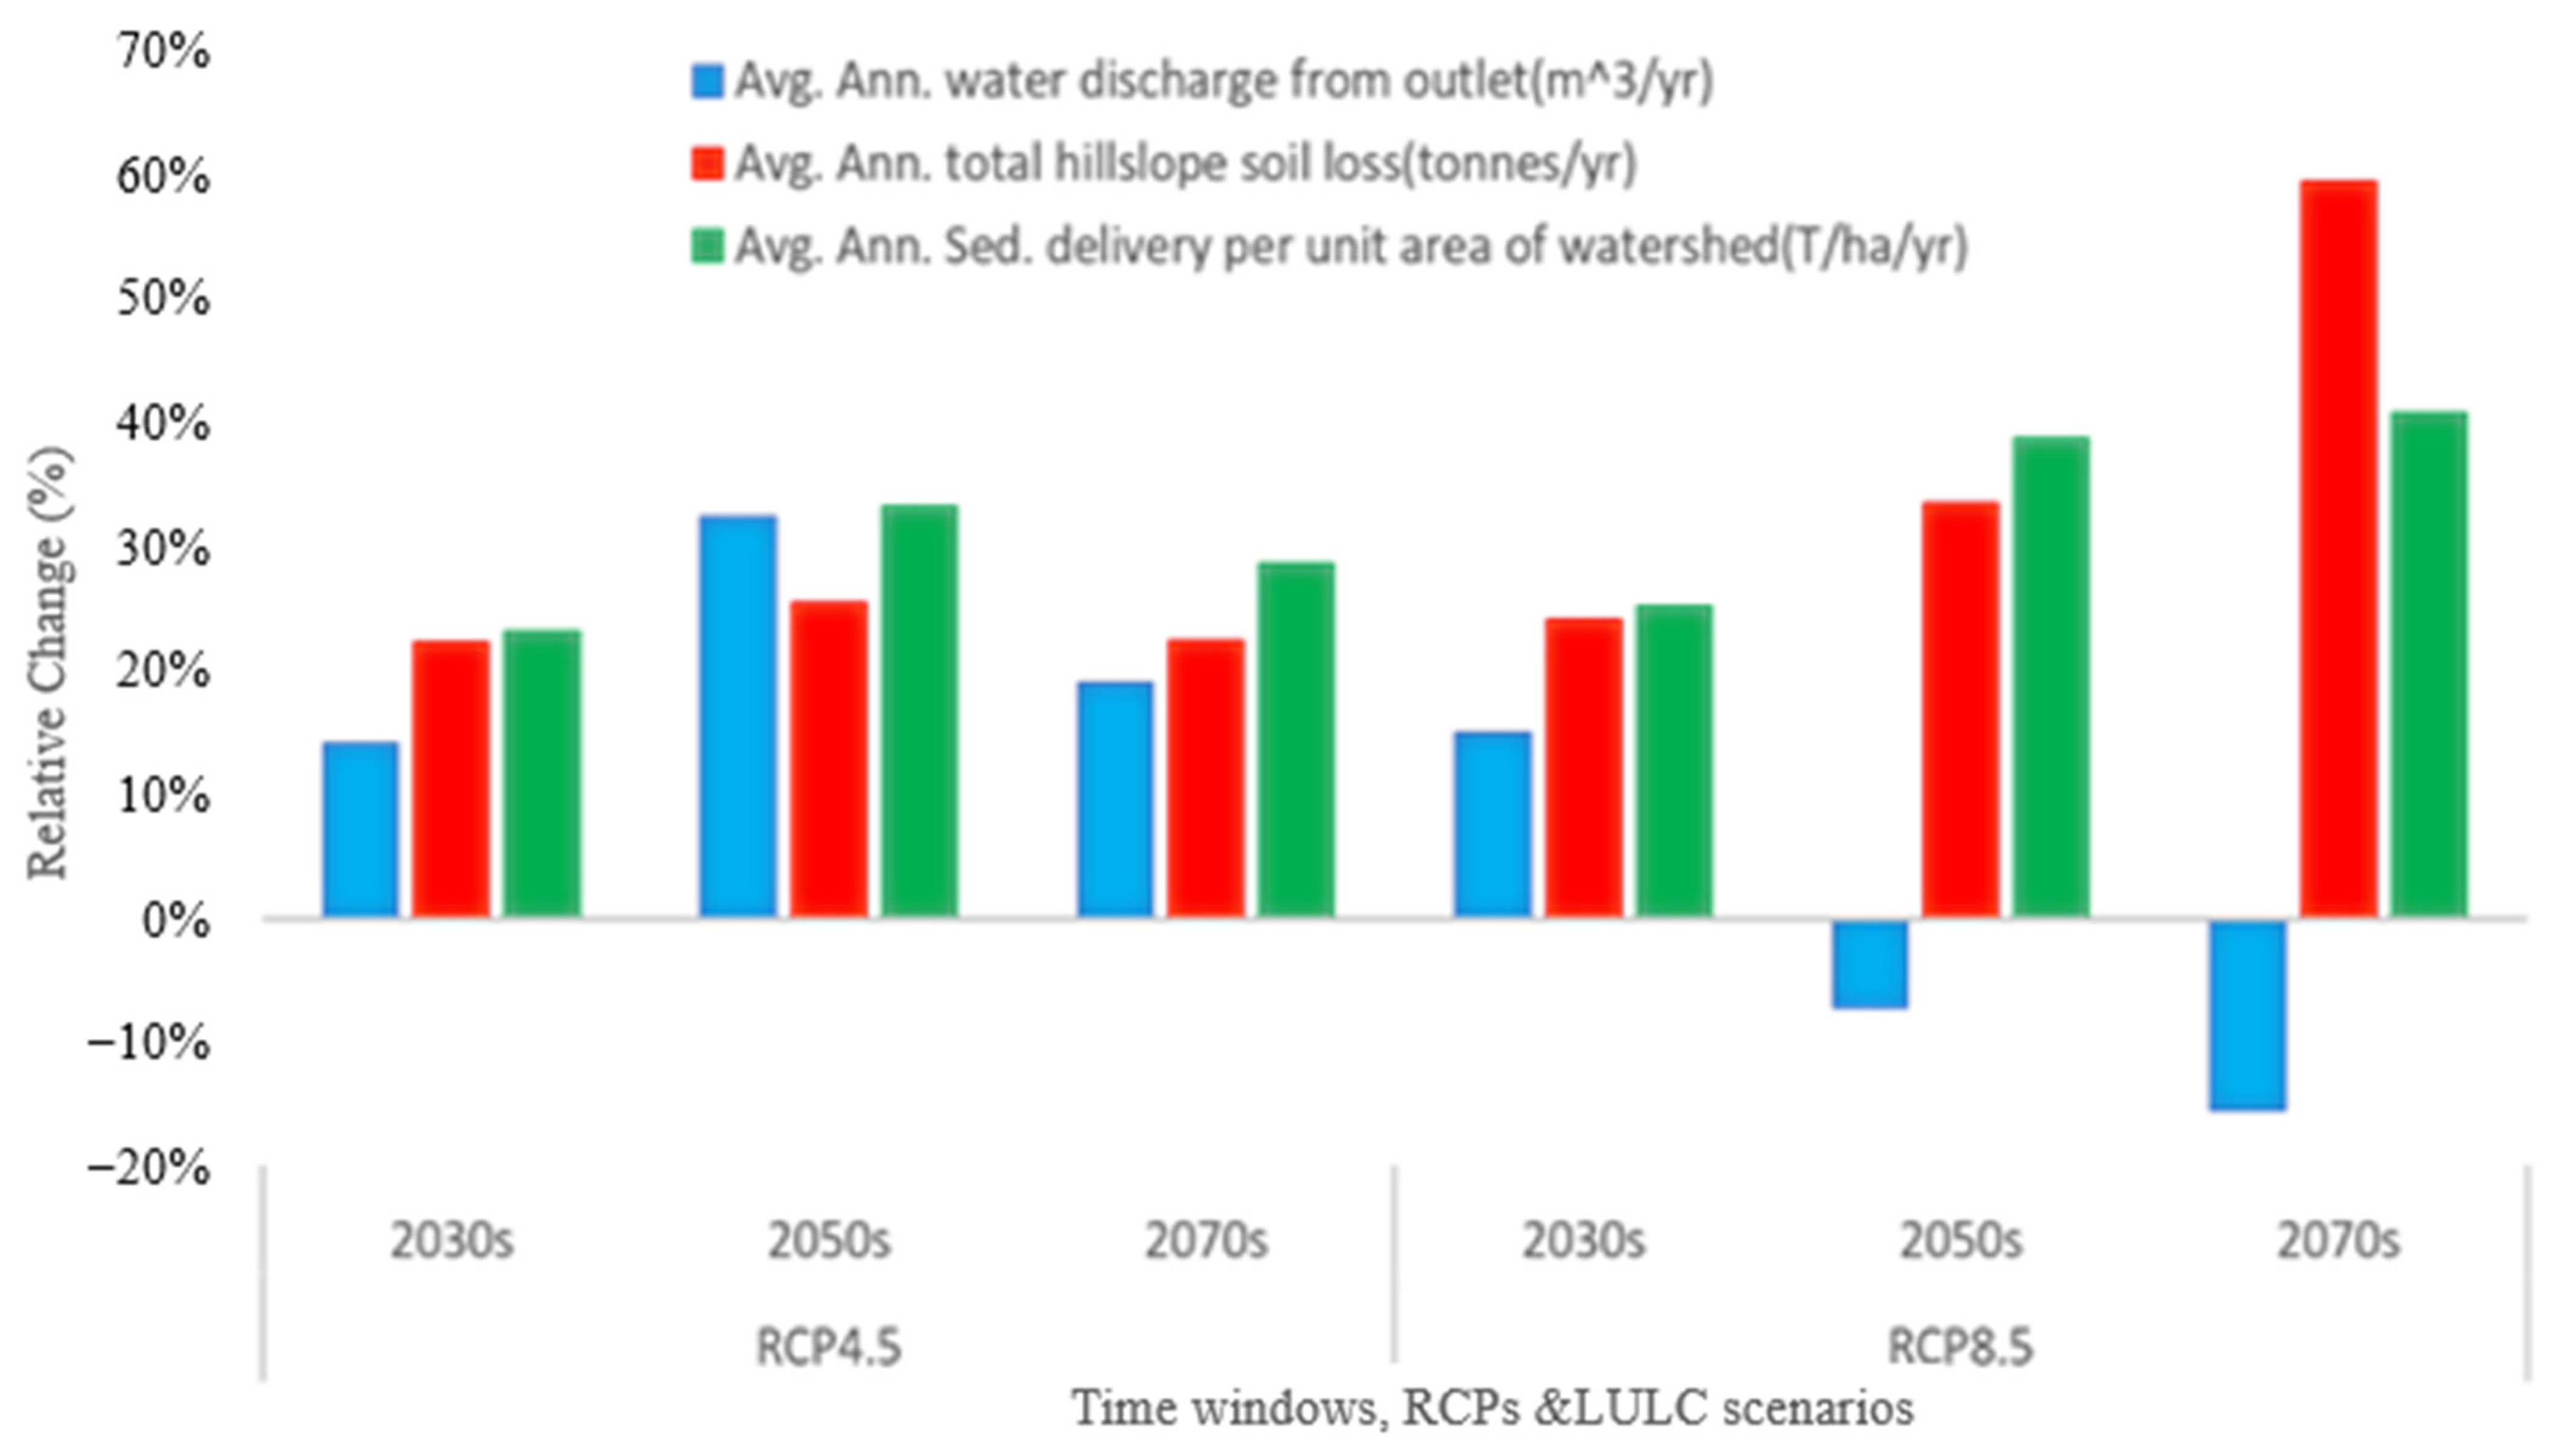
Figure 15 shows the soil loss, sediment yield, and river flow changes, in percent, under the impacts of combined climate and land use/cover impacts. The change in flow at Angerb River, the main tributary of the Megech River, showed an increase under the combined land use/cover and climate changes impacts for the case of the RCP4.5 scenario. However, the combined effects of land use and the RCP8.5 climatic scenario showed an increase in the 2030s and a decline for the 2050s and 2070s (Figure 15). The results of this study showed that flow declined in the far future predictions, consistent with those of previous studies for the Upper Blue Nile Basin [75,76]. Unlike river flow, the effects of combined land use and climate changes on sediment yield showed a significant increase in the far future. The rate of increase of sediment yield ranged from 23.28% to 41.01% under the combined effects of land use changes and climate scenarios (RCP4.5 and RCP8.5) across all timeframes. Similarly, the relative changes in percentage of soil loss under the synergetic land use change and climatic scenarios (RCP4.5 and 8.5) depicted an increase for all time periods. The results indicated a higher relative change under the RCP8.5 scenario and for the farthest time window. Previous studies on soil loss and sediment yield have shown some degree of consistency in the basin [41]. Therefore, the study findings showed that the combined land use/cover and climate changes substantially changed the soil loss, sediment yield, and flow metrics of the watershed. However, it should be noticed that research findings under the combined impacts of climate changes and land use/cover changes are subject to various uncertainties. Among the various sources of uncertainty, climate models, downscaling, bias correction techniques, land use/cover classification errors, the LULC prediction algorithm, and the GeoWEPP model scaling can be taken as the study’s limitations.
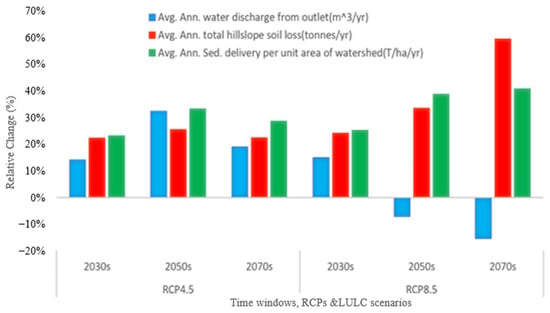
Figure 15.
Combined climate and land use impacts on discharge, hill slope soil loss, and sediment yield rates.
The results clearly indicate that the combined impacts of land use/cover and climate (RCP4.5 and 8.5) changes place significant pressure on the sustainable use of water and land resources in the Megech watershed. The focus of future studies will be on reducing the uncertainties and enhancing the accuracy of the results. Future studies should also include climate mitigation and adaptation and soil and water conservation techniques as strategies to address these significant challenges.
5. Conclusions
This study underlined the potential impacts of land use change and climate change on precipitation and temperature, with a focus on runoff, soil loss, and sediment yield in the Megech Dam watershed. Changes in climate and land use/cover have great potential to impose pressure on water availability, sustainable use of dams, and agricultural productivity in the Upper Blue Nile region.
Three temporal window scenarios of the 2030s, 2050s, and 2070s were selected for the impact analysis, which lie within the useful life of the Megech Dam. The impacts of projected land use/cover and climate on sediment yield, soil loss, and runoff were quantified using the physically based GeoWEPP soil erosion model. The generated land use/cover maps for 2035, 2055, and 2075 indicated an increase in cropland and settlement areas and a decrease in forest and rangelands, while other land uses/cover types, such as water, wetland, and bare land, did not show significant changes. As a result, the soil loss and sediment yield of the watershed increased, while flow depicted inconsistent changes across the selected time periods.
Climate downscaling and bias correction were performed using the distribution mapping technique. The analysis showed that the maximum temperature will increase, while the minimum temperature will decrease. Precipitation was projected to increase for wet months and decrease for dry months under both the RCP4.5 and RCP8.5 scenarios, without a clear pattern. As a result, for the three time windows, the river discharge due to climate change alone and the combination of land use/cover and climate change scenarios decreased/increased by −4.67%/17.32% and 14.18–32.63% for the RCP4.5 scenario and decreased by −4.01% to –20.65% and increased/decreased by 15.07%/−15.53% for the RCP8.5 scenario, respectively.
The sediment yield results showed an increase under the combined land/cover and climate change impacts in all scenarios, with ranges of 23.28–33.37% for RCP4.5 and 25.42–41.02% for RCP8.5, while for soil loss, the ranges were 1.26–5.90% and 11.44–16.86% for RCP4.5 and RCP8.5, respectively. Generally, addressing these challenges requires the use of watershed best-management practices (BMP) and proactive soil and water conservation measures. Overall, policymakers and land managers can mitigate and protect the recently constructed dams’ sedimentation and land productivity losses by adopting climate adaptations strategies and sustainable management practices in the Upper Blue Nile Basin.
Author Contributions
Conceptualization, M.A. and A.M.M.; methodology, M.A.; software, M.A.; validation, M.A.; formal analysis, M.A.; investigation, M.A., A.M.M. and G.T.; resources, M.A.; data curation, M.A.; writing—original draft preparation, M.A.; writing—review and editing, M.A., A.M.M. and G.T.; visualization, M.A.; supervision, A.M.M.; project administration, M.A., A.M.M. and G.T. All authors have read and agreed to the published version of the manuscript.
Funding
This research has not received any external fund.
Data Availability Statement
Data can be obtained upon request from the corresponding author.
Acknowledgments
The authors would like to thank the data providers, the Ministry of Water and Energy (MoWE), the Abbay Basin Authority, and the National Meteorological Agency. The authors express their sincere thanks to the reviewers and the editor for their comments to improve publication quality.
Conflicts of Interest
The authors declare that there are no known competing financial interests or personal relationships that could have appeared to influence the work reported in this paper.
References
- Azimi Sardari, M.R.; Bazrafshan, O.; Panagopoulos, T.; Sardooi, E.R. Modeling the impact of climate change and land use change scenarios on soil erosion at the Minab Dam Watershed. Sustainability 2019, 11, 3353. [Google Scholar] [CrossRef]
- Chuenchum, P.; Xu, M.; Tang, W. Predicted trends of soil erosion and sediment yield from future land use and climate change scenarios in the Lancang–Mekong River by using the modified RUSLE model. Int. Soil Water Conserv. Res. 2020, 8, 213–227. [Google Scholar] [CrossRef]
- Belay, T.; Mengistu, D.A. Impacts of land use/land cover and climate changes on soil erosion in Muga watershed, Upper Blue Nile basin (Abay), Ethiopia. Ecol. Process. 2021, 10, 68. [Google Scholar] [CrossRef]
- Tsegaye, L.; Bharti, R. The impacts of LULC and climate change scenarios on the hydrology and sediment yield of Rib watershed, Ethiopia. Environ. Monit. Assess. 2022, 194, 717. [Google Scholar] [CrossRef] [PubMed]
- Dale, V.H. The relationship between land-use change and climate change. Ecol. Appl. 1997, 7, 753–769. [Google Scholar] [CrossRef]
- Mango, L.M.; Melesse, A.M.; McClain, M.E.; Gann, D.; Setegn, S. Land use and climate change impacts on the hydrology of the upper Mara River Basin, Kenya: Results of a modeling study to support better resource management. Hydrol. Earth Syst. Sci. 2011, 15, 2245–2258. [Google Scholar] [CrossRef]
- Baig, M.F.; Mustafa, M.R.U.; Baig, I.; Takaijudin, H.B.; Zeshan, M.T. Assessment of land use land cover changes and future predictions using CA-ANN simulation for selangor, Malaysia. Water 2022, 14, 402. [Google Scholar] [CrossRef]
- Genet, A. Population growth and land use land cover change scenario in Ethiopia. Int. J. Environ. Prot. Policy 2020, 8, 77–85. [Google Scholar] [CrossRef]
- Negese, A. Impacts of land use and land cover change on soil erosion and hydrological responses in Ethiopia. Appl. Environ. Soil Sci. 2021, 2021, 6669438. [Google Scholar] [CrossRef]
- Borrelli, P.; Robinson, D.A.; Fleischer, L.R.; Lugato, E.; Ballabio, C.; Alewell, C.; Meusburger, K.; Modugno, S.; Schütt, B.; Ferro, V. An assessment of the global impact of 21st century land use change on soil erosion. Nat. Commun. 2017, 8, 2013. [Google Scholar] [CrossRef]
- Kebede, B.; Bekele, A.; Kedir, E. Can the urban poor afford modern energy? The case of Ethiopia. Energy Policy 2002, 30, 1029–1045. [Google Scholar] [CrossRef]
- Awulachew, S.B.; Yilma, A.D.; Loulseged, M.; Loiskandl, W.; Ayana, M.; Alamirew, T. Water Resources and Irrigation Development in Ethiopia; IWMI: Colombo, Sri Lanka, 2007; Volume 123. [Google Scholar]
- Melese, T.; Senamaw, A.; Belay, T.; Bayable, G. The spatiotemporal dynamics of land use land cover change, and its impact on soil erosion in Tagaw Watershed, Blue Nile Basin, Ethiopia. Glob. Chall. 2021, 5, 2000109. [Google Scholar] [CrossRef] [PubMed]
- Moisa, M.B.; Negash, D.A.; Merga, B.B.; Gemeda, D.O. Impact of land-use and land-cover change on soil erosion using the RUSLE model and the geographic information system: A case of Temeji watershed, Western Ethiopia. J. Water Clim. Change 2021, 12, 3404–3420. [Google Scholar] [CrossRef]
- Chimdessa, K.; Quraishi, S.; Kebede, A.; Alamirew, T. Effect of land use land cover and climate change on river flow and soil loss in Didessa River Basin, South West Blue Nile, Ethiopia. Hydrology 2018, 6, 2. [Google Scholar] [CrossRef]
- Tsegaye, B. Effect of land use and land cover changes on soil erosion in Ethiopia. Int. J. Agric. Sci. Food Technol. 2019, 5, 026–034. [Google Scholar] [CrossRef]
- Tewabe, D.; Fentahun, T. Assessing land use and land cover change detection using remote sensing in the Lake Tana Basin, Northwest Ethiopia. Cogent Environ. Sci. 2020, 6, 1778998. [Google Scholar] [CrossRef]
- Takele, A.; Lakew, H.B.; Kabite, G. Does the recent afforestation program in Ethiopia influenced vegetation cover and hydrology? A case study in the upper awash basin, Ethiopia. Heliyon 2022, 8, e09589. [Google Scholar] [CrossRef]
- Berihun, M.L.; Tsunekawa, A.; Haregeweyn, N.; Meshesha, D.T.; Adgo, E.; Tsubo, M.; Masunaga, T.; Fenta, A.A.; Sultan, D.; Yibeltal, M. Exploring land use/land cover changes, drivers and their implications in contrasting agro-ecological environments of Ethiopia. Land Use Policy 2019, 87, 104052. [Google Scholar] [CrossRef]
- Zhai, H.; Lv, C.; Liu, W.; Yang, C.; Fan, D.; Wang, Z.; Guan, Q. Understanding spatio-temporal patterns of land use/land cover change under urbanization in Wuhan, China, 2000–2019. Remote Sens. 2021, 13, 3331. [Google Scholar] [CrossRef]
- Alatorre, L.; Beguería, S.; Lana-Renault, N.; Navas, A.; García-Ruiz, J.M. Soil erosion and sediment delivery in a mountain catchment under scenarios of land use change using a spatially distributed numerical model. Hydrol. Earth Syst. Sci. 2012, 16, 1321–1334. [Google Scholar] [CrossRef]
- Nut, N.; Mihara, M.; Jeong, J.; Ngo, B.; Sigua, G.; Prasad, P.V.; Reyes, M.R. Land use and land cover changes and its impact on soil erosion in Stung Sangkae catchment of Cambodia. Sustainability 2021, 13, 9276. [Google Scholar] [CrossRef]
- Kidane, M.; Bezie, A.; Kesete, N.; Tolessa, T. The impact of land use and land cover (LULC) dynamics on soil erosion and sediment yield in Ethiopia. Heliyon 2019, 5, e02981. [Google Scholar] [CrossRef]
- Eekhout, J.P.; de Vente, J. Global impact of climate change on soil erosion and potential for adaptation through soil conservation. Earth-Sci. Rev. 2022, 226, 103921. [Google Scholar] [CrossRef]
- Chen, C.-N.; Tfwala, S.S.; Tsai, C.-H. Climate change impacts on soil erosion and sediment yield in a watershed. Water 2020, 12, 2247. [Google Scholar] [CrossRef]
- Borrelli, P.; Robinson, D.A.; Panagos, P.; Lugato, E.; Yang, J.E.; Alewell, C.; Wuepper, D.; Montanarella, L.; Ballabio, C. Land use and climate change impacts on global soil erosion by water (2015–2070). Proc. Natl. Acad. Sci. USA 2020, 117, 21994–22001. [Google Scholar] [CrossRef] [PubMed]
- Girmay, G.; Moges, A.; Muluneh, A. Assessment of current and future climate change impact on soil loss rate of Agewmariam Watershed, Northern Ethiopia. Air Soil Water Res. 2021, 14, 1178622121995847. [Google Scholar] [CrossRef]
- Jilo, N.B.; Gebremariam, B.; Harka, A.E.; Woldemariam, G.W.; Behulu, F. Evaluation of the impacts of climate change on sediment yield from the Logiya Watershed, Lower Awash Basin, Ethiopia. Hydrology 2019, 6, 81. [Google Scholar] [CrossRef]
- Alaminie, A.A.; Tilahun, S.A.; Legesse, S.A.; Zimale, F.A.; Tarkegn, G.B.; Jury, M.R. Evaluation of past and future climate trends under CMIP6 scenarios for the UBNB (Abay), Ethiopia. Water 2021, 13, 2110. [Google Scholar] [CrossRef]
- Tegegne, G.; Melesse, A.M. Comparison of trend preserving statistical downscaling algorithms toward an improved precipitation extremes projection in the headwaters of blue nile river in Ethiopia. Environ. Process. 2021, 8, 59–75. [Google Scholar] [CrossRef]
- Chapman, S.; Birch, C.E.; Galdos, M.V.; Pope, E.; Davie, J.; Bradshaw, C.; Eze, S.; Marsham, J.H. Assessing the impact of climate change on soil erosion in East Africa using a convection-permitting climate model. Environ. Res. Lett. 2021, 16, 084006. [Google Scholar] [CrossRef]
- Panagos, P.; Ballabio, C.; Himics, M.; Scarpa, S.; Matthews, F.; Bogonos, M.; Poesen, J.; Borrelli, P. Projections of soil loss by water erosion in Europe by 2050. Environ. Sci. Policy 2021, 124, 380–392. [Google Scholar] [CrossRef]
- Choudhury, B.U.; Nengzouzam, G.; Islam, A. Runoff and soil erosion in the integrated farming systems based on micro-watersheds under projected climate change scenarios and adaptation strategies in the eastern Himalayan mountain ecosystem (India). J. Environ. Manag. 2022, 309, 114667. [Google Scholar] [CrossRef]
- Chakilu, G.G.; Sándor, S.; Zoltán, T.; Phinzi, K. Climate change and the response of streamflow of watersheds under the high emission scenario in Lake Tana sub-basin, upper Blue Nile basin, Ethiopia. J. Hydrol. Reg. Stud. 2022, 42, 101175. [Google Scholar] [CrossRef]
- Roth, V.; Lemann, T.; Zeleke, G.; Subhatu, A.T.; Nigussie, T.K.; Hurni, H. Effects of climate change on water resources in the upper Blue Nile Basin of Ethiopia. Heliyon 2018, 4, e00771. [Google Scholar] [CrossRef] [PubMed]
- Mengistu, D.; Bewket, W.; Dosio, A.; Panitz, H.-J. Climate change impacts on water resources in the upper blue nile (Abay) river basin, ethiopia. J. Hydrol. 2021, 592, 125614. [Google Scholar] [CrossRef]
- Ongoma, V.; Chen, H.; Gao, C. Projected changes in mean rainfall and temperature over East Africa based on CMIP5 models. Int. J. Climatol. 2018, 38, 1375–1392. [Google Scholar] [CrossRef]
- Gelete, G.; Gokcekus, H.; Gichamo, T. Impact of climate change on the hydrology of Blue Nile basin, Ethiopia: A review. J. Water Clim. Change 2020, 11, 1539–1550. [Google Scholar] [CrossRef]
- Gebrechorkos, S.H.; Hülsmann, S.; Bernhofer, C. Long-term trends in rainfall and temperature using high-resolution climate datasets in East Africa. Sci. Rep. 2019, 9, 11376. [Google Scholar] [CrossRef]
- Getachew, B.; Manjunatha, B. Climate change projections and trends simulated from the CMIP5 models for the Lake Tana sub-basin, the Upper Blue Nile (Abay) River Basin, Ethiopia. Environ. Chall. 2021, 5, 100385. [Google Scholar] [CrossRef]
- Getachew, B.; Manjunatha, B.R.; Bhat, G.H. Assessing current and projected soil loss under changing land use and climate using RUSLE with Remote sensing and GIS in the Lake Tana Basin, Upper Blue Nile River Basin, Ethiopia. Egypt. J. Remote Sens. Space Sci. 2021, 24, 907–918. [Google Scholar] [CrossRef]
- Kumar, A.; Singh, A.; Gaurav, K. Assessing the synergic effect of land use and climate change on the upper Betwa River catchment in Central India under present, past, and future climate scenarios. Environ. Dev. Sustain. 2023, 25, 5163–5184. [Google Scholar] [CrossRef]
- Berihun, M.L.; Tsunekawa, A.; Haregeweyn, N.; Tsubo, M.; Fenta, A.A.; Ebabu, K.; Bayabil, H.K.; Dile, Y.T. Predicting runoff and sediment responses to climate-resilient land use and management scenarios. Environ. Sci. Pollut. Res. 2023, 30, 72262–72283. [Google Scholar] [CrossRef] [PubMed]
- Choukri, F.; Raclot, D.; Naimi, M.; Chikhaoui, M.; Nunes, J.P.; Huard, F.; Hérivaux, C.; Sabir, M.; Pépin, Y. Distinct and combined impacts of climate and land use scenarios on water availability and sediment loads for a water supply reservoir in northern Morocco. Int. Soil Water Conserv. Res. 2020, 8, 141–153. [Google Scholar] [CrossRef]
- Ahmad, M.N.; Shao, Z.; Javed, A. Modelling land use/land cover (LULC) change dynamics, future prospects, and its environmental impacts based on geospatial data models and remote sensing data. Environ. Sci. Pollut. Res. 2023, 30, 32985–33001. [Google Scholar] [CrossRef] [PubMed]
- Kamaraj, M.; Rangarajan, S. Predicting the future land use and land cover changes for Bhavani basin, Tamil Nadu, India, using QGIS MOLUSCE plugin. Environ. Sci. Pollut. Res. 2022, 29, 86337–86348. [Google Scholar] [CrossRef] [PubMed]
- Muhammad, R.; Zhang, W.; Abbas, Z.; Guo, F.; Gwiazdzinski, L. Spatiotemporal change analysis and prediction of future land use and land cover changes using QGIS MOLUSCE plugin and remote sensing big data: A case study of Linyi, China. Land 2022, 11, 419. [Google Scholar] [CrossRef]
- Eshete, D.G.; Rigler, G.; Shinshaw, B.G.; Belete, A.M.; Bayeh, B.A. Evaluation of streamflow response to climate change in the data-scarce region, Ethiopia. Sustain. Water Resour. Manag. 2022, 8, 187. [Google Scholar] [CrossRef]
- Tenagashaw, D.Y.; Andualem, T.G.; Ayele, W.T.; Belew, A.Z. Climate change impact on hydro-climatic variables of Ribb watershed, Tana sub-basin, Ethiopia. Appl. Water Sci. 2023, 13, 35. [Google Scholar] [CrossRef]
- Worku, G.; Teferi, E.; Bantider, A.; Dile, Y.T. Statistical bias correction of regional climate model simulations for climate change projection in the Jemma sub-basin, upper Blue Nile Basin of Ethiopia. Theor. Appl. Climatol. 2020, 139, 1569–1588. [Google Scholar] [CrossRef]
- Tigabu, T.B.; Wagner, P.D.; Hörmann, G.; Kiesel, J.; Fohrer, N. Climate change impacts on the water and groundwater resources of the Lake Tana Basin, Ethiopia. J. Water Clim. Change 2021, 12, 1544–1563. [Google Scholar] [CrossRef]
- Phiri, D.; Simwanda, M.; Salekin, S.; Nyirenda, V.R.; Murayama, Y.; Ranagalage, M. Sentinel-2 data for land cover/use mapping: A review. Remote Sens. 2020, 12, 2291. [Google Scholar] [CrossRef]
- Van Vuuren, D.P.; Edmonds, J.; Kainuma, M.; Riahi, K.; Thomson, A.; Hibbard, K.; Hurtt, G.C.; Kram, T.; Krey, V.; Lamarque, J.-F. The representative concentration pathways: An overview. Clim. Change 2011, 109, 5–31. [Google Scholar] [CrossRef]
- Flanagan, D.; Nearing, M. USDA-Water Erosion Prediction Project: Hillslope profile and watershed model documentation. NSERL Rep. 1995, 10, 1196–47097. [Google Scholar]
- Laflen, J.M.; Lane, L.J.; Foster, G.R. WEPP: A new generation of erosion prediction technology. J. Soil Water Conserv. 1991, 46, 34–38. [Google Scholar]
- Renschler, C.S. Designing geo-spatial interfaces to scale process models: The GeoWEPP approach. Hydrol. Process. 2003, 17, 1005–1017. [Google Scholar] [CrossRef]
- Flanagan, D.; Livingston, S.J. WEPP User Summary; NSERL Report: West Lafayette, IN, USA, 1995. [Google Scholar]
- Maalim, F.K.; Melesse, A.M.; Belmont, P.; Gran, K.B. Modeling the impact of land use changes on runoff and sediment yield in the Le Sueur watershed, Minnesota using GeoWEPP. Catena 2013, 107, 35–45. [Google Scholar] [CrossRef]
- Luetzenburg, G.; Bittner, M.J.; Calsamiglia, A.; Renschler, C.S.; Estrany, J.; Poeppl, R. Climate and land use change effects on soil erosion in two small agricultural catchment systems Fugnitz–Austria, Can Revull–Spain. Sci. Total Environ. 2020, 704, 135389. [Google Scholar] [CrossRef]
- Mwendera, E.; Saleem, M.M.; Dibabe, A. The effect of livestock grazing on surface runoff and soil erosion from sloping pasture lands in the Ethiopian highlands. Aust. J. Exp. Agric. 1997, 37, 421–430. [Google Scholar] [CrossRef]
- Yasir, S.; Crosato, A.; Mohamed, Y.A.; Abdalla, S.H.; Wright, N.G. Sediment balances in the Blue Nile River basin. Int. J. Sediment Res. 2014, 29, 316–328. [Google Scholar] [CrossRef]
- IPCC. Summary for Policymakers. In Climate Change and Land: An IPCC Special Report on Climate Change, Desertification, Land Degradation, Sustainable Land Management, Food Security, and Greenhouse Gas Fluxes in Terrestrial Ecosystems; Shukla, P.R., Skea, J., Buendia, E.C., Masson-Delmotte, V., Pörtner, H.-O., Roberts, D.C., Zhai, P., Slade, R., Connors, S., van Diemen, R., et al., Eds.; IPCC: Geneva, Switzerland, 2019. [Google Scholar] [CrossRef]
- Tekleab, S.; Mohamed, Y.; Uhlenbrook, S. Hydro-climatic trends in the Abay/upper Blue Nile basin, Ethiopia. Phys. Chem. Earth Parts A/B/C 2013, 61, 32–42. [Google Scholar] [CrossRef]
- Admas, M.; Melesse, A.M.; Abate, B.; Tegegne, G. Soil erosion, sediment yield, and runoff modeling of the megech watershed using the GeoWEPP model. Hydrology 2022, 9, 208. [Google Scholar] [CrossRef]
- Admas, M.; Melesse, A.M.; Abate, B.; Tegegne, G. Impacts of best management practices on runoff, soil loss, and sediment yield in the megech watershed, Ethiopia. Water 2023, 15, 788. [Google Scholar] [CrossRef]
- Moriasi, D.N.; Arnold, J.G.; Van Liew, M.W.; Bingner, R.L.; Harmel, R.D.; Veith, T.L. Model evaluation guidelines for systematic quantification of accuracy in watershed simulations. Trans. ASABE 2007, 50, 885–900. [Google Scholar] [CrossRef]
- Sinshaw, B.G.; Belete, A.M.; Mekonen, B.M.; Wubetu, T.G.; Anley, T.L.; Alamneh, W.D.; Atinkut, H.B.; Gelaye, A.A.; Bilkew, T.; Tefera, A.K. Watershed-based soil erosion and sediment yield modeling in the Rib watershed of the Upper Blue Nile Basin, Ethiopia. Energy Nexus 2021, 3, 100023. [Google Scholar] [CrossRef]
- Bewket, W.; Teferi, E. Assessment of soil erosion hazard and prioritization for treatment at the watershed level: Case study in the Chemoga watershed, Blue Nile basin, Ethiopia. Land Degrad. Dev. 2009, 20, 609–622. [Google Scholar] [CrossRef]
- Gashaw, T.; Tulu, T.; Argaw, M.; Worqlul, A.W. Modeling the impacts of land use–land cover changes on soil erosion and sediment yield in the Andassa watershed, upper Blue Nile basin, Ethiopia. Environ. Earth Sci. 2019, 78, 679. [Google Scholar] [CrossRef]
- Tadesse, L.; Suryabhagavan, K.; Sridhar, G.; Legesse, G. Land use and land cover changes and Soil erosion in Yezat Watershed, North Western Ethiopia. Int. Soil Water Conserv. Res. 2017, 5, 85–94. [Google Scholar] [CrossRef]
- Teshome, D.S.; Moisa, M.B.; Gemeda, D.O.; You, S. Effect of Land Use-Land Cover Change on Soil Erosion and Sediment Yield in Muger Sub-Basin, Upper Blue Nile Basin, Ethiopia. Land 2022, 11, 2173. [Google Scholar] [CrossRef]
- Bogale, A. Review, impact of land use/cover change on soil erosion in the Lake Tana Basin, Upper Blue Nile, Ethiopia. Appl. Water Sci. 2020, 10, 235. [Google Scholar] [CrossRef]
- Getachew, H.E.; Melesse, A.M. The impact of land use change on the hydrology of the Angereb Watershed, Ethiopia. Int. J. Water Sci. 2012, 1, 6. [Google Scholar]
- Tariku, T.B.; Gan, T.Y.; Li, J.; Qin, X. Impact of climate change on hydrology and hydrologic extremes of Upper Blue Nile River Basin. J. Water Resour. Plan. Manag. 2021, 147, 04020104. [Google Scholar] [CrossRef]
- Mekonnen, D.F.; Duan, Z.; Rientjes, T.; Disse, M. Analysis of combined and isolated effects of land-use and land-cover changes and climate change on the upper Blue Nile River basin’s streamflow. Hydrol. Earth Syst. Sci. 2018, 22, 6187–6207. [Google Scholar] [CrossRef]
- Girma, M.M. Potential Impact of Climate and Land Use Changes on the Water Resources of the Upper Blue Nile Basin. Ph.D. Dissertation, Ferie Universität Berlin, Berlin, Germany, 2013. [Google Scholar]
Disclaimer/Publisher’s Note: The statements, opinions and data contained in all publications are solely those of the individual author(s) and contributor(s) and not of MDPI and/or the editor(s). MDPI and/or the editor(s) disclaim responsibility for any injury to people or property resulting from any ideas, methods, instructions or products referred to in the content. |
© 2024 by the authors. Licensee MDPI, Basel, Switzerland. This article is an open access article distributed under the terms and conditions of the Creative Commons Attribution (CC BY) license (https://creativecommons.org/licenses/by/4.0/).

