Abstract
The need for pedestrian target detection in uncrewed aerial vehicle (UAV) remote sensing images has become increasingly significant as the technology continues to evolve. UAVs equipped with high-resolution cameras can capture detailed imagery of various scenarios, making them ideal for monitoring and surveillance applications. Pedestrian detection is particularly crucial in scenarios such as traffic monitoring, security surveillance, and disaster response, where the safety and well-being of individuals are paramount. However, pedestrian detection in UAV remote sensing images poses several challenges. Firstly, the small size of pedestrians relative to the overall image, especially at higher altitudes, makes them difficult to detect. Secondly, the varying backgrounds and lighting conditions in remote sensing images can further complicate the task of detection. Traditional object detection methods often struggle to handle these complexities, resulting in decreased detection accuracy and increased false positives. Addressing the aforementioned concerns, this paper proposes a lightweight object detection model that integrates GhostNet and YOLOv5s. Building upon this foundation, we further introduce the SPD-Conv module to the model. With this addition, the aim is to preserve fine-grained features of the images during downsampling, thereby enhancing the model’s capability to recognize small-scale objects. Furthermore, the coordinate attention module is introduced to further improve the model’s recognition accuracy. In the proposed model, the number of parameters is successfully reduced to 4.77 M, compared with 7.01 M in YOLOv5s, representing a 32% reduction. The mean average precision (mAP) increased from 0.894 to 0.913, reflecting a 1.9% improvement. We have named the proposed model “GSC-YOLO”. This study holds significant importance in advancing the lightweighting of UAV target detection models and addressing the challenges associated with complex scene object detection.
1. Introduction
Remote sensing technology is playing an increasingly vital role in modern fields of science and technology, with its applications spanning across various domains, such as earth observation [1], environmental monitoring [2], and resource management [3]. Remote sensing target identification, as a core application of remote sensing technology, is essential for the extraction and analysis of target information from remote sensing images. With the rapid growth of remote sensing data and improvements in data processing capabilities, efficiently and accurately identifying and locating targets from large-scale remote sensing images has become a pressing challenge for researchers. In the application of uncrewed aerial vehicle (UAV) remote sensing images, Pan et al. [4] collected multispectral images acquired by UAVs and extracted spatial, spectral, and textural features. Subsequently, they employed the Support Vector Machine (SVM) algorithm for training, classifying pixels or regions in the images such as potholes, cracks, or undamaged road surfaces. Bejiga et al. [5] proposed a method utilizing UAVs equipped with visual cameras to support search-and-rescue (SAR) operations for avalanches. Images captured by the UAVs underwent processing via a pre-trained convolutional neural network (CNN) for feature extraction, followed by the use of a linear SVM for detecting objects of interest.
In recent years, breakthroughs have been achieved in the field of computer vision, particularly with advancements in deep learning technology. Target-detection algorithms based on CNNs have garnered remarkable achievements in various domains. For instance, the introduction of attention mechanisms, multi-scale fusion, and cross-domain object relationship modeling techniques can further improve the performance of detectors in unmanned aerial vehicle images. Zhang et al. [6] proposed the Depthwise-separable Attention-Guided Network (DAGN) method, a framework designed for real-time vehicle detection in unmanned aerial vehicle remote sensing images. Li et al. [7] proposed modifications to YOLOv5, removing the second convolutional layer in the BottleNeckCSP structure and directly merging three-quarters of its input channels with the results processed by the first branch. This reduction in the number of model parameters, along with the addition of a 3 × 3 max-pooling layer in the SPP (spatial pyramid pooling) module of the network model, enhanced the model’s receptive field.
UAVs have revolutionized remote sensing applications by providing versatile platforms for data acquisition in various domains. Among the plethora of tasks facilitated by UAV-captured imagery, pedestrian detection stands out as a crucial task with profound implications for safety, security, and surveillance in diverse scenarios [8,9]. However, the integration of pedestrian detection capabilities into UAV systems is beset by a myriad of challenges stemming from the unique characteristics of UAV remote sensing imaging technology.
One of the primary challenges of UAV remote sensing imaging technology lies in the inherent variability in data acquisition conditions. Unlike fixed surveillance cameras, UAVs capture images from varying altitudes, angles, and distances, leading to significant geometric distortions and scale variations in the acquired imagery [10]. These variations pose substantial challenges for pedestrian detection algorithms, which must adapt to the diverse spatial resolutions and perspectives encountered in UAV imagery. Hong et al. [11] proposed a scale selection pyramid network (SSPNet) for detecting tiny objects, focusing on identifying small-scale persons in large-scale images obtained from UAVs. SSPNet consists of three main components: the context attention module for contextual information integration, the scale enhancement module to highlight features of specific scales, and the scale selection module for appropriate feature sharing between deep and shallow layers.
Shao [12] proposed another solution, Aero-YOLO, a lightweight UAV image target-detection method based on YOLOv8. Aero-YOLO employs GSConv and C3 modules to reduce the number of model parameters, extending the receptive field. Additionally, coordinate attention (CA) [13] and shuffle attention (SA) [14] are introduced to improve feature extraction, which is particularly beneficial for detecting small vehicles from a UAV perspective.
Furthermore, the dynamic nature of the environment in which UAVs operate introduces additional complexities for pedestrian detection. UAVs are often deployed in urban, rural, and natural environments, characterized by diverse lighting conditions, weather phenomena, and terrain features. These environmental factors can adversely affect the visibility and appearance of pedestrians in the captured imagery, hindering detection accuracy. As a result, Wang [15] proposed a pedestrian detection method for UAVs in low-light environments by merging visible and infrared images using a U-type GAN. A convolutional block attention module was introduced to enhance pedestrian information in the fused images, alongside spatial and channel domain attention mechanisms for the generation of detailed color fusion images. Subsequently, a YOLOv3 model with SPP and transfer learning was trained on the fused images. Moreover, the limited payload capacity and power constraints of UAVs imposed restrictions on the sensing modalities and hardware configurations that could be deployed for pedestrian detection tasks.
Balancing the trade-off between computational efficiency, detection accuracy, and energy consumption is a critical consideration in designing effective pedestrian detection systems for UAVs. Giovanna [16] introduced a lightweight CNN designed for crowd counting in UAV-captured images. The network utilizes a multi-input model trained on both real-world images and corresponding synthetic “crowd heatmaps” to focus on crucial image components. During inference, the synthetic input path is disregarded, resulting in a single-view model optimized for resource-constrained devices.
The existing methods, although notable, exhibit limitations in effectively detecting small-scale pedestrians in UAV remote sensing images, primarily due to challenges in spatial resolution and scale variation. Moreover, they struggle to adapt to the dynamic environmental conditions inherent in UAV operations, impacting the detection accuracy across diverse lighting and weather scenarios. Resource constraints pose further challenges, with existing lightweight architectures often failing to optimize the balance between detection accuracy, computational efficiency, and energy consumption. Additionally, shortcomings persist in feature representation and fusion techniques, particularly in low-light environments, hindering pedestrian detection accuracy across varying conditions.
Therefore, an improved lightweight YOLOv5-based method for remote sensing pedestrian detection is proposed in this paper to overcome the shortcomings of traditional algorithms and enhancing the accuracy and efficiency of target detection. This research primarily focuses on two key issues: first, enhancing the YOLOv5 algorithm to adapt to the characteristics of remote sensing images, thus improving the performance and robustness of remote sensing target identification, and second, designing a lightweight model to reduce the number of model parameters and computational load while maintaining recognition accuracy, thus meeting the real-time and efficiency requirements in practical applications.
In summary, our main contributions are as follows:
- GhostNet is integrated with YOLOv5 to reduce the number of model parameters, achieving model lightweighting.
- To enhance the model’s detection of small objects in UAV remote sensing images, we replaced traditional strided convolutions and pooling in CNNs with SPD-Conv.
- An attention mechanism module is added to the model to assist in accurately locating targets in the image.
The chapter organization of this paper is as follows: Section 1 introduces the application of remote sensing technology, along with the challenges faced in pedestrian detection from UAV remote sensing images. Section 2 provides a brief overview of the development of object detection techniques, focusing on small object detection and lightweight networks. In Section 3, we construct a lightweight detection network based on YOLOv5 and provide detailed explanations of the improvements made. Subsequently, in Section 4, we systematically demonstrate the effectiveness of our proposed enhancements through experiments. In Section 5, we discuss the results and compare the proposed model with other mainstream models. Finally, we summarize our work and provide prospects for future research.
2. Related Work
2.1. The Development of Object Detection
Early target-detection methods have primarily relied on human-designed features to represent objects. One of the most famous methods is the cascade classifier based on Haar-like features [17], proposed by Viola and Jones in 2001. This approach divides an image into different regions and uses Haar-like features to describe the pixel value differences within each region, enabling object detection.
Additionally, with the advancements in computer performance, researchers have begun to explore the use of sliding windows for object detection on the entire image. This approach involves employing sliding windows of various sizes across the image and applying a classifier to determine whether each window contains an object. One representative method is the SVM [18] classifier based on the HOG (histogram of oriented gradients) [19]. This method represents objects by calculating gradient histograms in different directions within the image and then utilizes an SVM classifier for object detection, achieving good results in static images.
Later, researchers started to focus on the extraction and description of local features. For example, methods based on the bag-of-visual-words (BoW) [20] model involve decomposing an image into local regions and representing each region by extracting local features, such as SIFT [21] and SURF [22]. Then, a clustering algorithm like K-means is used to cluster the extracted features, generating a set of visual words. Finally, the entire image is represented using the bag-of-words model, and a classifier is employed for object detection. This approach performs well in handling large-scale image databases but faces challenges when target scale variations and rotations are present.
Significant progress in object detection has been made with the rise of deep learning technology, which has replaced traditional methods as the mainstream approach. In 2014, Ross Girshick [23] introduced region-based CNN (R-CNN), the first method merging deep learning with object detection. R-CNN uses a selective search for candidate region generation and applies CNN for feature extraction and classification but suffers from slow processing. In 2015, the authors of [24] improved upon R-CNN with Fast R-CNN, introducing region-of-interest (ROI) pooling for faster feature computation. Later that same year, Ren et al. [25] proposed Faster R-CNN in which a Region Proposal Network (RPN) is incorporated for faster prediction of candidate bounding boxes through sharing of convolutional features.
In attempts to further improve both speed and accuracy, single-stage methods have emerged. For example, in 2016, Wei Liu et al. proposed the Single Shot MultiBox Detector (SSD) method [26], and Joseph Redmon et al. introduced the You Only Look Once (YOLO) [27,28,29,30,31] method. In both, a single-stage detection process is adopted to output the class and location information of objects directly through a single neural network model. This significantly improves detection speed and is suitable for real-time applications.
Transformer-based architectures [32] have recently emerged as a promising approach for object detection, where the power of self-attention mechanisms is leveraged to achieve state-of-the-art performance. The initial explorations of integrating transformers into object detection can be traced back to works such as that by Carion et al. [33] on detection transformers (DETR). With a DETR, a simple and end-to-end trainable architecture is introduced that formulates object detection as a direct set prediction problem. Using transformers to process the input image features, DETR demonstrates competitive performance on various object detection benchmarks without the need for hand-designed components like non-maximum suppression or anchor generation. While DETR demonstrates the potential of transformers in object detection, it suffers from slow training convergence and limited performance on small objects. Subsequent works have focused on addressing these issues.
2.2. Small Object Detection
Traditional approaches like sliding window-based techniques, and region proposal methods such as the selective search algorithm, form the basis of small-object detection but often suffer from computational inefficiency and limited accuracy. Feature pyramid networks (FPNs) [34] address scale variation but may struggle with very small objects because of their limited receptive fields. SSD and Faster R-CNN, though popular, face challenges in accurately detecting small objects, while EfficientDet [35] aims to enhance efficiency but may still encounter difficulties with cluttered scenes. An anchor-free method like CenterNet [36] simplifies the workflow but may struggle with extreme scale variations.
Another line of research has explored combining the strengths of both transformers and CNNs. With ConvNets [37] and YOLOv5 [30], transformers are integrated into existing CNN-based detection frameworks, leveraging the hierarchical feature representations learned by CNNs while benefiting from the global modeling capabilities of transformers. Object detection often requires handling objects of varying scales and in different contexts. Transformers have been shown to be effective in capturing cross-modal information, making them suitable for tasks like multi-scale object detection. With a Positional Embedding Transformer (PETR) [38], positional encoding techniques are incorporated to enhance the transformer’s ability to handle spatial information, improving detection accuracy especially for small objects. However, these approaches may increase the computational complexity.
Overall, while progress has been made, addressing challenges such as detection time, resource requirements, and the detection accuracy of very small objects remains a focus for future research. Sunkara [39] created new CNN architectures by applying SPD-Conv (a space-to-depth layer followed by a non-strided convolution layer) to YOLOv5 and ResNet, experimentally demonstrating that their model performs very well on complex tasks involving low-resolution images and small objects, with little additional computational resources and inference time.
2.3. Lightweight Network
A lightweight network refers to a model with fewer parameters and computational complexity than a traditional deep neural network. Early lightweight networks were primarily designed manually to reduce model complexity. For example, LeNet-5 [40] is a classic lightweight CNN model used for handwritten digit recognition that consists of several convolutional and pooling layers. With early lightweight networks, the focus was on reducing parameter and computational requirements to meet the demands of resource-constrained devices.
To further reduce the parameter and computational requirements of lightweight networks, researchers have explored techniques such as pruning and quantization [41]. Network pruning involves removing redundant connections or parameters in the network, thereby reducing the model size and computational complexity. Classic pruning methods include structured pruning, unstructured pruning, and pruning algorithms based on sparse rules. On the other hand, the floating-point weights and activation functions are converted into low-bit fixed-point representations via quantization. These optimization methods have improved the efficiency of lightweight networks to some extent.
Knowledge distillation methods [42] subsequently emerged as a way to transfer the knowledge from large complex models to smaller models. This involves training a large model (teacher model) and transferring its knowledge to a smaller model (student model). By doing so, the model size and computational complexity can be reduced while maintaining relatively high accuracy.
With the increasing demand for lightweight models, researchers have started to design specialized lightweight network architectures. These networks typically incorporate specific modules or design principles to reduce parameter count and computational complexity. Examples include the MobileNet series [43,44,45], ShuffleNet series [46,47], and EfficientNet [48]. In addition, there are automated model compression methods that utilize techniques such as reinforcement learning, evolutionary algorithms, or neural architecture search. These methods automatically search and optimize models, resulting in smaller lightweight networks with high performance.
3. Materials and Methods
3.1. GSC-YOLO Network Framework
To address the issues of large parameter count and low recognition accuracy in object detection models for UAV remote sensing images, we propose a lightweight model called GSC-YOLO (which stands for GhostNet, SPD-Conv, and coordinate attention YOLOv5), a fusion of YOLOv5s and GhostNet. The structure of GSC-YOLO is illustrated in Figure 1.
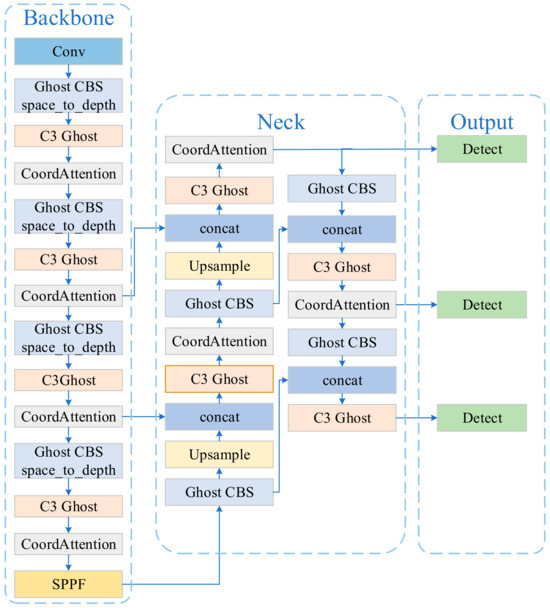
Figure 1.
The architecture of the GSC-YOLO model. We replaced all convolutional structures in the original YOLOv5 with Ghost Conv, applied SPD-Conv modules for downsampling operations, and incorporated the Coordinate Attention mechanism to enhance detection accuracy.
All CBS and C3 modules in the YOLOv5 network (Figure 2) are replaced with GhostCBS and C3Ghost modules to reduce the parameter count (as shown in Figure 3). Then, a space-to-depth step is incorporated after GhostCBS in the backbone structure to enhance the network’s feature extraction capability. Finally, an attention mechanism is introduced, allowing the model to focus on important areas in the image by learning attention weights. This enables GSC-YOLO to achieve more accurate detection and localization of objects in various complex scenes than YOLOv5s.
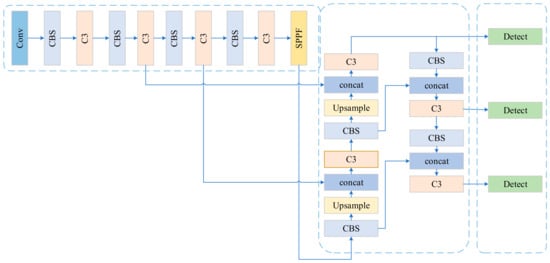
Figure 2.
The architecture of original YOLOv5 model. In YOLOv5, CBS stands for Conv-BN-SiLU. It represents a convolutional layer followed by batch normalization (BN) and the SiLU activation function. C3 is a network architecture module in YOLOv5 that is used to extract features (the specific network structure of CBS and C3 is shown in Figure 3). Spatial Pyramid Pooling Fusion (SPPF) captures information of different scales using pooling nuclei of different sizes.
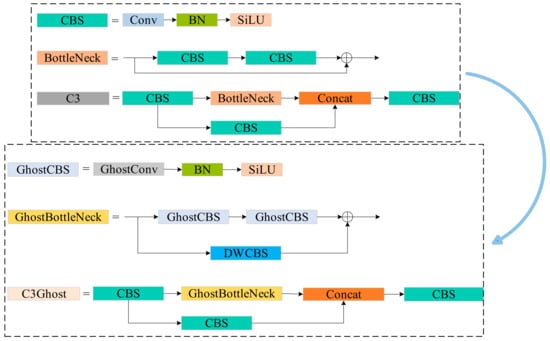
Figure 3.
Comparison of the original YOLOv5 structural unit and the GhostNet structural unit with replacement. The above section shows the original unit of YOLOv5, while the unit below illustrates the replacement unit we used. This modification effectively reduces the model’s parameter count and improves inference speed.
3.2. Ghost Net
GhostNet [49] is a lightweight CNN architecture designed to provide efficient and accurate image classification. It is inspired by the Ghost Module (as shown in Figure 4), where the network computation and parameter count are reduced via low-cost operations. As a result, the model of capacity of GhostNet is better while maintaining a lightweight nature. The Ghost Module, as the core component of GhostNet, first compresses the number of channels in the input image using regular convolutions. Then, it generates additional feature maps through linear transformations and concatenates these different feature maps together to form a new output. This operation significantly reduces the computational cost of the model. Specifically, it works as follows:
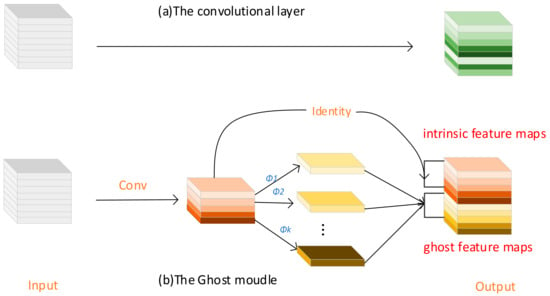
Figure 4.
Comparison between convolution layer and Ghost module: ordinary convolution directly convolves the entire input feature map with filters, while Ghost module convolution splits the operation into two stages, using a standard convolution followed by a lightweight convolution (depthwise separable convolution).
If there is an input feature map of size h × w × c and we want to obtain an output of size h′ × w′ × n using a convolutional kernel of size k × k, then the number of computations required to complete one convolution calculation for a regular convolution process is
In Equation (1), cost represents the number of computation required to complete one convolution calculation. h and w denote the height and width of the input feature map, respectively, while c represents the number of channels. Similarly, h′ and w′ represent the height and width of the output feature map, respectively, and n represents the number of output feature channels. k represents the size of the convolutional kernel.
If the linear operation within GhostConv is set as a depthwise separable convolution, then the computational required for performing this convolution operation is
where represents the proportion of channels that undergo regular convolution compared to the total number of output feature channels in the entire convolution operation and h′ and w′ represent the height and width, respectively, of the output feature map after GhostConv.
If we replace regular convolution with GhostConv, the compression ratio of computational between these two operations is theoretically
In Equation (3), represents the compression ratio of computational cost between regular convolution and GhostConv. Equation (4) provides a simplified version of the compression ratio when c is much larger than s.
GhostNet is composed of several Ghost Bottlenecks (Figure 5), which use Dwconv2d (Depthwise Separable Convolution) and GhostConv as the basic convolution units. Ghost Bottlenecks are further classified into two structures: strides = 1 and strides = 2.
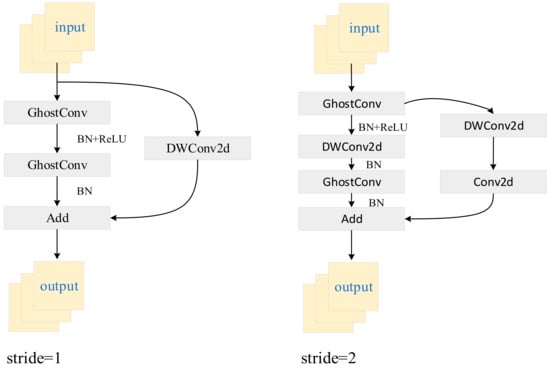
Figure 5.
Ghost Bottleneck. In the structure on the left, the backbone consists of two concatenated Ghost Modules (GM). With a stride of 1, this configuration does not compress the height and width of the input feature layer, thereby deepening the network. In contrast, the structure on the right introduces a depthwise separable convolution with a stride of 2 between the two GM. This allows compression of the feature map’s height and width by half compared to the input size.
3.3. K-Means Algorithm
In UAV remote sensing imagery, pedestrians may exhibit significant variations in size, pose, and viewpoint. Employing the K-means algorithm enables the adaptive selection of suitable anchor sizes based on the actual distribution of target scales and shapes within the dataset. This facilitates better coverage of pedestrians with diverse scales and shapes.
The algorithm unfolds through a series of systematic steps: Firstly, a training dataset is meticulously curated, with a focus on acquiring comprehensive annotated bounding box data tailored specifically for object detection tasks. Subsequently, a rigorous process of feature extraction ensues, whereby salient attributes such as width, height, and aspect ratio are meticulously derived from each bounding box. The initialization of cluster centers marks the commencement of the clustering procedure, wherein K initial cluster centers are meticulously chosen. This selection process may either entail a random assignment of K bounding boxes or a deliberate initialization guided by prior knowledge. Thereafter, the assignment of samples to clusters transpires, facilitated by the calculation of their distances to the K cluster centers, leading to their allocation to the cluster exhibiting the closest proximity. Iterative refinement ensues as the cluster centers are methodically updated by computing the average values derived from all bounding boxes encompassed within each cluster. The iterative process persists until either the cluster centers exhibit negligible fluctuations or a predetermined iteration threshold is attained. Ultimately, the selection of representative cluster centers culminates, discerned through a meticulous evaluation of the clustering outcomes, with these selected representatives serving as the esteemed prior boxes.
As per the architectural design of the YOLOv5 algorithm under investigation, it is customary for each detection head to encompass three candidate bounding boxes, thereby yielding a collective presence of three detection heads and, correspondingly, nine Anchor Boxes (Table 1). This architectural insight influenced our deliberation to designate the value of K as 9 when implementing the K-means algorithm. This strategic decision ensures the methodical clustering of each detection head, thereby delineating nine Anchor Boxes tailored for object detection purposes.

Table 1.
Comparison of candidate box size before and after using K-means algorithm. It should be noted that P3, P4, and P5 in the table, respectively, represent the three detection heads in the YOLOv5.
3.4. SPD-Conv
Traditional object detection networks face challenges in effectively detecting small objects due to inherent limitations.
Firstly, convolutional operations like stride convolutions and pooling layers often lead to critical information loss, primarily caused by downsampling and decreased spatial resolution. Secondly, small objects’ limited spatial coverage contrasts with traditional networks’ fixed receptive fields, hindering the capture of necessary contextual information and leading to incomplete understanding and localization difficulties. Lastly, traditional networks’ constrained spatial context and reduced resolution may inadequately learn discriminative features for small objects, resulting in suboptimal performance in distinguishing them from larger objects or complex backgrounds.
SPD-Conv is a novel building module for CNN architectures that aims to enhance the performance of object detection models. It replaces commonly used stride convolutions and pooling operations in typical CNN architectures. It consists of two main components: the SPD layer and the non-stride convolution layer. The SPD layer downsamples the feature map without losing important information in the channel dimension. It rescales the feature map while preserving all information, thereby eliminating the need for stride convolutions and pooling operations. A non-stride convolution layer is added after the SPD layer to obtain the desired number of channels. The advantages of SPD-Conv include the preservation of fine-grained information, improved feature representation, and scalability. By avoiding stride convolutions and pooling operations, SPD-Conv retains the fine-grained details of the original feature map, which is crucial for the accurate detection of small objects. It enhances the representation of small objects and low-resolution images, leading to more precise detection. Additionally, SPD-Conv can be easily scaled or adjusted to accommodate different applications or hardware requirements. Assuming we have an intermediate feature map X of size S × S × C1, the SPD structure performs slicing operations on this map to obtain the following sub-features in sequence:
where scale is a scaling factor that determines the downsampling rate applied to the input feature map X. The notation represents the sub-feature maps obtained through iterating slicing operations, where i and j increase from 0 to (scale − 1). Each sub-feature map has a size of S/scale × S/scale × C1, where S represents the spatial dimensions of the input feature map and C1 represents the number of channels. For instance, when scale = 2 (Figure 6), the input feature map is divided into four sub-feature maps, each with dimensions S/2 × S/2 × C1. These sub-feature maps are then concatenated along the channel dimension, resulting in a new feature map X′ with dimensions S/2 × S/2 × (4C1). Finally, a 1 × 1 convolutional kernel with dimensions C2 is applied to transform the concatenated feature map X′ into the desired feature map size.
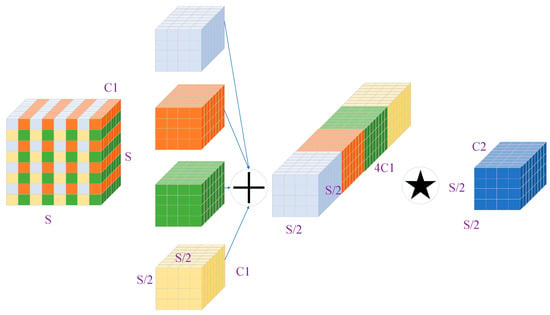
Figure 6.
The process of downsampling the feature map using SPD-Conv when scale = 2, where the star represents the 1 × 1 convolution operation. In this process, SPD-Conv first divides the input feature graph into four sub-feature graphs, then concatenates them along the channel direction, and finally employs a 1 × 1 convolution to achieve the desired number of channels.
We apply the method described above to the backbone and neck parts of YOLO-Ghost (as shown in Section 4.2.2), in which SPD-Conv replaces the downsampling layer (Figure 7). In the backbone, YOLO-Ghost has 5 subsampling layers, that is, times downsampling of the feature map; in the neck, there are two downsampling layers, or times downsampling of the feature map. Using 5 (only backbone) and 7 (both backbone and neck) SPD-Conv modules, we demonstrate that this method is more advantageous in small target detection.
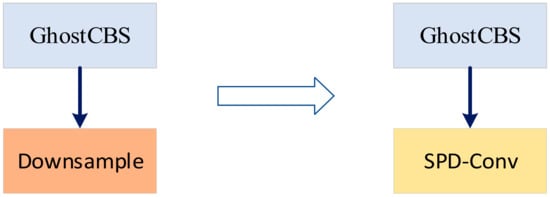
Figure 7.
Replacement of the downsampling module with SPD-Conv. We adopt SPD-Conv within the backbone and neck architectures, respectively, as substitutes for the conventional downsampling operation inherent to standard convolutions. This choice is made with the intention of preserving fine-grained characteristics during transition phases.
3.5. Coordinate Attention
The CA mechanism is an improvement over the squeeze-and-excitation (SE) [50] attention mechanism, where positional information is embedded into channel attention (Figure 8). The SE attention mechanism primarily enhances the importance of different channels by learning channel weights through global average pooling (Equations (6)) and fully connected layer operations. It focuses on inter-channel information interaction while overlooking the significance of positional information. On the other hand, CA incorporates two 1D global average pooling operations to capture global information in both the horizontal and vertical directions of the feature map. It then utilizes two fully connected layers to learn the feature weights. As a result, CA can capture long-range dependencies in the feature map while preserving precise positional information. By encoding positional information, it generates a pair of direction-aware and position-sensitive attention maps, thereby improving the representation capability for the objects of interest.
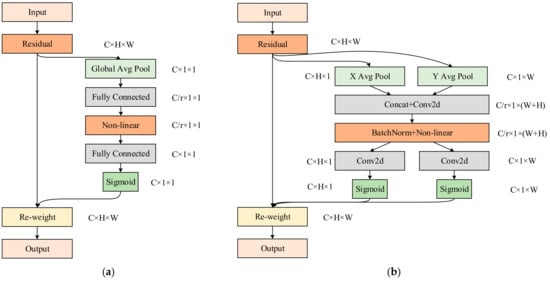
Figure 8.
Comparison of structures of two attention mechanisms: (a) SE, (b) CA. CA can be considered an extension of SE, as it not only attends to inter-channel correlations, but also concentrates attention on spatial locations, thereby enhancing the model’s spatial awareness.
The main operations of CA are as follows: Firstly, the input feature map undergoes two 1D global average pooling operations along each spatial direction (Equations (7) and (8)). Specifically, given input X, we encode each channel separately along the horizontal and vertical axis with two spatial ranges of pooling kernels and . This enables global information to be separately captured in both spatial directions.
The features obtained from the two global average pooling operations are concatenated followed by dimensionality reduction using 1 × 1 convolutional kernels and subsequent batch normalization.
where denotes the concatenation operation along the spatial dimension, represents the non-linear activation function, and denotes the shared 1 × 1 convolutional transformation.
After the computation outlined in Equation (9), we obtain intermediate variables, as shown in Equation (10).
where is the reduction ratio of the control block size.
Subsequently, is split into two tensors along the spatial dimension (as shown in Equations (11) and (12)).
Then, two 1 × 1 convolutional transformations, and , are utilized to respectively transform and into tensors with the same channel number as the input X.
where σ is the sigmoid activation function.
Finally, the outputs and from the previous step are unfolded and used as attention weights. The output of Coordinate Attention Block Y can be represented in the form of Equation (15).
From the derivation of the above equations, it can be observed that CA introduces positional information in addition to channel attention, enabling a more comprehensive capture of spatial relationships.
4. Experiments
4.1. Experimental Setup
4.1.1. Experimental Parameter Configuration
The experiment was conducted using the Windows 10 operating system, PyTorch (1.12.1 + cu116) as the deep learning framework, Python version 3.8, CUDA version 11.6, and CUDNN version 8.6.0 for network acceleration. Additionally, in the model training process, the configuration of hyperparameters plays a crucial role. The specific configuration is shown in Table 2.

Table 2.
Hardware and hyperparameter configuration in the model training process.
4.1.2. Dataset
The selected dataset for the experiment was sourced from the roboflow website and consists of aerial images captured by UAVs. This dataset includes pedestrian images in park settings, street settings, as well as forest and snowy environments with complex backgrounds (Figure 9). This selection aimed for a higher robustness for the pedestrian object detection model across different scenes. We partitioned the dataset, consisting of 4000 images and 8397 target instances, into a ratio of 7:2:1. The training set received the majority, comprising 2672 images and 5863 target instances. Subsequently, we allocated 874 images with 1618 target instances to the validation set and 454 images with 916 target instances to the test set.

Figure 9.
Pedestrian images in the dataset corresponding to different scenarios: (a) park; (b) street; (c) forest; (d) snowfield.
4.1.3. Evaluation Methodology
In the field of object detection, the following well-established evaluation metrics are commonly utilized to measure the performance of algorithms in detection tasks.
Precision P is a metric that measures the proportion of correctly predicted positive samples out of all samples predicted as positive by an algorithm, thereby evaluating the accuracy of the model. TP represents true positives (the number of samples correctly predicted as positive), and FP represents false positives (the number of samples incorrectly predicted as positive).
Recall R is a metric that measures the proportion of correctly predicted positive samples out of all actual positive samples, thereby evaluating the coverage of the model. FN represents false negatives (the number of samples incorrectly predicted as negative).
In the target detection experiments, we aspire for an optimal trade-off between Precision and Recall, where higher values for both metrics are desirable. However, it is recognized that in certain scenarios, these two metrics can be inherently contradictory, posing a challenge in achieving both simultaneously. Consequently, a comprehensive evaluation encompassing both Precision and Recall is crucial. One widely adopted approach to balancing these metrics is the utilization of the F1-score.
Average precision AP is the average value of precision corresponding to all recall values ranging from 0 to 1. It is also equal to the area under the P-R curve.
In practice, the value of this integral is approximated by summing the product of precision and the change in recall at each possible threshold (during training, we set the IOU threshold to 0.5).
Mean average precision (mAP) is a metric obtained by averaging the average precision across different classes. In object detection, precision is separately calculated for each class, and these precision values are then averaged. In this paper, since there is only one class (person), mAP is equal to AP. Additionally, apart from mAP, another important evaluation metric worth considering for this study is the model parameter count, given the objective is to create a lightweight object detection model. This is because smaller models are more easily deployable on embedded devices and UAVs, improving storage space utilization.
4.2. Performance Improvement Validation Experiment
For YOLOv5, a one-stage detector design is adopted, enabling it to achieve faster detection speed while maintaining high accuracy. It provides a range of pre-trained models that can be applied to various detection tasks, including human and vehicle detection. However, compared to some other lightweight object detection models, YOLOv5 has a relatively large model size, which may pose challenges in terms of storage and transmission. Additionally, because of the larger receptive fields, YOLOv5 may encounter difficulties in handling small objects, potentially resulting in less precise detection results. To address these issues, we propose several improvements.
4.2.1. Lightweight Improvement
GhostNet reduces the number of model parameters by using a module called Ghost Module. On the other hand, YOLOv5 has the main characteristics of a deeper and wider network structure and innovative techniques, such as PANet [51] and SPPF. These techniques enable YOLOv5 to more effectively capture features of different scales and semantics in object detection tasks, thereby improving detection accuracy.
By combining the GhostNet and YOLOv5 models, we fully leverage their respective strengths. GhostNet, as the backbone network, provides lightweight and efficient feature extraction, resulting in lower computation and memory consumption on resource-limited devices. Meanwhile, YOLOv5, as the detection head, accurately locates and classifies objects with its powerful detection capabilities. Therefore, this combination fulfills the need for model lightweighting while maintaining high performance. As shown in Table 3, after replacing the C3 module and Conv module in YOLOv5 with C3Ghost and GhostConv, the model’s parameter count decreased by nearly 50%. However, this change also resulted in a decrease in various detection metrics. Specifically, Precision and Recall decreased from 0.92 and 0.81 to 0.858 and 0.692 respectively, while mAP and F1-score decreased from 0.894 and 0.862 to 0.774 and 0.766. In the next steps, we explore how to improve the detection accuracy of lightweight networks.

Table 3.
Performance comparison of the network after lightweight operations.
As is widely known for images captured by UAVs, the objects occupy a relatively small portion of the entire image. The preset anchor sizes in the YOLO model may not align well with the sizes of the targets in the dataset. Therefore, we chose to use the K-means algorithm to reconfigure the sizes of the candidate bounding boxes, aiming to improve the model accuracy.
From Table 4, it can be observed that after re-clustering using the K-means algorithm, the model exhibits significant performance improvement without altering the parameter size.

Table 4.
Improving the lightweight model using the K-means algorithm.
4.2.2. SPD-Conv Improvement
The YOLOv5 network structure consists of three components: backbone, head, and detect. To validate the effectiveness of the SPD-Conv module, we built upon the model presented in the previous section and added the SPD module in two steps: first, adding it only to the backbone; second, adding it to both the backbone and head. Both approaches were effectively validated. When the SPD module was added only to the backbone, the model precision improved from 0.926 to 0.929, recall improved from 0.821 to 0.85, and mAP increased from 0.89 to 0.909. Furthermore, when we added the SPD module to both the backbone and head, the mAP increased by 2.5% to 0.915 (Table 5). These experimental results strongly demonstrate that the SPD module can effectively enhance the model’s ability to recognize small objects.
Since our objective is to make the network model more lightweight, we chose a model with a smaller parameter count (adding SPD only to the backbone) as the subject of the next step in our research.
4.2.3. Attention Mechanism Improvement
The principle of attention mechanism is based on the workings of the human visual system. In object detection models, the attention mechanism is commonly used to achieve two key steps: feature extraction and region selection. During the feature extraction process, the attention mechanism selectively focuses on certain regions of the image to enhance the feature representation of target areas. This can be achieved by computing attention weights for each position, which can be learned based on the relationship between the target and background. In the candidate bounding box generation or region proposal stage, the attention mechanism helps the model select candidate boxes or regions relevant to the target. By calculating attention scores for each candidate box or region, the model can selectively focus on the regions that are most likely to contain the target. Moreover, it helps the model handle situations such as occlusions and overlaps between objects. By placing attention on important objects, the model can better distinguish different targets and accurately perform localization and classification.
To demonstrate the superiority of CA over other attention mechanisms, this study conducted comparative experiments with four other attention mechanisms, including SA, convolutional block attention (CBAM) [52], efficient channel attention (ECA) [53], and SE.
From the experimental results (Table 6), it can be observed that not all attention mechanisms have a positive impact on the model. For example, shuffle attention, which was applied to the baseline model, resulted in a decrease in mAP from 0.909 to 0.908. Similarly, the addition of ECA had no effect on the model’s mAP. However, CA, the attention mechanism selected in this study, provided the greatest improvement in mAP, which increased to 0.913.
4.2.4. Further Experiment Clarification
Regarding the experiments mentioned above, we have an additional point we would like to elucidate. In Table 5, the method backbone, head + SPD demonstrates an mAP of 0.915, while our proposed GSC-YOLO model achieves an mAP of only 0.913. This initially suggests superior performance of the former. However, it is noteworthy that these mAP values were attained during training with a batch size of 36. Remarkably, when the batch size is reduced to 1, our proposed model achieves an mAP of 0.915, compared to 0.914 for the backbone, head + SPD method (Table 7). Despite slight performance variations observed among these models with different input image batch sizes, the disparity in mAP between them remains minimal, indicating comparable efficacy in object detection tasks. Nevertheless, in this context, our proposed model exhibits a distinct advantage in terms of size, thereby prompting its preference over the backbone, head + SPD method.

Table 5.
Validating the effectiveness of the SPD module by adding it at different positions in the network.
Table 5.
Validating the effectiveness of the SPD module by adding it at different positions in the network.
| Methods | P | R | mAP | F1-Score | Parameters |
|---|---|---|---|---|---|
| K-means + YOLO-Ghost | 0.926 | 0.821 | 0.89 | 0.870 | 3.68 M |
| Backbone + SPD | 0.929 | 0.85 | 0.909 | 0.888 | 4.72 M |
| backbone, head + SPD | 0.923 | 0.864 | 0.915 | 0.893 | 5.21 M |

Table 6.
Showcasing the superiority of CA mechanism by conducting experimental comparisons through the addition of different attention modules.
Table 6.
Showcasing the superiority of CA mechanism by conducting experimental comparisons through the addition of different attention modules.
| Methods | P | R | mAP | F1-Score | Parameters |
|---|---|---|---|---|---|
| Backbone + SPD | 0.929 | 0.85 | 0.909 | 0.888 | 4.72 M |
| +SA | 0.935 | 0.851 | 0.908 | 0.891 | 4.72 M |
| +ECA | 0.941 | 0.835 | 0.909 | 0.884 | 4.72 M |
| +CBAM | 0.917 | 0.859 | 0.91 | 0.887 | 4.78 M |
| +SE | 0.937 | 0.854 | 0.912 | 0.894 | 4.78 M |
| +CA (GSC-YOLO) | 0.947 | 0.843 | 0.913 | 0.892 | 4.77 M |

Table 7.
When the batch size is set to 1, the performance comparison between the method backbone, head + SPD and our proposed GSC-YOLO model on pedestrian detection in UAV remote sensing images.
Table 7.
When the batch size is set to 1, the performance comparison between the method backbone, head + SPD and our proposed GSC-YOLO model on pedestrian detection in UAV remote sensing images.
| Methods | P | R | mAP | Parameters | GFLOPs |
|---|---|---|---|---|---|
| backbone, head + SPD | 0.923 | 0.862 | 0.914 | 5.21 M | 18.5 |
| GSC-YOLO | 0.942 | 0.847 | 0.915 | 4.77 M | 16.6 |
In addition, we conducted another experiment wherein we augmented the backbone, head + SPD method with the same attention module (referred to here as Model A), yielding an mAP result of 0.916. This result is only 0.01 higher than our proposed model’s mAP. However, it is worth noting that while our proposed model has a GFLOPS (Giga Floating Point Operations Per Second) of 16.6, Model A has a GFLOPS of 18.6 (Table 8). In resource-constrained environments such as UAV platforms, where computational resources are limited, our proposed model’s lower GFLOPS suggests greater practicality and deployability.

Table 8.
After incorporating the CA mechanism into the method backbone, head + SPD (Model A), a performance comparison with our proposed GSC-YOLO model.
4.3. Visualisation Comparison of Detection Results
When the UAV flies at a low altitude and the model is used for detecting objects in simple scenes, such as pedestrians on the street, the pedestrian targets in the images are still relatively large. In such a scenario, there is little difference in performance between YOLOv5s and GSC-YOLO. As shown in Figure 10, both models successfully detect pedestrians with identical confidence scores.
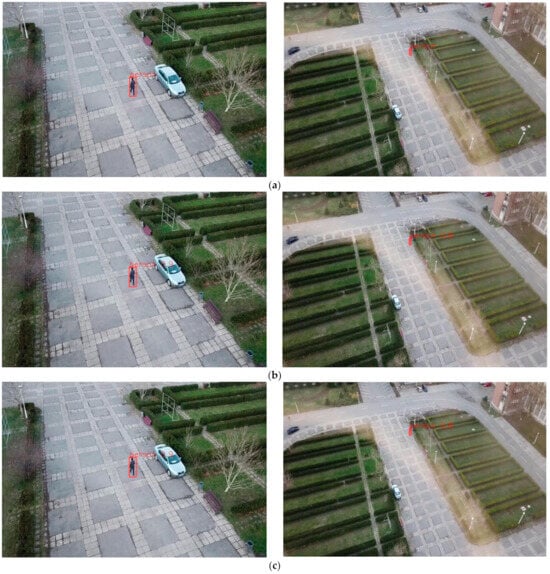
Figure 10.
We label the target instance in the figure as person, and the number after the label is the confidence score given to the target after the model inference. (a) Annotated pedestrian images in the dataset. Detection results with confidence scores for (b) the original YOLOv5s and (c) our proposed GSC-YOLO.
Increasing the altitude of the UAV, we captured photos in two scenarios: street and forest. In these scenarios, the size of each target is smaller, making object detection more challenging. We can observe that the original YOLOv5 model failed to detect the pedestrian on the street. In the forest environment, while both models successfully detected the targets, the baseline YOLOv5 model exhibited notably lower detection confidence scores compared to our proposed GSC-YOLO model (as shown in Figure 11). Additionally, the YOLOv5 model produced a false positive detection within the forest scene.
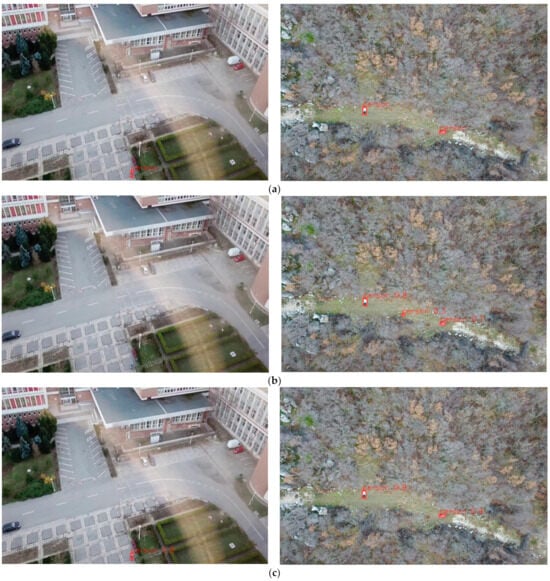
Figure 11.
As the altitude of the UAV increases, pedestrian targets become smaller. (a) Ground truth. Detection results for (b) YOLOv5s; (c) GSC-YOLO.
As the altitude of the UAV continues to increase and the flight scene changes to a more complex forest environment, the performance gap between the two models becomes more significant. In this scenario, YOLOv5 produced false positives in several instances, while our proposed GSC-YOLO model successfully detected all small pedestrian targets without any false positives (Figure 12). This demonstrates that our model has indeed achieved significant improvement in detecting small objects compared to the original YOLOv5 model.
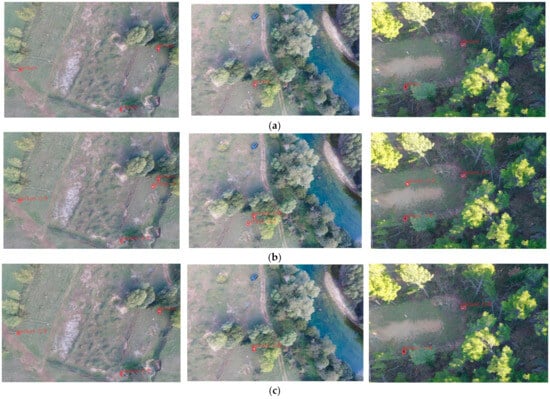
Figure 12.
After the UAV flies to a more complex scene, the object detection task becomes increasingly challenging. (a) Ground truth. Detection results for (b) YOLOv5s; (c) GSC-YOLO.
5. Discussion
5.1. The Improvement of Our Model
This study introduces “GSC-YOLO”, an advanced lightweight YOLOv5-based model tailored for pedestrian detection in UAV remote sensing images. The motivation behind improving upon the original YOLOv5 [30] baseline stems from the inherent challenges faced in remote sensing applications. Traditional object detection models often struggle to meet real-time requirements [16] and detect small-scale targets in UAV images under varying environmental conditions and complex backgrounds [10].
To address issues related to real-time requirements and limited computational efficiency on unmanned aerial vehicle platforms, we opt to streamline the YOLOv5 architecture by integrating GhostNet [49]. GhostNet’s lightweight design and efficient feature extraction capabilities enabled us to significantly reduce model parameters by approximately 50% compared to the original YOLOv5. From the experimental results in Section 4.2.1, as shown in Table 3, we observe that this lightweight approach reduces our model parameters from 7.01 M to 3.68 M. However, this method also poses a difficulty: as the number of model parameters decreases, there is a corresponding decline in model performance. In subsequent research, our focus is on enhancing the detection mean average precision of the model while striving to balance its detection performance with operational efficiency.
Considering the critical factor that pedestrians may appear in different scales due to varying distances from UAVs and different perspectives in remote sensing images, we have decided to use the K-means algorithm to redefine the sizes of candidate bounding boxes (Table 1). By adjusting the sizes of candidate boxes, we increased the mean average precision of the model (YOLO-Ghost) from 0.774 to 0.89, as detailed in Table 4.
As the altitude of UAVs increases, targets become progressively smaller. Inspired by SPD-Conv [39], we aim to enhance the model’s recognition performance of small targets by replacing downsampling operations with strideless convolutional pooling. In Section 4.2.2, we expanded upon the model (K-means + YOLO-Ghost) introduced in Section 4.2.1, wherein we respectively substituted the conventional downsampling procedure in the backbone and neck components of the network with SPD-Conv modules. This demonstration underscores the capability of SPD-Conv in enhancing the detection accuracy of pedestrians in UAV remote sensing images (as shown in Table 5). Experimental results demonstrate that adding SPD-Conv solely to the backbone yielded an mAP of 0.909. Moreover, incorporating SPD-Conv into both the backbone and neck sections concurrently resulted in an improved mAP of 0.915.
Lastly, by introducing the Coordinate Attention mechanism [13], our model considers not only inter-channel dependencies but also the relationships between each position in the feature maps, thereby enhancing the performance of detection tasks. In Section 4.2.3, building upon the model in Section 4.2.2 (backbone + SPD), we integrated the CA attention mechanism, comparing it with SA [14], ECA [53], CBAM [52], and SE [50]. With the addition of attention mechanisms, our final model achieved parameters totaling 4.77 million and an mAP of 0.913. This exploration elucidates the superior efficacy of the CA attention mechanism in pedestrian detection tasks within UAV remote sensing images.
Through analysis of detection performance, we observed that our proposed model improves upon the baseline by increasing the mAP metric from 0.894 to 0.913 (Figure 13). Furthermore, other metrics also show significant enhancements (Precision increased from 0.92 to 0.947, Recall increased from 0.81 to 0.843, and F1-score increased from 0.862 to 0.892). Regarding model size, we reduced the parameter count from 7.01 M to 4.77 M and the model size from 13.7 MB to 9.55 MB.
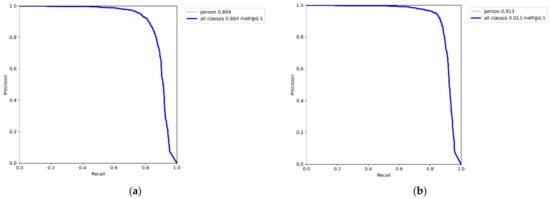
Figure 13.
mAP variation curves during the training process for (a) YOLOv5s; (b) GSC-YOLO.
5.2. Compared with Other Models
To corroborate its detection performance further, we conducted comparative analyses between the enhanced model and other object detection models. Through rigorous experimentation, we observed that our object detection model outperforms current one-stage detection models (YOLOv3 [28], YOLOv4 [29], YOLOv5n [30], YOLOX [54], YOLOv7 [31], YOLOv8 [55], SSD [26], RetinaNet [56]) in terms of accuracy and model size (Table 9).

Table 9.
The mAP and weights obtained by the improved YOLOv5 network model and other network models in the experiment.
As can be seen from the table, our proposed GSC-YOLO network not only significantly outperforms other networks in terms of average detection accuracy, but also has a much smaller model size. Although the size of YOLOv5n, a model in the YOLOv5 series, is only 3.8 MB, its mAP in the pedestrian target-detection task of UAV remote sensing images is too low, only 0.772. Regarding other YOLO family and single-stage object detection algorithms, the mAP of the smallest YOLOv7 model, which is 128% larger than ours, is only 0.836, lagging behind GSC-YOLO by 7.7%. The accuracy of YOLOv8, the highest-performing member of the family, reaches 0.872, lagging behind GSC-YOLO by 4.1%, while its model size is almost 234% of ours. Therefore, based on mAP, accuracy, or model size, our network model achieved good results in the experiment.
These experimental results indicate that our proposed lightweight UAV remote sensing image object detection network, GSC-YOLO, enhances detection performance while reducing model parameter count. These advantages provide a promising solution for deploying pedestrian detection models on UAV platforms.
6. Conclusions
In this paper, a novel lightweight UAV remote sensing image object detection model is proposed, where the lightweight network GhostNet is combined with the YOLOv5s object detection model. The proposed algorithm exhibits a smaller size and higher accuracy compared to the original YOLOv5 network, making it suitable for pedestrian detection tasks at different UAV flight altitudes. Using the proposed model, the parameter count is reduced from 7.01 M to 4.77 M, representing a 32% decrease compared to YOLOv5s. Additionally, the model’s mAP is improved from 0.894 to 0.913, a 1.9% increase. To further validate its performance in detection, we compared our improved model with other object detection models. Through experiments, we found that our object detection model outperforms current one-stage detection models in terms of both accuracy and model size. The lightweight detection model proposed in this paper is applicable to the embedded system carried by UAVs, which helps to improve the performance of UAVs in tasks such as pedestrian detection and target tracking, and meets the requirements of real-time and accuracy. In the future, we will explore the fusion of the model with other sensors (such as LiDAR, infrared cameras) to improve detection capabilities in complex environments. Furthermore, enhancing image quality is an intriguing approach to improving the performance of object detection models. We will analyze the impact of utilizing image denoising and image super-resolution reconstruction in our forthcoming research.
Author Contributions
Conceptualization, methodology, software, validation, S.L.; formal analysis, investigation, resources, Y.L.; writing—original draft preparation, S.L.; writing—review and editing, L.C.; supervision, L.C.; project administration, Y.L.; funding acquisition, Y.L. All authors have read and agreed to the published version of the manuscript.
Funding
This work was supported by the National Natural Science Foundation Project (62001447) and Youth Innovation Promotion Association, Chinese Academy of Science (2023224).
Data Availability Statement
The data used in this study are available upon request from the corresponding author via email. Data are contained within the article.
Conflicts of Interest
The authors declare no conflicts of interest.
References
- Zhang, B.; Wu, Y.; Zhao, B.; Chanussot, J. Progress and Challenges in Intelligent Remote Sensing Satellite Systems. IEEE J. Sel. Top. Appl. Earth Obs. Remote Sens. 2022, 15, 1814–1822. [Google Scholar] [CrossRef]
- Zhu, D.; Chen, T.; Zhen, N.; Niu, R. Monitoring the effects of open-pit mining on the eco-environment using a moving window-based remote sensing ecological index. Environ. Sci. Pollut. Res. 2020, 27, 15716–15728. [Google Scholar] [CrossRef] [PubMed]
- Abowarda, A.S.; Bai, L.; Zhang, C.; Long, D.; Li, X.; Huang, Q.; Sun, Z. Generating surface soil moisture at 30 m spatial resolution using both data fusion and machine learning toward better water resources management at the field scale. Remote Sens. Environ. 2021, 255, 112301–112320. [Google Scholar] [CrossRef]
- Pan, Y.; Zhang, X.; Cervone, G.; Yang, L. Detection of Asphalt Pavement Potholes and Cracks Based on the Unmanned Aerial Vehicle Multispectral Imagery. IEEE J. Sel. Top. Appl. Earth Obs. Remote Sens. 2018, 11, 3701–3712. [Google Scholar] [CrossRef]
- Bejiga, M.B.; Zeggada, A.; Melgani, F. Convolutional neural networks for near real-time object detection from UAV imagery in avalanche search and rescue operations. In Proceedings of the 2016 IEEE International Geoscience and Remote Sensing Symposium (IGARSS), Beijing, China, 10–15 July 2016; pp. 693–696. [Google Scholar]
- Zhang, Z.; Liu, Y.; Liu, T.; Lin, Z.; Wang, S. DAGN: A Real-Time UAV Remote Sensing Image Vehicle Detection Framework. IEEE Geosci. Remote Sens. Lett. 2020, 17, 1884–1888. [Google Scholar] [CrossRef]
- Li, Z.; Namiki, A.; Suzuki, S.; Wang, Q.; Zhang, T.; Wang, W. Application of Low-Altitude UAV Remote Sensing Image Object Detection Based on Improved YOLOv5. Appl. Sci. 2022, 12, 8314. [Google Scholar] [CrossRef]
- Shao, Z.; Cheng, G.; Ma, J.; Wang, Z.; Wang, J.; Li, D. Real-Time and Accurate UAV Pedestrian Detection for Social Distancing Monitoring in COVID-19 Pandemic. IEEE Trans. Multimed. 2022, 24, 2069–2083. [Google Scholar] [CrossRef] [PubMed]
- Thakur, N.; Nagrath, P.; Jain, R.; Saini, D.; Sharma, N.; Hemanth, D. Autonomous pedestrian detection for crowd surveillance using deep learning framework. Soft Comput. 2023, 27, 9383–9399. [Google Scholar] [CrossRef]
- Wu, Q.; Zhang, B.; Guo, C.; Wang, L. Multi-Branch Parallel Networks for Object Detection in High-Resolution UAV Remote Sensing Images. Drones 2023, 7, 439. [Google Scholar] [CrossRef]
- Hong, M.; Li, S.; Yang, Y.; Zhu, F.; Zhao, Q.; Lu, L. SSPNet: Scale Selection Pyramid Network for Tiny Person Detection From UAV Images. IEEE Geosci. Remote Sens. Lett. 2022, 19, 8018505. [Google Scholar] [CrossRef]
- Shao, Y.; Yang, Z.; Li, Z.; Li, J. Aero-YOLO: An Efficient Vehicle and Pedestrian Detection Algorithm Based on Unmanned Aerial Imagery. Electronics 2024, 13, 1190. [Google Scholar] [CrossRef]
- Hou, Q.; Zhou, D.; Feng, J. Coordinate Attention for Efficient Mobile Network Design. In Proceedings of the IEEE/CVF Conference on Computer Vision and Pattern Recognition, Nashville, TN, USA, 20–25 June 2021; pp. 13713–13722. [Google Scholar]
- Zhang, Q.L.; Yang, Y.B. Sa-net: Shuffle attention for deep convolutional neural networks. In Proceedings of the ICASSP 2021–2021 IEEE International Conference on Acoustics, Speech and Signal Processing (ICASSP), Toronto, ON, Canada, 6–11 June 2021; IEEE: Piscataway, NJ, USA; pp. 2235–2239. [Google Scholar]
- Wang, C.; Luo, D.; Liu, Y.; Xu, B.; Zhou, Y. Near-surface pedestrian detection method based on deep learning for UAVs in low illumination environments. Opt. Eng. 2022, 61, 023103–023122. [Google Scholar] [CrossRef]
- Castellano, G.; Castiello, C.; Cianciotta, M.; Mencar, C. Multi-view Convolutional Network for Crowd Counting in Drone-Captured Images. In Computer Vision—ECCV 2020 Workshops; Bartoli, A., Fusiello, A., Eds.; Springer International Publishing: Cham, Switzerland, 2020; Volume 12538, pp. 588–603. [Google Scholar]
- Zhang, L.; Wang, J.; An, Z. Vehicle recognition algorithm based on Haar-like features and improved Adaboost classifier. J. Ambient Intell. Humaniz. Comput. 2023, 14, 807–815. [Google Scholar] [CrossRef]
- Wang, Y.; Zhu, X.; Wu, B. Automatic detection of individual oil palm trees from UAV images using HOG features and an SVM classifier. Int. J. Remote Sens. 2019, 40, 7356–7370. [Google Scholar] [CrossRef]
- Zhang, T.; Zhang, X.; Ke, X.; Liu, C.; Xu, X.; Zhan, X.; Wang, C.; Ahmad, I.; Zhou, Y.; Pan, D.; et al. HOG-ShipCLSNet: A Novel Deep Learning Network with HOG Feature Fusion for SAR Ship Classification. IEEE Trans. Geosci. Remote Sens. 2022, 60, 5210322. [Google Scholar] [CrossRef]
- Aslan, M.F.; Durdu, A.; Sabanci, K. Human action recognition with bag of visual words using different machine learning methods and hyperparameter optimization. Neural Comput. Appl. 2020, 32, 8585–8597. [Google Scholar] [CrossRef]
- Yan, K.; Sukthankar, R. PCA-SIFT: A more distinctive representation for local image descriptors. In Proceedings of the 2004 IEEE Computer Society Conference on Computer Vision and Pattern Recognition, Washington, DC, USA, 27 June–2 July 2004. p. II. [Google Scholar]
- Bay, H.; Ess, A.; Tuytelaars, T.; Van Gool, L. Speeded-Up Robust Features (SURF). Comput. Vis. Image Underst. 2008, 110, 346–359. [Google Scholar] [CrossRef]
- Girshick, R.; Donahue, J.; Darrell, T.; Malik, J. Region-Based Convolutional Networks for Accurate Object Detection and Segmentation. IEEE Trans. Pattern Anal. Mach. Intell. 2016, 38, 142–158. [Google Scholar] [CrossRef] [PubMed]
- Girshick, R. Fast R-CNN. In Proceedings of the IEEE International Conference on Computer Vision (ICCV), Washington, DC, USA, 7–13 December 2015; pp. 1440–1448. [Google Scholar]
- Ren, S.; He, K.; Girshick, R.; Sun, J. Faster R-CNN: Towards Real-Time Object Detection with Region Proposal Networks. IEEE Trans. Pattern Anal. Mach. Intell. 2017, 39, 1137–1149. [Google Scholar] [CrossRef] [PubMed]
- Liu, W.; Anguelov, D.; Erhan, D.; Szegedy, C.; Reed, S.; Fu, C.-Y.; Berg, A.C. Ssd: Single shot multibox detector. In Proceedings of the European Conference on Computer Vision, Amsterdam, The Netherlands, 14 September 2016; pp. 21–37. [Google Scholar]
- Redmon, J.; Divvala, S.; Girshick, R.; Farhadi, A. You Only Look Once: Unified, Real-Time Object Detection. In Proceedings of the 2016 IEEE Conference on Computer Vision and Pattern Recognition (CVPR), Seattle, WA, USA, 27–30 June 2016; pp. 779–788. [Google Scholar]
- Redmon, J.; Farhadi, A. YOLOv3: An Incremental Improvement. arXiv 2018, arXiv:1804.02767. [Google Scholar]
- Bochkovskiy, A.; Wang, C.-Y.; Liao, H.-Y.M. Yolov4: Optimal speed and accuracy of object detection. arXiv 2020, arXiv:2004.10934. [Google Scholar]
- YOLO-V5. Available online: https://github.com/ultralytics/yolov5 (accessed on 22 February 2022).
- Wang, C.; Bochkovskiy, A. YOLOv7: Trainable bag-of-freebies sets new state-of-the-art for real-time object detectors. In Proceedings of the IEEE/CVF Conference on Computer Vision and Pattern Recognition, Vancouver, BC, Canada, 18–22 June 2023; pp. 7464–7475. [Google Scholar]
- Vaswani, A.; Shazeer, N.; Parmar, N.; Uszkoreit, J.; Jones, L.; Gomez, A.N.; Kaiser, Ł.; Polosukhin, I. Attention is all you need. arXiv 2017, arXiv:1706.03762. [Google Scholar]
- Carion, N.; Massa, F.; Synnaeve, G.; Usunier, N.; Kirillov, A.; Zagoruyko, S. End-to-end object detection with transformers. In Proceedings of the European Conference on Computer Vision, Glasgow, UK, 23–28 August 2020; pp. 213–229. [Google Scholar]
- Lin, T.-Y.; Dollar, P.; Girshick, R.; He, K.; Hariharan, B.; Belongie, S. Feature Pyramid Networks for Object Detection. In Proceedings of the IEEE Conference on Computer Vision and Pattern Recognition, Honolulu, HI, USA, 21–26 June 2017; pp. 2117–2125. [Google Scholar]
- Mingxing, T.; Pang, R.; Le, Q. EfficientDet: Scalable and Efficient Object Detection. In Proceedings of the IEEE/CVF Conference on Computer Vision and Pattern Recognition (CVPR), Seattle, WA, USA, 13–19 June 2020; pp. 10781–10790. [Google Scholar]
- Kaiwen, D.; Song, B.; Lingxi, X.; Honggang, Q.; Qingming, H.; Qi, T. CenterNet: Keypoint Triplets for Object Detection. In Proceedings of the IEEE/CVF International Conference on Computer Vision (ICCV), Seoul, Republic of Korea, 27 October–2 November 2019; pp. 6569–6578. [Google Scholar]
- Chen, X.; Li, S.; Yang, Y.; Wang, Y. DECO: Query-Based End-to-End Object Detection with ConvNets. arXiv 2023, arXiv:2312.13735. [Google Scholar]
- Liu, Y.; Wang, T.; Zhang, X.; Sun, J. PETR: Position Embedding Transformation for Multi-View 3D Object Detection. arXiv 2022, arXiv:2203.05625. [Google Scholar]
- Sunkara, R.; Luo, T. No More Strided Convolutions or Pooling: A New CNN Building Block for Low-Resolution Images and Small Objects; Cornell University Library: Ithaca, NY, USA, 2022. [Google Scholar]
- Kayed, M.; Anter, A.; Mohamed, H. Classification of Garments from Fashion MNIST Dataset Using CNN LeNet-5 Architecture. In Proceedings of the 2020 International Conference on Innovative Trends in Communication and Computer Engineering (ITCE), Aswan, Egypt, 8–9 February 2020; pp. 238–243. [Google Scholar]
- Incremental Network Quantization: Towards Lossless CNNs with Low-Precision Weights. Available online: https://arxiv.org/abs/1702.03044,2017 (accessed on 25 August 2017).
- Gou, J.; Yu, B.; Maybank, S.J.; Tao, D. Knowledge Distillation: A Survey. Int. J. Comput. Vis. 2021, 129, 1789–1819. [Google Scholar] [CrossRef]
- Howard, A.G.; Zhu, M.; Chen, B.; Kalenichenko, D.; Wang, W.; Weyand, T.; Andreetto, M.; Adam, H. Mobilenets: Efficient convolutional neural networks for mobile vision applications. In Proceedings of the IEEE Conference on Computer Vision and Pattern Recognition (CVPR), Honolulu, HI, USA, 21–26 July 2017. [Google Scholar]
- Sandler, M.; Howard, A.; Zhu, M.; Zhmoginov, A.; Chen, L. MobileNetV2: Inverted Residuals and Linear Bottlenecks. In Proceedings of the 2018 IEEE/CVF Conference on Computer Vision and Pattern Recognition, Salt Lake City, UT, USA, 18–23 June 2018; pp. 4510–4520. [Google Scholar]
- Howard, A.; Sandler, M.; Chu, G.; Chen, L.-C.; Chen, B.; Tan, M.; Wang, W.; Zhu, Y.; Pang, R.; Vasudevan, V. Searching for mobilenetv3. arXiv 2019, arXiv:1905.02244. [Google Scholar]
- Zhang, X.; Zhou, X.; Lin, M.; Sun, J. ShuffleNet: An Extremely Efficient Convolutional Neural Network for Mobile Devices. In Proceedings of the 2018 IEEE/CVF Conference on Computer Vision and Pattern Recognition, Salt Lake City, UT, USA, 18–23 June 2018; pp. 6848–6856. [Google Scholar]
- Ma, N.; Zhang, X.; Zheng, H.T.; Sun, J. ShuffleNet V2: Practical Guidelines for Efficient CNN Architecture Design. In Proceedings of the Computer Vision—ECCV 2018, Munich, Germany, 8–14 September 2018; Lecture Notes in Computer Science. Volume 11218. [Google Scholar]
- Tan, M.; Le, Q.V. EfficientNet: Rethinking Model Scaling for Convolutional Neural Networks. arXiv 2019, arXiv:1905.11946. [Google Scholar]
- Han, K.; Wang, Y.; Tian, Q.; Guo, J.; Xu, C.; Xu, C. Ghostnet: More features from cheap operations. In Proceedings of the IEEE/CVF Conference on Computer Vision and Pattern Recognition, Seattle, WA, USA, 13–19 June 2020; pp. 1580–1589. [Google Scholar]
- Hu, J.; Shen, L.; Sun, G. Squeeze-and-excitation networks. In Proceedings of the IEEE Conference on Computer Vision and Pattern Recognition (CVPR) 2018, Salt Lake City, UT, USA, 18–22 June 2018; pp. 7132–7141. [Google Scholar]
- Liu, S.; Qi, L.; Qin, H.; Shi, J.; Jia, J. Path Aggregation Network for Instance Segmentation. arXiv 2018, arXiv:1803.01534. [Google Scholar]
- Woo, S.; Park, J.; Lee, J.Y.; Kweon, I.S. Cbam: Convolutional block attention module. In Proceedings of the European Conference on Computer Vision (ECCV) 2018, Munich, Germany, 8–14 September 2018; pp. 3–19. [Google Scholar]
- Wang, Q.; Wu, B.; Zhu, P.; Li, P.; Zuo, W.; Hu, Q. ECA-Net: Efficient channel attention for deep convolutional neural networks. In Proceedings of the IEEE/CVF Conference on Computer Vision and Pattern Recognition, Seattle, WA, USA, 14–19 June 2020; pp. 11534–11542. [Google Scholar]
- Ge, Z.; Liu, S.; Wang, F.; Li, Z.; Sun, J. YOLOX: Exceeding YOLO Series in 2021. arXiv 2021, arXiv:2107.08430. [Google Scholar]
- Jocher, G.; Chaurasia, A.; Qiu, J. Ultralytics YOLOv8, Version 8.0.0 Software; GitHub: San Francisco, CA, USA, 2023; Available online: https://github.com/ultralytics/ultralytics (accessed on 10 January 2024).
- Lin, T.Y.; Goyal, P.; Girshick, R.; He, K.; Dollar, P. Focal Loss for Dense Object Detection. In Proceedings of the IEEE International Conference on Computer Vision, Venice, Italy, 22–29 October 2017; pp. 2980–2988. [Google Scholar]
Disclaimer/Publisher’s Note: The statements, opinions and data contained in all publications are solely those of the individual author(s) and contributor(s) and not of MDPI and/or the editor(s). MDPI and/or the editor(s) disclaim responsibility for any injury to people or property resulting from any ideas, methods, instructions or products referred to in the content. |
© 2024 by the authors. Licensee MDPI, Basel, Switzerland. This article is an open access article distributed under the terms and conditions of the Creative Commons Attribution (CC BY) license (https://creativecommons.org/licenses/by/4.0/).
