Article

iblueCulture: Data Streaming and Object Detection in a Real-Time Video Streaming Underwater System

by
Apostolos Vlachos
1,*,
Eleftheria Bargiota
1,
Stelios Krinidis
1,2,
Kimon Papadimitriou
3,
Angelos Manglis
4,
Anastasia Fourkiotou
5 and
Dimitrios Tzovaras
1
1
Information Technologies Institute Centre for Research and Technology Hellas, GR 57001 Thermi, Greece
2
Department of Management Science & Technology, Democritus University of Thrace (DUTH), GR 65404 Kavala, Greece
3
School of Rural and Surveying Engineering, Faculty of Engineering, Aristotle University of Thessaloniki, GR 54124 Thessaloniki, Greece
4
Skopelos Dive Centre, GR 57001 Thermi, Greece
5
Atlantis Consulting S.A., GR 57001 Thermi, Greece
*
Author to whom correspondence should be addressed.
Remote Sens. 2024, 16(13), 2254; https://doi.org/10.3390/rs16132254
Submission received: 29 February 2024 / Revised: 10 May 2024 / Accepted: 13 May 2024 / Published: 21 June 2024

Abstract

:
The rich and valuable underwater cultural heritage present in the Mediterranean is often overlooked, if not completely unknown, due to the inherent difficulties in using physical approaches. The iblueCulture project was created to bridge that gap by introducing a real-time texturing and streaming system. The system captures video streams from eight underwater cameras and manipulates it to texture and colorize the underwater cultural heritage site and its immediate surroundings in a virtual reality environment. The system can analyze incoming data and, by detecting newly introduced objects in sight, use them to enhance the user experience (such as displaying a school of fish as they pass by) or for site security. This system has been installed in some modern and ancient shipwrecks in Greece and was used for in situ viewing. It can also be modified to work remotely, for example, in museums or educational institutions, to make the sites more accessible and raise public awareness. It can potentially be used in any underwater site, both for presentation and education, as well as for monitoring and security purposes.

1. Introduction

Underwater cultural heritage (UCH) is an especially important but often overlooked resource since the inherent difficulties in using physical approaches, especially at greater depths, make interacting with UCH sites particularly challenging. Modeling these sites can offer stakeholders effective ways to maintain, develop and promote them. Apart from scientific study or site security, these methods can also benefit tourism development by offering non-divers the chance to visit such sites through virtual reality (VR) applications.
Many projects have attempted to recreate UCH sites, such as shipwrecks or even submerged settlements, in both physical and virtual environments. The travelling exhibition of the Julia Ann, or the museum that houses the Vasa, Gustavus Adolphus’ warship [1], are prime examples of such physical exhibitions of salvaged shipwrecks. As one of the 39 more popular digital tools, 3D bathymetry was proposed as an effective way to document UCH sites [2,3,4,5]. Photos and photogrammetry are used in most cases to digitally recreate and present shipwrecks [6,7,8,9,10]. Another virtual dive application used a pre-generated 3D model for the VR environment, while the site’s environs were procedurally generated [11]. The iMARECULTURE project attempts to raise public awareness via virtual visits and edutainment solutions, as well as including information for divers [12]. In the case of the Vrouw Maria, an immersive, interactive experience with gesture navigation allows users to visit a digital reconstruction of the shipwreck in a VR space [13]. The VISAS project has also developed a dry-dive system, using the 3D reconstructions of two UCH sites in Italy [14]. None of the above projects, however, have a way to represent the site in real time, meaning that any change at the site after the documentation, such as a part of a ship falling off, will not be represented in the reconstruction. This is what the iblueCulture project can achieve.
VR applications are, overall, an extremely complex yet impressive tool in today’s scientific industry. Many cultural heritage projects are incorporating VR in some way so as to enhance the user experience and allow them to view sites enhanced with multi-modal information, including 3D models. Meanwhile, the advent of large language models (LLMs), or artificial intelligence (AI), is changing the way we work. Businesses and research organizations intensify the use of AI in their work to build powerful tools, simplify complex and difficult procedures through their work, give the best possible performance of their products to the audience and produce user-friendly solutions. The idea behind the iblueCulture project was to build a VR application that will give the user a realistic view of shipwrecks and underwater heritage by utilizing the video feed from the in situ cameras. A big part of this manipulation is what the AI is required to perform.
The project is based on real-time video streaming, which is received from in situ underwater cameras and is then segmented, according to the objects in current view, while foreign objects that are detected can be handled differently. The various parts are manipulated digitally and then re-incorporated into the main application, which has a premade 3D model of the shipwreck already in place. By effectively offering a real-time view of the underwater environment, the iblueCulture project can be used in various fields. With the system installed, the public can use the application to dry dive and virtually explore previously unreachable UCH sites. Researchers and stakeholders can study and monitor a site, even in a remote location and at a significant depth, while also being offered site security in the form of a constant video feed and foreign object detection.

2. Materials and Methods

The system is quite complex and performs many different tasks simultaneously; a general outline of the hardware components and software pipeline follows below.

2.1. Pilot Sites

The UCH pilot sites we decided on are a total of four, possibly five, shipwrecks in the Aegean Sea, Greece. One is a modern shipwreck, that of the cargo ship Christophoros, which sank in 1983 just off the coast of Skopelos island in Panormos bay. It now rests approximately forty-three meters deep in the sea. The others are Byzantine-era shipwrecks of cargo ships, which sank in the bay of Vasilikos, close to the island of Peristera, Alonissos. All that currently remains of those ships are their cargo, large piles of amphorae they were once transporting, amounting to over three thousand. The number of the Byzantine ships themselves is disputed since two of these four piles are quite close together, making it difficult to distinguish if they were onboard one or two vessels. These sites are fifty-seven meters deep, and due to that depth, archaeologists have had little to zero opportunity to study them and determine their actual number. For our objectives, we consider the disputed sites as one, so our total number of pilot sites will be referred to as four, three Byzantine cargo ships and one modern. The Christophoros is naturally the largest site. The ship itself is approximately eighty meters in length. Meanwhile, the Byzantine sites are, at most, ten by eight meters. They are all at significant depths, making them completely inaccessible to non-divers. The area around the Christophoros site is easily accessible for divers and near a beach. Meanwhile, the island of Peristera, near where the Byzantine sites are found, is only accessible via boat. The terrain is difficult to traverse, being a rocky surface near the sea, thus making installation a particularly challenging process.
In all pilot sites, before any installation, a diving team took detailed photographs and a video of both the actual site and its immediate environs for photogrammetric purposes. The methodology for this photoshoot was a bit different from performing the same process for land-based sites. It is very easy to control and maintain a stable distance from an object on land, while underwater, there is sometimes significant movement. At the same time, at the shipwreck, one has little control over lighting since a boat or ship that passes above can drastically change the illumination and shadows in situ. Therefore, the team had to improvise and sometimes re-shoot some areas.
We initially created a high-detail 3D model for each UCH site, using these photos from the diving team. The models for the Peristera sites (Figure 1) were easier to handle due to having approximately 300–500 photos for each site. The Christophoros dataset was more than 5000 photos, which was very difficult to work with. The main technological constraint was the RAM and VRAM available on our workstation, which was not enough to process all these photos at the same time. According to various photogrammetry software companies, such as Agisoft 2.1.1. creators of Metashape [15], we needed a computer with more than 128 GBs of RAM, a dual-socket CPU with as many cores as possible, and a professional level GPU. Such a workstation is only necessary for very large datasets, as was the case with Christophoros, and was not required at any permanent iblueCulture installation. In this case, after splitting the images in batches and removing some photos such as blurry ones or ones with significant lens flare, we managed to perform the photogrammetric process for all the shipwrecks using OpenSFM [16].

2.2. System Composition

2.2.1. Underwater System

The foundation of the system is naturally the underwater cameras. The cameras are 12MP Arducams, each connected onto a Raspberry Pi 4, with 8 GB of RAM. They are both placed inside a waterproof housing, tested for eighty meters of depth. The housing has a transparent side, which the camera is facing. That opening also has an automated wiper attached that works once daily to remove debris from the viewport. Each housing has only one output, which connects to a nearby underwater hub.
There are two hubs in total, the dubbed main and the secondary hub. They are very similar in composition as they both house ethernet switches and power cables. The secondary hub has incoming connections for four cameras and an outgoing one to the main hub. That one, in turn, has five incoming connections (four for cameras and one for the secondary hub) and an outgoing connection to the surface. Note that when referring to connections as incoming and outgoing, we point out the direction data are moving in the system. In the case of power, all connections can be considered as reverse. That is, the main hub receives power from the surface and passes it along to four cameras and the secondary hub, which in turn serves another four cameras.
This array of eight cameras is placed in situ, encircling the shipwreck. Ideally, the cameras can cover an entire site at one time, which stands true for the Byzantine sites, though not for Christophoros. Due to its sheer size, our array of cameras could only cover approximately one quarter of the ship. We believe that a vessel of this size would require thirty-two cameras, which would also increase power and data transfer requirements significantly.

2.2.2. Surface Close-Proximity Installation

As mentioned previously, the main hub is connected to the surface via a Kevlar shielded Ethernet cable. This connection serves to both transfer power from the surface to the underwater components and to transfer data from below the sea to the surface. A non-permanent surface installation, dubbed the transit hub, is what powers the system and collects all incoming data. Four solar panels are responsible for powering the entire system by charging twelve batteries. These batteries, at full charge, can power the entire installation for approximately a week. A wind turbine serves as a backup, as well as extra power generation. A security camera allows us to remotely monitor the transit hub, while a weather station can also help in monitoring and warning us of significant weather changes. The weather station is the only component connected directly via a satellite and not through the attached 5G modem–router. A long-distance Wi-Fi antenna serves as a network backup. The incoming data stream moves into the system, and initially, the modem–router sends the data to an NUC. The video streams are stored into an attached synology network shared storage (NAS) and then downscaled to reduce the transfer speed requirements. The downscaled video streams are then sent through the 5G connection to the remote processing hub.

2.2.3. Remote Site

On our remote site, another NUC, as well as a workstation, manipulates the incoming video streams. Initially, the NUC receives all data and conducts all the segmentation. Here is where the object, color distribution and lighting parameter detection takes place. The NUC can run any one of those services, though it has difficulties due to technological constraints. We elaborate further on the detection process below in Section 2.3.
The workstation, an i9 11900KF with 64 GB of RAM and an Nvidia 3090 24 GB, constantly runs the Unity application, as well as a couple of background services.
The Unity application running on this workstation has a 3D virtual space that is created using the models created from the diving team’s pictures (Figure 2). A different virtual space is created for each UCH site and includes a photogrammetric 3D model of the appropriate shipwreck. The environment artificially simulates underwater turbidity, as well as incorporating some digital elements such as marine flora and fauna. For each connected user, the environment spawns a new camera, which effectively moves in 3D space according to user commands and streams the camera view back through to the mobile application.
One of the constantly running background services is a photogrammetric service that can recreate the shipwreck’s 3D model, if required, and then reinsert it into the Unity environment. This is a command line Linux service that constantly runs in the workstation and uses the OpenSFM library. It effectively watches the folder we specify and, if there are images, proceeds to create a 3D model. This new model is tested against the previous one from the same service to determine whether the 3D model has changed significantly. In the case of Christophoros, for example, if a part of the ship, say a railing, falls off due to erosion, the shipwreck has now changed. If a large enough change is detected, more than, say, an amphora moving slightly to one side, then the model is recreated using stills of the incoming video streams and then reinserted into the Unity environment. This will lead to lower-detail 3D models, though we are currently working on a way to detect the specific area of this change and then only use incoming stills for that area and previous photos of the others. So, if a railing on the left side of Christophoros falls off, the camera stills that capture this change will be used, but the rest of the images in the photogrammetric process will be the ones the diving team took in their initial survey.
The other background service receives the user coordinates from their smartphone application and translates and introduces the JSON file into the Unity application. This way, the user’s movements can be accurately tracked and translated into the main application, so that the appropriate feedback is sent back.
To simplify the pipeline, the video stream goes out of the underwater cameras into the first NUC, is downscaled and then forwarded to the main processing NUC, where the enhancements take place. It is then sent on to the workstation and Unity application. As the user moves in their mobile application, Unity mirrors that movement and streams back the appropriate video frames.

2.3. Mobile Application

The main goal of the iblueCulture project is to make shipwreck sites available to a wide pool of people, for different purposes, in a real-time VR environment. The project is aimed at the system being used either in situ or remotely in specific installations, such as kiosks or museums. Therefore, an application was created as part of this project for mobile devices (both tablets and smartphones). This application has been built for both Android and iOS devices and can work on any recent (2019-) smartphone or tablet, with at least 2 GB of RAM. It has the ability to serve both in situ and remote installations, depending on stakeholder needs. In the case of a local beneficiary, such as the nearby town, it can be set to work in a GPS-only mode, which can then limit the application to working only while in the specific town (for kiosk installations) or even directly above the UCH site. In the latter case, one of our proposals would have the application installed directly on tablets or phones that are then handed out to tourists while on boat tours of the area. As for remote installations, there would be no such limit, and the application could even handle multiple UCH sites simultaneously, for example, both the Peristera and Christophoros sites. This option could be incorporated into the application itself or left to the stakeholder. The project is mainly aimed at non-divers of all ages, though some divers could find it useful in the case when, for example, they are visiting and diving near one island, indicatively Skopelos, but do not have time to visit another.
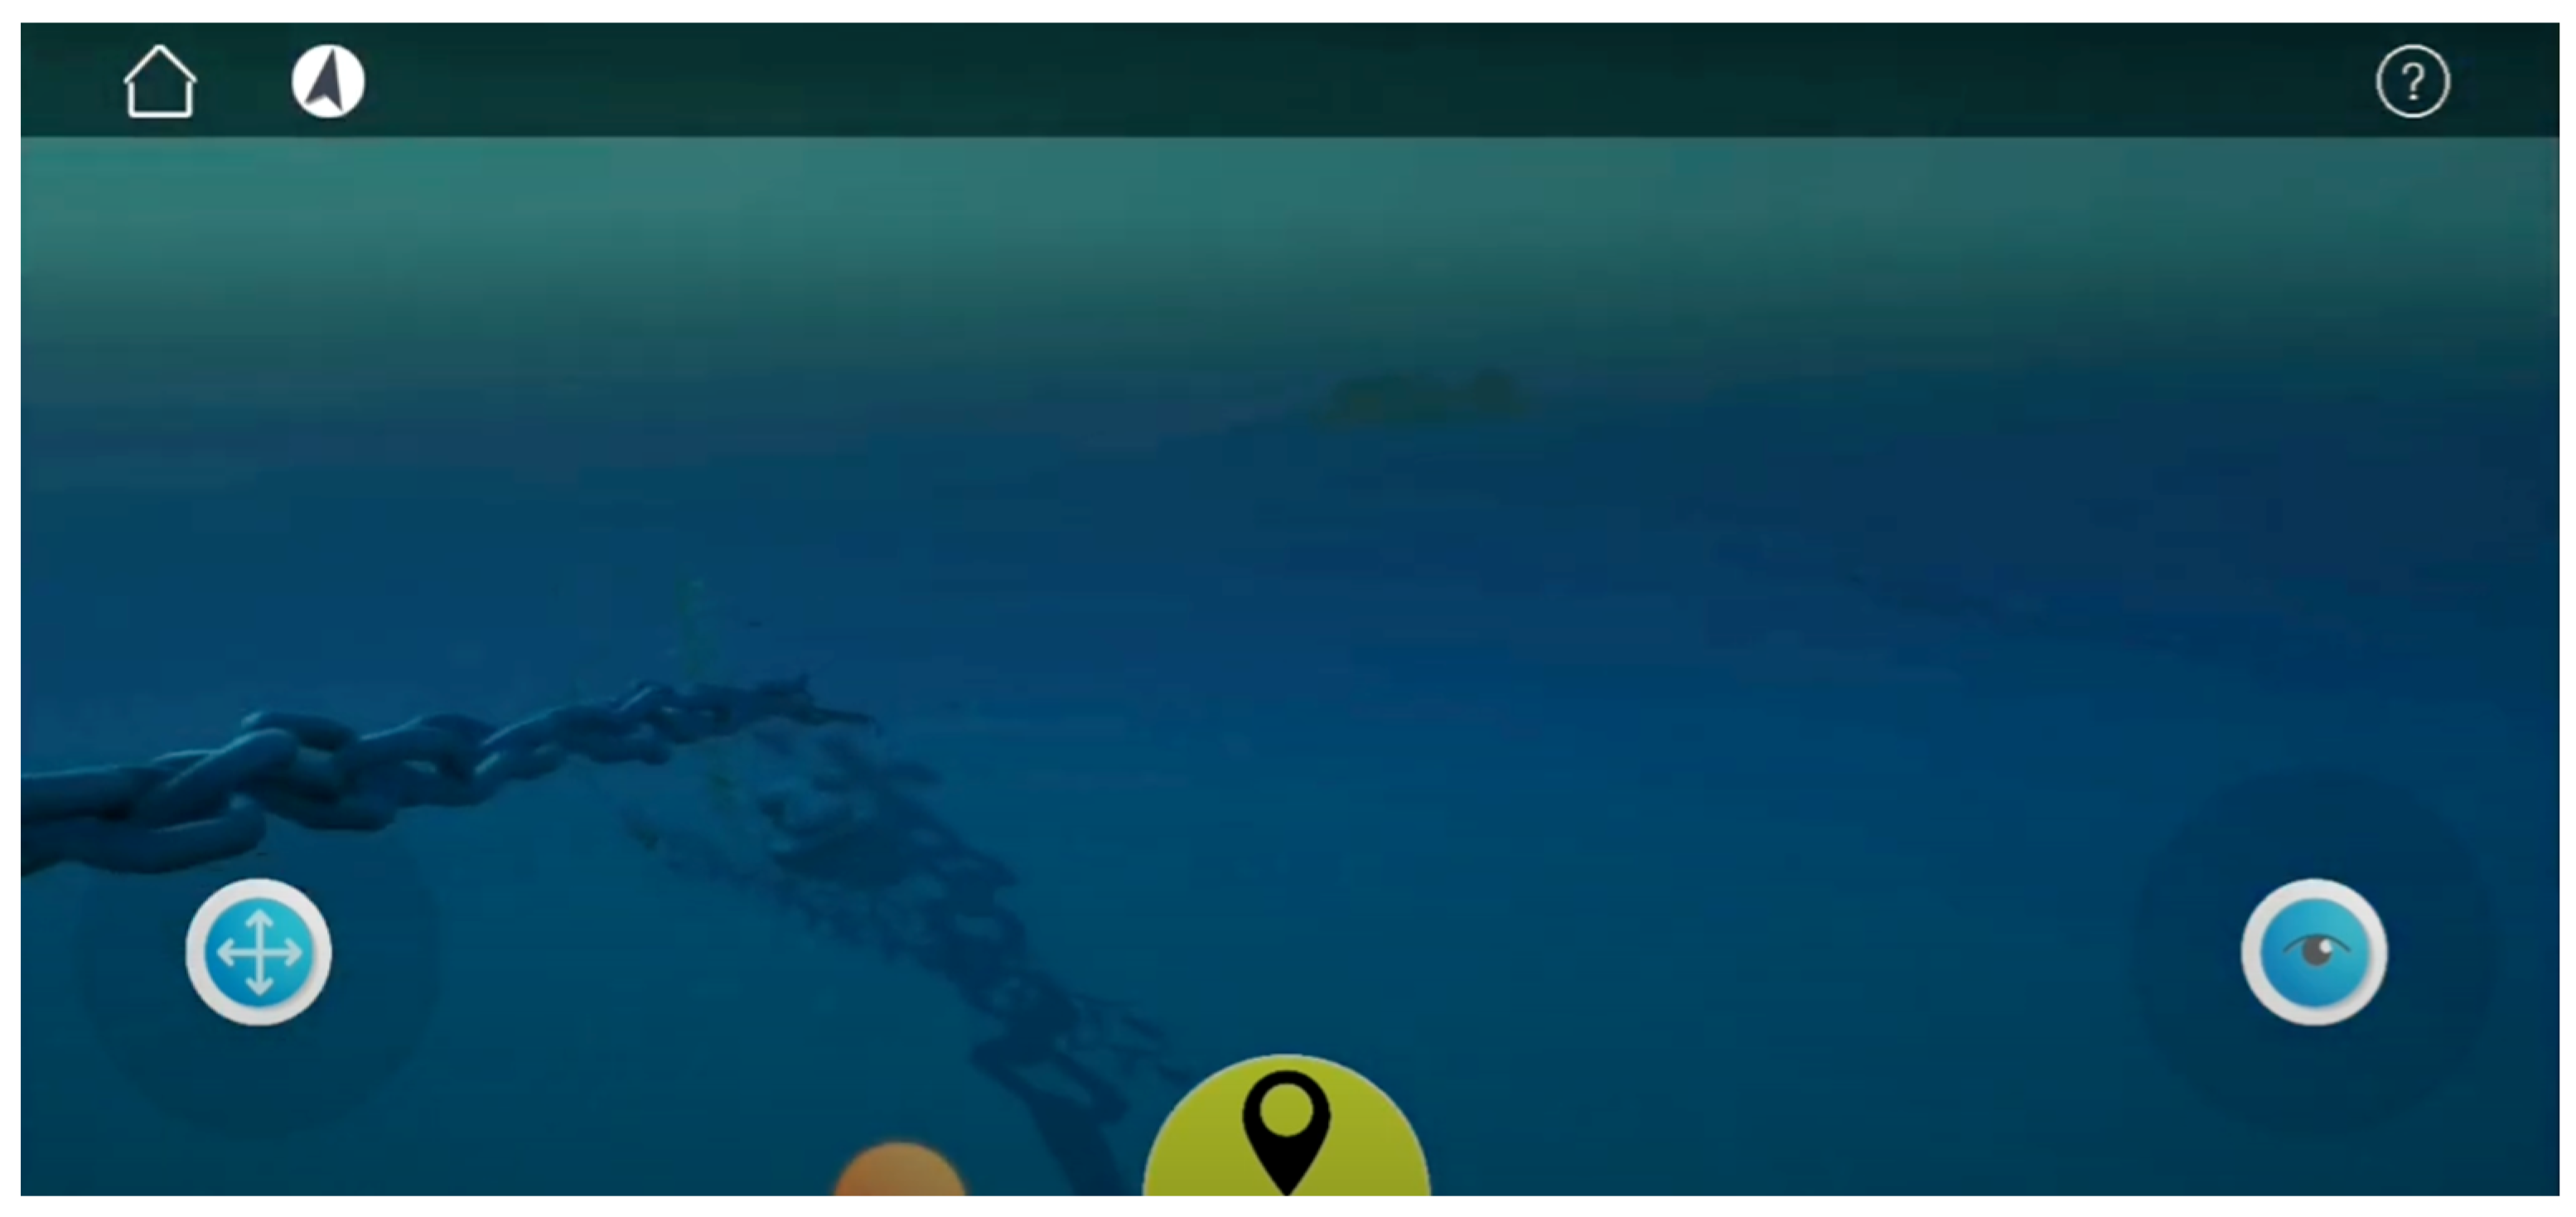
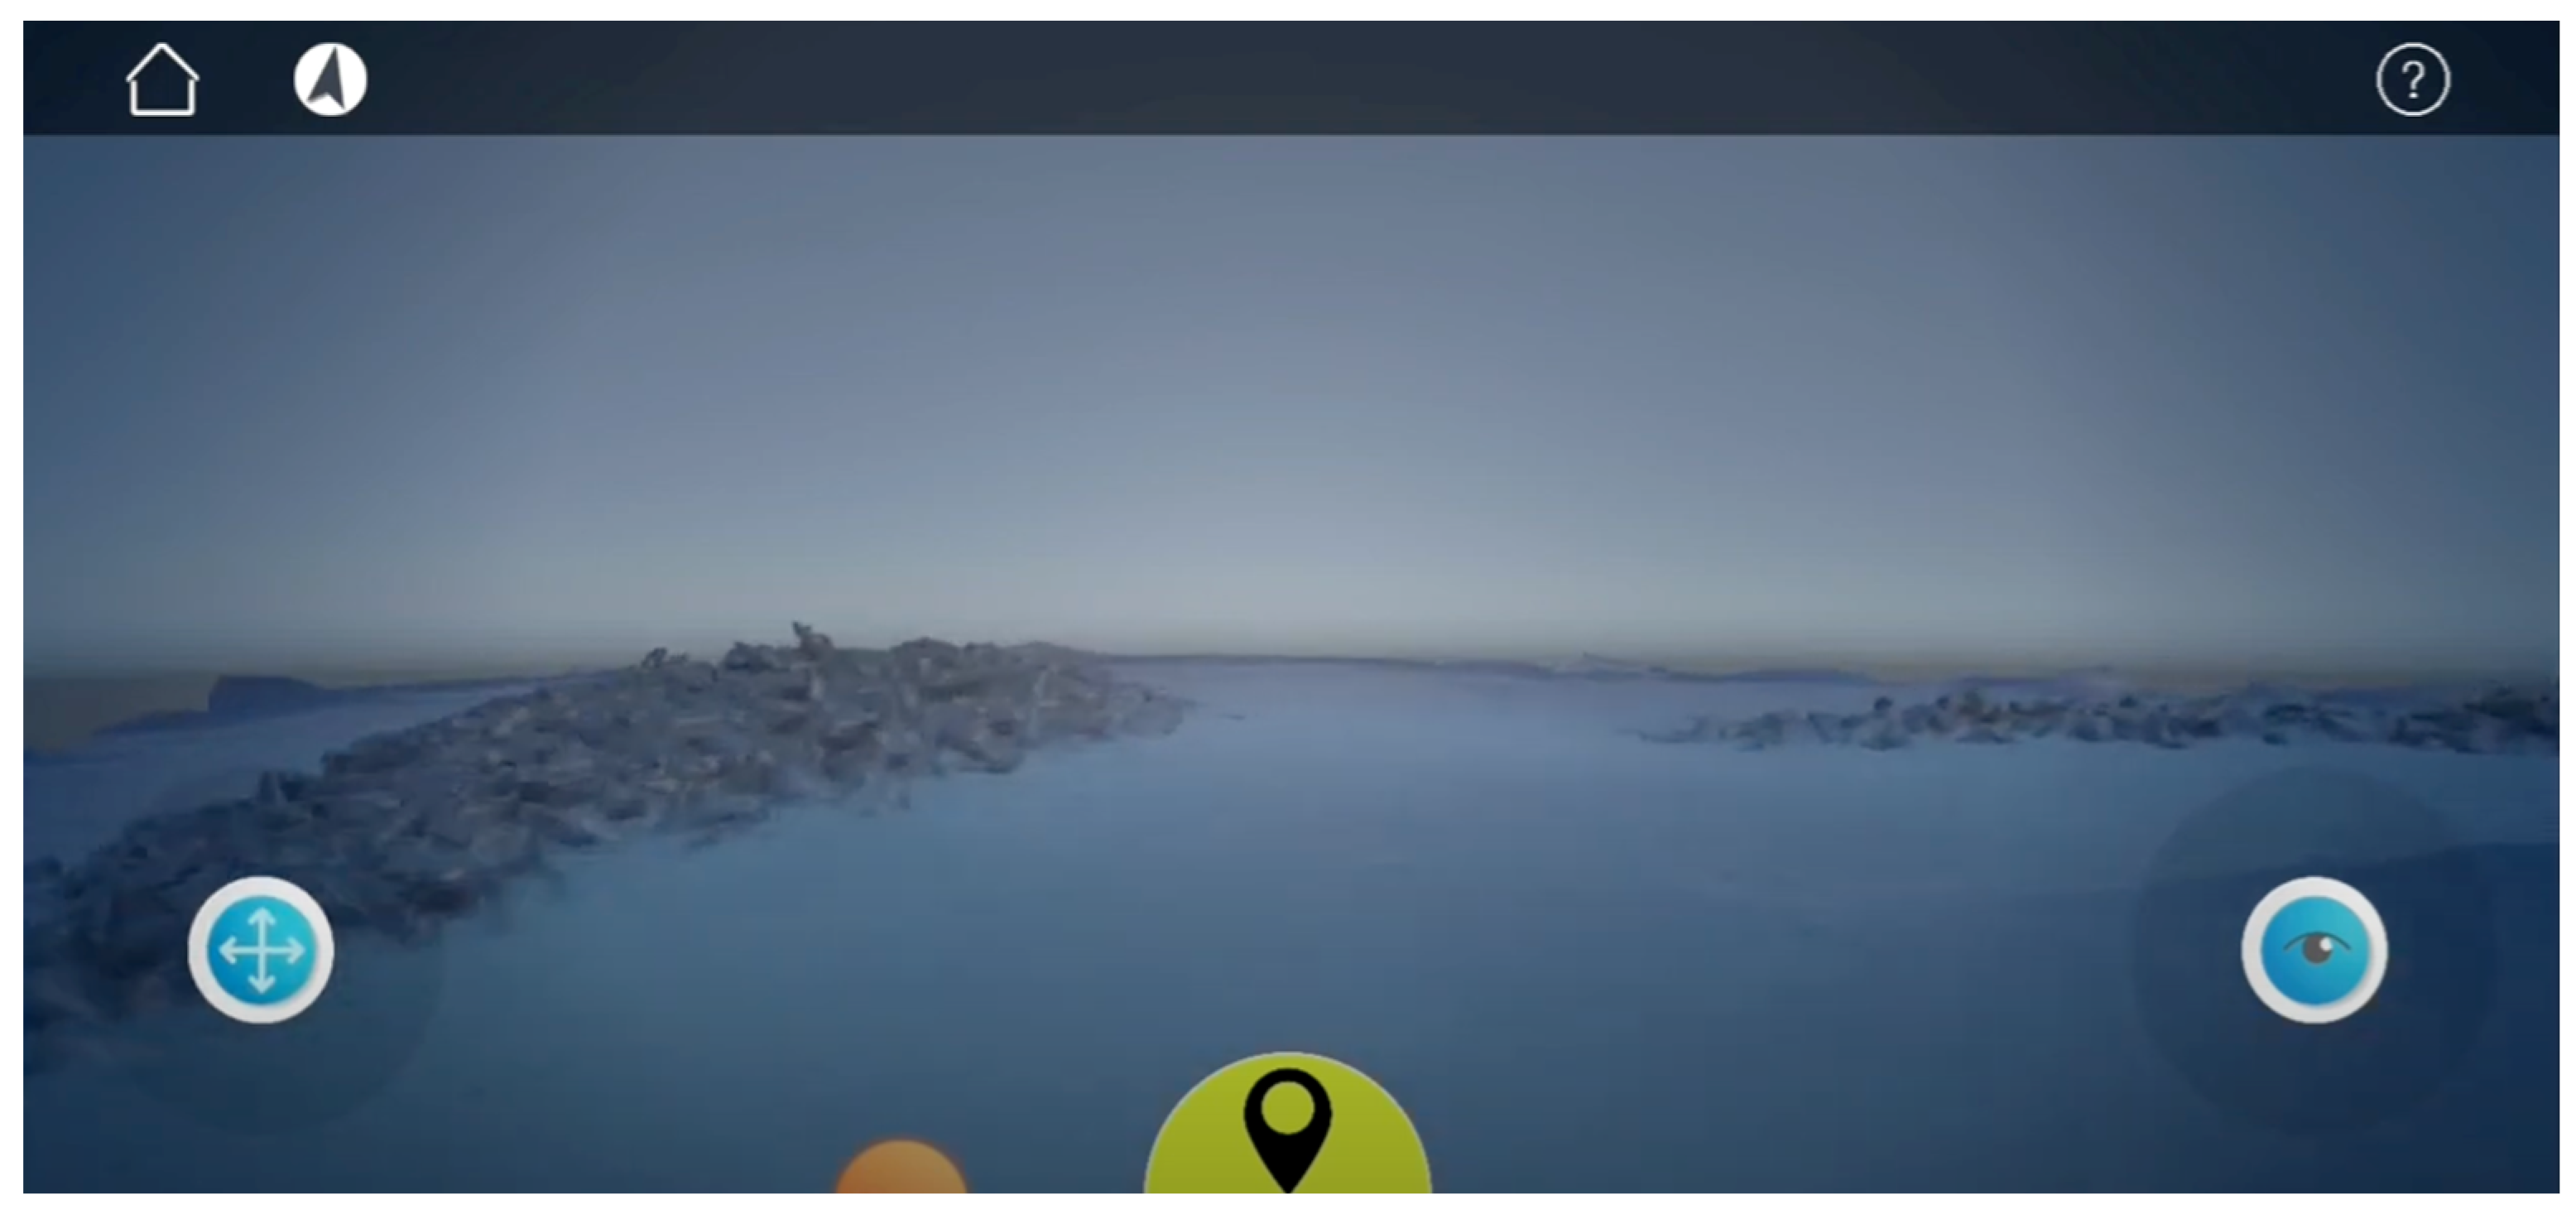
The application itself is very lightweight, as all the processor-intensive graphical elements arrive in a video stream from the workstation. It can be used on a user’s smartphone without a headset, or it can be modified for headsets similar to Google Cardboard. We can also adjust it for PC-connected or even standalone VR headsets. The application begins with a digitally created environment, where the user appears, in first-person view, to stand on a boat out at sea (Figure 3). At this point, the user has no control over the character yet who looks around a digital environment before proceeding to dive into the sea and, after a short dive near the anchor chain, reaches the bottom and the UCH site (Figure 4). One of the features we wish to implement in the future is a complete digital recreation of the area at the spot one must dive, via photos and drone imaging, and incorporating that as the introductory scene.
The user now has full control and can navigate using touch controls on his smart device (Figure 5). The arrow button on the left side is used to control movement in four directions (the user cannot go up or down), while the right-side button controls the view in all directions. There is also a reset position yellow button, at the bottom and middle of the screen, that returns the user to the starting position after the dive, near the shipwreck. The home button on the top left is used to return to the login screen, while the arrow button is used to select between GPS and not geo-restricted mode. A help button is on the top right.

2.4. Real-Time Texturing

This pipeline delivers video directly from the underwater cameras to our processing workstation, and that video is used for 3D modelling, as well as texturing the premade 3D models. For instance, during daytime, the shipwrecks are naturally illuminated, though that can change if a ship or boat passes over the area. That change is realized in the application by texturing the premade 3D models with the appropriate parts of the video that each camera sends back.
As the video feed comes into the remote site, the frames from each of the 8 cameras are masked so that the actual wreck is the only thing visible. These masked frames are then turned into a video stream and applied directly onto the 3D models inside the Unity environment as an outside video source. This is quite fast and thus offers real-time lighting changes to the models. As for the surrounding environment, we sample the same images at predetermined points and compare those to previous matches to increase or decrease visibility. Let us assume that we decide, for example, on the anchor of Christophoros to be one of the 8 points. We select an image of the anchor that is very bright (at noon, with no obstacles above) and decide on that as 100% brightness. We then compare this area of every incoming frame from that specific camera to the pre-selected one, and we measure the color difference between them and then subtract that difference from the scene lighting. The reason we decided to subtract the difference is in case our initial image of the anchor was not the brightest possible. This way, we can potentially go over 100% brightness. The points we select must be visible from multiple cameras, but even then, there can be cases where a small obstacle can create a shadow that obscures only 1 or 2 of the 8 points, while the rest are at 100% brightness. In such a case, we use the most common lighting difference. If, for example, 3 cameras show 100% and the rest show 20%, the system uses 100%. In case we have, say, 3 cameras at 50%, 2 at 10% and 3 at 100%, we decide on using the average of the two most common results.
In all the above video manipulations, any objects that pass in front of the camera, such as fish, can be quite problematic since they would show up in the shipwreck’s texture. Blocking the view of some of the 8 lighting points is not that important, since the system can work off the remaining ones. However, showing up inside the texture would mean that the 3D model of the ship would appear to have fish embedded in it. For that reason alone, we wanted to have the ability to remove any foreign objects, at least for the modeling and texturing processes. To sustain the level of immersion we had decided on, we wanted to not just remove any foreign objects but retain the ability to reinsert them in our Unity scene.
This is where we turned to AI algorithms. To achieve this, we ran multiple experiments with different datasets and algorithms, to obtain strong detection and segmentation results of the underwater objects (fauna).

2.5. Object Detection in the Underwater Environment

This section describes the process of selecting appropriate tools and the method followed for object detection in the underwater environment, and specifically the fauna, for the wreck of Skopelos. Since iblueCulture is a virtual reality project aimed at the real-time transmission of the underwater environment, the tools and algorithms used need to be capable of serving the project objectives in both speed and quality.
Object detection, segmentation and tracking are some of the key components of computer vision, which have wide-ranging real-world applications. The current state-of-the-art techniques in computer vision are based on deep neural networks, and one of the key challenges is using the state-of-the-art techniques in these fields on novel images and videos in different environments and classes. These methods require expensive manual annotations and transfer learning to make them work on domains different from their training datasets [17].
Object detection involves localizing and classifying objects within an image or video. It aims at identifying specific objects of interest and providing their bounding boxes, crucial for tasks like object tracking and scene understanding. Popular object detection algorithms include faster R-CNN, YOLO (You Only Look Once) and SSD (single-shot multibox detector). These algorithms differ in terms of speed, accuracy and trade-offs, catering to specific application requirements. Object detection finds applications in various fields, including video surveillance for identifying and tracking individuals or objects, agriculture for crop monitoring and pest detection, and retail analytics for customer behavior analysis [18].
Object segmentation and object tracking are fundamental research areas in the computer vision community. These two topics are difficult to handle and encounter some common challenges, such as occlusion, deformation, motion blur and scale variation. The former contains the heterogeneous object, interacting object, edge ambiguity, and shape complexity. The latter suffers from difficulties in handling fast motion, out-of-view objects, and real-time processing. Combining the two problems of video object segmentation and tracking, VOST can overcome their respective shortcomings and improve their performance. VOST can be widely applied to many practical applications such as video summarization, high-definition video compression, human computer interaction and autonomous vehicles [19].

2.5.1. Relevant Bibliography

The task of object detection is nothing new and has occupied many scientists in the field of image and video processing for years. However, real-time detection and segmentation is a more complex problem that has only begun to evolve in recent years. Algorithms such as SAM (Segment Anything Model) [20] give admirable results in the field of object segmentation since the user has the ability to select and isolate any object within an image. The SAM produces high-quality object masks from input prompts such as points or boxes, and it can be used to generate masks for all objects in an image. It has been trained on a dataset of 11 million images and 1.1 billion masks and has strong zero-shot performance on a variety of segmentation tasks.
This algorithm can really be revolutionary in the quick and easy creation of databases to be used for object segmentation. However, this is a supervised algorithm, so it cannot be directly useful in the case of iblueCulture, where we need an unsupervised segmentation of the fish in the image.
Also promising for our project are the background removal algorithms, such as VIBE [21], which through a motion detection process in a fixed background can create the mask of moving objects. However, after short tests, the following problems emerged:
  • On one hand, in the underwater environment of the wreck, other moving objects could appear besides fish (e.g., a bottle or other debris) or even a moving current that would not allow the correct creation of a stable background.
  • The algorithm had relatively low speeds that were prohibitive for the part of real-time analysis that we aimed at.
In Table 1 below, we can see the results of a comparison we performed on how VIBE works on different image qualities since our goal was to achieve real-time prediction and masking in underwater videos where the quality of the image decreases. As we can see, the execution time for the VIBE algorithm is very high (approx. 8–10 s), which makes it unsuitable for real-time tasks.
Another promising algorithm in the field of object segmentation is XMem [22]. XMem is a video object segmentation architecture for long videos with unified feature memory stores inspired by the Atkinson–Shiffrin memory model [23]. Its architecture incorporates multiple independent yet deeply connected feature memory stores: a rapidly updated sensory memory, a high-resolution working memory and a compact, and thus sustained, long-term memory.
The memory reading operation extracts relevant features from all three memory stores and uses those features to produce a mask. To incorporate new memory, the sensory memory is updated every frame, while the working memory is only updated every r-th frame. The working memory is consolidated into the long-term memory in a compact form when it is full, and the long-term memory forgets obsolete features over time. Although XMem seemed very promising and real-time-friendly, it is a semi-supervised architecture, where a first-frame annotation is provided by the user, and the method segments objects in all other frames as accurately as possible. As we mentioned, we are focusing on unsupervised object segmentation, so XMem would not fit our task.
In general, so far, there has been literature on image reconstruction for real-time 3D face reconstruction applications, which are based on the mathematical decoding of the human face and are trained for pose-tracking human features.
However, there is nothing relevant in the literature that specifically concerns the pose-tracking of underwater fish that could perhaps help with our problem. Therefore, it seemed necessary to use an algorithm for object segmentation, which can serve real-time speeds, and to train it on a large dataset of fish, which was the object of our study.

2.5.2. Methodology

We performed many tests before deciding the best algorithms for our use case. Object detection algorithms are usually pretrained in datasets with a specific number of classes. We show some results that were taken for 2 different videos during the research process (1 video of the Peristera shipwreck and 1 video of fish closer to the camera). The reason we used different videos was to see how distance affected our results and have a better view of what algorithm we should use for our videos in this case. The three algorithms we tested were SAM, ArtGAN and Track Anything.
SAM is a Meta AI Research product and, as we explained above, is a powerful tool for image segmentation. SAM performs really well in segmenting moving objects regardless of distance and is also strong in terms of speed. The problem with this algorithm is that it is semi-supervised, which means that we have to manually select the object of interest on the first frame of the video. This is not useful to our task, since we want completely unsupervised detection and tracking as we cannot control the underwater traffic during app use. Also, generally, SAM is known for its strong ability regarding image segmentation and high interactivity with different prompts, but many users and researchers have claimed that it performs poorly regarding consistent segmentation in videos.
Track Anything [24] is a flexible and interactive tool for video object tracking and segmentation. It is developed upon Segment Anything and can specify anything to track and segment via user clicks only. During tracking, users can flexibly change the objects they want to track or correct the region of interest if there are any ambiguities. These characteristics enable Track Anything to be suitable for the following:
  • Video object tracking and segmentation with shot changes.
  • Visualized development and data annotation for video object tracking and segmentation.
  • Object-centric downstream video tasks, such as video inpainting and editing.
Although the Track Anything Model performs well with close objects, when we tested its performance in the video from the Peristera shipwreck, the algorithm was unable to segment any of the passing fish, so we could not use it with our data. Track Anything is also semi-supervised, but it is supposed to be a boosted version of SAM that achieves high-performance interactive tracking and segmentation in videos with very little human participation.
ArtGAN [25] refers to an online HuggingFace space with a demo application of an algorithm that uses SAM with SAHI [26], which is a vision library for large-scale object detection and instance segmentation. Unfortunately, it has since been deactivated and we cannot access it any longer. ArtGAN managed to track movement in the close video but was not able to focus specifically on the fish. The problem with ArtGAN was that it could not discern moving objects (fish) from other moving textures, such as waves and water movement, so it kept tracking every moving texture in the video. In addition, in the video of Peristera, where the fish were far from the camera, the algorithm was unable to offer any showable results.
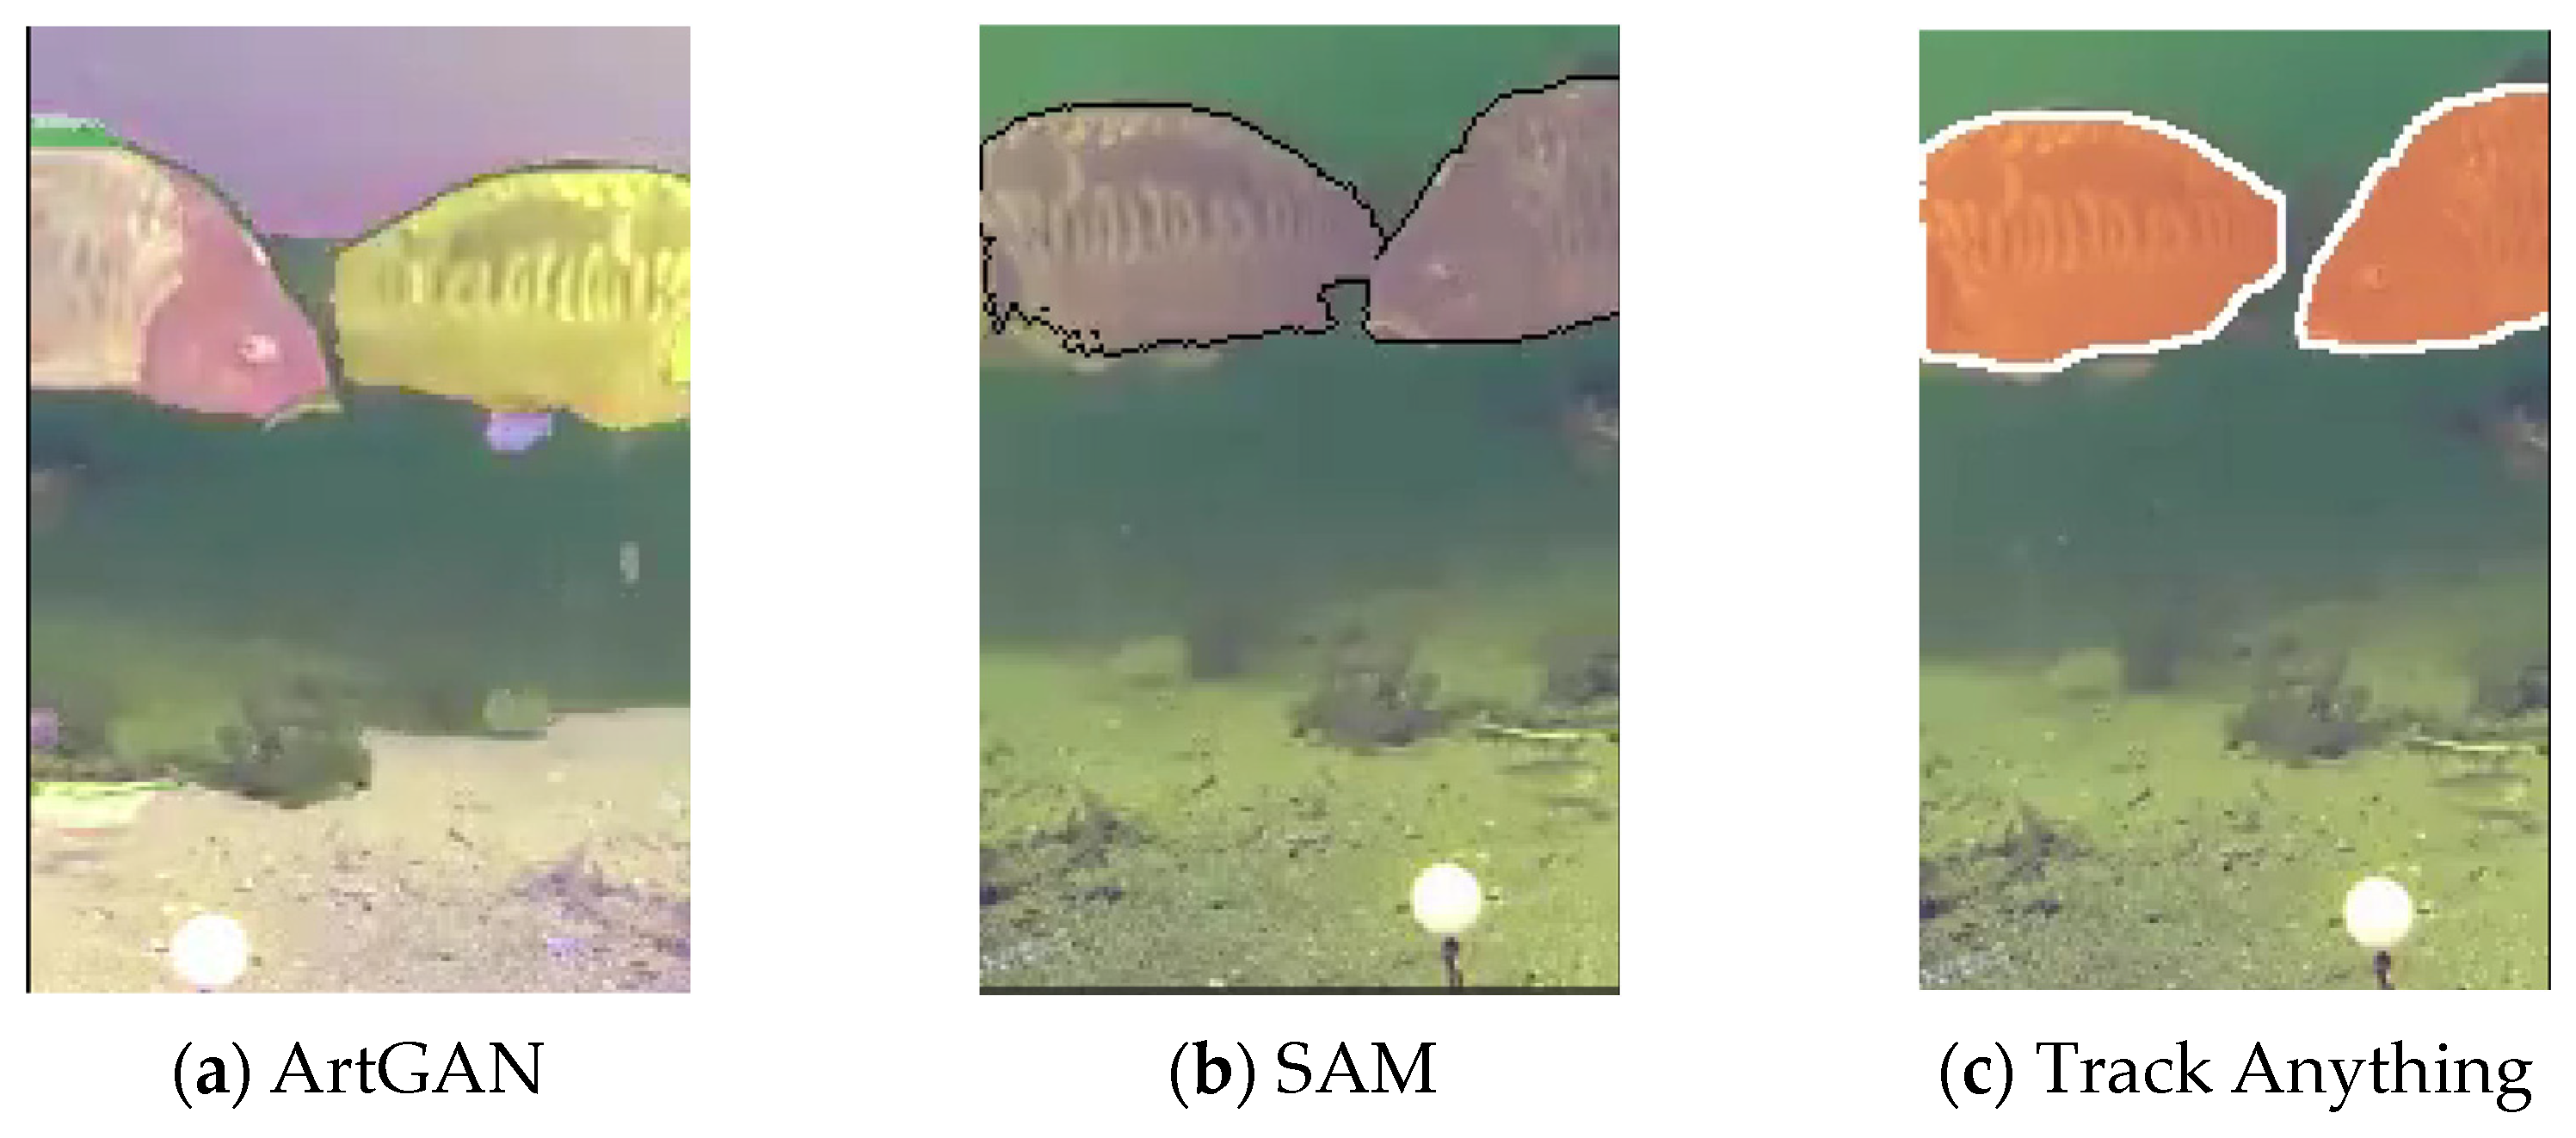
In Figure 6a, we can see how ArtGAN performed the fish segmentation in a sample video. The algorithm cannot segment correctly as it segments the fish heads, fins and body separately. ARTGan also segments the sea bottom and waves, which are not our target classes. In Figure 6b, we can see the SAM performance in the same video. The segmentation process of SAM consists of the selection of the target object in the first frame. SAM was able to segment and track the fish correctly, only after we specified them in the first frame. Observing the whole output video, SAM was not very clear and consistent in focusing on our target fish, although we semi-supervised the process. In Figure 6c, we tested Track Anything, and we can see that it gives the best results compared to the previous two algorithms. Although it works well in segmenting videos, Track Anything also needs our participation in controlling the target objects, which makes it unsuitable for our task.
In Figure 7 below, we can see how our algorithms performed in a video of Peristera. In Figure 7a, we can see a frame from the video with the fish far from camera. In Figure 7b, ArtGAN performs object segmentation in the same frame but cannot discern fish from other moving textures, as we also noticed in the previous test frame. In Figure 7c, SAM manages to capture most fish that pass by but still cannot capture the far ones. Segmentation is not very clear due to image quality and algorithm ability. In Figure 7d, Track Anything performs fish segmentation well, but as we can see, the algorithm’s ability to detect any fish far from the camera is poor. Observing the video, we could see that it could not also track the whole movement of the fish from the beginning.
None of these algorithms seemed suitable for our task as we needed a fast unsupervised detection and tracking of fish that move either close to or far from the camera in real time. We then tried using the YOLO algorithm. YOLO (You Only Look Once) [27] is a real-time object detection algorithm developed by Joseph Redmon and Ali Farhadi in 2015. It is a single-stage object detector that uses a convolutional neural network (CNN) to predict the bounding boxes and class probabilities of objects in input images. YOLO is the simplest object detection architecture. While not the most accurate, it is one of the fastest when it comes to prediction times. For that reason, it is used in many real-time systems like security cameras. This architecture can be based on any convolutional backbone. Images are processed through the convolutional stack, as in the image classification case, but the classification head is replaced with an object detection and a classification head.
Specifically, we used YOLOv8 (8th iteration of the YOLO algorithm). YOLOv8 is a cutting-edge, state-of-the-art model that builds upon the success of previous YOLO versions, such as YOLOv5 [28], and introduces new features and improvements to further boost performance and flexibility. YOLOv8 is designed to be fast, accurate, and easy to use, making it an excellent choice for a wide range of object detection and tracking, instance segmentation, image classification and pose estimation tasks. The algorithm can offer out-of-the-box support for all the above tasks, accessible through a Python package as well as a command line interface. YOLOv8 is widely used in industries such as robotics, autonomous driving, and video surveillance. The model leverages computer vision techniques and machine learning algorithms to identify and localize objects in real-time scenarios.
YOLOv8 is trained by default on the COCO dataset [29]. The COCO paper presents a new dataset with the goal of advancing the state-of-the-art in object recognition by placing the question of object recognition in the context of the broader question of scene understanding. This is achieved by gathering images of complex everyday scenes containing common objects in their natural context. Objects are labeled using per-instance segmentations to aid in precise object localization. It contains photos of 91 object types that would be easily recognizable by a 4-year-old. It has a total of 2.5 million labeled instances in 328 k images.
Being trained in such a powerful dataset, YOLOv8 is able to detect and track objects with high precision without being supervised. A big advantage of the algorithm is also the fact that it gives itself the option to be trained in a custom dataset accordingly with the needs of the user. Although COCO includes a wide variety of objects (airplane, person, bird, cat, dog, etc.), fish is not in the default classes. Therefore, YOLOv8 seemed to be a convenient option for our project if we could find a suitable dataset that would fit our needs.
When deploying a model for object detection, a confidence score threshold is chosen to filter out false positives and ensure that a predicted bounding box has a certain minimum score [30]. It is important to correctly set the confidence factor so as not to lose accuracy (if we set it low) but also not make it difficult for the algorithm to detect the objects (if we set it high). In plain words, the confidence score shows how sure the algorithm is for the detection. If we set the confidence factor to a specific number, we only obtain output levels that are above this confidence number we set.
Picking the right dataset was very important in the process of this study. As mentioned above, the YOLOv8 algorithm is pretrained in the COCO dataset which does not have a class of fish in it. So, underwater detection was poor and missed many moving fish, even when the confidence factor was low. We also trained YOLOv8 in a dataset of fish images that were not underwater [31], and although in images with fish closer to the camera, the model was performing well, the results were not usable in the video of Peristera.
We used a test image for the default YOLOv8 performance (the algorithm without training in the custom fish dataset) and the YOLOv8 trained on a fish (not underwater).
YOLOv8 manages to detect objects from the background, but it cannot tell the class correctly (it identifies fish as birds) and loses some data. Having set the confidence factor to be 0.2, we saw confidence scores from 0.2 to 0.89 (the highest confidence rate of the output).
We then obtained segmentation results from YOLOv8 trained on a dataset with fish images that are not underwater [31]. The training process is described in detail in the Data and Training section. The dataset also includes labels of fish species (Gilt Head Bream, etc.) which are not necessary for the current task. The algorithm did not perform very clearly around fish tails and fins, thus losing data. This probably happens because underwater images of fish are different from images outside of water, so the algorithm cannot focus on the target. Again, the confidence factor was 0.2; therefore, the scores we took for every label were all above this number.
When we used the model that we built with the non-underwater fish on frames of the Peristera shipwreck, we did not see any visible results. The algorithm was unable to detect any fish, probably because it was trained on images of fish above water, so the underwater task was confusing.
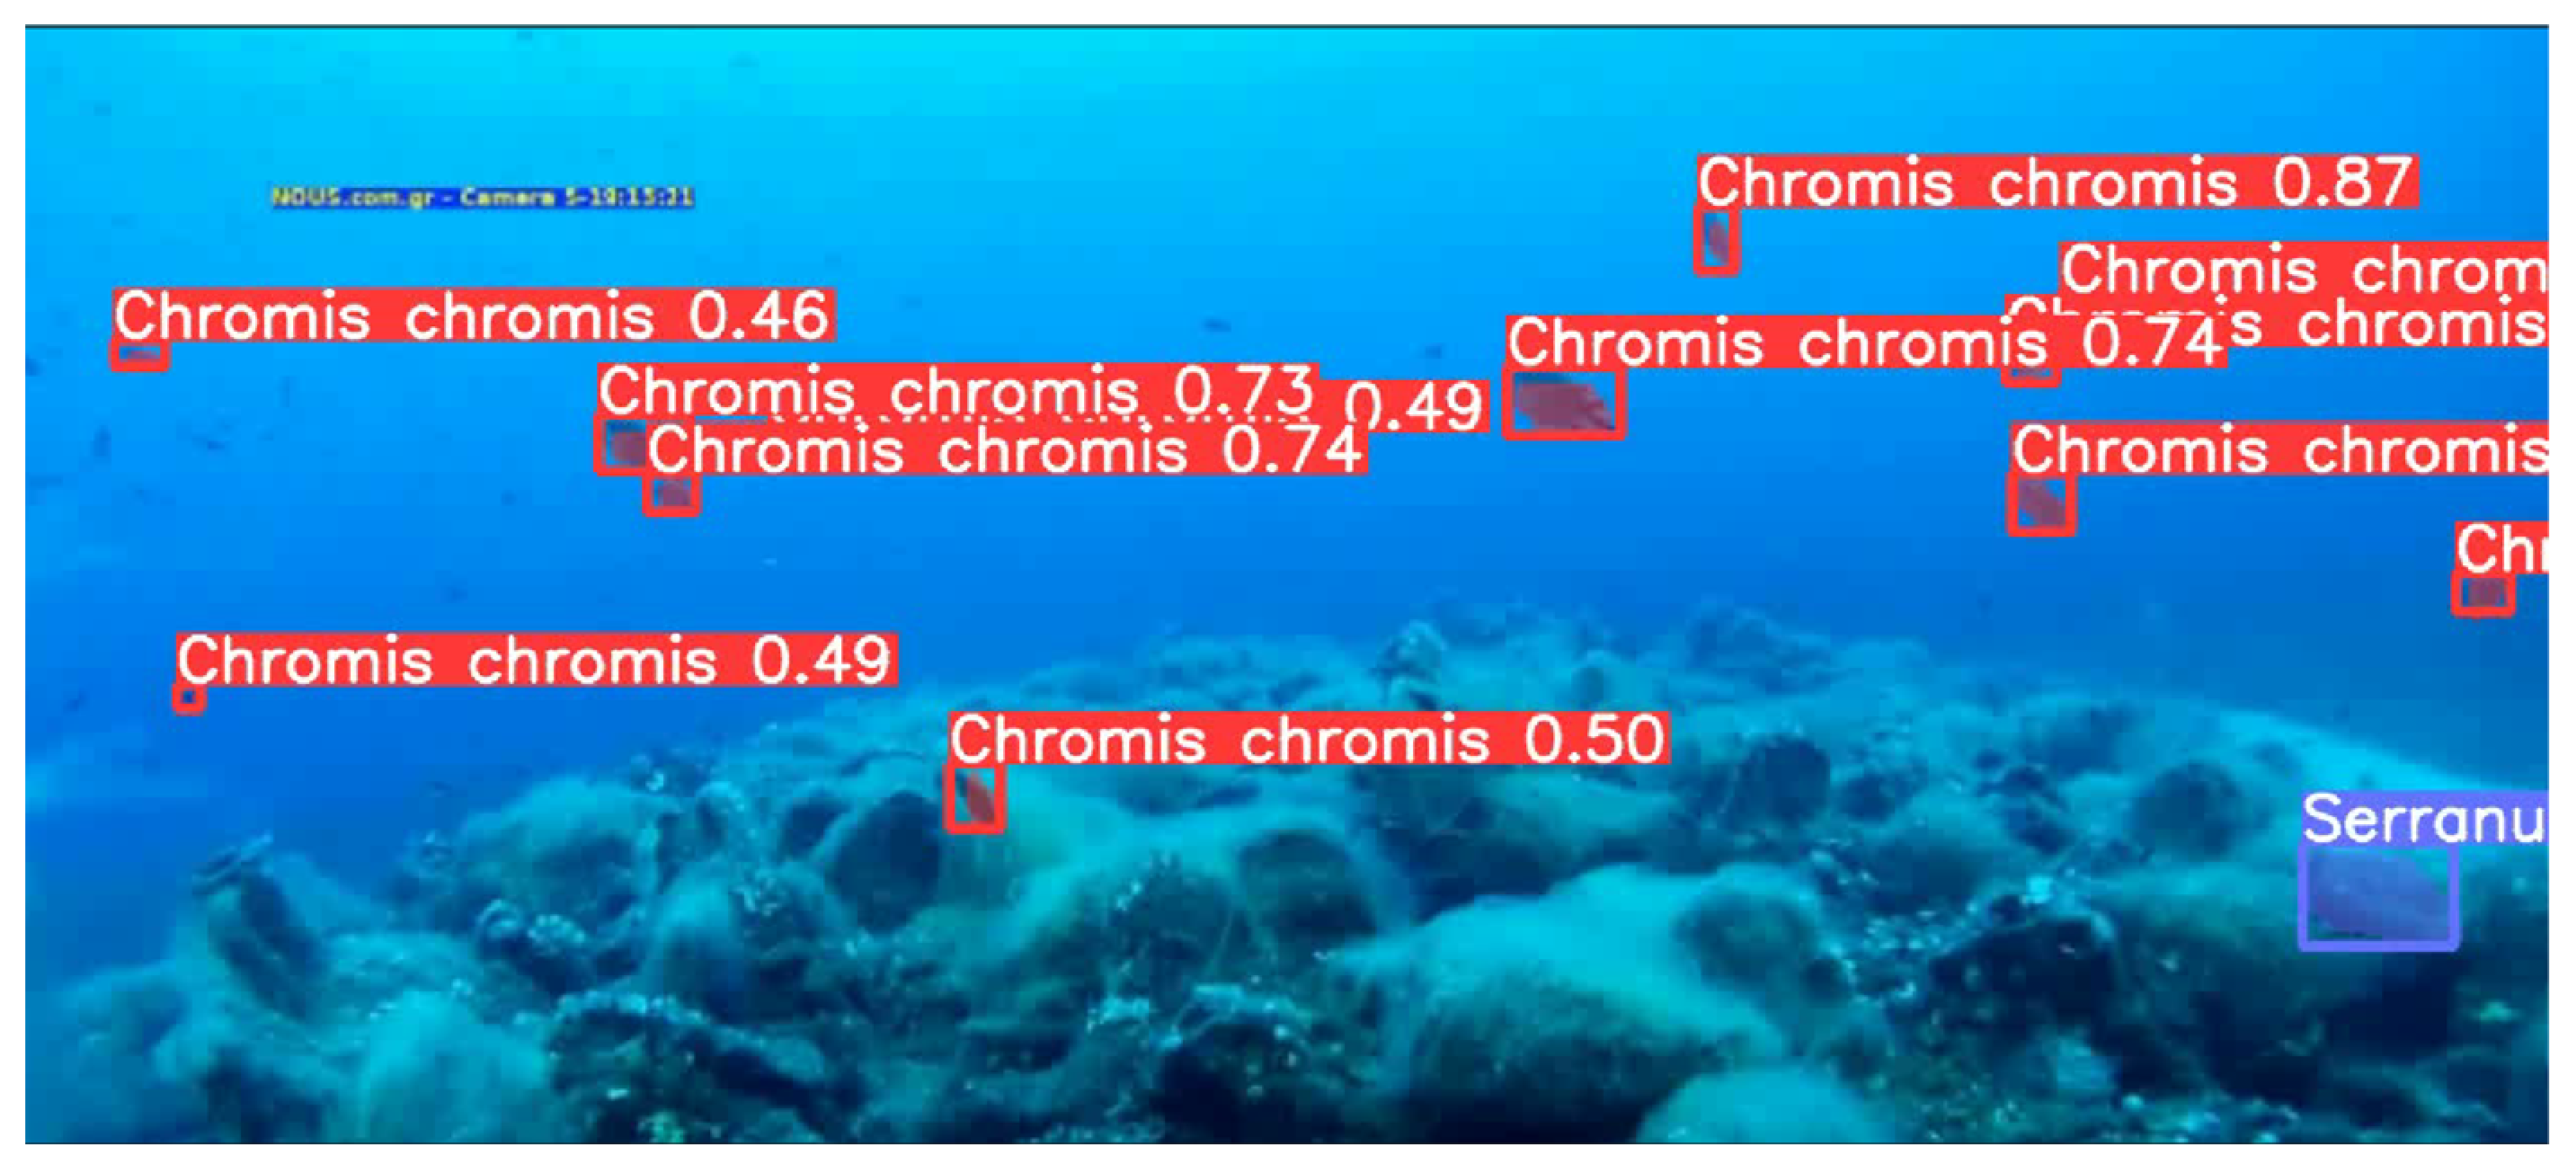
By the time we trained our model in the v9-Instance-con-sam (bueno IS) dataset [32], which consists of underwater images of fish, and set the confidence factor to 0.4, our model had performed satisfactorily and gave us some very useful results. This dataset also contained labels with fish species (chromis chromis, serranus, etc.), so near every bounding box, we can also see the specific label.
In Figure 8, we can see segmentation results in a frame from the Peristera video. The red bounding boxes are the detections with the species label and the confidence score, which indicates how confident the algorithm is about the prediction.
After a thorough search, the methodology that was decided upon included the detection of objects (detection), the segmentation of objects (segmentation), the monitoring of objects (tracking), the creation of a binary mask of objects (masking), an analysis in real time (real-time analysis) and, eventually, the final configuration of the objects in a 3D modeling tool, such as Unity.
However, our goal in this project was not only to detect and segment the underwater fish but to also mask them in real-time so they can be used later in a 3D construction tool, such as Unity, in order to deliver real-life reconstructed video images to the user.
For the detection task, YOLOv8 uses a 3-level architecture [28,33] that includes the following:
  • A network that performs the extraction of the features from the image (Backbone).
  • A network that connects these features to the final stage where the predictions are made (Neck).
  • A network that makes the final predictions and gives its output to the bounding box, within which the object (Head) is detected.
Instance segmentation takes object detection a step further. Instead of just identifying and bounding objects, it precisely segments each individual object’s pixels, effectively outlining its shape and isolating it from the background. We also need to clarify that in the YOLOv8 architecture, the segmentation process is not separate from the detection process. They are part of the same pipeline where detection (drawing bounding boxes) and segmentation (identifying each pixel’s class) are tightly intertwined.
For the object tracking procedure, YOLOv8 uses the BoT-SORT-ReID model [34], which consists of two basic functions:
  • The use of the Kalman filter [35], which is one of the most powerful tools for measuring and predicting quantities over time (Motion Models). Once initialized, the Kalman filter predicts the state of the system at the next step. It also provides a measure of the uncertainty of the prediction. Once the measurement is obtained, the Kalman filter updates (or corrects) the prediction and uncertainty of the current state. Then, it predicts the following situations and so on.
  • The alignment of the predictions of the new frames with the predictions that have already been made and the use of separate additional models that enhance the appearance characteristics of the objects (appearance models and re-identification).
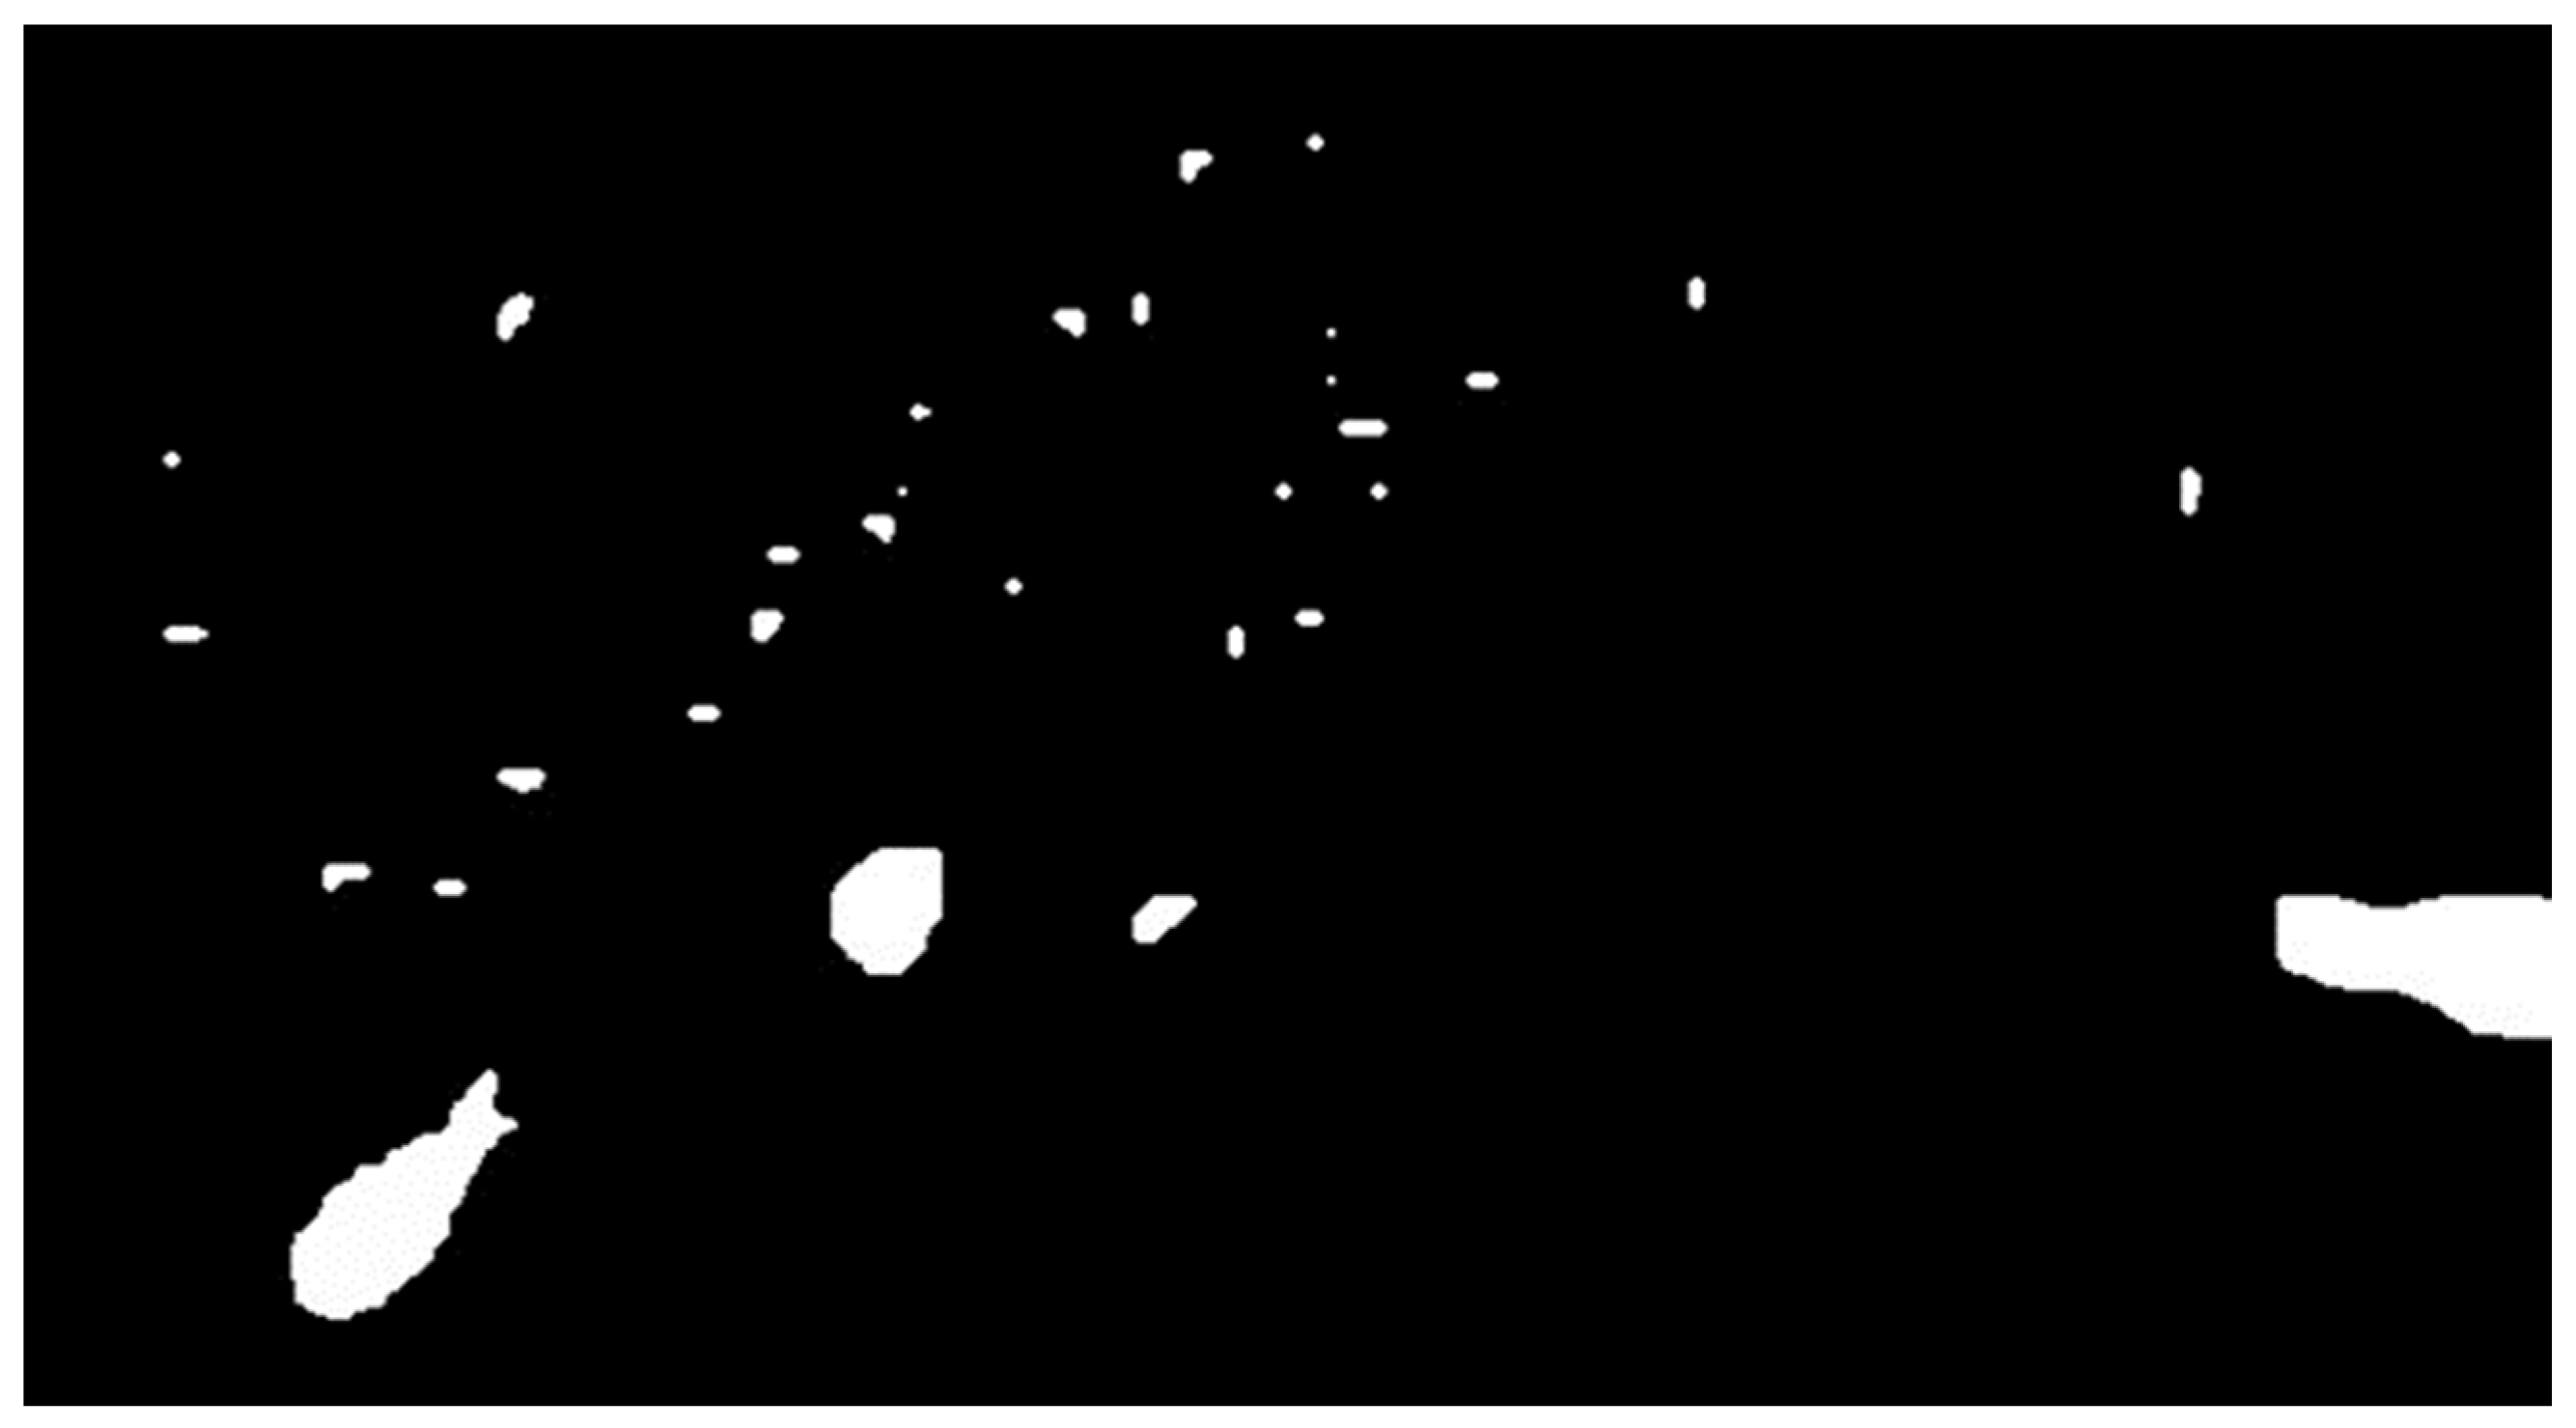
Masking is the process by which we derived the binary masks from the objects that our algorithm had already detected and segmented. The binary masks are used later in the modeling program (Unity) for the 3D representation of our image.
Using the python library “cv2”, we generated the binary mask of a single object in a frame of the video. To display all the objects in the frame, we used the Pytorch library and specifically the torch.add function:
t o r c h . a d d ( i n p u t ,   o t h e r ,   ,   a l p h a = 1 ,   o u t = N o n e )     T e n s o r
where
o u t _ i = i m p u t _ i + a l p h a     o t h e r _ i
For each frame of the imported video, the YOLOv8 algorithm detects the fish and isolates them as segments as they move through the frame and then our masking algorithm presents the binary objects in it.
The output is given in real-time and it is a video of binary fish masks that move around the shipwreck.

2.5.3. Real-Time Analysis

Since the experiment concerns the real-time streaming of the image that we had from the wreck in Skopelos, we tried to go frame by frame for each fragment of the Peristera wreck and obtain the mask with all the objects contained in it in each frame. The process included processing each frame separately and displaying the predictions of all objects per frame and then serially.
Beyond the real-time extraction of the masks, we must take into account that the image will be transmitted directly from the cameras inside the algorithm for processing. Since Google Colab does not currently support streaming data processing directly, to test the algorithm on an image directly from the camera, we needed to import the model into some Python environment to obtain the livestream from the cameras and extract the masks directly.

2.5.4. Evaluation

The metrics used in our model are precision (P), recall (R), mean average precision m A P 50 and m A P 50 : 95 .
Precision represents the ratio of positive samples to those predicted to be positive. Below, we can see the equation that describes precision [M].
P r e c i s i o n = T P T P + F P
Recall represents the ratio of detected positive samples to all positive samples. Below, we can see the equation that describes recall [M].
R e c a l l = T P T P + F N
The IoU measures the overlap between the predicted bounding boxes and true ones, with scores ranging from 0 to 1. If the prediction is perfect, the IoU = 1, and if it completely misses, the IoU = 0.
AP is defined as the area under the precision–recall curve. AP50 is defined as AP when IoU = 50. Below, we can see the equations that describe AP50 and AP [36].
A P = 0 1 P R d R
m A P 50 : 95 = 1 10 ( A P 50 + A P 55 + + A P 90 + A P 95 )
The confusion matrix is a table that shows how many correct and how many wrong predictions a model has made. TP stands for true positive (there is an object in the image and the algorithm makes a correct prediction), FP stands for false positive (there is no object in the image, but the algorithm detects one) and FN stands for false negative (the algorithm fails to locate the object in the image) [37].
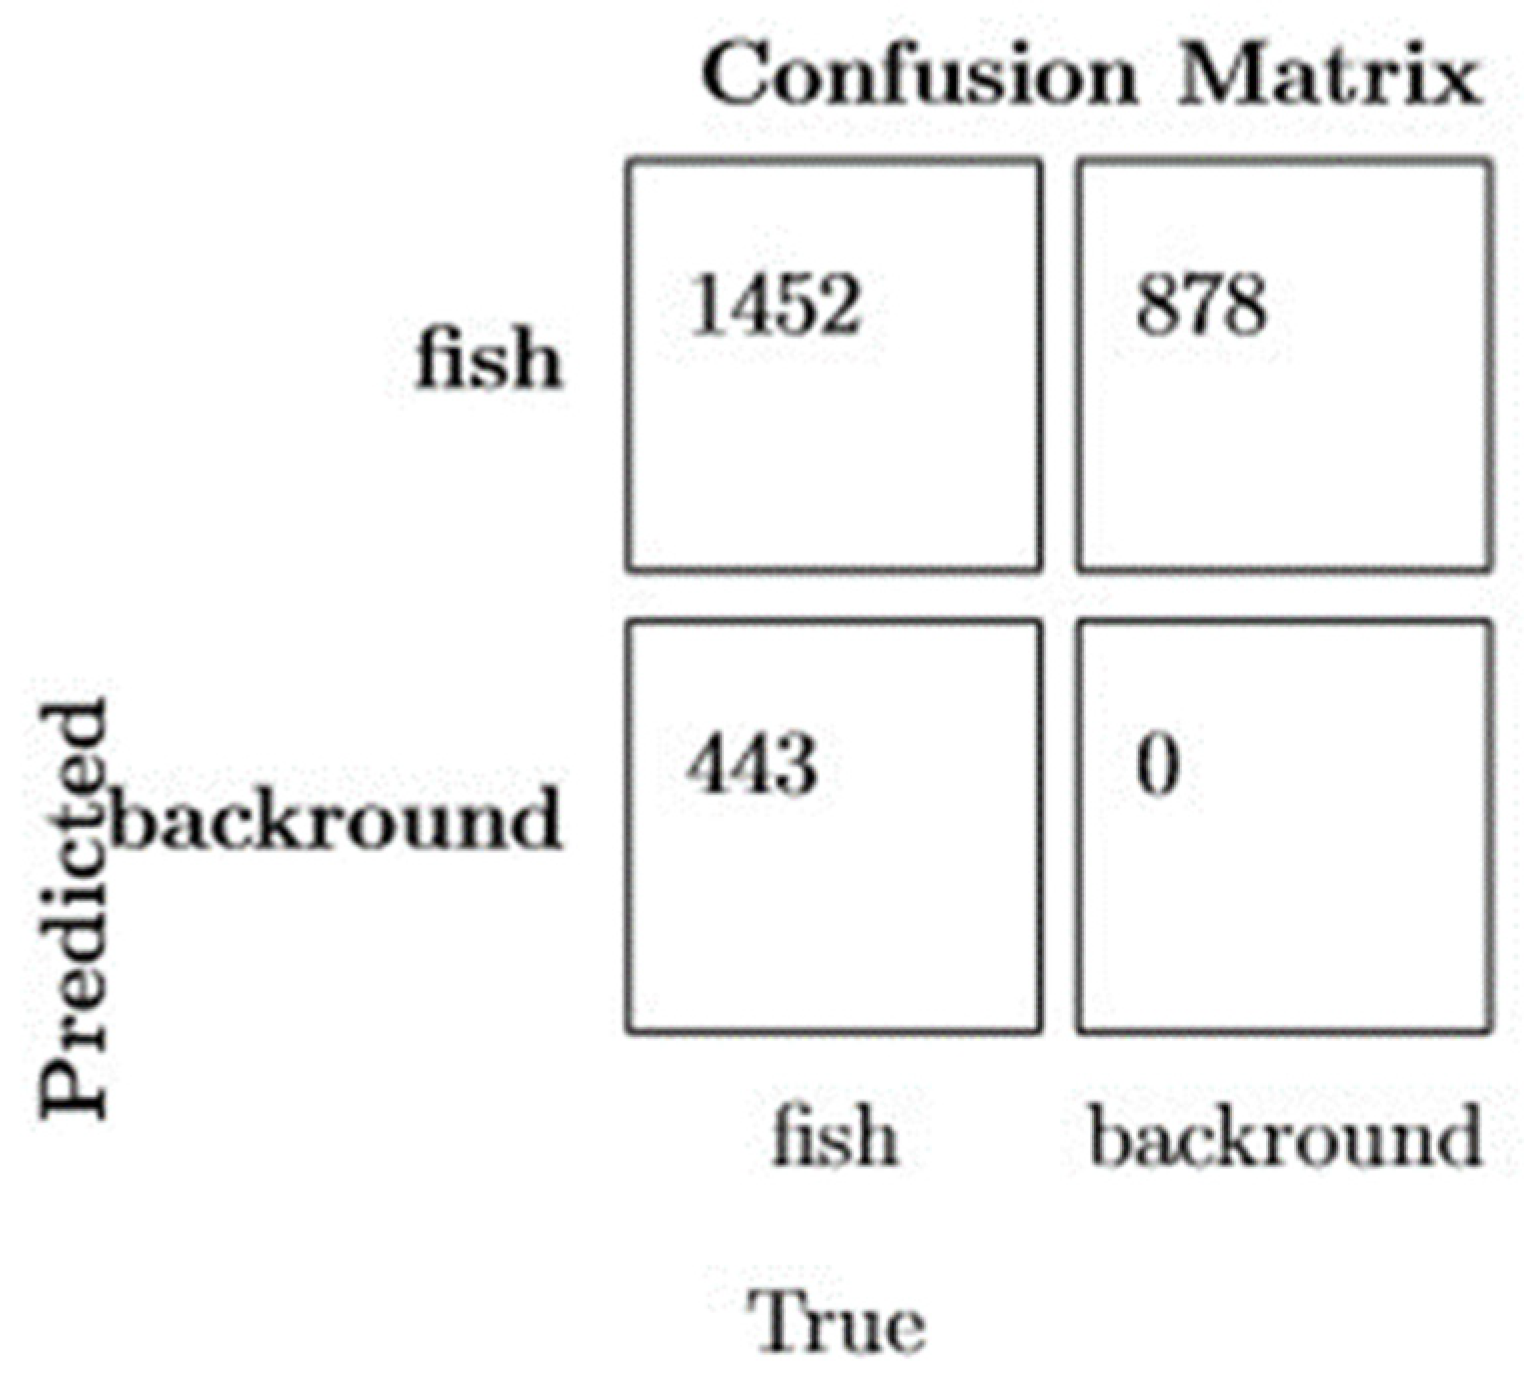
In Figure 9, we see a confusion matrix between fish and the background (sea or other objects) as we are interested in detecting fish underwater. So, the true positive is how many fish that our algorithm detected were actually fish, false positive is how many of the fish that our algorithm detected were actually background, false negative is how many of the background that the algorithm detected were actually fish, and finally, true negative is how many of the background objects that our algorithm detected were actually the background.

2.5.5. Data and Training

As mentioned, the above model is pre-trained on the COCO dataset for object detection and segmentation, which, however, does not include the fish class. Therefore, we re-trained the model on a custom dataset that served the detection and segmentation of fish. The dataset used was “v9-Instance-con-sam (bueno IS)” [32] belonging to the diverse library of the Roboflow platform, in the Instance Segmentation track. It included 2773 (1940 train set, 271 test set, 562 valid set) frames from underwater video footage depicting fish with their tags. The dataset was considered suitable due to the context of the frames as any other dataset with images of fish out of water was unable to provide accurate results for images of the wreck. The dataset was exported in yaml format along with the tags in txt, which is the compatible format for use with the YOLOv8 model.
The training was carried out in Python in the Google Colab Pro environment (Python3 runtime type) using GPU and specifically the A100 and in high RAM mode. To train our model, we set the hyperparameters of the overall network as follows:
  • Epochs = 30;
  • Learning rate = 0.001;
  • Batch size = 16;
  • Optimizer = ‘auto’.
This optimizer option builds an optimizer for the given model based on the number of iterations during training. In this particular case, because the number of iterations is less than 10,000 (batch size = 16, epochs = 30), ‘AdamW’ is automatically selected.
  • Network architecture = ‘yolov8’;
  • Activation function = ‘leaky relu’.
In general, the initial input of the data stimulates neurons linearly, but in fact, the expression ability of linear models is far from meeting the requirements. The greatest significance of the activation function is to solve nonlinear problems and improve the expression ability of deep convolutional network models. The original algorithm YOLO v8 uses the Leaky ReLU activation function as do the previous versions YOLOv5 and YOLOv3, and its formula is [38]
R e L U x = x , i f   x > 0 a x , i f   x 0
In Figure 10, we can see a Leaky ReLU activation function for different sizes of factor a.

3. Results

3.1. Losses

Yolov8 uses BCE for classification and DFL and CIoU losses for bounding box regression. The final loss is a weighted sum of these three individual losses. The weights control the relative importance or contribution of each loss in the final combined loss that gets optimized during training.
“Box” refers to the loss associated with bounding box regression, “dfl” stands for distribution focal loss and “cls” is the standard classification cross entropy loss, i.e., the class loss weight. The three losses—box, DFL and classification—are used to calculate the total loss in YOLOv8. The box loss corresponds to how well the model is able to locate the object within the bounding box. The DFL loss is used to handle class imbalance in the object detection process. Meanwhile, the classification loss is responsible for ensuring that the detected objects are correctly classified. When YOLO performs a segmentation task, there is also another loss, segmentation loss. Segmentation loss quantifies how close the predicted segmentation map is to the ground truth map. It measures how effectively the model performs the semantic segmentation task.
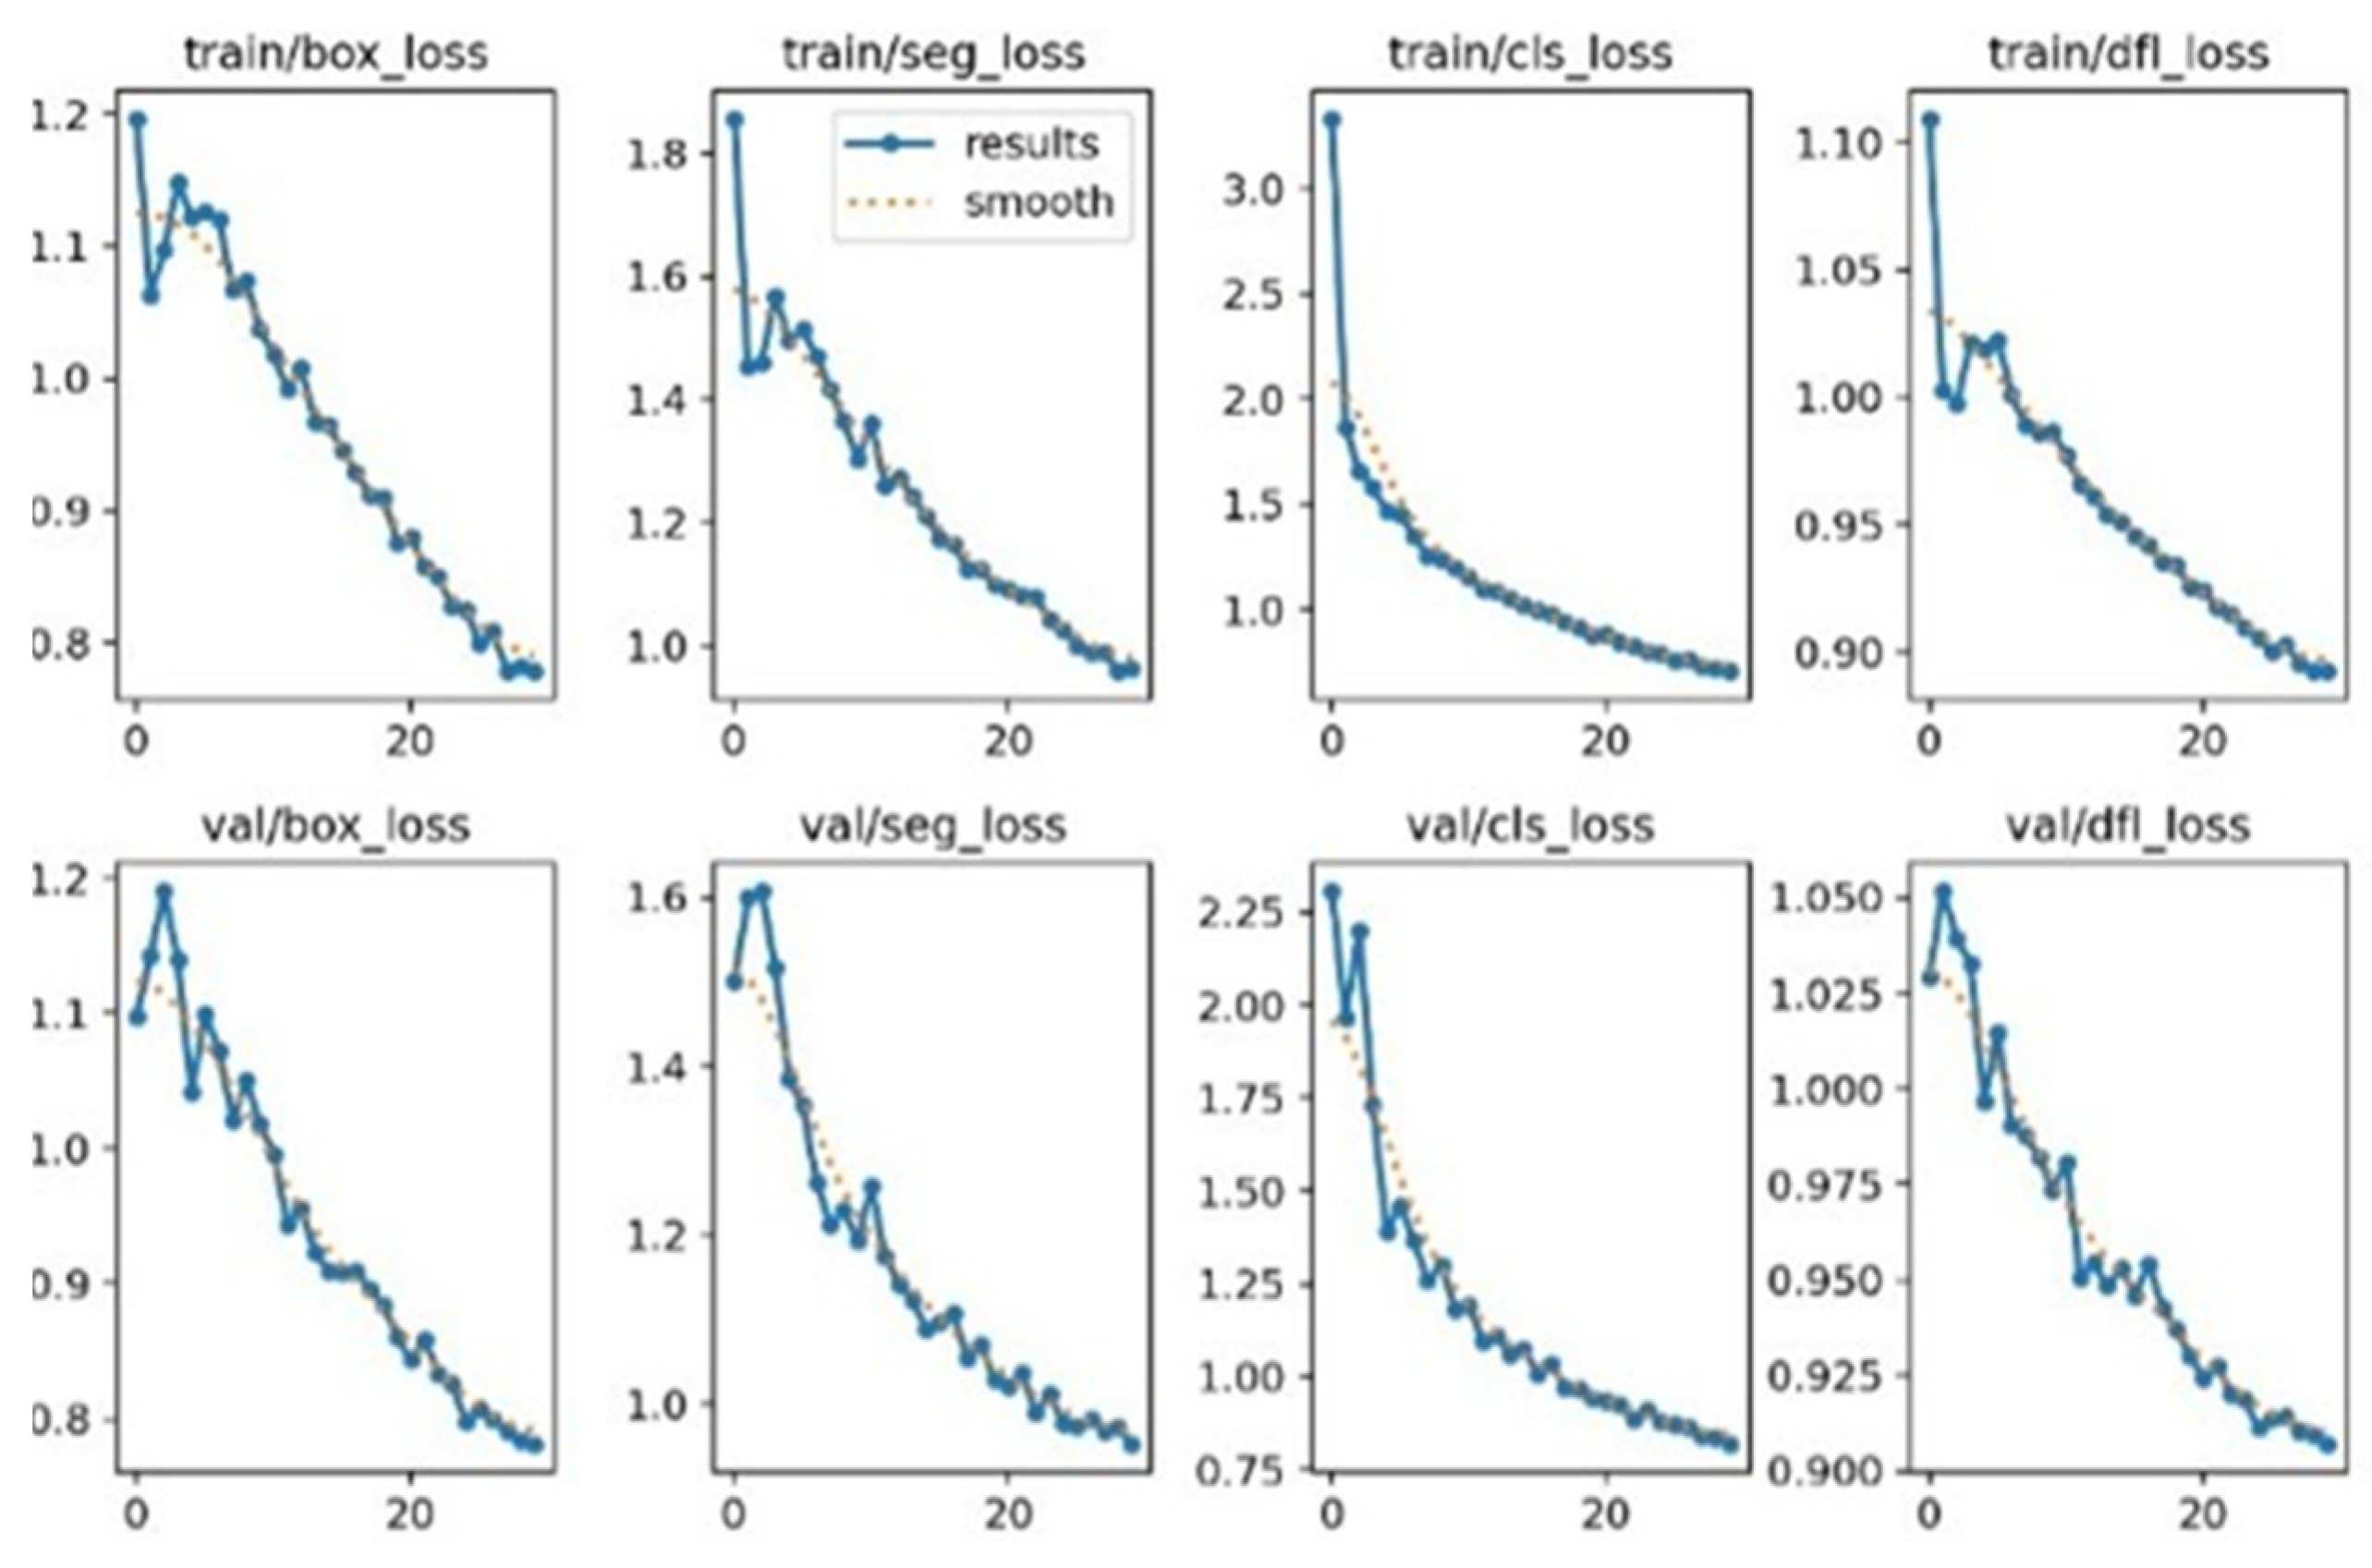
As we can see in Figure 11, we have training and validation losses. Training loss is used to optimize the model’s parameters during training, and validation loss helps monitor the model’s performance during training and detect overfitting [28]. We can see the loss curves obtained after 30 epochs. The course of the curves is as expected (decreasing), which indicates the successful training of the model and a balanced validation process.

3.2. Validation

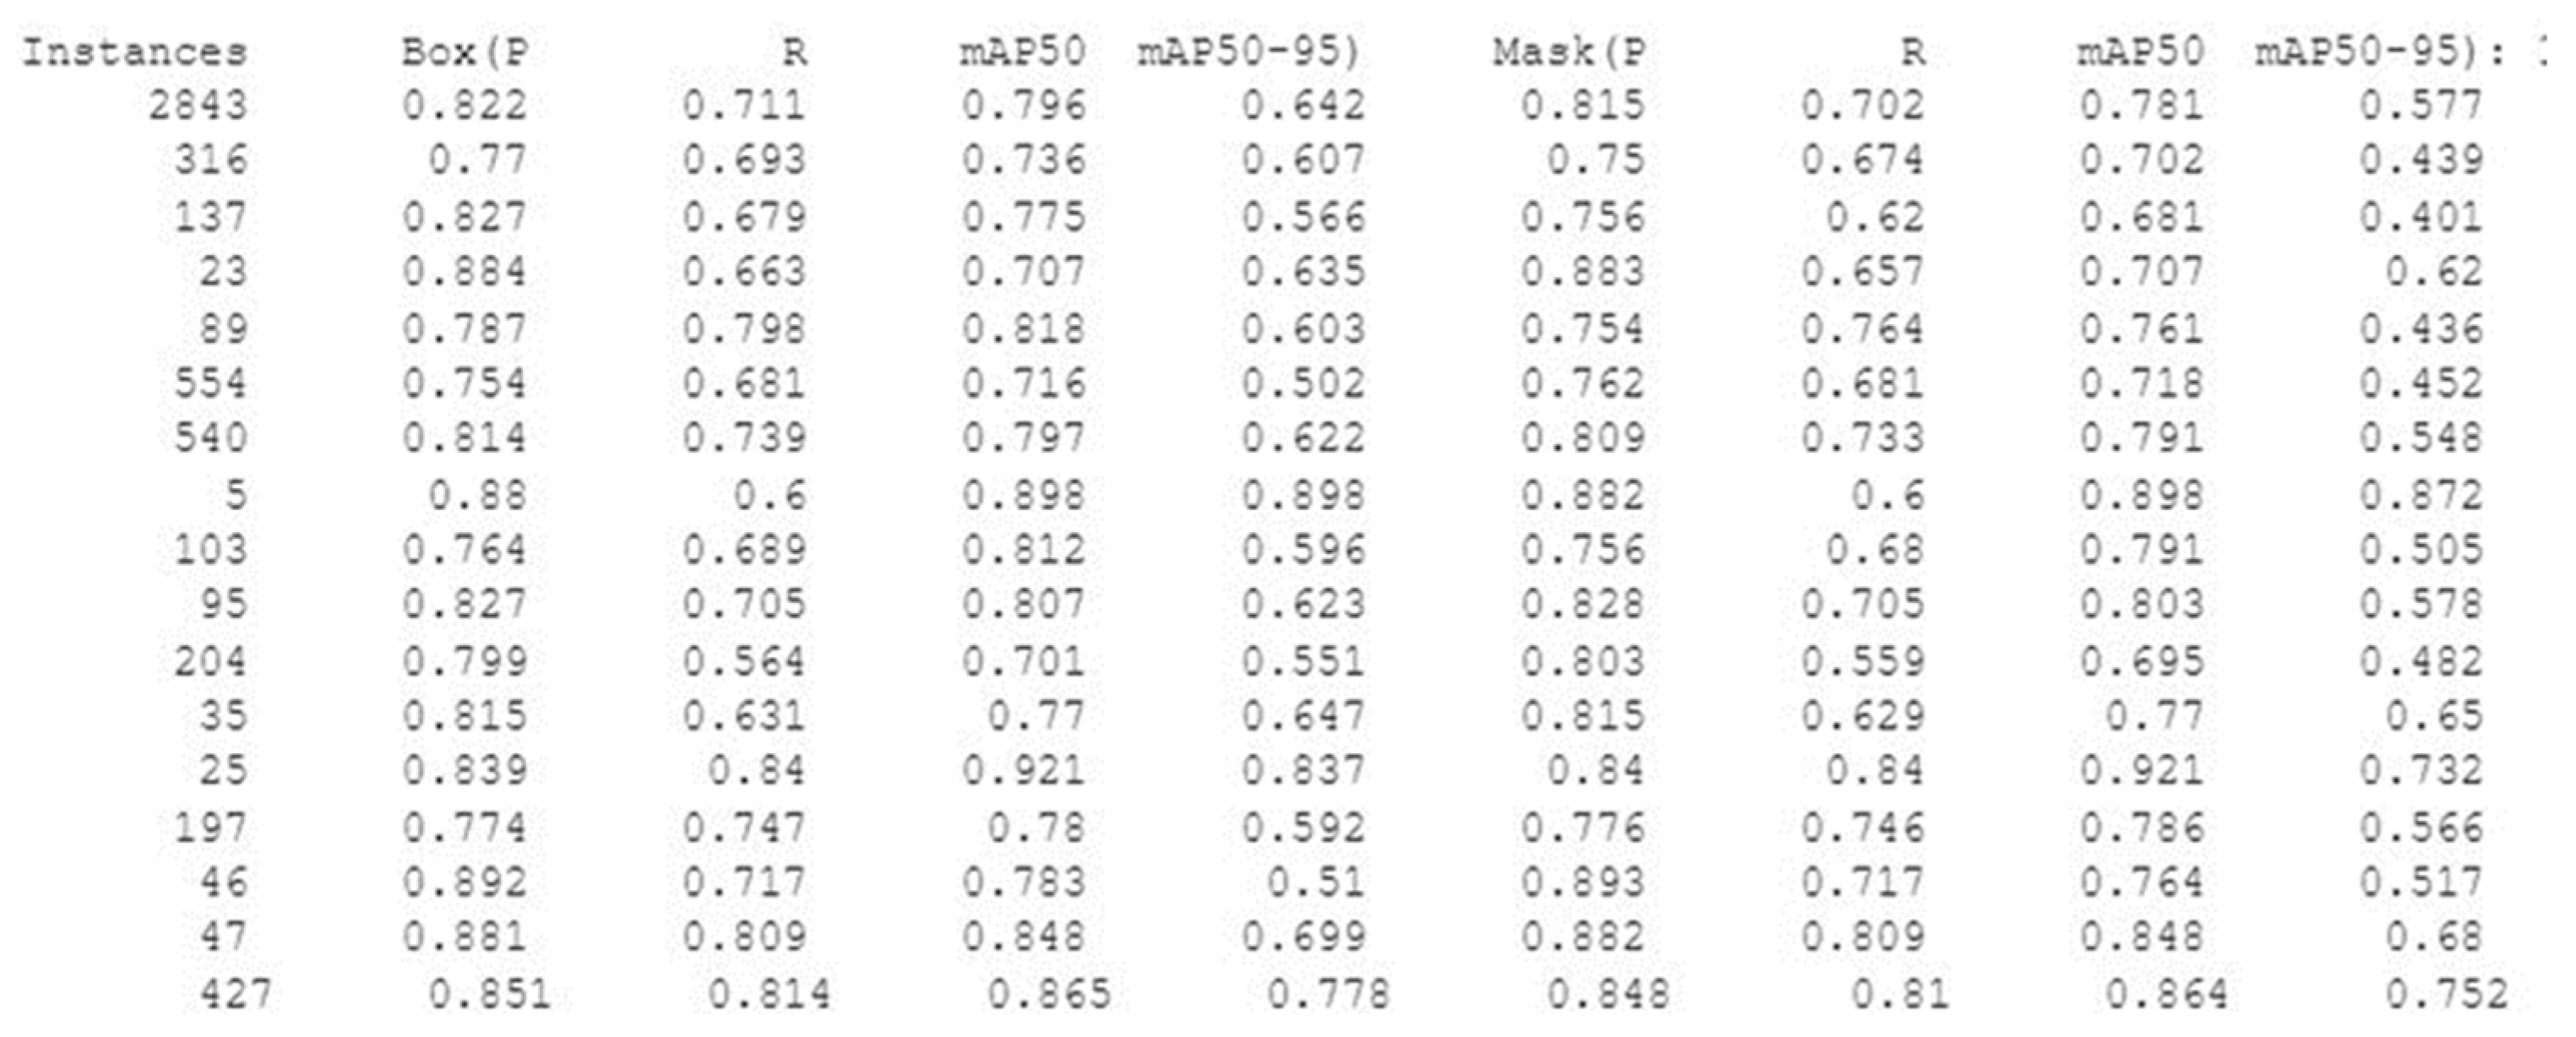
In Figure 12, we can see the validation results of YOLOv8 in a video of the Peristera shipwreck after training with our custom dataset. The image shows the number of instances for every class of our dataset (different species of fish) in the whole video, the precision, the recall, the mAP50 and the mAP50-90 for every bounding box detection and the precision, the recall, the mAP50 and the mAP50-90 for every masked object. The image is a screenshot from the results inside our training environment (Google Colab).

3.3. Confusion Matrix

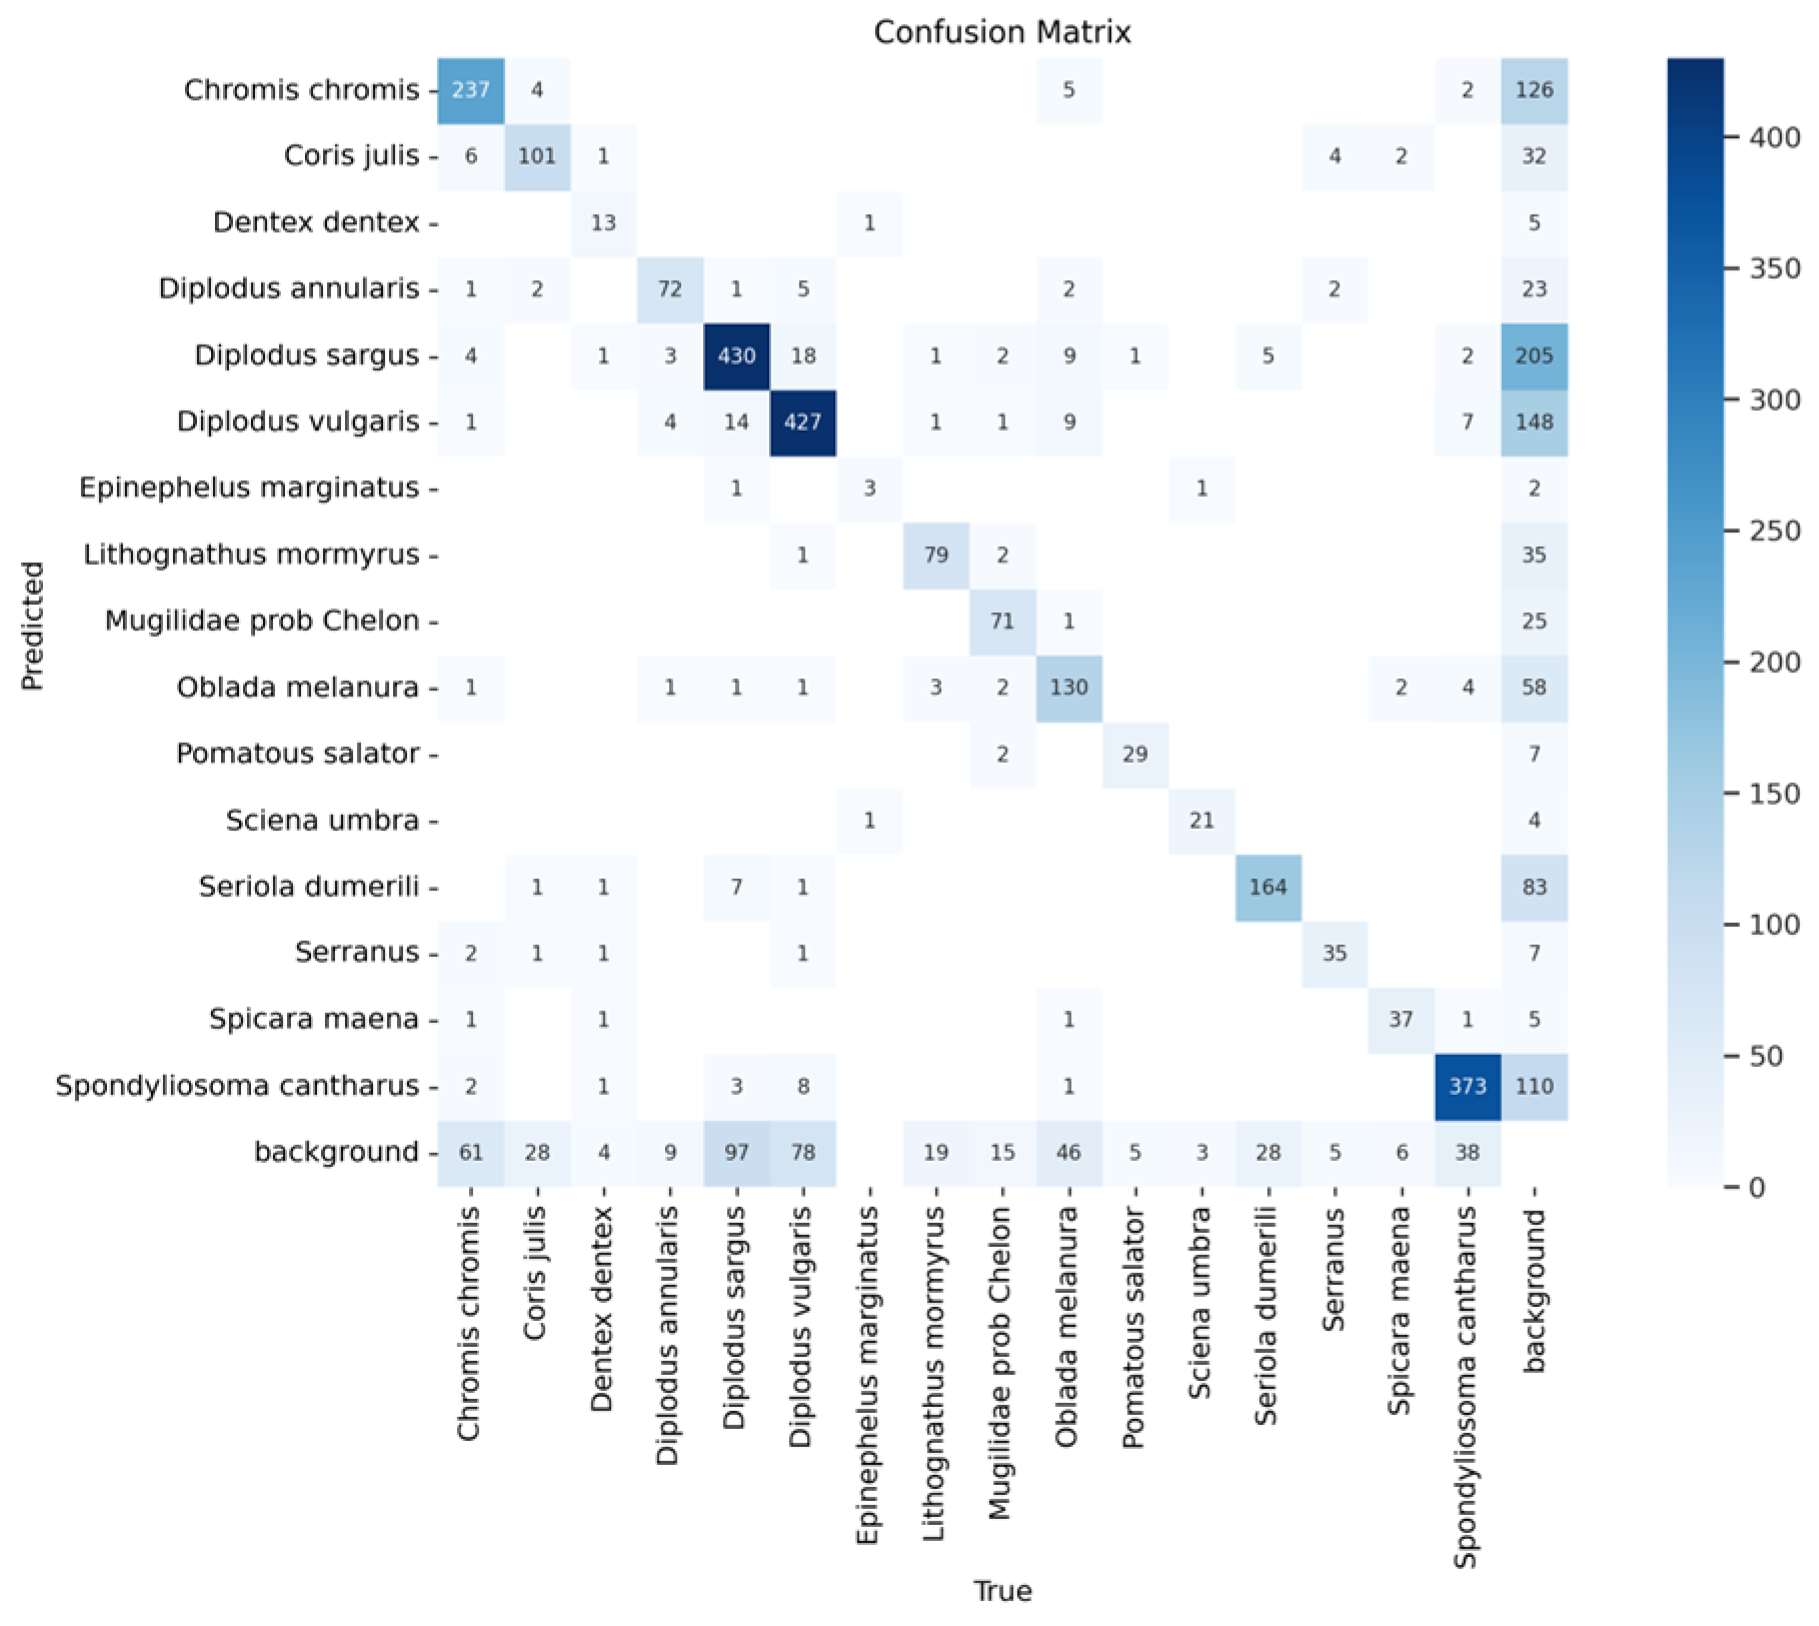
The confusion matrix inside our training environment is a matrix with all the species that our dataset contained and the algorithm’s predictions between them, as we can see in Figure 13. The matrix basically describes when a fish is truly the species that the algorithm detects and when it belongs to another class or in the background.
Since in this project we do not focus on species classification but generally on fish detection and segmentation, we generalize the confusion matrix in a 2 × 2 matrix that consists of information only about fish and background predictions. We put all the true fish predictions in the true positive section, all the wrong fish predictions that were the background in the false positive section, all the wrong background predictions that were fish in the false negative section and all the true background predictions in the true negative section.
In Figure 14, we see the table confusion matrix with the TP (true positive), TN (true negative), FP (false positive) and FN (false negative) for classification only between the fish and the background. The result was 1452 detected fish that were actually fish, 872 predicted fish that were actually background, 443 background objects that were predicted as fish and 0 background objects that were predicted as background.

3.4. Times

We then started applying our model to a video of the wreck of Peristera. Setting the confidence factor to 0.2, our model could successfully detect up to forty fish per frame (in one case from schools of fish). The detection times in each frame are approximately 2.0 ms for the preprocess, 13.8 ms for the detection and segmentation process and 2.6 ms for the postprocess, which make the model extremely easy to use for live broadcasting in real-time. Figure 15 is a screenshot of the prediction process inside our training environment. Every line of the image describes the prediction results for every video frame out of the 318. For example, in the first line, we can see that in the 308th frame, the algorithm detected 33 fish (33 chromis chromis) in a total time of 13.7 ms, without the preprocess and the postprocess that was shown after the algorithm finished the detection.

3.5. Detection and Segmentation per Frame

In Figure 16 we can see an example of applying the model to some frames of our video. The images are screenshots of the results inside our training environment. The confidence factor was set at 0.2 as we observed that when we decreased the confidence factor, more fish detections were shown in the results, which was our main goal. The detections are the red and green bounding boxes together with the fish species and the confidence factor, which shows how sure the algorithm is about the specific prediction.
Since our goal is to achieve real-time segmentation, the time factor was crucial for picking YOLOv8 and rejecting others such as VIBE. YOLOv8 gives fast predictions suitable for real-time applications.

3.6. Masking per Frame

As we explained in the Masking Section, we used the Python library “cv2” to generate the binary masks of the detected fish in the video. For each frame, we add all the masks of the detected fish and display them one by one in a sequence in order to take the mask video. In Figure 17, we can see two screenshots from the frame sequence with the masks inside our training environment.

4. Discussion

Based on our experiments, the combination of strong detection, segmentation and tracking algorithms and a masking algorithm gave very good results and were easy to manipulate in the 3D reconstruction tools.
The real-time texturing also gave good results, as far as the process and pipeline were concerned. The main issue, as was true with the whole system, was hardware. Even when streaming a simple model to the mobile application, we encountered hardware limitations, where the 3D model had to be downgraded significantly to much lesser polygons to achieve a constant stream at 15 fps. Running all the services and AI masking and segmentation tools simultaneously also put a heavy toll on our workstation. The main issue was, as mentioned previously, RAM, VRAM and CPU-GPU cores. In order to have the system running on one machine, it would need a state-of-the-art workstation, possibly with dual processors, multiple GPUs, and a large amount of RAM. Depending on the required accuracy during these processes, such as the photogrammetric accuracy of the background service, perhaps two or more such workstations are needed to split the tasks.
Cost is, therefore, a significant factor and might be raised or lowered, depending on the system requirements. If, for example, it is installed on a site purely for monitoring purposes, there is no reason to have very high-quality 3D models, as long as the foreign object detection algorithm works flawlessly. In the case of an exhibition or information kiosk, not every single fish needs to be re-entered into the scene. By simply removing one out of every three, the result would still be a very immersive environment while significantly reducing the graphics processing load by reducing the amount of 3D models.
In the case of installing the system, where stakeholders wish to be able to change between various sites, costs can rise significantly. For example, a small town that wants one shipwreck displayed at a kiosk requires just one set of cameras and stations, as outlined above. In the case of the three Peristera sites, if the stakeholders wish to have the capability to display all three, be it simultaneously or as a selection during the application login, more processing power is required, apart from the three total sets of underwater and close-proximity systems. As for the processing station, we believe that, with all services and AI tools working, the system requires one powerful workstation per site. This, of course, depends highly on the initial investment in this machine. A single workstation, with the right hardware, could potentially serve for all three Peristera wrecks.
The size of the shipwreck also affects the entire installation. A permanent installation around a site like Peristera works perfectly well with eight or perhaps even fewer cameras. In the case of Christophoros, however, more cameras are required to cover the entire ship. Considering that it could take perhaps 32 cameras for a ship this size, we would have to increase the number of underwater hubs along with the cameras. This would also lead to a need to increase the power requirements; therefore, more solar panels and batteries would be needed, as well as a second or perhaps even third modem, to transmit the enormous amount of data.
Depth is, of course, one of the biggest issues. Our system has been rated for up to 80 m, but anything more than that would require significant improvements to the camera and hub housings, which would also affect the setup of the overall system.
The increased costs mentioned above for the stakeholders do, however, come with benefits for the end users as, thanks to all the graphic processing performed at the remote station, they do not require high-end devices to use the application.
An important benefit of the system is that it requires little to no maintenance and running costs. The installation is, power-wise, self-sufficient during the summer and most of the spring and autumn. During the winter, adding more wind turbines could also reduce the downtime significantly, where power from the batteries has run out. Of course, more batteries would also help even further. The system can be modified to display the “last-known state”, that is, the very last video with good lighting conditions, in case it cannot receive any video from the site. As for the underwater equipment, the only problem might have been the cameras, specifically the debris on the housing camera openings, were it not for the wipers that work daily. If the system is without power for 2–3 weeks, a diver would need to descend and clean up the camera housings. No significant damage will occur to the housing and therefore affect the outgoing video, unless the system has been continuously without power for more than 2–2.5 months. The backup generator could be turned on manually, for a day or two every 2 weeks, to avoid both.
Speaking of camera housings, they can withstand pressure and do not deteriorate or dissolve underwater as do the cables that run between the cameras and hubs and to the surface. The surface installation is as secure as possible, with the security camera, and, if needed, an enclosure can be built to keep it safe from animals. We would, of course, recommend that someone monitors remotely and occasionally visits the close-proximity system, but it is reasonably secure. It has an overall small footprint, approximately 10 sq. meters, so it should not have a significant environmental impact.
We performed user surveys at the pilot sites, after we presented the application and allowed users to test it. Since it was off-season, our users were local community members rather than tourists. Out of the registered 37 people of all age groups, 16 were present during the application tests and 21 during the presentation. Moreover, 27 took part in our survey, which included questions regarding whether they were divers (77% were) and if they were at all familiar with VR applications, where 18% responded “very familiar”, while 15% responded “not at all”. Most other questions were about the application itself, mainly how user-friendly it was, if they required any help and for what specifically, and what features or other suggestions they would recommend. Furthermore, 37% found the navigation and controls were confusing, while 26% had to ask for help. Another 82% found that the in situ version of the application was very interesting and would benefit the community. The overall results and response were very positive and in fact gave a lot of suggestions on how to improve and expand the application. For example, one suggestion was to try to include a small, partially submerged cave near the Peristera diving location, if and when the surface area around it is digitally recreated.

5. Conclusions

The results of this study indicate the importance of an integrated and well-structured pre-processing system when it comes to building a VR app. This plays a big role in the iblueCulture project, as the underwater image is obviously more difficult to process in terms of quality and speed. This specifically is the reason we tried to establish and refine a very detailed processing path of the image from the moment that the camera captures a frame until this frame reaches the 3D reconstruction tool as a binary mask.
The results offer insights regarding maintaining, developing and promoting UCH sites using AI. The obvious practical application of this study proposes a well-structured underwater image processing pipeline, that can be used to give a technologically modern view to tourists and offer non-divers the opportunity to explore UCH sites and experience a full and realistic tour of shipwrecks.
Our analysis uses strong algorithms that predict underwater objects (such as fish), tracks and segments them and then masks them in order to use them for the 3D reconstruction, as well as removing any foreign, to the shipwreck, objects from the texture. There are many other suggestions in the current literature on object segmentation [19] and on how to obtain masks [21] on an image. Our method is aimed specifically at underwater environments and suggests a combination of algorithms and suitable datasets to prepare an image for 3D reconstruction.
Image quality and high-speed tools were vital to this study and many of the technological challenges and limitations met were due to these two factors. Because of the difficulty in approaching the shipwrecks and the fact that we could not have full remote control of the cameras, nor, of course, the weather conditions, manipulating the underwater images can only happen under specific circumstances and within certain limitations. In the case of a storm, for example, we receive little to no image from the cameras. On such an occasion, the system falls back to the premade 3D models and textures. During the night, there is no image to speak of as it is too dark to distinguish anything. In this case, the system displays basically darkness, as we intended it to be accurate in representation. The real-time factor, when it comes to underwater environments, can be quite complex and demanding, and the tools that are used should be really strong in terms of speed, memory and hardware quality.
The system could also incorporate various other sensors, such as temperature, sound, etc. These could also be used in the case of CAVE systems, where, for example, a decrease in temperature (a slight decrease, just as an indication) as soon as the user dives to the UCH site, would improve user immersion. In the case of site security, perhaps as a future project, seismic detector arrays could also be used. Turbidity is instantly visible through the system, though we thought of using sensors, or even the cameras themselves, to measure it and artificially introduce a digital fog in the Unity application to simulate low visibility. As it stands, while we tested this option, the light manipulation already in place can possibly dim the user’s view a lot. While this would be the realistic view this whole project is about, no stakeholder would endorse an application where the user cannot actually see anything. Therefore, this is something to be discussed in each individual scenario.
Our study highlights useful insights about the potential of utilizing artificial intelligence in exploring underwater heritage and enhancing tourism and culture through the promotion of UCH sites. Future research can extend this study in several ways, including the application of these findings in established apps that have similar aims and purposes, testing them under real conditions and obtaining feedback from the users. Another step further could focus on how to deal with limitations such as extreme weather conditions, a sudden lack of data due to weather patterns or even a lack of information about a UCH site under study.

Author Contributions

Conceptualization, supervision, project administration, funding acquisition, D.T., A.M. and K.P.; software, investigation, validation, data curation, visualization, A.V., E.B. and S.K.; methodology, formal analysis, resources, writing-original draft preparation, writing-review and editing, A.V., E.B., S.K. and A.F. All authors have read and agreed to the published version of the manuscript.

Funding

This work is partially supported by the i-blueCulture project co-financed by the European Regional Development Fund of the European Union and Greek national funds through the Operational Program Competitiveness, Entrepreneurship and Innovation, under the call RESEARCH–CREATE–INNOVATE (project code: T2EDK-03610).

Data Availability Statement

The data presented in this study are available on request from the corresponding author. 3rd party data has been referenced and provided with the corresponding URL.

Conflicts of Interest

The authors declare no conflict of interest.

References

  1. Vasa Museum. Available online: https://www.vasamuseet.se/en (accessed on 4 March 2024).
  2. O’Leary, M.J.; Paumard, V.; Ward, I. Exploring Sea Country through high-resolution 3D seismic imaging of Australia’s NW shelf: Resolving early coastal landscapes and preservation of underwater cultural heritage. Quat. Sci. Rev. 2020, 239, 106353. [Google Scholar] [CrossRef]
  3. Pydyn, A.; Popek, M.; Kubacka, M.; Janowski, Ł. Exploration and reconstruction of a medieval harbour using hydroacoustics, 3-D shallow seismic and underwater photogrammetry: A case study from Puck, southern Baltic Sea. Archaeol. Prospect. 2021, 28, 527–542. [Google Scholar] [CrossRef]
  4. Violante, C.; Masini, N.; Abate, N. Integrated remote sensing technologies for multi-depth seabed and coastal cultural resources: The case of the submerged Roman site of Baia (Naples, Italy). In Proceedings of the EUG 2022, Vienna, Austria, 23–27 May 2022. [Google Scholar]
  5. Menna, F.; Agrafiotis, P.; Georgopoulos, A. State of the art and applications in archaeological underwater 3D recording and mapping. J. Cult. Herit. 2018, 33, 231–248. [Google Scholar] [CrossRef]
  6. Gkionis, P.; Papatheodorou, G.; Geraga, M. The Benefits of 3D and 4D Synthesis of Marine Geophysical Datasets for Analysis and Visualisation of Shipwrecks, and for Interpretation of Physical Processes over Shipwreck Sites: A Case Study off Methoni, Greece. J. Mar. Sci. Eng. 2021, 9, 1255. [Google Scholar] [CrossRef]
  7. Bruno, F.; Barbieri, L.; Mangeruga, M.; Cozza, M.; Lagudi, A.; Čejka, J.; Liarokapis, F.; Skarlatos, D. Underwater augmented reality for improving the diving experience in submerged archaeological sites. Ocean Eng. 2019, 190, 106487. [Google Scholar] [CrossRef]
  8. Yamafune, K.; Torres, R.; Castro, F. Multi-Image Photogrammetry to Record and Reconstruct Underwater Shipwreck Sites. J. Archaeol. Method Theory 2017, 24, 703–725. [Google Scholar] [CrossRef]
  9. Aragón, E.; Munar, S.; Rodríguez, J.; Yamafune, K. Underwater photogrammetric monitoring techniques for mid-depth shipwrecks. J. Cult. Herit. 2018, 34, 255–260. [Google Scholar] [CrossRef]
  10. Balletti, C.; Beltrame, C.; Costa, E.; Guerra, F.; Vernier, P. 3D reconstruction of marble shipwreck cargoes based on underwater multi-image photogrammetry. Digit. Appl. Archaeol. Cult. Herit. 2016, 3, 1–8. [Google Scholar] [CrossRef]
  11. Liarokapis, F.; Kouřil, P.; Agrafiotis, P.; Demesticha, S.; Chmelík, J.; Skarlatos, D. 3D modelling and mapping for virtual exploration of underwater archaeology assets. Int. Arch. Photogramm. Remote Sens. Spat. Inf. Sci. 2017, 42, 425–431. [Google Scholar] [CrossRef]
  12. Skarlatos, D.; Agrafiotis, P.; Balogh, T.; Bruno, F.; Castro, F.; Davidde Petriaggi, D.; Demesticha, S.; Doulamis, A.; Drap, P.; Georgopoulos, A.; et al. Project iMARECULTURE: Advanced VR, iMmersive Serious Games and Augmented REality as Tools to Raise Awareness and Access to European Underwater CULTURal heritagE. In Digital Heritage. Progress in Cultural Heritage: Documentation, Preservation, and Protection, EuroMed 2016; Lecture Notes in Computer Science; Springer: Cham, Switzerland, 2016; Volume 10058. [Google Scholar] [CrossRef]
  13. Markku Reunanen, M.; Díaz, L.; Horttana, T. A Holistic User-Centered Approach to Immersive Digital Cultural Heritage Installations: Case Vrouw Maria. J. Comput. Cult. Herit. 2015, 7, 1–16. [Google Scholar] [CrossRef]
  14. Bruno, F.; Lagudi, A.; Barbieri, L. Virtual Reality Technologies for the Exploitation of Underwater Cultural Heritage. In Latest Developments in Reality-Based 3D Surveying and Modelling; Remondino, F., Georgopoulos, A., González-Aguilera, D., Agrafiotis, P., Eds.; MDPI: Basel, Switzerland, 2018; pp. 220–236. [Google Scholar] [CrossRef]
  15. Metashape System Requirements, by Agisoft. Available online: https://www.agisoft.com/downloads/system-requirements/ (accessed on 4 March 2024).
  16. OpenSFM. Available online: https://opensfm.org (accessed on 4 March 2024).
  17. Viswanath, V. Object Segmentation and Tracking in Videos. UC San Diego. ProQuest ID: Viswanath_ucsd_0033M_19737. Merritt ID: Ark:/13030/m5wh83s6. 2020. Available online: https://escholarship.org/uc/item/4wk7s73k (accessed on 2 March 2024).
  18. Segmentation vs. Detection vs. Classification in Computer Vision: A Comparative Analysis. Available online: https://www.picsellia.com/post/segmentation-vs-detection-vs-classification-in-computer-vision-a-comparative-analysis (accessed on 3 March 2024).
  19. Yao, R.; Lin, G.; Xia, S.; Zhao, J.; Zhou, Y. Video Object Seg-mentation and Tracking: A Survey. ACM Transactions on Intelligent Systems and Technology. arXiv 2019, arXiv:1904.09172. [Google Scholar]
  20. Kirillov, A.; Mintun, E.; Ravi, N.; Mao, H.; Rolland, C.; Gustafson, L.; Xiao, T.; Whitehead, S.; Berg, A.C.; Girshick, R.; et al. Segment Anything. arXiv 2023, arXiv:2304.02643. [Google Scholar]
  21. Barnich, O.; Van Droogenbroeck, M. ViBe: A Universal Background Subtraction Algorithm for Video Sequences. IEEE Trans. Image Process. 2011, 20, 1709–1724. [Google Scholar] [CrossRef] [PubMed]
  22. Cheng, H.K.; Schwing, A.G. Xmem: Long-term video object segmentation with an atkinson-shiffrin memory model. In Proceedings of the European Conference on Computer Vision, Tel Aviv, Israel, 23–27 October 2022; Springer Nature: Cham, Switzerland, 2022; pp. 640–658. [Google Scholar]
  23. Atkinson, R.C.; Shiffrin, R.M. Human memory: A proposed system and its control processes. In The Psychology of Learning and Motivation: II; Spence, K.W., Spence, J.T., Eds.; Academic Press: Cambridge, MA, USA, 1968. [Google Scholar] [CrossRef]
  24. Yang, J.; Gao, M.; Li, Z.; Gao, S.; Wang, F.; Zheng, F. Track Anything: Segment Anything Meets Videos. arXiv 2023, arXiv:2304.11968. [Google Scholar]
  25. ArtGAN. Available online: https://huggingface.co/spaces/ArtGAN/Segment-Anything-Video (accessed on 14 January 2024).
  26. Akyon, F.C.; Altinuc, S.O.; Temizel, A. Slicing Aided Hyper Inference and Fine-Tuning for Small Object Detection. In Proceedings of the 2022 IEEE International Conference on Image Processing (ICIP), Bordeaux, France, 16–19 October 2022; pp. 966–970. [Google Scholar] [CrossRef]
  27. Redmon, J.; Divvala, S.; Girshick, R.; Farhadi, A. You Only Look Once: Unified, Real-Time Object Detection. In Proceedings of the 2016 IEEE Conference on Computer Vision and Pattern Recognition (CVPR), Las Vegas, NV, USA, 27–30 June 2016; pp. 779–788. [Google Scholar]
  28. Ultralytics YOLO Documentation. Available online: https://docs.ultralytics.com/yolov5/ (accessed on 21 February 2024).
  29. Lin, T.Y.; Maire, M.; Belongie, S.; Hays, J.; Perona, P.; Ramanan, D.; Dollár, P.; Zitnick, C.L. Microsoft COCO: Common Objects in Context. arXiv 2014, arXiv:1405.0312. [Google Scholar]
  30. Wenkel, S.; Alhazmi, K.; Liiv, T.; Alrshoud, S.; Simon, M. Confidence Score: The Forgotten Dimension of Object Detection Performance Evaluation. Sensors 2021, 21, 4350. [Google Scholar] [CrossRef] [PubMed]
  31. Roboflow Fish Dataset. Available online: https://universe.roboflow.com/minor/fish_dataset_instance_segmentation/dataset/1/images (accessed on 3 March 2024).
  32. Roboflow. Available online: https://universe.roboflow.com/fish-dl/instance-con-sam-buenois/dataset/9 (accessed on 21 February 2024).
  33. Brief Review: YOLOv5 for Object Detection. Available online: https://sh-tsang.medium.com/brief-review-yolov5-for-object-detection-84cc6c6a0e3a (accessed on 20 February 2024).
  34. Aharon, N.; Orfaig, R.; Bobrovsky, B.Z. BoT-SORT: Robust associations multi-pedestrian tracking. arXiv 2022, arXiv:2206.14651. [Google Scholar]
  35. Kalman Filter. Available online: https://www.kalmanfilter.net/multiSummary.html (accessed on 14 January 2024).
  36. The Confusing Metrics of AP and MAP for Object Detection. Available online: https://yanfengliux.medium.com/the-confusing-metrics-of-ap-and-map-for-object-detection-3113ba0386ef (accessed on 3 March 2024).
  37. Zhou, Z. Detection and Counting Method of Pigs Based on YOLOV5_Plus: A Combination of YOLOV5 and Attention Mechanism. Math. Probl. Eng. 2022, 2022, 7078670. [Google Scholar] [CrossRef]
  38. Yang, F. An improved YOLO v3 algorithm for remote Sensing image target detection. J. Phys. Conf. Ser. 2021, 2132, 012028. [Google Scholar] [CrossRef]
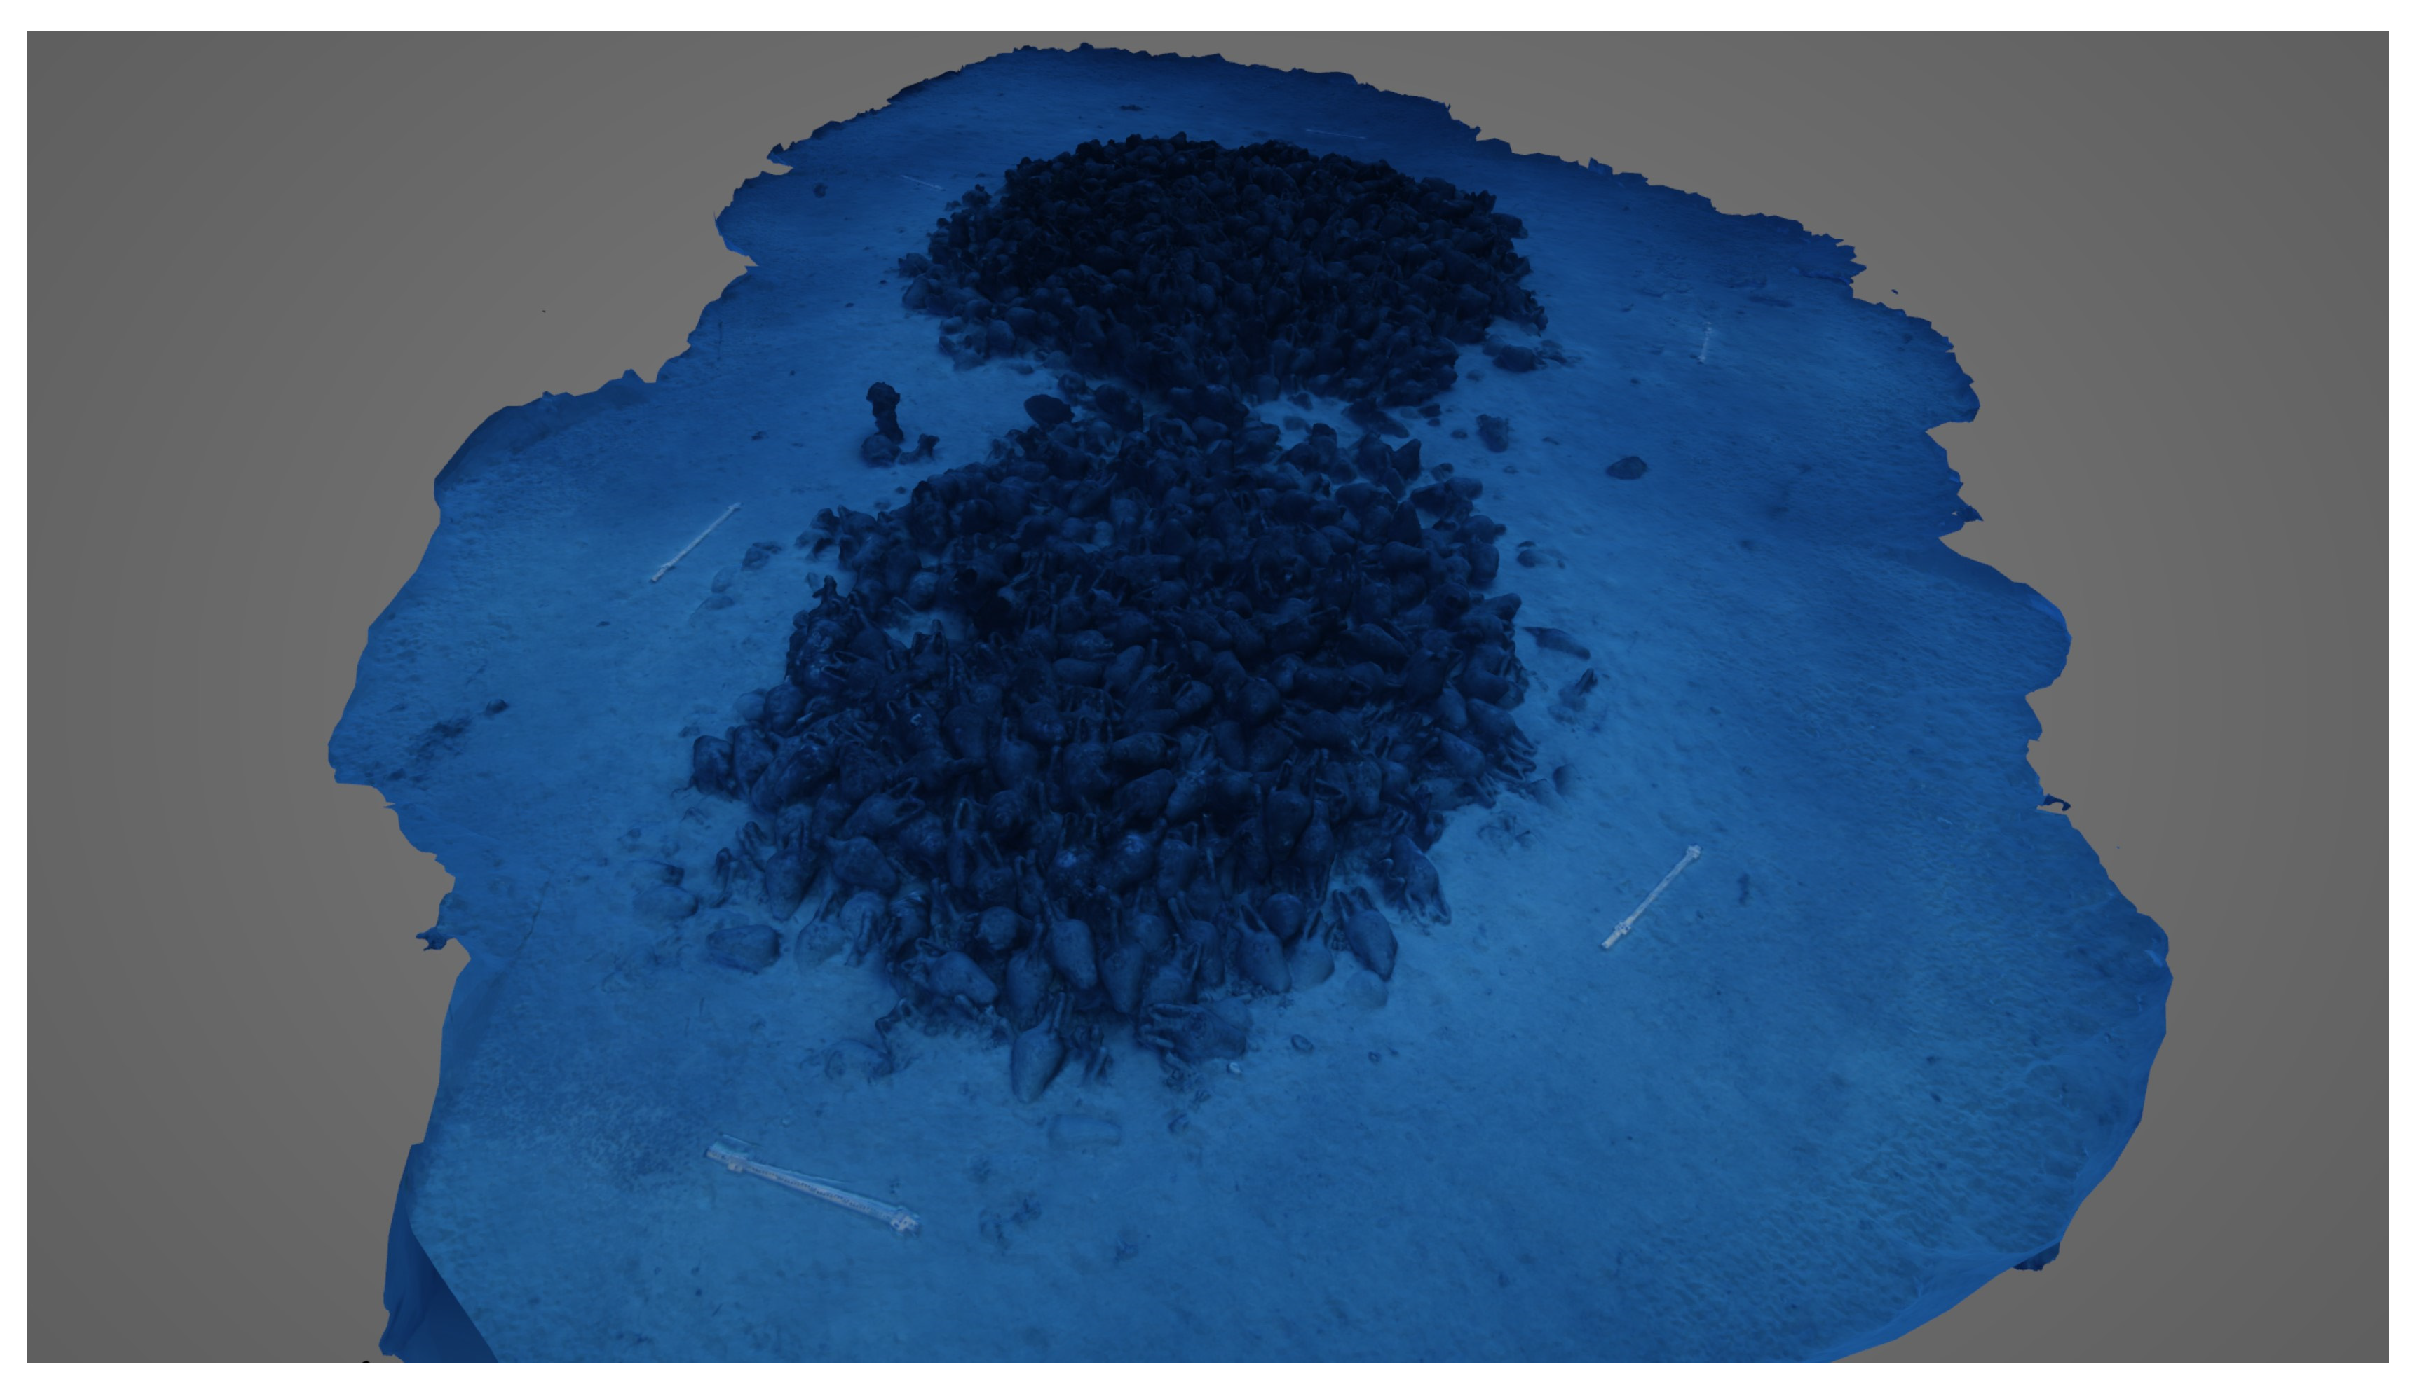
Figure 1. 3D model of one of the Peristera Byzantine shipwrecks.
Remotesensing 16 02254 g001
Figure 2. The Unity application while running on the workstation.
Remotesensing 16 02254 g002
Figure 3. The user character, just before the dive.
Remotesensing 16 02254 g003
Figure 4. The user character reaches the bottom and sees the UCH site, in the distance.
Remotesensing 16 02254 g004
Figure 5. The user navigating the UCH site.
Remotesensing 16 02254 g005
Figure 6. Close-up camera views.
Remotesensing 16 02254 g006
Figure 7. Peristera frame/tests in ArtGAN, SAM and Track Anything.
Remotesensing 16 02254 g007
Figure 8. YOLOv8 performance on frames of the Peristera video with v9-Instance-con-sam (bueno IS).
Remotesensing 16 02254 g008
Figure 9. Confusion matrix of fish and background.
Remotesensing 16 02254 g009
Figure 10. Leaky ReLU graph.
Remotesensing 16 02254 g010
Figure 11. Loss curves after we trained our model.
Remotesensing 16 02254 g011
Figure 12. Measurements of the metrics for detection and segmentation for the various classes of the dataset.
Remotesensing 16 02254 g012
Figure 13. Confusion matrix of YOLOv8 with our custom dataset.
Remotesensing 16 02254 g013
Figure 14. Confusion matrix between fish and background.
Remotesensing 16 02254 g014
Figure 15. Examples of detection in the frames of the video from the wreck of Peristera.
Remotesensing 16 02254 g015
Figure 16. Detections in the video of the Peristera shipwreck. The numbers next to the labels correspond to confidence scores.
Remotesensing 16 02254 g016
Figure 17. Masking in the video from the Peristera shipwreck.
Remotesensing 16 02254 g017
Table 1. VIBE algorithm speeds.
Video SecsQuality CameraExecution TimeExec. Time w/o VibranceExec. Time with No Preprocessing
7 sCamera 4 (blurred, not good)9 s7 s8–13 s (times varied)
7 sCamera 5 (good)11 s10 s10 s
Disclaimer/Publisher’s Note: The statements, opinions and data contained in all publications are solely those of the individual author(s) and contributor(s) and not of MDPI and/or the editor(s). MDPI and/or the editor(s) disclaim responsibility for any injury to people or property resulting from any ideas, methods, instructions or products referred to in the content.