Abstract
How to enhance the desired signal with low signal-to-noise ratio (SNR) is a difficult problem in the estimation process of the direction-of-arrival (DOA) of the target scattering wave signal. In this paper, the feasibility of spatial spectrum estimation in the Range-Doppler (RD) domain is analyzed in principle, and the SNR gain expression of weak scattering wave signal is derived when constructing multi-snapshots virtual array data. On this basis, the mutual eigenvector singular value decomposition (MESVD) method based on RD domain mode excitation is proposed, which can robustly and effectively estimate the direction of the coherent weak signals. Simulation experiments verify that the RD domain spectral estimation method has the ability to simultaneously obtain the direction of multiple weak target scattering waves, and the direction-finding accuracy can reach the Cramer–Rao bound (CRB) of conventional spectral estimation method. The results of Monte Carlo experiments show that the root-mean-square-error (RMSE) of azimuth estimation of RD domain spatial spectrum estimation method is 5.76° lower than that of a conventional multiple signal classification (MUSIC) method. In addition, the practicability of the proposed method is demonstrated by comparing the DOA estimation results of a set of real data with Automatic Dependent Surveillance-Broadcast (ADS-B) data.
1. Introduction
Over-the-horizon radar plays an important role in modern long-range detection [1,2,3], which can detect the vast airspace for a long time at a relatively low cost, and the use of high-power AM, FM, TV broadcast, etc. as non-cooperative illuminators also further improve the concealment and survivability of the radar systems [4]. However, target scattering waves received by the array antennas of an over-the-horizon passive detection system are highly susceptible to interference and influence of the complex electromagnetic environment [5], and their signal power levels are often so weak that they are submerged in various interference and noise, which makes it of strong practical significance to study the detection technology of the weak target signals in the background of clutter.
DOA refers to the directional information of each signal arriving at the receiving antenna array in space. The related principle is an important part of target detection technology, and is also a popular research trend in the field of array signal processing at present [6,7]. In traditional spatial spectrum goniometric algorithms, the resolution of beamforming is limited by the aperture of the receiving array, and it is difficult to break through the Rayleigh resolution limit. The Capon spatial spectrum method can perform the spatial spectrum estimation simply and reliably [8], but its performance degrades seriously at low SNR [9]. The MUSIC spatial spectrum method has good super-resolution ability, but requires accurate estimation of the number of sources in order to correctly classify the signal and noise subspaces after the eigen-decomposition of the covariance matrix [10]. The estimation of signal parameters via rotational invariance technique (ESPRIT) algorithm is a reduced dimensional subspace spectral estimation method, which avoids the computationally intensive spectral search process [11]. The ESPRIT method should reconstruct the receiving array into two identical sub-arrays, so that it is only applicable to special array manifolds. The maximum likelihood (ML) approach can achieve optimal unbiased estimation, which has a theoretical mean square error comparable to the CRB [12]. However, the high algorithm complexity increases the difficulty of promotion.
In a passive radar system, the antennas receive scattering waves from the target as well as multipath waves such as high power direct wave and ground-sea clutters. The SNR of scattering waves may even be 100 dB lower than that of direct waves [13], resulting in subspace interleaving in the eigen-decomposition of the covariance matrix, which makes it more difficult to accurately estimate the number of sources [14], and further deteriorates the performance of spectral estimation methods such as MUSIC. Many studies have contributed to improving the robustness of DOA estimation for low SNR signals or coherent signals. A root-MUSIC method is proposed in [15], which transforms the spectral search into polynomial rooting to reduce the computational complexity and can work even when the SNR of the echo signal is low. The manifold separation technique is used to extend the root-MUSIC method from uniform linear array (ULA) to arrays of arbitrary geometry in [16], although it is very complicated to find the root when the array aperture is large. A weighted algorithm based on signal subspace characteristics proposed in [17] uses the noise immunity of signal subspace to improve the robustness under low SNR. The MUSIC-like algorithm proposed in [18] can work stably without an accurate source number at low SNR, but its performance is still limited by the Cramer–Rao bound. The spatial smoothing technique proposed in [19,20] has the ability to suppress the coherent interference, but the method is mainly applied in ULA. The linear relationship between the eigenvectors of the covariance matrix and the signal steering vectors is proved in [21], which is used for a matrix reconstruction method based on the eigenvector proposed in [22] to realize coherent signals’ DOA estimation. None of the above works investigates how to enhance the SNR of the received desired signals. The method of beamforming in the RD domain proposed in [23,24] provides a new idea: by using the characteristics of different targets and clutters distributed in different RD units, the separation of target scattering wave and interference in the RD domain is formed, and the SNR of the target scattering wave is greatly improved in the corresponding RD unit due to coherent integration processing.
Therefore, a novel spectrum estimation method of Range-Doppler domain MUSIC (RD-MUISC) was proposed in 2018 to achieve more SNR gain for weak echo wave RD domain signal processing compared to the time domain signal processing of a classical DOA estimation method [25]. The conventional RD domain signal processing can only produce one two-dimensional spectrum result per time, resulting in a rank of one for the covariance matrix constructed by a single snapshot in the RD domain, which cannot be directly used for MUSIC method. The whole process of extending the single snapshot datum to the multi-snapshots virtual array data and completing the MUSIC spectrum estimation is given in [25]. The improvement work on RD-MUSIC that is carried out in this paper is that the application conditions and performance boundary of the RD-MUSIC method are determined by principle analysis, and a novel RD-MUSIC method is proposed for the direction estimation problem of coherent weak signals.
The main contributions of this paper are as follows: (1) a method to construct multi-snapshots virtual array data for narrowband signal is proposed, and its SNR gain is derived; (2) a method is proposed to estimate DOA of coherent weak signals in the RD domain; (3) the Monte Carlo simulation results of the spatial spectral estimation methods in the RD domain proposed in this paper and the comparison curves with the CRB are given, and the actual field data are verified.
The rest of this paper is arranged as follows: Section 2 introduces the array received by the signal model and the principle of MUSIC spectrum estimation, and gives the CRB formula; Section 3 introduces the principle of DOA estimation in the RD domain, derives the SNR gain expression of virtual array signal, and proposes a novel RD domain DOA estimation method for the coherent weak signals; Section 4 gives the simulation and field test results of the RD domain spatial spectrum estimation method; Section 5 concludes the whole paper. In this paper, , , , , , , denote expectation, complex conjugate, transpose, Hermitian transpose, inverse, absolute value, and Hadamard product, respectively.
2. Basic Principle
Compared with ULA, uniform circular array (UCA) can perform direction finding and beam scanning in the 360° azimuth range, and has the same array aperture in any azimuth. Therefore, UCA is used as the type of receiving antenna array in the following derivation and analysis in this paper.
The receiving antenna array is a UCA with elements, radius, and height. The coordinate system is established with the UCA center point as the coordinate origin. The geometrical distribution of the UCA elements and the incident direction of the signal are shown in Figure 1.
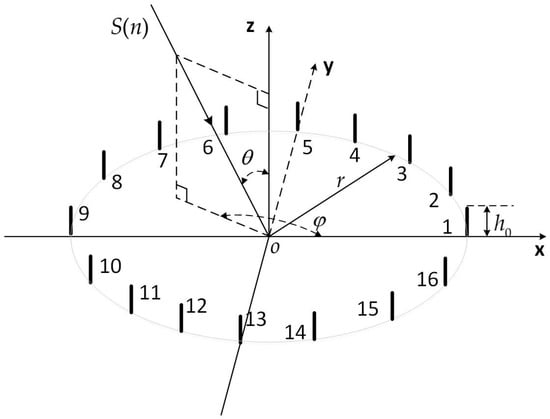
Figure 1.
The schematic diagram of the spatial distribution of the rectangular coordinate system o-xyz and UCA array elements.
The far-field incident signal received by UCA consists of a direct wave signal, multipath signals including target scattering waves, and noise. After the array amplitude and phase calibration processing, it can be considered that each receiving channel has amplitude and phase consistency; that is, the signal complex amplitude attenuation factor of each channel is consistent, so can be expressed as follows:
where is the time domain sampling point serial number of the array received signal; is the signal sampling rate; is the direct wave signal incident at the center of the UCA array, which is a stationary Gaussian random process with power normalization; , , and are complex amplitude factor, incident azimuth, and pitch angle of the direct wave, respectively; denotes the i-th incident multipath signal; , , and are complex amplitude factor, time delay, and Doppler shift of the i-th multipath signal compared to , respectively; and are incident azimuth and pitch angle of the i-th multipath signal, respectively; and are the array steering vectors corresponding to the direct wave and the i-th multipath signal, respectively; is the carrier frequency of the incident signal; is the velocity of light; is the Gaussian white noise complex vector of the receiving channels; and the noise power of each channel is .
The sampling covariance matrix is calculated as:
Eigen-decomposition of is expressed as:
where and are the m-th eigenvalue and the corresponding eigenvector of , respectively; the eigenvalues are sorted in descending order; is the dimensional signal subspace corresponding to the first eigenvalues; is the dimensional noise subspace corresponding to the remaining eigenvalues; and and are the signal eigenvalue diagonal matrix and the noise eigenvalue diagonal matrix, respectively.
The MUSIC method makes use of the orthogonality between signal subspace and noise subspace obtained by the covariance matrix eigen-decomposition to construct the spatial spectrum function. The MUSIC spectral function is constructed as follows:
Therefore, the angle when the spectral function takes an extreme value is the direction of the incident signal.
The CRB provides a lower bound for direction estimation error. As a reference for verifying the performance of the estimation method under different snapshots’ number and SNR, the calculation formula is [26]:
where is the number of snapshots involved in DOA estimation, the steering vector matrix is composed of the steering vectors of incident signals, is the partial derivative matrix of matrix about the direction of arrival, and is the diagonal matrix composed of the SNR of signals.
Furthermore, one of the prerequisites for the RD-domain signal enhancement spatial spectrum estimation method is that the reference signal consisting of direct wave and noise can be obtained, which can be used for coherent integration calculation with the array received signal. The expression for the reference signal is the following:
The power of Gaussian white noise in the reference signal is .
3. Direction of Arrival Estimation in Range-Doppler Domain
3.1. Feasibility Analysis
The feasibility of the RD domain DOA estimation comes from the invariance of the direction information of the incident waves in the two-dimensional ambiguity function. In the following, the conclusion will be derived from analyzing the two-dimensional ambiguity function calculated by the reference signal and the signal of each receiving channel which is called the surveillance channel signal.
The SNR of the reference signal as Equation (6) is high enough. In addition, it is assumed that the direct wave signal in the array received signal as Equation (1) has been completely suppressed by time domain cancellation or beamforming, so the vector of channel surveillance channel signals can be indicated as:
where the vector can be expressed in .
The m-th channel two-dimensional ambiguity function of the reference signal and the m-th surveillance channel signal can be obtained as:
where and are the search value of Range and Doppler shift, respectively, and represents the m-th element of the i-th multipath signal’s steering vector . Therefore, the two-dimensional ambiguity function vector of channels is written in the following form:
where is an amplitude factor diagonal matrix of multipath signals, is the array manifold matrix composed of the steering vectors of multipath signals, is the two-dimensional ambiguity function vector of the normalized amplitude direct wave signal and the normalized amplitude multipath signals, and the i-th element of is:
is the equivalent noise vector of channels, the m-th element of is:
In addition, the two-dimensional spectrum based on the two-dimensional ambiguity function can be called the RD map generally. The ambiguity function vector in the form of Equation (9) is called the RD domain virtual array signal in this paper, which completely retains the steering vector of multipath signals, indicating that the virtual array signal has the same spatial characteristics as the surveillance channel signal in Equation (7), which is the principle basis for DOA estimation in the RD domain.
The RD domain virtual array signal consists of the first term representing a multipath signal and the second term representing noise, and can be rewritten as:
3.2. Range Spectrum Virtual Array of Narrowband Signal
The RD domain covariance matrix is constructed by using the RD domain virtual array snapshot data obtained by Equation (12) as follows:
Since single RD calculation can only produce single snapshot data, the rank of is 1, which makes it unrealistic to directly use for the MUSIC method. In order to obtain multi-snapshots data to restore the rank of , the time-domain sampling sequence of the reference signal and the m-th surveillance channel signal are generally divided into segments (), respectively, and the ambiguity function of the k-segment is calculated. The two-dimensional ambiguity function value at , which are the serial number of the time delay and Doppler shift, known as the RD unit where the i-th multipath signal is located, is used to construct the m-th channel virtual sampling sequence , , so the M-channels, K-snapshots virtual array data are . The reference diagram of this method is shown in Figure 2. We use the first virtual array construction (VAC1) to refer to the method of generating multi-snapshots virtual array data by segmenting the time-domain sampling sequence.
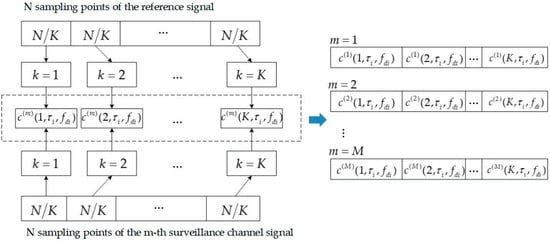
Figure 2.
The reference diagram of VAC1.
Aiming at the direction-finding application scenario of the low SNR narrowband signals, another method is proposed to construct RD domain multi-snapshots. The range spectrum at the target scattering wave signal’s Doppler shift on the RD map is directly regarded as the multi-snapshots in the RD domain without segmenting the time-domain sampling sequence of the reference signal and the surveillance channel signals. That is to say, a column of range spectrum with length at the i-th multipath signal’s Doppler shift on the RD map generated by the reference signal and the m-th surveillance channel signal is directly regarded as the virtual sampling sequence of the m-th channel, and the range spectrum sampling interval is defined as . Therefore, the range spectrum virtual array data of M-channels and -snapshots are defined as follows:
We use the second virtual array construction (VAC2) to refer to the method of directly generating multi-snapshots virtual array data by the range spectrum on RD map. The reference diagram of VAC2 is shown in Figure 3.
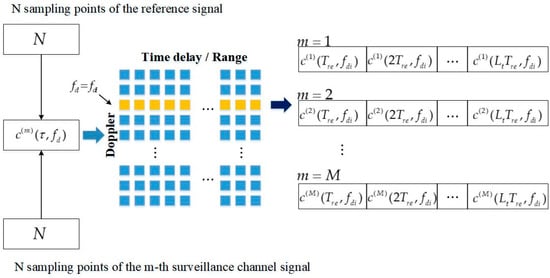
Figure 3.
The reference diagram of VAC2.
The virtual array data covariance matrix is approximated as:
The virtual array data need to satisfy to ensure that is a full rank matrix. The eigen-decomposition of and the MUSIC spectrum function are similar to Section 2 which can be expressed as:
The CRB of virtual array data DOA estimation method can be calculated as:
where is the number of virtual array snapshots and is the diagonal matrix composed of the equivalent SNR of the virtual array signal.
Compared with VAC1, VAC2 only requires calculation of the two-dimensional ambiguity function once for each surveillance channel, which can significantly decrease the computation burden. Furthermore, more points can participate in coherent integration because it is not necessary to segment the time-domain sampling sequence, which can theoretically provide greater SNR gain. When the SNR of the target scattering wave is set to −40 dB, the RMSE comparison results of the azimuth estimation of the incident signal under the two construction methods of VAC1 and VAC2 are shown in Figure 4. The abscissa indicates the number of snapshots in the RD domain. The primary conclusion, which can be obtained from the results with the 200 Hz bandwidth signal, is that the azimuth estimation error of the VAC2 method is smaller, and the VAC2 method can obtain higher and more robust SNR gain than the VAC1 method when processing narrowband signals. However, the DOA estimation performance of the VAC1 method is less affected by the bandwidth of the incident signal and the number of snapshots in the RD domain, and it is also shown in Figure 4 that there is a negative correlation between the bandwidth of the incident signal and the DOA estimation performance of the VAC2 method. When the bandwidth reaches 6 kHz, the DOA estimation performance of the VAC2 method is worse than that of the VAC1 method, and the estimation accuracy gradually deteriorates with the increase of the number of the RD domain snapshots.
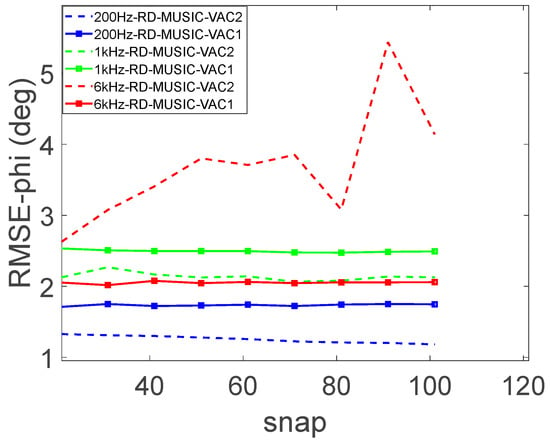
Figure 4.
The DOA estimation performance of two virtual array construction methods for different bandwidth signals.
According to the results in Figure 4 and the principle that the main lobe width of the range spectrum on the RD map is inversely proportional to the signal bandwidth, when the RD domain sampling points of the VAC2 method are selected to exceed the main lobe range in the range spectrum, the RD domain signal processing cannot obtain sufficient SNR gain. Since the number of snapshots in the RD domain must meet the requirement of , the ideal application condition of VAC2 is that the bandwidth of the incident signal is not greater than , and is an empirical value in the range of [1, 10].
3.3. Signal-to-Noise Ratio Gain Analysis
Assuming that the incident signal is a narrowband signal, the reference signal is shown in Equation (6) with the SNR conformed to ; the surveillance channel array signals are shown in Equation (7); where the multipath signals number is , the complex amplitude of the i-th multipath signal is , and the power of the noise in each surveillance channel is . Since the power level of each multipath signal is lower than the noise to meet the weak scattering waves characteristic, the SNR is conformed to .
It can be seen from Equation (12) that the two-dimensional ambiguity function vector consists of the signal part and the noise part, so as to calculate the SNR of the RD domain multi-snapshots virtual array data. Each receiving array element has channel consistency and the noise of each channel is independent and identically distributed. It can be considered that the SNR of the time-domain sampling sequence between each channel is consistent. Similarly, the SNRs of the RD domain sampling sequence between the channels are also the same. Therefore, only the m-th channel’s RD domain SNR is derived below instead of calculating all channels.
The m-th channel two-dimensional ambiguity function shown in Equation (12) can be represented by the signal part and the noise part , , , respectively:
where is the correlation term between the reference channel signal and the i-th multipath signal, and is the correlation term between the reference channel noise and the i-th multipath signal.
Suppose that the desired DOA estimation signal is the L-th multipath signal, and the represents the two-dimensional ambiguity function value of the desired signal. In the RD unit where the desired signal is located, the power of the L-th multipath signal in the m-th channel can be calculated as follows:
In the RD unit , the of other multipath signals become the interference term of signal part . When is large and the range parameter meets , the correlation coefficient between and is expressed as , tending to zero, so the power of the interference term is approximately:
The three terms of the noise part in the two-dimensional ambiguity function are analyzed in the following. Taking as an example, the Fourier series coefficients of the range spectrum sequence with points are obtained:
where is the Fourier series coefficient of the incident signal , also known as the spectral coefficient; is the k-th frequency point on the spectrum. Since is independent of the sampling serial number , Equation (25) can be simplified as:
where is the spectral coefficient of the m-th surveillance channel noise .
Because the noise is a white Gaussian process which has a power of , it can be considered that has a constant value of among the whole spectrum, that is, . Substituting it into Equation (26), we can obtain the following:
According to the Parseval theorem of discrete Fourier series, the average power of the signal in the time domain is equal to the sum of the power in the frequency domain, which can be expressed as . Therefore, the expression of the quadratic sum of at the range spectrum can be obtained as:
It is known that the average power of and is 1 and , respectively. By using the Parseval theorem for and , Equation (28) can be rewritten as:
It can be seen from Equation (27) that the distribution of is independent of the Doppler shift, so the root mean square of in the two-dimensional ambiguity function is equal to the root mean square of the range spectrum:
Similarly, the root mean square and of and can be calculated, respectively, as follows:
The average value of the noise power contained in each RD unit on the RD map of the m-th channel is:
Considering a mathematical theorem of the inequality relation in which the absolute value of the arithmetic mean of several numbers does not exceed the root mean square of these numbers [27], the upper bound of noise power can be derived from Equation (33) as follows:
The ratio of the signal power in the RD unit where the desired signal is located to the average noise power in each RD unit on the RD map is called the RD domain SNR, which can be given by the following:
where is the SNR of the L-th multipath signal which is the desired signal, is the SNR of the i-th signal of the all multipath signals, and is the SNR of the reference signal. Equation (35) shows that the lower bound of SNR in the RD domain is proportional to , which is the number of coherent integration points, and inversely proportional to , which is the number of multipath signals. In addition, the lower bound of is proportional to the reference signal’s SNR () and inversely proportional to the SNR of each multipath signal () except the desired signal.
Supposing that the noise terms , and are uncorrelated additive noises, then Equation (33) can be directly reduced to:
In this case, the RD domain SNR is obtained as follows:
According to the foregoing, the signals’ SNRs are obtained by and , and Equation (37) can be approximated as . In summary, the target scattering wave can obtain a maximum N-fold SNR gain in the RD domain compared to the time-domain sampling sequence of the surveillance channel.
3.4. Direction of Arrival Estimation of Coherent Weak Signals in Range-Doppler Domain
When multiple targets flying in formation at the same altitude and the same speed are close to the receiving position, the Doppler shift, time delay, and pitch angle of the scattering wave of different targets may be similar. According to the difference in azimuth, different members of the formation can be distinguished by scattering wave DOA estimation. When the RD domain virtual array data are constructed in the VAC2 method, due to the similar Doppler shift and time delay, the scattering waves of different targets are distributed on the range spectrum at the same Doppler shift on the RD map, and obtain approximately the same coherent integration gain and synchronization in virtual sampling sequence, so they can be considered as coherent received signals. The coherence between signals may cause rank loss of the covariance matrix and affect the accuracy of the spatial spectrum estimation algorithm. Therefore, the decoherence method is acquired to eliminate the influence of scattering wave signals’ coherence in the DOA estimation method.
3.4.1. Decoherence Method for Uniform Circular Array in Range-Doppler Domain
Since the UCA array manifold matrix does not have a Vandermonde structure similar to the ULA array manifold matrix, the mode excitation method is usually used to convert the UCA into a virtual uniform linear array structure for decoherence processing [28]. The research of UCA mode excitation in RD domain for DOA estimation of coherent signals is completed in the following.
The M-channels and -snapshots virtual array data constructed by the VAC2 method are regarded as a pseudo-time series, with length , of each channel’s sampling data received by the M-elements UCA. The m-th channel and -snapshots pseudo-time series in the virtual time of is given as follows:
where is the sampling interval of range spectrum on the RD map.
The array manifold matrix of UCA can be composed of the steering vectors of multipath signals, which is expressed as . When the UCA center point and the antennas are at the same height of , the i-th multipath signal’s steering vector can be expanded as:
The noise component in the pseudo-time series is represented as . Let , and the pseudo-time series received by the M-element UCA can be expressed as:
The form of Equation (40) is consistent with Equation (1), so the mode excitation of UCA in RD domain can refer to the time domain mode excitation of UCA. The virtual ULA elements obtained by the UCA manifold transform are symmetrically distributed with the serial number antenna as the center. When the number of UCA elements satisfies , the mode excitation method can be used to convert the UCA sampling sequence points of the M-channels into the virtual ULA sampling sequence points of the channels, which are defined as follows:
In the formula:
where , is the first kind Bessel function of order , is the carrier frequency of the signal, and is the velocity of light. The number of the virtual ULA elements should meet the maximum number of modes required for mode excitation as , where is the downward integer symbol. In the case that all sources are coplanar, the pitch angle of the incident signal is basically the same, so in Equation (46) as the array manifold vector of the virtual ULA is abbreviated as .
In the pseudo-time series received by the UCA in the RD domain, the expected target scattering wave signal and its coherent signal occupies the largest proportion in the range spectrum due to the coherent integration processing. The eigen-decomposition of the pseudo-time series sampling covariance matrix is calculated according to Equation (15), and the eigenvector corresponding to the maximum eigenvalue is a linear combination of the steering vectors of the scattering wave signal and its coherent multipath signals [19]. This characteristic is also valid on the virtual ULA obtained by the mode excitation of UCA, because the mode excitation does not change the composition of the received signal. of virtual ULA can be expressed as:
where is the steering vector matrix of coherent multipath signals and is the coefficient vector. Substituting Equation (46) into Equation (47), another expression form of is given as follows:
The eigenvector singular value decomposition (ESVD) is a decoherence method for signal processing of ULA, which constructs an dimensional matrix with the elements of as follows:
The dimension satisfies , , , and tends to the square matrix as much as possible. From Equation (46) and Equation (49), can be transformed into the following:
where , and denotes the first m rows of the steering vector matrix , so Equation (51) can be further simplified as follows:
Equation (52) shows that the rank of is the same as the number of multipath signals, and is no longer affected by the coherence of multipath signals. This conclusion indicates that the ESVD method has the ability to resolve coherence. The singular value decomposition of is , and the left singular value matrix is divided into signal subspace and noise subspace according to the distribution of singular value. Finally, the MUSIC spectrum estimation method is used to realize the DOA estimation of coherent signals. In this paper, this direction estimation method for coherent signals is called RD-ESVD-MUSIC.
3.4.2. The Proposed Improved Method
The RD-ESVD-MUSIC method does not make full use of the symmetric manifold characteristics of the virtual ULA array. Therefore, an improved ESVD-MUSIC method based on the symmetric relationship of the virtual ULA array is proposed, which is called mutual-ESVD-MUSIC in the RD domain, referred to as RD-MESVD-MUSIC. The specific steps of this method are as follows.
Firstly, the single-point correlation values of all channel elements and the central antenna channel element in the maximum eigenvector are calculated as follows:
Equation (47) is substituted into the above formula:
where , .
Then, according to the symmetry of the virtual ULA, a Toeplitz matrix is constructed in the following form:
A new array manifold vector is constructed, and is the steering vector matrix of the corresponding coherent signals, so can be transformed into a covariance matrix form:
satisfies the Vandermonde structure, and each column is linearly independent when the DOA of coherent signals is inconsistent. Therefore, the rank of is restored to the number of multipath signals to achieve decoherence.
Since is not necessarily a Hermitian matrix in the actual construction, it can be corrected by referring to the idea of spatial smoothing. is a switching matrix whose sub-diagonals are all one and other elements are zero. The reverse correction matrix is generated as follows:
From Equation (57), it can be seen that the reverse correction matrix does not change the steering vector information of the multipath signals. can be used to smooth the by . The corrected matrix is a Hermitian matrix, and its eigenvalues are real. Finally, the eigen-decomposition is given to obtain the signal space and the noise space, and the DOA estimation of coherent signals is realized by the MUSIC method.
Compared with the RD-ESVD-MUSIC method, each column of the covariance matrix constructed with the proposed method contains more information about the array elements, so it may have better resolution when estimating the azimuth of weak coherent signals. The subsequent simulation results will show that RD-MESVD-MUSIC can achieve higher estimation accuracy and robustness than RD-ESVD-MUSIC for weak coherent multipath signals.
4. Processing Results and Analysis
The 16-element UCA received time-domain sequence data are generated by Equation (1) at a sampling rate of 10 kHz. The reference signal containing direct wave signal and noise is obtained by beamforming processing of in the incident direction of the direct wave. The surveillance channel signal is obtained by suppressing the direct wave of .
The DOA spectrum estimation methods compared in this section include (1) Capon spectrum estimation, searching the beamforming direction with the largest SNR gain of MVDR beamformer to obtain the spatial spectrum; (2) the conventional MUSIC method, searching the maximum value of the spatial spectrum function constructed by time-domain array data; (3) the RD-MUSIC method, the methods involved in Section 3.2, including two RD domain virtual array construction methods of VAC1 and VAC2; (4) the RD-ESVD-MUSIC spectral estimation, the method involved in Section 4.1; (5) the RD-MESVD-MUSIC spectral estimation, the method involved in Section 4.2; and (6) CRB-OAS, which is the square root of CRB obtained from DOA estimation of the original array signal in time domain, and CRB-EAS, which is the square root of CRB obtained from DOA estimation of the RD domain enhanced array signal constructed by VAC2.
The number of Monte Carlo simulation experiments designed in this section is times. The root mean square error of DOA estimation results is and , respectively, where and represent the target scattering wave’s pitch angle and azimuth obtained by spatial spectrum estimation, and are the actual pitch angle and azimuth as a standard, the search range of pitch angle is , the search step is 0.1°, the search range of azimuth is , and the search step is 0.1°.
4.1. Simulation Results of Spatial Spectrum Estimation in Range-Doppler Domain
The total number of coherent integration points set in this subsection is 20,000, the RD domain virtual array data are constructed by the VAC1 and VAC2 methods, and the number of RD domain snapshots is set as 41. This subsection performs DOA estimation on the generated simulation data, compares the estimation results of different spectral estimation methods, and analyzes the performance of VAC1-RD-MUSIC and VAC2-RD-MUSIC methods in the case of low SNR.
The parameters of direct wave and three scattering waves are shown in Table 1. When the SNR of target 1 scattering wave in the surveillance channel signal is set to −50 dB:2 dB:10 dB, the Monte Carlo simulation experiment of the DOA estimation of target 1 scattering wave is completed, and the variation curves of the RMSEs of different DOA estimation methods with the increase of target 1 scattering wave’s SNR are counted and compared with the CRB. The results are shown in Figure 5.

Table 1.
The parameters of Simulation 1.
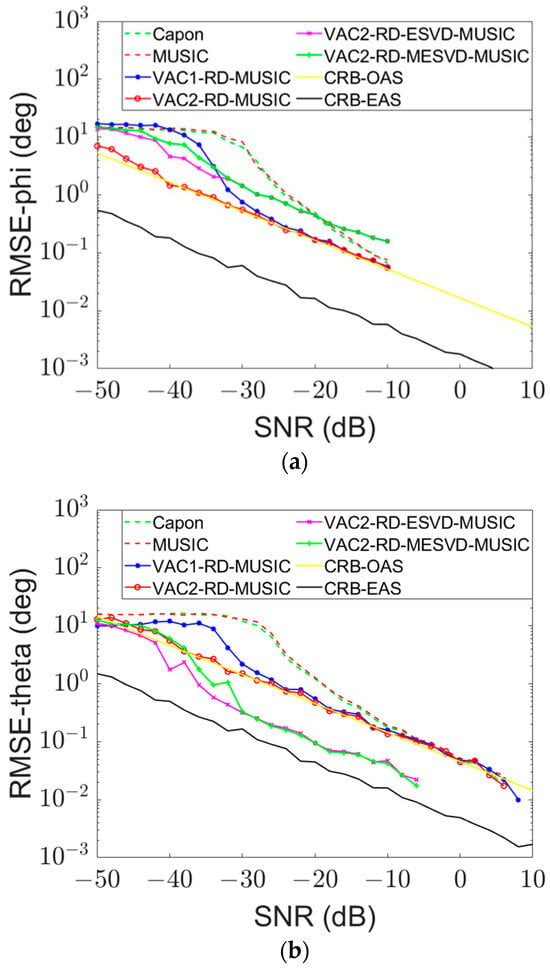
Figure 5.
(a) RMSE of target 1 scattering wave azimuth estimation. (b) RMSE of target 1 scattering wave pitch angle estimation.
For weak scattering wave signals, the DOA estimation accuracy of the two RD-MUSIC methods is significantly improved compared with the Capon method and MUSIC method, and the azimuth estimation RMSE of the two RD domain methods can approach or even exceed the CRB of the original array signal in the time domain at a low SNR. When the scattering SNR of target 1 is in the range of −50 dB to −10 dB, as is shown in Figure 5a, the average azimuth RMSE of VAC1-RD-MUSIC method is 1.48° lower than that of the conventional MUSIC method, and the average azimuth RMSE of VAC2-RD-MUSIC method is 5.76° lower than that of the conventional MUSIC method. It is shown in Figure 5b that the average pitch angle RMSE of VAC1-RD-MUSIC method is 4.26° lower than that of the conventional MUSIC method, and the average pitch angle RMSE of VAC2-RD-MUSIC method is 5.67° lower than that of the conventional MUSIC method. When the SNR of target 1 is greater than −10 dB, the two RD domain methods have the approximate performance of the conventional Capon method and MUSIC method, and the estimation error of both azimuth and pitch angle reaches the level of 0.1°. This accuracy is high enough for practical application scenarios. The reason why the curves corresponding to some methods in Figure 5 do not cover the whole SNR range is that when the SNR increases to a certain extent, the estimation error is much smaller than the search step size, and the RMSE statistical result is 0.
Therefore, the VAC2-RD-MUSIC method has the best DOA performance for narrow-band weak signals, especially when the scattering wave SNR is lower than −10 dB.
When the SNR of the scattering wave of target 1 is set as −30 dB, the azimuth search range is set to [1°, 360°], the pitch angle search range is [1°, 90°], and the search step is 1°. The parameters of direct wave and three scattering waves are shown in Table 2. The spatial spectrum results of DOA estimation of multiple weak scattering waves are shown in Figure 6.

Table 2.
The parameters of Simulation 2.
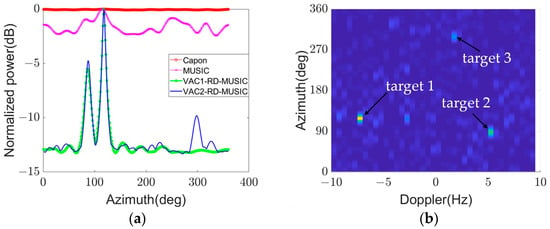
Figure 6.
(a) Multi-target DOA estimation azimuth spatial spectrum with different spectral estimation methods. (b) Doppler-Azimuth spatial spectrum of VAC2 method.
Figure 6a shows a power normalized one-dimensional azimuthal spatial spectrum drawn by projecting the Doppler-Azimuth spatial spectrum onto the azimuthal dimension. The azimuthal spatial spectrum shows that the Capon method and the conventional MUSIC method can only observe a small spectral peak near the incident azimuth of target 1, respectively, and the two RD domain MUSIC methods have the ability to simultaneously detect multiple peaks of multiple low SNR signals. In addition, the VAC1-RD-MUSIC method can obtain the direction information of target 1 and target 2 scattering waves, and cannot complete the DOA estimation of target 3 scattering wave at −40 dB SNR; the VAC2-RD-MUSIC method can accurately estimate the direction of the three scattering waves. The Doppler-Azimuth spatial spectrum results of VAC2-RD-MUSIC is shown in Figure 6b, from which the spectral peaks corresponding to the three target scattering waves can be observed, and the spectral peak positions correspond to (−7.5 Hz, 118°), (5 Hz, 88°), and (1.5 Hz, 299°), respectively. The Doppler shifts of the three scattering wave spectral peaks are consistent with the set value, and the error of the azimuth estimation result is within 3°. Figure 6 shows that the RD domain spatial spectrum estimation method has the ability to simultaneously estimate the DOA of multiple low SNR target scattering waves.
4.2. Simulation Results of DOA Estimation for Coherent Weak Signals in RD Domain
The total number of coherent integration points set in this subsection is 20,000, the RD domain virtual array data are constructed by the VAC2 method, and the number of snapshots is set as 41. The scattering waves of target 1 and target 2 are coherent signals, and the scattering wave of target 3 is an incoherent signal. This subsection mainly verifies the azimuth estimation performance of different DOA estimation methods for coherent signals.
4.2.1. Comparison of Decoherence Methods and Non-Decoherence Methods
The parameters of direct wave and two coherent scattering waves are shown in Table 3. When the surveillance channel signal only contains the coherent signal components of target 1 and target 2 scattering waves, and the SNR of target 1 scattering wave is set to −50 dB:2 dB:10 dB, the Monte Carlo simulation experiment of target 1 scattering wave DOA estimation is completed, and the variation curves of the RMSE of different DOA estimation methods with the increase of target 1 scattering waves’ SNR are statistically analyzed.

Table 3.
The parameters of Simulation 3.
As shown in Figure 7, the non-decoherence method cannot accurately estimate the azimuth of target 1 scattering wave, when the SNR of target 1 scattering wave is lower than that of target 2 scattering wave. The azimuth RMSE of the two decoherence algorithms is significantly lower than that of other methods, indicating that RD-ESVD-MUSIC and RD-MESVD-MUSIC can suppress the shadowing of strong coherent scattering waves to weak scattering waves in the RD domain, so as to realize the correct DOA estimation of target scattering waves with low SNR. When the SNR of target 1 scattering wave is in the range of −50 dB to −10 dB, Figure 7 shows that the azimuth RMSE of the RD-ESVD-MUSIC method is 1.66° lower than that of the MUSIC method, and the azimuth RMSE of RD-MESVD-MUSIC method is 3.55° lower than that of the MUSIC method.
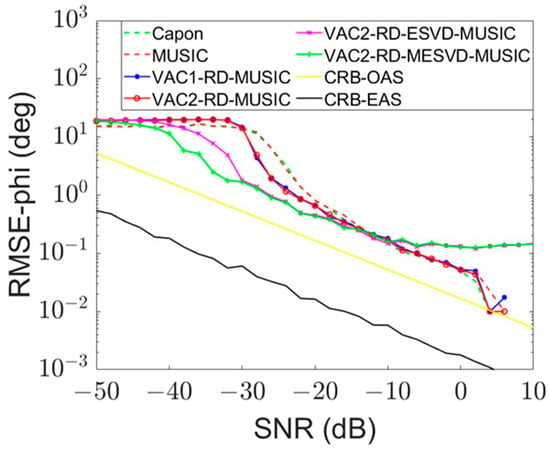
Figure 7.
RMSE of target 1 scattering wave azimuth estimation when the SNR of coherent interference is −30 dB.
When the SNR of target 1 is greater than −10 dB, the two RD domain decoherence algorithms have an obvious performance loss compared to the conventional Capon method and MUSIC method. When the SNR of target 1 exceeds −10 dB, the influence of the scattering wave of target 2 as coherent interference on the DOA estimation of the scattering wave of target 1 can be ignored due to the relatively low SNR of target 2, so the conventional Capon method and MUSIC method, as well as the VAC1-RD-MUSIC method and VAC2- RD-MUSIC method, can work normally. However, the two decoherence methods will lose a certain degree of spatial freedom due to mode excitation and covariance matrix reconstruction, resulting in a decrease in DOA estimation accuracy. At this time, the azimuth RMSE of the RD-ESVD-MUSIC method is 0.09° higher than the conventional MUSIC method, and the azimuth RMSE of RD-MESVD-MUSIC is 0.09° higher than the conventional MUSIC method. The azimuth estimation error of all the methods is below 0.2°, which is enough to meet the requirements of the actual scene; that is, to say the performance losses of RD- RD-ESVD-MUSIC and MESVD-MUSIC do not affect the reliability of their practical application.
In the actual scene, the power of the coherent interference signal often changes synchronously with the signal to be measured, so the simulation parameters of a direct wave and two coherent scattering waves are set as shown in Table 4. When the SNR of target 1 scattering wave is set to −50 dB:2 dB:10 dB, and the SNR of target 2 scattering wave is synchronously set to −50 dB:2 dB:10 dB, the Monte Carlo simulation experiment of target 1 scattering wave DOA estimation is completed. The result is shown in Figure 8.

Table 4.
The parameters of Simulation 4.
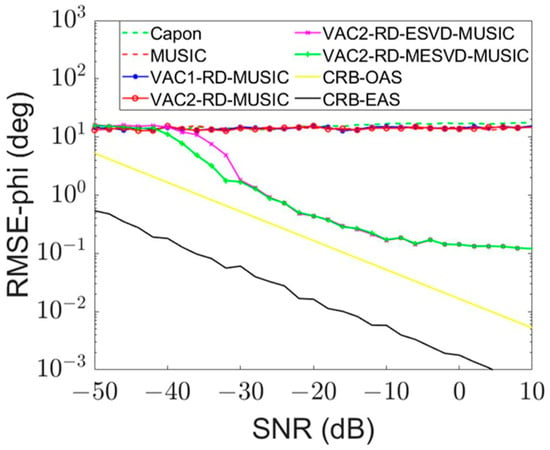
Figure 8.
RMSE of target 1 scattering wave azimuth estimation when the SNR of coherent interference is equal to the SNR of target 1.
As the simulation result shown in Figure 8, when the coherent interference’s SNR is equivalent to the SNR of the signal to be measured, the interference always has a significant impact on the DOA estimation performance. At this time, the conventional Capon method and MUSIC method, as well as the VAC1-RD-MUSIC method and VAC2-RD-MUSIC method, are basically ineffective, and the two RD domain decoherence methods can effectively estimate the DOA of target 1. When the SNR of target 1 scattering wave is in the range of −50 dB to −10 dB, Figure 8 shows that the azimuth RMSE of RD-ESVD-MUSIC method is 7.88° lower than that of the MUSIC method, and the azimuth RMSE of the RD-MESVD-MUSIC method is 9.12° lower than that of the MUSIC method.
According to the results of Figure 7 and Figure 8, RD-ESVD-MUSIC and RD-MESVD-MUSIC have better DOA estimation performance for coherent weak signals than the non-decoherence methods when there is a strong coherent interference, and they can also achieve acceptable DOA estimation accuracy when the signal’s SNR is significantly higher than the coherent interference’s SNR. Furthermore, the RD-MESVD-MUSIC method has a higher estimation accuracy than the RD-ESVD-MUSIC method.
4.2.2. Comparison of Two RD Domain Decoherence Algorithms
The parameters of direct wave and two coherent scattering waves are shown in Table 5. The surveillance channel signal only contains the coherent signal components of target 1 and target 2, and the SNR of target 1 scattering wave is −30 dB. The RD domain MUSIC results corresponding to the Doppler shift of target 1 and target 2 are shown in Figure 9. The spatial spectrum of VAC2-RD-MUSIC is shown in Figure 9a; there is a large interference spectrum peak at the azimuth of 108° and the pitch angle of 22°, which is caused by the interference between the two scattering waves. Figure 9b,c indicate the results of RD-ESVD-MUSIC and RD-MESDVD-MUSIC, respectively. Both methods can accurately estimate the DOA of coherent signals, and the spectral peak shape obtained by RD-MESDVD-MUSIC is sharper than that of RD-ESVD-MUSIC.

Table 5.
The parameters of Simulation 5.

Figure 9.
A pair of coherent scattering wave signals are contained. (a) RD-MUSIC spatial spectrum. (b) RD-ESVD-MUSIC spatial spectrum. (c) RD-MESVD-MUSIC spatial spectrum.
The parameters of direct wave and two coherent scattering waves are shown in Table 6. The surveillance channel signal contains the three target scattering wave components, and target 3 scattering wave is a strong incoherent signal relative to target 1 and target 2 scattering waves, so that there are obvious power residues of target 3 in the range spectrum at the Doppler shift of target 1 and target 2, which will affect the scattering wave DOA estimation of target 1 and target 2. The estimation results of different RD domain MUSIC methods corresponding to the Doppler shift of −7.5 Hz which correspond to target 1 and target 2 are shown in Figure 10. Both Figure 10a,b show an obvious spectral peak in the direction of target 3 wave, and the spectral peak positions of target 1 and target 2 can no longer be observed in the RD-ESVD-MUSIC spatial spectrum. It can be observed in Figure 10c that two spectral peaks are located at (86°, 70°) and (119°, 69°), corresponding to the scattering waves of target 1 and target 2, respectively. It is shown in Figure 10 that RD-MESD-MUSIC has stronger DOA estimation robustness than RD-ESVD-MUSIC in the case of an existing strong non-coherent interference.

Table 6.
The parameters of Simulation 6.

Figure 10.
A pair of coherent scattering wave signals and an incoherent scattering wave signal are contained. (a) RD-MUSIC spatial spectrum. (b) RD-ESVD-MUSIC spatial spectrum. (c) RD-MESVD-MUSIC spatial spectrum.
4.3. Actual Data Processing Result
The DOA estimation results of some actual antenna array acquisition data are presented in this subsection, which verify the ability of the RD-MUSIC method to estimate the weak scattering wave signals’ DOA by comparison with the direction information of the scattering wave relative to the receiving position calculated by the position information of the civil aviation aircraft provided by ADS-B. In the actual data acquisition processing, the received array is a 40-element UCA with a radius of 50 m, and the array signal sampling rate is 10 kHz after down-conversion to zero intermediate frequency. Due to hardware limitations, only 16 continuous channels of data can be processed at present, so the array manifold is a 16-element uniform circular arc linear array. The processing results show that the manifold can also use the RD domain spatial spectrum estimation method to estimate the DOA of weak scattering waves.
The time-domain power spectrum of the array received signal is shown in Figure 11a. The reference channel signal and the surveillance channel signal are obtained by the beamforming method and the interference cancellation algorithm, respectively. The two-dimensional ambiguity function is calculated every 2 s to obtain an RD map. According to the time order, the Doppler spectrum is extracted from each RD map and stacked to form a time-Doppler map, as shown in Figure 11b. A time-Doppler curve of a target can be observed in the time-Doppler map, and the Doppler value of each point in the detection curve is considered as the target scattering wave signal’s Doppler shift at each time.
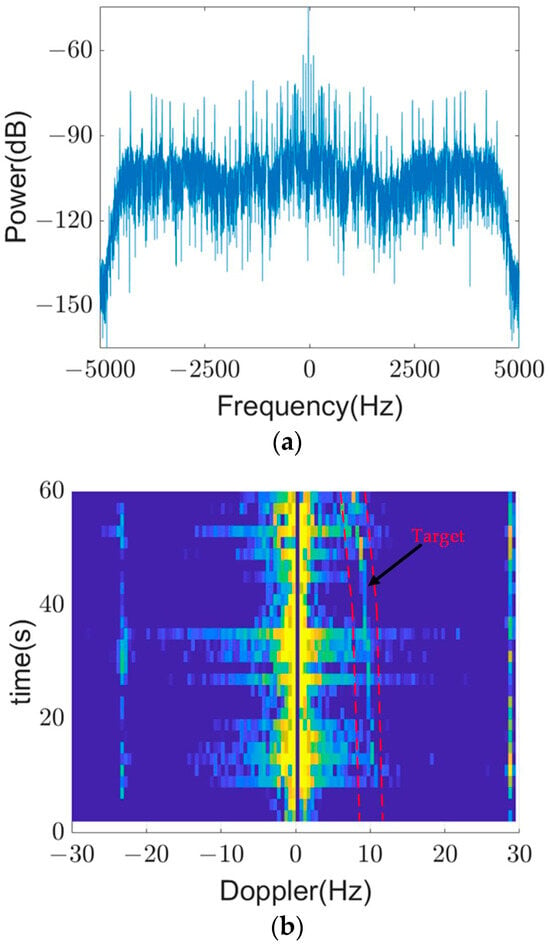
Figure 11.
(a) Power spectrum. (b) Time-Doppler diagram.
The VAC2 method is used to construct multi-snapshots virtual array data for RD-MUSIC spectrum estimation. It is shown in Figure 12 that the RD-MUSIC estimation direction information of a one-minute continuous weak scattering wave signal compares with the expected DOA calculated by synchronously received ADS-B. Figure 12a is the azimuth estimation result, and Figure 12b is the pitch angle estimation result, which match the direction information of the civil aviation aircraft provided by ADS-B, indicating that the RD-MUSIC method can estimate DOA of the weak scattering wave signal in the actual data. The azimuth estimation result is more stable than the pitch angle, which is consistent with the array manifold characteristics.
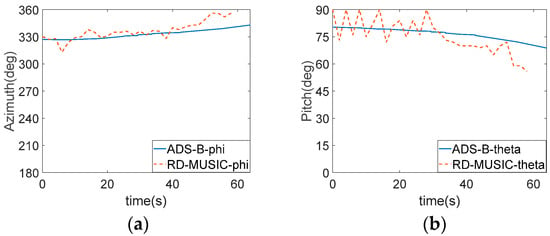
Figure 12.
(a) Azimuth results of RD-MUSIC of actual data. (b) Pitch angle results of RD-MUSIC of actual data.
5. Conclusions
The RD domain spatial spectrum estimation method proposed in this paper can effectively detect the direction information of weak target scattering waves. The virtual array data generated based on the range spectrum on an RD map is regarded as a pseudo-time series of multiple snapshots, providing sufficient SNR gain for scattering wave signal and improving the accuracy of DOA estimation. In addition, a RD-MESVD-MUSIC method is proposed to solve the problem of obtaining DOA of coherent scattering waves with low SNR. The results of the simulation experiments and actual data processing verify that the RD domain spatial spectrum estimation method has good DOA estimation ability for weak target scattering waves.
Author Contributions
Conceptualization, H.X. and H.M.; methodology, H.X.; software, H.X. and L.W.; validation, H.X., H.M., L.W., J.J. and H.Z.; formal analysis, H.X.; investigation, H.X.; resources, H.M. and H.Z.; data curation, H.X., H.M. and J.J.; writing—original draft preparation, H.X.; writing—review and editing, H.M., X.L. and L.W.; visualization, H.X.; supervision, H.M.; project administration, H.M.; funding acquisition, H.M. and X.L. All authors have read and agreed to the published version of the manuscript.
Funding
This research was funded by the National Natural Science Foundation of China, grant number 62071188, and the Hubei Radio Monitoring Center project, grant number ZAHX-ZC-202302.
Data Availability Statement
The original contributions presented in the study are included in the article, further inquiries can be directed to the corresponding author.
Conflicts of Interest
The authors declare no conflicts of interest.
References
- Sahr, J.D.; Lin, F.D. The Manastash Ridge Radar: A pssive bistatic radar for upper atmosphere radio science. Radio Sci. 1997, 32, 2345–2358. [Google Scholar] [CrossRef]
- Qin, Y.; Ma, H.; Cheng, L. Cardinality balanced multitarget multi- Bernoulli filter for multipath multitarget tracking in over-the-horizon radar. IET Radar Sonar Navig. 2016, 10, 535–545. [Google Scholar] [CrossRef]
- Liu, Y.; Zhang, X.; Yang, Q. DOA Estimation of Multiple Coherent Targets Using Weight Vector Orthogonal Decomposition in TDM-MIMO HF-Radar. Remote Sens. 2023, 15, 4073. [Google Scholar] [CrossRef]
- Yu, D.; Ma, H.; Cheng, L. Method and field experiment of target tracking via multi-static Doppler shifts in high-frequency passive radar. IET Radar Sonar Navig. 2016, 10, 1201–1212. [Google Scholar] [CrossRef]
- Fabrizio, G.A.; Gershman, A.B.; Turley, M.D. Robust adaptive beamforming for HF surface wave over-the-horizon radar. IEEE Trans. Aerosp. Electron. Syst. 2004, 40, 510–525. [Google Scholar] [CrossRef]
- Vallet, P.; Mestre, X.; Loubaton, P. Performance analysis of an improved MUSIC DoA estimator. IEEE Trans. Signal Process. 2015, 63, 6407–6422. [Google Scholar] [CrossRef]
- Lei, W.; Chen, B. High-resolution DOA estimation for closely spaced correlated signals using unitary sparse Bayesian learning. Electron. Lett. 2015, 51, 285–287. [Google Scholar] [CrossRef]
- Huang, Y.; Zhou, M.; Vorobyov, S.A. New Designs on MVDR Robust Adaptive Beamforming Based on Optimal Steering Vector Estimation. IEEE Trans. Signal Process. 2019, 67, 3624–3638. [Google Scholar] [CrossRef]
- Cheng, L.; Li, Y.; Zou, L.; Qin, Y. DOA Estimation for Highly Correlated and Coherent Multipath Signals with Ultralow SNRs. Int. J. Antennas Propag. 2019, 2019, 2837315. [Google Scholar] [CrossRef]
- Schmidt, R.; Schmidt, R.O. Multiple emitter location and signal parameter estimation. IEEE Trans. Antennas Propag. 1986, 34, 276–280. [Google Scholar] [CrossRef]
- Gershman, A.B.; Ruebsamen, M.; Pesavento, M. One- and two-dimensional direction-of-arrival estimation: An overview of search-free techniques. Signal Process. 2010, 90, 1338–1349. [Google Scholar] [CrossRef]
- Choi, Y.H. Maximum likelihood estimation for angles of arrival of coherent signals using a coherency profile. IEEE Trans. Signal Process. 2000, 48, 2679–2682. [Google Scholar] [CrossRef]
- Saini, R.; Cherniakov, M.; Lenive, V. Direct path interference suppression in bistatic system: DTV based radar. In Proceedings of the 2003 International Conference on Radar (IEEE Cat. 03EX695), Adelaide, SA, Australia, 30 March 2004; pp. 309–314. [Google Scholar]
- Thomas, J.K.; Scharf, L.L.; Tufts, D.W. The probability of a subspace swap in the SVD. IEEE Trans. Signal Process. 1995, 43, 730–736. [Google Scholar] [CrossRef]
- Rao, B.D.; Hari, K.V.S. Performance analysis of Root-Music. IEEE Trans. Acoust. Speech Signal Process. 1989, 37, 1939–1949. [Google Scholar] [CrossRef]
- Belloni, F.; Richter, A.; Koivunen, V. DoA Estimation Via Manifold Separation for Arbitrary Array Structures. IEEE Trans. Signal Process. 2007, 55, 4800–4810. [Google Scholar] [CrossRef]
- McCloud, M.L.; Scharf, L.L. A new subspace identification algorithm for high-resolution DOA estimation. IEEE Trans. Antennas Propag. 2002, 50, 1382–1390. [Google Scholar] [CrossRef]
- Zhang, Y.; Ng, B.P. MUSIC-like DOA estimation without estimating the number of sources. IEEE Trans. Signal Process. 2010, 58, 1668–1676. [Google Scholar] [CrossRef]
- Shan, T.J.; Kailath, T. Adaptive beamforming for coherent signals and interference. Acoust. Speech Signal Process. IEEE Trans. 1985, 33, 527–536. [Google Scholar] [CrossRef]
- Elmaraazey, M. An adaptive spatial smoothing technique for beamforming in the presence of correlated arrivals. In Proceedings of the 1993 IEEE International Symposium on Circuits and Systems (ISCAS), Chicago, IL, USA, 3–6 May 1993; pp. 208–211. [Google Scholar]
- Cadzow, J.A.; Kim, Y.S.; Shiue, D.C. General direction-of-arrival estimation: A signal subspace approach. IEEE Trans. Aerosp. Electron. Syst. 1989, 25, 31–47. [Google Scholar] [CrossRef]
- Choi, Y.H. ESPRIT-Based Coherent Source Localization with Forward and Backward Vectors. IEEE Trans. Signal Process. 2010, 58, 6416–6420. [Google Scholar] [CrossRef]
- Fabrizio, G.; Colone, F.; Lombardo, P.; Farina, A. Passive radar in the high frequency band. In Proceedings of the 2008 IEEE Radar Conference, Rome, Italy, 26–30 May 2008; pp. 1–6. [Google Scholar]
- Fabrizio, P.L.G.; Colone, F.; Farina, A. Adaptive beamforming for high-frequency over-the-horizon passive radar. IET Radar Sonar Navig. 2009, 3, 384–405. [Google Scholar] [CrossRef]
- Li, Y.; Ma, H.; Wu, Y.; Cheng, L.; Yu, D. Method for bearing estimation of target for amplitude modulation radio-based passive radar application. Electron. Lett. 2018, 54, 383–385. [Google Scholar] [CrossRef]
- Stoica, P.; Arye, N. MUSIC, maximum likelihood, and Cramer-Rao bound. IEEE Trans. Acoust. Speech Signal Process 1989, 38, 720–741. [Google Scholar] [CrossRef]
- Wang, L.; Fang, D.; Zhang, M.; Lin, J.; Gu, L.; Zhong, T.; Yang, X.; Xie, D.; Luo, Z.; Xiao, B.; et al. Handbook of Mathematics, 1st ed.; Higher Education Press: Beijing, China, 2006; p. 21. [Google Scholar]
- Wax, M.; Sheinvald, J. Direction Finding of Coherent Signals via Spatial Smoothing for Uniform Circular Arrays. IEEE Trans. Antennas Propag. 1994, 42, 613–620. [Google Scholar] [CrossRef]
Disclaimer/Publisher’s Note: The statements, opinions and data contained in all publications are solely those of the individual author(s) and contributor(s) and not of MDPI and/or the editor(s). MDPI and/or the editor(s) disclaim responsibility for any injury to people or property resulting from any ideas, methods, instructions or products referred to in the content. |
© 2024 by the authors. Licensee MDPI, Basel, Switzerland. This article is an open access article distributed under the terms and conditions of the Creative Commons Attribution (CC BY) license (https://creativecommons.org/licenses/by/4.0/).