Article

Research on Calculation Method of On-Orbit Instrumental Line Shape Function for the Greenhouse Gases Monitoring Instrument on the GaoFen-5B Satellite

1
School of Environmental Science and Optoelectronic Technology, University of Science and Technology of China, Hefei 230026, China
2
Anhui Institute of Optics and Fine Mechanics, Hefei Institutes of Physical Science, Chinese Academy of Sciences, Hefei 230031, China
3
Key Laboratory of Optical Calibration and Characterization, Chinese Academy of Sciences, Hefei 230031, China
4
China Siwei Surveying and Mapping Technology Co., Ltd., Beijing 100086, China
*
Author to whom correspondence should be addressed.
Remote Sens. 2024, 16(12), 2171; https://doi.org/10.3390/rs16122171
Submission received: 6 May 2024 / Revised: 8 June 2024 / Accepted: 12 June 2024 / Published: 15 June 2024
(This article belongs to the Special Issue Remote Sensing Satellites Calibration and Validation)

Abstract

:
The Greenhouse Gases Monitoring Instrument is based on the spectroscopic principle of spatial heterodyne spectroscopy technology and has the characteristics of no moving parts, a hyperspectral resolution, and a large luminous flux. The instrumental line shape function is one of the most important parameters characterizing the features of the instrument, and it plays a vital role in the system error analysis of the instrument’s measurements. To accurately obtain the instrumental line shape function of a spatial heterodyne spectrometer during the on-orbit period and improve the accuracy of gas concentration retrieval, this study develops a method to model and characterize the characteristics of the instrumental line shape function, including modulation loss and phase error. This study employs the solar calibration spectrum in the 1.568–1.583 μm bands to conduct iterative calculations of the instrumental line shape function error model. After the instrumental line function is updated, the average relative deviation is reduced from 1.83% to 0.756% between the theoretical and measured solar spectra. Additionally, the average relative deviation is reduced from 7.049% to 2.106% between the GMI nadir and theoretical nadir spectra. The findings demonstrate that updating the instrumental line shape function mitigates the impact of variations in the spectrometer’s instrumental line shape due to alterations in the orbital environment. This study offers a dependable reference for both the enhancement and oversight of a spectrometer’s instrumental line shape function, along with an investigation of shifts in instrument parameters.

1. Introduction

GaoFen-5B (GF-5B) was successfully launched from the Taiyuan Satellite Launch Center on 7 September 2021. It is a fusion application satellite that obtains multiple types of observation data, including hyperspectral, full-spectrum, polarization, multi-angular, and ocean sun glint observation data. It carries out simultaneous hyperspectral observations of the atmosphere and land [1]. GF-5B covers a wide observation spectrum, ranging from ultraviolet to long-wavelength infrared (0.24–13.3 μm). This allows for highly accurate measurements using various detection methods. Consequently, GF-5B achieves comprehensive environmental monitoring of the atmosphere, water resources, and natural ecosystems. The GF-5B satellite carries a powerful suite of seven payloads, including two for Earth imaging and five dedicated to atmospheric measurement. One of the key instruments is the Greenhouse Gases Monitoring Instrument (GMI), developed by the Anhui Institute of Optics and Fine Mechanics of the Chinese Academy of Sciences. This payload leverages spatial heterodyne spectroscopy (SHS) technology, which combines the benefits of grating dispersion and interferogram modulation. This allows the GMI to achieve exceptional performance with a high signal-to-noise ratio (SNR) and hyperspectral resolution, with the added advantage of no moving parts, thus enhancing its reliability.
Since the 1980s, with the rapid development of science and industrial and agricultural technology, the emissions of gases, such as carbon dioxide, methane, nitrous oxide, and halogenated compounds, from industrial and agricultural production and human activities have been increasing. This has led to a continuous increase in the concentration of greenhouse gases (GHGs), causing the global average surface temperature to rise [2]. Among these gases, CO2 is the most important greenhouse gas in the atmosphere, accounting for about 64% of long-lived greenhouse gases (LLGHGs). Since CO2 is a trace gas in the atmosphere, its volume fraction is about 3.8 × 10⁻⁴, and the range of its concentration variation is small. The seasonal fluctuation caused by land area and vegetation volume decreases from (12~22) × 10−6 in the northern hemisphere to (1~2) × 10−6 in the southern hemisphere [3]. Research by P. J. Rayner and D. M. O’Brien indicates that, for space-based detection, the detection accuracy needs to reach 1% to be effectively used for CO2 source and sink analyses [4]. To meet the requirements for the high-precision global detection of greenhouse gas concentrations, the GMI payload adopts a solution that is distinct from traditional hyperspectral imaging technologies. It is based on SHS, utilizing a static grating instead of the moving mirror in traditional Fourier transform spectrometers, which has the advantages of a small volume and weight, no moving parts, and a hyperspectral resolution, enabling the acquisition of fine absorption spectra with an extremely high spectral resolution [5,6]. SHS technology differs from the Fourier interferometer scheme employed by Japan’s Greenhouse Gases Observing Satellite (GOSAT) [7] and the grating spectrometer scheme used by the United States’ Orbiting Carbon Observatory-2 (OCO-2) [8]. For the atmospheric detection spectroscopy payload, both radiometric accuracy and spectral precision are critical factors influencing atmospheric retrieval processes [9].
During the launch and on-orbit periods, the optical, structural, and electronic components of the spectrometer may undergo performance changes, resulting in laboratory calibration results that cannot be directly applied to the on-orbit spectrum. Thus, it is necessary to correct such changes during the on-orbit period, requiring on-orbit calibration, including both spectral and radiometric calibration. Spectral calibration includes determining the relationship between the spatial frequency of interference fringes and the incident wavelength, as well as the instrumental line shape function (ILSF). Spectral calibration is the primary task carried out to ensure the genuine and effective acquisition of target spectral information. Before the launch, the GMI payload completed high-precision laboratory spectral calibration using a tunable laser combined with a speckle integrating sphere system. The uncertainty of spectral calibration reached 0.015 cm−1 [10], and the ILSF was determined through instrument measurements of monochromatic light data [11]. However, during satellite launch, factors such as instrument vibrations, changes in on-orbit thermal conditions, outer space gravity and radiation, instrument aging, and differences between on-orbit and laboratory experimental environmental conditions can lead to subtle variations in wavelength and the spectrometer’s ILSF during the on-orbit period. Therefore, it is essential to monitor and update the wavelength and ILSF changes of the spectrometer during the on-orbit period [12]. During the on-orbit period of the satellite, on-orbit wavelength calibration was performed using the measured high-resolution solar Fraunhofer as the characteristic spectral lines. After calibration, the spectral line deviation reduced from 0.133 cm−1 to 0.009 cm−1 [13]. To further improve the accuracy of on-orbit spectral calibration, accurately obtain the fine absorption spectral information of greenhouse gases, and ensure the precision of atmospheric greenhouse gas retrieval, studying the ILSF of the spectrometer during the on-orbit period is of great significance, especially for quantitative analyses of hyperspectral remote sensing data.
For the retrieval of high-precision greenhouse gases in the atmosphere, there are three main factors that constitute the primary constraints: atmospheric radiative transfer calculation, instrument models, and retrieval algorithms. The most important parameter in the instrument model is the ILSF, which determines the final spectral form of the radiation entering the instrument. It represents the instrumental spectral resolution and the distribution of energy across spectral lines. Therefore, it is important to accurately obtain the ILSF of the spectrometer to precisely simulate the theoretical spectrum and quantitative retrieval [9,14]. When a Fourier transform spectrometer performs spectroscopy through spatial modulation, it is assumed that the theoretical ILSF for each spectral band is identical. In ground-based laboratories, methods such as gas absorption [15,16] and adjustable lasers [11,17] are often utilized to determine the ILSF. This involves measuring the ILSF by selecting prominent gas absorption lines or laser wavelengths within the working spectral range. For on-orbit ILSF determination, laser diodes are commonly chosen as light sources [18,19,20], sharing the same principles as tunable lasers. Another option is to use the solar spectrum, although adjustments to parameters such as the distance from the Sun to the Earth and solar activity cycles are necessary [21].
The GMI payload employs a static interferogram technology system and lacks experimental equipment for directly measuring the ILSF using monochromatic light or gas absorption cells. Therefore, it is impossible to directly measure the ILSF in a way similar to that used in ground-based laboratory environments. Currently, there is limited research both domestically and internationally on updating the ILSF of space-borne spectrometers during the on-orbit period. This study, based on the principles of SHS technology and the processing of interferograms, derives theoretical mathematical expressions for the ILSF. Utilizing the GMI payload as the carrier and combining the laboratory measurement results of the ILSF and the analysis of instrument parameters, this study utilizes the on-orbit solar observation calibration spectrum of the GMI payload, which is not affected by the atmosphere and features an independent solar Fraunhofer line. The model establishes the ILSF concerning modulation loss and phase error, using the stable Kurucz solar spectrum as the theoretical reference spectrum. A model function for the ILSF concerning modulation loss and phase error is established. Through residual iterative optimization with the solar calibration spectrum measured by the GMI payload, the parameters of the ILSF model are ultimately obtained. This achieves the update of the GMI measurement of the on-orbit ILSF, with an ILSF on-orbit monitoring error of less than 1%. This study provides a reference for subsequent on-orbit calibration, monitoring of the ILSF, and analyses of instrumental parameter changes for spectrometers.

2. GMI Payload Overview and Ground-Based ILSF Testing

2.1. Overview of the GMI Payload

The GMI adopts the principle of SHS technology, as illustrated in Figure 1. It consists of a collimating front lens (L1), a spatial heterodyne interferometer unit (beam splitter and two-arm grating), imaging lenses (L2 and L3), and a detector.
According to the interference principle of SHS technology, the spectrum of the measured target, obtained through this technology, appears as an interferogram. After passing through collimating system L1, the incident light spectrum B σ is directed parallel to the beam splitter and divided into two beams of light, which are directed towards the gratings in each arm. After diffraction by the grating, the two beams of light form a tilt angle ± θ with the optical axis. Then, the two diffractive beams return to the beam splitter again and are finally projected onto the detector through the detector optical system L2/L3. Among them, the wavefront of the two coherent beams produces an inclination angle of 2 θ , so there are different optical path differences at different sampling positions in the spectral dimension direction (the direction of arrow X in Figure 1), forming interference fringes. There is a Fourier transform (FT) relationship between the intensity information of the interference fringes obtained by SHS and the incident spectral information, as shown in Equation (1) [22]:
I x = 0 B σ 1 + cos 2 π f σ x d σ
Here, x represents the optical path differences (OPD) of the sampling point; f σ = 4 σ σ 0 tan θ represents the spatial frequency of the interference fringes generated when a light beam with wavenumber sigma enters the spatial heterodyne spectrometer; σ 0 and θ are the Littrow wavenumber and angle; and B σ d σ is the intensity at wavenumber σ .
The GMI payload is equipped with four spectral channels, namely, O2 (0.765 μm), CO2-1 (1.575 μm), CO2-2 (2.05 μm), and CH4 (1.65 μm). The 0.765 μm band is utilized to mainly provide information on surface pressure, clouds, and aerosols. The 1.575 μm and 1.65 μm bands are used to estimate the atmospheric concentrations of CO2 and CH4, respectively. The 2.05 μm band mainly provides information on aerosols and CO2. The main technical specifications of the GMI payload are shown in Table 1.

2.2. The ILSF Model and Laboratory Testing

2.2.1. Ideal Measurement Model

The ILSF characterizes the spectral response of a spectrometer to a monochromatic light source at a given wavelength, serving as a crucial parameter for the high-precision spectral calibration of spectrometers [23]. The input signal is typically set as an impulse function δ σ σ 0 , where the frequency domain of the impulse function is a constant, i.e., F δ σ σ 0 = 1 . For incident light with the Littrow wavenumber, the relationship between the OPD u of the two beams upon re-encountering after dispersion and the distance from the grating dispersion direction to optical axis x can be expressed as follows:
u = 4 x tan θ
The input spectra in the SHS system can be symmetrized by defining the following:
B e σ = 1 2 B σ + B σ
Here, σ = σ σ 0 . This is a generation of the relationship B e σ = B σ + B σ / 2 , which is often applied in the analysis of FTS systems and accounts for the symmetry in the recovered transform. After making these changes, Equation (1) can be rewritten as follows:
I u = B σ 1 + cos 2 π u σ d σ
By setting B σ = δ σ 1 σ in Equation (3), the response of the basic SHS systems given by Equation (4) is as follows:
I u = cos 2 π u σ 1
Here, σ 1 = σ 1 σ 0 , and the constant term is removed. Since I u is measured only over a finite range of u u < L = u max , in the simplest case, the transform of Equation (5) can be written as follows:
B I σ = 2 L sin c 2 π L σ 1 + σ + sin c 2 π L σ σ 1
As indicated by Equation (6), under ideal conditions, spectrum B I σ reconstructed from monochromatic light interference data is a sin c function, oscillating with its peaks centered around zero and gradually decaying towards zero. This is commonly referred to as the instrumental line shape function. The full width at half maximum (FWHM) of the ILSF reflects the broadening influence of the instrument on the spectrum, and its size can determine the spectral resolution of the instrument. Under ideal conditions, the ILSF of the instrument is only affected by modulation loss [24]. Figure 2 presents typical theoretical results for the ILSF.

2.2.2. The Laboratory ILSF Experiment

When measuring the ILSF, it is essential that the wavelength uncertainty of the light source is minimal, ensuring good stability. Additionally, there should be multiple lines uniformly distributed within the spectral range of the instrument, and the spectral resolution of these lines should be significantly smaller than the spectral resolution of the instrument. The line intensity should also meet the SNR requirements of the instrument. The GMI payload belongs to super-resolution spectral spectrophotometry technology. The spectral calibration scheme selected involves a SANTEC TSL-510C tunable laser from SANTEC Corporation combined with a speckle integrating sphere system [10]. This instrument can output continuous tunable monochromatic light (1 pm intervals) within the spectral range of the instrument, with a linewidth smaller than 1 pm. The wavelength absolute accuracy is better than 5 pm, and the output power meets the requirements of the spatial heterodyne spectrometer. The light output from the laser is introduced into an integrating sphere to provide a uniform surface light source that fills the FOV of the instrument. The laser spot on the inner wall of the integrating sphere directly illuminates a small area, and the method of using a rotating diffuse reflection plate is employed to eliminate the speckle caused by the spatial coherence of the laser [25,26]. The interferogram is restored to the spectrum after preprocessing and phase correction. To ensure the accurate peak positioning of the spectral data, the original 500 valid data points are zero-filled to 214. After zero-filling, the spectral resolution remains unchanged, and the spectral curve becomes smoother. A preprocessed interferogram at an incident wavenumber of 6349.21 cm−1 is shown in Figure 3a, and restored spectral data after zero-filling are shown in Figure 3b.
When a Fourier spectrometer performs spectral splitting through spatial modulation, the ILSF is the same for each spectral band. Therefore, it is not necessary to determine the ILSF for each incident wavenumber. In actual processing, the spectrum of individual monochromatic lights is normalized and shifted to the same position based on the location of their maxima. The result is shown in Figure 4a. Because of the narrow spectral range of the instrument, the ILSF variation is minimal across the spectrum. Therefore, averaging the ILSF at various wavenumbers provides the overall ILSF for the entire spectral range. The FWHM of the instrument is 0.268 cm−1, as depicted in Figure 4b.

2.2.3. The ILSF Absorption Cell Test Validation

Before the GMI payload launched, absorption spectrum testing experiments were conducted using specialized equipment, such as hyperspectral resolution calibration equipment and an atmospheric environment simulation calibration chamber [27,28]. The experimental equipment is shown in Figure 5. Firstly, the atmospheric environment simulation calibration chamber is evacuated to a high vacuum state with air extraction equipment to measure the background spectrum; then, gas distribution equipment is employed to proportion greenhouse gases at standard concentrations. Temperature control equipment is utilized for temperature regulation, and once the temperature and pressure parameters stabilize, the payload conducts absorption spectrum measurements. The measured transmittance spectrum is obtained based on the target and background spectrum.
According to the Beer–Lambert law [29], the theoretical transmittance calculation formula for radiant energy passing through the target gas is as follows:
τ λ = e α λ c L
Here, λ is the wavelength, α is the gas absorption cross-section, c is the target gas concentration, and L is the absorption path length. The target gas concentration is obtained by combining the gas pressure and temperature with the ideal gas equation [30]. The calculation of the atmospheric absorption cross-section α is under the condition of the absorption cell state when the payload measures the actual transmittance. The absorption cross-section for each channel is calculated based on the HITRAN database [31] and relevant formula σ = n 0 α P T 0 / P 0 T , where σ is the absorption coefficient, n 0 is the standard Lorentzian constant, P is the actual pressure, T is the actual temperature, and P 0 and T 0 are the pressure and temperature in the standard atmospheric state.
The calculated transmittance spectrum is convolved with the ILSF of the corresponding channel, resulting in the theoretical transmittance for each channel. Figure 6 illustrates a comparison between the measured (blue curve) and theoretical transmittance (red curve) of the CO2-1 bands observed by the GMI payload. This comparison was carried out in a controlled environment, where 100 kPa of CO2 gas was introduced into the simulated calibration chamber, with the gas temperature rigorously maintained at 20 ± 0.5 °C. A comparative analysis between the measured transmittance of the absorption cell and the theoretical transmittance revealed that the absorption peak positions are accurate, confirming the precision of the wavelength calibration results. According to Equation (8), the average relative deviation of the spectral lines was 0.818%, demonstrating good agreement within the depth and width of the absorption peaks and confirming the accuracy of the ILSF calibration.
R M D = 1 n i = 1 n x i X i X i 100 %
Here, x is the measured spectrum, X is the reference spectrum, and i is the number of spectral points.

3. On-Orbit ILSF Status Analysis

3.1. On-Orbit Calibration Scheme

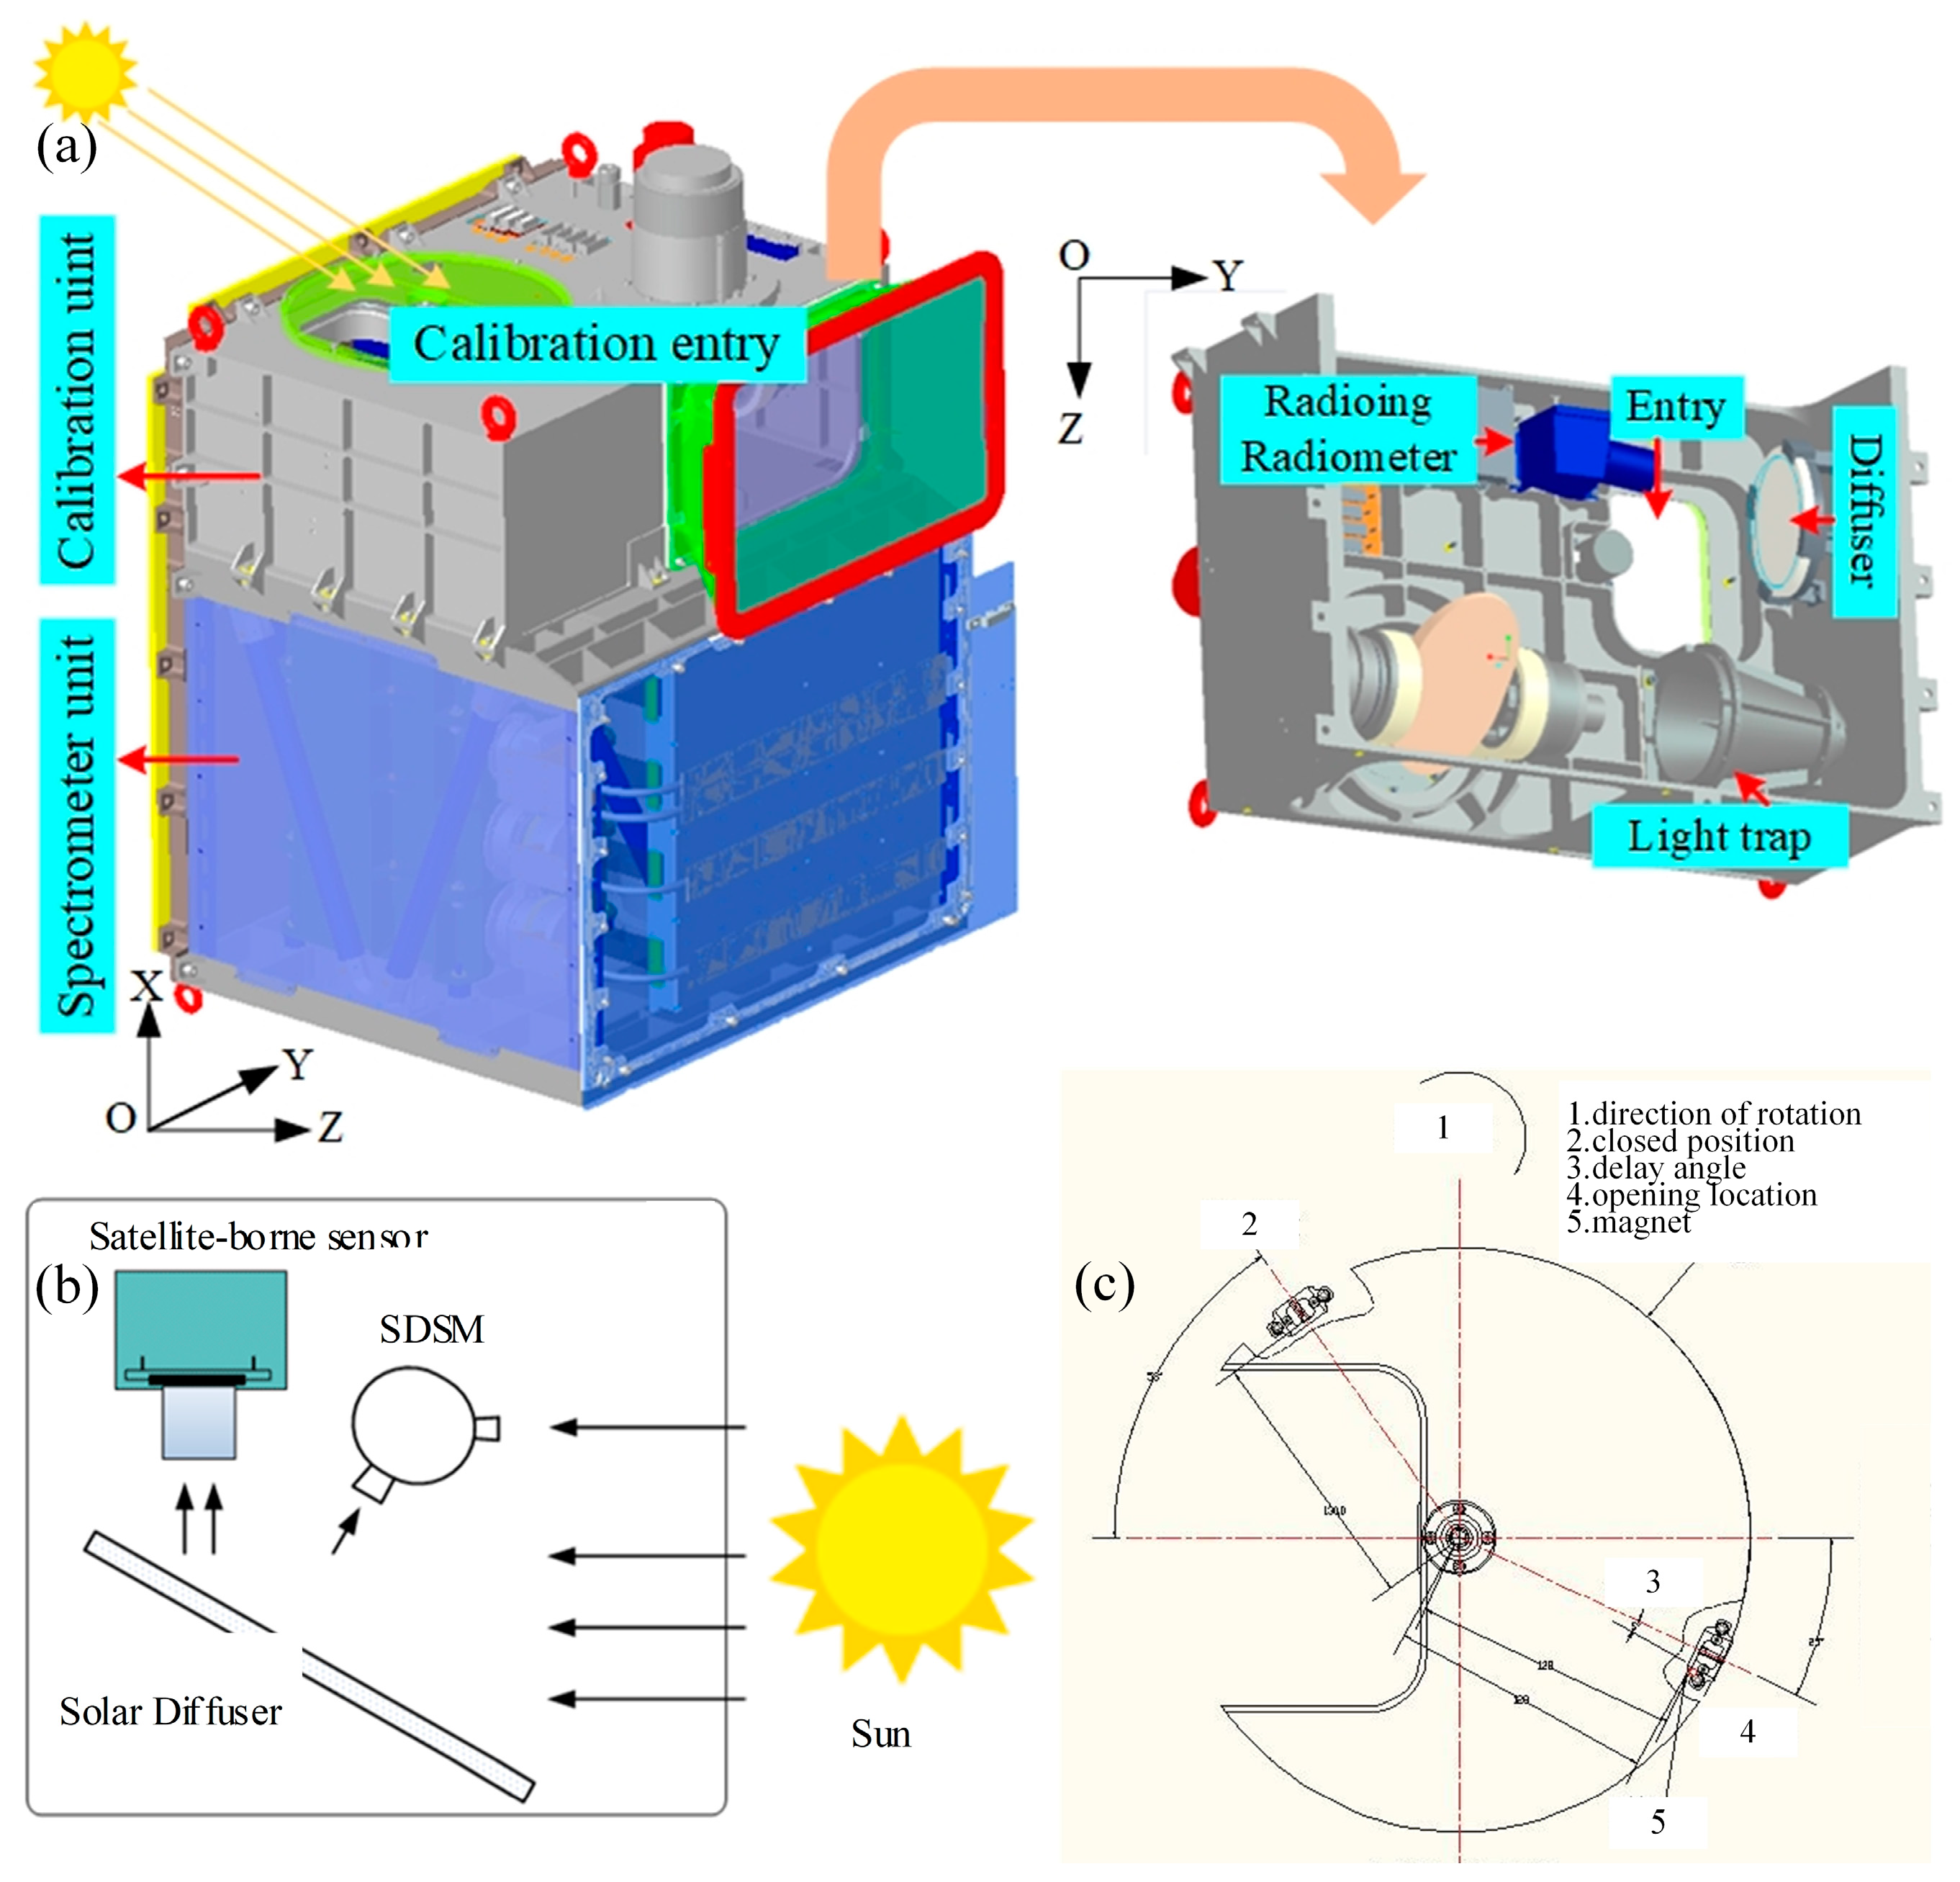
The GMI payload on-orbit calibration scheme uses highly stable sunlight as the calibration light source. It establishes a space-level large-area radiation standard source through a solar illumination calibrator and fills its aperture of observation and FOV at the front end of the payload optical path to achieve entire end-to-end optical path calibration. During the on-orbit calibration process, the payload’s two-dimensional scanning mechanism shifts the nadir observation mode to the on-orbit calibration mode; a schematic diagram of the calibration optical path is shown in Figure 7b. This action allows the calibration light source, sunlight, to enter the payload telescope, initiating data collection in calibration mode. The structure of the calibrator is shown in Figure 7a. The on-orbit calibrator consists of a solar diffuser, a light trap, a radiometer, a calibration door, a driving mechanism, and a calibration cabin. It achieves entire aperture, FOV, and optical path calibration for the payload. The calibrators serve distinct functions within the instrument system. Firstly, the solar diffuser plate, constructed from polytetrafluoroethylene, functions as a standard light source by harnessing on-orbit solar illumination. Secondly, the radiometer is tasked with tracking and monitoring the decay of the diffuser plate over time. Additionally, the light trap plays a crucial role in providing a dark background reference for instrument calibration and conducting dark current measurements. Furthermore, the calibration cabin and space diaphragm are employed to eliminate stray light and safeguard the space environment. Finally, the door and driving mechanism work in conjunction with the two-dimensional rotation of the scanning mirror to execute calibration procedures; the door-blocking structure is shown in Figure 7c. These calibration routines are conducted monthly to ensure the precision and accuracy of the instrument measurements.
The on-orbit calibration of the GMI payload includes spectral calibration and radiometric calibration, both of which use unified on-orbit calibration equipment, and the calibration time is selected near the Antarctic region of the satellite. The spectral calibration time must be selected so that the sunlight can be incident on the calibration equipment, the sunlight can pass through the upper atmosphere, and the height range is 10–100 km. During the radiometric calibration, it is crucial to select a calibration time for when sunlight can illuminate the calibration device without being affected by atmospheric absorption.

3.2. Theoretical Spectral Processing

The solar spectrum is an absolute value of solar irradiance in a certain wavelength band. The solar spectrum, which is usually determined during the solar minimum or low-solar-activity periods, has important implications for climate science and sensor radiometric calibration. The Kurucz solar spectrum is often used as the standard solar spectrum to compare and calibrate observations. The Kurucz solar spectrum, developed by Robert Kurucz, is a theoretical representation of the solar spectrum, calculated using specific physical assumptions and mathematical models. The Kurucz solar spectrum spans a broad range of wavelengths, from ultraviolet to infrared, offering detailed information on the sun’s radiation intensity and spectral characteristics at various wavelengths [32].
The solar spectrum observed by the GMI payload can clearly distinguish the solar Fraunhofer absorption lines formed by the absorption of the outer atmospheric elements of the sun. The spectral resolution of the Kurucz solar spectrum is higher than that of the GMI payload. Therefore, the Kurucz solar spectrum with a high spectral resolution can be used as the theoretical reference spectrum for the on-orbit spectral calibration of the GMI payload. The Kurucz solar spectrum is derived from theoretical and empirical model calculations, covering a spectral range of 0.2 to 200 μm. The uncertainty of its standard value in the CO2-1 bands can reach 3% [8,33,34]. The data can be accessed from a website (http://Kurucz.harvard.edu/sun, accessed on 12 December 2023). Figure 8 shows the spectral line distribution of the Kurucz solar spectrum in the CO2-1 bands. The Kurucz solar spectrum is denoted as the input spectrum S σ , and the ILSF signifies the response of a single detector element to the optical wavelength of monochromatic light on this pixel, set to f σ ; the theoretical reference solar spectrum S σ is equivalent to the input spectrum, and the convolution of the ILSF of the spectrometer is [35].
S σ = S σ f σ
Here, σ is the corresponding wavenumber of the spectrum.
According to the principle of selecting characteristic lines, appropriate solar spectral lines are selected [36], as shown in Figure 8, where the blue curve is the theoretical reference solar spectrum after convolution, and the red curve is the selected reference solar characteristic line.

3.3. Solar Calibration Spectrum Processing

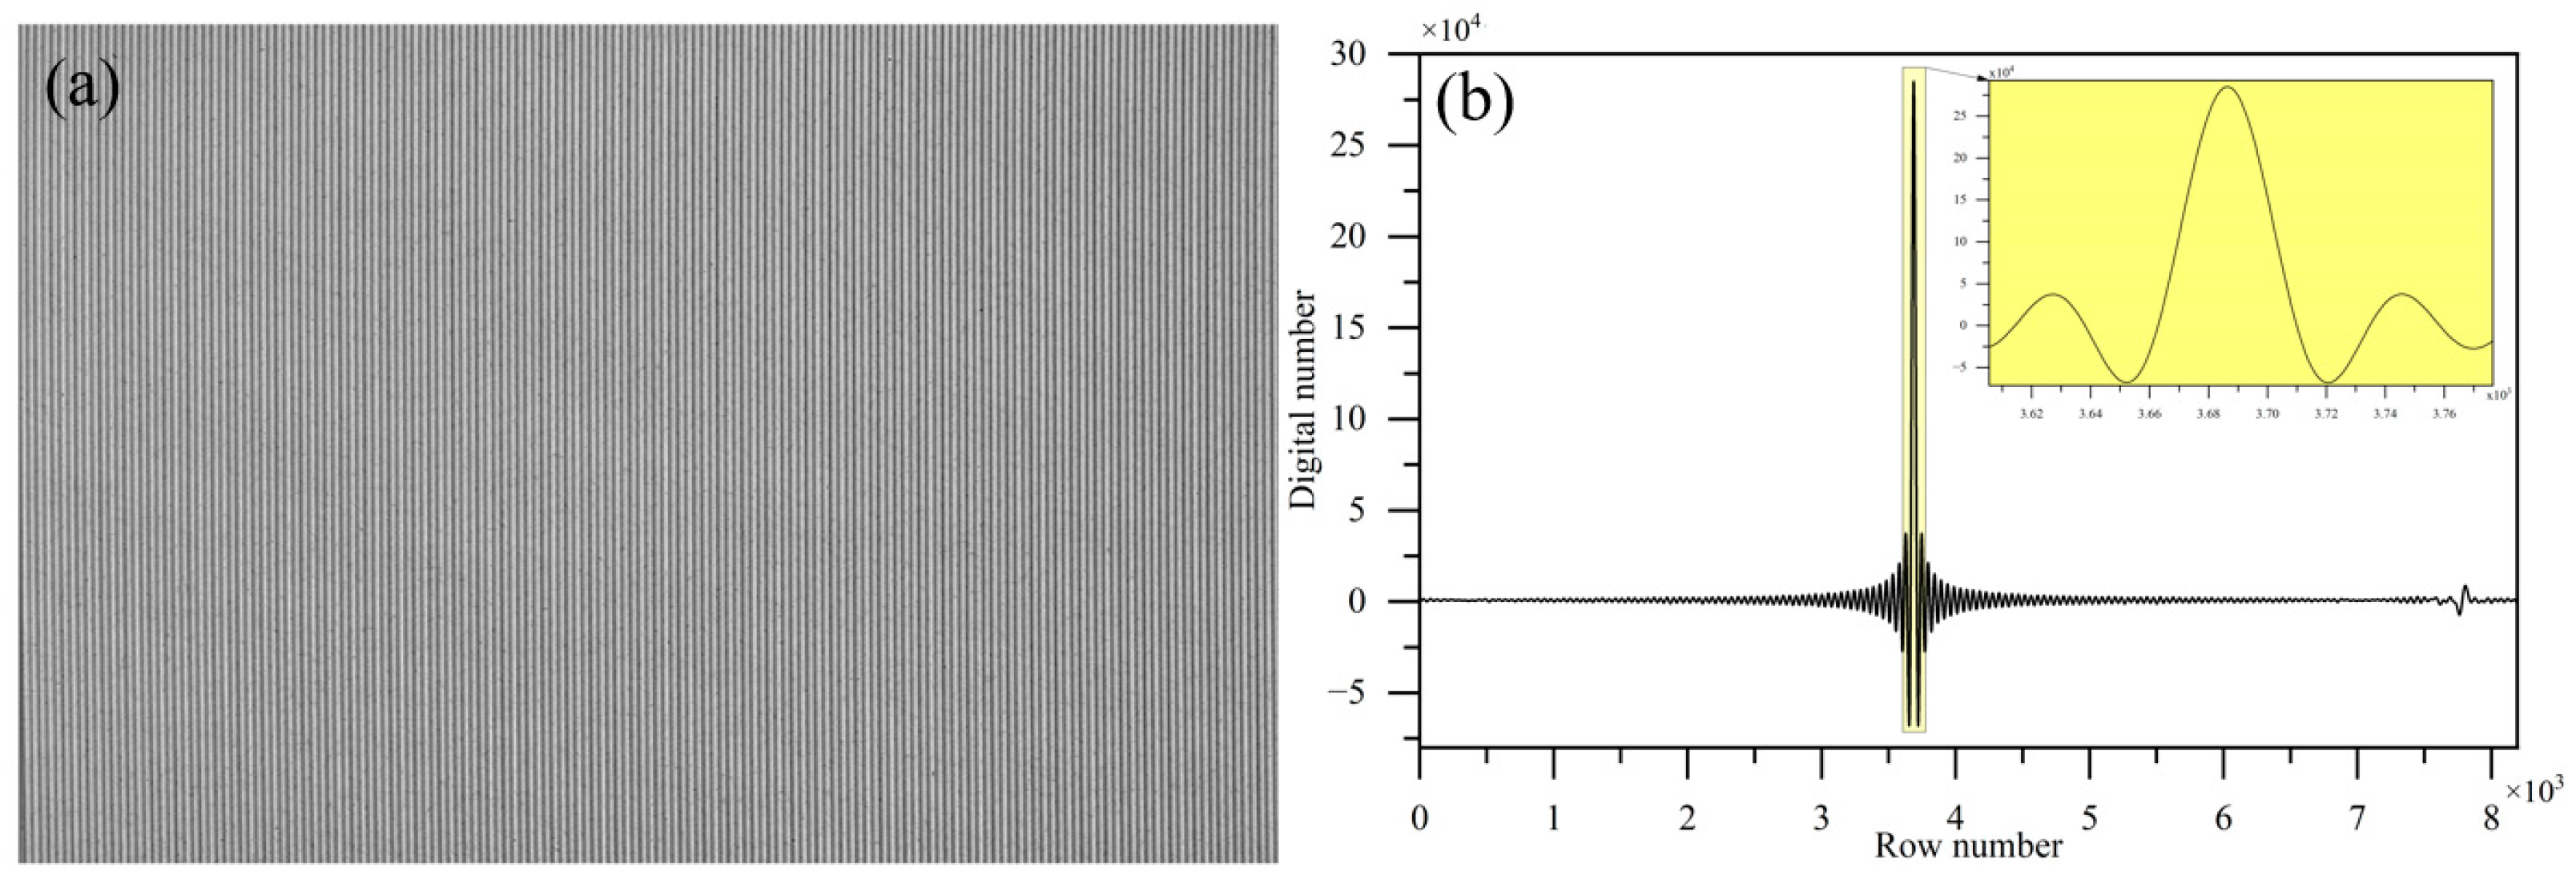
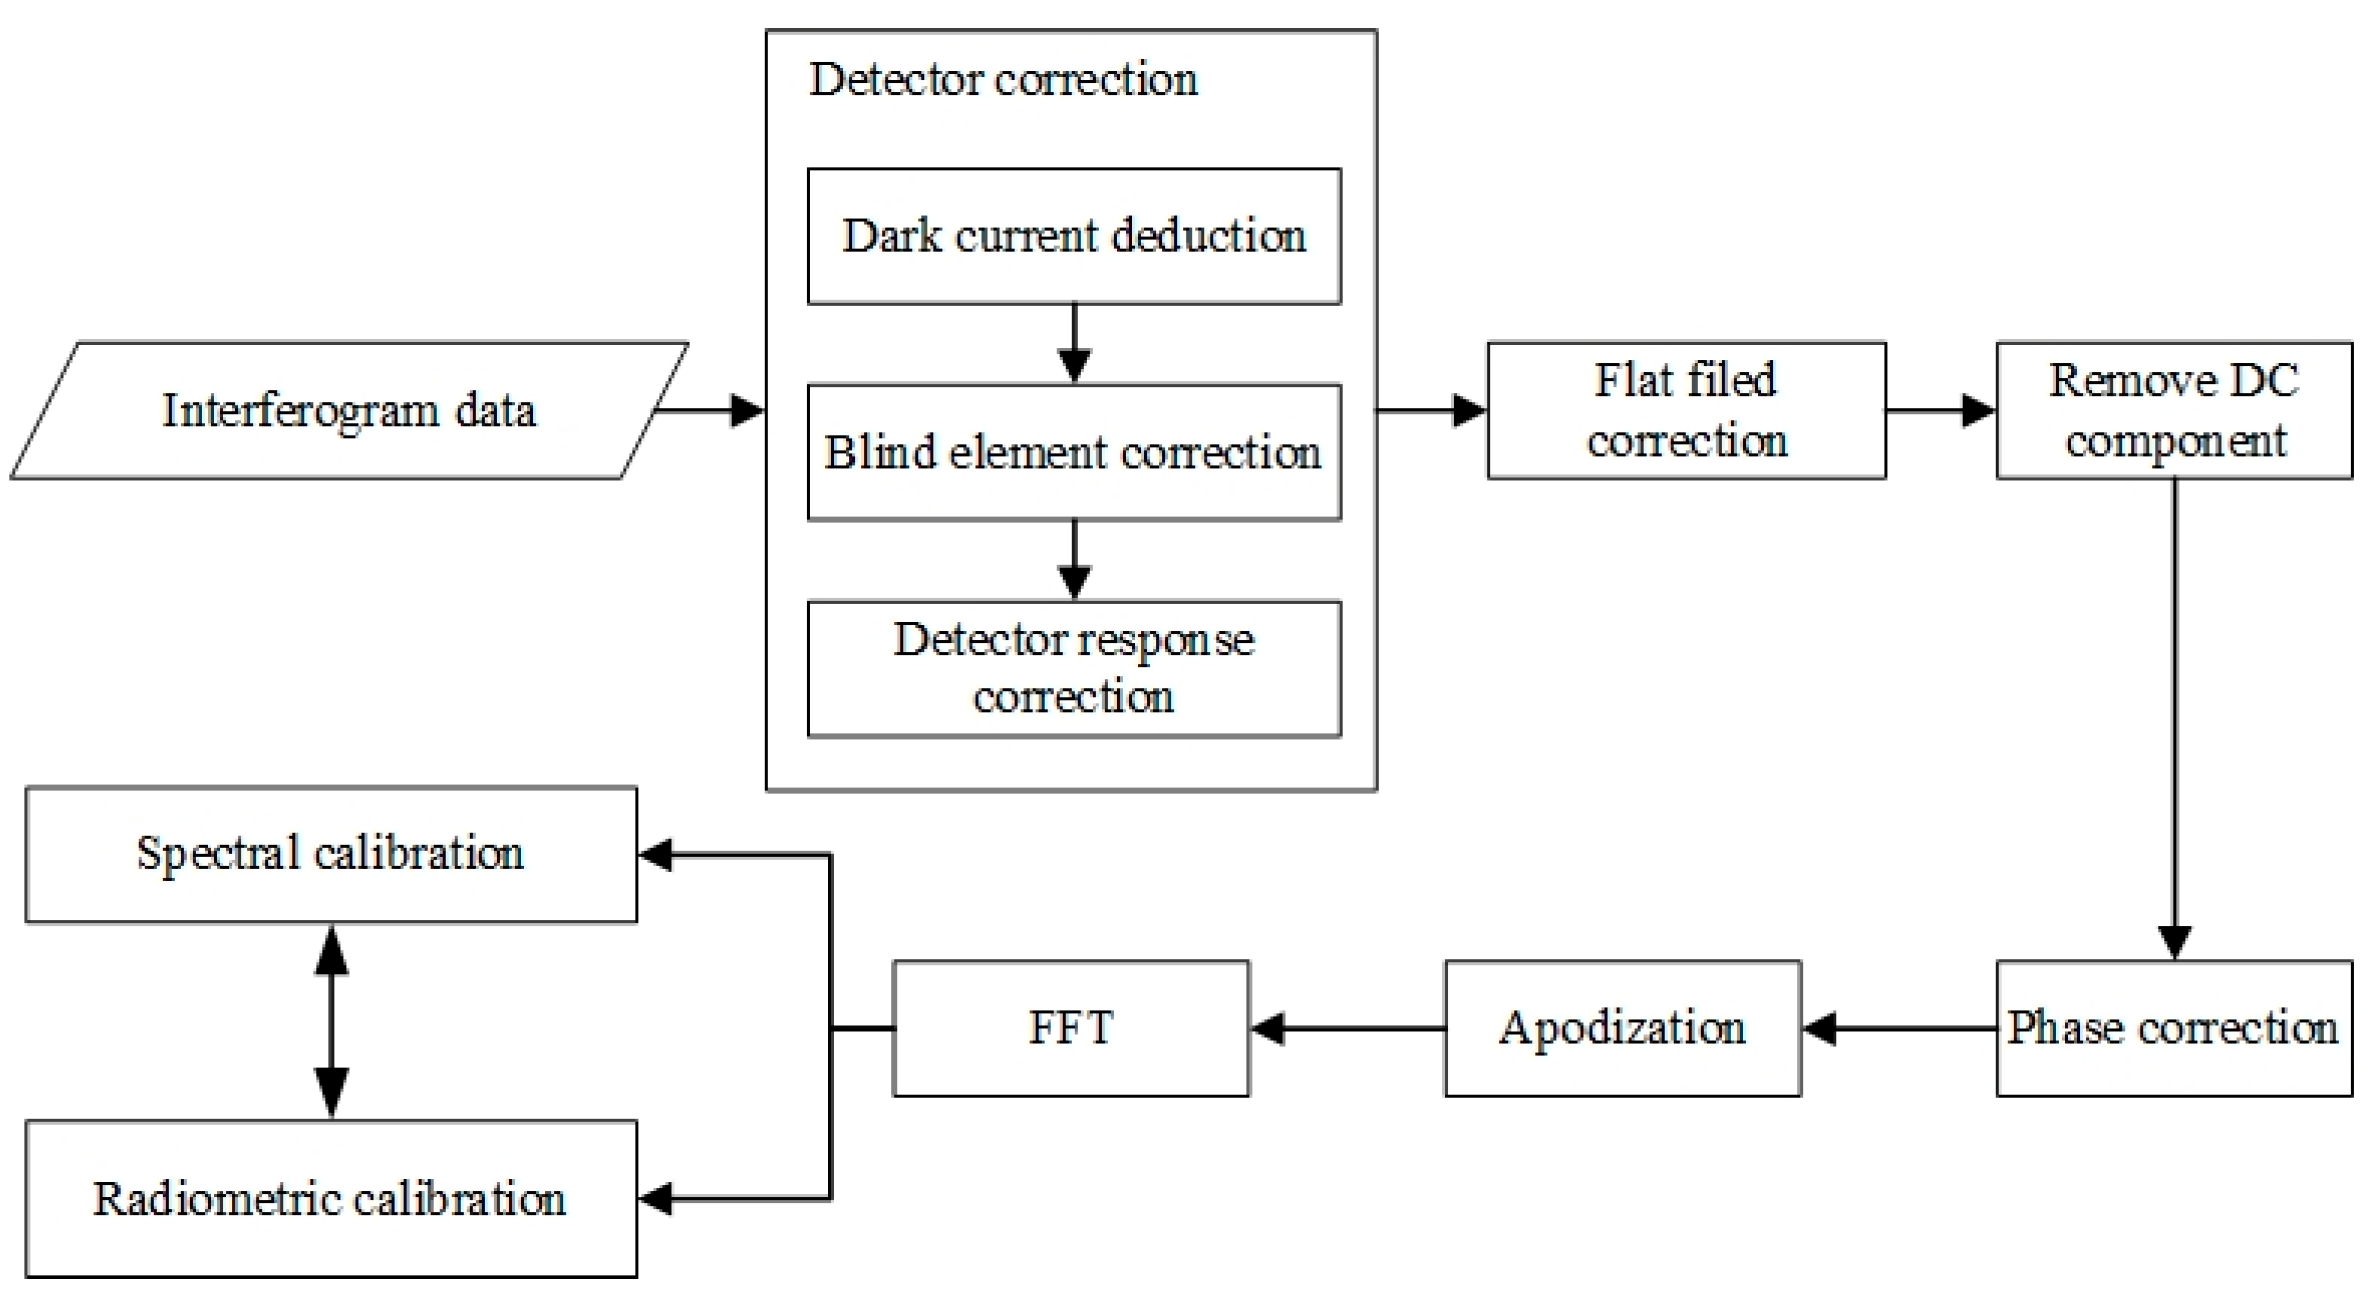
The on-orbit spectral calibration of the GMI payload must first carry out the preprocessing of the interferogram [37]. In contrast with traditional interferometer spectrometers, the GMI payload obtains an interferogram through heterodyne modulation, making it susceptible to various factors such as detector noise, machining, and assembly errors in optical components, as well as background interference. Therefore, the preprocessing of the interferogram includes dark current (DC) noise subtraction, abnormal pixel correction, detector corresponding error correction (uniformity correction), interferogram baseline correction, phase error correction, and Fourier transform (FFT). Considering the rise in abnormal pixels during the GMI payload on-orbit period, the algorithm for detecting and correcting abnormal pixels is enhanced. For trend items influenced by factors such as light source uniformity, optical path stability, and processing and assembly errors during the collection process, the variational mode decomposition (VMD) method is employed, effectively removing trend terms [13]. The on-orbit calibration data processing of the GMI payload is shown in Figure 9. The preprocessed interferogram of the calibration of the first solar observation in the CO2-1 bands after the GMI payload entered orbit (11 October 2021) is shown in Figure 10.
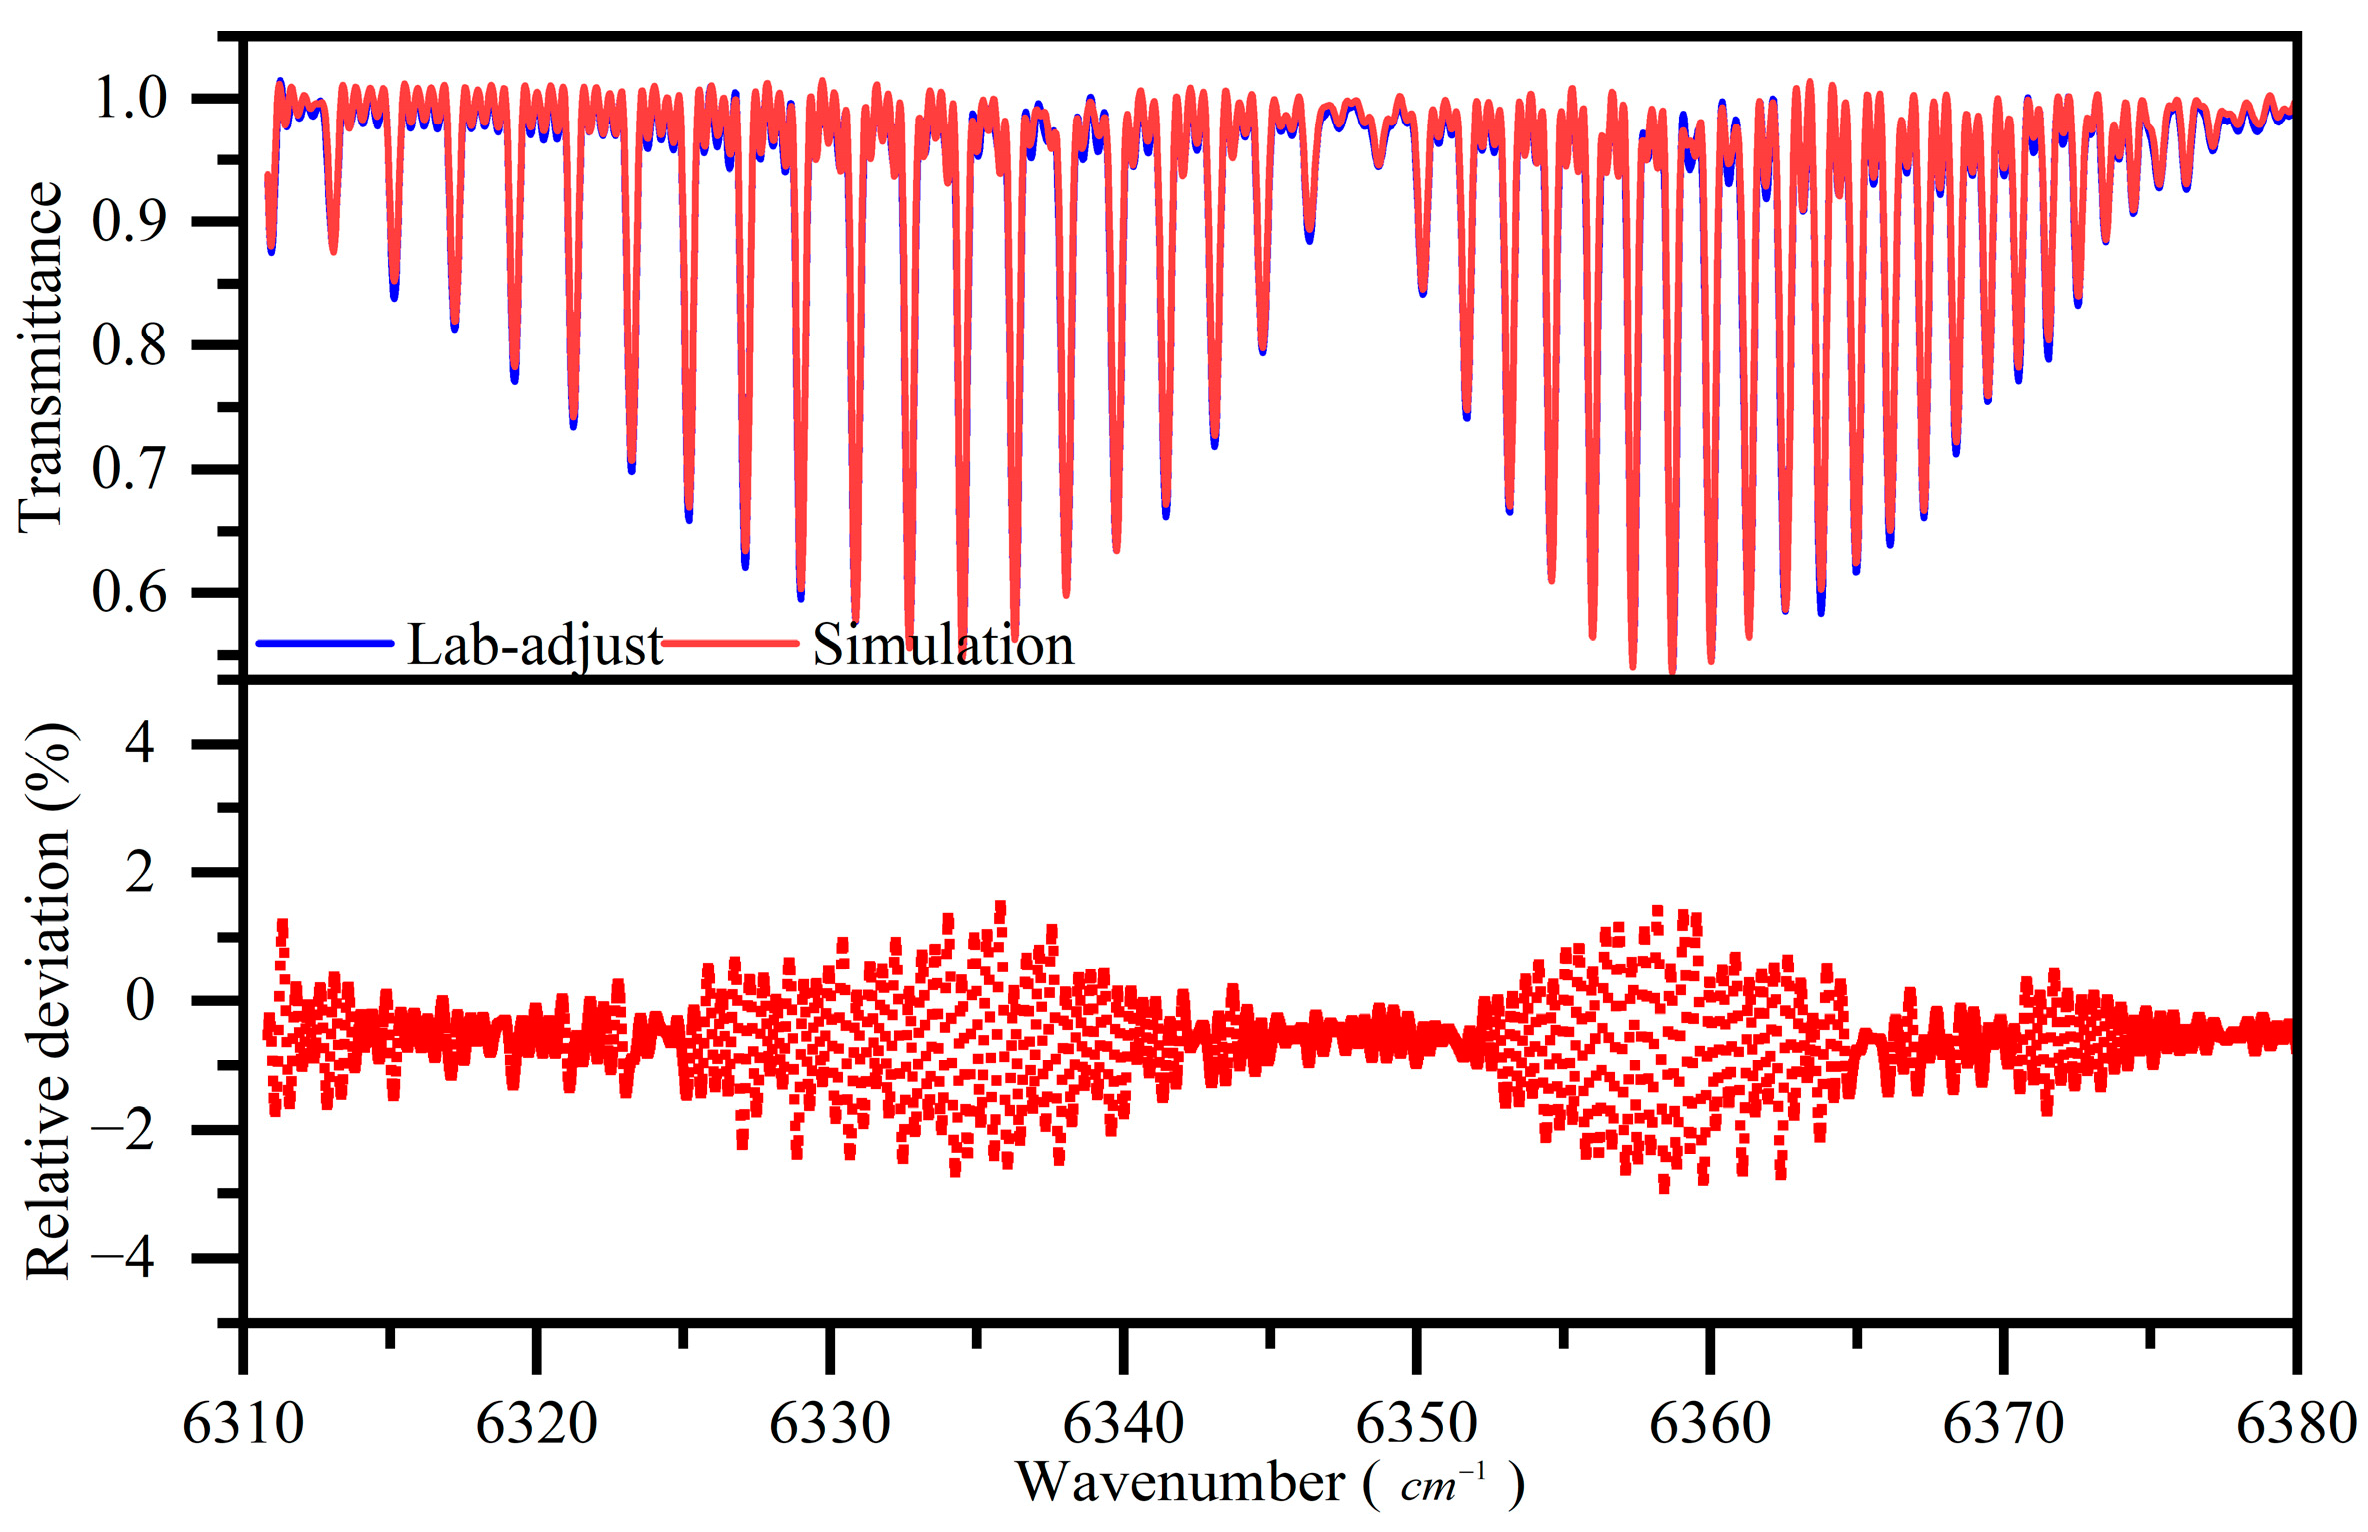
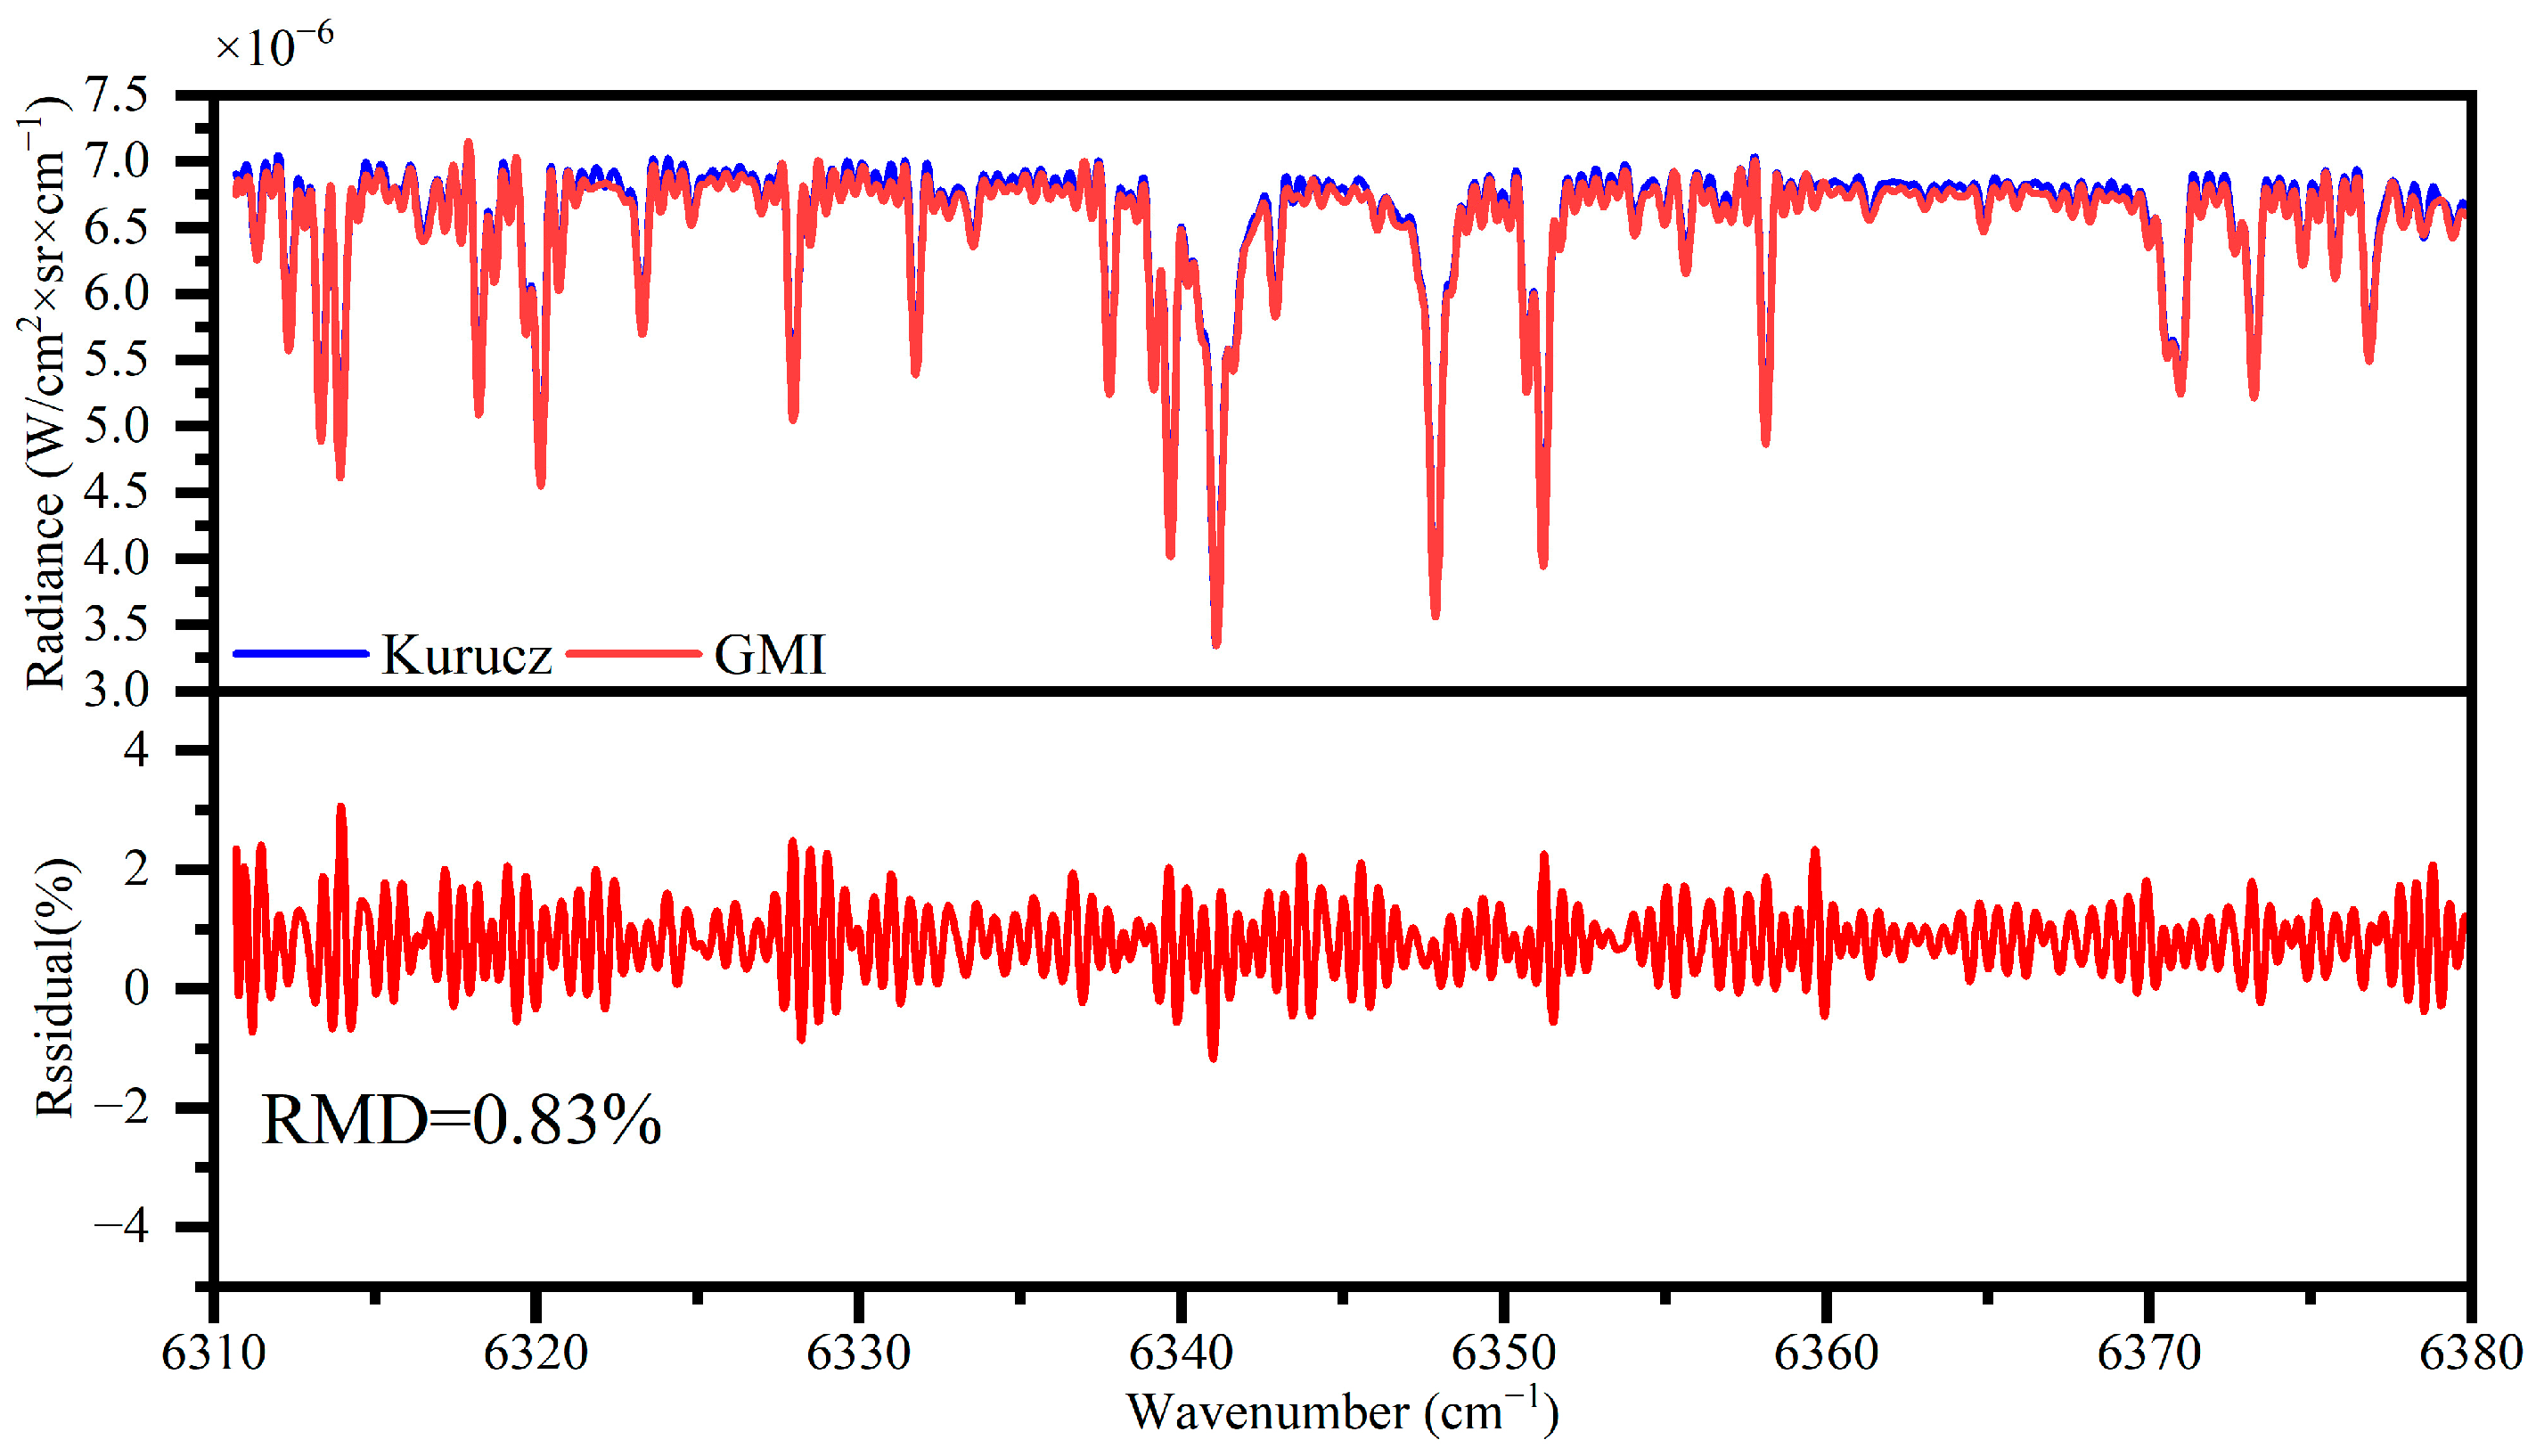
By using Equation (9), the Kurucz solar spectrum in the CO2-1 bands is convolved with the ILSF. Figure 11 shows the comparison results between the measured spectrum and the reference spectrum in the CO2-1 bands and the relative deviation results of the two spectra. This spectrum is derived from processing the GMI payload data following the calibration data processing flowchart shown in Figure 11. The figure shows that the spectral lines of the theoretical solar spectrum and the measured spectrum closely match, although there are variations in the depth of the absorption peak. The relative average deviation of the spectral lines across the entire band is approximately 1.83%. The differences may be attributed to significant distinctions between the on-orbit operating environment, conditions, and laboratory environment during satellite mission execution. Additionally, changes in equipment parameters may contribute to errors when directly applying the ILSF obtained in the laboratory to on-orbit observational data.

4. On-Orbit ILSF Iterative Model Algorithm

After obtaining the processing results of the GMI payload on-orbit solar observation spectrum in Section 3, the laboratory ILSF measurement results cannot be directly applied. To effectively monitor the changes in instrument performance and obtain an accurate spectrum, it is necessary to adjust the ILSF after the on-orbit GMI payload. However, because of the static interferogram technology of the GMI payload and the absence of measuring equipment for monochromatic light, it is not possible to directly measure the ILSF of the instrument. Additionally, the factors influencing the ILSF result from a complex interplay of effects, and it is difficult to accurately derive a mathematical expression for its function directly from the perspective of a physical model. Luo et al. [38] analyzed the modulation efficiency of the interferograms of a spatial heterodyne spectrometer during the engineering implementation process. They focused on factors such as the splitting characteristics of the beam splitter, aberrations of the optical system [39,40] (including the installation accuracy of the collimation system [41] and the exit wavefront error, interferometer component surface shape errors, imaging system defocus, and MTF curve degradation), and the influence of the extended light source, as well as detector sampling density and spacing.
The ILSF determines the degree of modulation of the instrument on incident radiation, that is, the spectral resolution of the instrument and the spectral line energy distribution. The ILSF can be divided into two parts. The first part describes the modulation loss caused by the inherent self-apodization of the instrument. It can be used to calculate the optical thickness of the spectrometer and the FOV. The second part is caused by the uncalibrated and optical phase difference of the instrument, characterized by modulation efficiency amplitude and phase error. The modulation efficiency amplitude characterizes the width of the ILSF, and the phase error quantifies the degree of ILSF symmetry. Therefore, it is effective to correct the ILSF function by constructing models with respect to modulation loss and phase error [42].
The calibration data of the solar spectrum measured by the orbiting high-resolution spectrometer are not affected by aerosols and have the characteristics of independent solar Fraunhofer lines. The stable Kurucz solar spectrum is used as the reference spectrum [43] to establish the ILSF modulation term error and phase error model. By iteratively optimizing the ILSF model parameters, it is possible to achieve the best agreement between the theoretical spectrum and the measured solar spectrum in the CO2-1 bands.

4.1. Error Function Model

The modulation term error of the instrument is an inherent property of the instrument, and the Gaussian line shape is the curve most used to describe the shape of peaks in a spectrum [44]. The modulation loss and phase error are randomly generated using a Gaussian function, which has the following 1D form:
f x = a e x μ 2 2 δ 2
Here, a is the height of the peak; μ is the central coordinate of the peak; δ is the width of the bell-shaped curve, also known as the standard deviation; and x is the coordinate position.
According to the above formula, the Gaussian function selected for the simulation generation of modulation loss and phase error curve is as follows:
f k i y = j = 0 n 1 a j e y μ 2 2 δ j 2
Here, a denotes the error function parameter, μ is the mean, and δ 2 is the variance.

4.2. Construction of an Error Model for the Modulation Term

The expression of the interferogram collected by the theoretical spatial heterodyne spectrometer indicates that B σ is the optical radiation intensity and that x is the position of the detector pixel. When σ < 0 and B σ = B σ , the interferogram can be represented as follows:
I x = B σ cos 2 π σ u d σ = B σ e i 2 π σ u d σ
When the spectrometer operates in a non-ideal state, it introduces modulation errors to the interferogram. In this case, the interferogram is expressed as follows:
I x = A σ , x B σ e i 2 π σ u e i φ σ , x d σ
Here, A σ , x is the modulation loss of the interferogram, and φ σ , x is the phase error.
The interferogram of the monochromatic light modulation term error with frequency is σ 0 , which can be expressed as follows:
I o x = A σ 0 , x B o σ 0 e i σ 0 x + φ σ 0 , x + e i σ 0 x + φ σ 0 , x
Since the interferogram has no practical significance in the negative direction, the modulation error interferogram can also be expressed as follows:
I o x = A σ 0 , x B o σ 0 e i σ 0 x + φ σ 0 , x
The theoretical spectrum B σ 0 of monochromatic light can be obtained as follows:
B σ 0 = I o x 1 A σ 0 , x e i σ 0 x e i φ σ 0 , x = B 0 σ 0 D σ 0
Here, A σ 0 , x = j = 0 n 1 a a j e x μ a j 2 2 δ a j 2 is the modulation loss term, φ σ 0 , x = j = 0 n 1 a p j e x μ p j 2 2 δ p j 2 is the modulation term error, B o σ 0 is the measured ILSF in the laboratory, and D σ 0 is the Fourier transform of the modulation term error.

4.3. The ILSF Modulation Term Error Correction

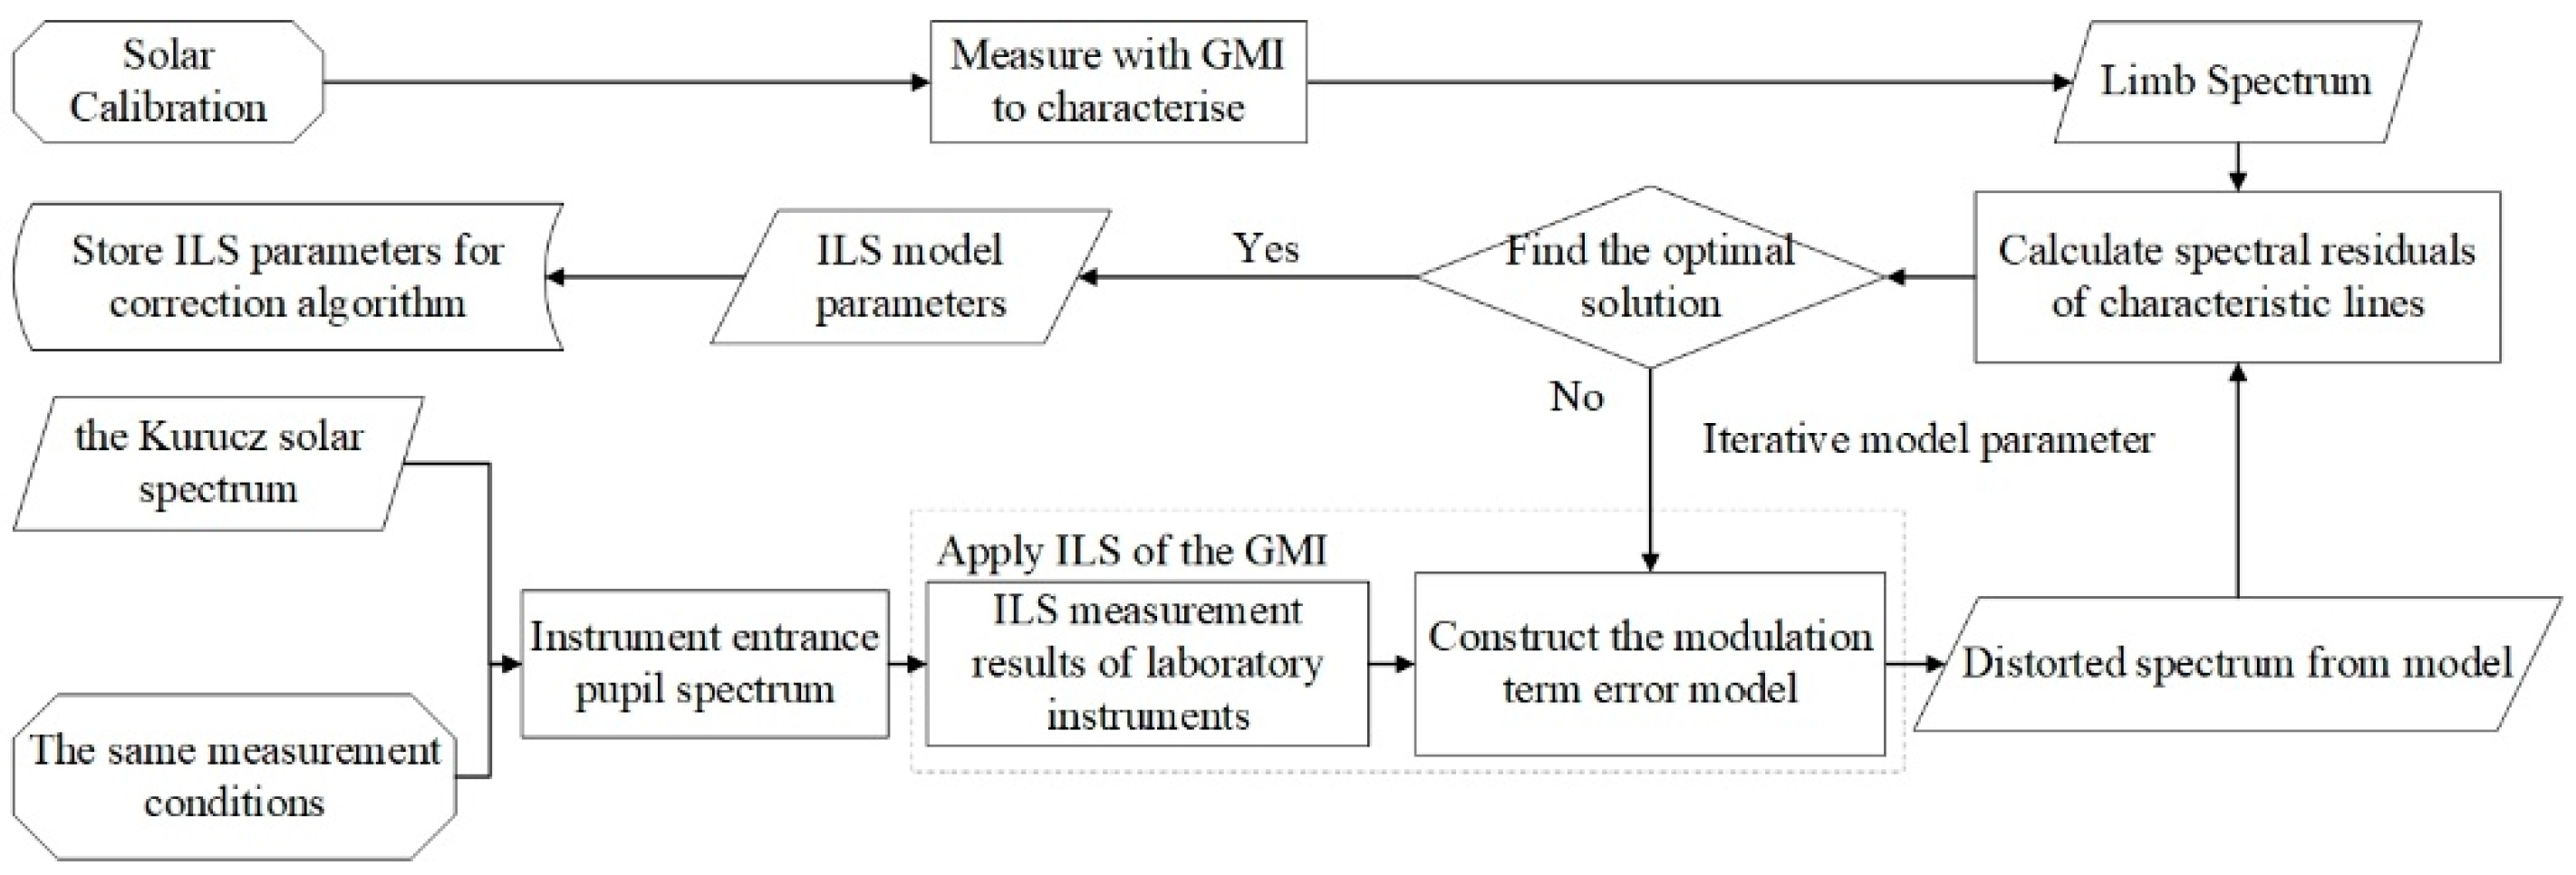
A flowchart of the ILSF characterization is presented in Figure 12. Different characterization and modeling algorithms are presented in this section. First, the solar spectrum is measured with the GMI payload to characterize its properties. To produce the reference spectrum, the same radiance can be either modeled or measured at a high resolution so that absorption or emission lines are resolved to their natural shape. Once these two sets of data are obtained, the characterization becomes an iterative optimization process on the ILSF model parameters. Once the distorted spectrum is close to the measured spectrum up to a certain threshold value, the ILSF parameters are stored to feed the correction algorithm.
The main steps are as follows:
(1) Obtain the solar spectrum measured by the GMI payload and amplitude brightness value of the characteristic spectral lines.
(2) Select the high-precision Kurucz solar spectrum of the corresponding band as the reference spectrum.
(3) Acquire the ILSF data measured using laboratory tunable lasers.
(4) Construct a GMI payload instrument modulation term error model to obtain the new ILSF.
(5) Calculate the residual of the measured solar spectrum characteristic lines and the reference spectrum characteristic lines after convolving the ILSF with Kurucz.
(6) Iteratively optimize the modulation term error model parameters.
(7) Calculate the corresponding model parameters a , δ , μ when the evaluation function χ 2 is the smallest. Then, obtain the final ILSF data according to Equation (16).
The average relative deviation is used as the evaluation function, as shown in Equation (17):
χ 2 a , δ , μ = 1 N j = 1 N G j S i , a , δ , μ G j 2
Here, G j is the radiation value of the spectrometer at wavenumber W N j , N is the total number of spectral points selected for evaluation, and S i , a , δ , μ is the radiation value of the reference spectrum after convolution with the ILSF at wavenumber W N j .

5. Experiment and Discussion

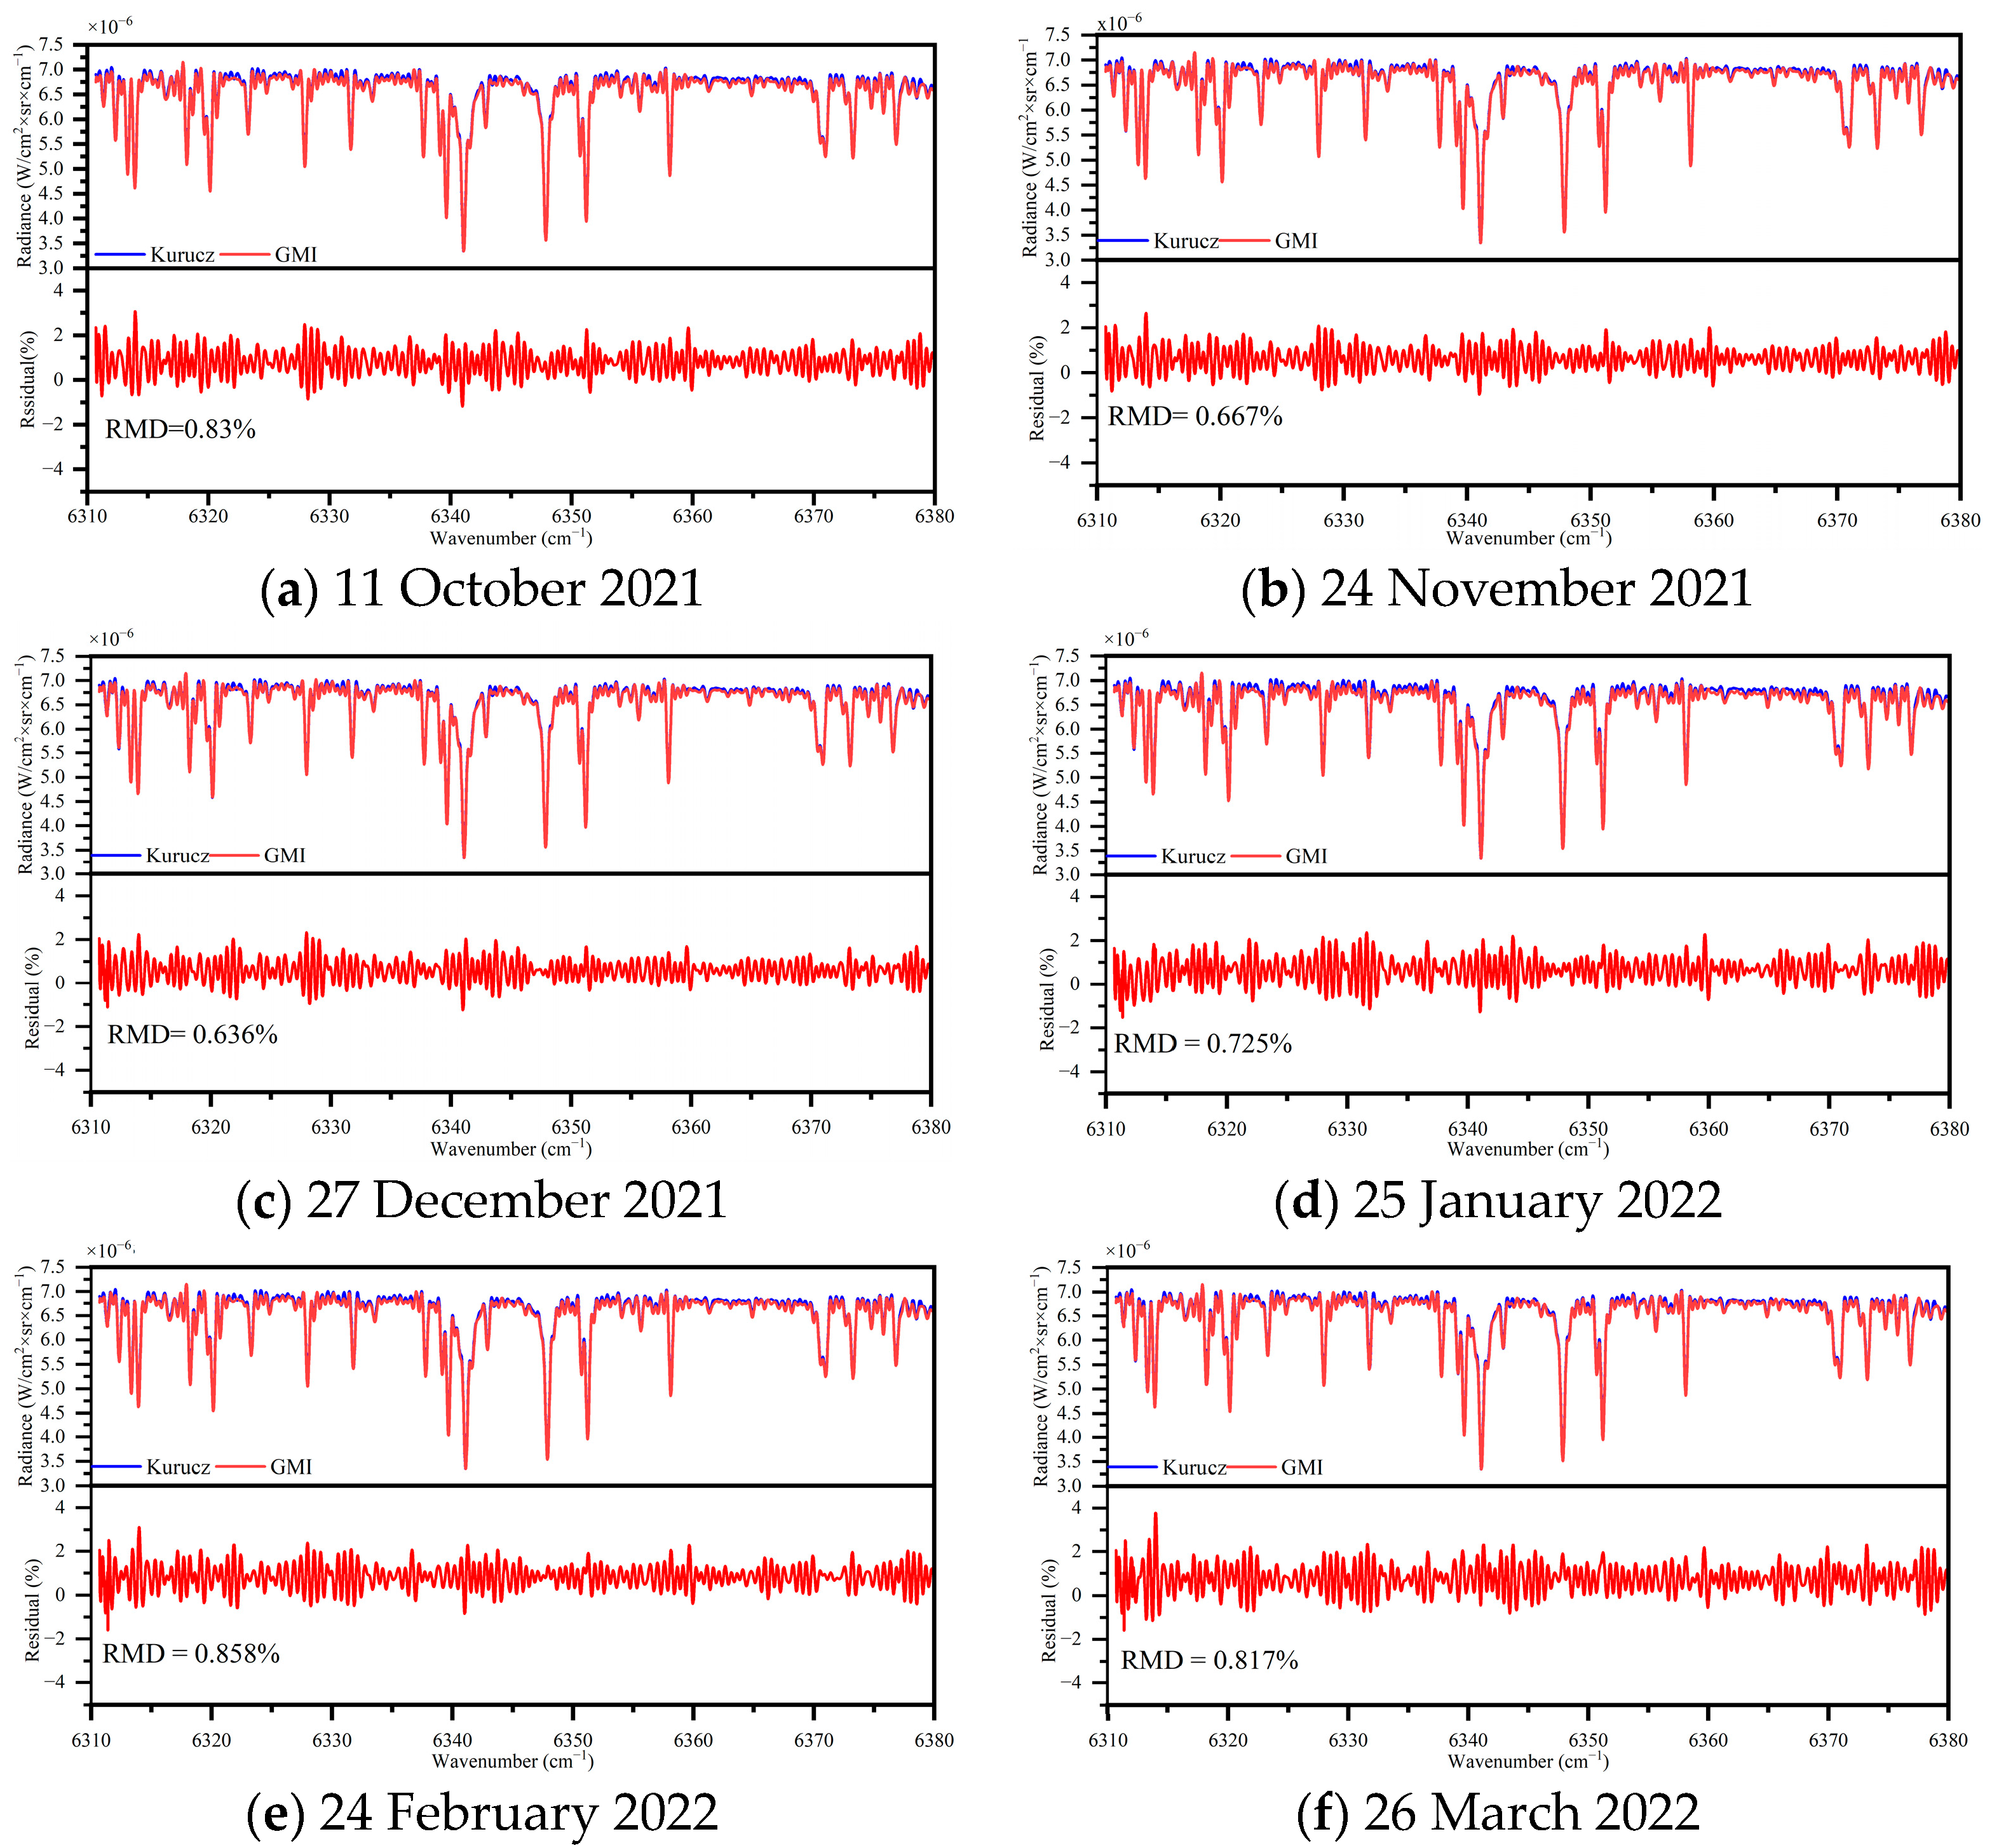
The spectral calibration data selected for analysis were derived from solar observations within the CO2-1 bands following the deployment of the GMI payload on orbit. The Kurucz solar spectrum’s corresponding band was convolved with the ILSF to create a reference spectrum. Figure 13 shows the solar calibration data obtained after the deployment of the GMI payload on orbit. The theoretical spectrum (the blue curve) and the measured spectrum (the red curve) show a substantial consistency, with relative deviations being large relative to the baseline near the solar Fraunhofer lines, with overall relative deviations in the ±2% range and relative mean deviations of about 0.83%. Six calibration datasets—specifically from 11 October 2021, 24 November 2021, 27 December 2021, 25 January 2022, 24 February 2022, and 26 March 2022—were selected for ILSF calculation and verification.
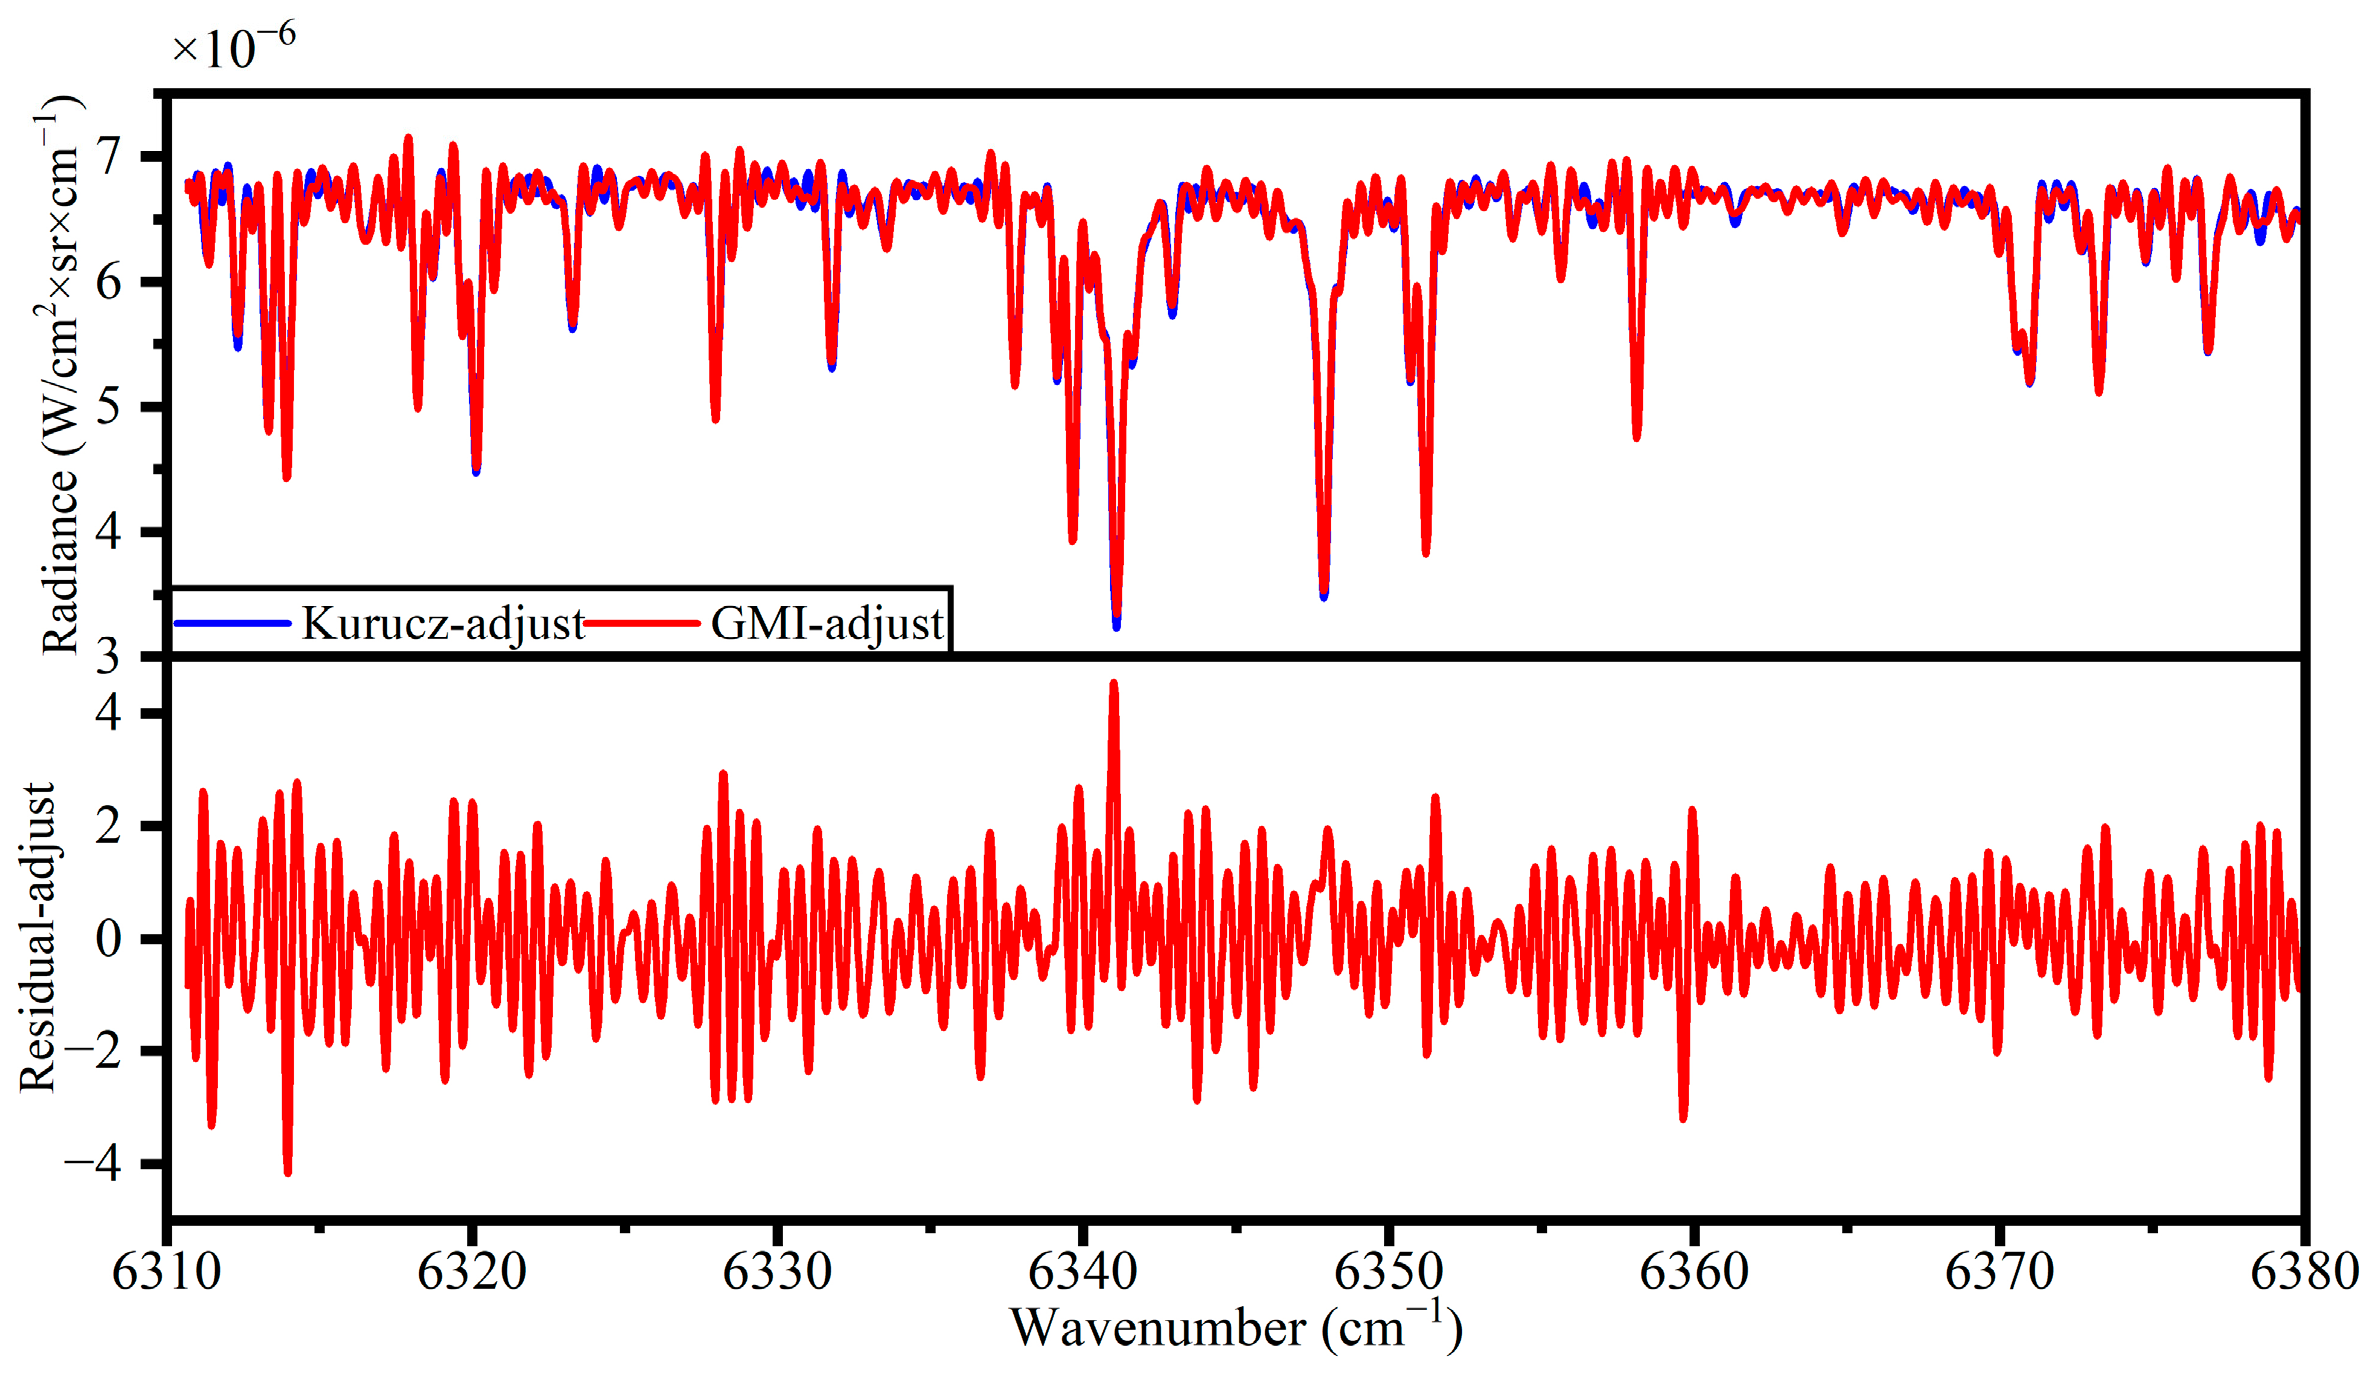
The error model of the modulation term was iterated, and Figure 14 shows the ILSF measured in the laboratory using a monochromatic laser before the GMI load launch (the blue curve) and the adjusted ILSF obtained using the iterative error function model after the GMI load on orbit (the green curve). The resolution is reduced after the ILSF correction, and the asymmetric side lobe oscillations indicate that the corrected ILSF enhances the consistency between the theoretical solar spectrum and the measured solar spectrum in the corresponding band spectral line.
Figure 15 shows a comparison between the corrected CO2-1 bands’ measured solar spectrum and the theoretical spectrum after ILSF correction, along with the relative residual distribution. From the comparison, it is evident that the spectra are highly consistent. The relative residual distribution indicates that the overall relative deviation is within the ±2% range, with larger deviations observed in the bands with dense solar Fraunhofer lines. The average relative deviations for the six measured solar spectra are 0.83%, 0.667%, 0.636%, 0.725%, 0.858%, and 0.817%, all of which are around 0.8%. This also demonstrates that the instrument maintains relative stability over this period after ILSF correction. By averaging these six results, it is found that the ILSF accuracy error is 0.756%, with deviations within 1%. This indicates that the ILSF correction method has a good corrective effect.
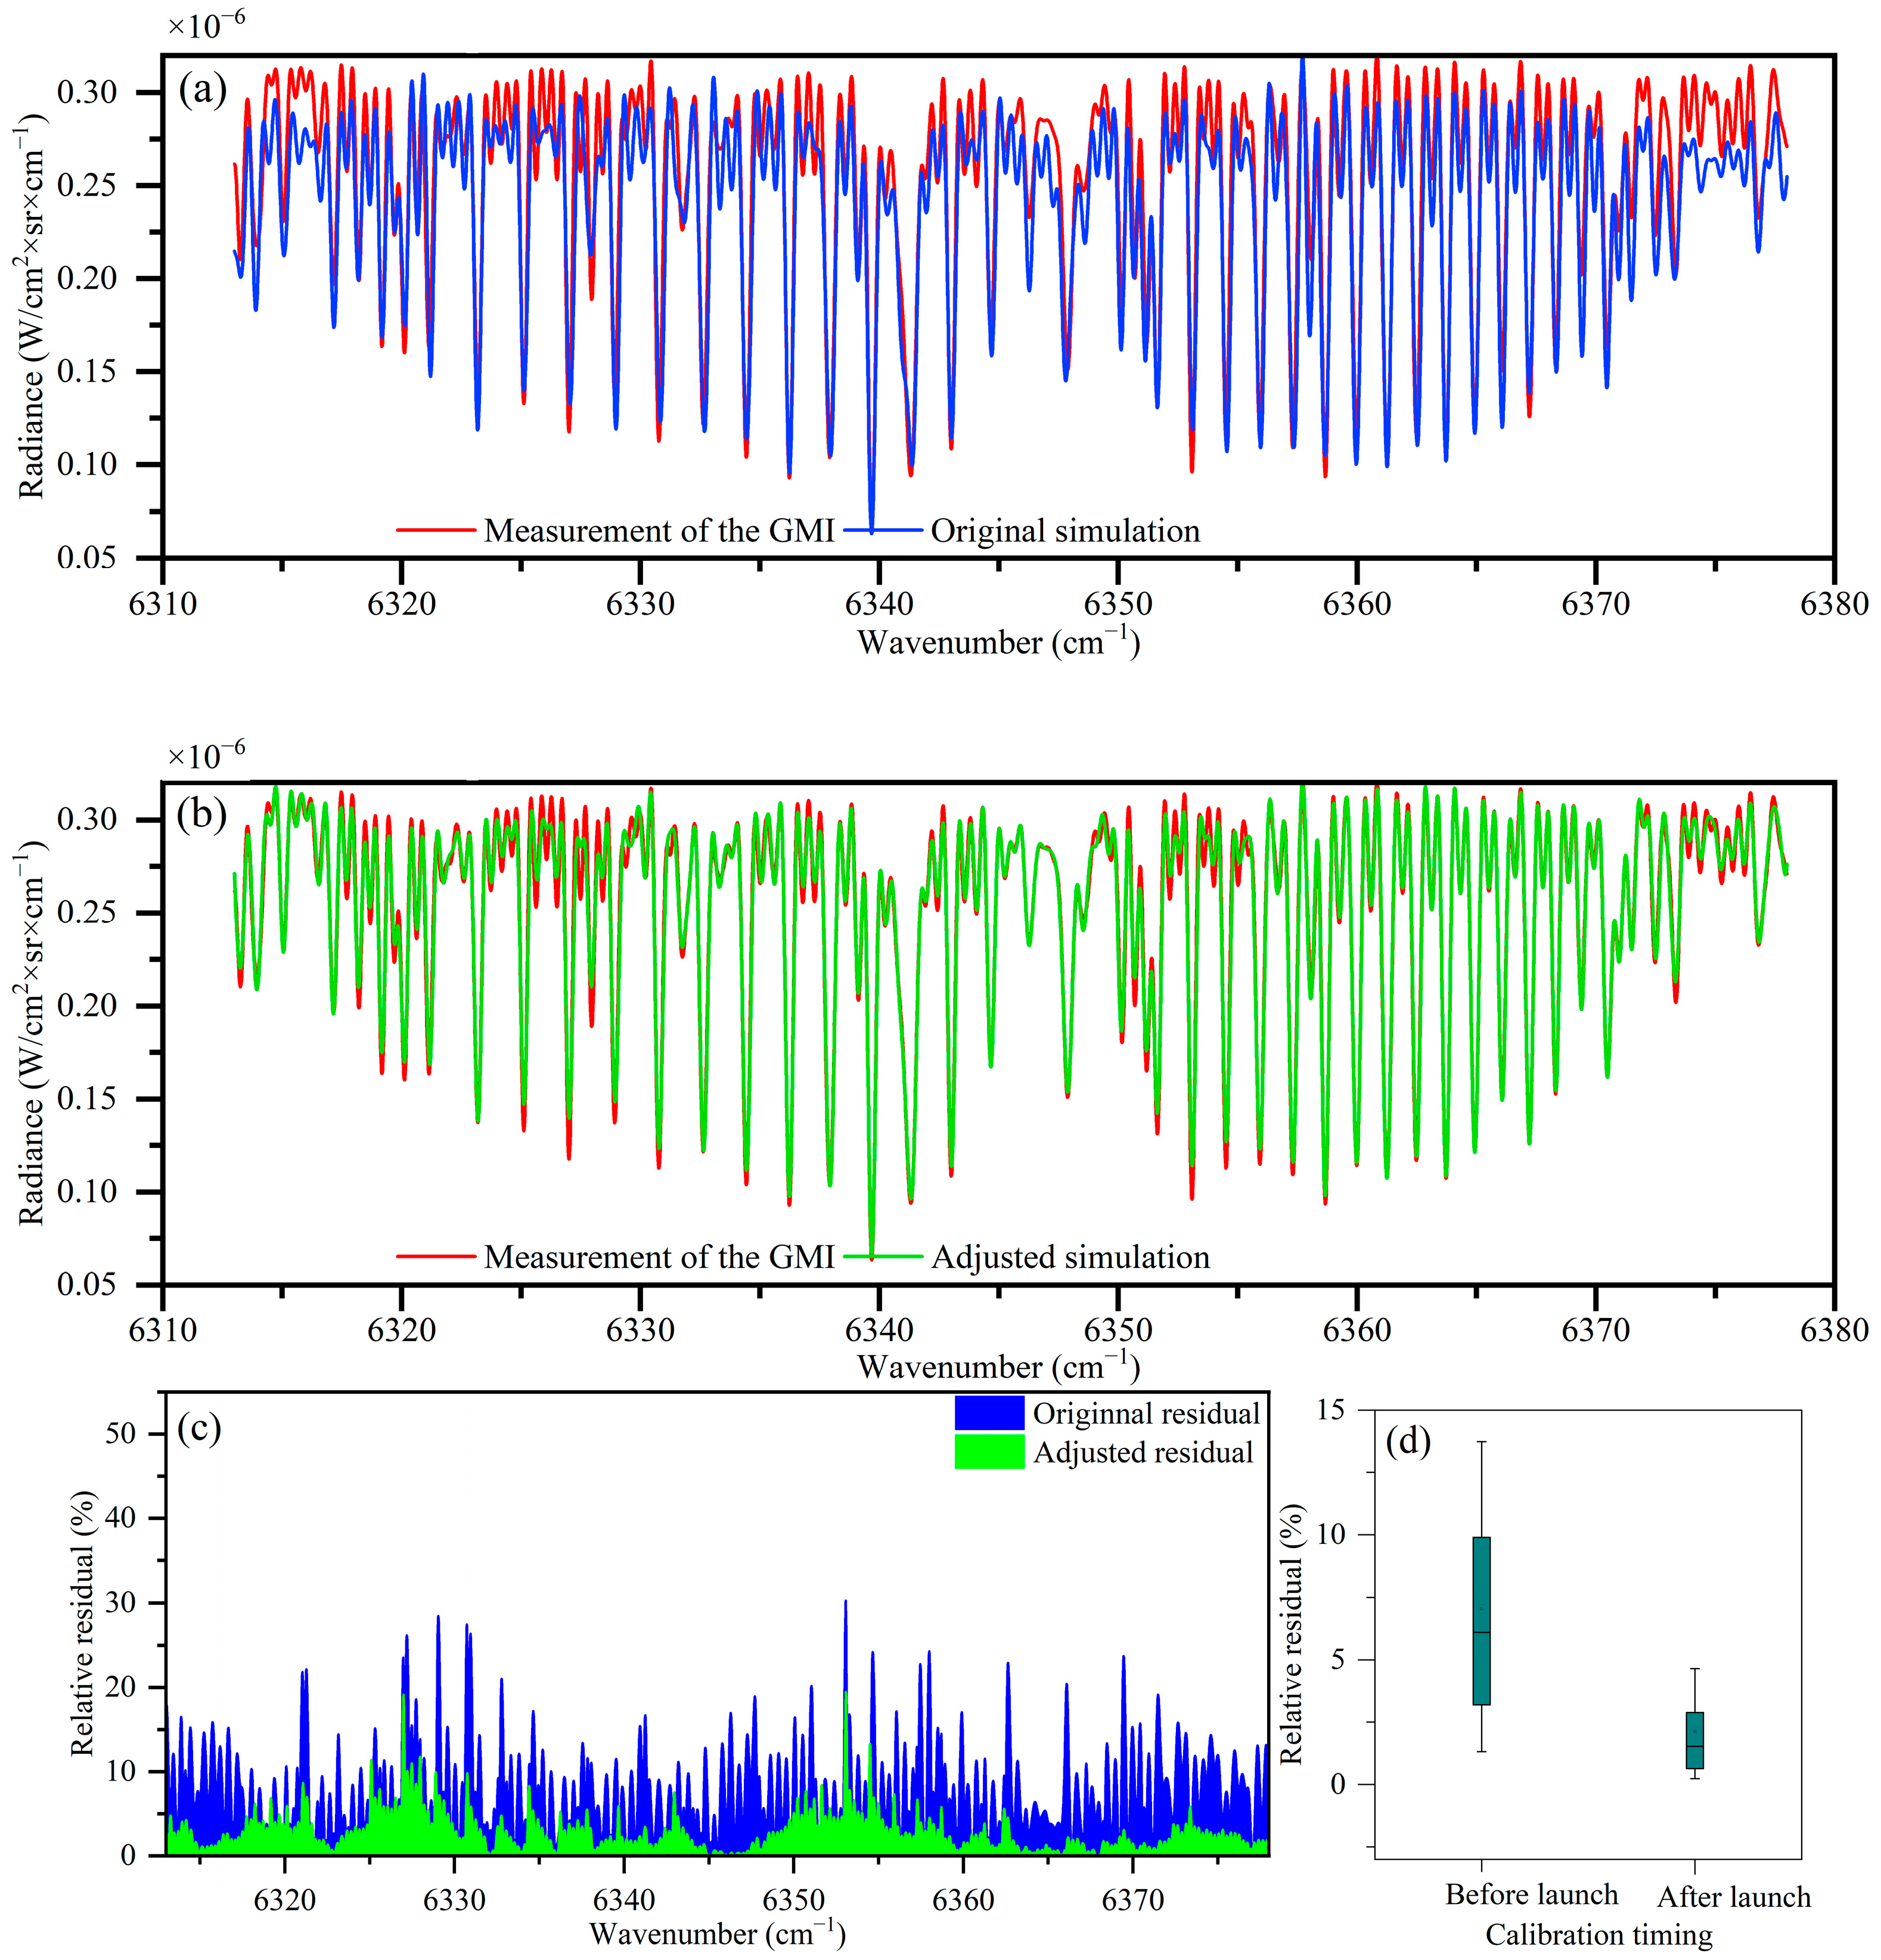
To further analyze the impact of on-orbit updates and adjustments to the ILSF on the GMI payload’s instrumental performance, the nadir observation spectrum of the CO2-1 bands on 11 November 2021 was selected. The results are shown in Figure 16. Figure 16a, b compares the simulated and measured spectra before and after the ILSF correction, exhibiting consistent distribution characteristics. Figure 16c shows the distribution of relative residuals, indicating larger residuals in bands with dense absorption peaks. Figure 16d shows that, after the ILSF correction, the average relative deviation between the measured and simulated spectra decreases from 7.049% to 2.106%. The residual values indicate that the discrepancy between the theoretical solar spectrum and the measured solar spectrum improves after updating the ILSF. This demonstrates that the changes in the ILSF caused by the on-orbit environment can be effectively corrected.
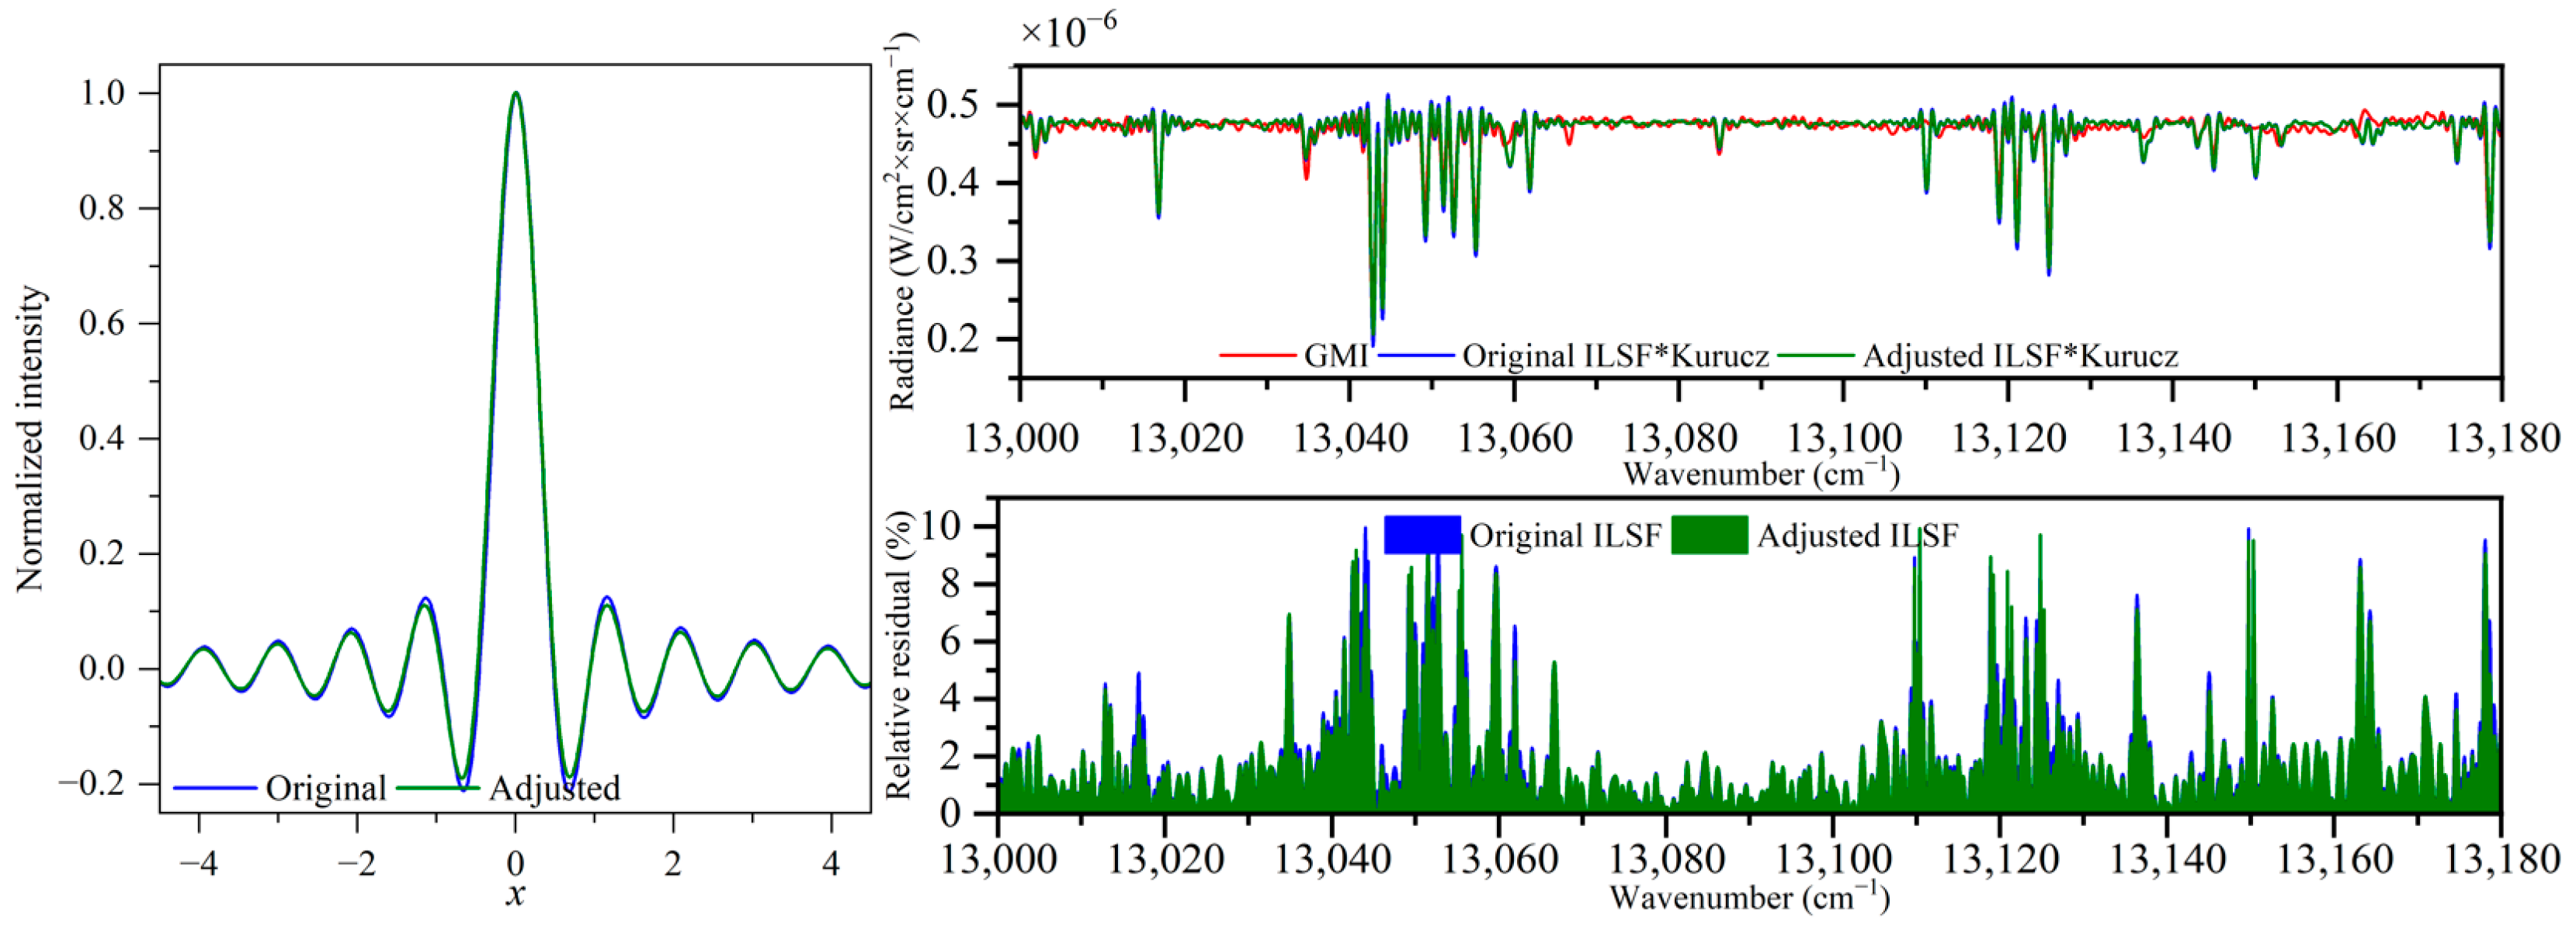
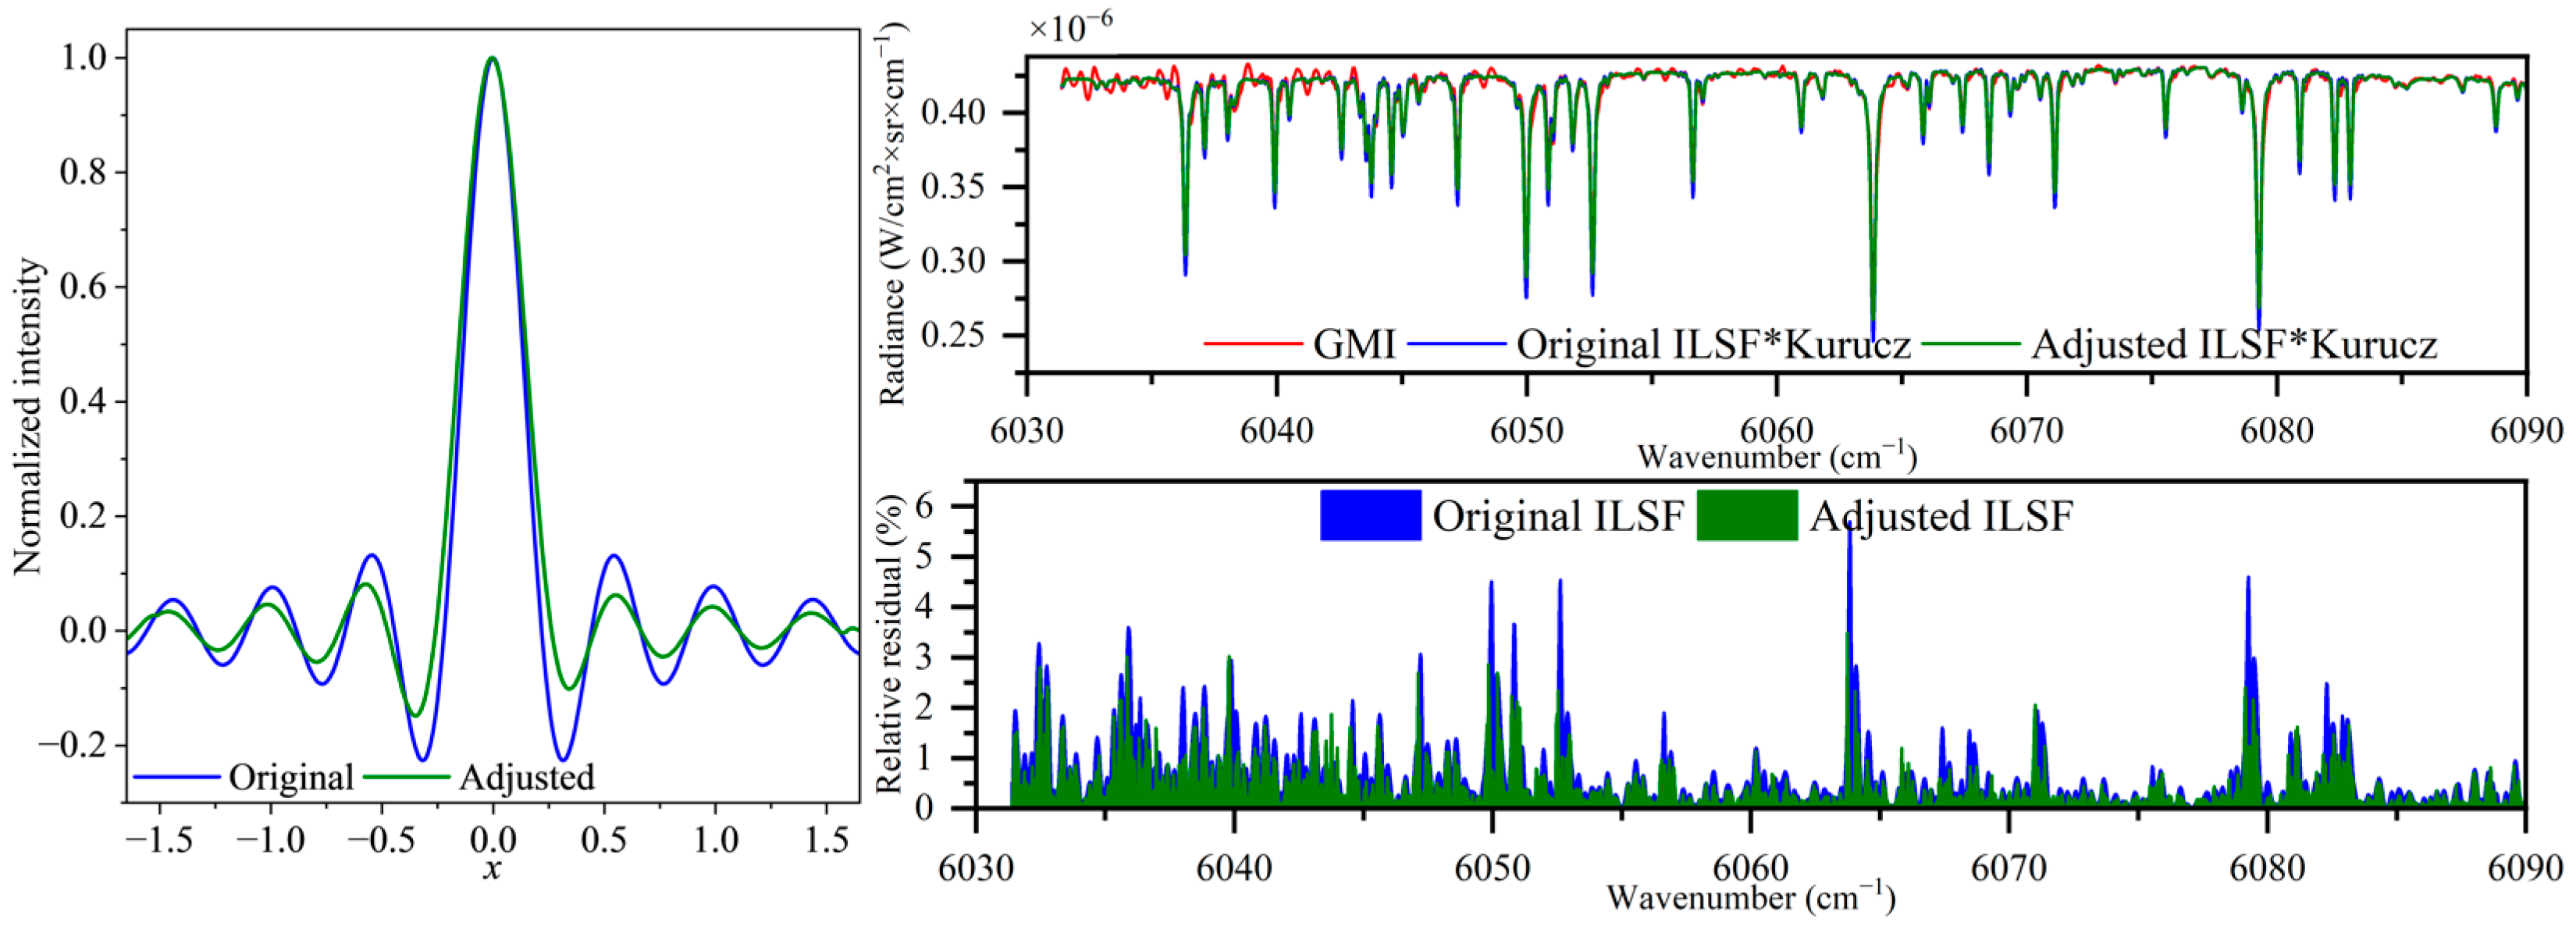
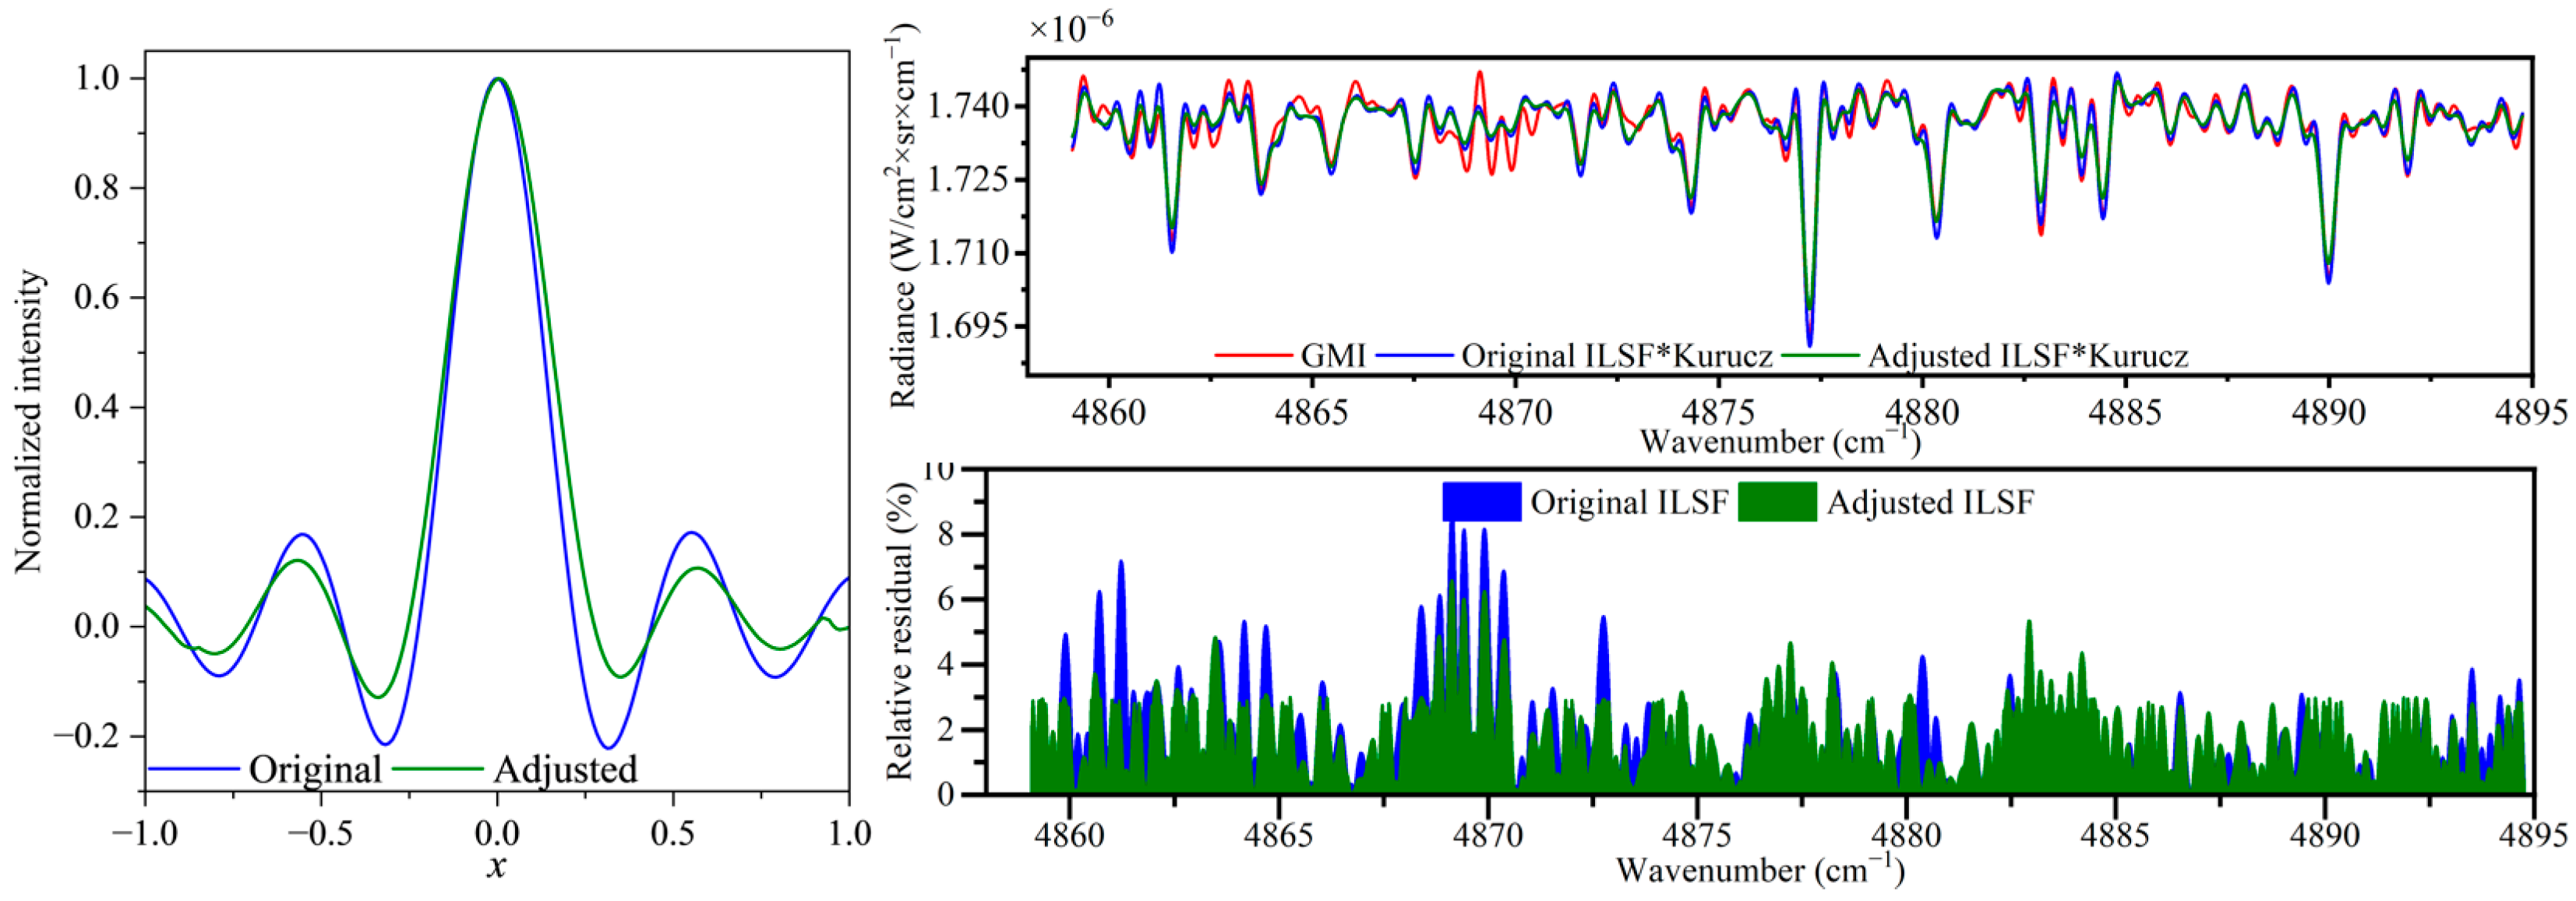
According to the algorithm in Section 4, the other three bands are corrected. As shown in the Figure 17, the ILSF oscillation of the O2 bands is reduced, but not obviously so, and the residuals before and after correction are also relatively close. Figure 18 shows the ILSF correction results for CH4 bands, which are relatively close to those of the CO2-1 bands. Figure 19 shows the ILSF correction results for the CO2-2 bands, where the ILSF changes are more pronounced, with a trend similar to the CO2-1 and CH4 bands. The ILSF of CO2-2 bands is broadened and the oscillation is reduced. However, the correction effect of the residuals before and after the ILSF correction for the CO2-2 bands is not significant. This may be due to the detector for these bands being greatly affected by temperature, which impacts the solar calibration data, as well as the inapplicability of the radiometric calibration coefficients. Currently, on-orbit absolute radiometric calibration is ongoing, and after its completion, the CO2-2 bands will be the focus of the analysis.

6. Conclusions

Based on the GMI, this study proposes a method to construct an ILSF error model function using Gaussian line shapes in order to monitor and update the ILSF. This addresses the challenges arising from instrument degradation and performance changes during the on-orbit period, preventing spectra from being measured by tunable lasers or standard gas with absorption characteristics. By combining the two main characteristics (modulation loss and phase error) of the ILSF, an ILSF functional model is constructed. The solar spectrum is not affected by aerosols and has the characteristics of independent solar Fraunhofer lines. The model parameters of the on-orbit ILSF are obtained by iterating the residuals of the measured solar spectrum and the theoretical reference solar spectrum of the spectrometer, and the update and supervision of the ILSF variations are completed to further improve the measurement accuracy of the spectrometer on orbit, thus verifying that the use of Gaussian line shapes to construct the ILSF error function has a good effect.
During the on-orbit period, the monitoring of changes in the updated ILSF provides a basis for subsequent research on the on-orbit parameter changes of the instrument. Additionally, the ILSF correction in this study was conducted under the assumption that the solar diffuser plate of the calibrator was not degraded, without considering the influence of the radiometric calibration results. Subsequent research on on-orbit radiometric calibration will further elaborate on the correction of ILSF variations.

Author Contributions

Conceptualization, H.S. and W.X.; Methodology, Y.H.; Software, H.Y. and Y.D.; Validation, Y.H., H.L., Z.L. and Y.D.; Formal analysis, C.L. and S.W.; Resources, X.W.; Data curation, C.H.; Writing—original draft, Y.H.; Writing—review & editing, H.S. and C.L.; Supervision, W.X.; Project administration, H.S.; Funding acquisition, H.S. All authors have read and agreed to the published version of the manuscript.

Funding

This research was funded by next-generation carbon satellite data receiving, processing and cloud service technology (2023YFB3907500) and construction of satellite-ground link indicator system and carbon monitoring planning guidance technology (2023YFB390751).

Data Availability Statement

Data underlying the results presented in this paper are not publicly available at this time but may be obtained from the authors upon reasonable request.

Acknowledgments

The authors thank all the co-workers in the research group for their help.

Conflicts of Interest

Author Chenhui Hou declares that he was employed by China Siwei Surveying and Mapping Technology Co., Ltd., during the conduct of this study. The author confirms that the research was conducted in the absence of any commercial or financial relationships that could be construed as a potential conflict of interest. The remaining authors declare that the research was conducted in the absence of any commercial or financial relationships that could be construed as a potential conflict of interest.

References

  1. Zhang, M.; Wen, Y.; Sun, L.; Li, Y. Overview and Application of GaoFen 5-02 Satellite. Aerosp. China 2022, 12, 9–15. [Google Scholar]
  2. Bruhwiler, L.; Basu, S.; Butler, J.H.; Chatterjee, A.; Dlugokencky, E.; Kenney, M.A.; McComiskey, A.; Montzka, S.A.; Stanitski, D. Observations of greenhouse gases as climate indicators. Clim. Chang. 2021, 165, 12. [Google Scholar] [CrossRef] [PubMed]
  3. Mao, J.; Kawa, S.R. Sensitivity studies for space-based measurement of atmospheric total column carbon dioxide by reflected sunlight. Appl. Opt. 2004, 43, 914–927. [Google Scholar] [CrossRef] [PubMed]
  4. Rayner, P.J.; O’Brien, D.M. The utility of remotely sensed CO2 concentration data in surface source inversions. Geophys. Res. Lett. 2001, 28, 175–178. [Google Scholar] [CrossRef]
  5. Harlander, J.M.; Roesler, F.L. Spatial heterodyne spectroscopy: A novel interferometric technique for ground-based and space astronomy. In Instrumentation in Astronomy VII; Proc. SPIE 1235; SPIE (Society of Photo-Optical Instrumentation Engineers): Tucson, AZ, USA, 1990. [Google Scholar] [CrossRef]
  6. Smith, B.W.; Harlander, J.M. Imaging spatial heterodyne spectroscopy: Theory and practice. In Infrared Technology and Applications XXV; Proc. SPIE 3698; SPIE (Society of Photo-Optical Instrumentation Engineers): Tucson, AZ, USA, 1999. [Google Scholar] [CrossRef]
  7. Hamazaki, T.; Kaneko, Y.; Kuze, A.; Kondo, K. Fourier transform spectrometer for Greenhouse Gases Observing Satellite (GOSAT). In Enabling Sensor and Platform Technologies for Spaceborne Remote Sensing; Proc. SPIE 5659; SPIE (Society of Photo-Optical Instrumentation Engineers): Tucson, AZ, USA, 2005. [Google Scholar] [CrossRef]
  8. Frankenberg, C.; Pollock, R.; Lee, R.A.M.; Rosenberg, R.; Blavier, J.-F.; Crisp, D.; O’Dell, C.W.; Osterman, G.B.; Roehl, C.; Wennberg, P.O.; et al. The Orbiting Carbon Observatory (OCO-2): Spectrometer performance evaluation using pre-launch direct sun measurements. Atmos. Meas. Tech. 2015, 8, 301–313. [Google Scholar] [CrossRef]
  9. Crisp, D.; Fisher, B.M.; O’Dell, C.; Frankenberg, C.; Basilio, R.; Bösch, H.; Brown, L.R.; Castano, R.; Connor, B.; Deutscher, N.M.; et al. The ACOS CO2 retrieval algorithm—Part II: Global XCO2 data characterization. Atmos. Meas. Tech. 2012, 5, 687–707. [Google Scholar] [CrossRef]
  10. Li, Z.; Xiong, W.; Shi, H.; Wang, X.; Ye, H.; Wei, Q.; Qiao, Y. Study on Laboratory Calibration of Spatial Heterodyne Spectrometer. Acta Opt. Sin. 2014, 34, 0430002. [Google Scholar]
  11. Xiong, W.; Shi, H.L.; Yu, N.H. Study on a new method for instrumental line shape measurement of spatial heterodyne interference spectrometer. Spectrosc. Spectr. Anal. 2015, 35, 267–271. [Google Scholar] [PubMed]
  12. Sun, K.; Liu, X.; Nowlan, C.R.; Cai, Z.; Chance, K.; Frankenberg, C.; Lee RA, M.; Pollock, R.; Rosenberg, R.; Crisp, D. Characterization of the OCO-2 instrument line shape functions using on-orbit solar measurements. Atmos. Meas. Tech. 2017, 10, 939–953. [Google Scholar] [CrossRef]
  13. Han, Y.; Shi, H.; Li, Z.; Luo, H.; Ding, Y.; Xiong, W.; Hu, Z. Greenhouse gas monitoring instrument on the GF-5 satellite-II: On-orbit spectral calibration. Appl. Opt. 2023, 62, 5839–5849. [Google Scholar] [CrossRef]
  14. Wu, J.; Wang, X.; Fang, Y.; Xiong, W.; Shi, H.; Qiao, Y. Abilitiy Analysis of Spatial Heterodyne Spectrometer in Atmospheric CO2 Detection. Acta Opt. Sin. 2011, 31, 0101001. [Google Scholar]
  15. Genest, J.; Tremblay, P. Instrument Line Shape of Fourier Transform Spectrometers: Analytic Solutions for Nonuniformly Illuminated Off-axis Detectors. Appl. Opt. 1999, 38, 5438–5446. [Google Scholar] [CrossRef] [PubMed]
  16. Atkinson, N.C.; Wilson, S.H.S. Measurement of interferometer instrument line shape. In Remote Sensing—A Scientific Vision for Sustainable Development, Proceedings of the IGARSS’97. 1997 IEEE International Geoscience and Remote Sensing Symposium Proceedings, Singapore, 3–8 August 1997; IEEE: Singapore, 1997; Volume 4, pp. 2011–2014. [Google Scholar] [CrossRef]
  17. Xiong, W. Hyperspectral Greenhouse Gases Monitor Instrument (GMI) for Spaceborne Payload. Spacecr. Recovery Remote Sens. 2018, 39, 14–24. [Google Scholar]
  18. Gero, P.J.; Dykema, J.A.; Anderson, J.G.; Leroy, S.S. On-orbit Characterization of Blackbody Emissivity and Spectrometer Instrument Line Shape Using Quantum Cascade Laser Based Reflectometry. In Proceedings of the SPIE—Earth Observing Systems XIII, San Diego, CA, USA, 11–13 August 2008; SPIE: San Diego, CA, USA, 2008; Volume 7081. [Google Scholar]
  19. Shiomi, K.; Kina, T.; Kawakami, S.; Mitomi, Y.; Yoshida, M.; Higuchi, R.; Sekio, N.; Kataoka, F. Status of GOSAT Post-launch Calibration. In Proceedings of the ESA Atmospheric Science Conference 2009, Barcelona, Spain, 7–11 September 2009. [Google Scholar]
  20. Shiomi, K.; Kina, T.; Kawakami, S.; Takeshima, T. Calibration of operational GOSAT Level 1 products. In Sensors, Systems, and Next-Generation Satellites XIV; Proc. SPIE 7826; SPIE (Society of Photo-Optical Instrumentation Engineers): Toulouse, France, 2010; p. 782605. [Google Scholar] [CrossRef]
  21. Lin, C.L.; Wang, Y.M.; Zheng, Y.Q. Preflight Spectral Calibration of Hyperspectral Carbon Dioxide Spectrometer of TanSat. Opt. Precis. Eng. 2017, 25, 2064–2075. [Google Scholar]
  22. Harlander, J.M. Spatial Heterodyne Spectroscopy: Interferometric Performance at Any Wavelength without Scanning. Ph.D. Thesis, University of Wisconsin, Madison, WI, USA, 1991; p. 0903. [Google Scholar]
  23. Li, B.; Li, M.; Xu, P. High Precision On-board Calibration for Spaceborne Atmospheric Monitoring Spectrometer. Spacecr. Recovery Remote Sens. 2018, 39, 60–69. [Google Scholar] [CrossRef]
  24. Chamberlain, J. The Principles of Interferometric Spectroscopy; Wiley: New York, NY, USA, 1979. [Google Scholar]
  25. Xu, Q.; Zheng, X.; Zhang, W.; Wang, X. Advanced Calibration Method for Sun Radiometers. Acta Opt. Sin. 2010, 30, 1337. [Google Scholar]
  26. Zhai, W.; Li, J.; Zheng, X.; Li, Z.; Meng, B.; Zhang, W.; Wang, X. Research on Method of Calibrating Sun Channels of Sun Radiometers. Acta Opt. Sin. 2012, 32, 0412004. [Google Scholar] [CrossRef]
  27. Li, Z.; Xiong, W.; Luo, H.; Qiao, Y. Study on Asymmetric Spatial Heterodyne Spectroccopy. Spectrosc. Spectr. Anal. 2016, 36, 2291–2295. [Google Scholar]
  28. Shen, J.; Xiong, W.; Shi, H.; Luo, H.; Li, Z.; Hu, G.; Fang, X.; Xu, B. Absolute Phase Drift Analysis and Correction of Asymmetric Spatial Heterodyne Interferometer for Wind Detection. Acta Opt. Sin. 2017, 37, 0430003. [Google Scholar] [CrossRef]
  29. Swinehart, D.F. The Beer-Lambert Law. J. Chem. Educ. 1962, 39, 333. [Google Scholar] [CrossRef]
  30. Kenneth Rideout, M.S. Barron’s AP Physics; Barron’s Educational Series: Hauppauge, NY, USA, 2015; p. 313. [Google Scholar]
  31. Gordon, I.; Rothman, L.; Hargreaves, R.; Hashemi, R.; Karlovets, E.; Skinner, F.; Conway, E.; Hill, C.; Kochanov, R.; Tan, Y.; et al. The HITRAN2020 molecular spectroscopic database. J. Quant. Spectrosc. Radiat. Transf. 2022, 277, 107949. [Google Scholar] [CrossRef]
  32. Kurucz, R.L.; Furenlid, I.; Brault, J.; Testerman, L. Solar Flux Atlas from 296 to 1300 nm, National Solar Observatory, Sunspot, New Mexico, 1984. Available online: http://kurucz.harvard.edu/sun/fluxatlas/ (accessed on 11 June 2024).
  33. Meroni, M.; Busetto, L.; Guanter, L.; Cogliati, S.; Crosta, G.F.; Migliavacca, M.; Panigada, C.; Rossini, M.; Colombo, R. Characterization of fine resolution field spectrometers using solar Fraunhofer lines and atmospheric absorption features. Appl. Opt. 2010, 49, 2858–2871. [Google Scholar] [CrossRef]
  34. Chateauneuf, F.J.; Fortin, S.Y.; Buijs, H.L.; Soucy, M.-A.A. On-orbit performance of the ACE-FTS instrument. In Earth Observing Systems IX; Proc. SPIE 5542; SPIE: Denver, CO, USA, 2004. [Google Scholar] [CrossRef]
  35. Kostkowski, H.J.; Bass, A.M. Slit Function Effects in the Direct Measurement of Absorption Line Half-Widths and Intensities*†. J. Opt. Soc. Am. 1956, 46, 1060–1064. [Google Scholar] [CrossRef]
  36. Wang, J.; Ye, H.; Yi, W.; Chen, Z.; Fang, X.; Du, L. Research on the method of updating instrument line shape function of on-orbit Fourier ultrahigh resolution spectrometer. J. Infrared Millim. Waves 2018, 37, 613. [Google Scholar]
  37. Ye, S.; Xiong, W.; Qiao, Y.; Hong, J.; Fang, Y. Data Processing for Interferogram of Spatial Heterodyne Spectrometer. Spectrosc. Spectr. Anal. 2009, 29, 848–852. [Google Scholar]
  38. Luo, H.; Ye, Q.; Xiong, W.; Li, Z.; Li, S.; Shi, H. Study on the interferogram modulation efficiency of Spatial Heterodyne Spectrometer. Acta Opt. Sin. 2016, 36, 0712003. [Google Scholar]
  39. Genest, J.; Tremblay, P. Impact of the optical aberrations on the line shape of Fourier-transform spectrometers. Vib. Spectrosc. 2002, 29, 3–13. [Google Scholar] [CrossRef]
  40. Jozwicki, R.; Kosycarz, M. Influence of optical aberrations on the accuracy of Fourier transform infrared spectrometer. In Proceedings of the Tenth Polish-Czech-Slovak Optical Conference: Wave and Quantum Aspects of Contemporary Optics, Karpacz, Poland, 16–20 September 1996; Proc. SPIE 3320. SPIE: Karpacz, Poland, 1998. [Google Scholar] [CrossRef]
  41. Wawrzyniuk, L. Influence of collimator aberrations on the instrument line shape of a Fourier transform spectrometer. Appl. Opt. 2021, 60, 8792–8801. [Google Scholar] [CrossRef] [PubMed]
  42. Liu, D.; Huang, Y.; Cao, Z.; Lu, X.; Liu, X. The Influence of Instrumental Line Shape Degradation on Gas Retrievals and Observation of Greenhouse Gases in Maoming, China. Atmosphere 2021, 12, 863. [Google Scholar] [CrossRef]
  43. Chance, K.; Kurucz, R.L. An improved high-resolution solar reference spectrum for earth’s atmosphere measurements in the ultraviolet, visible, and near infrared. J. Quant. Spectrosc. Radiat. Transf. 2010, 111, 1289–1295. [Google Scholar] [CrossRef]
  44. Smith, G.W. Modulation Effects in Magnetic Resonance: Widths and Amplitudes for Lorentzian and Gaussian Lines. J. Appl. Phys. 1964, 35, 1217–1221. [Google Scholar] [CrossRef]
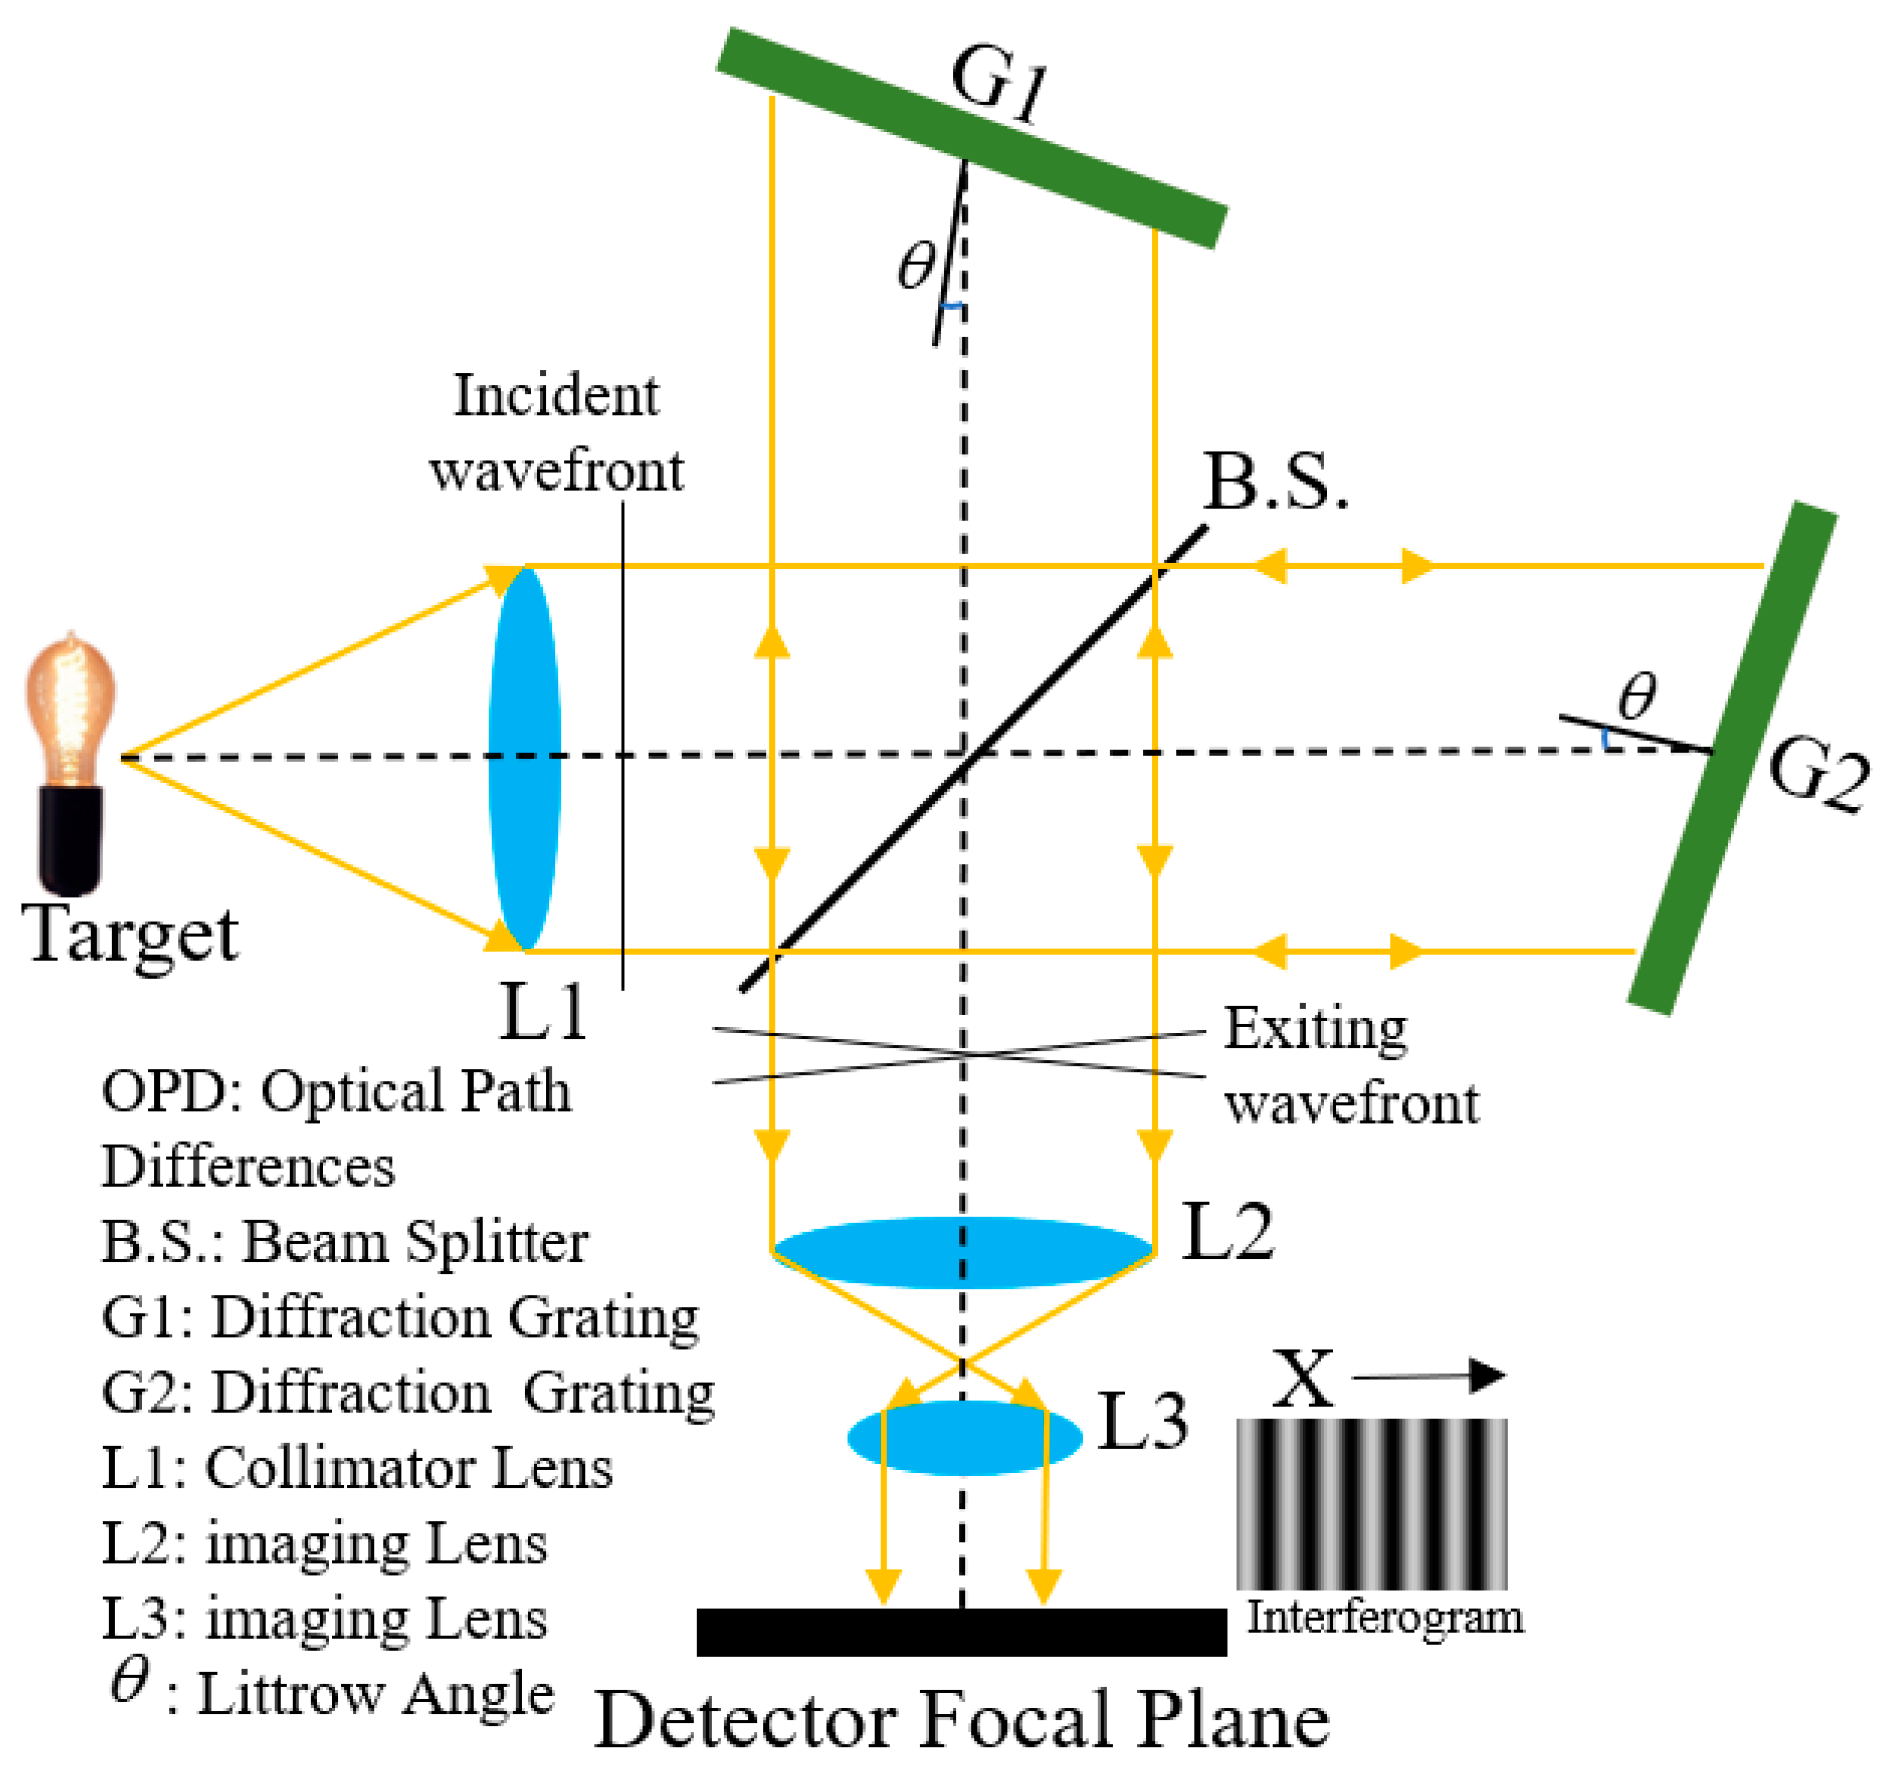
Figure 1. Principle of spatial heterodyne spectrometer.
Remotesensing 16 02171 g001
Figure 2. Theoretical results for the ILSF.
Remotesensing 16 02171 g002
Figure 3. Monochromatic light measurement results. (a) Interferogram of 6349.21 cm−1 after preliminary processing; (b) recovered spectrum of interferogram after zero-filling.
Remotesensing 16 02171 g003
Figure 4. The ILSF measurement results. (a) ILSF versus wavenumber; (b) the mean of ILSF.
Remotesensing 16 02171 g004
Figure 5. Experimental equipment of atmospheric environment simulation calibration chamber [23].
Remotesensing 16 02171 g005
Figure 6. The absorption spectrum experimental data results in the CO2-1 bands.
Remotesensing 16 02171 g006
Figure 7. Schematic diagram of the GMI on-orbit calibration. (a) Calibration equipment; (b) calibration optical path; (c) calibrator door-blocking structure.
Remotesensing 16 02171 g007
Figure 8. The spectral line distribution of Kurucz solar spectrum in the CO2-1 bands.
Remotesensing 16 02171 g008
Figure 9. The GMI on-orbit calibration data processing flowchart.
Remotesensing 16 02171 g009
Figure 10. The GMI payload first on-orbit calibration interferogram. (a) Interferogram; (b) single-row interferogram.
Remotesensing 16 02171 g010
Figure 11. Solar spectrum in CO2-1 bands.
Remotesensing 16 02171 g011
Figure 12. Flow chart of ILSF characterization.
Remotesensing 16 02171 g012
Figure 13. The initial solar calibration data of GMI near the CO2-1 bands (11 October 2021).
Remotesensing 16 02171 g013
Figure 14. The GMI payload pre-launch and on-orbit-adjusted ILSF (blue curve: lab measurements; green curve: the ILSF after on-orbit update).
Remotesensing 16 02171 g014
Figure 15. Comparison results of measured and reference solar spectral characteristics in the CO2-1 bands after ILSF correction.
Remotesensing 16 02171 g015
Figure 16. The nadir observation spectrum in the CO2-1 bands after the ILSF update. (a) Theoretical spectrum convolution of initial ILSF and measured spectrum. (b) Theoretical spectrum convolution of iterative ILSF and measured spectrum. (c) Spectral residuals prior to the emission and the on-orbit-adjusted ILSF. (d) Residuals distribution.
Remotesensing 16 02171 g016
Figure 17. ILSF correction results for O2 (0.759–0.769 μm) bands.
Remotesensing 16 02171 g017
Figure 18. ILSF correction results for CH4 (1.642–1.658 μm) bands.
Remotesensing 16 02171 g018
Figure 19. ILSF correction results for CO2-2 (2.043–2.058 μm) bands.
Remotesensing 16 02171 g019
Table 1. Main technical indicators of the GMI.
ParametersTechnical Indicators
O2CO2-1CH4CO2-2
Central Wavelength/μm0.7651.5751.652.05
Spectral Range/μm0.765~0.7691.568~1.5831.642~1.6582.043~2.058
Spectral Resolution/cm−10.60.270.270.27
SNR (Albedo = 0.3; Sun Elevation = 30°)300250
Radiometric Calibration Absolute Accuracy: 5%; Relative Accuracy: 2%
Field of View (FOV)14.6 mrad (10.3 km@705 km)
Observation ModeNadir Observation Mode: 1, 5, 7, 9 Points (Default 5 Points)
Solar Observation Mode: Calibration Observation
Disclaimer/Publisher’s Note: The statements, opinions and data contained in all publications are solely those of the individual author(s) and contributor(s) and not of MDPI and/or the editor(s). MDPI and/or the editor(s) disclaim responsibility for any injury to people or property resulting from any ideas, methods, instructions or products referred to in the content.