Article

VALNet: Vision-Based Autonomous Landing with Airport Runway Instance Segmentation

1
Department of Electrics and Information Engineering, Beihang University, Beijing 100191, China
2
UAV Industry Academy, Chengdu Aeronautic Polytechnic, Chengdu 610100, China
*
Author to whom correspondence should be addressed.
Remote Sens. 2024, 16(12), 2161; https://doi.org/10.3390/rs16122161
Submission received: 21 April 2024 / Revised: 10 June 2024 / Accepted: 12 June 2024 / Published: 14 June 2024

Abstract

:
Visual navigation, characterized by its autonomous capabilities, cost effectiveness, and robust resistance to interference, serves as the foundation for vision-based autonomous landing systems. These systems rely heavily on runway instance segmentation, which accurately divides runway areas and provides precise information for unmanned aerial vehicle (UAV) navigation. However, current research primarily focuses on runway detection but lacks relevant runway instance segmentation datasets. To address this research gap, we created the Runway Landing Dataset (RLD), a benchmark dataset that focuses on runway instance segmentation mainly based on X-Plane. To overcome the challenges of large-scale changes and input image angle differences in runway instance segmentation tasks, we propose a vision-based autonomous landing segmentation network (VALNet) that uses band-pass filters, where a Context Enhancement Module (CEM) guides the model to learn adaptive “band” information through heatmaps, while an Orientation Adaptation Module (OAM) of a triple-channel architecture to fully utilize rotation information enhances the model’s ability to capture input image rotation transformations. Extensive experiments on RLD demonstrate that the new method has significantly improved performance. The visualization results further confirm the effectiveness and interpretability of VALNet in the face of large-scale changes and angle differences. This research not only advances the development of runway instance segmentation but also highlights the potential application value of VALNet in vision-based autonomous landing systems. Additionally, RLD is publicly available.

Graphical Abstract

1. Introduction

Aircraft flight encompass stages of taking off, climbing, cruising, descending, approaching, and landing [1,2,3], where most intricacy and uncertainty occur during approaching and landing. A successful landing requires appropriate pitch angles and descending rate. The aircraft’s flight path is supposed to be aligned with the runway centerline and go across designated landing points [4]. According to the latest Commercial Aviation Accident Statistical Analysis Report by Airbus, the majority of fatal flight accidents (covering all commercial jet transport aircraft with a passenger capacity exceeding 40 people) over the past two decades have occurred during approaching and landing [5]. For fixed-wing UAV, which is extensively used in military and many industries, although the accident rates lack public data, comparison to manned aircraft shows that the autonomous landing UAV experiences more risks caused by factors such as wind speed, complex meteorological conditions, terrain variations, and the absence of a human in the loop (HIL) in particular [6].
To enhance the safety and performance of aircraft, continuously improved automation in the modern aviation industry mitigates cognitive and fatigue risks for pilots and UAV operators. Common examples of auto landing systems include the instrument landing system (ILS) [7], precision approach radar (PAR) [8], and onboard landing guidance system (OLGS) [9], all providing guidance on lateral and vertical directions based on radio signals. But the high costs of deployment and maintenance make the systems only suitable for extremely adverse weather conditions. Factors such as wartime and complex electromagnetic environments also impose limitations on the systems. Visual navigation, characterized by its autonomous capabilities, cost effectiveness, and robust resistance to interference, serves as the foundation for vision-based autonomous landing systems. Fortunately, another solution is provided by advancements in computer vision and onboard embedded technology, which have made vision-based autonomous landing systems a focal point in current research for UAVs and civil aircraft. This technology brings with it a myriad of advantages, including low cost, interference resistance, high adaptability, and easy deployment. The integration of these advancements further solidifies the prominence of vision-based autonomous landing systems in the contemporary landscape of research and development for unmanned aerial vehicles and civil aircraft.
After years of exploration, vision-based autonomous landing has been successfully applied to rotary-wing aircraft such as unmanned helicopter drone and small multi-rotor UAV [10]. But for fixed-wing UAV, its airframe structure and natural principles make it unable to hover above and descend onto a landing point like a rotary-wing aircraft. Especially for large fixed-wing UAVs and commercial aircraft, its high speed, significant mass, and large turning radius heavily require low error rate during landing, along with more stringent performance requirements for achieving reliable, precise, and robust vision-based autonomous landings. For fixed-wing UAV, the landing posture relative to the runway is determined by the aiming point distance (which is the distance between the aircraft’s nose projection onto the runway centerline and the aiming point), the lateral path angle, the vertical path angle, and the aircraft’s Euler angles (pitch, roll, and yaw) as illustrated in Figure 1. Two parts critical in the vision-based landing system are relative pose estimation and runway instance segmentation. The former monitors the aircraft’s real-time position and direction to the runway, which facilitates timely adjustments. And the latter identifies the landing area accurately, thus minimizing risks during landing and ensuring safety. Note that, in addition to visual information for relative pose estimation, the integration of onboard inertial measurement units (IMUs) and other sensors also provide estimation of the aircraft’s attitude.
A reliable onboard-applicable vision-based autonomous landing system primarily accomplishes runway detection, runway instance segmentation, and autonomous landing control, where the intermediate step of runway segmentation is indispensable [11]. By performing pixel-level classification of runway markings, precise delineation of the runway area can be achieved [12]. This provides more accurate information for UAV navigation, allowing the observation of factors such as the alignment of the aircraft with the runway centerline, the size of corner points, and the reasonableness of the current glide angle. When combined with onboard inertial navigation sensors, the information allows further control of the UAV during the approaching and landing, improving the safety of UAV landings significantly especially in electromagnetic warfare environments [13].
Existing methods for runway segmentation can be categorized into traditional segmentation and segmentation by deep learning. Traditional runway instance segmentation methods primarily rely on recognizing the texture features, line segments, or shape features of the runway but face challenges in adapting to complex scenes of confounding objects such as dams and bridges, being unable to distinguish between multiple runways within an airport [14,15,16]. Recent studies by Yan et al. have introduced novel methodologies across various domains in multimedia computing and computer vision [17,18,19,20,21]. Consequently, the accuracy of traditional methods falls short of fully automated landing requirements.
Compared to traditional methods, deep learning-based runway segmentation approaches have demonstrated excellent generalization and accuracy in detection and segmentation [22]. Typical methods include convolutional neural networks (CNNs), fully convolutional networks (FCNs) [23], and advanced architectures like U-Net [24] and Mask R-CNN [25]. These methods leverage hierarchical feature extraction and end-to-end learning to effectively capture the complex patterns and features of runway images [26]. However, they also face three main challenges that need to be addressed to achieve reliable runway segmentation for autonomous landing:
  • Dataset Quality and Scale: The specificity of this domain means that existing datasets often lack the quality and scale required for robust training and evaluation of deep learning models [14]. There is an urgent need for a large-scale, high-quality, publicly available dataset focused on runway segmentation during the landing phase.
  • Handling Scale Variations: As UAVs approach the runway, the scale of narrow runway targets varies significantly [27]. Effective runway segmentation schemes must handle a wide range of visual information, from distant global scenes to nearby texture features, ensuring accurate visual guidance throughout the entire landing phase.
  • Adapting to Orientation Changes: During the landing process, the aircraft’s direction changes, causing the runway’s orientation to rotate in the images [28]. This diminishes the effectiveness of runway segmentation and impacts the accuracy of the aircraft’s attitude estimation. Models need to accommodate potential directional variations to maintain robustness and precision in various weather conditions and complex backgrounds.
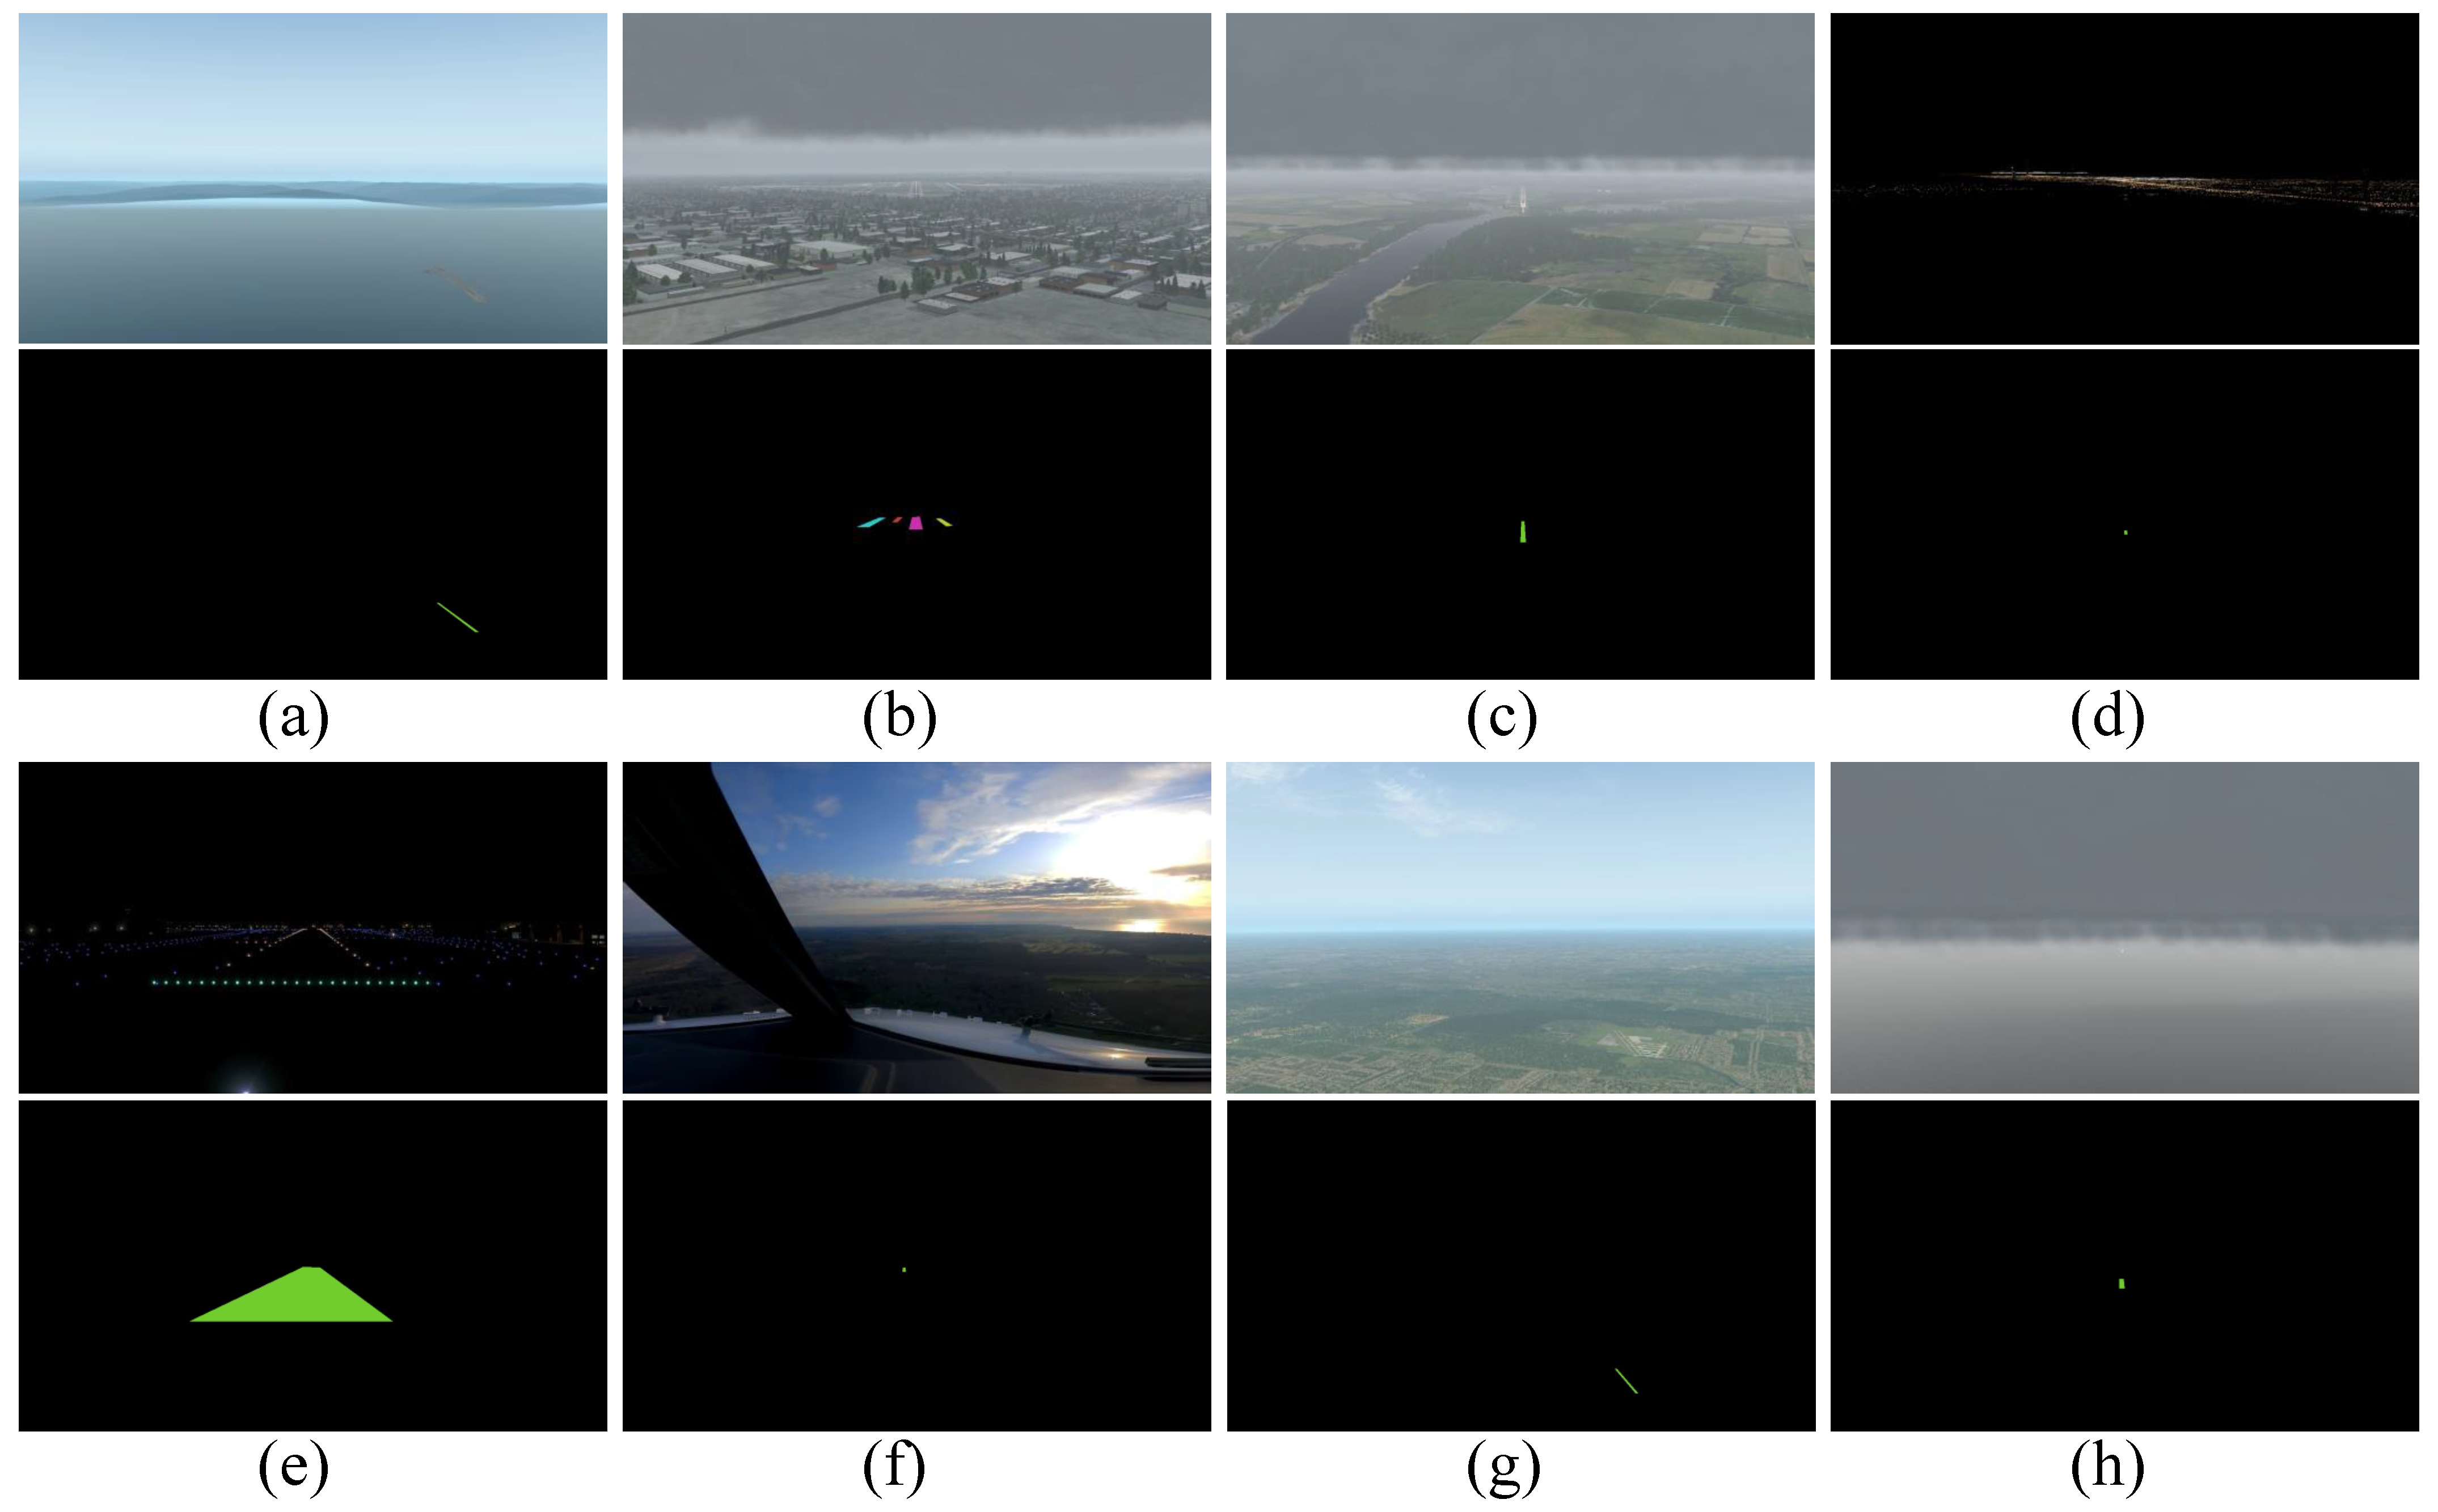
To address these challenges, we introduce the Runway Landing Dataset (RLD), designed to alleviate the deficiency of large-scale, high-quality, publicly available datasets for runway segmentation in the visual guidance of a fixed-wing aircraft’s landing. RLD simulates complex real-world scenarios by providing data under diverse weather conditions and geographical environments, covering landing processes at thirty airports worldwide, with a total of 12,239 images sourced from X-Plane 11. RLD stands out for the following reasons: it offers the largest number of images, covers entire landing scenarios, includes various weather conditions (such as (a) sunny, (b) cloudy, (c) foggy, and (d) night in Figure 2), and spans diverse geographical environments across six continents. This dataset enables researchers to assess the generality and robustness of algorithms under different conditions and provides a strong foundation for tackling challenges in visual guidance.
Moreover, we propose a dual strategy to address scale and aspect ratio variations during autonomous landing. Firstly, we introduce the Asymptotic Feature Pyramid Network (AFPN) to ensure accurate runway segmentation as the aircraft approaches and descends onto the runway. AFPN progressively integrates low-level and high-level features, effectively mitigating substantial semantic differences between adjacent layers, thus addressing issues such as the great scale differences shown in Figure 2e,f. Secondly, CEM based on the concept of band-pass filtering is implemented to highlight texture features in images, adapt the model to complex scenarios and large-scale variations (as shown in Figure 2g,h), and improve the perception of runway textures and segmentation performance.
Finally, to handle challenges of various angular differences and ranges in images caused by the aircraft’s changing flying posture when landing, such as significant maneuvers, OAM is devised to provide the model with more comprehensive rotational invariance. The module fuses information from multiple rotation angles, enhancing the model’s robustness in accurately capturing the relative position and posture between the aircraft and the runway in different orientations. This approach significantly improves the safety and precision of the autonomous landing system under complex environments.
The main contributions of this paper are as follows:
  • A large-scale, high-quality, publicly available landing segmentation dataset, RLD (Runway Landing Dataset), is proposed. It comprises data of autonomous runway landing images in thirty airports worldwide under various weather and geographical scenarios simulating the real and complex world.
  • To address significantly various scales during autonomous landing and meet the precision requirements of runway segmentation, a dual strategy is proposed: AFPN allows highly precise instance segmentation in the model as the aircraft approaches the runway, and CEM based on band-pass filtering improves the model’s adaptability to complex scenes and large-scale variations and effective usage of contextual information, and ultimately enhances the performance of runway segmentation.
  • OAM is innovatively designed with a three-channel structure. The introduced module significantly improves the model’s rotational invariance in complex situations, even when large angular changes occur. The design notably enhances the model’s adaptability to changes in the runway direction, which is a substantial contribution to the reliability and performance improvement in autonomous landing systems in various complex environments.

2. Related Works

2.1. Instance Segmentation

Instance segmentation, the core in computer vision, aims to precisely identify and segment each independent object instance in an image. With the advancement of deep learning in recent years, instance segmentation based on neural networks has made significant breakthroughs, despite facing a series of notable challenges, including but not limited to small object segmentation, geometric transformation, obscured object identification, and segmentation in degraded image. Overcoming these challenges will propel instance segmentation to be more comprehensive and robust for various real-world scenarios. Instance segmentation methods based on two-stage deep learning are usually categorized into two major types of technology: bottom–up methods based on semantic segmentation, and top–down methods based on detection. Bottom–up instance segmentation methods perform pixel-level semantic segmentation before distinguishing different instances by clustering, metric learning [29,30,31], etc., while top–down instance segmentation methods locate the instance (bounding box) by object detection before semantic segmentation in the box, with each result treated as an independent output. Relevant models include FCIS [32], Mask-RCNN [25], TensorMask [29,33], DeepMask [34], PANet [35], and Mask Scoring R-CNN [36].
For single-stage instance segmentation, inspired by research in single-stage object detection, two main approaches have emerged. One approach is inspired by one-stage, anchor-based detection models (such as the YOLO series [37,38,39,40,41,42,43,44,45,46,47] and RetinaNet [48]), with representative works like YOLACT [49,50] and SOLO [51,52]. The other approach is inspired by anchor-free detection models (such as FCOS [53]), with typical representatives including PolarMask [54,55] and AdaptIS [56]. All these methods demonstrate outstanding performance of instance segmentation in various scenarios.

2.2. Vision-Based Runway Segmentation

The instance segmentation of airport runway primarily focuses on the precise identification and segmentation of airport runways during landing [57,58,59], with current research predominantly centering on overcoming large-scale variations and complex backgrounds and improving segmentation accuracy. Existing runway segmentation methods can be categorized into traditional and deep learning approaches [60,61,62,63,64,65]. Traditional methods rely heavily on the feature recognition of runway textures, line segments, or shapes. While these methods demonstrate certain effectiveness in specific scenarios, their adaptability to complex scenes with confounding objects such as dams and bridges is limited. Their constrained ability to distinguish among multiple landable runways in one airport restricts the accuracy from meeting the practical requirements of automated landing.
Fortunately, runway segmentation methods based on deep learning show robust generalization and high precision in their performance of detection and segmentation. As mentioned in the references, a precise runway detection method based on YOLOv5 is proposed in [26], a benchmark for airport detection using Sentinel-1 SAR (Synthetic Aperture Radar) is introduced in [66], and several detection approaches based on deep learning principles are presented in [14,67,68,69]. Presently, only private aviation companies are endeavoring to research deep learning solutions of runway detection by forward-facing cameras located on the aircraft’s nose or wings, which has achieved notable success in vision-based autonomous landing systems such as the capabilities of the autonomous taxiing, taking off, and landing of Airbus [70] and the Daedalean project [71]. These advanced methods demonstrate enhanced adaptability to runway features across varying observing distances and significant achievements to address challenges such as differences in aspect ratios, lighting conditions, and noise at the same time. These methods contribute valuable experiences and insights to the field of airport runway instance segmentation.
According to our research, no image datasets of runway segmentation of real-world landing have been discovered. Given the considerations of safety and sensitivity in aviation, flight simulators emerge as a low-cost alternative. Some studies use Flight Gear [14,67,72,73], while BARS chose X-Plane for data collection. Alternative methods collect image data directly from satellites [14,67] and, like the Runway Dataset [72], from UAVs. However, none of the datasets provide simulation of a complete landing and are public. Thus, to fill the emptiness, our work aims to present a more comprehensive, authentic, and accessible dataset for runway segmentation.

3. Runway Landing Dataset

To advance research in instance segmentation of airport runways, a novel dataset is introduced, known as RLD. It aims to facilitate the study and performance evaluation of visual guidance systems by providing a large-scale, diverse, and high-quality image collection of airport runways.
A detailed overview of the sources and annotation process of RLD is provided here. Additionally, a comprehensive analysis of RLD is conducted from various perspectives, such as data collection, annotation, size, aspect ratios, and global distribution. The RLD dataset is divided into 9791 training images, 1223 validation images, and 1225 testing images.

3.1. Image Collection of RLD

Flight simulators have become an economically viable option for simulating various flight scenarios and training due to constraints related to safety and sensitivity in the aviation domain. It not only reduces costs but also provides a safe and controlled environment. The majority of images come from a flight simulator certified by the Federal Aviation Administration (FAA)—X-Plane 11, which is favored by both aviation enthusiasts and professional pilots for its highly realistic flight simulation and open plugin architecture. It features high realism, global scenery, and real-time weather simulation.
Data collected from X-Plane 11 allow RLD to cover a variety of terrains (runways in cities, villages, grasslands, mountains, oceans, etc.) and weather conditions (sunny, cloudy, foggy, night, etc.), and thus ensure that RLD can capture the rich features of different airport runways from the perspective of aerial front view and simulate a variety of landing scenes in the real world.
Moreover, some images are collected from YouTube videos of the full landing process of civil aviation aircraft based on front cameras. Despite some unrelated information, they help to enhance and supplement the authenticity of RLD to a certain extent; the perspectives obtained from actual flight inject more real-world elements into the dataset, making it closer to actual flight scenarios.
As shown in Table 1, RLD contains 12,239 images of 1280 × 720 pixels. It not only simulates the entire landing process but is also publicly available.

3.2. Annotation Method

For precision, the images are annotated by labelme https://github.com/labelmeai/labelme (accessed on 1 January 2024). It depicts each runway image instance with key features such as runway edges, shapes, and positions. By the systematic and detailed annotation process, a high-quality instance segmentation set comes into being, providing reliable and comprehensive basic data for subsequent research on airport runway instance segmentation.
Several examples of annotated images of RLD shown in Figure 3 illustrate different weather conditions (such as sunny, cloudy, foggy, and night) in row (a), different geographical environments (such as oceans, jungles, mountains, and plains) in row (b), different scenes (such as deserts, cities, villages, and cockpit views) in row (c), entire landing processes (from far to near, from high to low, and from the air to the ground) in row (d), and diverse styles of runways (single and multiple) in row (e).

3.3. Various Sizes of Runways

The RLD covers full stages of the landing processes, which inevitably results in a variety of runway instance sizes. To comprehensively evaluate the model’s adaptability and segmentation performance on runways of different sizes, a detailed statistical analysis of runway areas is conducted. We used the definitions of small, medium, and large target sizes in MS COCO to classify the runway areas: small targets represent pixel sizes between 0 and 1024 (32 × 32) pixels, medium targets represent pixel sizes between 1025 and 9216 (96 × 96) pixels, and large targets represent pixel sizes greater than 9216 pixels. This detailed analysis will provide a deeper understanding of the model’s adaptability to runways of different sizes and offer substantial guidance for further algorithm optimization.
The specific statistical results are shown in Table 2. It is worth noting that small targets account for 52.5% of the total, posing a considerable challenge for the existing segmentation method.

3.4. Various Aspect Ratios of Ruwanys

The aspect ratio of targets is crucial for the performance of segmentation models because stretching targets in one direction may lead to the loss of crucial features, especially for elongated targets. Additionally, elongated objects may interfere with the model, resulting in the omission and misidentification of runways, which can ultimately result in the loss of runway targets for the aircraft. A detailed statistical analysis of the aspect ratios is conducted on all the instances in RLD, and the results are shown in Table 3. Specifically, 24.4% of the runway targets in RLD have a large aspect ratio, while 25.9% of the targets have a small aspect ratio. Such a distribution of aspect ratios significantly impacts the effectiveness of segmentation models, and needs to be fully considered in the algorithm design. This in-depth analysis gives a better understanding of the characteristics of the dataset and a targeted guidance for model optimizing.
Since aspect ratios are calculated after the calculation of bounding boxes and the actual runway directions exhibit diversity, it inevitably leads to significant differences between the aspect ratios of instances and of bounding boxes. To more accurately reflect this issue, statistics of the ratios of the runway areas to the bounding box areas are obtained from the instances. As shown in Table 4, the runway area takes more than 50% of the bounding box area for 77% of the instances, while for only 19% of the instances, the runway area takes less than 25% of the bounding box area. This further confirms the statistics presented in Table 3. A thorough understanding of these subtle differences helps to assess the robustness and adaptability of the segmentation model more comprehensively.

3.5. Global Distribution of Landing Runways

As shown in Figure 4, the worldwide distribution of landing runways takes airports in different countries and regions into consideration to ensure the geographic diversity and global generalization of RLD. The global distributed images reflect a wide range of geographic features and thus help to evaluate the robustness and adaptability of the instance segmentation model.

4. Method

To address the challenges in the field of vision-based autonomous landing, VALNet is proposed to tackle two main issues in visual guidance landing tasks. Built upon the fundamental framework of YOLOv8 [47], VALNet mainly consists of the CEM, Asymptotic Feature Pyramid Network (AFPN), and OAM.

4.1. Overall Structure of the Network

4.1.1. Overview of YOLOv8-Seg

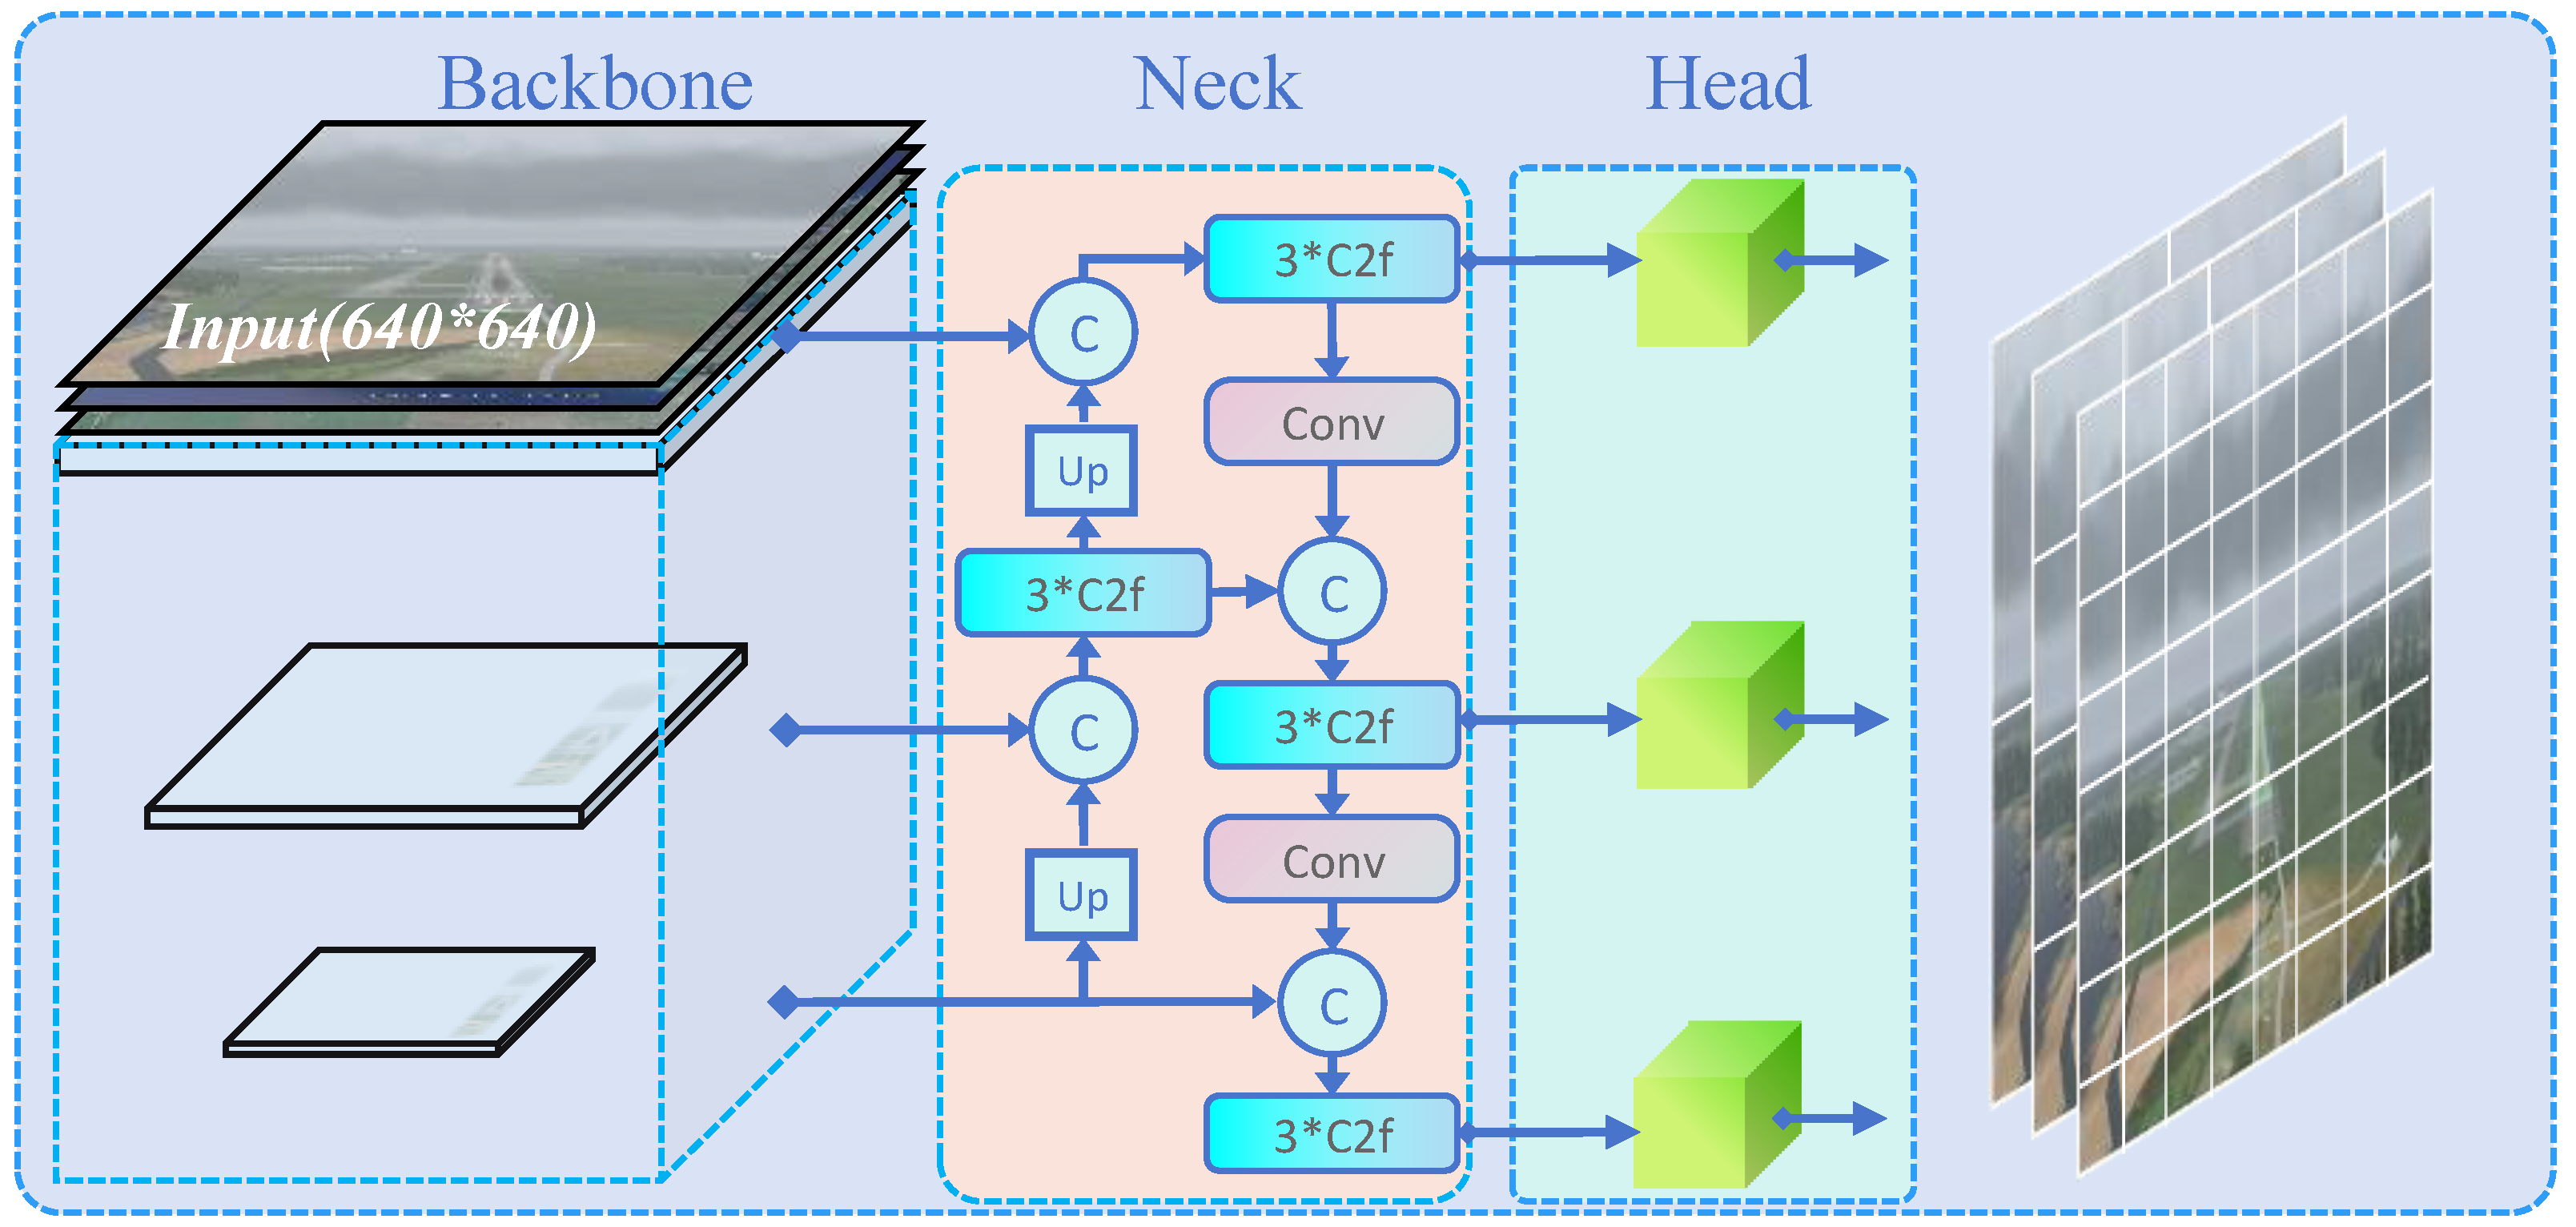
YOLOv8 is the latest state-of-the-art (SOTA) model in the YOLO series developed by Ultralytics. Based on the concepts of speed, accuracy, and convenience, it introduces a series of new improvements and features aimed at achieving superior performance, efficiency, and flexibility. Compared to previous models, YOLOv8 has extensive scalability and can support a full range of visual AI tasks, such as image segmentation, object detection, pose estimation, object tracking, and image classification, and meet the needs of different applications and fields. Specifically, YOLOv8 innovations include the use of a new backbone network, anchor-free detecting head, and new loss function, which enable the model to perform well in various tasks and run on a variety of hardware platforms, from CPU to GPU. It consists of a backbone for feature extraction, neck for multi-feature fusion, and head for output prediction. Figure 5 shows the network structure of YOLOv8.
The backbone of YOLOv8 extracts features from images mainly through C2f and SPPF. Inspired by the design of YOLOv7 ELAN, the backbone and neck of YOLOv8 replace the C3 structure of YOLOv5 with the C2f, which has a richer gradient flow and adjusted number of channels for different scale models. Compared with the C3 module, C2f reduces one convolutional layer, achieving model lightweighting. The multi-scale fusion module combines the Feature Pyramid Network (FPN) and Path Aggregation Network (PAN). By bi-directionally fusing low-level and high-level features, it strengthens low-level features with a smaller receptive field, enhancing the detection capability of targets at different scales. However, there is a gap—the significant semantic differences between adjacent layers. Compared with YOLOv5, the head part of YOLOv8 has undergone major changes, adopting the currently mainstream decoupling head structure that separates the classifying head and detecting head, with the anchor-based system replaced by the anchor-free one, adding more flexibility and accuracy to the model’s performance.

4.1.2. Vision-Based Autonomous Landing Segmentation Network

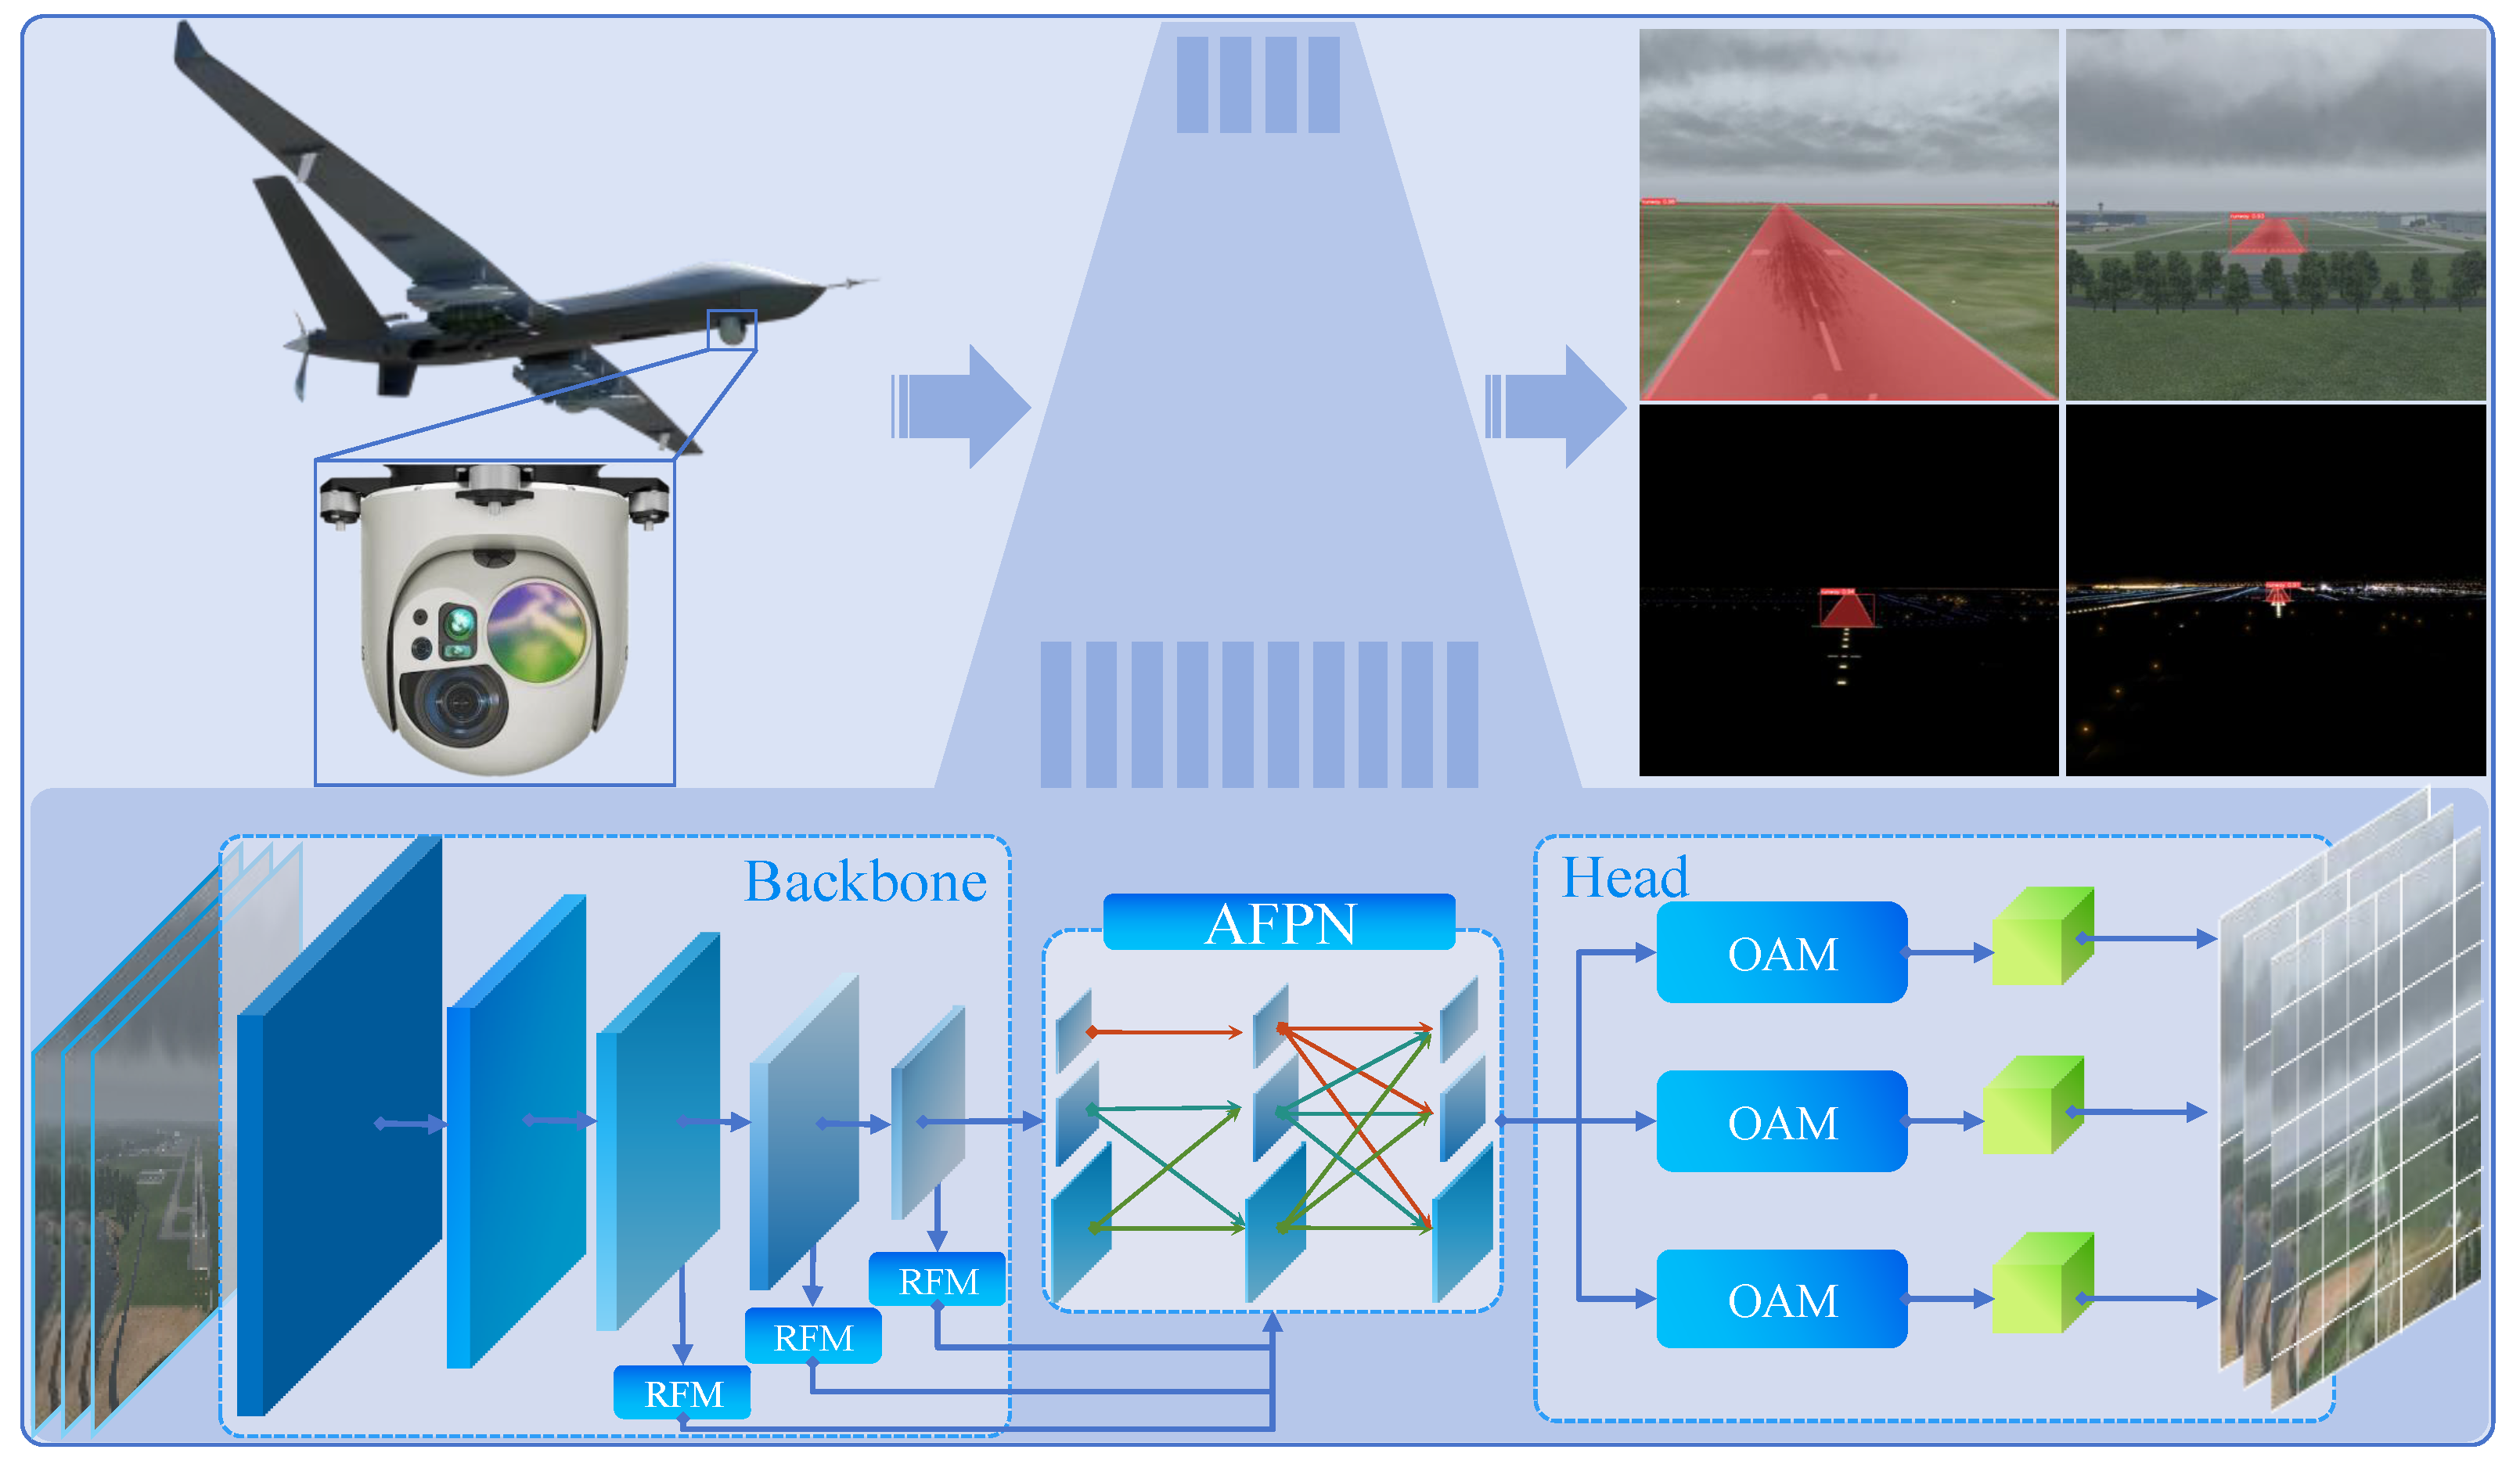
The vision-based autonomous landing system is a self-landing system independent of GNSS, mitigating the risk of interruption due to signal interference, deception, and complex electromagnetic environments. Given the high accident rate during the landing phase, the precise and reliable positioning of the aircraft, as well as runway detection and segmentation, is crucial. During the landing process, UAVs continuously search for a suitable runway within the field of view of optical sensors or cameras, allowing the vision-based autonomous landing system to autonomously select the nearest or safest runway for the final approaching and landing.
In the camera’s field of view, runways typically exhibit shapes of tilted or symmetric quadrilaterals. With the changing Euler angles of the UAV, the geometric characteristics of the runway alter correspondingly. The rapid changes in height and speed during landing can cause significant variations in the scale of the runway in the image and large fluctuations of the background. The dynamic change greatly challenges the accuracy in detecting and segmenting the runway, as the model needs to adapt to instances of runways at different scales and angles while maintaining robustness to background changes.
To segment the runway more effectively, the latest SOTA-based YOLOv8 is chosen to be the basic framework of VALNet, which mainly consists of the Context Enhancement Module (CEM), Asymptotic Feature Pyramid Network (AFPN), and Orientation Adaptation Module (OAM) as shown in Figure 6. CEM and AFPN are combined into a dual strategy to ensure that the instance segmentation model can maintain highly accurate runway segmentation performance when the aircraft approaches the runway from far to near and from high to low. OAM fuses the feature information of the same angles through rotation operations, providing the model with more comprehensive rotation invariance and adaptability to direction changes of the runway.

4.2. Context Enhancement Module

Due to rapid changes in the height and speed of UAVs during landing, the runway’s scale undergoes significant distortion in captured images, along with substantial fluctuations in background information, which poses two primary challenges: one problem is the loss of target runway caused by the drastic distortion of the field of view, especially small targets in the distance; another concern is false positives and false negatives in the presence of confusing objects. What is more, inherent noise in the original images makes it hard to classify the pixels of the runway, and the downsampling in the backbone of YOLOv8-seg further reduces the image resolution, erasing crucial and fine details. To address the challenges, a dual strategy comprising CEM and AFPN is proposed, where CEM focuses on contextual enhancement, while AFPN is dedicated to alleviating semantic gaps between different layers.
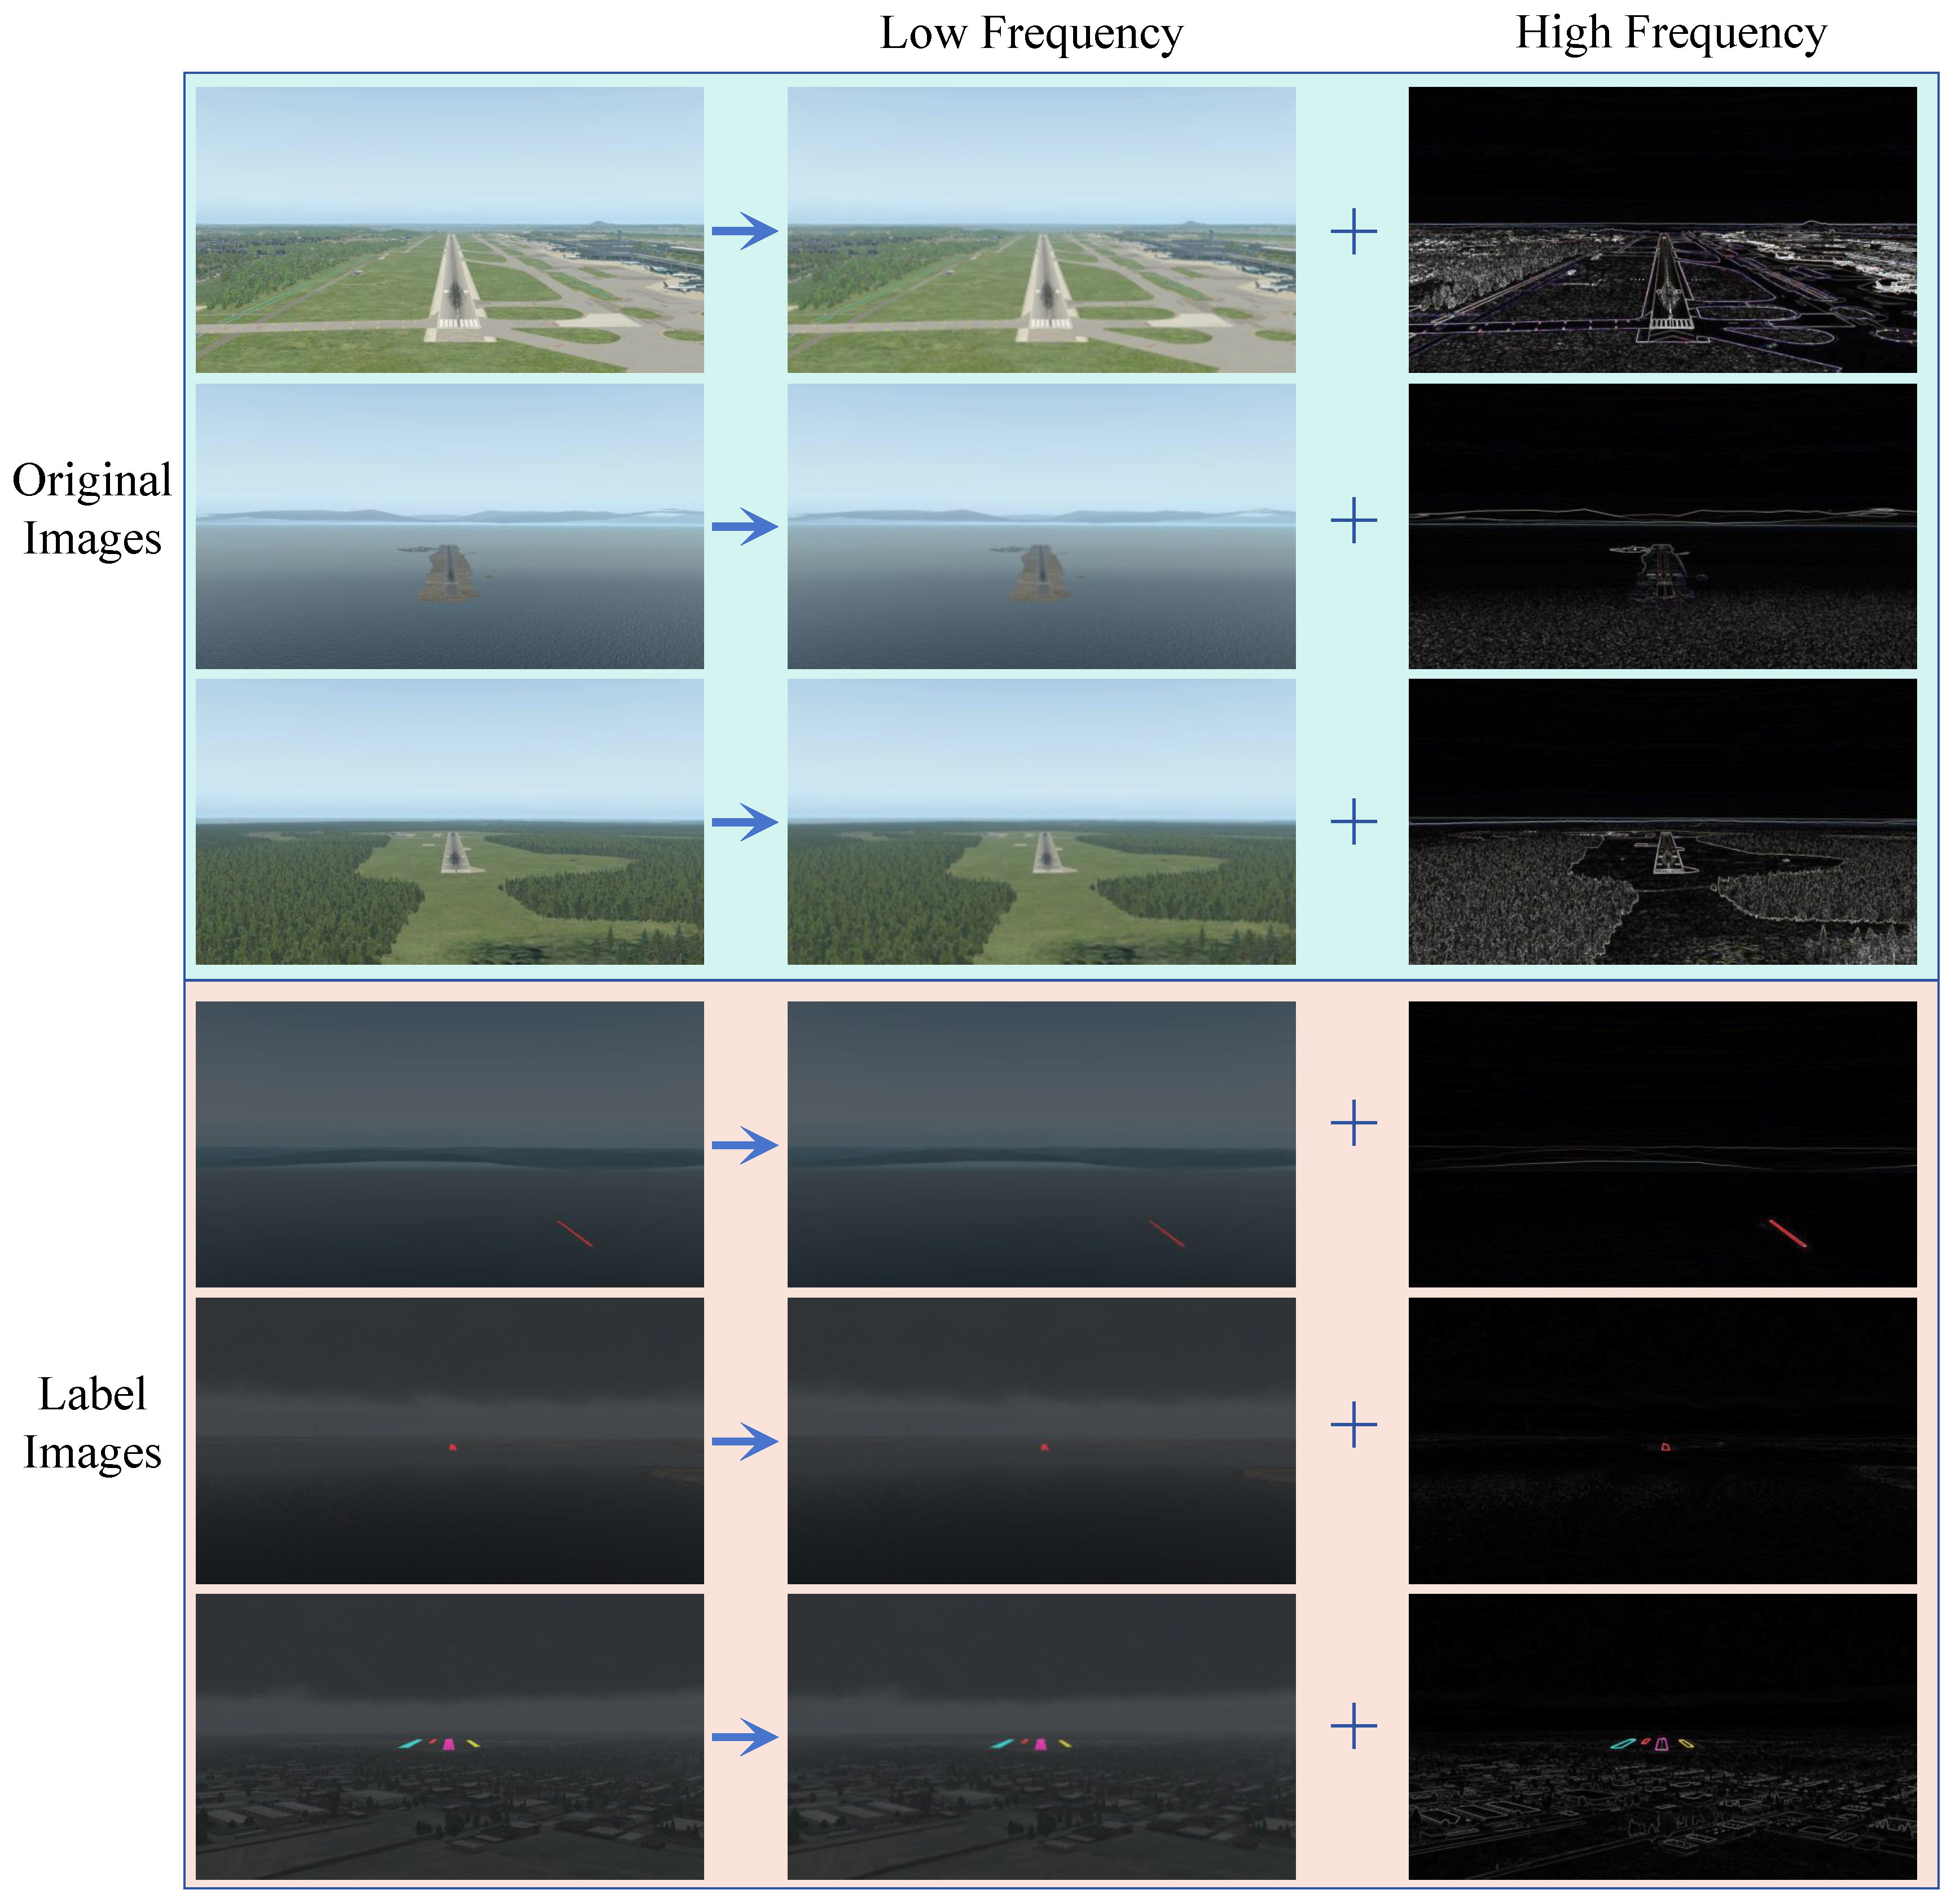
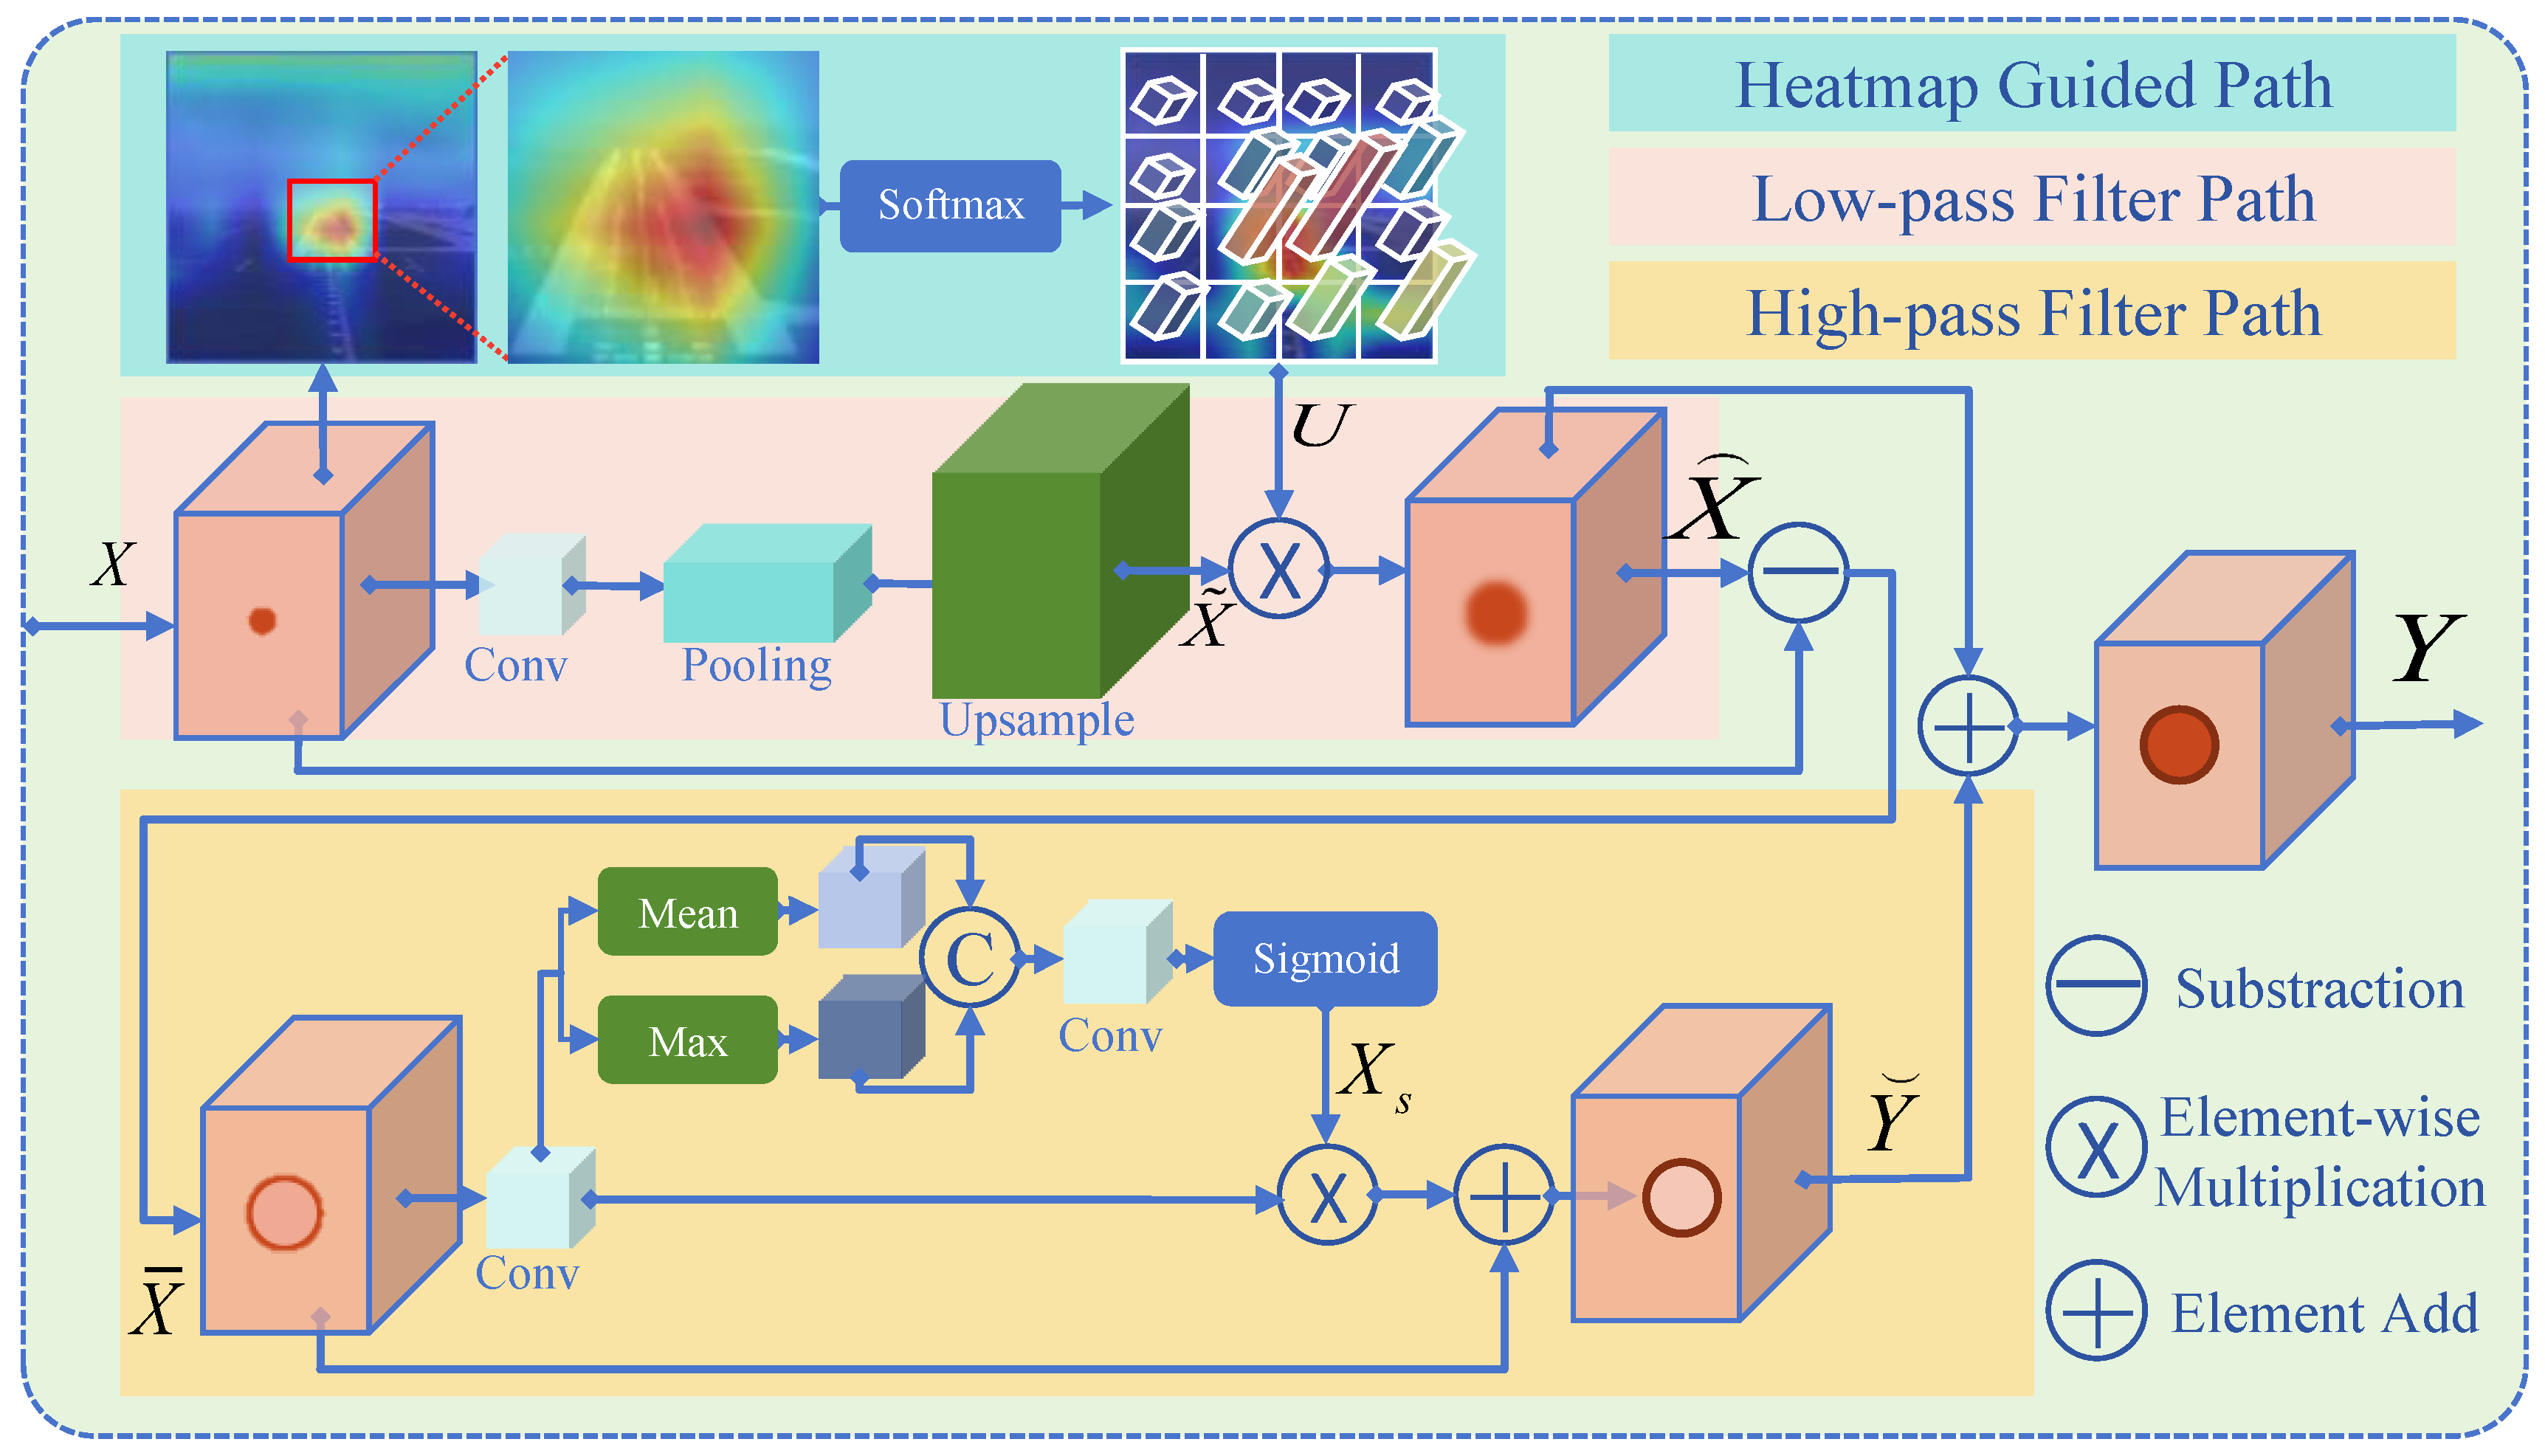
In the field of signal processing, low-pass and high-pass filters can be used to adjust the frequency components of signals in the frequency domain to achieve different processing requirements for signals. In practical applications, low-pass and high-pass filters are often combined to form band-pass filters to achieve more refined signal processing goals. The design of CEM is inspired by the above frequency domain analysis concept. As shown in Figure 7 natural images can be decomposed into two main components: one is the feature that describes the smooth transition or gradient in the image, which corresponds to the low-frequency component I l o w ; the other is the feature that represents the sudden changes or subtle details in the image, which corresponds to the high-frequency component I h i g h . The original image I R C × H × W , where C represents the channel dimension, and H × W represents the spatial resolution. This decomposition satisfies satisfies Equation (1):
I = I l o w + I h i g h .
The decomposition makes it easy to understand and process the overall trends and local details in the image. Similarly, annotated instance segmentation images can also be decomposed into the sum of low-frequency and high-frequency components. The low-frequency component can be obtained by using mean or Gaussian filtering, while the high-frequency component can be obtained by using Laplacian or Sobel filtering. Here, the high-frequency component is obtained by original feature I minus the low-pass component I l o w as in
I l o w = F F T 1 ( G ( I ) F F T ( I ) ) ;   I high = I I l o w ;   G ( c , x , y ) = i = 1 c 1 2 π σ 2 exp x 2 + y 2 2 σ 2 ,
where F F T is the Fourier transform, F F T 1 is the inverse Fourier transform, x and y denote the horizontal and vertical offsets in the c channel, respectively, and σ represents the standard deviation of the Gaussian function.
As shown in the second column of Figure 7, the low-pass component is relatively smooth, while the high-pass component in the third column contains clearer details and more contours.
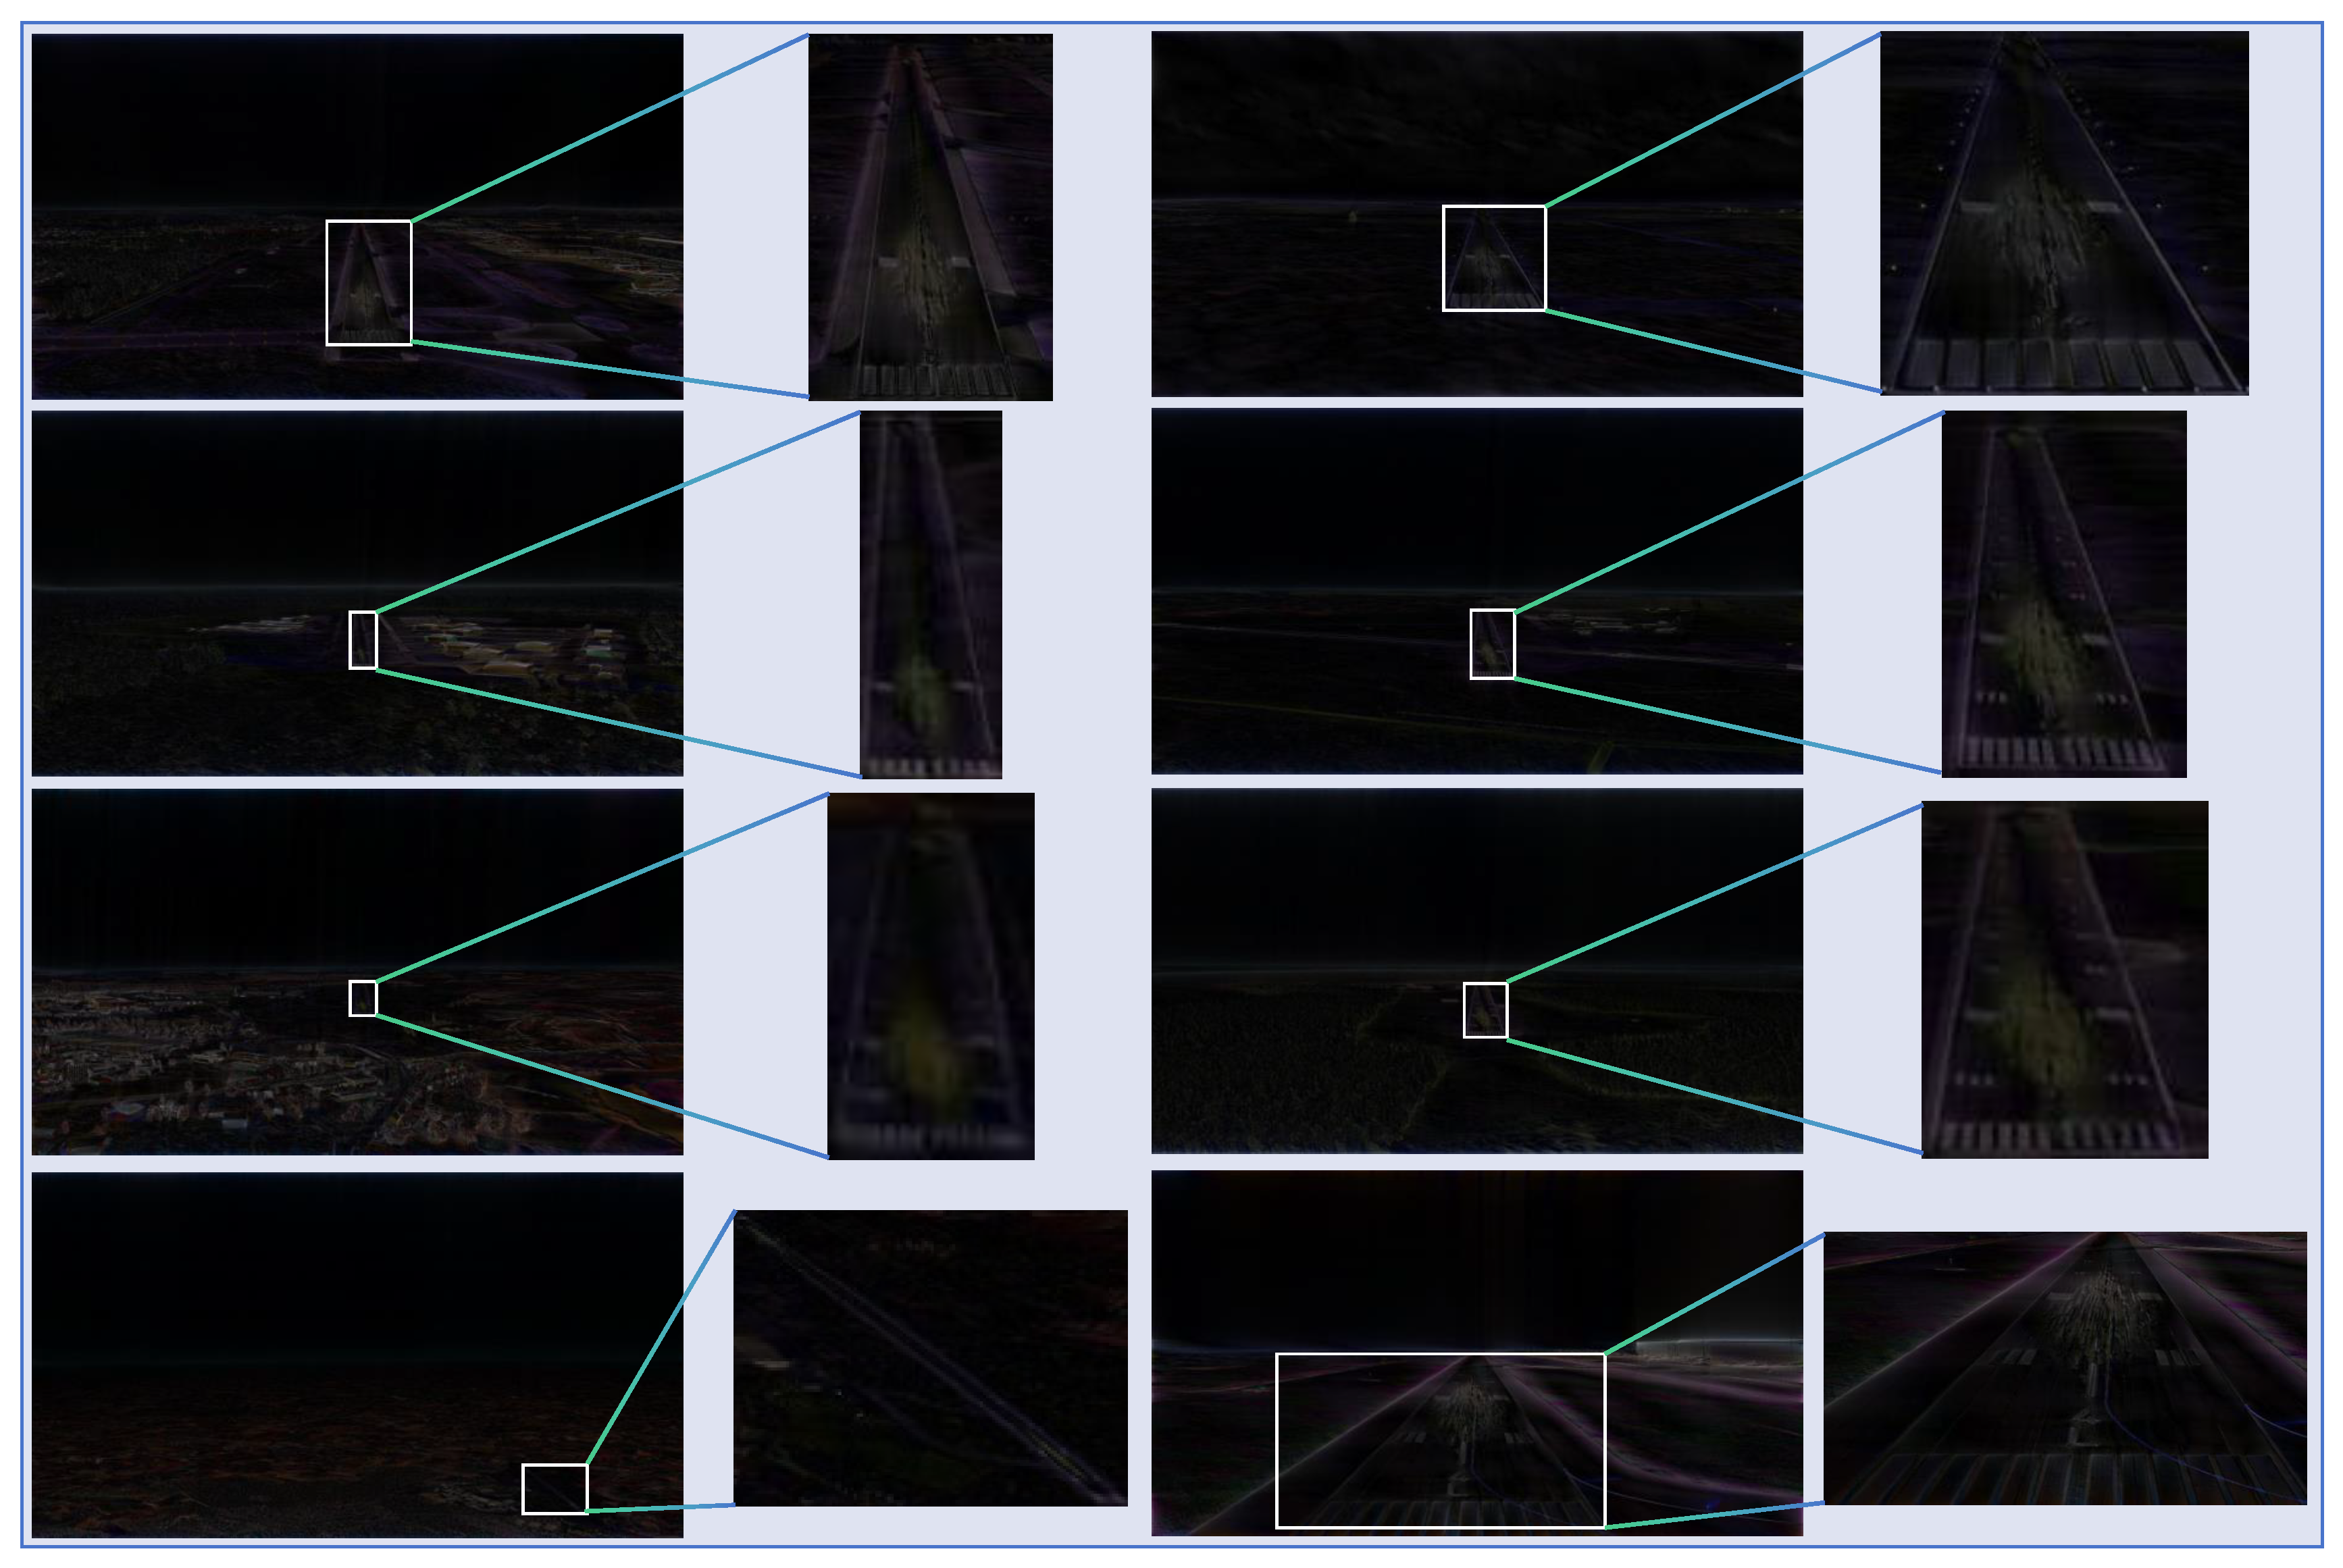
In order to extract runway features more effectively, CEM introduces the idea of band-pass filters. The idea is based on an understanding of the frequency domain information of images, where the edges of the runway are considered to be of high frequency and the background of low frequency. The contained area, especially the center area, of the runway has the band-pass information to be segmented in target instances. As shown in Figure 8, after the original images are filtered by the band-pass filter, not only are the edges of the runway successfully highlighted, making them clearer and more distinguishable, but so is the low-frequency object area.
In this way, sensitivity to the features of specific target areas is introduced in VALNet for better adaption to image changes of runway under different scenarios and lighting conditions, and for improving the network’s perception of the center area of runway and instance segmentation of the runway, especially in cases involving complex textures and large-scale changes. By integrating band-pass filters into the instance segmentation network, improvement in the robustness and generalization of the network is expected, making it more suitable for various complex landing scenarios.
As mentioned above, the concept of band-pass filters in CEM is introduced for the effective extraction of runway features. The model can learn appropriate “frequencies” when focusing on the middle area of the runway rather than on edge and background information. Thus, CEM is designed by a three-channel method.
The goal of the heatmap-guided channel is to filter out the background information in the image by the low-pass filter and the heatmap. To achieve it, the heatmap of the image is generated, where the intensity in the heatmap reflects the contribution of the pixel to the overall semantics. By multiplying the heatmap feature with the low-pass filtered feature, an adaptive filtering mechanism focusing more on areas with high semantic intensity is achieved. It helps the model to reduce background interference and emphasize more on the central part of the runway and overall contextual features.
The high-pass filter channel aims to capture the high-frequency information of the image, especially the edges and subtle geometric features of the runway. When combined with the spatial attention mechanism, it can self-adaptively adjust the model’s attention to different regions of the image. The combination enhances the model’s perception of the runway boundary, thus improving its ability to capture detailed information and to understand the geometric shape and structure of the runway.
The combination of the three channels, namely, the heatmap-guided channel, the high-pass filter channel, and the spatial attention channel, forms the overall design framework of CEM. By integrating information of different frequencies, CEM can more comprehensively and accurately capture the runway features in the image, providing an effective feature extraction method for visual tasks. It improves the model’s understanding and generalizing of the runway structure and contextual features in practical applications.
As shown in Figure 9, we define the feature input to the CEM structure from the backbone network as X, which is the input to CEM. We define the CEM output as Y, whose size is equal to X. The heatmap channel first obtains the heatmap from the input feature as shown in Equation (3):
M ( i , j ) = n = 1 c 1 c X n ( i , j ) ,
where i is the row index, j is the column index, n is the feature index, and c is the total number of channels.
The heatmap consists of background region S b , high-temperature target region S t h , and low-temperature target region S t l , satisfying
M = S b + S t h + S t l .
The goal is to make the background region S b small enough while S t h and S t l each adequately cover the target area such that the corresponding heatmap M ^ corresponding to the low-pass filter path output feature X ^ satisfies
M * = argmax M ^ M , s . t . M ^ S t l .
To meet Equation (5) is to expand and amplify the targeted high-temperature region S t h in the heatmap. Therefore, as shown in Figure 9, in each local region of size s × s , guided by M, a vector U with the highest probability representing the target region is obtained by Softmax:
U = exp M i i = 1 c exp M i , i = 1 , 2 , , c ,
where c = s × s and M = M 1 , M 2 , . . . , M c .
For the low-pass filter path, feature extraction is performed on the entire input through convolutional operations, and subsequent pooling operations reduce the spatial resolution of the feature map and preserve the main feature information, allowing the model to better focus on the overall structure of the image. The final up-sampling restores the spatial resolution of the feature map to the size of original heatmap and output X ˜ .
After the feature map X ˜ is obtained from the low-pass filter path, the heatmap-guided low-pass filtering result X ^ can then be obtained by elementwise multiplication of X ˜ and U:
X ^ = X ˜ T U ,
Throughout the design, the output X ^ guides the low-pass filter to pay more attention to the target region, making it more targeted in capturing task-relevant information. The strategy of combining heatmap information helps improve the model’s perception and understanding of the target region, enhancing semantic information related to the targeted area.
For the high-pass filter path, the input X ¯ is obtained by subtracting the output of the low-pass filter path X ˜ from the original feature X:
X ¯ = X X ˜ ,
As shown in Equation (8), the original high-pass filter directly extracts the runway’s edges from the image. However, due to the presence of a large amount of texture and details in the features, these pieces of information may introduce unnecessary complexity to the model, causing some challenges.
Given that the spatial attention mechanism enables the model to focus more on specific regions of the image and to capture important task-relevant information, introducing a weighting mechanism allows the model to dynamically adjust its attention to different areas, thereby enhancing its perceptual capabilities and task performance. Therefore, for more accurate capturing of the edge information of the runway and suppression of irrelevant textures, especially the details and edge features of the target region, a spatial attention mechanism is introduced to enhance high-frequency information.
In the high-pass filter pathway, the intermediate features are obtained by the original high-pass filter, which includes edge information of the runway and the textures in the image. After that, the spatial attention mechanism is introduced, which emphasizes important areas in the image while suppressing irrelevant texture information by weighting the intermediate features. Specifically, mean and max operations are performed to obtain the spatially attention-weighted high-pass features. Thus, more focus is placed on the positions containing target information in the image, diminishing the influence of regions containing only texture information at the same time. In this way, fine-tuning of the output of the high-pass filter is achieved, making it more focused on the critical areas of runway edges. The spatial attention
X s = σ F F M a x ( X ¯ ) F M e a n ( X ¯ ) ,
where σ · is the sigmoid activation function, ∘ is the concatenation operation, and F · is the 3 × 3 convolution operation. F M a x · indicates taking the maximum value at the same position on the feature map, and F M e a n · represents taking the average value at the same position on the feature map along the channel dimension.
So, the final output of the high-pass filter channel is
X ˘ = X s F ( X ¯ ) + X ¯ ,
where ⊙ is the elementwise dot product, and F is the 3 × 3 convolution operation.
The final output of CEM comes from the combination of the high-pass features of the weighted spatial attention and the output of the heatmap-guided low-pass filtering path. It retains the runway edge information and reduces interference from textures and irrelevant details, providing the model with a clearer and more precise feature representation as shown in
Y = X ^ + X ˘ ,
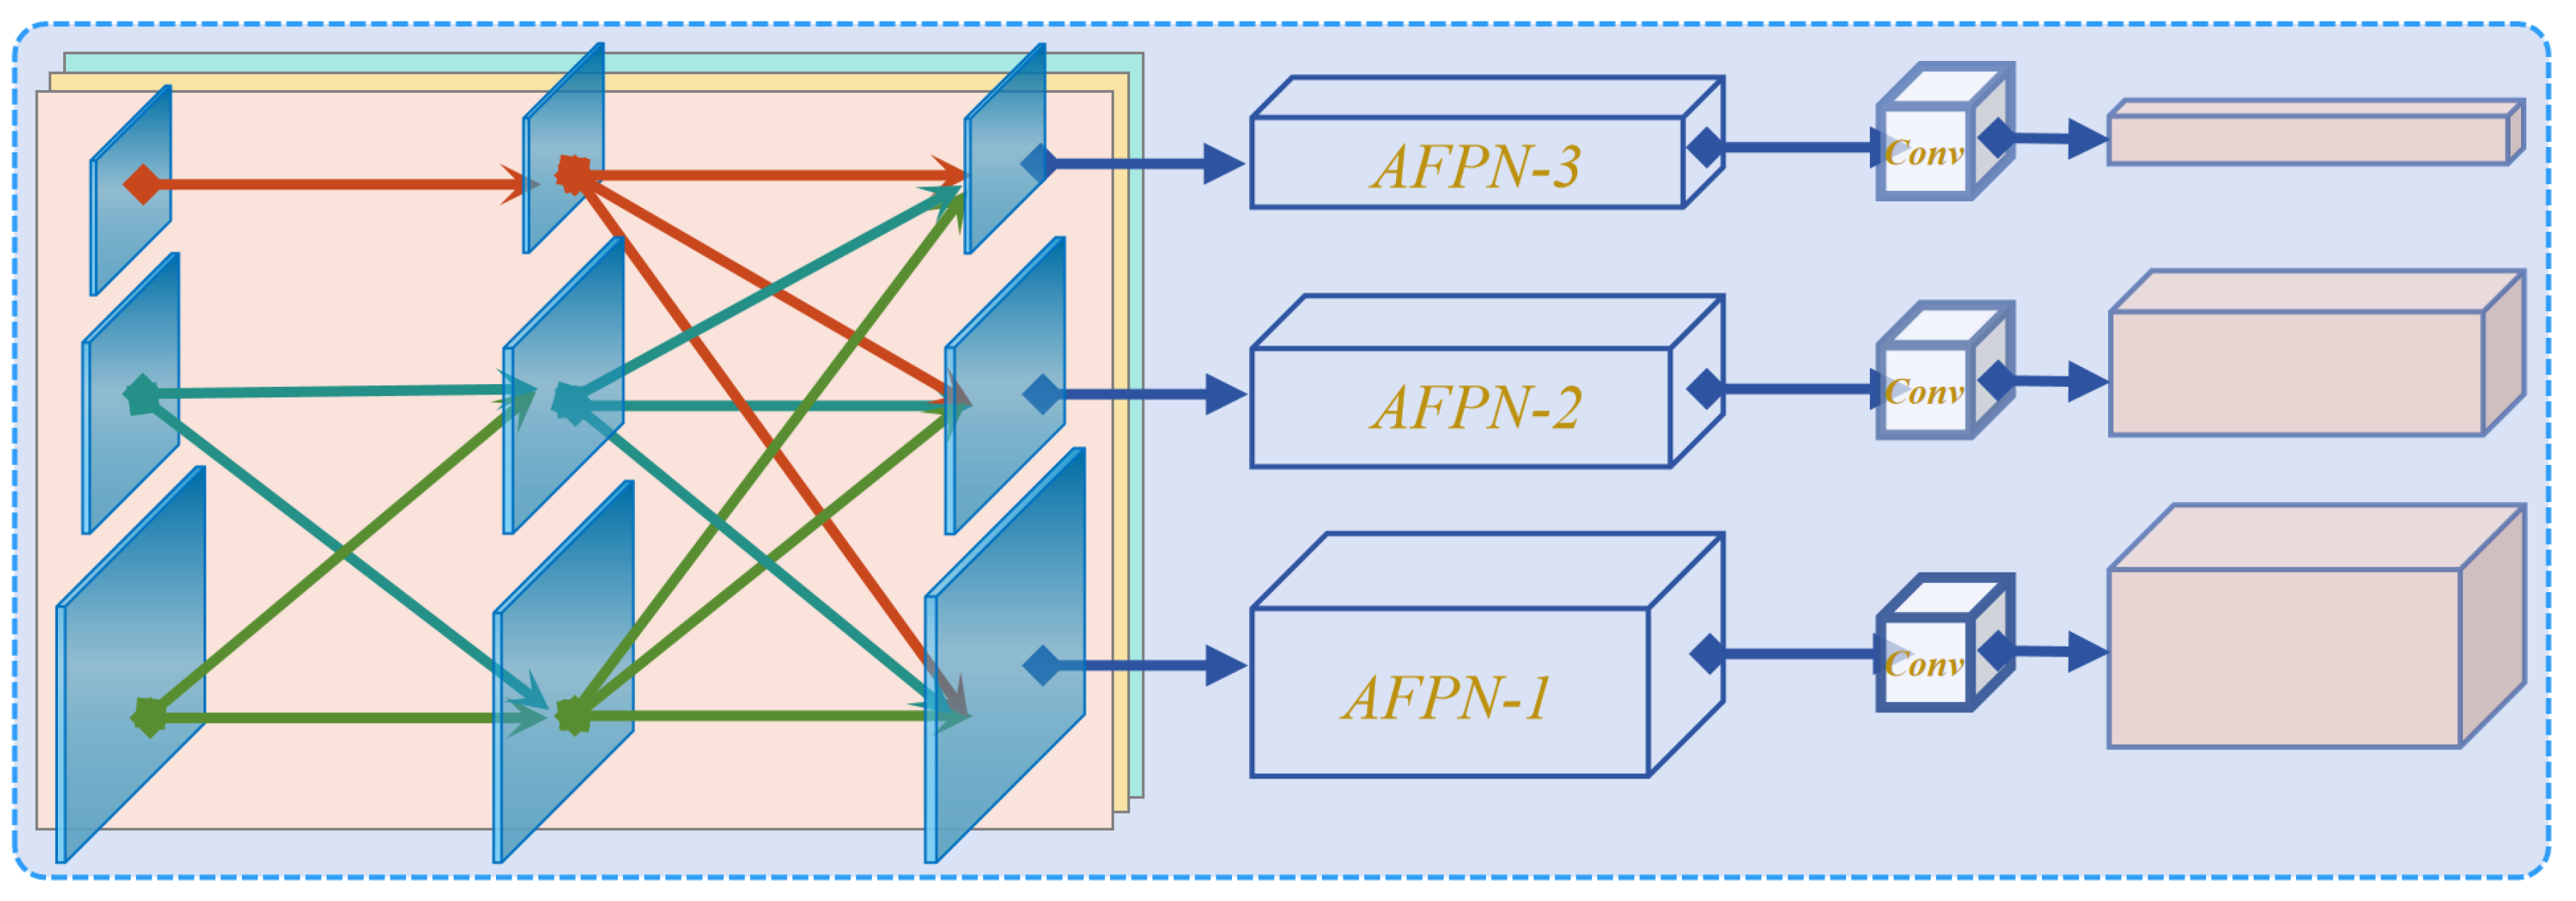
Note that the original YOLOv8 model employs the Path Aggregation Feature Pyramid Network (PAFPN) which introduces a bottom–up pathway on top of the Feature Pyramid Network (FPN). It aims to facilitate the propagation of high-level features from top to bottom, allowing low-level features to acquire more detailed information. However, a challenge appears such that detailed information from low-level features may be lost or degraded during the propagation and interaction process, resulting in a certain degree of semantic gap.
To handle the challenge, AFPN is introduced as shown in Figure 10. AFPN is designed to facilitate direct interaction between non-adjacent layers by first fusing features from two adjacent layers and gradually incorporating high-level features into the fusion process. In contrast to traditional top–down pathways, AFPN emphasizes more on narrowing the semantic gap between low-level and high-level features, thus mitigating large semantic differences between non-adjacent layers.
In practical implementation, to integrate detailed information from low-level features effectively, AFPN progressively fuses high-level features to improve the overall understanding across different hierarchical features of the model, thus enhancing its performance in object detection tasks. The progressive fusion of AFPN alleviates the issue of semantic gap, allows the features from various layers to be comprehensive used, and increases the accuracy and robustness of runway segmentation.

4.3. Orientation Adaptation Module

The direct augmentation of data to improve a model’s robustness to rotation during training may deviate from real-world scenarios. Data augmentation involves transforming and distorting the original data to expand the training set and enhance the model’s robustness to various changes. However, in the practical application scenarios of autonomous landing systems, conventional data augmentation techniques may lead to some unrealistic scenarios.
For instance, directly flipping the upper half of an image (usually the sky or other irrelevant information) to the lower half through data augmentation might result in unreasonable scenarios, such as placing the sky at the bottom of the image and the ground at the top. Such situations are impossible in the real world because, during the autonomous landing process of an aircraft, the relative position and orientation of the aircraft are subject to physical laws, and the sky cannot be below the ground.
Therefore, to better adapt to the direction changes in real-world scenarios, the OAM is used to fuse rotation information instead of relying on data augmentation that does not conform to reality. This approach is more in line with the motion laws of aircraft during landing, ensuring consistency between model training and application, and improving the reliability, performance, and robustness of the overall system.
The inspiration behind the design of OAM stems from a profound understanding of the potential directional changes that may occur during an aircraft’s landing process. By introducing OAM into the segmentation head, the fusion of rotation information is achieved, which allows the model to perceive the relative position and orientation between the aircraft and the runway in different directions more comprehensively and accurately. In this way, the model exhibits more robust performance in real-flight scenarios, providing the autonomous landing system with a more reliable visual perception capability when facing the complexity and uncertainty of actual landing scenarios.
Of the triple-channel based OAM, the three branches can obtain features of a 90° clockwise rotation tensor, 90° counterclockwise rotation tensor, and original tensor by introduced rotation operations and residual transformations, where the 90° clockwise rotation tensor represents the state of the original feature after a clockwise rotation of 90°, the 90° counterclockwise rotation tensor represents the state of the original feature after a counterclockwise rotation of 90°, and the original tensor represents an unrotated state.
The triple-channel design allows the full usage of the rotation information by obtaining features of different angles through multiple channels, thereby enhancing the model’s ability to capture rotational transformations in input images. Each channel undergoes specialized processing to preserve and highlight the captured features of specific rotation directions.
The triple-channel based OAM uses the rotation operation; Figure 11 shows the process.
The input features from the backbone network into the OAM structure are denoted as X ( i ) R C × H × W . The output of OAM is defined as Y ( i ) , with the same size as X ( i ) . OAM comprises three channels: the CR-Channel of 90° clockwise rotation around the C-axis, the CL-Channel of 90° counterclockwise rotation around the C-axis, and the Original-Channel representing the unrotated, original features. The operations for the CR-Channel and CL-Channel are similar: both involve rotation first, then feature extraction via Max-Avg Pooling, and finally reverse rotation to complete the process. By Rodrigues’ rotation formula, the rotation tensor around any axis is defined as
R ( θ , X ) = H ( θ ) X
where R ( θ , X ) is the rotated tensor, H ( θ ) is the rotation matrix, and ⊙ denotes the elementwise multiplication. The rotation matrix H R C × H × W is expressed as
H = I + sin θ · K + ( 1 cos θ ) · K 2 ,
with I R C × H × W representing the identity matrix, θ the rotation angle, and K R C × H × W the anti-symmetric rotation matrix around the axis.
Thus, the rotation expression of the input features for the first rotation stage of CR-Channel and CL-Channel is
X r ( i ) = R π 2 , X ( i ) ;   X l ( i ) = R π 2 , X ( i ) ,
where X r ( i ) represents the features after a 90° clockwise rotation, X l ( i ) represents the features after a 90° counterclockwise rotation, R ( θ , X ( i ) ) denotes the rotation tensor around an axis by an angle θ , and X ( i ) R C × H × W are the input features, with C representing the channel dimension and H × W representing the spatial resolution.
In the second rotation stage of the CR-Channel and CL-Channel, features are extracted at different angles by spatial attention mechanisms, followed by inverse rotation:
Y r ( i ) = R 1 π 2 , X ^ r ( i ) ; X ^ r ( i ) = X r ( i ) σ F 7 × 7 F Avg X r ( i ) ;   F Max X r ( i ) Y l ( i ) = R 1 π 2 , X ^ l ( i ) ; X ^ l ( i ) = X l ( i ) σ F 7 × 7 F Avg X l ( i ) ;   F Max X l ( i )
where Y r ( i ) and Y l ( i ) represent the output features of the CR-Channel and CL-Channel after inverse rotation, respectively. R 1 ( θ , X ^ ) denotes the inverse rotation by angle θ , σ ( · ) is the sigmoid activation function, F 7 × 7 ( · ) is the convolution operation with a 7 × 7 kernel, F Avg ( · ) is the average pooling operation, F Max ( · ) is the maximum pooling operation, and ⊙ denotes elementwise multiplication.
For the Original-Channel, the input feature is X ( i ) R C × H × W , and the output is
Y u r ( i ) = X ( i ) F C GAP X ( i ) + GMP X ( i ) ,
where F C ( · ) stands for full connection, G A P ( · ) for global average pooling, and G M P ( · ) for global maximum pooling, with details in
GAP ( X ) = 1 W H k = 1 H l = 1 W X k , l ;   G M P ( X ) = max H , W X k , l .
By experiments, the form of adaptive parameters is adopted for the final output of OAM:
Y ( i ) = α Y r ( i ) + β Y l ( i ) + γ Y u r ( i ) ,
where α , β , and γ are self-adaptive weights satisfying.
The three-channel structured design obtaining feature representations at different angles improves the ability, robustness, and adaptability of the model in capturing rotation transformations in input images. The model can strongly support autonomous landing systems in accurately determining the relative position between the aircraft and the runway.

5. Experiment

5.1. Dataset and Setting

5.1.1. Dataset

RLD is introduced in studying automatic landing systems. It comprises 12,239 images with a resolution of 1280 × 720 pixels. It covers diverse terrains such as urban, rural, grassland, mountainous, and oceans, along with various weather conditions such as sunny, cloudy, foggy, and night to ensure enough features are captured in the frontal aerial perspective to simulate various real-world landing scenarios at different airports.
In addition to RLD, we also incorporate BARS and COCO2017 datasets for comparison. BARS provides annotated images specifically tailored for runway segmentation tasks, while COCO2017 offers a diverse range of annotated images, aiding in benchmarking and developing robust segmentation models. This integration allows for a comprehensive evaluation of our methods across different conditions and scenarios, ensuring robust performance and generalizability.

5.1.2. Evaluation Metrics

Popular performance evaluation metrics of mAP, AP50, and AP75 are employed, where mAP denotes the average precision calculated within the IoU threshold range (from 0.50 to 0.95 with a step size of 0.05). Additionally, other evaluation metrics are also taken into consideration, such as Params (parameter size), FLOPs (floating-point operations per second), and fps (frames per second).

5.1.3. Experimental Setup

All experiments of the proposed algorithm are successfully implemented on a Windows operating system equipped with an NVIDIA RTX 3080 Ti GPU with memory of 12 GB and by PyTorch 1.10.1, conda 4.12.0, and CUDA 11.7, with its pretraining performed on the COCO dataset. All experimental parameters are presented in Table 5.

5.2. Comparison with SOTA Methods on the RLD

To assess the effectiveness of RLD in runway instance segmentation comprehensively and testify the proposed algorithm, extensive experiments on RLD are conducted with results compared with other SOTA methods. As shown in Table 6, VALNet demonstrates outstanding performance on metrics such as 69.4% in mAP, 96.3% in AP50, and 74.8% in AP75, reaching a new SOTA level.
RLD plays a crucial role in the experiments: it provides rich, real-world data that enable the model to achieve significant performance improvements in various complex scenarios. VALNet maintains a competitive level in fps, which ensures real-time processing capability in onboard environments.
Furthermore, VALNet exhibits remarkable computational efficiency with relatively low Params and GFLOPs, providing an economically efficient solution for vision-based autonomous landing tasks. The series of experimental results fully demonstrates the outstanding performance and practicality of VALNet in the field of runway instance segmentation.
As shown in Table 7, when experiments are carried out on the publicly available runway segmentation dataset BARS, the results of the model again show outstanding levels on evaluation metrics such as in mAP, in AP50, and in AP75, greatly surpassing YOLOv8-seg. Furthermore, compared to other SOTA methods like Mask R-CNN, the proposed approach also demonstrates a slightly improved trend.
The COCO2017 dataset is introduced for further comparison. VALNet performs better than other SOTA methods in evaluating metrics such as mAP, AP50, and AP75 as shown in Table 8.
The results indicate that although VALNet’s performance on the COCO2017 dataset is average, it demonstrates competitive performance compared to CATNet in remote sensing scenarios. This suggests that VALNet, while not excelling on COCO2017, shows strong performance and versatility in specialized applications such as remote sensing.

5.3. Ablation Studies

5.3.1. Improvements over Baseline Model

For in-depth analysis of the impact of CEM, AFPN, and OAM on the overall framework, ablation experiments are conducted on RLD upon the baseline model YOLOv8-seg, with detailed results presented in Table 9. Experimental results show significant performance improvement in introducing CEM and OAM separately to the baseline model. The joint use of AFPN and CEM effectively eliminates semantic gaps, while the combination of AFPN and OAM has a relatively minor impact on performance enhancement.
The results again demonstrate the positive contributions of CEM, AFPN, and OAM to the overall framework and their strong support for the model’s performance improvement. Among the combinations, the introduction of CEM or OAM each exhibits notable performance improvement, and the synergistic effect of AFPN and CEM is particularly significant in addressing the issue of semantic gaps.

5.3.2. Ablation Studies on CEM

To evaluate the effectiveness of CEM, ablation experiments are conducted with YOLOv8-seg as the baseline, and the results are presented in Table 10. It shows that the HGP (heatmap guided path) plays a crucial role in guiding the model to reduce background interference and focus more on the central part of the runway.
Further experiments on VALNet with different CEM strides on RLD are conducted, with detailed results shown in Table 11. It is evident that segmentation performance decreases as strides increase because, with the increase in strides, the negative impact of information loss outweighs the enhancement of contextual features by CEM.
The results confirm the effectiveness of CEM in improving the model’s performance and highlight the crucial role of the heatmap guided path in reducing interference and enhancing the model’s focus. At the same time, striking a balance between information loss and the enhancement of contextual features when choosing CEM strides can achieve a best segmentation performance.

5.3.3. Ablation Studies on OAM

To evaluate the effectiveness of OAM, ablation experiments with YOLOv8-seg as the baseline are conducted, focusing on the weights in OAM. Results are presented in Table 12. It indicates that adaptive parameters are more capable of accommodating rotations at different angles, thereby achieving better performance.
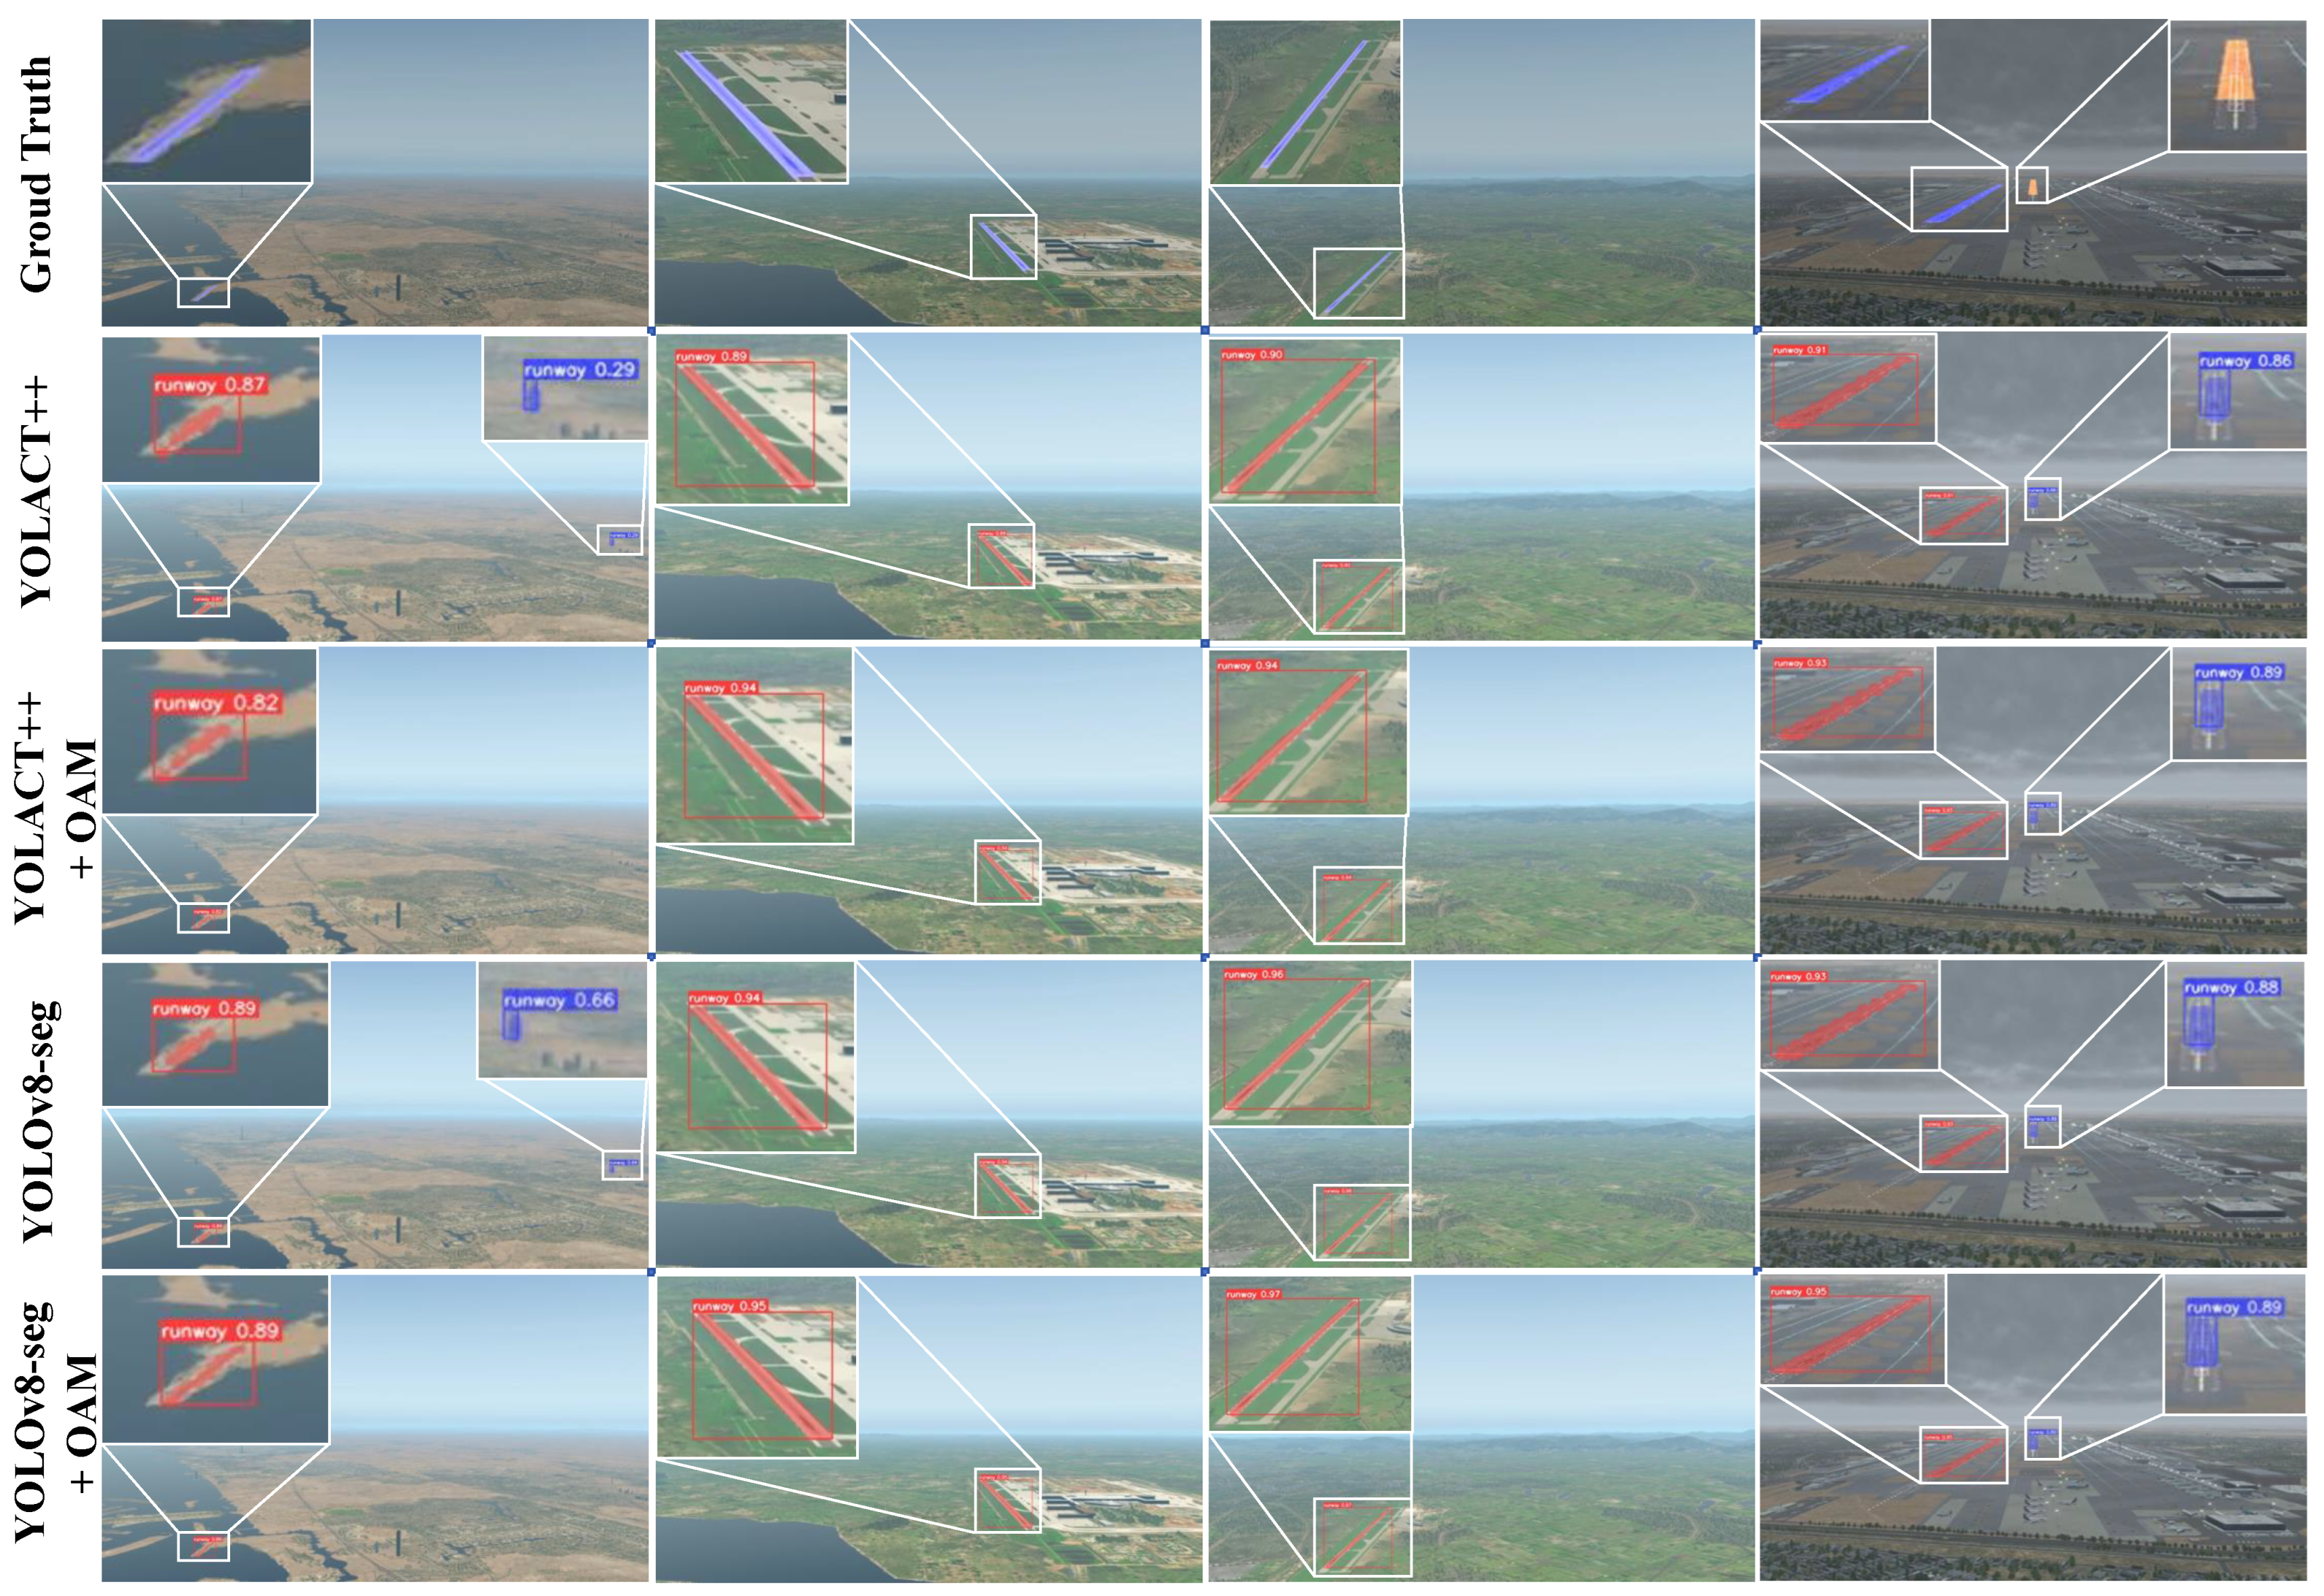
OAM showcases its performance when applied separately to YOLACT++ and YOLOv8-seg as shown in Figure 12. The instances of the runway in the first and third groups of experiments are positioned at the lower left corner of the images, facilitating the demonstration of OAM module’s capability to handle angular transformations within the image. Conversely, the instances in the second group of experiments are positioned at the lower right corner, while the fourth group exhibits a more diversified setup, encompassing instances both centrally and towards the left of the image. This diversified positioning enables a comprehensive demonstration of the efficacy of the OAM module in addressing large angular transformations within the image. Through analysis, it is evident that OAM significantly improves segmentation performance for rotated runways.
These experiments validate the effectiveness of OAM in enhancing the model’s adaptability to rotation characteristics and demonstrate its generalization capabilities across different models. Particularly, the introduction of OAM plays a crucial role in improving the model’s performance in handling rotational transformations.

5.4. Visualization Experiment

Several visualization experiments, including heatmap visualization and inference visualization, are conducted to visually analyze the performance of VALNet, providing a comprehensive understanding of how VALNet operates in the runway instance segmentation task, thus allowing intuitive observation of the model’s responses to different scenes and input variations.

5.4.1. Visualization of Heatmaps

Heatmaps are intuitive observations of the model’s attention to different regions of the image, so the focused areas and features in segmenting runway instances can be easily identified, which is crucial for a deeper understanding of the model’s operation and its perception of different objects in the image.
As shown in Figure 13, four different SOTA models of SOLOv2, YOLACT++, Mask R-CNN, and YOLOv8-seg are compared with the proposed VALNet. Clearly, because of the sparse distribution of heat outside the target area that contributes to the model’s precision and distinctiveness in target segmentation, VALNet can easily focus on the area within the runway target range. The intuitive visual results help to qualitatively analyze and compare the performance of the models.

5.4.2. Visualization between SOTA Methods and VALNet

As shown in Figure 14, the inference results of three different SOTA models of YOLACT++, Mask R-CNN, YOLOv8-seg are compared with the proposed VALNet. In diverse scenarios such as night, foggy, cloudy, urban, and rural, and for targets of different sizes, VALNet exhibits higher object detection confidence and better segmentation performance, which further validates the robustness and generalization capabilities of VALNet in various environments and complex scenes.

5.5. Limitations and Future Works

The proposed VALNet instance segmentation tailored for runways in varying weather and geographical conditions can provide accurate information for vision-based autonomous aircraft landing systems. Experiments demonstrate the effectiveness and interpretability of this approach. However, the study focuses only on runway instance segmentation, limiting its ability to directly infer relative attitude and position from runway images, which affects the simplicity, efficiency, and application of the system.
Future research aims to develop an end-to-end model that translates image/video inputs into relative position and attitude information with respect to the airport, thus achieving a more efficient and precise autonomous landing system. This endeavor seeks to advance the development of vision-based autonomous landing systems.
Additionally, the RLD dataset proposed in this paper primarily originates from flight simulation software, providing abundant runway image data but differing somewhat from real-world data. Simulation-generated images may be constrained by factors such as lighting conditions and landscape details, potentially diverging from real-world flight scenarios. Therefore, while experimental results in simulated environments may be satisfactory, their generalizability and reliability in real-world settings require further validation. Future work may focus on gathering richer and more authentic runway image data encompassing diverse meteorological conditions, geographical environments, and runway structures. Such datasets would aid in verifying the model’s generalizability and robustness, enhancing the reliability and practicality of autonomous landing systems in real-world applications. Moreover, exploring techniques for fine-tuning and optimizing models using real-world data can further improve their performance and applicability.
Finally, while the paper briefly touches on scenarios like rain, snow, clear weather, daytime, and nighttime, in-depth research on these different weather conditions is lacking. Future endeavors could involve detailed analysis of image characteristics and challenges in various weather conditions, aiding in validating model generalization across diverse weather conditions and enhancing the reliability and practicality of autonomous landing systems in complex weather environments. Moreover, exploring techniques like reinforcement learning to enable the adaptive adjustment of model behavior across different weather conditions could better address the complexities of real-world flight scenarios.

6. Conclusions

To address the challenges of runway instance segmentation in visual-based autonomous landing systems, RLD is introduced. It covers various weather conditions and diverse geographical environments, including runways from 30 airports worldwide, with the goal of delineating runway areas highly precisely and providing accurate information for UAV navigation.
In runway instance segmentation tasks, to tackle large-scale variations and different runway angles in input images, an innovative VALNet is proposed. Firstly, inspired by the concept of band-pass filtering, CEM is introduced for the model to learn adaptively strong “frequency band” information through heatmap guidance. The module effectively preserves runway edge information and reduces interference from unrelated details, providing the model with clearer and more accurate features. Secondly, the Triple-Channel design of OAM fully leverages rotation information to enhance the model’s capability to capture rotational transformations in input images, which improves the model’s robustness and adaptability when facing rotational transformations in input images and strongly supports the model in accurately perceiving the relative position and posture between the aircraft and the runway in autonomous landing systems.
Extensive experiments on RLD show significant performance improvements of the proposed approach. Visualization results further validate the effectiveness and interpretability of VALNet when facing large-scale variations and angular differences. Not only is the impact of the research evident in the runway instance segmentation field but it also highlights the potential application value of VALNet in visual-based autonomous landing systems. Our next focus is on estimating the state of the runway, along with visual-based autonomous landing control in the long run.

Author Contributions

Conceptualization, Q.W. and W.F.; methodology, Q.W., W.F. and B.L.; validation, Q.W. and H.Z.; formal analysis, W.F. and Q.W.; writing—original draft preparation, W.F. and Q.W.; writing—review and editing, H.Z., B.L. and S.L.; visualization, W.F., Q.W. and S.L.; supervision, Q.W.; H.Z. and S.L.; funding acquisition, H.Z. All authors have read and agreed to the published version of the manuscript.

Funding

This work was supported by the National Natural Science Foundation of China (Grant No. 61901015) and the Sichuan Province Science and Technology Achievement Transformation Demonstration Project (Grant No. 2022ZHCG0060).

Data Availability Statement

Data are openly available in a public repository. The RLD dataset is available at https://pan.baidu.com/s/1wzOcUrieoAh5MnkzNk50QQ?from=init&pwd=su1g (accessed on 1 January 2024).

Acknowledgments

We express our sincere gratitude to the researchers behind YOLOv8 for generously sharing their algorithm codes, which greatly facilitated the execution of our comparative experiments.

Conflicts of Interest

The authors declare no conflicts of interest.

References

  1. Kong, Y.; Zhang, X.; Mahadevan, S. Bayesian Deep Learning for Aircraft Hard Landing Safety Assessment. IEEE Trans. Intell. Transp. Syst. 2022, 23, 17062–17076. [Google Scholar] [CrossRef]
  2. Torenbeek, E. Advanced Aircraft Design: Conceptual Design, Analysis and Optimization of Subsonic Civil Airplanes; John Wiley and Sons, Ltd.: Hoboken, NJ, USA, 2013. [Google Scholar]
  3. She, Y.; Deng, Y.; Chen, M. From Takeoff to Touchdown: A Decade’s Review of Carbon Emissions from Civil Aviation in China’s Expanding Megacities. Sustainability 2023, 15, 16558. [Google Scholar] [CrossRef]
  4. Bras, F.L.; Hamel, T.; Mahony, R.E.; Barat, C.; Thadasack, J. Approach maneuvers for autonomous landing using visual servo control. IEEE Trans. Aerosp. Electron. Syst. 2014, 50, 1051–1065. [Google Scholar] [CrossRef]
  5. Airbus. Statistical Analysis of Commercial Aviation Accidents 1958–2022. Available online: https://accidentstats.airbus.com/ (accessed on 1 January 2024).
  6. Zhang, D.; Wang, X. Autonomous Landing Control of Fixed-wing UAVs: From Theory to Field Experiment. J. Intell. Robot. Syst. 2017, 88, 619–634. [Google Scholar] [CrossRef]
  7. Novák, A.; Havel, K.; Janovec, M. Measuring and Testing the Instrument Landing System at the Airport Zilina. Transp. Res. Procedia 2017, 28, 117–126. [Google Scholar] [CrossRef]
  8. Deplasco, M. Precision Approach Radar (PAR). Access Science. 2014. Available online: https://skybrary.aero/articles/precision-approach-radar-par (accessed on 1 January 2024).
  9. Mu, L.; Mu, L.; Yu, X.; Zhang, Y.; Li, P.; Wang, X. Onboard guidance system design for reusable launch vehicles in the terminal area energy management phase. Acta Astronaut. 2018, 143, 62–75. [Google Scholar] [CrossRef]
  10. Niu, G.; Yang, Q.; Gao, Y.; Pun, M.O. Vision-Based Autonomous Landing for Unmanned Aerial and Ground Vehicles Cooperative Systems. IEEE Robot. Autom. Lett. 2022, 7, 6234–6241. [Google Scholar] [CrossRef]
  11. Nguyen, H.P.; Ngo, D.; Duong, V.T.L.; Tran, X.T. Vision-based Navigation for Autonomous Landing System. In Proceedings of the 2020 7th NAFOSTED Conference on Information and Computer Science (NICS), Ho Chi Minh City, Vietnam, 26–27 November 2020; pp. 209–214. [Google Scholar]
  12. Chen, M.; Hu, Y. An image-based runway detection method for fixed-wing aircraft based on deep neural network. IET Image Process. 2024, 18, 1939–1949. [Google Scholar]
  13. Watanabe, Y.; Manecy, A.; Amiez, A.; Aoki, S.; Nagai, S. Fault-tolerant final approach navigation for a fixed-wing UAV by using long-range stereo camera system. In Proceedings of the 2020 International Conference on Unmanned Aircraft Systems (ICUAS), Athens, Greece, 1–4 September 2020; pp. 1065–1074. [Google Scholar]
  14. Aytekin, Ö.; Zöngür, U.; Halici, U. Texture-Based Airport Runway Detection. IEEE Geosci. Remote Sens. Lett. 2013, 10, 471–475. [Google Scholar] [CrossRef]
  15. Ducoffe, M.; Carrere, M.; F’eliers, L.; Gauffriau, A.; Mussot, V.; Pagetti, C.; Sammour, T. LARD—Landing Approach Runway Detection—Dataset for Vision Based Landing. arXiv 2023, arXiv:2304.09938. [Google Scholar]
  16. Ye, R.; Tao, C.; Yan, B.; Yang, T. Research on Vision-based Autonomous Landing of Unmanned Aerial Vehicle. In Proceedings of the 2020 IEEE 3rd International Conference on Automation, Electronics and Electrical Engineering (AUTEEE), Shenyang, China, 20–22 November 2020; pp. 348–354. [Google Scholar]
  17. Yan, C.C.; Gong, B.; Wei, Y.; Gao, Y. Deep Multi-View Enhancement Hashing for Image Retrieval. IEEE Trans. Pattern Anal. Mach. Intell. 2020, 43, 1445–1451. [Google Scholar] [CrossRef] [PubMed]
  18. Yan, C.C.; Li, Z.; Zhang, Y.; Liu, Y.; Ji, X.; Zhang, Y. Depth Image Denoising Using Nuclear Norm and Learning Graph Model. ACM Trans. Multimed. Comput. Commun. Appl. (TOMM) 2020, 16, 1–17. [Google Scholar] [CrossRef]
  19. Yan, C.C.; Hao, Y.; Li, L.; Yin, J.; Liu, A.; Mao, Z.; Chen, Z.; Gao, X. Task-Adaptive Attention for Image Captioning. IEEE Trans. Circuits Syst. Video Technol. 2021, 32, 43–51. [Google Scholar] [CrossRef]
  20. Yan, C.C.; Teng, T.; Liu, Y.; Zhang, Y.; Wang, H.; Ji, X. Precise No-Reference Image Quality Evaluation Based on Distortion Identification. ACM Trans. Multimed. Comput. Commun. Appl. (TOMM) 2021, 17, 1–21. [Google Scholar] [CrossRef]
  21. Yan, C.; Meng, L.; Li, L.; Zhang, J.; Wang, Z.; Yin, J.; Zhang, J.; Sun, Y.; Zheng, B. Age-Invariant Face Recognition by Multi-Feature Fusionand Decomposition with Self-attention. ACM Trans. Multimed. Comput. Commun. Appl. (TOMM) 2022, 18, 1–18. [Google Scholar] [CrossRef]
  22. Jiang, L.; Xie, Y.; Ren, T. A Deep Neural Networks Approach for Pixel-Level Runway Pavement Crack Segmentation Using Drone-Captured Images. arXiv 2020, arXiv:2001.03257. [Google Scholar]
  23. Shelhamer, E.; Long, J.; Darrell, T. Fully convolutional networks for semantic segmentation. In Proceedings of the 2015 IEEE Conference on Computer Vision and Pattern Recognition (CVPR), Boston, MA, USA, 7–12 June 2014; pp. 3431–3440. [Google Scholar]
  24. Ronneberger, O.; Fischer, P.; Brox, T. U-Net: Convolutional Networks for Biomedical Image Segmentation. arXiv 2015, arXiv:1505.04597. [Google Scholar]
  25. He, K.; Gkioxari, G.; Dollár, P.; Girshick, R.B. Mask R-CNN. In Proceedings of the 2017 IEEE International Conference on Computer Vision (ICCV), Venice, Italy, 22–29 October 2017; pp. 2980–2988. [Google Scholar]
  26. Ma, N.; Weng, X.; Cao, Y.; Wu, L. Monocular-Vision-Based Precise Runway Detection Applied to State Estimation for Carrier-Based UAV Landing. Sensors 2022, 22, 8385. [Google Scholar] [CrossRef]
  27. Nagarani, N.; Venkatakrishnan, P.; Balaji, N. Unmanned Aerial vehicle’s runway landing system with efficient target detection by using morphological fusion for military surveillance system. Comput. Commun. 2020, 151, 463–472. [Google Scholar] [CrossRef]
  28. Kordos, D.; Krzaczkowski, P.; Rzucidło, P.; Gomolka, Z.; Żesławska, E.; Twaróg, B. Vision System Measuring the Position of an Aircraft in Relation to the Runway during Landing Approach. Sensors 2023, 23, 1560. [Google Scholar] [CrossRef]
  29. Brabandere, B.D.; Neven, D.; Gool, L.V. Semantic Instance Segmentation with a Discriminative Loss Function. arXiv 2017, arXiv:1708.02551. [Google Scholar]
  30. Bai, M.; Urtasun, R. Deep Watershed Transform for Instance Segmentation. In Proceedings of the 2017 IEEE Conference on Computer Vision and Pattern Recognition (CVPR), Honolulu, HI, USA, 21–26 July 2016; pp. 2858–2866. [Google Scholar]
  31. Zhao, Q.; Liu, B.; Lyu, S.; Wang, C.; Yang, Y. Enhancing Spatial Consistency and Class-Level Diversity for Segmenting Fine-Grained Objects. In Proceedings of the International Conference on Neural Information Processing, Changsha, China, 20–23 November 2023. [Google Scholar]
  32. Li, Y.; Qi, H.; Dai, J.; Ji, X.; Wei, Y. Fully Convolutional Instance-Aware Semantic Segmentation. In Proceedings of the 2017 IEEE Conference on Computer Vision and Pattern Recognition (CVPR), Honolulu, HI, USA, 21–26 July 2017; pp. 4438–4446. [Google Scholar]
  33. Chen, X.; Girshick, R.B.; He, K.; Dollár, P. TensorMask: A Foundation for Dense Object Segmentation. In Proceedings of the 2019 IEEE/CVF International Conference on Computer Vision (ICCV), Seoul, Republic of Korea, 27 October–2 November 2019; pp. 2061–2069. [Google Scholar]
  34. Pinheiro, P.H.O.; Collobert, R.; Dollár, P. Learning to Segments Objects Candidates. In Proceedings of the Neural Information Processing Systems, Montreal, QC, Canada, 7–12 December 2015. [Google Scholar]
  35. Liu, S.; Qi, L.; Qin, H.; Shi, J.; Jia, J. Path Aggregation Network for Instance Segmentation. In Proceedings of the 2018 IEEE/CVF Conference on Computer Vision and Pattern Recognition, Salt Lake City, UT, USA, 18–23 June 2018; pp. 8759–8768. [Google Scholar]
  36. Huang, Z.; Huang, L.; Gong, Y.; Huang, C.; Wang, X. Mask Scoring R-CNN. In Proceedings of the 2019 IEEE/CVF Conference on Computer Vision and Pattern Recognition (CVPR), Long Beach, CA, USA, 15–20 June 2019; pp. 6402–6411. [Google Scholar]
  37. Redmon, J.; Divvala, S.K.; Girshick, R.B.; Farhadi, A. You Only Look Once: Unified, Real-Time Object Detection. In Proceedings of the 2016 IEEE Conference on Computer Vision and Pattern Recognition (CVPR), Las Vegas, NV, USA, 27–30 June 2015; pp. 779–788. [Google Scholar]
  38. Redmon, J.; Farhadi, A. YOLO9000: Better, Faster, Stronger. In Proceedings of the 2017 IEEE Conference on Computer Vision and Pattern Recognition (CVPR), Honolulu, HI, USA, 21–26 July 2017; pp. 6517–6525. [Google Scholar]
  39. Redmon, J.; Farhadi, A. YOLOv3: An Incremental Improvement. arXiv 2018, arXiv:1804.02767. [Google Scholar]
  40. Bochkovskiy, A.; Wang, C.Y.; Liao, H.Y.M. YOLOv4: Optimal Speed and Accuracy of Object Detection. arXiv 2020, arXiv:2004.10934. [Google Scholar]
  41. Zhu, X.; Lyu, S.; Wang, X.; Zhao, Q. TPH-YOLOv5: Improved YOLOv5 Based on Transformer Prediction Head for Object Detection on Drone-captured Scenarios. In Proceedings of the 2021 IEEE/CVF International Conference on Computer Vision Workshops (ICCVW), Montreal, BC, Canada, 11–17 October 2021; pp. 2778–2788. [Google Scholar]
  42. Zhao, Q.; Liu, B.; Lyu, S.; Wang, C.; Zhang, H. TPH-YOLOv5++: Boosting Object Detection on Drone-Captured Scenarios with Cross-Layer Asymmetric Transformer. Remote Sens. 2023, 15, 1687. [Google Scholar] [CrossRef]
  43. Wang, Q.; Feng, W.; Yao, L.; Chen, Z.; Liu, B.; Chen, L. TPH-YOLOv5-Air: Airport Confusing Object Detection via Adaptively Spatial Feature Fusion. Remote Sens. 2023, 15, 3883. [Google Scholar] [CrossRef]
  44. Li, C.; Li, L.; Jiang, H.; Weng, K.; Geng, Y.; Li, L.; Ke, Z.; Li, Q.; Cheng, M.; Nie, W.; et al. YOLOv6: A Single-Stage Object Detection Framework for Industrial Applications. arXiv 2022, arXiv:2209.02976. [Google Scholar]
  45. Wang, C.Y.; Bochkovskiy, A.; Liao, H.Y.M. YOLOv7: Trainable Bag-of-Freebies Sets New State-of-the-Art for Real-Time Object Detectors. In Proceedings of the 2023 IEEE/CVF Conference on Computer Vision and Pattern Recognition (CVPR), Vancouver, BC, Canada, 17–24 June 2022; pp. 7464–7475. [Google Scholar]
  46. Reis, D.; Kupec, J.; Hong, J.; Daoudi, A. Real-Time Flying Object Detection with YOLOv8. arXiv 2023, arXiv:2305.09972. [Google Scholar]
  47. Varghese, R.; Sambath, M. YOLOv8: A Novel Object Detection Algorithm with Enhanced Performance and Robustness. In Proceedings of the 2024 International Conference on Advances in Data Engineering and Intelligent Computing Systems (ADICS), Chennai, India, 18–19 April 2024; pp. 1–6. [Google Scholar]
  48. Lin, T.Y.; Goyal, P.; Girshick, R.B.; He, K.; Dollár, P. Focal Loss for Dense Object Detection. In Proceedings of the 2017 IEEE International Conference on Computer Vision (ICCV), Venice, Italy, 22–29 October 2017; pp. 2999–3007. [Google Scholar]
  49. Bolya, D.; Zhou, C.; Xiao, F.; Lee, Y.J. YOLACT: Real-Time Instance Segmentation. In Proceedings of the 2019 IEEE/CVF International Conference on Computer Vision (ICCV), Seoul, Republic of Korea, 27 October–2 November 2019; pp. 9156–9165. [Google Scholar]
  50. Bolya, D.; Zhou, C.; Xiao, F.; Lee, Y.J. YOLACT++ Better Real-Time Instance Segmentation. IEEE Trans. Pattern Anal. Mach. Intell. 2019, 44, 1108–1121. [Google Scholar] [CrossRef] [PubMed]
  51. Wang, X.; Kong, T.; Shen, C.; Jiang, Y.; Li, L. SOLO: Segmenting Objects by Locations. arXiv 2019, arXiv:1912.04488. [Google Scholar]
  52. Wang, X.; Zhang, R.; Kong, T.; Li, L.; Shen, C. SOLOv2: Dynamic and Fast Instance Segmentation. arXiv 2020, arXiv:2003.10152. [Google Scholar]
  53. Tian, Z.; Shen, C.; Chen, H.; He, T. FCOS: Fully Convolutional One-Stage Object Detection. In Proceedings of the 2019 IEEE/CVF International Conference on Computer Vision (ICCV), Seoul, Republic of Korea, 27 October–2 November 2019; pp. 9626–9635. [Google Scholar]
  54. Xie, E.; Sun, P.; Song, X.; Wang, W.; Liu, X.; Liang, D.; Shen, C.; Luo, P. PolarMask: Single Shot Instance Segmentation with Polar Representation. In Proceedings of the 2020 IEEE/CVF Conference on Computer Vision and Pattern Recognition (CVPR), Seattle, WA, USA, 13–19 June 2019; pp. 12190–12199. [Google Scholar]
  55. Xie, E.; Wang, W.; Ding, M.; Zhang, R.; Luo, P. PolarMask++: Enhanced Polar Representation for Single-Shot Instance Segmentation and Beyond. IEEE Trans. Pattern Anal. Mach. Intell. 2021, 44, 5385–5400. [Google Scholar] [CrossRef] [PubMed]
  56. Sofiiuk, K.; Barinova, O.; Konushin, A. AdaptIS: Adaptive Instance Selection Network. In Proceedings of the 2019 IEEE/CVF International Conference on Computer Vision (ICCV), Seoul, Republic of Korea, 27 October–2 November 2019; pp. 7354–7362. [Google Scholar]
  57. Chen, W.; Zhang, Z.; Yu, L.; Tai, Y. BARS: A benchmark for airport runway segmentation. Appl. Intell. 2022, 53, 20485–20498. [Google Scholar] [CrossRef]
  58. Ryu, H.; Lee, H.; Kim, K. Performance Comparison of Deep Learning Networks for Runway Recognition in Small Edge Computing Environment. In Proceedings of the 2023 IEEE/AIAA 42nd Digital Avionics Systems Conference (DASC), San Diego, CA, USA, 1–5 October 2023; pp. 1–6. [Google Scholar]
  59. Men, Z.; Jie, J.; Xian, G.; Lijun, C.; Liu, D. Airport runway semantic segmentation based on dcnn in high spatial resolution remote sensing images. Int. Arch. Photogramm. Remote Sens. Spat. Inf. Sci. 2020, XLII-3/W10, 361–366. [Google Scholar] [CrossRef]
  60. Chatzikalymnios, E.; Moustakas, K. Autonomous vision-based landing of UAV’s on unstructured terrains. In Proceedings of the 2021 IEEE International Conference on Autonomous Systems (ICAS), Montréal, QC, Canada, 11–13 August 2021; pp. 1–5. [Google Scholar]
  61. Tripathi, A.K.; Patel, V.V.; Padhi, R. Vision Based Automatic Landing with Runway Identification and Tracking. In Proceedings of the 2018 15th International Conference on Control, Automation, Robotics and Vision (ICARCV), Singapore, 18–21 November 2018; pp. 1442–1447. [Google Scholar]
  62. Liu, C.; Cheng, I.; Basu, A. Real-Time Runway Detection for Infrared Aerial Image Using Synthetic Vision and an ROI Based Level Set Method. Remote Sens. 2018, 10, 1544. [Google Scholar] [CrossRef]
  63. Abu-Jbara, K.; Sundaramorthi, G.; Claudel, C.G. Fusing Vision and Inertial Sensors for Robust Runway Detection and Tracking. J. Guid. Control. Dyn. 2017, 41, 1929–1946. [Google Scholar] [CrossRef]
  64. Ajith, B.; Adlinge, S.D.; Dinesh, S.; Rajeev, U.P.; Padmakumar, E.S. Robust Method to Detect and Track the Runway during Aircraft Landing Using Colour segmentation and Runway features. In Proceedings of the 2019 3rd International Conference on Trends in Electronics and Informatics (ICOEI), Tirunelveli, India, 23–25 April 2019; pp. 751–757. [Google Scholar]
  65. Fan, Y.; Ding, M.; Cao, Y. Vision algorithms for fixed-wing unmanned aerial vehicle landing system. Sci. China Technol. Sci. 2017, 60, 434–443. [Google Scholar] [CrossRef]
  66. Wang, D.; Zhang, F.; Ma, F.; Hu, W.; Tang, Y.; Zhou, Y. A Benchmark Sentinel-1 SAR Dataset for Airport Detection. IEEE J. Sel. Top. Appl. Earth Obs. Remote Sens. 2022, 15, 6671–6686. [Google Scholar] [CrossRef]
  67. Akbar, J.; Shahzad, M.A.; Malik, M.I.; Ul-Hasan, A.; Shafait, F. Runway Detection and Localization in Aerial Images using Deep Learning. In Proceedings of the 2019 Digital Image Computing: Techniques and Applications (DICTA), Perth, Australia, 2–4 December 2019; pp. 1–8. [Google Scholar]
  68. Budak, Ü.; Halici, U.; Şengür, A.; Karabatak, M.; Xiao, Y. Efficient Airport Detection Using Line Segment Detector and Fisher Vector Representation. IEEE Geosci. Remote Sens. Lett. 2016, 13, 1079–1083. [Google Scholar] [CrossRef]
  69. Zhang, Q.; Zhang, L.; Shi, W.; Liu, Y. Airport Extraction via Complementary Saliency Analysis and Saliency-Oriented Active Contour Model. IEEE Geosci. Remote Sens. Lett. 2018, 15, 1085–1089. [Google Scholar] [CrossRef]
  70. Au, J.; Reid, D.; Bill, A. Challenges and Opportunities of Computer Vision Applications in Aircraft Landing Gear. In Proceedings of the 2022 IEEE Aerospace Conference (AERO), Big Sky, MT, USA, 5–12 March 2022; pp. 1–10. [Google Scholar]
  71. Daedalean. Visual Landing Guidance. Available online: https://www.daedalean.ai/products/landing. (accessed on 1 January 2024).
  72. Liujun, W.; Haitao, J.; Chongliang, L. An airport runway detection algorithm based on semantic segmentation. Navig. Position. Timing 2021, 8, 97–106. [Google Scholar] [CrossRef]
  73. Wu, L.; Cao, Y.; Ding, M.; Zhuang, L. Runway identification tracking for vision-based autonomous landing of UAVs. Microcontroll. Embed. Syst. Appl. 2017, 17, 6. [Google Scholar]
  74. Cheng, B.; Misra, I.; Schwing, A.G.; Kirillov, A.; Girdhar, R. Masked-attention Mask Transformer for Universal Image Segmentation. In Proceedings of the 2022 IEEE/CVF Conference on Computer Vision and Pattern Recognition (CVPR), New Orleans, LA, USA, 18–24 June 2022; pp. 1280–1289. [Google Scholar]
  75. Liu, Y.; Li, H.; Hu, C.; Luo, S.; Luo, Y.; Chen, C.W. Learning to Aggregate Multi-Scale Context for Instance Segmentation in Remote Sensing Images. IEEE Trans. Neural Netw. Learn. Syst. 2024, 1–15. [Google Scholar] [CrossRef] [PubMed]
Figure 1. Sketch of the working principle of fixed-wing UAV visual-based autonomous landing system. Illustrates the working principle of the vision-based autonomous landing system for fixed-wing UAVs, highlighting key factors such as aiming point distance, lateral and vertical path angles, and Euler angles (pitch, roll, and yaw).
Remotesensing 16 02161 g001
Figure 2. Illustrates the various challenges in runway instance segmentation for visual-based autonomous landing systems. Each group of images in this figure contains two parts: the upper part displays the original visual images, while the lower part represents the ground truth labels for runway instance segmentation. (ad) Demonstrate weather variability and complex backgrounds. (e,f) Highlight significant scale differences. (g,h) Show substantial aspect ratio differences.
Remotesensing 16 02161 g002
Figure 3. Samples of annotated images in RLD. The different colored lines and symbols represent different instance. (a) Different weather conditions (sunny, cloudy, foggy, and night). (b) Different geographical environments (oceans, jungles, mountains, and plains). (c) Different scenes (deserts, cities, villages, and cockpit views). (d) Entire landing processes (from far to near, from high to low, and from the air to the ground). (e) Diverse styles of runways (single and multiple).
Remotesensing 16 02161 g003
Figure 4. Geographic distribution of landing runways worldwide: ensuring geographic diversity and global generalization of RLD. The red symbols indicate the location of airports.
Remotesensing 16 02161 g004
Figure 5. Detailed network structure of YOLOv8: backbone, multi-scale feature fusion, and decoupled head for enhanced visual AI tasks.
Remotesensing 16 02161 g005
Figure 6. Overview of VALNet: Integrating Context Enhancement Module (CEM), Asymptotic Feature Pyramid Network (AFPN), and Orientation Adaptation Module (OAM) for vision-based autonomous landing segmentation.
Remotesensing 16 02161 g006
Figure 7. Image decomposition examples of low-frequency and high-frequency information. Each original image is decomposed into its low-frequency and high-frequency components. The upper part displays the original visual image, while the lower part shows the corresponding annotated images. The second column demonstrates the relatively smooth low-pass components, whereas the third column highlights the clearer details and contours of the high-pass components. This decomposition aids in highlighting runway edges and essential details for more effective segmentation.
Remotesensing 16 02161 g007
Figure 8. Example of band-pass filter. The application of band-pass filtering methods facilitates the effective extraction of runway features, distinguishing high-frequency runway edges from low-frequency backgrounds, and enhancing sensitivity to target areas in VALNet’s instance segmentation.
Remotesensing 16 02161 g008
Figure 9. Architectural overview of Context Enhancement Module (CEM). CEM integrates both low-pass and high-pass filtering pathways to amplify task-relevant semantic information and suppress irrelevant texture details. Through a combination of heatmap-guided low-pass filtering and weighted spatial attention mechanisms, CEM enhances the model’s perception of target regions, providing a refined and focused representation of runway features.
Remotesensing 16 02161 g009
Figure 10. Architecture of the Asymptotic Feature Pyramid Network. AFPN addresses the challenge of the semantic gap by enabling direct interaction between non-adjacent layers and the progressive fusion of high-level features.
Remotesensing 16 02161 g010
Figure 11. Structure diagram of Orientation Adaptation Module. The Orientation Adaptation Module (OAM) integrates rotation information to enhance the model’s robustness to directional changes in real-world landing scenarios. By fusing rotation information directly into the segmentation head, the model accurately perceives the relative position and orientation between the aircraft and the runway. The triple-channel design allows for the comprehensive capture of rotational transformations, enhancing the model’s ability to adapt to varying orientations in the input images.
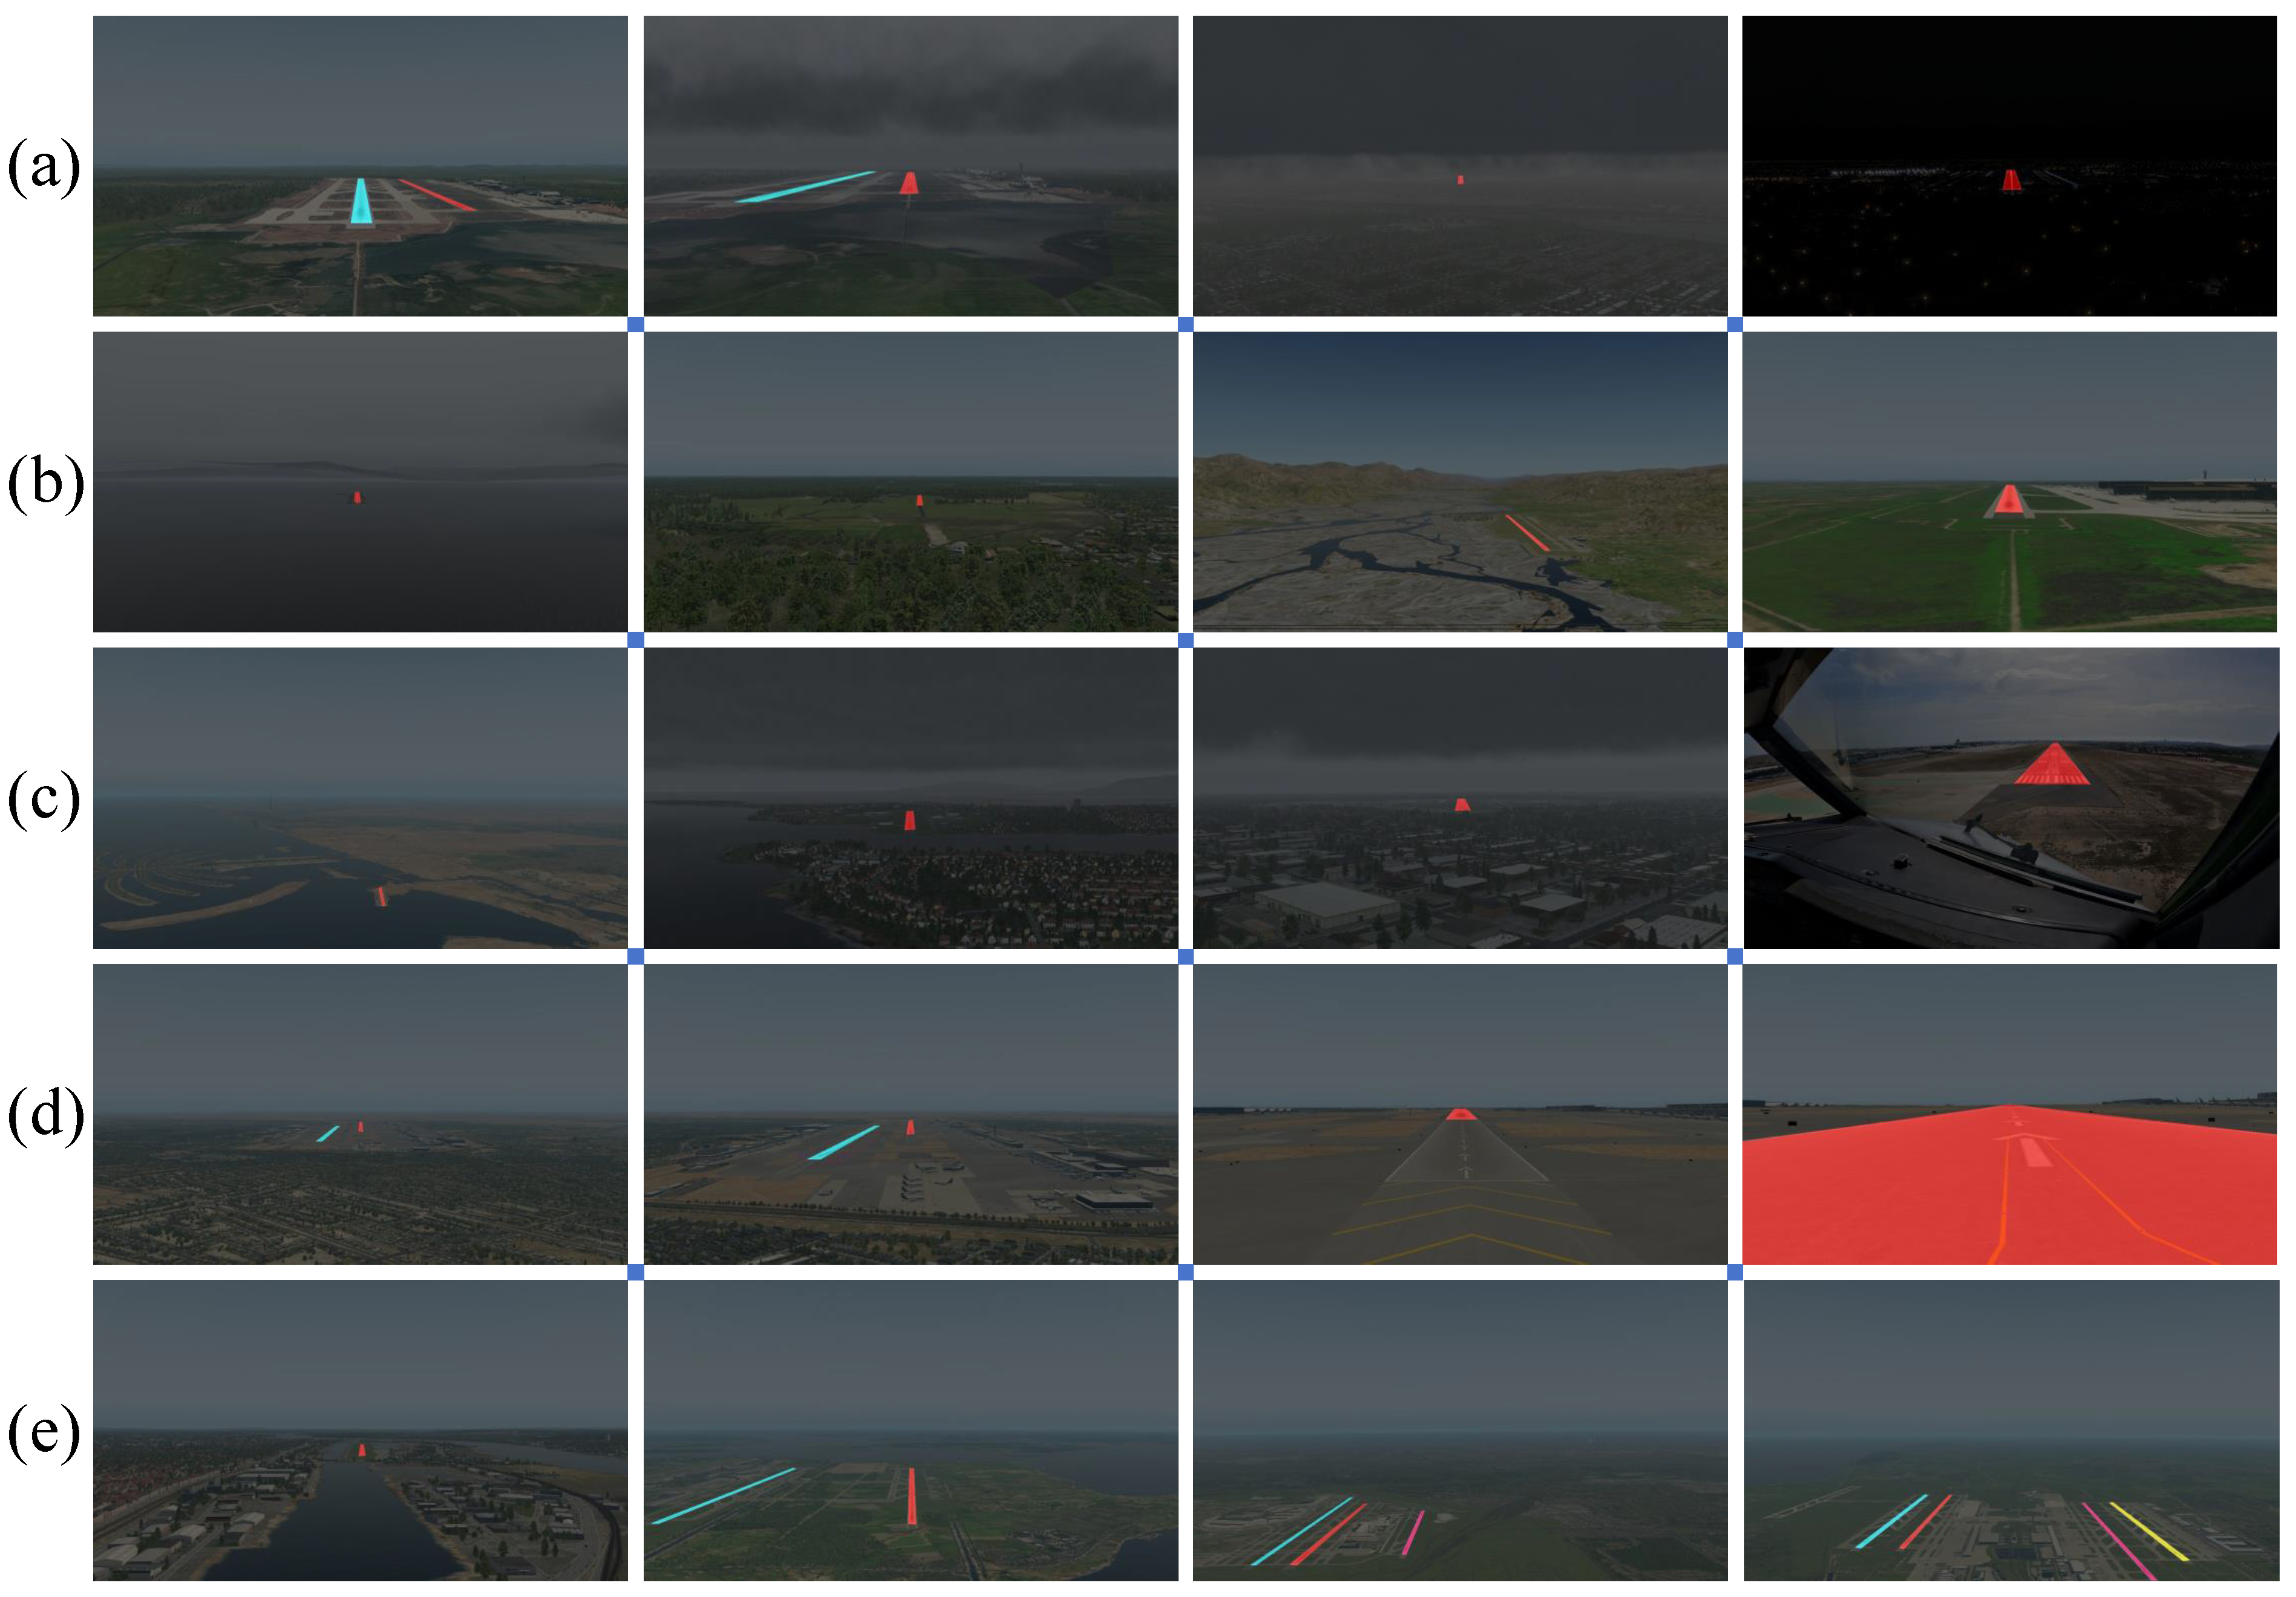
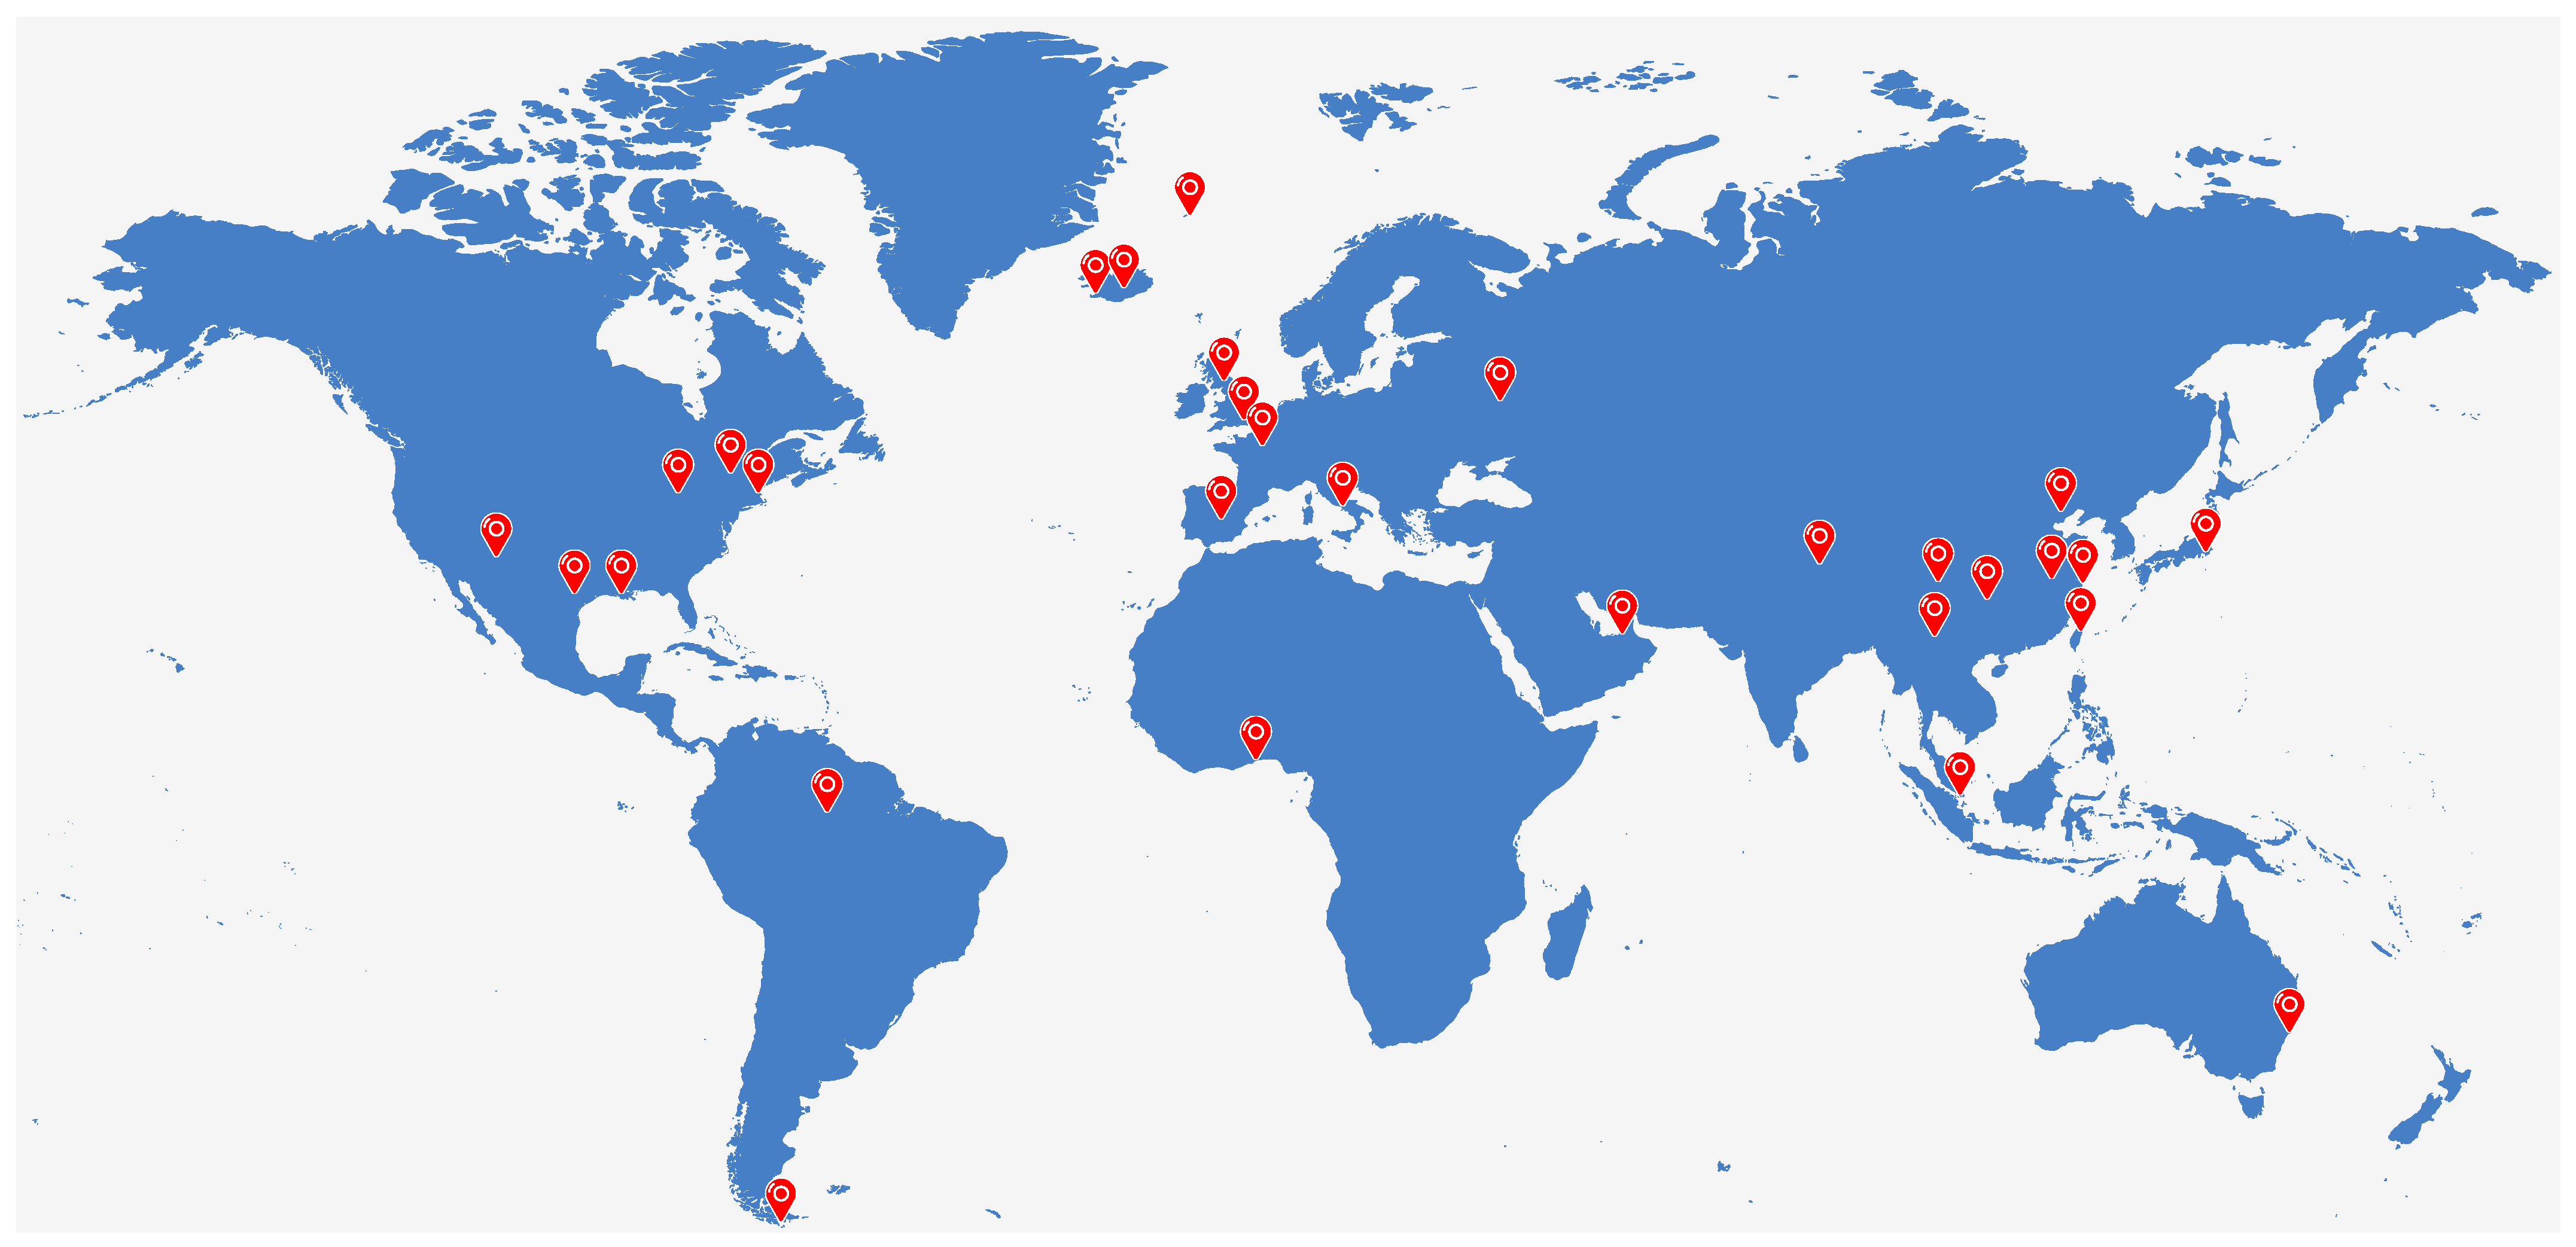
Remotesensing 16 02161 g011
Figure 12. The prediction visualization before and after OAM.
Remotesensing 16 02161 g012
Figure 13. The prediction visualization of five different models, SOLOv2,YOLACT++, Mask R-CNN, YOLOv8-seg and our VALNet.
Remotesensing 16 02161 g013
Figure 14. The prediction visualization of four different models, YOLACT++, Mask R-CNN, YOLOv8-seg and our VALNet.
Remotesensing 16 02161 g014
Table 1. Comparison of RLD and other runway datasets.
DatasetSourceNumber of ImagesImage SizeFull Landings ProcessPublicly Available
Runway Dataset [72]Internet and Collection by UAV27011242 × 375FalseFalse
BARSX-Plane10,2561920 × 1080FalseTrue
Dataset in [73]Flight Gear953520 × 1224FalseFalse
Dataset in [62]Flight Gear24001280 × 800FalseFalse
Dataset in [14]Satellite Images5714,000 × 11,000FalseFalse
Dataset in [67]Satellite Images700256 × 256FalseFalse
Dataset in [59]Satellite Images13001536 × 1536FalseFalse
RLDX-Plane and Internet12,2391280 × 720TrueTrue
Table 2. Various sizes of runway objects.
IntervalsSmallMediumLarge
Proportion52.5%26.5%19.0%
Table 3. Distribution of runway aspect ratios.
Range ( 0 , 0.5 ] ( 0.5 , 1 ] ( 1 , 2 ] ( 2 , 22.4 ]
Proportion25.9%31.8%17.9%24.4%
Table 4. Ratio of runway area with bounding box area.
Range ( 0 , 0.25 ] ( 0.25 , 0.5 ] ( 0.5 , 0.75 ] ( 0.75 , 1 ]
Proportion19%4%33%44%
Table 5. Training parameters setup.
ParametersSetup
Epochs50
Batch Size12
OptimizerSGD
NMS IoU0.7
Initial Learning Rate0.01
Final Learning Rate0.0001
Momentum0.937
Weight-Decay0.0005
Table 6. The results of VALNet and the current SOTA methods on the RLD.
MethodmAP [%]AP50 [%]AP75 [%]fpsParamsGFLOPs
Mask R-CNN [25]59.580.766.0121.344.4M113
Mask2Former [74]42.177.535.882.241.0M256
YOLACT [49]44.679.139.5121.435.3M68.4
YOLACT++ [50]47.583.842.133.542.14M21.4
SOLOv1 [51]33.753.629.0125.336.3M101
SOLOv2 [52]34.954.729.6120.446.6M112
PolarMask [54]36.857.034.726.334.7M253.6
YOLOv8-seg [47]65.989.869.581.111.8M42.4
CATNet [75]65.185.970.524.0554.7M186.1
VALNet69.496.374.875.912.4M43.1
Table 7. Results of VALNet and current SOTA methods on BARS.
MethodmAP [%]AP50 [%]AP75 [%]
Mask R-CNN [25]82.095.986.5
Mask2Former [74]71.384.663.9
YOLACT [49]66.293.777.9
YOLACT++ [50]70.396.881.3
SOLOv1 [51]63.187.972.5
SOLOv2 [52]68.293.977.8
PolarMask [54]64.788.374.5
YOLOv8-seg [47]79.997.985.9
CATNet [75]78.690.281.3
VALNet83.598.687.8
Table 8. Results of VALNet and current SOTA methods on COCO2017.
MethodmAP [%]AP50 [%]AP75 [%]
Mask R-CNN [25]39.842.235.6
Mask2Former [74]44.248.737.3
YOLACT [49]29.848.531.2
YOLACT++ [50]34.653.836.9
SOLOv1 [51]37.859.540.4
SOLOv2 [52]47.763.245.5
PolarMask [54]36.259.437.7
YOLOv8-seg [47]38.742.029.7
CATNet [75]40.546.732.0
VALNet41.345.633.5
Table 9. Ablation experiments on RLD.
BaselineCEMAFPNOAMmAP [%]AP50 [%]AP75 [%]
   65.989.869.5
  67.392.473.3
  66.190.269.8
  67.492.373.6
 67.792.673.9
 68.294.374.5
 67.692.773.1
69.496.374.8
Table 10. Ablation experiments on heatmap guided path.
MethodmAP [%]AP50 [%]AP75 [%]
Baseline65.989.869.5
Baseline + CEM (without HGP)66.291.371.1
Baseline + CEM67.392.473.3
Table 11. Ablation study on downsampling stride of CEM.
StridemAP [%]AP50 [%]AP75 [%]
269.496.374.8
468.795.874.1
667.594.673.4
866.393.572.6
Table 12. Ablation experiments on adaptive weights of OAM.
MethodmAP [%]AP50 [%]AP75 [%]
Baseline65.989.869.5
Baseline + OAM (Same weight)66.391.273.3
Baseline + OAM (Adaptive weight)67.492.373.6
Disclaimer/Publisher’s Note: The statements, opinions and data contained in all publications are solely those of the individual author(s) and contributor(s) and not of MDPI and/or the editor(s). MDPI and/or the editor(s) disclaim responsibility for any injury to people or property resulting from any ideas, methods, instructions or products referred to in the content.