Article

Lunar High Alumina Basalts in Mare Imbrium

by
Jingran Chen
1,
Shengbo Chen
2,3,
Ming Ma
1,* and
Yijun Jiang
1
1
School of Surveying and Exploration Engineering, Jilin Jianzhu University, Changchun 130118, China
2
College of Geoexploration Science and Technology, Jilin University, Changchun 130026, China
3
Center for Excellence in Comparative Planetology, Chinese Academy of Sciences, Hefei 230026, China
*
Author to whom correspondence should be addressed.
Remote Sens. 2024, 16(11), 2045; https://doi.org/10.3390/rs16112045
Submission received: 8 May 2024 / Revised: 28 May 2024 / Accepted: 4 June 2024 / Published: 6 June 2024
(This article belongs to the Section Satellite Missions for Earth and Planetary Exploration)

Abstract

:
High-alumina (HA) mare basalts play a critical role in lunar mantle differentiation. Although remote sensing methods have speculated their potential presence regions based on sample FeO and TiO2 compositions, the location and distribution characteristics of HA basalts have not been provided. In this study, the compositions of exposed rocks in Mare Imbrium were determined using Lunar Reconnaissance Orbiter (LRO) Diviner oxides and Lunar Prospector Gamma-Ray Spectrometer (LP-GRS) Thorium (Th) products. The exposed HA basalts were identified based on laboratory lithology classification criteria and Al2O3 abundance. The HA basalt units were mapped based on lunar topographic data, and their morphological geological characteristics were calculated based on elevation data. The results show that there are 8406 HA basalt pixels and 17 original units formed by volcanic eruptions in Mare Imbrium. The statistics of their morphology characteristics show that the HA basalts are widely distributed in the northern part of Mare Imbrium, and their compositions have a large range of variation. These units have different area and volume, and the layers formed were discontinuous. The characteristic analysis shows that the aluminum-bearing volcanic activities in Mare Imbrium were irregular. The eruptions of four different source regions occurred in three phases, and the scale and extent of the eruptions were different. The results in this study provide reliable evidence for the heterogeneity of the lunar mantle and contribute valuable information to the formation process of early lunar mantle materials.

1. Introduction

Mare basalt is an important part of the lunar surface and a hot topic in lunar origin and evolution research [1,2]. Mare basalts overlay approximately 17% of the lunar surface [3,4,5], and they are products of partial melting of the lunar mantle. The study of mare basalts with special compositions can reveal the chemical composition of lunar mantle sources [6,7], which is indicative of regional magmatism and volcanism [8], and provide important clues for understanding the thermal evolution of the moon [9].
High alumina (HA) basalt is defined as mare basalt with more than 11 wt% Al2O3 [6,10,11,12]. Its main compositions include plagioclase and pyroxene [13,14,15]. Compared with other types of basalts, its Al-rich character is derived from plagioclase retained in the eruptive source [11,16,17,18]. The unique Al2O3 abundance reflects the high proportion of plagioclase in magmatic ocean accumulation rocks [17], suggesting low efficiency differentiation of plagioclase in the upper lunar mantle [19]. After the Apollo 14 mission, HA basalts were divided into two types according to their petrogenesis: igneous rocks formed by thermal activity within volcanoes and melts produced by impact [20,21,22]. Both types of HA basalts were collected in the Apollo 14 mission [23,24]. The large radioactive age revealed that early aluminum volcanic activity may have originated from lunar crustal plagioclase differentiation or older events [5,25,26,27,28], recorded events such as plagioclase lunar crust formation (4.5–4.3 Ga), basin impact (3.9–3.8 Ga), and magma formation (4.3–3.85 Ga). In addition, distant sampling regions suggest that HA basalts may be widely distributed on the lunar surface, mostly buried beneath regolith or impact ejecta [11,12,29].
Compared with the basin formed by other impact events, the Imbrium basin is a multiring basin on the lunar nearside [30,31,32,33]. For many years, it has been widely studied by lunar geologists, and approximately 3.85 Ga was formed by the impact of Fe-rich objects [34,35,36,37]. Mare Imbrium contains ancient and young basalts [38], where the last lunar volcanic activity occurred [39]. Therefore, Mare Imbrium is an ideal region for studying basaltic volcanism [40].
According to the composition range of HA basalt samples (12–18 wt% FeO, 1–5 wt% TiO2, and 0–4 ppm Th), the Kramer team used Clementine Ultraviolet-Visible (UV-VIS) FeO and TiO2 and LP-GRS Th data, with FeO used as a proxy for Al2O3, and achieved the remote sensing identification of HA basalts in Mare Moscoviense, Nectaris, Fecunditatis, and Northern Imbrium. Their study used optical maturity parameter (OMAT [41]); this parameter is used to reflect the degree of influence of space weathering such as solar wind and galactic cosmic rays on the lunar regolith [42]. Different composition and age units are divided by the composition of adjacent immature craters. Their study concluded that most of the ancient HA basalts were buried by basin ejecta and basalt flow and were excavated to the regolith by small impacts as ejecta at different periods. They used small impact projectile analysis to identify 34 regions of interest (ROI) for possibly having HA basalts on the lunar surface [11,12,29]. Among them, the ROI in northern Imbrium is most likely to be the source of Apollo 14 samples [11,12]. However, there are four problems in their research: (1) The correlation between FeO and Al2O3 of HA basalt samples is low (R2 = 0.4923), and the method of using FeO to replace Al2O3 may not reflect the accurate abundance of Al2O3 in some regions. (2) The mixing of regolith material and HA basalts underestimates the area of the HA basalt units, and the mixing of highland material and HA basalts overestimates the amount of HA basalts. (3) The locations of the HA basalts were not provided. (4) The morphological and geological characteristics (layer thickness, unit area, and volume) of the HA basalt units formed by the original volcanic eruption were not calculated or analyzed. In addition, three challenges exist in HA basalt remote sensing identification based on Al2O3 abundance. (1) Due to the lack of correlation between the main oxide abundances of HA basalt samples, it is difficult to establish constraints on HA basalt remote sensing identification based on composition [43]. (2) Distinguishing distant ejecta or mixtures with more than 11 wt% Al2O3 from local HA basalts is difficult [11,44,45,46,47,48]. (3) The space resolution and coverage of existing composition data are inconsistent, the coverage of the high-resolution product CE-1 IIM (200 m/pixel, 75.4% coverage) is low, and the resolution of the high-coverage product LP-GRS (0.5 ppd, 100% coverage) is low.
To solve the above problems and current challenges, this paper uses the five main oxide products (Al2O3, TiO2, FeO, CaO, and MgO [43]) estimated from the Lunar Reconnaissance Orbiter (LRO) Diviner CF product, combined with the LP-GRS Th data and following the laboratory lithology classification criteria [49], and established the lunar lithology classification image. According to the composition relationship of adjacent pixels, the interference of the mare–highland mixture is excluded, and the HA basalt pixels are identified. Their distribution and the map of HA basalt units formed by the early volcanic eruption of Mare Imbrium are provided. The morphological and geological characteristics of these units are calculated, and the patterns and eruption characteristics of early aluminiferous volcanic activity on the moon are analyzed.

2. Materials and Methods

2.1. LRO Diviner Products

The Diviner oxide data used in this study were calculated by Ma et al. [43] based on the latest Christiansen Feature (CF) product [50]. LRO Diviner is a 9-channel push-broom radiometer that can obtain solar reflection and thermal infrared emission data over the moon [51]. The peak value at 8 μm wavelength calculated by the three channels has a sensitive feature to the lunar silicate mineral spectrum, named Christiansen Feature (CF, [50,52,53,54]). There is a correlation between the CF and oxide abundance [55,56]; thus, the CF can be used as a basis for the quantitative inversion of lunar element oxide abundance [57].
The original standard CF image (32 ppd, 52.4% coverage, 60° N/S) was calculated by Greenhagen et al. [52]. Their study estimated the location of Christiansen Feature by a three-point parabolic fit to the emissivity of three bands (7.55–8.05, 8.10–8.40, and 8.38–8.68) around 8 μm, and equally distributed channels in each 8 μm region between 60° N/S at low spatial resolution (32 ppd). They found that the CF value in the image was affected by three factors: geometry, space weathering, and compositions. Greenhagen et al. [52] used a polynomial fit across latitudes to smooth the CF values of the highlands and calculated the Normalize Equatorial Noon (NEN) CF image based on the offset of the smoothed values from the highlands, and the coverage of the image increased to 82.5%. With the continuous measurement of Diviner, its scientific team provided a standard CF image with 128 ppd and 99.86% coverage according to the calculation method of Greenhagen et al. [52]. These three images are preserved in the Planetary Data System (PDS) at the University of Washington. However, the CF values of the above three images did not fully reflect the compositional differences among different topographies, and some CF values are affected by unequal thermal changes and space weathering. Greenhagen et al. [53] completed topographic correction and provided an NEN CX3 CF image using the effect of topographical features with different albedos on CF values. Subsequently, based on the relationship between optical maturity parameters (OMAT) and the CF values of different lunar samples [56,58], Lucey et al. [50] used Kaguya OMAT and FeO abundance and related scale factors to correct the space weathering of NEN CX3 CF images, and the abnormal values in some regions caused by space weathering were basically eliminated. In the latest OMAT CX3 CF image [50], the CF value accurately reflects the lunar surface composition information and not affected by topography or space weathering [59].
Based on the relationship between OMAT CF values and the true composition values of 48 lunar sampling sites, Ma et al. [43] established a Back Propagation Neural Network (BPNN) training model, calculated six major elemental oxide(SiO2, Al2O3, MgO, CaO, TiO2, FeO) image products (32 ppd, 70° N/S). Among them, Diviner Al2O3 has the highest prediction accuracy among the six composition products, and the results exhibit a clear dichotomous distribution between mare and highlands (Figure 1). Notably, most of the mare with more than 11 wt% Al2O3 are near the highlands, indicating that HA basalts may be widely distributed in these regions and provide the preliminary candidate regions for remote sensing identification of HA basalts [60]. In addition, the rock abundance product provided by the Diviner team (128 ppd, 80° N/S) was used in this study to obtain the exposed rock pixels. The product was calculated by Bandfield et al. [61] using lunar surface thermal physical parameters and diurnal temperature difference data measured by LRO Diviner. After that, the lunar surface was divided into six units based on the rock abundance and regolith temperature data, and a threshold (rock abundance > 0.5 wt%) was established to distinguish the exposed rocks from surface regolith.

2.2. Remote Sensing Identification of HA Basalts

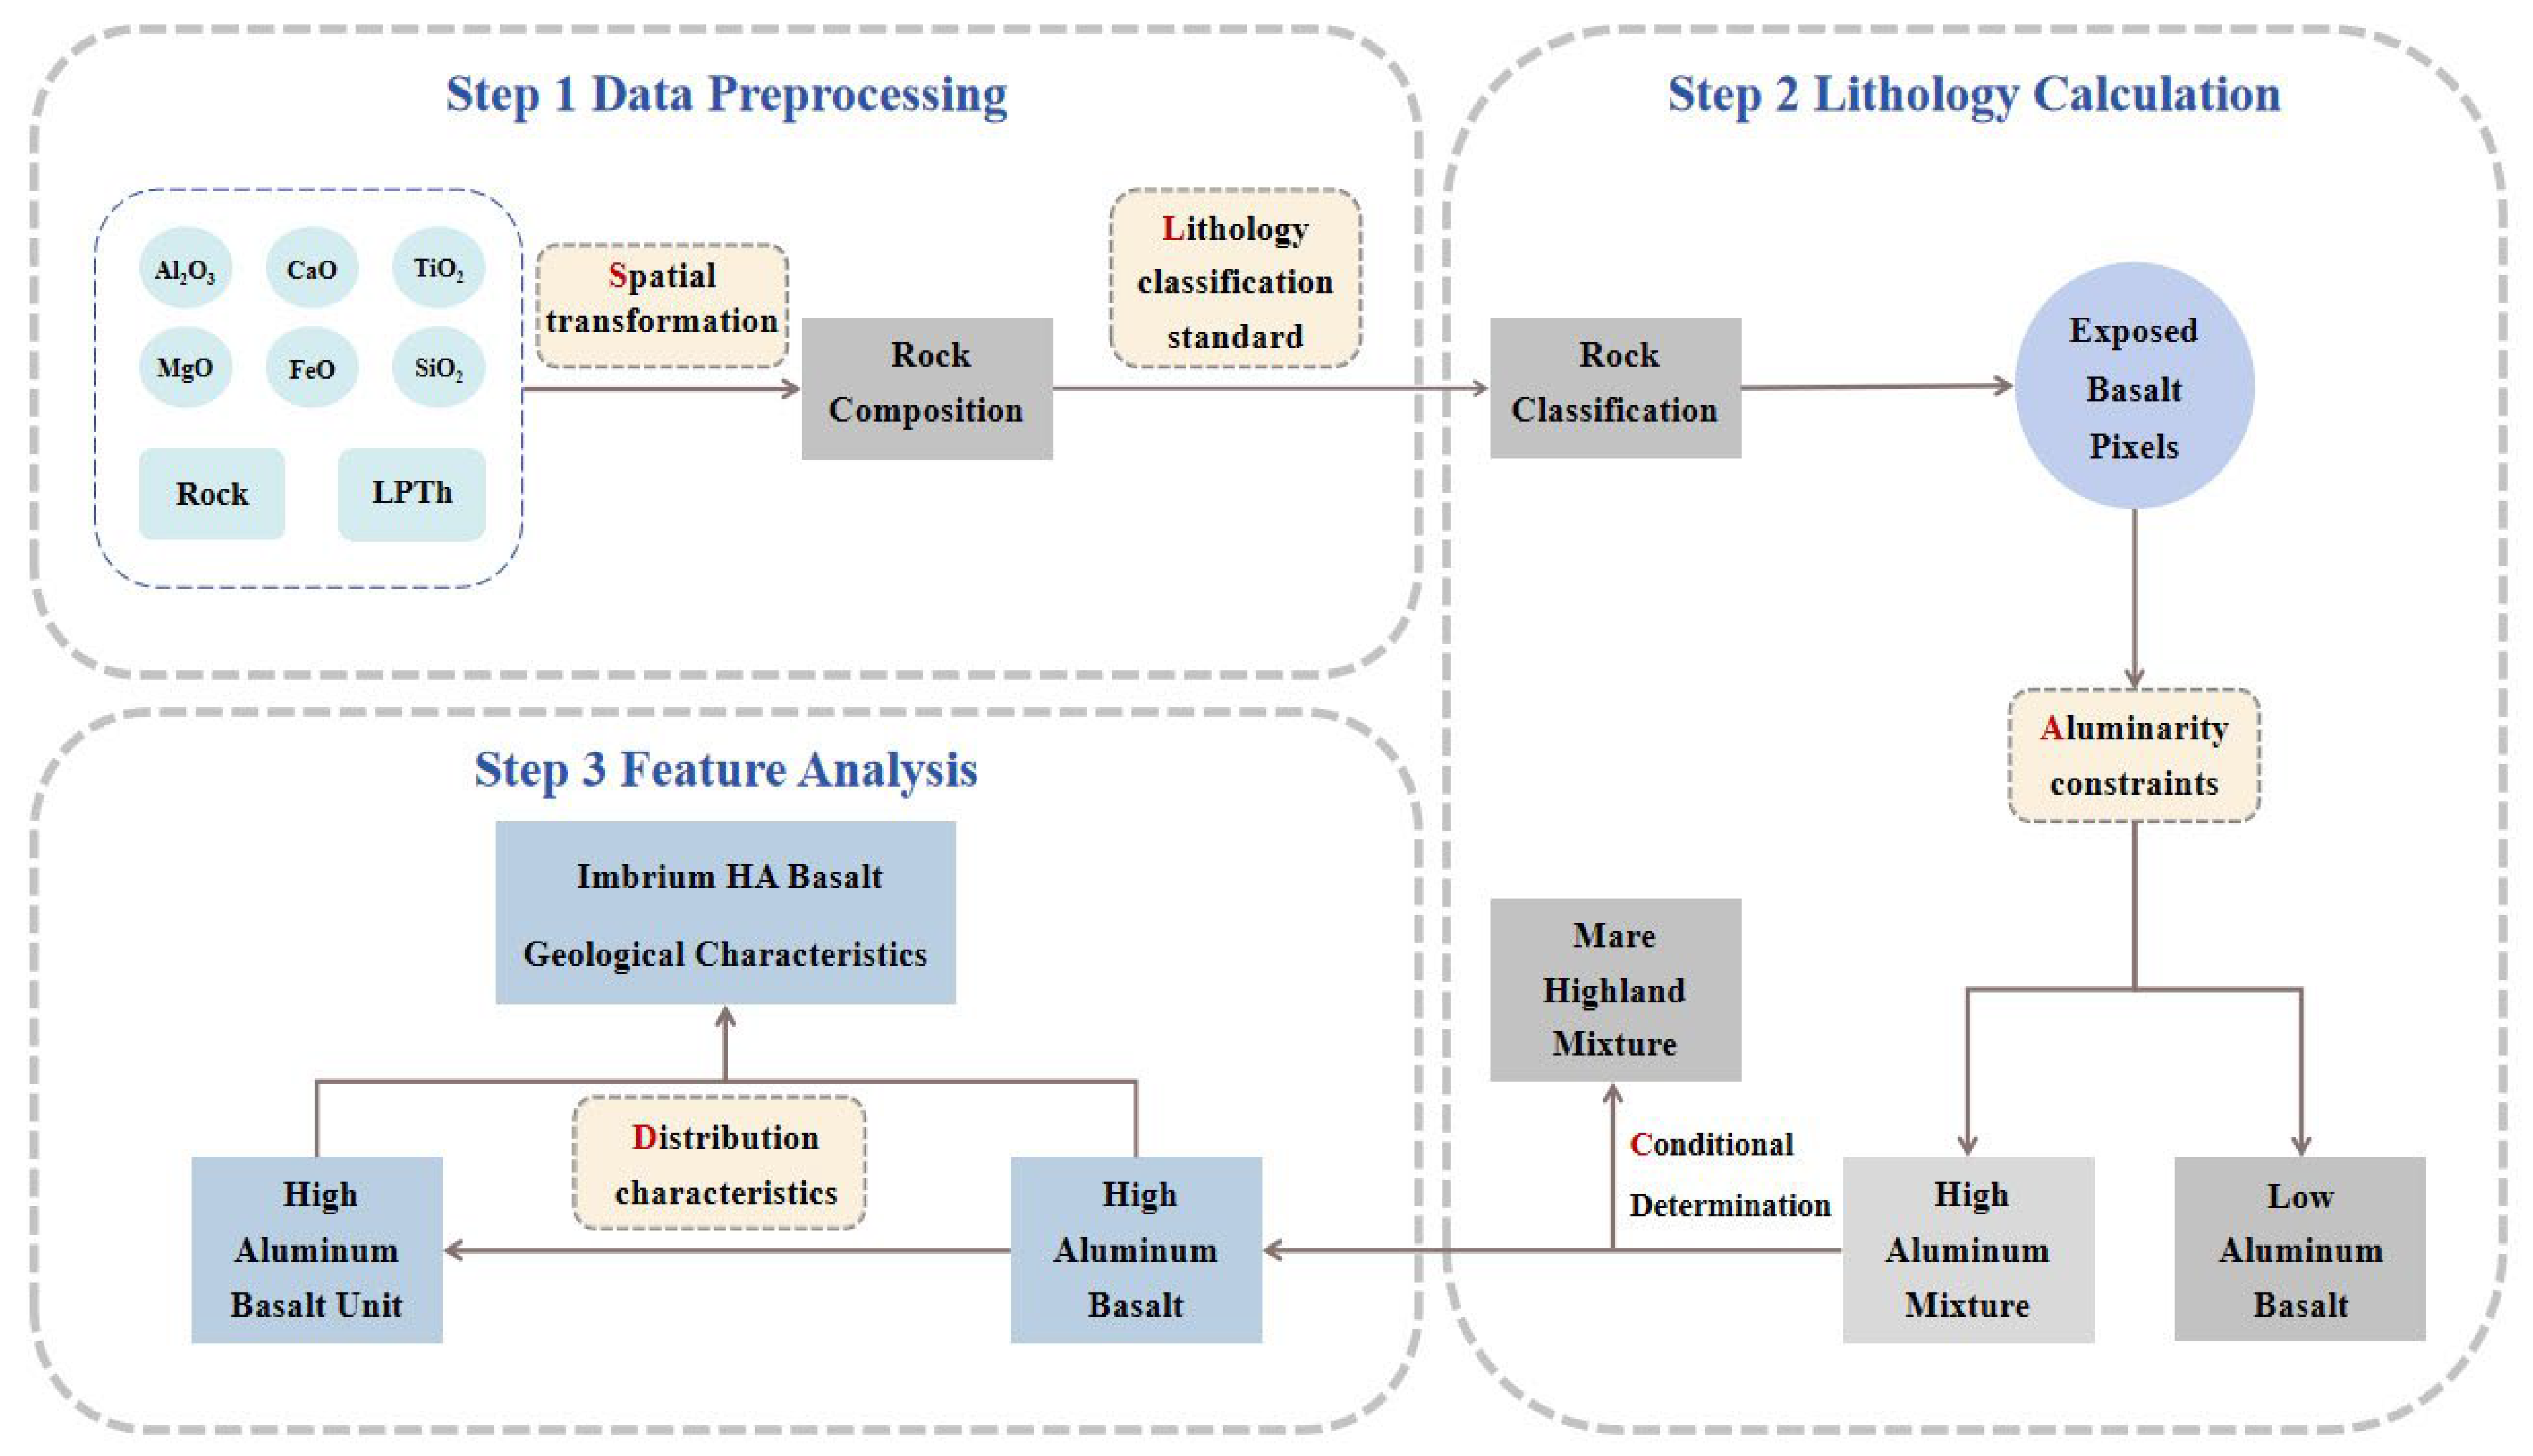
Distinguishing different rock types is the key to lunar lithology identification [49]. Lunar primitive rock suites mainly include the magnesian suite (MS), alkaline suite (AS), KREEP basalt suite, and mare basalt (MB) suite [63,64,65]. In this study, the Diviner oxide and LP-GRS Th data [66] are used as the composition criteria to distinguish rock types (Figure 2). Employing spatial transformation (64 × 64 oxides corresponding to 1 Th pixel) to unify their resolution, four rock types are identified according to laboratory lithology classification criteria (Table 1, [49]), and the lunar regolith lithology is obtained.
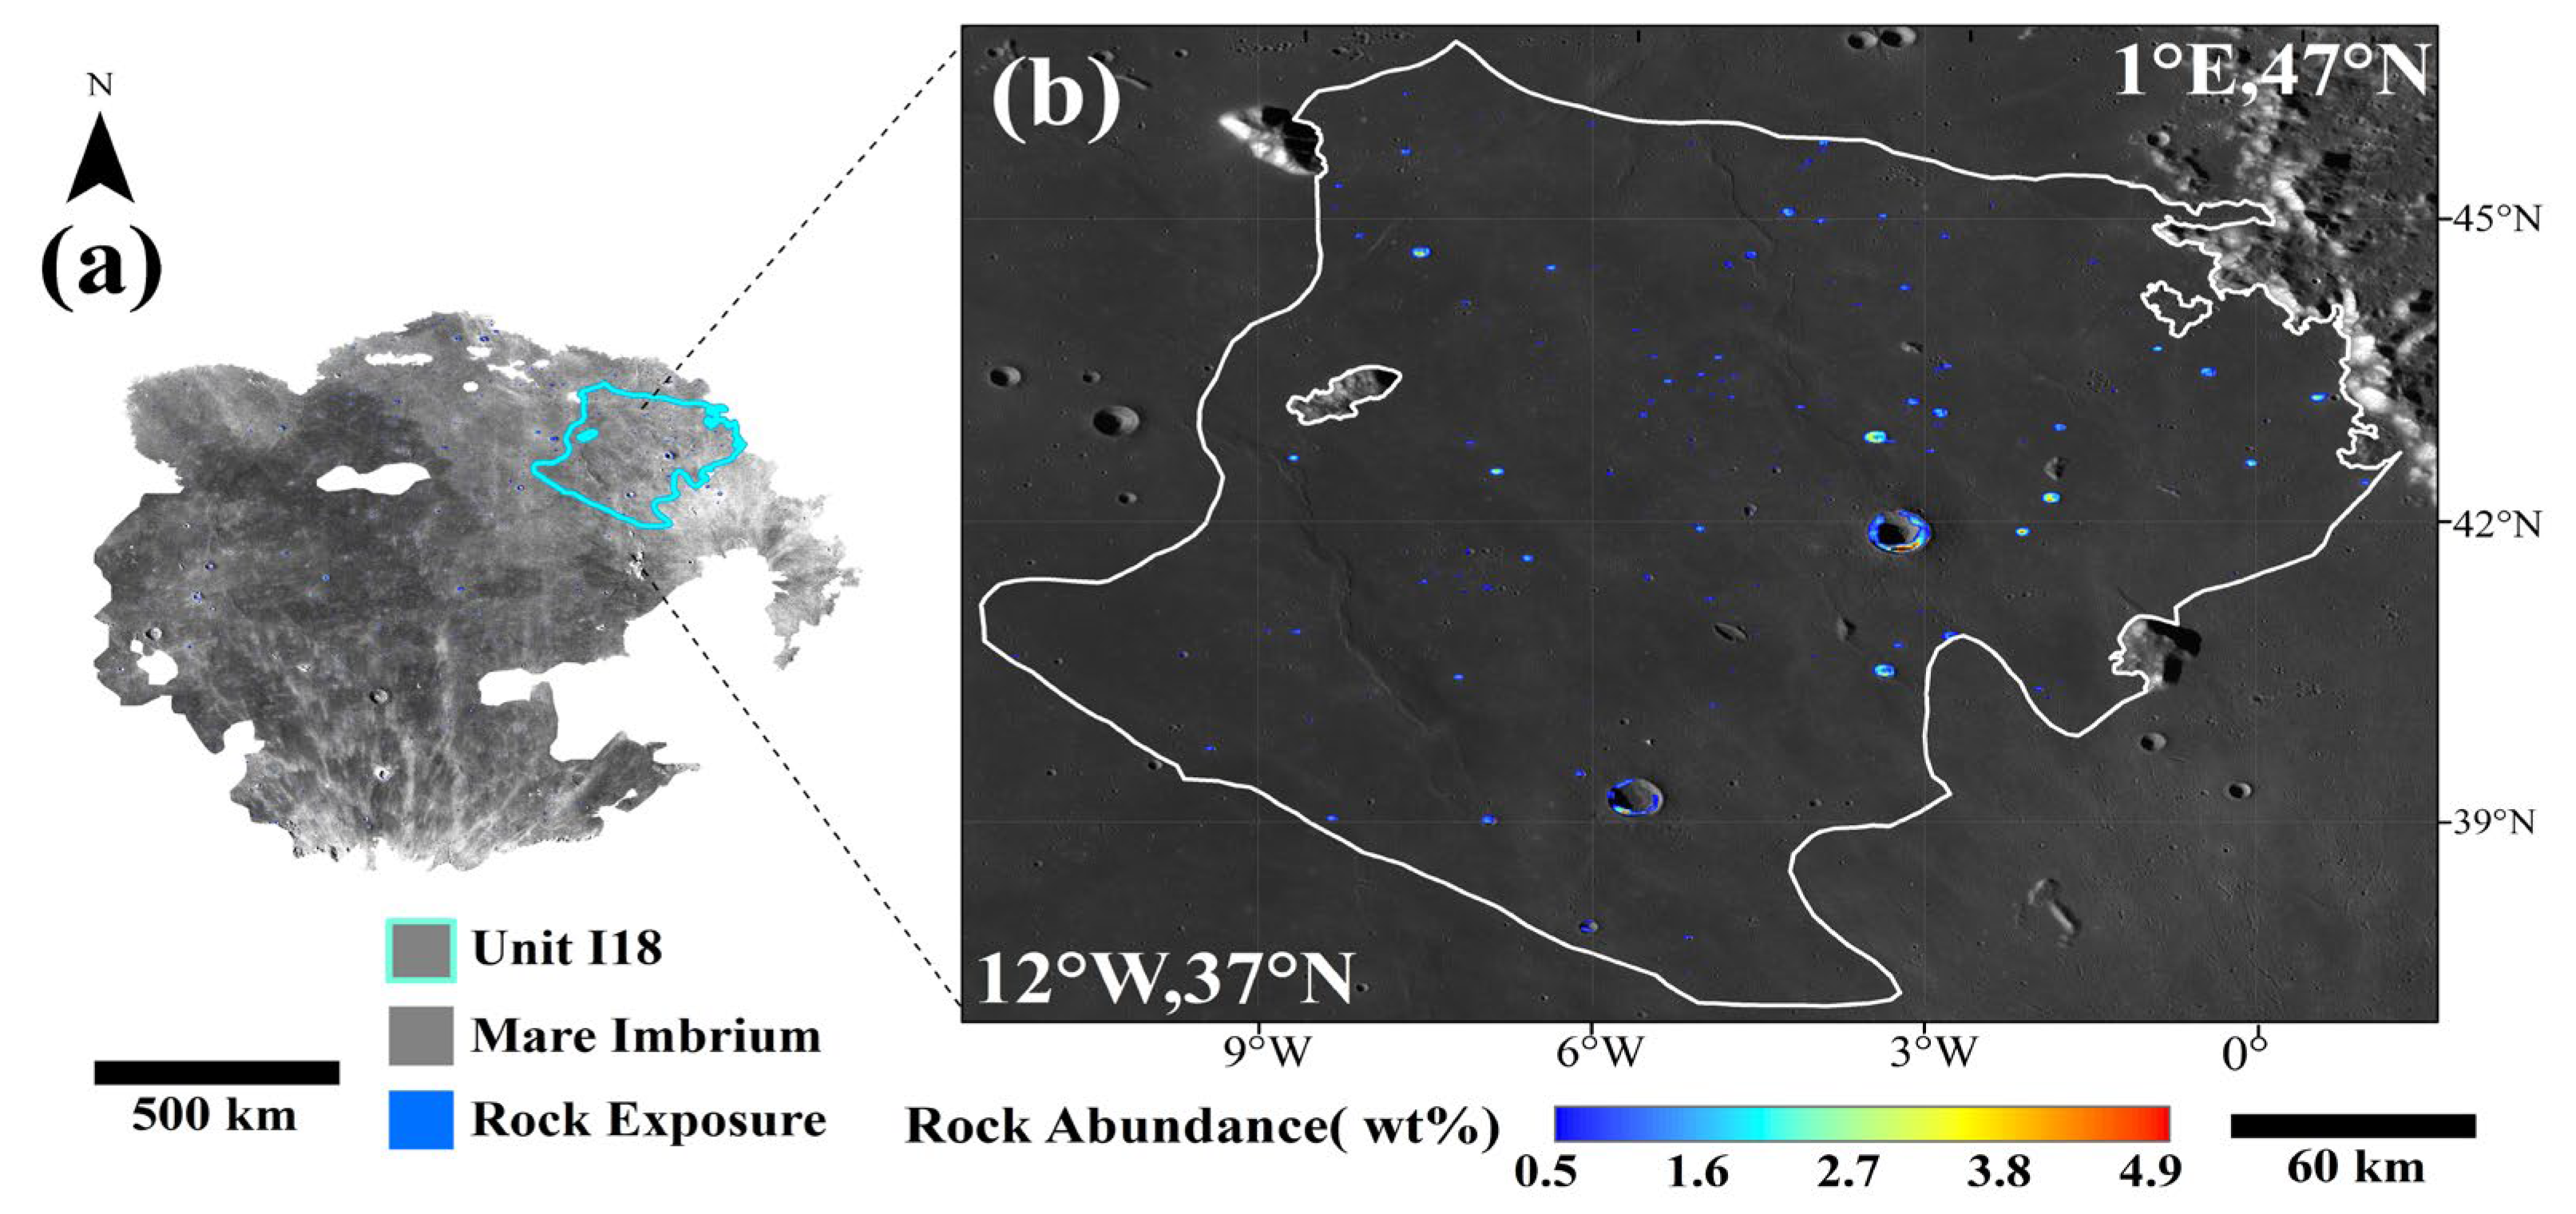
HA basalts were usually buried beneath weathering layers or mare basalts [60], and the exposed HA basalts were usually excavated by impact events. The rock abundance of typical mare and highland regolith were less than 0.5 wt% [61]. A rock abundance of more than 0.5 wt% was used as a threshold to distinguish the exposed rocks by impact excavation and regolith material, and the locations of Mare Imbrium exposed rock were identified (Figure 3). The lithology of these exposed rocks was identified by using spatial transformation (4 × 4 rock image corresponding to 1 lithology image) and unifying the coverage (70° N/S). The constraints of Al2O3 exceeding 11 wt% were applied to the pixels that have been determined as basalts to identify HA basalts.
However, mixtures of low-alumina mare basalt and high-alumina highland material also have more than 11 wt% Al2O3, only use compositional constraints, and cannot exclude the influence of the mixture. Fortunately, the special composition and mixing process of two materials may solve this problem [60]. There was a strong positive correlation between Al2O3 and Mg# abundance (K = 0.6698, R2 = 0.7689, [49]) in the lunar soil samples, and the two compositions showed a weak negative correlation in the HA basalt samples (K = −0.1671, R2 = 0.4676). In addition, the mixing processes caused by impact were directional. For example, in the four directions (horizontal, vertical, and two 45°directions) adjacent the mare–highland mixture pixels, the Al2O3 abundance of several pixels in at least one direction was positively correlated with Mg#, or in the adjacent eight pixels directions, the Al2O3 and Mg# abundance in the two directions was positively correlated. Therefore, Diviner Al2O3 and Mg# data were used for linear fitting (95% confidence limit, K > 0.5608 and K < 0.7788) to determine the composition adjacent to the unknown pixel and exclude the influence of the mare–highland mixture.

2.3. HA Basalt Pixels and Unit Characteristic Calculation

Most of the exposed HA basalt pixels adjacent to the crater originated from units formed by volcanic eruptions and flow crystallization, and the distribution of pixels provides the location of HA basalt units. The LROC Wide Angle Camera (WAC; 100 ppd) map was used to observe the distribution characteristics of HA basalt pixels at different topographies. The map has radiometric calibration based on the solar incidence angle, and it can be used as a basis for geological feature analysis [62,67,68]. Using LROC WAC as the base map, the aggregation areas were drawn according to the distribution of HA basalt pixels, and the HA basalt units were identified in the aggregation region by visual interpretation. However, HA basalts produced by material migration and distance ejecta were usually exposed at the bottom of rugged topography, flat regolith, and away from craters. They were not local and introduced interference information for HA basalt units remote sensing identification. On the WAC map, the minimum radius identified as a crater is 1 km (10 pixels, [69]). Therefore, the few exposed HA basalt pixels regions or away the crater (centered on the crater, beyond a radius) regions were excluded from the units.
Basaltic flow events and spatial weathering caused most of the HA basalt layers formed by the original volcanic eruption to be buried by the regolith and basalt layers. Fortunately, the position of the HA basalts excavated by impact on the crater wall is able to reflect the position of original HA basalts layer in the vertical direction. Meanwhile, elevation data and boundaries of HA basalt units can be combined to calculate their morphological and geological characteristics. Currently, the widely used lunar elevation datasets include LRO/Lunar Orbiter Laser Altimeter (LOLA) digital elevation model [70] and the digital elevation model provided by SELENE topographic camera [69]. Considering the advantages of the high accuracy of the former and the high resolution of the latter, Barker et al. [71] co-registered the two datasets and provided the SLDEM product. The product has three usable resolutions (128 ppd, 256 ppd, and 512 ppd). Considering the consistency of the product resolution, the 128 ppd images were used.
D e p t h i , j = M a x M a x S L D E M i f : i + f , j f : j + f S L D E M i , j ,
T h i c k n e s s i , j = M a x M a x D e p t h i f : i + f , j f : j + f D e p t h i , j ,
V o l u m e = T h i c k n e s s M a x × A r e a ,
Notably, when calculating the buried depth and thickness of the HA basalt layer, different degrees of ejecta from the adjacent crater will affect the calculation. For example, from the vertical profile of the crater (Figure 4), when calculating the depth and thickness of HA basalts a and b on the crater wall as examples, the HA basalts at other locations represent the interference factors in the calculation. Among them, c represents the HA basalt that slips from the crater wall to the bottom, e represents the HA basalt in the distal ejecta, g represents the HA basalt in proximal ejecta on the edge of crater, and d at the top of the opposite side of a and b. They may irregularly distribute on both sides of the crater edge (d, e, g), wall (a, b), and bottom (c). This distribution may lead to inaccurate calculation of the maximum and minimum elevation difference of the pixels and may overestimate the depth and thickness of HA basalt layer. For example, the burial depth of pixel a should be calculated from the top of its side rather than the position of the top d on the other side. The thickness of the HA basalt layer depends on the depth of a and b, but not the depth of other pixels. To improve the accuracy of the morphological geological feature calculation, we introduce a distance threshold f to eliminate the influence of the distal ejecta e and then eliminate on the other side top d in the calculation. When observing craters in Imbrium, we noticed that most craters containing HA basalts have a radius R of no more than 2.5 km. Therefore, we use Formula (1) and set the threshold f to 10 (f is equal to 2.37 km, the distance of 10 pixels in the rock abundance image) to calculate the thickness and burial depth of the HA basalt layer. The i and j represent the latitude and longitude of the HA basalt pixel. The burial depth of an HA basalt pixel is equal to the maximum elevation of the adjacent 10 pixels minus the elevation of the pixel. The thickness is equal to the maximum burial depth of the adjacent 10 pixels minus the burial depth of the pixel. The maximum and minimum burial depths of the HA basalt unit are equal to the maximum and minimum burial depths of HA basalt pixels on the crater wall inside the unit, and the thickness of the unit is equal to the average thickness of the HA basalt layer inside the unit. In addition, this calculation process may be affected by several error sources: (1) The HA basalt may be broken, worn, and scoured when moving to the crater bottom, resulting in mass wasting. (2) The possible proximal ejecta adjacent to the crater may cause the HA basalt layer’s estimated thickness to be overestimated during the calculation. (3) Different crater forms may affect the internal rock layer due to geological factors such as collapse, fragmentation, and rock accumulation.
In addition, the regolith composition does not reflect the true composition of HA basalt units. The HA basalt pixels’ average oxide abundance in units should represent the entire unit composition. Therefore, the average compositions of HA basalt pixels were more representative of the whole unit. According to the location of exposed HA basalt pixels, combined with the Diviner main oxide image, their main oxide abundances (Al2O3, TiO2, and FeO) were calculated, and the unit average oxide abundance was calculated in combination with the area of units. At the same time, considering the influence of other special composition basalts (such as high-Ti basalt and low-Al basalt), the abundance of three oxides in non-HA basalt pixels were assigned the value of 0.

3. Results

3.1. Lithology Classification

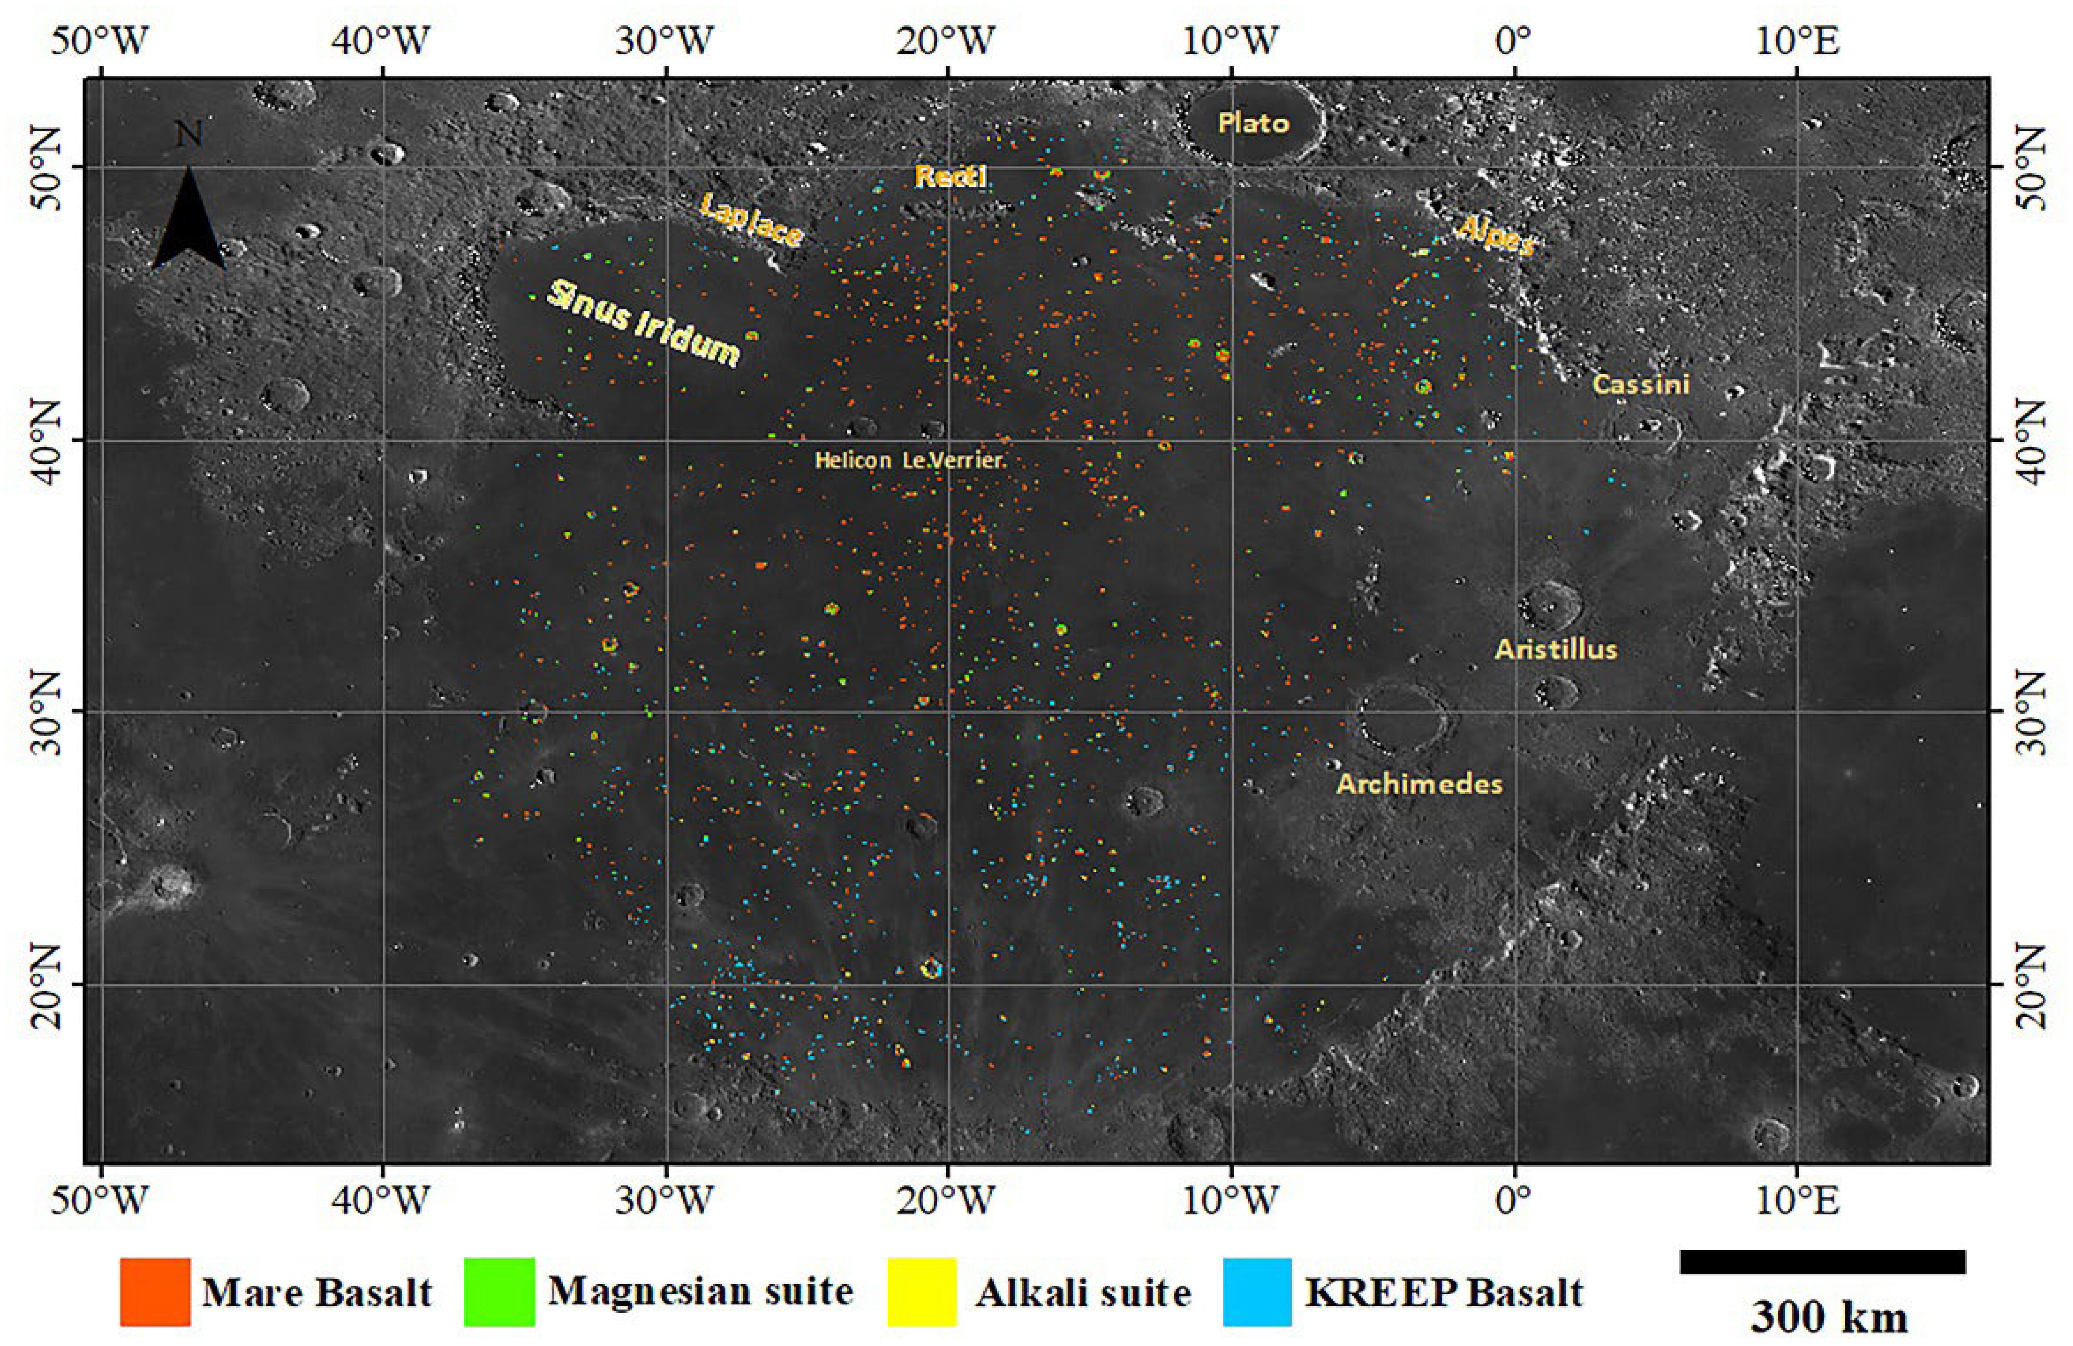
In Mare Imbrium, a total of 80,700 rock pixels with an abundance of >0.5 wt% were excavated to the regolith surface. Their total area is approximately 4842 km2, covering approximately 0.5% of the Mare Imbrium area. The classification of these rocks is shown in Figure 5. It can be seen that most of the Mare Basalt (MB) pixels are concentrated in northern Mare Imbrium, with a few scattered in the southern region. They are distant from highlands and irregularly distributed, with a total area of approximately 1563 km2, accounting for 32.3% of the rock pixel area. KREEP Basalt pixels have the opposite distribution characteristics as MB; they are less in the north where MB accumulates and more in the south, with a total area of about 1551 km2, accounting for 32.0% of the rock pixel area. The Magnesian suite (MS) and Alkali suite (AS) have similar distribution patterns; they are concentrated on the edge of the impact crater, covering areas of approximately 1261 km2 and 467 km2, respectively.
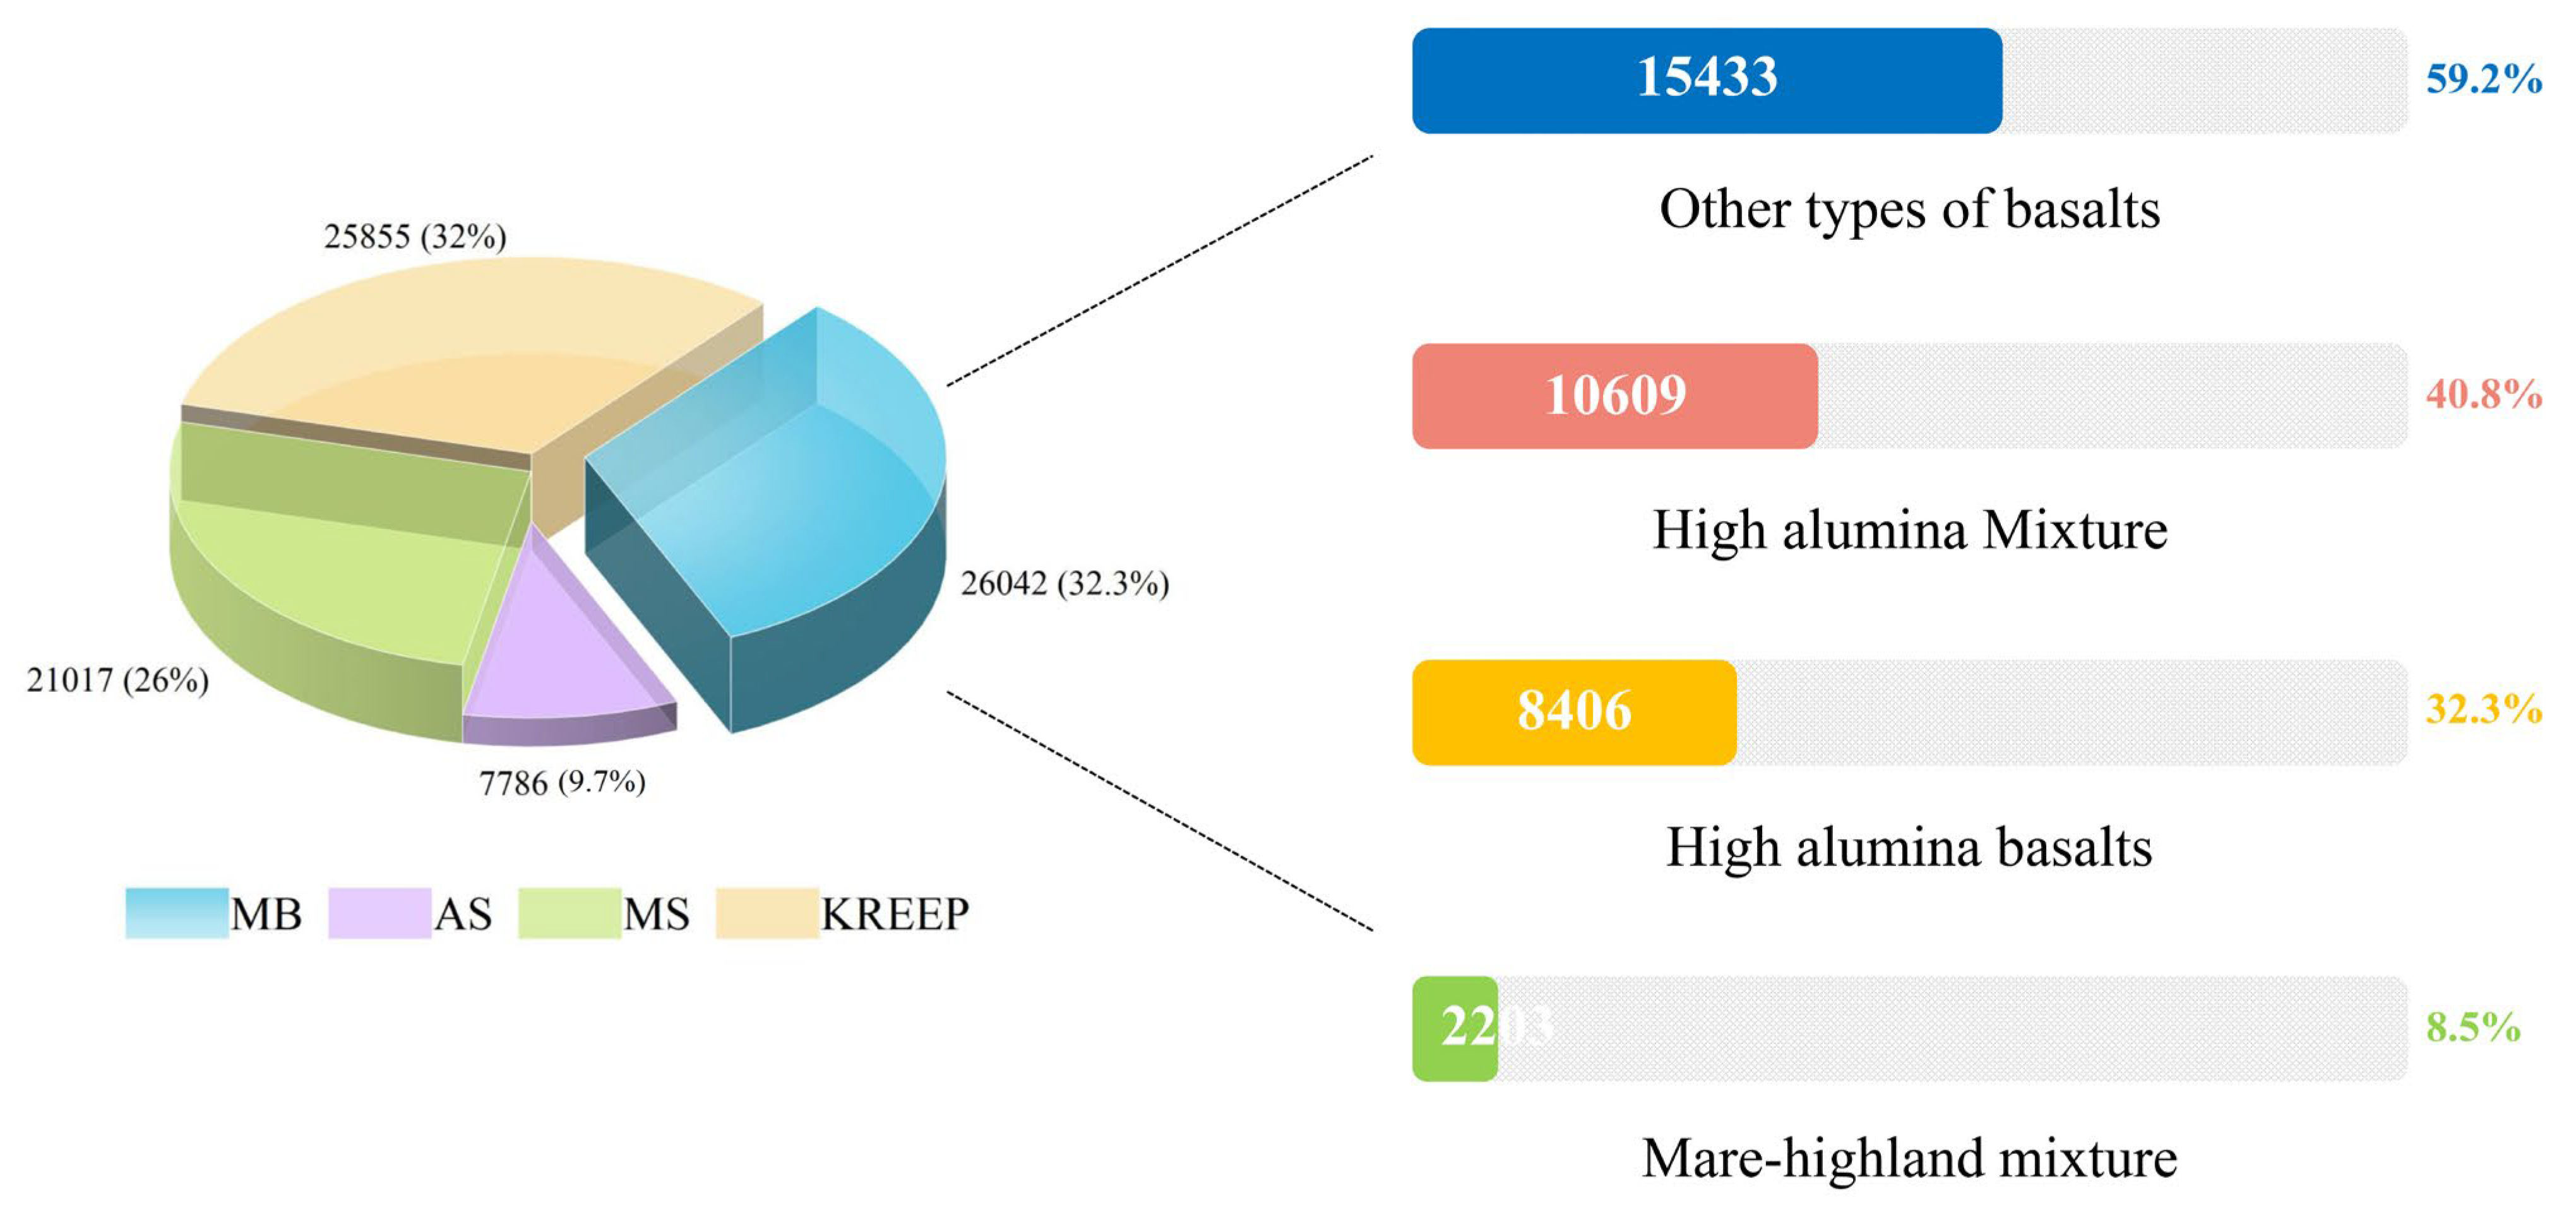
In addition, the amount of each type of rock was counted according to the lithology classification results (Figure 6). The amount of MB is the largest (26,042), accounting for 32.3% of the rock pixels. The amount of KREEP basalts is similar but less than mare basalts (25,855). In addition, 21,017 MS and 7786 AS were identified, accounting for 25.8% and 9.6%, respectively. After 26,042 basalts were identified, 10,609 high-aluminum mixture pixels with more than 11wt% Al2O3 were identified. Among them, 2203 mare–highland mixtures were excluded, and 8406 HA basalts were identified, accounting for 32.3% of the basalts. There are approximately 10.4% HA basalt and 2.8% mare–highland mixture in Imbrium exposed rocks. The distribution characteristics of a large amount of exposed rock but a small amount of HA basalts indicates that a large amount of Mare Imbrium basalt was covered by highland material (e.g., plagioclase and magnesian suite, etc.), and 26% of HA basalt was polluted by mare–highland mixtures. Therefore, the actual amount of HA basalt in Imbrium may be more than we identified, and the influence of the mare–highland mixture on the identification of HA basalts should be taken seriously.
According to the locations of exposed HA basalt pixels, combined with Diviner main oxide data, the abundances of three compositions were calculated (Figure 7). The results show that the oxide abundance range of Mare Imbrium HA basalts (Al2O3: 11.1–17.6 wt%, TiO2: 0–9 wt%, FeO: 10–22 wt%) is wider than the Apollo 14 samples (Al2O3: 11–16 wt%, TiO2: 1.5–3 wt%, FeO: 13–19 wt%) and Luna 16 samples (Al2O3: 12–19 wt%, TiO2: 2–5 wt%, FeO: 13–19 wt%). Specifically, there are 1247 pixels with more than 16 wt% Al2O3 and 2268 pixels with more than 19 wt% FeO. Notably, only eight pixels have the TiO2 abundances of 1.5–3 wt%. Five of them are located in central Imbrium, two in the east, and one in the north. A total of 66% of HA basalt pixels have TiO2 abundances of 3–5 wt%, and 2855 pixels have TiO2 abundances of more than 5 wt%. In general, the differences in the amounts of HA basalts with different compositions are obvious. This indicates that they may originate from different periods or different locations of the eruption source.

3.2. Mare Imbrium HA Basalt Units

There are 17 HA basalt units (Figure 8) in Imbrium, and the area of these units and the number of HA basalt pixels are different. Three units were identified in Sinus Iridum, though they were heavily polluted by ejecta and highland materials. The distributions of HA basalts in the three units are different. HA basalts in F1 and F3 were concentrated on the crater wall and bottom, and in F2 they were mostly distributed in proximal ejecta. Five large units (F6, F7, F8, F9, and F10) were identified in northern Imbrium center, with more HA basalts pixels than other units. Among them, Helicon and Le Verrier and their secondary impact craters excavated large amounts of HA basalts in F6 and F7. Large amounts of HA basalts were located adjacent to the mountains in F8 and F9. Four units (F11, F12, F13, and F14) were identified in the east, and they were located in southwest of the Alpes Mountain. In addition, five units (F4, F5, F15, F16, and F17) are located in Mare Imbrium center. F16 and F10 were not identified as the same unit although they were adjacent. The reason is that F16 was identified by the excavation of four impact craters. Most HA pixels in F16 were distributed on the proximal ejecta surface, while in F10 they were distributed on the crater wall or bottom. The adjacent but different distribution characteristics indicate that they may originate from different eruption periods.

3.3. HA Basalt Unit Distribution Characteristics

Based on the HA basalt pixels and unit locations, the morphological and geological characteristics of 17 units were statistically calculated (Table 2). The results show that the area of Imbrium HA basalt units is 116,366 km2, accounting for approximately 6.3% of Mare Imbrium area. Among them, there are 13,020 km2 HA basalt units in Sinus Iridum, a total of 600 HA basalt pixels. F1 and F3 have similar thicknesses and similar maximum burial depths but different volumes. F2 has the largest burial depth, and its volume is the smallest among 17 units. The five north-central units have large areas (>10,000 km2) and volumes, except for F10, and the four units have similar thicknesses but different volumes. F9 and F10 have similar volumes but different thicknesses. The unit with the largest area is F7 (17,072 km2) and the smallest is F12 (1425 km2). The northeastern and central units are small in area and volume (<500 km2), and they have different thicknesses and burial depths.
Some units in the four regions (north central, northwest, northeast, and central) have similar thicknesses. The maximum thickness does not exceed 70 m. The thicknesses of 17 units can be divided into three different levels: 30–40 m (F5 in the center and F14 in the northeast), 50–60 m (F2 in the northwest; F4 in the middle; F10 in the north central; F11 in the northeast) and 60–70 m (F1 and F3 in the northwest; F6, F7, F8, and F9 in the north central; F12 and F13 in the northeast; F15 and F16 in the central). These characteristics indicate that they erupted irregularly in four different source regions.
The mean values of the three oxide abundances were calculated (Table 2). From the results, the HA basalts in F5 are obviously affected by the plagioclase composition at the crater bottom, resulting in abnormal values of high aluminum and low iron and titanium in unit. The oxide abundances of the five units in north-central Imbrium are similar. The oxide abundance was similar in the four northeastern units except for F14. F14 may have been affected by ecdemic ejecta, as its Al2O3 abundance is similar to the other three units, but the FeO and TiO2 abundances are abnormally high. In general, Imbrium HA basalt units are affected by compositional differences caused by different locations and topographies.

4. Discussion

4.1. Comparison with the Results of Previous Studies

Kramer et al. [11,12] summarized the volcanism and petrogenesis of HA basalts, using the negative correlation between FeO and Al2O3, combined with compositional constraints (12–18 wt% FeO, 1–5 wt% TiO2, 0–4 ppm Th), and the ejecta composition adjacent to the immature (OMAT < −0.8) small impact crater (0.4–4 km) was statistically analyzed. Using 5 wt% TiO2 as the composition threshold, the influence of the mare–highland mixture was eliminated, and basalt units of different ages and compositions were identified. In Imbrium, the three units with different TiO2 and FeO abundances are Im (low Fe, very low Ti), Iltm (very low Fe, low Ti), and Imtm (high Fe, low Ti). The TiO2 abundance of Iltm in northern Imbrium is determined by Apollo 14 and Luna 16 sample compositions. Since the ejecta composition is similar to the Apollo 14 samples, it is considered that HA basalts and the source of the Apollo 14 sample may exist.
The similarity between the two methods is that both methods use composition constraints to identify HA basalts in craters and ejecta. Both studies identified HA basalt units adjacent to the Sinus Iridum and Recti Peak Helicon in northern Imbrium. However, the results of the two studies are different. The HA basalt candidate unit Iltm [12] was located in northwestern Imbrium, and most parts of Iltm were found in southern Sinus Iridum and Recti. In this study, three units and 600 HA basalt pixels were found in Sinus Iridum. Compared with Iltm, they show scattered distribution characteristics and are located away from highlands. No HA basalts were identified adjacent to Laplace and Recti, but two large units (F7 and F9) were identified in the southeast of two mountains. F7 is the largest and thickest unit in Imbrium, although Kramer et al. [12] identified it as a high-iron, high-titanium unit Imtm. There are two main reasons for this difference. First, the average TiO2 abundance of HA basalt pixels in F7 exceeded the threshold (>5 wt%) of Mare and Highland, and all these pixels were excluded from calculations by Kramer et al. [12]. Second, the young high-Ti basalt overlies most of the F7 surface. Although <5 wt% TiO2 HA basalts exist in ejecta, it is difficult to find them by calculating the average. In addition to the above five units, more units were identified in northern and central Imbrium. In general, compared with the methods used by Kramer et al. [12], our method can identify more HA basalt pixels and more units with larger areas, which are more widely distributed and discontinuous. In addition, this study provides the HA basalt locations used to calculate the distribution characteristics of HA basalt units and the morphological geological characteristics of HA basalt layers.
There are two reasons for the difference between the two results. (1) Apollo 14 and Luna 16 samples are limited, their compositions (1–5 wt% TiO2, 12–18 wt% FeO) limit the identification of a large part of HA basalts, and more than 5 wt% medium-Ti (high-Ti) and high-Al basalts may be excluded as highland materials [11,12]. Since these basalts may have erupted during different periods [72,73,74,75], the FeO and TiO2 compositions may be more extensive. The HA basalt composition (Table 2) proves this, and some 5–9 wt% TiO2 HA basalts are also identified in Imbrium. (2) Most HA basalts were buried by young basalts or regolith. The compositions of the buried materials were not identified only by using the regolith composition conditions. In addition, this study has some limitations. Firstly, our remote sensing identification method for HA basalts is applied to rock pixels with an abundance of >0.5 wt%, the HA basalts pixels buried by regolith or basalt flows may cause our method to fail. Secondly, HA basalt units adjacent to highlands or with less excavated rocks may be considered as ecdemic ejecta, and they cannot be identified. Third, the proximal ejecta at the crater edge and the HA basalt that slipped to the bottom of the crater make the thickness calculation inaccurate in this study. In future research, we will comprehensively consider the gravity and anti-gravity factor, explore the distribution patterns and morphological geological characteristics of the HA basalts beneath regolith, basalt layers, and deeper layers, and extend the research scope to the whole mare and cryptomare.

4.2. Mare Imbrium HA Basalt Layers

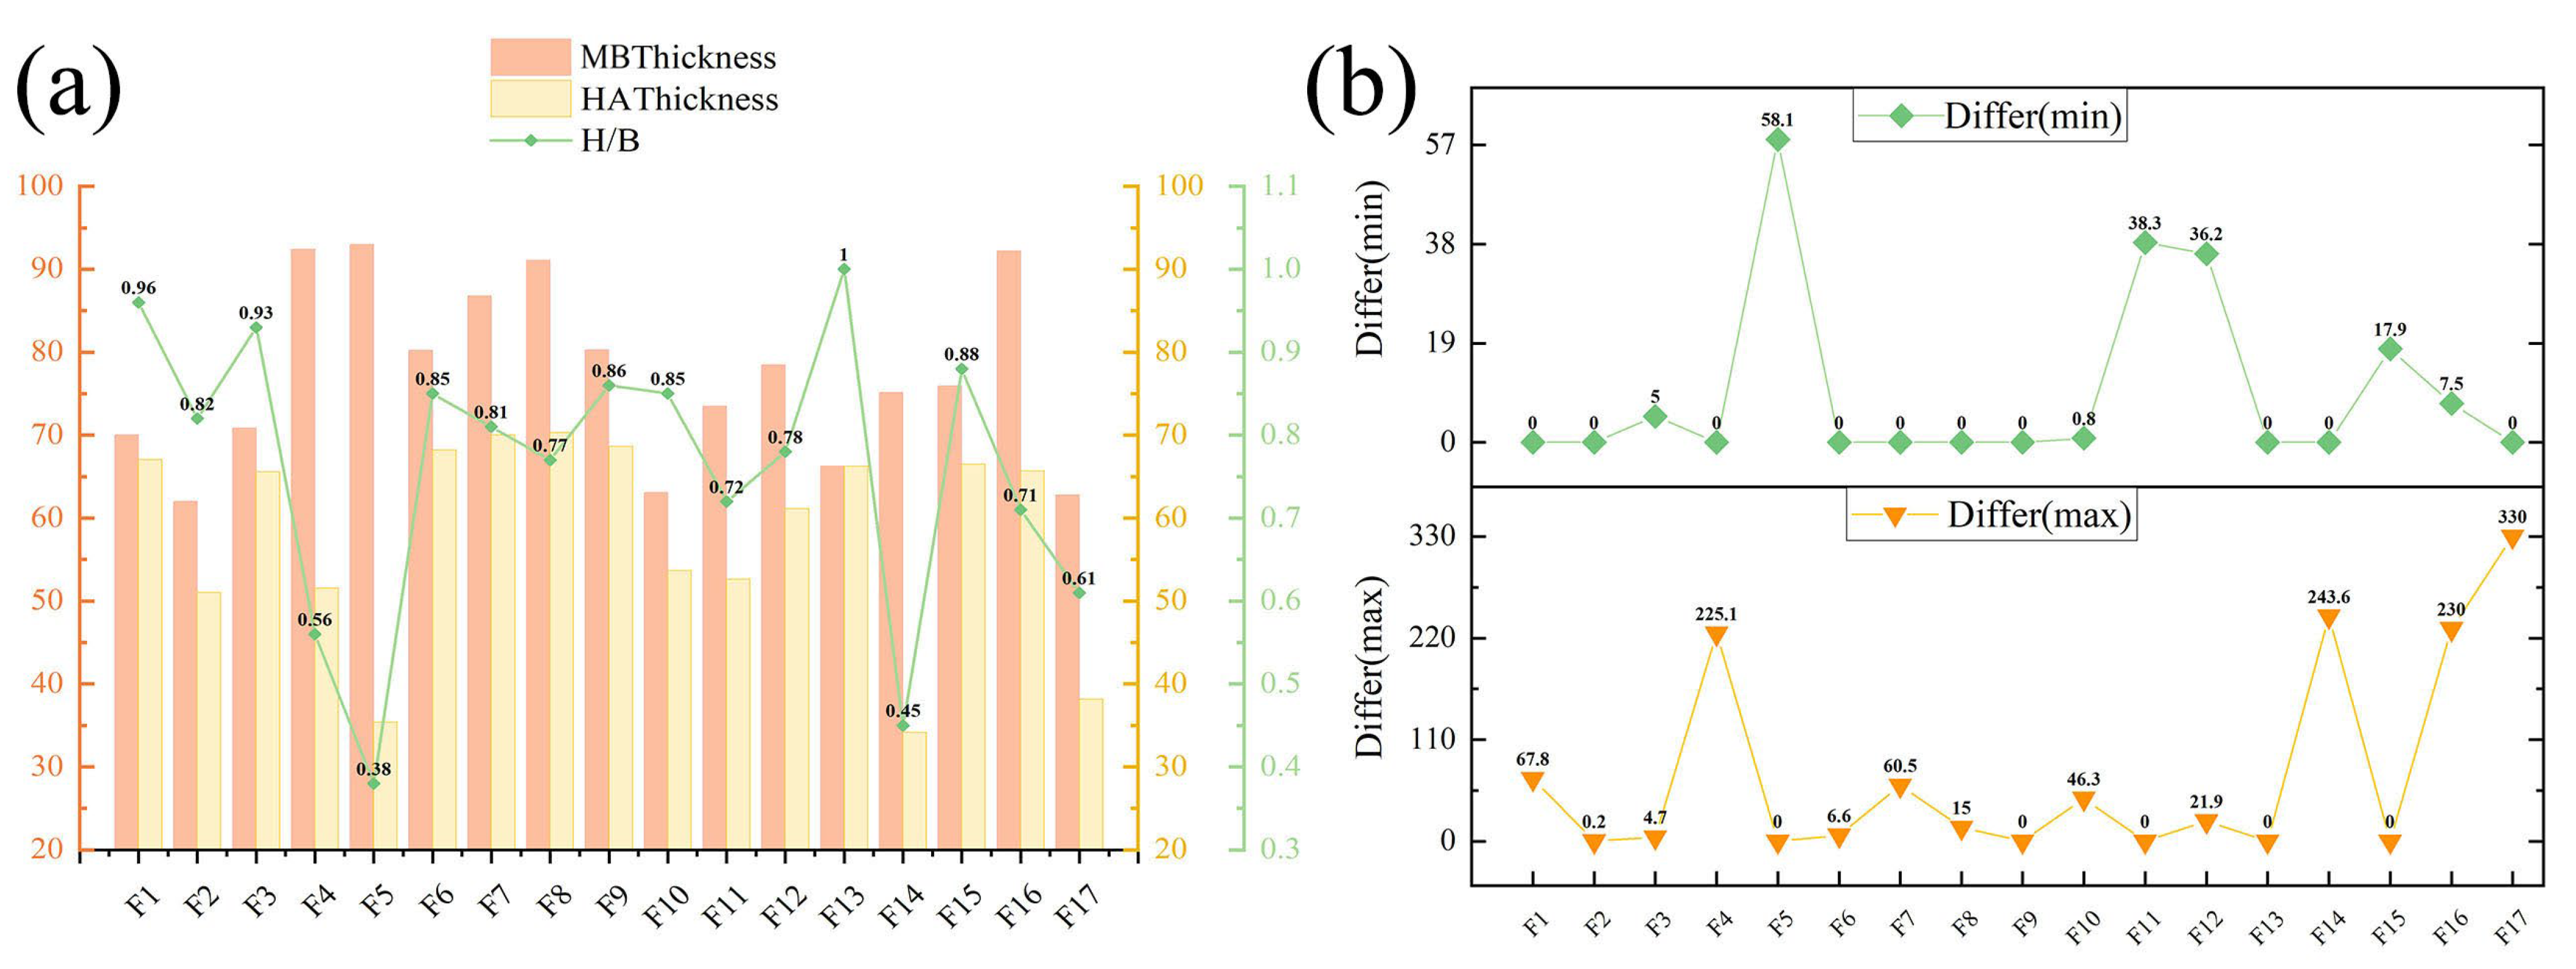
The young mare basalt (MB) magma (3.6~2.6 Ga, [31]) filled Mare Imbrium and overlaid the rock layers, possibly constituting the underlying unit of the HA basalts. The overlay of MB layers and special topography (such as fold ridges, ground uplift, and impact craters) cause the pixels identified in HA basalt units to be scattered rather than aggregated. These pixels have different burial depths. Therefore, the formed HA basalt layers were discontinuous and their thicknesses were not consistent. To understand the vertical distribution of HA basalt layers, the exposed MB pixel locations in 17 units and Formulas (1) and (2) were used to calculate their vertical distribution characteristics in vertical (thickness and maximum, minimum burial depths). Figure 9a shows the average thickness and proportion of HA basalts and MB. Figure 9b calculates the minimum burial depth difference and the maximum burial depth difference between two layers.
According to the results, compared with the basalt layer formed by ancient volcanism, the layer formed by young basalt flow is thinner and discontinuous. Except for F5 and F14, the other units only formed a thin layer of less than 30 m, overlying the HA basalt layers. The thickness of most HA basalt layers exceeded 50% of MB layers. At the same time, the maximum burial depth difference between the two layers is 0 (F5, F9, F11, F13, and F15), indicating that the earliest volcanic eruptions in these regions and these HA basalt layers overlie the original basin surface. Interestingly, these units are distributed in various regions of Mare Imbrium HA basalt units map (Figure 8). They may have originated from different eruption sources, but the similar TiO2 abundances in units except F5, which are seriously affected by plagioclase material, indicate that they may have erupted at the same phase. In addition, some units with similar maximum burial depth differences also have similar compositions (F3, F6, F7, F8, F10, F12), they may have formed in the second phase of the HA basalts eruption.
In a previous study by Dickson et al. [28], the Apollo 14 HA basalts were divided into three categories based on their age: the oldest basalt (approximately 4.3 Ga), the middle-aged basalt (approximately 4.1 Ga), and the youngest basalt (approximately 3.9 Ga). This study verifies this speculation. They may have derived from volcanic events that erupted during three different periods and from four different source regions. Firstly, the thickness of the 17 high-alumina basalt units can be divided into three grades (30–40 m, 50–60 m, 60–70 m), and the units of the same grade originate from different source regions. Secondly, according to the maximum burial depth difference between two layers in these units, the eruption of Mare Imbrium HA basalts may be divided into three phases. The first phase occurred before the formation of Imbrium basin, the oldest HA basalts erupted to the basin surface and formed the irregular HA basalt layers. The second phase erupted and overlaid some ancient basalts that erupted in the middle period. Notably, the eruption time of the third phase is uncertain. The depth differences between two layers and the earliest erupted basalt in some units (F4, F14, F16, and F17) are more than 200 m, indicating that they may have scatter erupted after the Imbrium impact event or at the same time as Mare Imbrium basalt magma. According to the HA basalts map (Figure 8), the source area and scales of the HA basalts eruption in the three phases were random. The HA basalt units that formed in the first phase have a small area and a large span of the eruption position. The second eruption is large, but mainly concentrated in northwestern Sinus Iridum and northern central Mare Imbrium. The third eruption was relatively small, with only a few eruptions in Mare Imbrium western center.

4.3. Morphological and Geological Characteristics of Imbrium HA Basalts

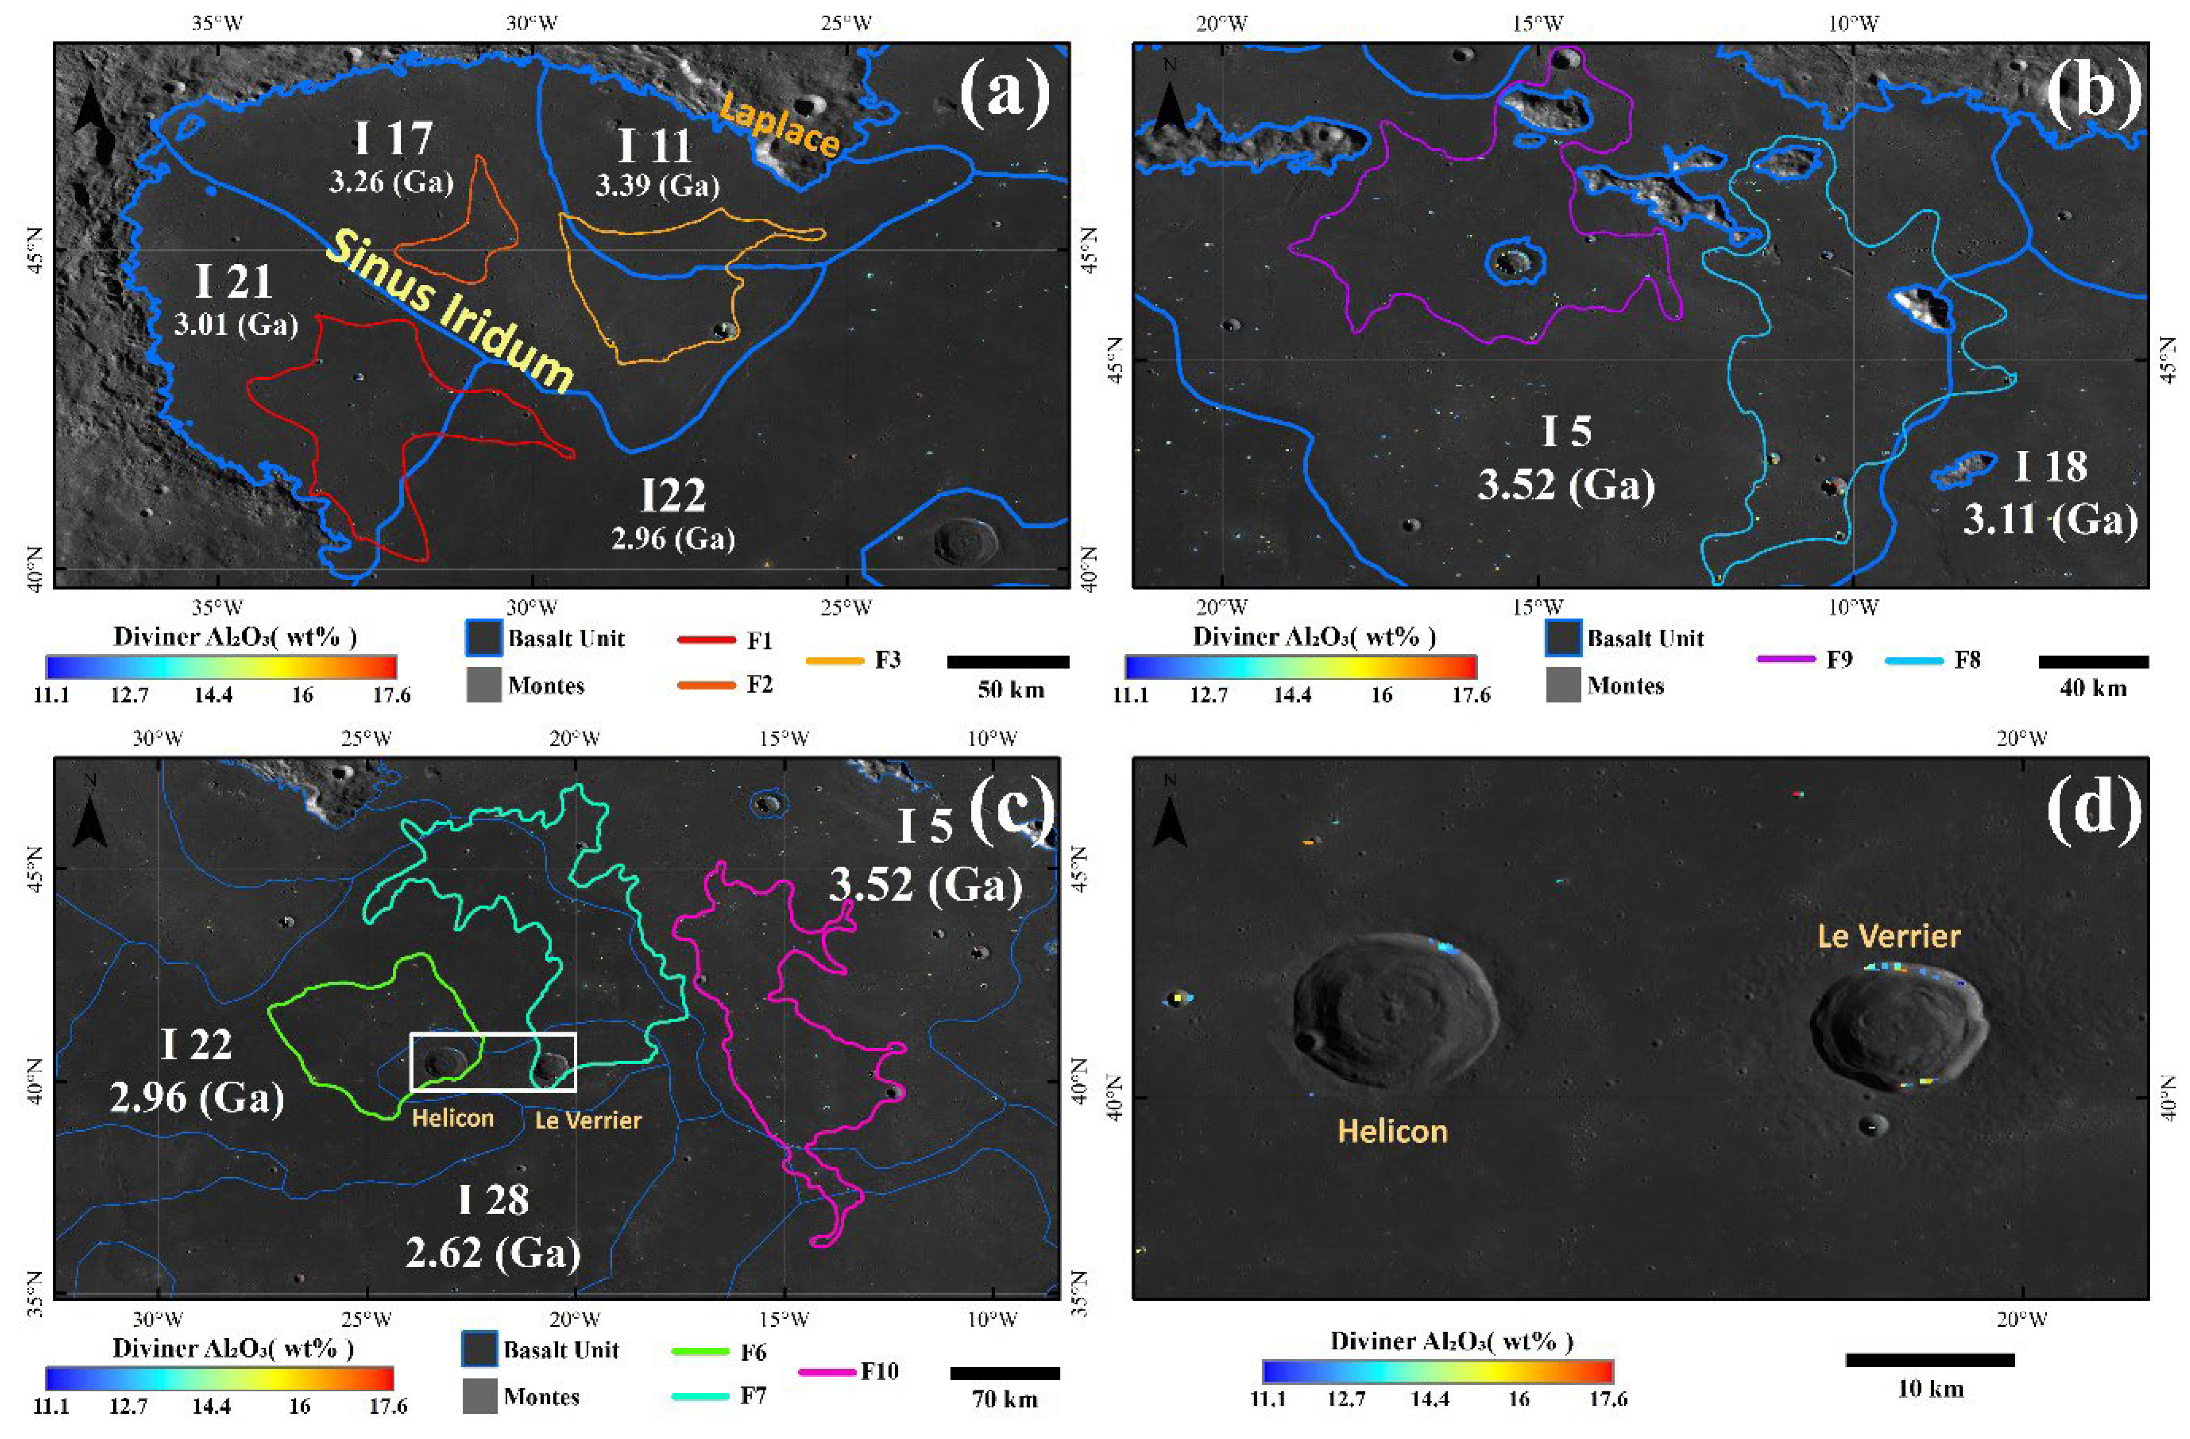
Most of the HA basalt units were located in northern Imbrium and were distant from the highlands. In Sinus Iridum, there are two main reasons for the difference between the thicknesses of F2 and the other two units: (1) Contrast from WAC imagery indicates that F2 is influenced by highland ejecta (Figure 10a). Its minimum burial depth (64.6 m) and maximum burial depth (896 m) suggest that since the formation of Sinus Iridum, this area has been affected by highland ejecta multiple times, leading to deeper burial of the HA basalts. (2) Basalt units generated at different times (Figure 10a, [31]) have flowed and overlaid F1 and F3. The HA basalt units may have inconsistent thickness due to being overlaid by basalts of varying ages and thicknesses.
The north-central units were adjacent with a large area, and they have similar thickness but different burial depths. This indicates that after a massive eruption of ancient HA basalts, they may have flowed and overlaid the uneven Imbrium Basin. The flat region adjacent to the mountain of F8, F9 has a large amount of HA basalts (Figure 10b), they are derived from the mountain. Impact events have excavated them into the regolith and bottom of craters, they usually stayed on flat regions rather than rugged regions. In addition, there were no HA basalt pixels at the crater bottom or surroundings in some units, they were at the edge of the crater wall (e.g., Helicon and Le Verrier; Figure 10d). The reason may be that HA basalts from the original basin were excavated by Helicon at the crater bottom, wall, and proximal ejecta. The young basalt flows overlaid the proximal ejecta and the bottom of the crater. Therefore, the amount, thickness, and volume of HA basalts may be underestimated.

5. Conclusions

In this paper, Diviner and LP-GRS composition data are used to identify Mare Imbrium exposed HA basalts. LROC WAC and SLDEM topographic data are used to map Imbrium HA basalt units and calculate their geological characteristics. The main conclusions are as follows: (1) Remote sensing identification based on Al2O3 abundance can distinguish HA basalts from different types of basalts, which account for 32.3% of Imbrium total basalts. (2) Mare Imbrium basalts are overlain by large areas of adjacent highland material, and the HA basalts pollution rate from the mare–highland mixture is 26%. Therefore, the pollution of highland materials should be taken seriously, and the effect of mare–highland mixtures on HA basalts identification should be investigated. (3) The oxide abundances of Mare Imbrium HA basalts show a wider range than Apollo 14 and Luna 16 samples. Obviously, the number of HA basalts with different oxide abundances are different. (4) Imbrium HA basalts have erupted widely in the north, and the eruption was irregular. The northern center has the largest scale, and five large HA basalt units were formed. In northwestern, northeastern, and central Imbrium, there are scattered small-scale eruptions. (5) In the northern central part of Mare Imbrium, four units except F10 have similar maximum thickness. F2, located in Sinus Iridum, has the largest burial depth and the smallest volume. (6) The thickness of the HA basalt layers in different units is inconsistent, and the distribution is discontinuous. There are three grades for the thickness of the 17 units, and the eruption source region of each grade is different and their composition is different. They may have originated during different periods and from different eruption sources. (7) There may be three phases of HA basalts eruption in four regions and their eruption scales are different.

Author Contributions

Conceptualization, J.C. and M.M.; methodology, M.M.; software, S.C. and M.M.; validation, J.C., S.C. and Y.J.; formal analysis, J.C. and M.M.; investigation, J.C. and Y.J.; resources, S.C.; data curation, J.C.; writing—original draft preparation, J.C.; writing—review and editing, M.M. and S.C.; visualization, M.M.; supervision, S.C.; project administration, J.C.; funding acquisition, S.C. All authors have read and agreed to the published version of the manuscript.

Funding

This research was jointly supported by the National Key Research and Development Program of China (Grant 2022YFF0503100), the Strategic Priority Research Program of Chinese Academy of Sciences, Grant XDB 41000000, the National Natural Science Foundation of China (41372337, 41772346, and 42050202), the National Natural Science Foundation of Jilin Province (20230101315JC), and the Key Research Project of Education Department of Jilin Province (JJKH20210295KJ).

Data Availability Statement

Five lunar major oxide abundance products are available at Ma et al. [43], the LP-GRS Th product is available at Prettyman [66]. The SLDEM 2015 maps (No.: SLDEM2015_128_60S_60N_000_360) are available at PDS: https://ode.rsl.wustl.edu/moon/index.aspx (accessed on 8 May 2024). The LROC WAC map is found at Robinson et al. [67].

Acknowledgments

Many thanks to the two reviewers and editor for their hard work and a large number of meaningful, valuable, and constructive comments, which have greatly improved the research level of this paper. Many thanks to the editors for your hard work.

Conflicts of Interest

The authors declare no conflicts of interest.

References

  1. Liu, D.; Wang, X.; Liu, J.; Liu, B.; Ren, X.; Chen, Y.; Chen, Z.; Zhang, H.; Zhang, G.; Zhou, Q.; et al. Spectral interpretation of late-stage mare basalt mineralogy unveiled by Chang’E-5 samples. Nat. Commun. 2022, 13, 5965. [Google Scholar] [CrossRef] [PubMed]
  2. Patel, S.M.; Harish; Patel, D.; Solanki, P.M.; El-Maarry, M.R. Hybrid Volcanic Episodes within the Orientale Basin, Moon. Remote Sens. 2023, 15, 1801. [Google Scholar] [CrossRef]
  3. Head, J.W., III. Lunar volcanism in space and time. Rev. Geophys. 1976, 14, 265–300. [Google Scholar] [CrossRef]
  4. Wilhelms, D.E.; McCauley, J.F.; Trask, N.J. The Geologic History of the Moon; U.S. Government Printing Office: Washington, DC, USA, 1987; pp. 2330–7102. [Google Scholar]
  5. Li, S.; Hsu, W.; Guan, Y.; Wang, L.; Wang, Y. Petrogenesis of the Northwest Africa 4898 high-Al mare basalt. Meteorit. Planet. Sci. 2016, 51, 1268–1288. [Google Scholar] [CrossRef]
  6. Neal, C.R.; Taylor, L.A.J.G.e.C.A. Petrogenesis of mare basalts: A record of lunar volcanism. Geochim. Cosmochim. Acta 1992, 56, 2177–2211. [Google Scholar] [CrossRef]
  7. Wang, Y.; Ding, X.Z.; Chen, J.; Han, K.Y.; Shi, C.L.; Jin, M.; Liu, L.W.; Liu, X.B.; Deng, J.Y. Interpretation of Geological Features and Volcanic Activity in the Tsiolkovsky Region of the Moon. Remote Sens. 2024, 16, 1000. [Google Scholar] [CrossRef]
  8. Shearer, C.K.; Hess, P.C.; Wieczorek, M.A.; Pritchard, M.E.; Parmentier, E.M.; Borg, L.E.; Longhi, J.; Elkins-Tanton, L.T.; Neal, C.R.; Antonenko, I.; et al. Thermal and magmatic evolution of the moon. Rev. Mineral. Geochem. 2006, 60, 365–518. [Google Scholar] [CrossRef]
  9. Head, J.W. Lava Flooding of Ancient Planetary Crusts-Geometry, Thickness, and Volumes of Flooded Lunar Impact Basins. Moon Planets 1982, 26, 61–88. [Google Scholar] [CrossRef]
  10. Hagerty, J.J.; Shearer, C.K.; Papike, J.J. Petrogenesis of the Apollo 14 high-alumina basalts: Implications from ion microprobe analyses. Geochim. Cosmochim. Acta 2005, 69, 5831–5845. [Google Scholar] [CrossRef]
  11. Kramer, G.Y.; Jolliff, B.L.; Neal, C.R. Distinguishing high-alumina mare basalts using clementine UVVIS and lunar prospector GRS data: Mare moscoviense and mare nectaris. J. Geophys. Res. Planets 2008, 113, E01002. [Google Scholar] [CrossRef]
  12. Kramer, G.Y.; Jolliff, B.L.; Neal, C.R. Searching for high alumina mare basalts using Clementine UVVIS and Lunar Prospector GRS data: Mare Fecunditatis and Mare Imbrium. Icarus 2008, 198, 7–18. [Google Scholar] [CrossRef]
  13. Neal, C.R.; Taylor, L.A.; Lindstrom, M.M. Apollo 14 mare basalt petrogenesis-Assimilation of KREEP-like components by a fractionating magma. In Proceedings (A89-10851 01-91), Proceedings of the 18th Lunar and Planetary Science Conference, Houston, TX, USA, 16–20 March 1987; Cambridge University Press: Cambridge, MA, USA; Lunar and Planetary Institute: Houston, TX, USA, 1988; pp. 139–153. [Google Scholar]
  14. Neal, C.; Taylor, L.; Schmitt, R.; Hughes, S.; Lindstrom, M. High alumina (HA) and very high potassium (VHK) basalt clasts from Apollo 14 breccias. II-Whole rock geochemistry-Further evidence for combined assimilation and fractional crystallization within the lunar crust. In Proceedings (A89-36486 15-91), Proceedings of the 19th Lunar and Planetary Science Conference, Houston, TX, USA, 14–18 March 1988; Cambridge University Press: Cambridge, MA, USA; Lunar and Planetary Institute: Houston, TX, USA, 1989; pp. 147–161. [Google Scholar]
  15. Finnila, A.; Hess, P.; Rutherford, J.o.G.R.P. Assimilation by lunar mare basalts: Melting of crustal material and dissolution of anorthite. J. Geophys. Res. Planets 1994, 99, 14677–14690. [Google Scholar] [CrossRef]
  16. Ridley, W. On high-alumina mare basalts. In Proceedings (A78-46603 21-91), Proceedings of the 6th Lunar Science Conference, Houston, TX, USA, 17–21 March 1975; Pergamon Press, Inc.: New York, NY, USA, 1975; Volume 1, pp. 131–145. [Google Scholar]
  17. Papike, J.; Vaniman, D. The lunar mare basalt suite. Geophys. Res. Lett. 1978, 5, 433–436. [Google Scholar] [CrossRef]
  18. Hui, H.; Neal, C.R.; Shih, C.-Y.; Nyquist, L.E. Petrogenetic association of the oldest lunar basalts: Combined Rb-Sr isotopic and trace element constraints. Earth Planet. Sci. Lett. 2013, 373, 150–159. [Google Scholar] [CrossRef]
  19. Snyder, G.A.; Taylor, L.A.; Neal, C.R. A chemical model for generating the sources of mare basalts: Combined equilibrium and fractional crystallization of the lunar magmasphere. Geochim. Cosmochim. Acta 1992, 56, 3809–3823. [Google Scholar] [CrossRef]
  20. Warren, P.H.; Kallemeyn, G.W.; Kyte, F.T. Siderophile element evidence indicates that Apollo 14 high-Al mare basalts are not impact melts. In Proceedings of the Lunar and Planetary Science Conference, Houston, TX, USA, 17–21 March 1997; p. 1501. [Google Scholar]
  21. Hui, H.; Oshrin, J.G.; Neal, C.R. Investigation into the petrogenesis of Apollo 14 high-Al basaltic melts through crystal stratigraphy of plagioclase. Geochim. Cosmochim. Acta 2011, 75, 6439–6460. [Google Scholar] [CrossRef]
  22. Neal, C.; Banerdt, W.; Alkalai, L.; Team, L. Lunette: A two-lander Discovery-class geophysics mission to the Moon. In Proceedings of the 42nd Annual Lunar and Planetary Science Conference, The Woodlands, TX, USA, 7–11 March 2011; p. 2832. [Google Scholar]
  23. Nyquist, L.; Wooden, J.; Shih, C.-Y.; Wiesmann, H.; Bansal, B. Isotopic and REE studies of lunar basalt 12038: Implications for petrogenesis of aluminous mare basalts. Earth Planet. Sci. Lett. 1981, 55, 335–355. [Google Scholar] [CrossRef]
  24. Zeigler, R.A.; Korotev, R.L.; Haskin, L.A.; Jolliff, B.L.; Gillis, J.J. Petrography and geochemistry of five new Apollo 16 mare basalts and evidence for post-basin deposition of basaltic material at the site. Meteorit. Planet. Sci. 2006, 41, 263–284. [Google Scholar] [CrossRef]
  25. Grieve, R.A.; McKay, G.A.; Weill, D.F. Microprobe studies of three Luna 16 basalt fragments. Earth Planet. Sci. Lett. 1972, 13, 233–242. [Google Scholar] [CrossRef]
  26. Grieve, R.; McKay, G.; Smith, H.; Weill, D. Lunar polymict breccia 14321: A petrographic study. Geochim. Cosmochim. Acta 1975, 39, 229–245. [Google Scholar] [CrossRef]
  27. Ma, M.S.; Schmitt, R.; Nielsen, R.; Taylor, G.; Warner, R.; Keil, K. Petrogenesis of Luna 16 aluminous mare basalts. Geophys. Res. Lett. 1979, 6, 909–912. [Google Scholar] [CrossRef]
  28. Dickinson, T.; Taylor, G.; Keil, K.; Schmitt, R.A.; Hughes, S.; Smith, M. Apollo 14 aluminous mare basalts and their possible relationship to KREEP. J. Geophys. Res. Solid Earth 1985, 90, C365–C374. [Google Scholar] [CrossRef]
  29. Kramer, G.Y.; Jaiswal, B.; Hawke, B.R.; Oehman, T.; Giguere, T.A.; Johnson, K. The basalts of Mare Frigoris. J. Geophys. Res.Planets 2015, 120, 1646–1670. [Google Scholar] [CrossRef]
  30. Spudis, P.D. The Geology of Multi-Ring Impact Basins; Cambridge University Press: Cambridge, UK, 1993. [Google Scholar]
  31. Hiesinger, H.; Jaumann, R.; Neukum, G.; Head, J.W., III. Ages of mare basalts on the lunar nearside. J. Geophys. Res. Planets 2000, 105, 29239–29275. [Google Scholar] [CrossRef]
  32. Bugiolacchi, R.; Guest, J.E. Compositional and temporal investigation of exposed lunar basalts in the Mare Imbrium region. Icarus 2008, 197, 1–18. [Google Scholar] [CrossRef]
  33. Ng, M.H.; Zhang, X.P.; Xu, Y.; Li, L.S. Major Elements Concentrations in Chang’E-3 Landing Site from Active Particle-Induced X-ray Spectrometer. Remote Sens. 2023, 15, 1643. [Google Scholar] [CrossRef]
  34. Stadermann, F.J.; Heusser, E.; Jessberger, E.K.; Lingner, S.; Stöffler, D. The case for a younger Imbrium basin: New 40Ar-39Ar ages of Apollo 14 rocks. Geochim. Cosmochim. Acta 1991, 55, 2339–2349. [Google Scholar] [CrossRef]
  35. Korotev, R.L. Compositional variation in Apollo 16 impact-melt breccias and inferences for the geology and bombardment history of the Central Highlands of the Moon. Geochim. Cosmochim. Acta 1994, 58, 3931–3969. [Google Scholar] [CrossRef]
  36. Duncan, R.; Norman, M.; Ryder, G.; Dalrymple, G.; Huard, J. Identifying impact events within the lunar cataclysm from 40Ar-39Ar ages of Apollo 16 impact melt rocks. In Proceedings of the Lunar and Planetary Science Conference, League City, TX, USA, 15 March 2004; p. 1328. [Google Scholar]
  37. Nyquist, L.; Shih, C.; Reese, Y. Dating melt rock 63545 by Rb-Sr and Sm-Nd: Age of Imbrium; SPA dress rehearsal. In Proceedings of the 42nd Lunar and Planetary Science Conference, The Woodlands, TX, USA, 7–11 March 2011. [Google Scholar]
  38. Wang, Q.L.; Liu, J.Z.; Ji, J.Z.; Guo, D.J.; Liu, J.W. Redefinition and geological significance of periods of basaltic magma filling in lunar Mare Imbrium. Acta Petrol. Sin. 2016, 32, 29–42. [Google Scholar]
  39. Yun-Zhao, W. Reflectance spectroscopy of the Moon and its application. Earth Sci. Front. 2014, 21, 74. [Google Scholar] [CrossRef]
  40. Spudis, P.D.; Hawke, B.R.; Lucey, P.G. Materials and formation of the Imbrium basin. In Proceedings (A89-10851 01-91), NASA-Supported Research, Proceedings of the 18th Lunar and Planetary Science Conference, Houston, TX, USA, 16–20 March 1987; Cambridge University Press: Cambridge, MA, USA; Lunar and Planetary Institute: Houston, TX, USA, 1988; pp. 155–168. [Google Scholar]
  41. Wilcox, B.; Lucey, P.; Gillis, J. Mapping iron in the lunar mare: An improved approach. J. Geophys. Res. Planets 2005, 110, E2512. [Google Scholar] [CrossRef]
  42. Lucey, P.G.; Blewett, D.T.; Taylor, G.J.; Hawke, B.R. Imaging of lunar surface maturity. J. Geophys. Res. Planets 2000, 105, 20377–20386. [Google Scholar] [CrossRef]
  43. Ma, M.; Li, B.Z.; Chen, S.B.; Lu, T.Q.; Lu, P.; Lu, Y.; Jin, Q. Global estimates of lunar surface chemistry derived from LRO diviner data. Icarus 2022, 371, 114697. [Google Scholar] [CrossRef]
  44. Oberbeck, V.R. The role of ballistic erosion and sedimentation in lunar stratigraphy. Rev. Geophys. 1975, 13, 337–362. [Google Scholar] [CrossRef]
  45. Hagerty, J.J.; Shearer, C.K.; Vaniman, D.T. Heat-producing elements in the lunar mantle: Insights from ion microprobe analyses of lunar pyroclastic glasses. Geochim. Cosmochim. Acta 2006, 70, 3457–3476. [Google Scholar] [CrossRef]
  46. Huang, Y.H.; Minton, D.A.; Hirabayashi, M.; Elliott, J.R.; Richardson, J.E.; Fassett, C.I.; Zellner, N.E.B. Heterogeneous impact transport on the Moon. J. Geophys. Res. Planets 2017, 122, 1158–1180. [Google Scholar] [CrossRef]
  47. Head, J.W.; Wilson, L. Generation, ascent and eruption of magma on the Moon: New insights into source depths, magma supply, intrusions and effusive/explosive eruptions (Part 2: Predicted emplacement processes and observations). Icarus 2017, 283, 176–223. [Google Scholar] [CrossRef]
  48. Xie, M.G.; Xiao, Z.Y.; Zhang, X.Y.; Xu, A.A. The Provenance of Regolith at the Chang’e-5 Candidate Landing Region. J. Geophys. Res. Planets 2020, 125, E6112. [Google Scholar] [CrossRef]
  49. Wang, X.M.; Zhao, S.Y. New Insights into Lithology Distribution Across the Moon. J. Geophys. Res. Planets 2017, 122, 2034–2052. [Google Scholar] [CrossRef]
  50. Lucey, P.G.; Greenhagen, B.; Hanna, K.D.; Bowles, N.; Flom, A.; Paige, D.A. Christiansen Feature Map from the Lunar Reconnaissance Orbiter Diviner Lunar Radiometer Experiment: Improved Corrections and Derived Mineralogy. J. Geophys. Res. Planets 2021, 126, E6777. [Google Scholar] [CrossRef]
  51. Williams, J.P.; Paige, D.A.; Greenhagen, B.T.; Sefton-Nash, E. The global surface temperatures of the moon as measured by the diviner lunar radiometer experiment. Icarus 2017, 283, 300–325. [Google Scholar] [CrossRef]
  52. Greenhagen, B.T.; Lucey, P.G.; Wyatt, M.B.; Glotch, T.D.; Allen, C.C.; Arnold, J.A.; Bandfield, J.L.; Bowles, N.E.; Hanna, K.L.D.; Hayne, P.O.; et al. Global Silicate Mineralogy of the Moon from the Diviner Lunar Radiometer. Science 2010, 329, 1507–1509. [Google Scholar] [CrossRef]
  53. Greenhagen, B.; Lucey, P.; Bandfield, J.; Hayne, P.; Williams, J.; Paige, D. The Diviner Lunar Radiometer compositional data products: Description and examples. In Proceedings of the 42nd Annual Lunar and Planetary Science Conference, The Woodlands, TX, USA, 7–11 March 2011; p. 2679. [Google Scholar]
  54. Lucey, P.G.; Greenhagen, B.T.; Song, E.; Arnold, J.A.; Lemelin, M.; Hanna, K.D.; Bowles, N.E.; Glotch, T.D.; Paige, D.A. Space weathering effects in Diviner Lunar Radiometer multispectral infrared measurements of the lunar Christiansen Feature: Characteristics and mitigation. Icarus 2017, 283, 343–351. [Google Scholar] [CrossRef]
  55. Logan, L.M.; Hunt, G.R.; Salisbury, J.W. The use of mid-infrared spectroscopy in remote sensing of space targets. In Infrared and Raman Spectroscopy of Lunar and Terrestrial Minerals; Academic Press: Orlando, FL, USA, 1975; pp. 117–142. [Google Scholar]
  56. Hanna, K.L.D.; Greenhagen, B.T.; Patterson, W.R.; Pieters, C.M.; Mustard, J.F.; Bowles, N.E.; Paige, D.A.; Glotch, T.D.; Thompson, C. Effects of varying environmental conditions on emissivity spectra of bulk lunar soils: Application to Diviner thermal infrared observations of the Moon. Icarus 2017, 283, 326–342. [Google Scholar] [CrossRef]
  57. Allen, C.C.; Greenhagen, B.T.; Hanna, K.L.D.; Paige, D.A. Analysis of lunar pyroclastic deposit FeO abundances by LRO Diviner. J. Geophys. Res. Planets 2012, 117, E3982. [Google Scholar] [CrossRef]
  58. Hanna, K.L.D.; Wyatt, M.B.; Thomas, I.R.; Bowles, N.E.; Greenhagen, B.T.; Maturilli, A.; Helbert, J.; Paige, D.A. Thermal infrared emissivity measurements under a simulated lunar environment: Application to the Diviner Lunar Radiometer Experiment. J. Geophys. Res. Planets 2012, 117, E3862. [Google Scholar] [CrossRef]
  59. Ma, M.; Chen, J.; Chen, S.; Li, B.; Lu, T.; Han, C.; Tian, P. Study on remote sensing identification and geological characteristics analysis of high alumina mare basalt in Mare Frigoris. Chin. J. Geophys. 2022, 65, 4628–4642. [Google Scholar] [CrossRef]
  60. Ma, M.; Chen, J.R.; Chen, S.B.; Li, B.Z.; Han, C.H.; Tian, P. High alumina basalts identification and their feature analysis in Mare Fecunditatis. Icarus 2024, 407, 115464. [Google Scholar] [CrossRef]
  61. Bandfield, J.L.; Ghent, R.R.; Vasavada, A.R.; Paige, D.A.; Lawrence, S.J.; Robinson, M.S. Lunar surface rock abundance and regolith fines temperatures derived from LRO Diviner Radiometer data. J. Geophys. Res. Planets 2011, 116, E3866. [Google Scholar] [CrossRef]
  62. Sato, H.; Robinson, M.S.; Hapke, B.; Denevi, B.W.; Boyd, A.K. Resolved Hapke parameter maps of the Moon. J. Geophys. Res. Planets 2014, 119, 1775–1805. [Google Scholar] [CrossRef]
  63. Warren, P.H.; Kallemeyn, G.W. Geochemical investigation of two lunar mare meteorites: Yamato-793169: And Asuka-881757. In Proceedings of the NIPR Symposium on Antarctic Meteorites, Tokyo, Japan, 31 May–2 June 1993; pp. 35–57. [Google Scholar]
  64. Lucey, P.; Korotev, R.L.; Gillis, J.J.; Taylor, L.A.; Lawrence, D.; Campbell, B.A.; Elphic, R.; Feldman, B.; Hood, L.L.; Hunten, D. Understanding the lunar surface and space-Moon interactions. Rev. Mineral. Geochem. 2006, 60, 83–219. [Google Scholar] [CrossRef]
  65. Wieczorek, M.A.; Jolliff, B.L.; Khan, A.; Pritchard, M.E.; Weiss, B.P.; Williams, J.G.; Hood, L.L.; Righter, K.; Neal, C.R.; Shearer, C.K.; et al. The constitution and structure of the lunar interior. In New Views of the Moon; Jolliff, B.L., Wieczorek, M.A., Eds.; Reviews in Mineralogy & Geochemistry; Lunar and Planetary Institute: Houston, TX, USA, 2006; Volume 60, p. 221. [Google Scholar]
  66. Prettyman, T. Lunar Prospector GRS Elemental Abundance Bundle; NASA Planetary Data System: Washington, DC, USA, 2021; p. 22. [Google Scholar]
  67. Robinson, M.S.; Brylow, S.; Tschimmel, M.e.; Humm, D.; Lawrence, S.; Thomas, P.; Denevi, B.W.; Bowman-Cisneros, E.; Zerr, J.; Ravine, M. Lunar reconnaissance orbiter camera (LROC) instrument overview. Space Sci. Rev. 2010, 150, 81–124. [Google Scholar] [CrossRef]
  68. Speyerer, E.; Robinson, M.; Denevi, B.; Team, L.S. Lunar Reconnaissance Orbiter Camera global morphological map of the Moon. In Proceedings of the 42nd Annual Lunar and Planetary Science Conference, The Woodlands, TX, USA, 7–11 March 2011; p. 2387. [Google Scholar]
  69. Haruyama, J.; Hara, S.; Hioki, K.; Iwasaki, A.; Morota, T.; Ohtake, M.; Matsunaga, T.; Araki, H.; Matsumoto, K.; Ishihara, Y. Lunar global digital terrain model dataset produced from SELENE (Kaguya) terrain camera stereo observations. In Proceedings of the 43rd Annual Lunar and Planetary Science Conference, The Woodlands, TX, USA, 19–23 March 2012; p. 1200. [Google Scholar]
  70. Smith, D.E.; Zuber, M.T.; Jackson, G.B.; Cavanaugh, J.F.; Neumann, G.A.; Riris, H.; Sun, X.L.; Zellar, R.S.; Coltharp, C.; Connelly, J.; et al. The Lunar Orbiter Laser Altimeter Investigation on the Lunar Reconnaissance Orbiter Mission. Space Sci. Rev. 2010, 150, 209–241. [Google Scholar] [CrossRef]
  71. Barker, M.K.; Mazarico, E.; Neumann, G.A.; Zuber, M.T.; Haruyama, J.; Smith, D.E. A new lunar digital elevation model from the Lunar Orbiter Laser Altimeter and SELENE Terrain Camera. Icarus 2016, 273, 346–355. [Google Scholar] [CrossRef]
  72. Papanastassiou, D.; Wasserburg, G. RbSr ages of igneous rocks from the Apollo 14 mission and the age of the Fra Mauro formation. Earth Planet. Sci. Lett. 1971, 12, 36–48. [Google Scholar] [CrossRef]
  73. Mark, R.K.; Lee-Hu, C.-N.; Wetherill, G.W. Equilibration and ages-Rb-Sr studies of breccias 14321 and 15265. In Proceedings (A75-39540 19-91), Proceedings of the 5th Lunar Science Conference, Houston, TX, USA, 18–22 March 1974; Pergamon Press, Inc.: New York, NY, USA, 1974; Volume 2, pp. 1477–1485. [Google Scholar]
  74. Mark, R.; Lee-Hu, C.; Wetherill, G. More on Rb-Sr in lunar breccia 14321. In Proceedings (A78-46668 21-91), Proceedings of the 6th Lunar Science Conference, Houston, TX, USA, 17–21 March 1975; Pergamon Press, Inc.: New York, NY, USA, 1975; Volume 2, pp. 1501–1507. [Google Scholar]
  75. Dasch, E.; Shih, C.-Y.; Bansal, B.; Wiesmann, H.; Nyquist, L. Isotopic analysis of basaltic fragments from lunar breccia 14321: Chronology and petrogenesis of pre-Imbrium mare volcanism. Geochim. Cosmochim. Acta 1987, 51, 3241–3254. [Google Scholar] [CrossRef]
Figure 1. LRO Diviner Al2O3 map (70° N/S, 32 ppd [43]); the base image is LROC WAC map (100 m/pixel [62]).
Remotesensing 16 02045 g001
Figure 2. Remote sensing identification and morphological geological characteristics analysis of HA basalt flow chart. The red text in the figure introduces the research methodology of this paper.
Remotesensing 16 02045 g002
Figure 3. Exposed rock pixels formed by impact in Mare Imbrium. (a) Map of Mare Imbrium. (b) Map of Mare basalt unit I18 in Hiesinger et al. [31].
Remotesensing 16 02045 g003
Figure 4. Simplified vertical profile of the impact crater. a, b on the crater wall represent the calculated pixels, c, d, e, and g on the edge represent the calculated interference factors. f is the threshold established based on the value of the impact crater radius R.
Remotesensing 16 02045 g004
Figure 5. Map of Mare Imbrium lithology classification results. Including mare basalt (MB), magnesian suite (MS), alkali suite (AS), and KREEP basalt. The mountains in Mare Imbrium are marked in yellow bold text, and the large impact craters are marked in yellow text.
Remotesensing 16 02045 g005
Figure 6. The amount of Mare Imbrium lithological classifications and the amount of MB classifications.
Remotesensing 16 02045 g006
Figure 7. The abundance of the three main oxides in Mare Imbrium HA basalt pixels.
Remotesensing 16 02045 g007
Figure 8. Mare Imbrium HA basalt unit map; F1–F17 represent the identified HA basalt units; the mountains in Imbrium are marked in dark yellow, and the large craters excavated by impact events are marked in light yellow.
Remotesensing 16 02045 g008
Figure 9. The HA basalt layer and basalt layer thickness and ratio (a); the maximum burial depth difference and the minimum burial depth difference (b).
Remotesensing 16 02045 g009
Figure 10. Sinus Iridum basalt units [31] and HA basalt units (a); five units in central Imbrium (b,c) and two large impact craters (d). (d) shows the white box area in (c). The color of the pixels in the figure is the Al2O3 abundance of HA basalts.
Remotesensing 16 02045 g010
Table 1. Laboratory lithology classification criteria [49].
LithologyClassification Criteria
Magnesian SuiteTh/MgO ≤ 0.4495 and TiO2/MgO ≤ 0.03132
Alkali Suite(1) Th/MgO ≤ 0.4495 and TiO2/MgO > 0.03132 and FeO/CaO ≤ 1.2967 and Th/CaO > 0.09372
(2) Th/MgO > 0.4495 and TiO2/Al2O3 ≤ 0.68435 and Th/Al2O3 ≤ 1.32803 and MgO/CaO ≤ 0.575
(3) Th/MgO > 0.4495 and TiO2/Al2O3 ≤ 0.68435 and Th/Al2O3 > 1.32803
KREEP basaltTh/MgO > 0.4495 and TiO2/Al2O3 ≤ 0.68435 and
Th/Al2O3 ≤ 1.32803 and MgO/CaO > 0.575
Mare Basalt(1) Th/MgO > 0.4495 and TiO2/Al2O3 > 0.68435
(2) Th/MgO ≤ 0.4495 and TiO2/MgO > 0.03132 and FeO/CaO > 1.2967
Table 2. Statistical results for the compositional and morphological geological characteristics of HA basalt units.
DesignationHAAl2O3TiO2FeOArea
(km2)
Max Depth (m)Min
Depth (m)
Thick
Ness (m)
Volume
(km3)
F125313.85.317.269005821.667462
F26313.14.817.1133989664.65168
F328414.46.117.647815766.566313
F417713.25.918.256785048.152287
F56214.95.416.9565158858.635200
F631514.35.917.412,1937161.768799
F7158013.85.717.417,0727370.5701219
F8128713.95.617.514,9067931.4701048
F998213.75.116.912,9397080.969888
F10164313.75.417.216,0968201.154864
F118613.85.217.4184248241.85397
F1211113.64.916.5142541038.96187
F1348013.75.217.052567672.066300
F1412513.76.819.329723853.334101
F156314.85.316.8249861531.966166
F162913.74.716.8206746523.566136
F177613.54.716.927512916.138105
Disclaimer/Publisher’s Note: The statements, opinions and data contained in all publications are solely those of the individual author(s) and contributor(s) and not of MDPI and/or the editor(s). MDPI and/or the editor(s) disclaim responsibility for any injury to people or property resulting from any ideas, methods, instructions or products referred to in the content.