Article

Multi-Step Unsupervised Domain Adaptation in Image and Feature Space for Synthetic Aperture Radar Image Terrain Classification

1
The School of Artificial Intelligence, Xidian University, Xi’an 710071, China
2
Hangzhou Institute of Technology, Xidian University, Hangzhou 311231, China
3
High Resolution Earth Observation System Shaanxi Data and Application Center, Xi’an 710061, China
*
Author to whom correspondence should be addressed.
Remote Sens. 2024, 16(11), 1901; https://doi.org/10.3390/rs16111901
Submission received: 9 May 2024 / Accepted: 23 May 2024 / Published: 25 May 2024

Abstract

:
The significant differences in data domains between SAR images and the expensive and time-consuming process of data labeling pose significant challenges to terrain classification. Current terrain classification methodologies face challenges in addressing domain disparities and detecting uncommon terrain effectively. Based on Style Transformation and Domain Metrics (STDMs), we propose an unsupervised domain adaptive framework named STDM-UDA for terrain classification in this paper, which consists of two steps: image style transfer and domain adaptive segmentation. As a first step, image style transfer is performed within the image space to mitigate the differences in low-level features between SAR image domains. Subsequently, leveraging this process, the segmentation network extracts image features, employing domain metrics and adversarial training to enhance alignment between domain gaps in the semantic feature space. Finally, experiments conducted on several pairs of SAR images, each exhibiting varying degrees of differences in key imaging parameters such as source, resolution, band, and polarization, demonstrate the robustness of the proposed method. It achieves remarkably competitive classification accuracy, particularly for unlabeled, high-resolution broad scenes, effectively overcoming the domain gaps introduced by the diverse imaging parameters under studies.

1. Introduction

Synthetic aperture radar (SAR) is an active microwave remote sensing imaging radar with the high resolution and the ability to continuously monitor within a short imaging period. It is less affected by weather and can observe ground targets independent of sunlight illumination. Its applications extend across military and civilian domains [1]. In environmental protection [2], disaster monitoring [3], ocean observation [4], resource preservation [5], land-cover [6] analysis, precision agriculture [7], urban area detection [8], and geographic mapping [9], SAR terrain classification task, predicting semantic labels pixel by pixel, finds extensive usage.
In recent years, with the rapid growth and development of the number of available SAR images and artificial intelligence technology, the exponentially increasing demand for SAR image interpretation, especially for the task of terrain classification, has pushed classification algorithms to gradually shift to automatic, end-to-end, and the hottest deep learning-based [10] methods. The existing deep learning (DL) models integrate the essence of traditional methods, which can learn multi-scale and multi-level feature representations, such as FPN [11]. In addition, it can effectively capture the contextual information of the image, such as ViT [12]. With its powerful feature representation ability, DL methods have made great progress in the field of SAR image terrain classification [13,14,15]. However, the progression of deep learning methods in the domain of SAR image terrain classification remains limited by two respects. On the one hand, different optical images, which are highly consistent with human visual cognition, in SAR images display many abstract forms such as foreshortening, shadow, and layover because of the active microwave imaging process. This makes SAR image labeling arduous, infrequent, and costly to acquire. On the other hand, owing to the distinctive imaging mechanism of SAR, radar imaging parameters have a pronounced influence on SAR images, resulting in variations in data distribution, gray levels, and texture due to different sensors, bands, polarizations, resolutions, or angles of incidence. Figure 1 presents SAR images produced through various resolutions (imaging area is Hanzhong, Shaanxi) and polarizations, where the data for the different polarizations were taken from the study [16]. Notably, substantial variations in grayscale are apparent across these SAR images, particularly when considering distinct imaging modes. Significant domain differences in these complex data situations weaken classification performance during model migration. As a result, the training and testing of deep methods are often limited to the same scene, resulting in a deficiency in model generalization. Therefore, the focus of this paper is to circumvent the constraints imposed by the scarcity of manually labeled samples and the significant domain differences that challenge prevailing deep terrain classification algorithms.
From the above description, the complexity and high dependency of SAR data hinder model generalizability and feature learning. As a special case of transfer learning (TL), domain adaptation (DA) uses the label learning of the source domain to execute new tasks in the target domain. As a paradigm of cross-domain learning, deep DA methods, particularly unsupervised DA (UDA), play a crucial role in enhancing the generalizability of SAR image terrain classification methods. UDA solely depends on source domain labels for model training, while autonomously adapting to the feature distribution of the target domain. This approach significantly mitigates the requirement for manual labeling, minimizes inconsistencies across domain features, and leverages commonalities between the source and target domains. It has been extensively investigated and applied in both natural and remote sensing domains. Existing UDA methods tend to consider only the consistency of the domain in feature space, leading to a limited ability to perceive uncommon terrain features. Li et al. [17] proposed a BDL framework that reduces domain differences through bidirectional learning in two sequential steps of image translation and segmentation adaptation in both directions. It is essential to highlight that the image translation network’s quality in the mentioned framework significantly influences the image segmentation quality. The study demonstrates that maintaining consistency among low-level features within the image space facilitates the model in capturing fundamental terrain features, consequently enhancing domain alignment within the feature space.
Drawing inspiration from the above research, a multi-step unsupervised domain adaptive SAR image terrain classification framework (STDM-UDA) based on style transfer and domain metrics is proposed for unlabeled scenes, while considering the unique characteristics and present state of SAR images. STDM-UDA, a two-step independent domain adaptive network is constructed to reduce domain differences in image space and semantic space and to migrate annotation information from the source to achieve terrain classification in the target domain. In the first step, the style transfer network facilitates the migration of SAR image style characteristics from the source to the target domain, diminishing disparities in low-level statistical attributes like brightness and contrast among images. This process narrows the domain gaps within the image space, aiding the network in acquiring shared feature representations. In the second step, the network extracts semantic features from the images and employs adversarial learning and domain metrics to align the translated source and target domains within the feature space. STDM-UDA enhances model generalization and accomplishes target domain image terrain classification by leveraging source domain information, thus obviating the need for target domain image annotation.
In summary, the main contributions of this paper are as follows:
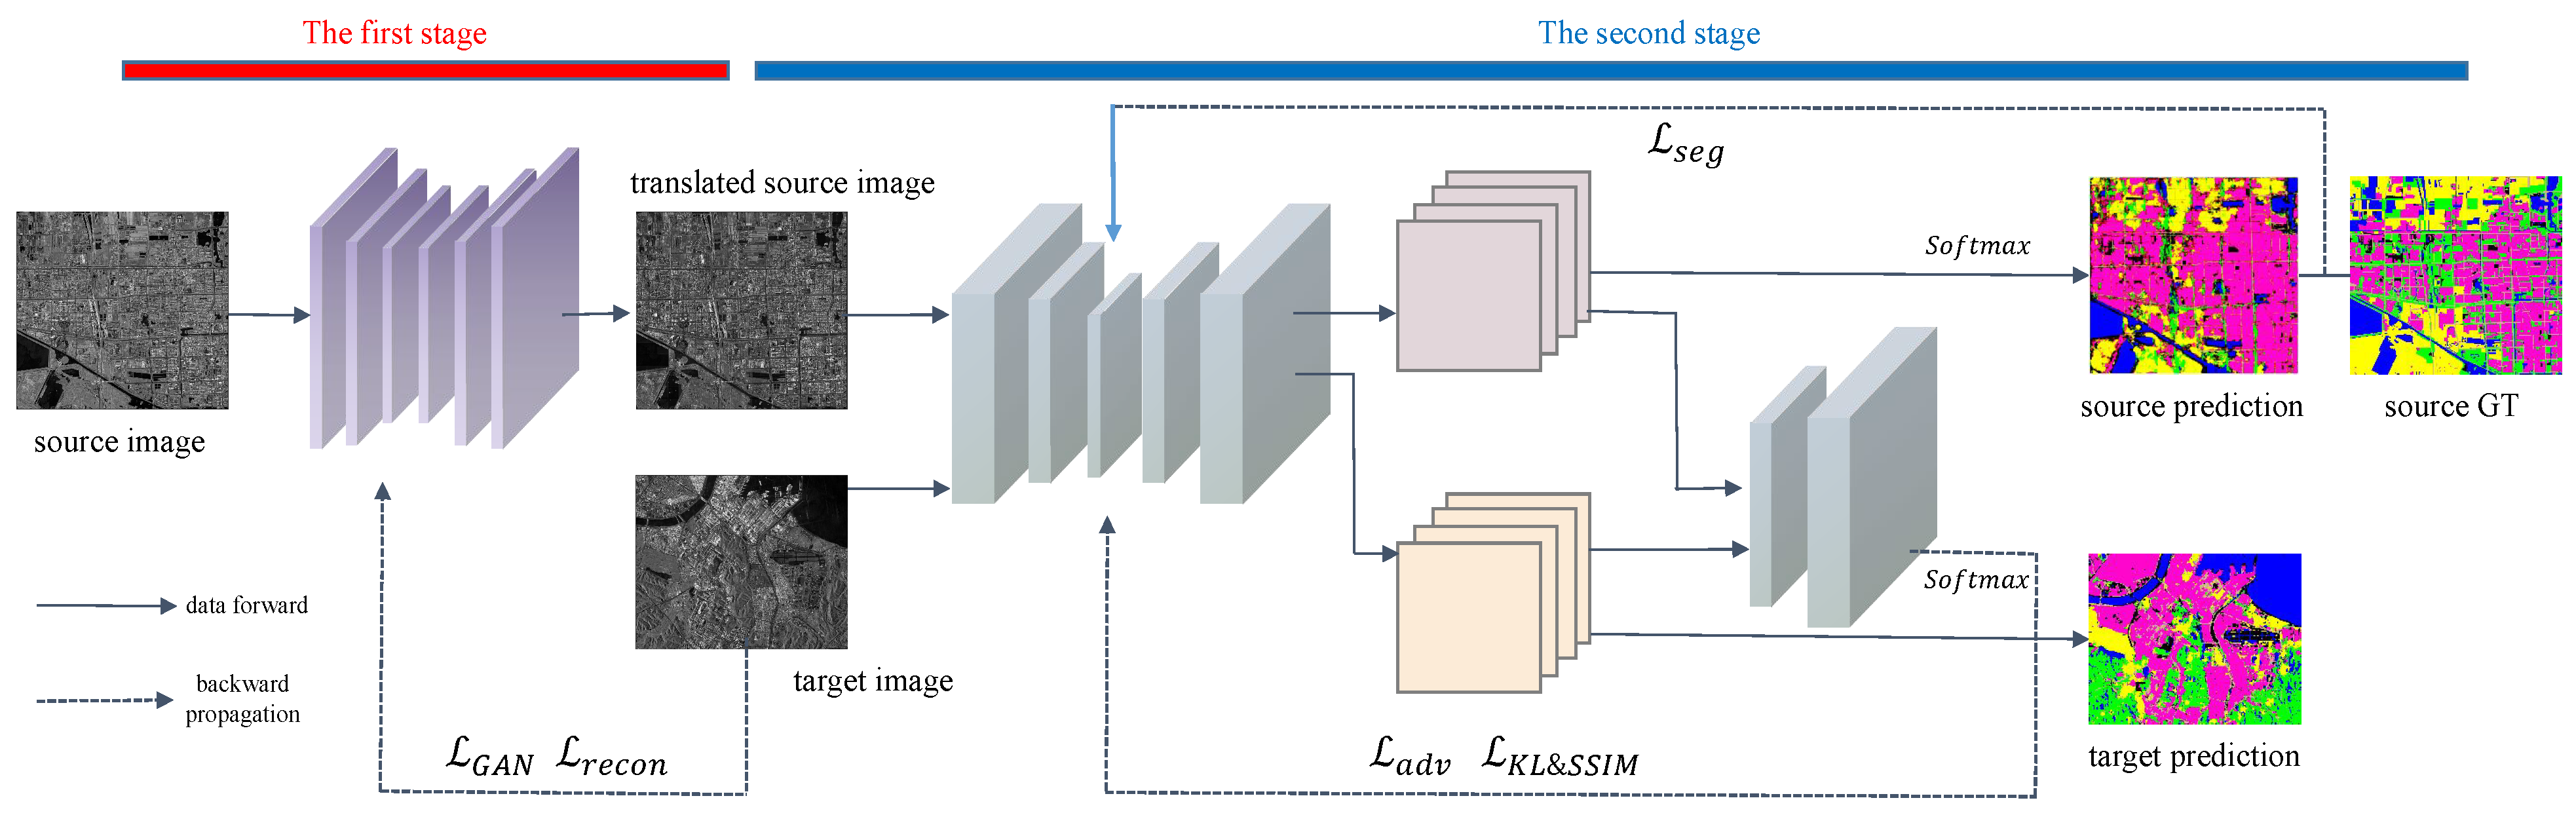
  • A multi-step unsupervised domain adaptive SAR image terrain classification model framework based on Style Transformation and Domain Metrics (STDM-UDA) is proposed. The framework reduces the domain differences in both image space and feature space through two independent domain adaptation networks to enhance the generalization of the model.
  • STDM-UDA transfers source domain knowledge to an unlabeled target domain, avoiding the need for labeled data in the target domain.
  • The effectiveness of STDM-UDA is convincingly demonstrated by the terrain classification results in three high-resolution broad scenes without labels.
The rest of this paper is organized as follows. The related work is introduced in Section 2. Section 3 details the method adopted in this paper. Section 4 presents the classification experimental results on SAR images. Finally, discussion and conclusions are summarized in Section 5 and Section 6.

2. Related Works

2.1. SAR Image Terrain Classification

In practical applications, DL methods are divided into supervised learning and unsupervised learning according to whether to use labeled data to learn the objective function. Supervised learning has demonstrated significant advantages in nature and remote sensing domains, while unsupervised learning offers broader application prospects.
One big challenge of supervised learning is generalization, i.e., how well a trained model performs on test data. Therefore, various DL techniques and model structures have been proposed to assist models in learning more general feature representations. In [18], the authors proposed a region-level SAR image classification algorithm based on RCC-MRF (RCC, region category confidence-degree) and CNN. The unary energy function of RCC-MRF is used to explore the most probable regions of the CNN-predicted label distribution, while the binary capability function is used to constrain the space of neighboring superpixel regions. In [14], the authors extract image features on multi-scale sub-images and feeds them into softmax classification. Then, the classification map is optimized by the bilateral filtering method based on the spatial relationship to improve the smoothness of the classification map. Compared with [18], the work in [14] is more efficient for spatial constraints in the label domain. In [19], the authors adopted a two-stage approach for SAR image classification. In the first stage, the SAR classification network is directly trained to obtain intermediate-layer image features. In the second stage, an end-to-end metric network is trained to measure the relationship between sample features. This simple approach can achieve better performance than a normal CNN structure. In addition to using the CNN network, Geng et al. [20] proposed to use LSTM to learn the potential spatial relationship of SAR images and use non-negative and Fisher-constrained autoencoders for feature discrimination and classification. Zhang et al. [21] used the GAN network to extract and integrate multi-scale image features in a semi-supervised manner, and perform final classification.
Unsupervised learning aims to automatically mine potential modes in data, suitable for unlabeled data. In [22], the authors use deep learning to cluster images as well as the VGG16 model with batch normalization to extract SAR image features, and they build an entropy-based loss function for training. However, its classification accuracy is low. In [23], the authors propose a SAR image segmentation network that combines the modeling ability of the conditional random field (CRF) model with the representation learning ability of the unsupervised principal component analysis network (UPCANet). However, the network is computationally intensive, slow, and has low robustness to speckle. In VQC-CAE [24], this unsupervised PolSAR image classification model embeds the features extracted by the CAE network into a vector quantization module for clustering and constructs a quantization loss and reconstruction loss training model. The classification accuracy of this model is good, but the number of cluster centers needs to be set manually. In [13], the authors propose a GHCNN algorithmic framework that stacks multiple unsupervised trained convolutional AE (CAE) modules to form a deep hierarchy to achieve SAR image classification through fine-tuning supervised data. In [25], the authors directly use low-level superpixels and CNN high-level semantic information to generate pseudo-labels and model training. During training, the quality of the labels generated by the model also continues to improve. Inspired by the success of ViT [12] and MAE [26], in [27], based on the ViT model, the authors use random mask self-encoding to pre-train on unlabeled data and apply them to polSAR image classification. However, this random mask strategy will cause the model to lose the ability to perceive small targets in remote sensing images and increase the difficulty of image reconstruction. In [28], the authors propose to use the PImask strategy instead of the random mask strategy for model pre-training to preserve the feature information of small targets and obtain advanced classification performance. Overall, state-of-the-art unsupervised learning has met them in terrain classification performance compared to partially supervised learning methods.

2.2. Deep Domain Adaptation in SAR Image

When transferring knowledge between SAR scenarios, it is often the case that there exists some deterioration of performance on test scenes. DA aims to address the degradation of classification performance by correcting the domain mismatch between training and test data. Deep DA can be broadly divided into three categories: discrepancy-based [29], adversarial-based [30], and self-training-based deep DA [31].
Difference-based SAR image domain adaptive segmentation aims to align feature representations of source and target domains through fine-tuning deep networks with target-domain-labeled or -unlabeled data. However, an effective representation of the domain differences plays a crucial role in determining the domain generalizability of the model [32,33]. In [34], the context features of SAR images are extracted through the LSTM network. Then, the cross-domain features are mapped to a common feature subspace through the edge adaptive network to alleviate the problem of different feature dimensions and distribution edges of heterogeneous SAR data. The conditional distribution adaptive network is used to resolve the feature differences within classes of heterogeneous SAR images. In [35], the authors transfer the electro-optical (EO) domain knowledge to the domain of SAR image classification by minimizing the distribution between EO and SAR images. Specifically, two coupled deep encoders map heterogeneous data to a shared embedding space and then use SWD to minimize the two-domain feature distribution. In [36], the authors used model distillation to transfer EO domain knowledge to the SAR image domain. Huang et al. [37] proposed a multi-step DA method, using remote sensing images as the transition domain, and transferring natural image information to SAR images to adapt to the classification of SAR images. These methods strengthen the learning of domain-invariant features while ignoring domain-specific representation information, which will lead to a decrease in the discriminative performance of target domain features.
DA methods based on adversarial and self-training are also representative. Adversarial-based methods aim to align different domains on intermediate features or network predictions. This method circumvents the requirement to explicitly display domain differences. However, it may lead to issues of instability and mode collapse in adversarial networks, thus hindering the effective alignment of source and target domains. The style transfer [38] is a typical adversarial-based model. Furthermore, in [39], the authors use an adversarial domain translator as a general-purpose domain transference solution to learn cross-domain features and conduct complete domain adaptation from optical images to SAR images. The self-training methods are to iteratively generate pseudo-labels on the target domain data to train the model. The training process of these methods is complex and usually includes the joint training of multiple networks. In [31], a spherical spatial adaptive network is proposed to tackle cross-domain unknown category data. In addition, the authors believe that using only a single domain adversarial learning makes itdifficult to obtain satisfactory classification performance on the target domain, and adding pseudo-labels improves classification performance.

3. Methods

The technical details of STDM-UDA are described in this section. The complete structure of the proposed framework is shown in Figure 2, in which STDM-UDA consists of two independent steps based on adversarial DA: image style transfer network and adaptive segmentation network. The networks in both steps of STDM-UDA employ the generative adversarial network (GAN) training strategy for domain adaptive learning. The training process for each network is conducted independently. In the first step, the network is directed to achieve SAR image style transfer from the source to the target domain. This process diminishes differences between the two domains in the low-level of image space, encompassing brightness, contrast, dynamic range, and texture. Consequently, it eases the visual discrepancies between domains and facilitates knowledge transfer. The generated intermediate domain images along with the target domain images are trained for the adaptive images segmentation network in the second step, and each pixel category of the broad scenes in the target domain is acquired during testing.
In the remainder of this section, the data preprocessing of raw SAR images is described in Section 3.1. The image translation network and adaptive segmentation network are detailed in Section 3.2 and Section 3.3, respectively.

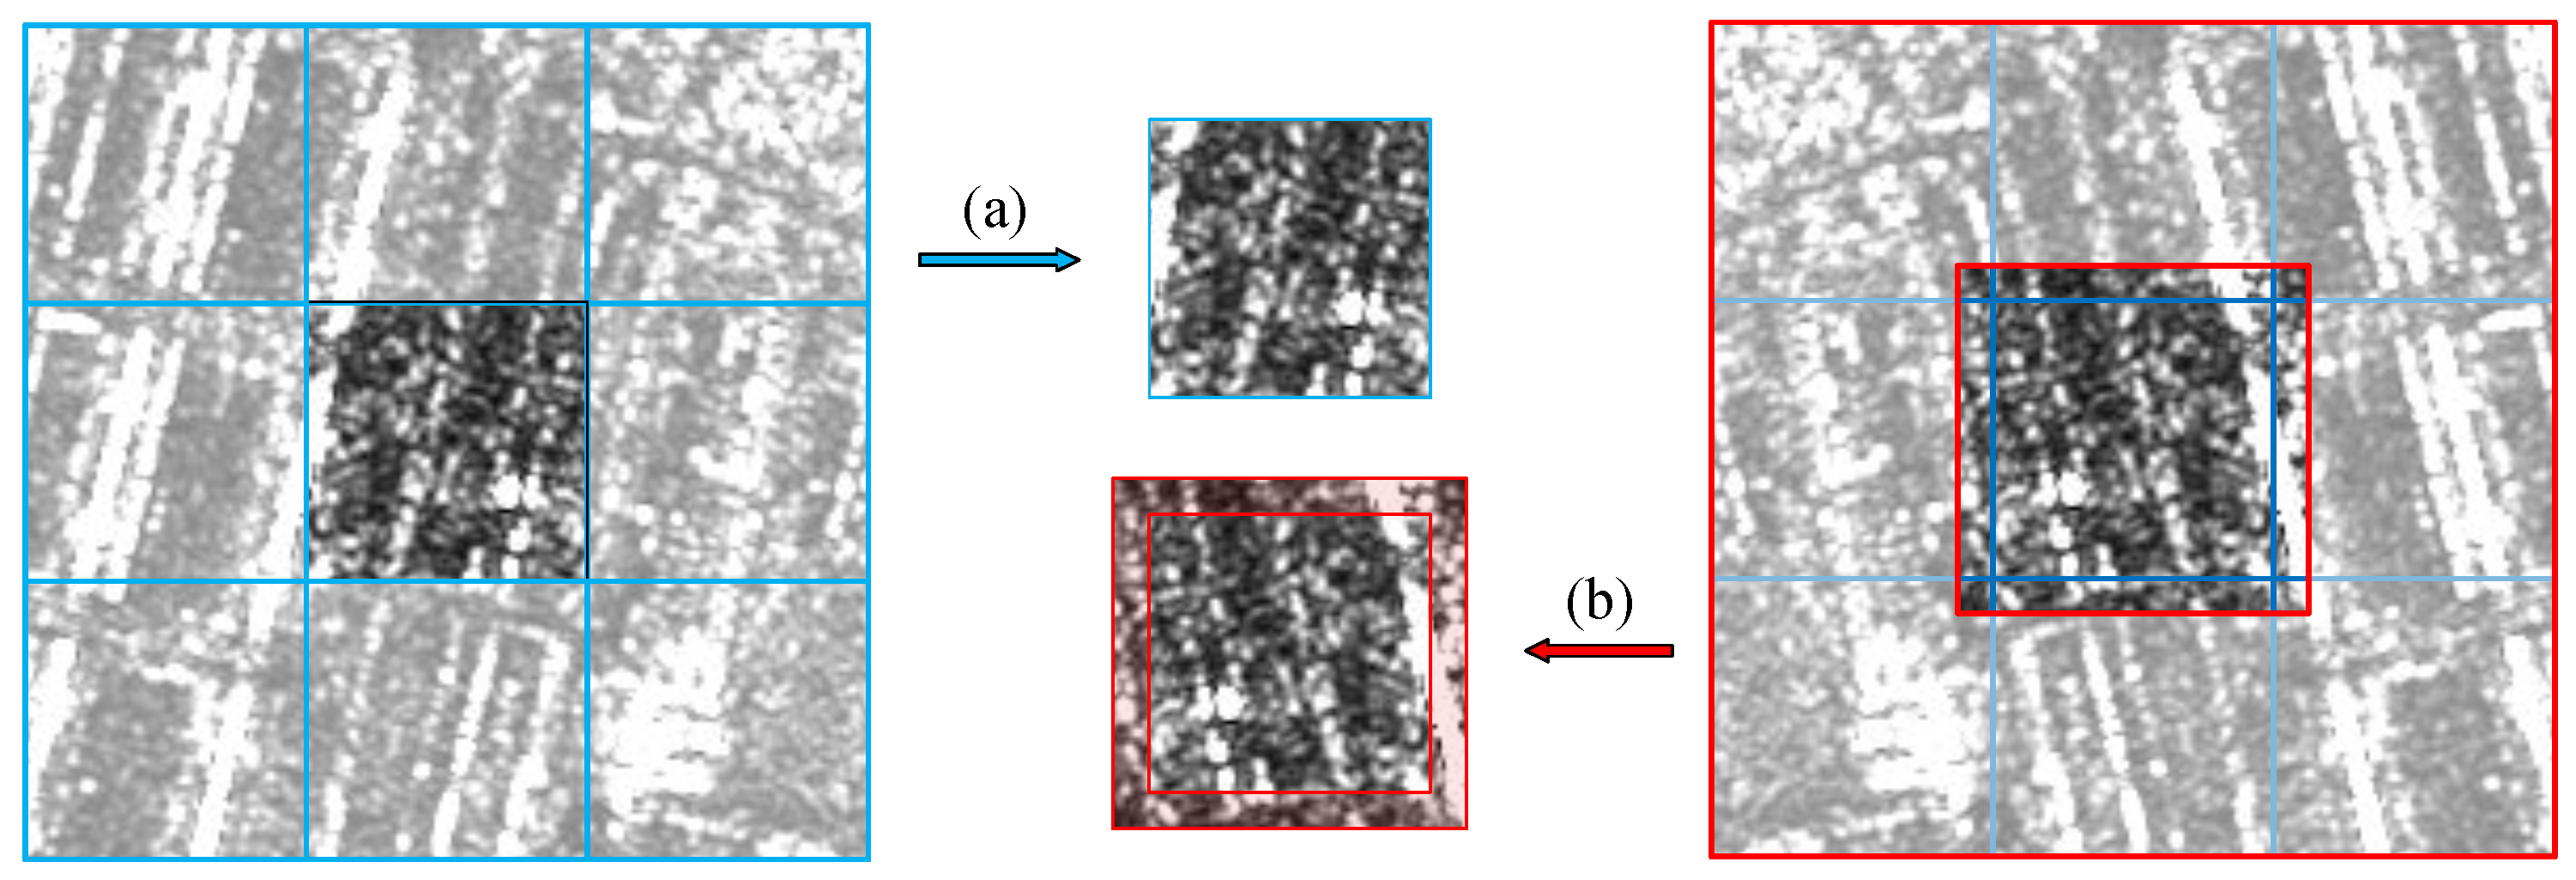
3.1. Data Preprocessing

This section describes the preprocessing of raw SAR images of a broad scene. SAR images have a large dynamic range due to their spatial resolution. As a result, the raw SAR images generally consist of 16-bit unsigned integer data with a highly asymmetric distribution, where the majority of pixels are located in the low amplitude range (0 to 500). Standard CNNs are unable to handle such a large dynamic range, so dynamic range compression is necessary. Applying a simple linear stretching to the SAR images cause the compression of the majority of pixel points into a narrow range of small gray levels, leading to a significant loss of detail information. As a consequence, the image cannot be accurately displayed. This will cause the recognition of the neural network to be misdirected. To mitigate this issue, we employ linear stretching with truncation for processing raw SAR images. Specifically, the distribution and frequency of occurrence of the gray levels of the raw SAR images are counted in ascending order and a distribution function is accumulated. As the distribution function accumulates to a threshold, the gray values of pixels with higher gray levels are overwritten by 255, and the remaining pixel gray values are linearly stretched between 0 and 255. The definition is as follows:
p i j o u t = 255 × p i j i n p t h , if p i j i n < p t h 255 , if p i j i n p t h
where p t h represents the truncated gray value, and p i j i n and p i j o u t represent the input and output gray levels at pixel points (i, j), respectively.
The dynamic range-transformed SAR image is divided into a series of subimages using dilated sampling. Figure 3 illustrates the difference between direct and dilated sampling. Unlike direct sampling, the dilated sampling approach discards the prediction results of boundary pixels with contextual information deprivation. Although this increases the prediction overhead, it significantly enhances the consistency of predicted terrian at the boundaries of the subimage predicted results.

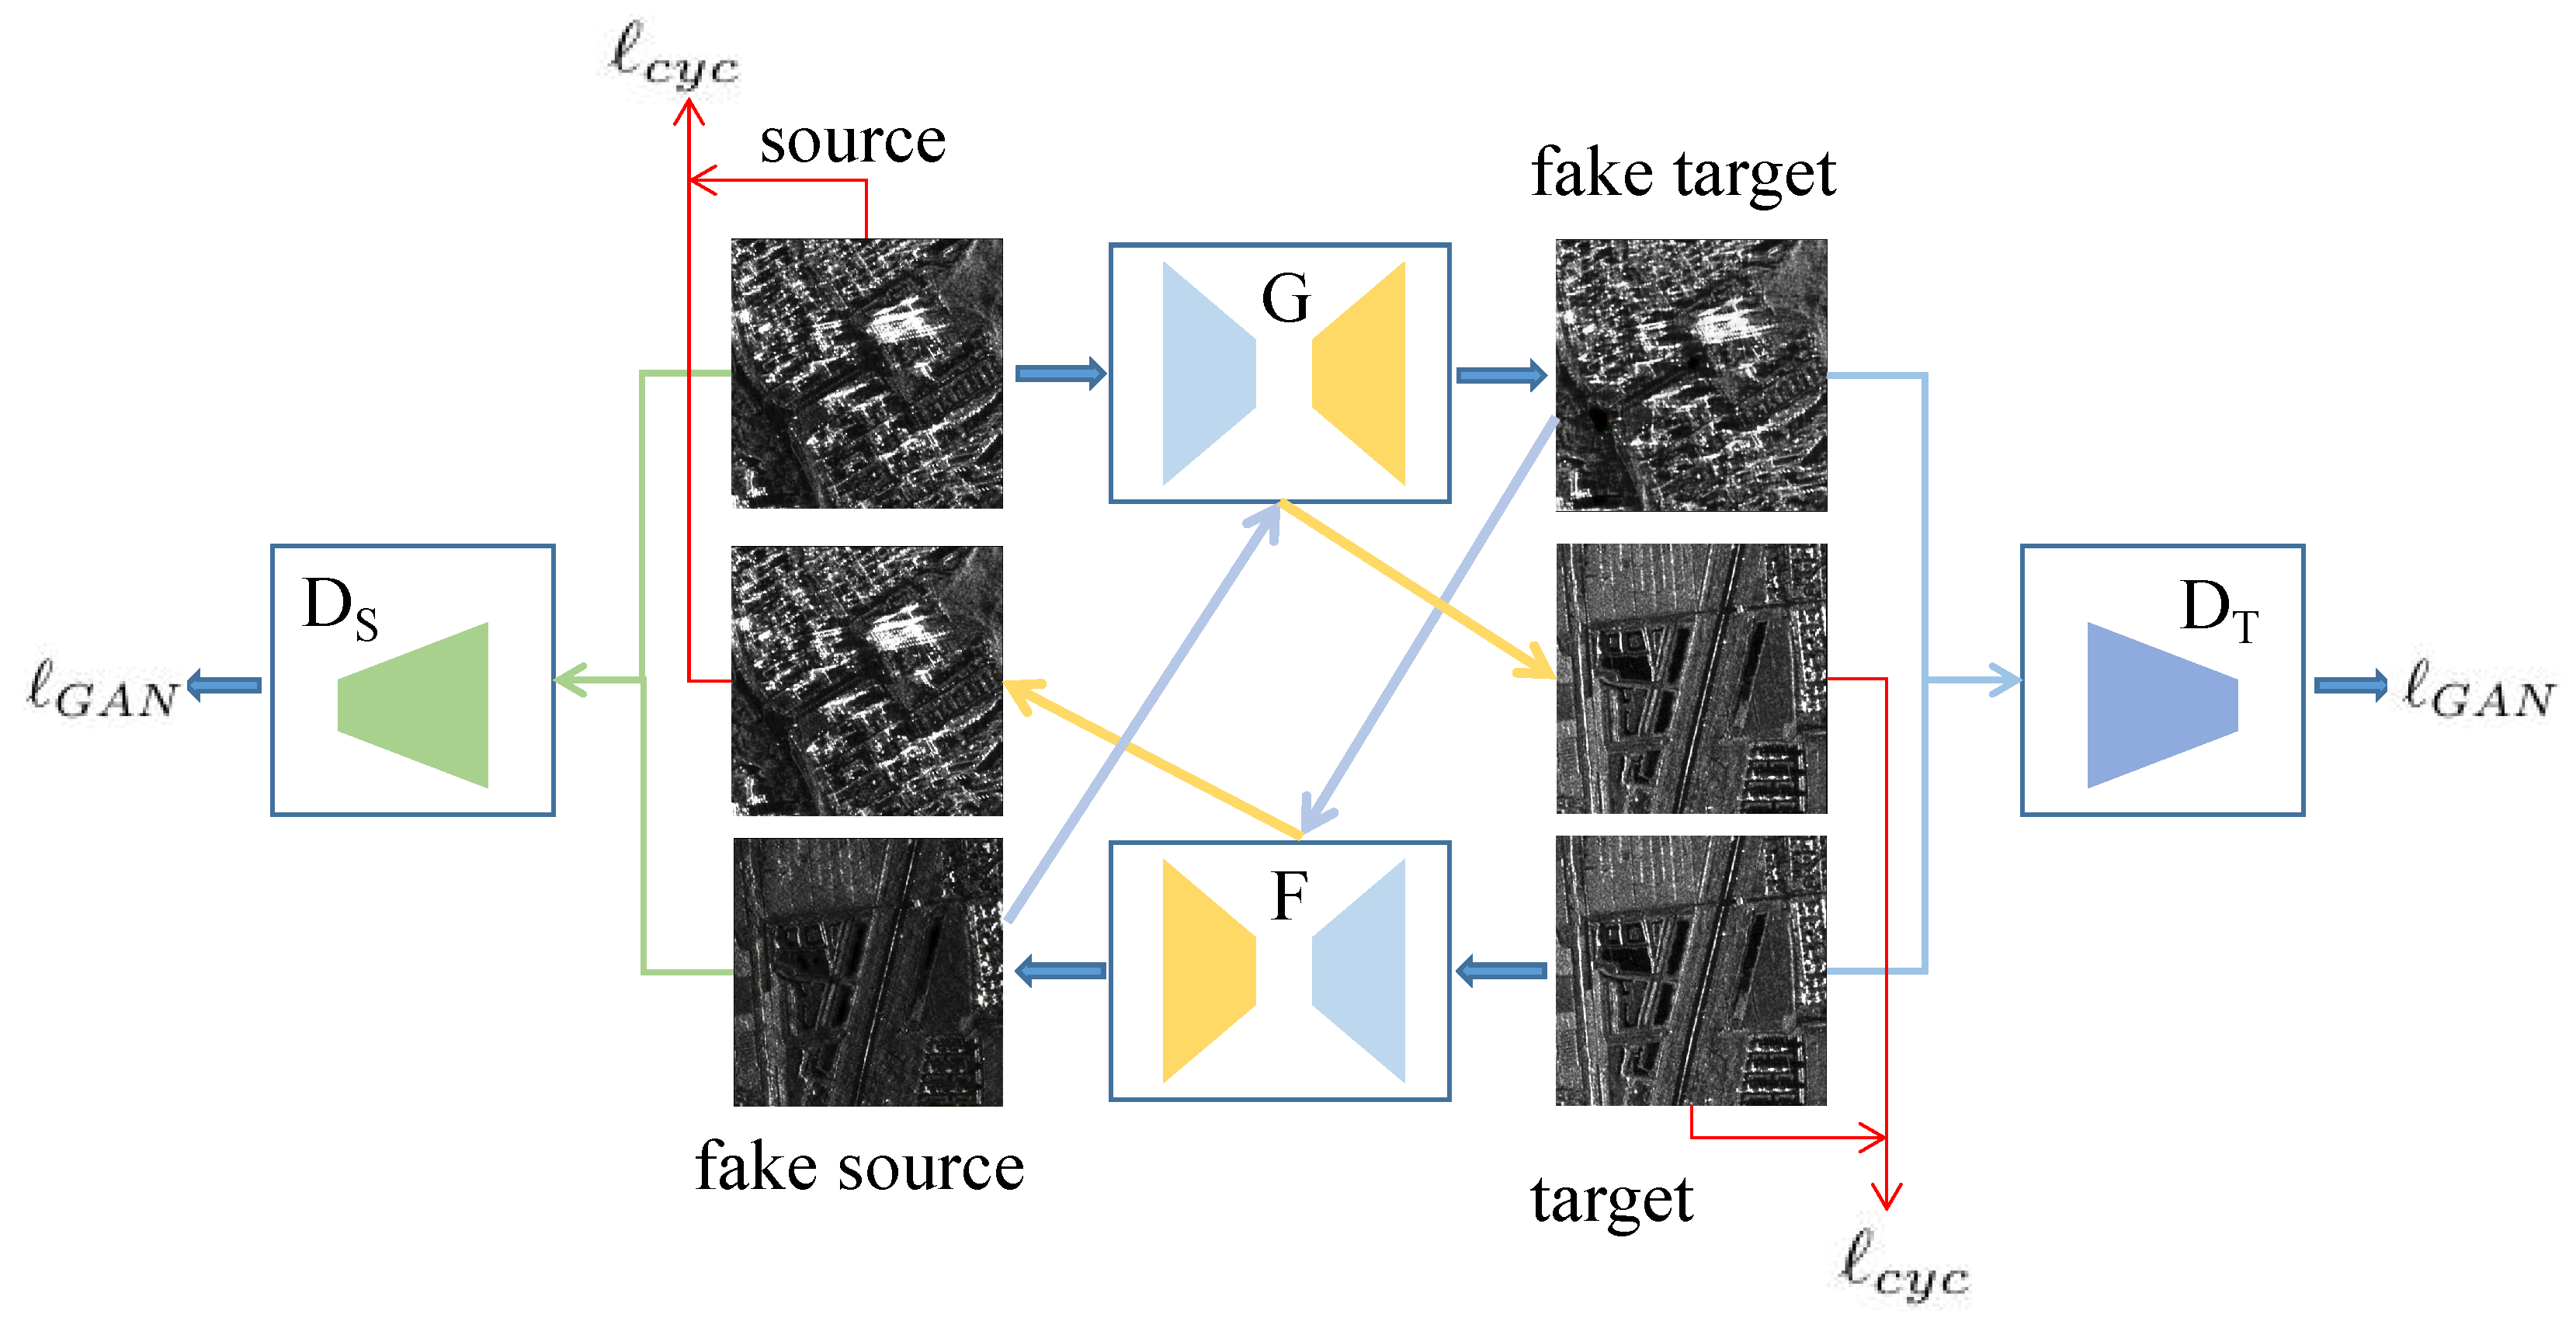
3.2. Image Style Transfer Network

The GAN-based image style transfer network (STN) is used as the first step of STDM-UDA as an adversarial domain adaptive network, which achieves the directional transfer of style images from the source to the target domain. Reducing the domain differences at the low level between the two domains in the image space provides a good starting point for the second step of the adaptive segmentation network.
In STDM-UDA, we adopt CycleGAN [38] as the unpaired SAR image style transfer model. Rather than necessitating a direct correspondence between SAR images in the source and target domains, CycleGAN encourages the generator to achieve SAR image style transfer through adversarial learning. This entails the discriminator evaluating the stylistic similarity between the generated (translated) image and the target domain image. Its structure is shown in Figure 4 and consists of two pairs of the generator and the discriminator. The generators G and F establish a bi-directional mapping relationship between the images of the source domain S and the target domain T. The discriminators D S and D T separately discriminate between the source images s and the translated source images F ( t ) , and the target images t and the translated target images G ( s ) . For convenience, it is defined E s p d a t a ( s ) as the sample space of the source domain S, and  E t p d a t a ( t ) is the sample space of the target domain T. In summary, the loss function of STN has the following parts: an adversarial loss L G A N , a cycle consistency loss L c y c , and an identity loss L i d e n t i t y .

3.2.1. Adversarial Loss

The G learns the mapping from S to T ( G : S T ) , and the F learns the mapping from T to S ( F : T S ) . We apply adversarial losses to both mapping functions such that the mapped data distribution is close to that of the target domain. The adversarial loss [40] is applied to both mappings so that the mapped data distribution is close to the real-data distribution.
The adversarial loss of S T is defined as follows:
L G A N ( G , D T , S , T ) = E t p d a t a ( t ) [ log D T ( t ) ] + E s p d a t a ( s ) [ log ( 1 D T ( G ( s ) ) ) ]
The G aims to generate plausible images of T. The  D T is dedicated to distinguishing between real and generated images of T so that the optimization objective for this loss is to minimize G and maximize D T .
The adversarial loss of T S is
L G A N ( F , D S , T , S ) = E s p d a t a ( s ) [ log D S ( s ) ] + E t p d a t a ( t ) [ log ( 1 D S ( F ( t ) ) ) ]
Similar to the process for S T , the goal is to minimize F and maximize D S .

3.2.2. Cycle Consistency Loss

Relying solely on an adversarial loss does not guarantee that the generator will consistently map the input to the desired output, especially in the case of larger models. To ensure that the learned G and F maintain consistency without contradicting each other, the cycle consistency loss [38] is added to aim for the G ( F ( t ) ) to resemble the t, and the F ( G ( s ) ) to resemble the s as closely as possible. The cycle consistency loss incorporates the L 1 loss to quantify the similarity between images during the learning process of the two mappings. L 1 is used in the loss to measure the consistency between SAR images. The definitions are as follows:
L c y c ( G , F ) = E s p d a t a ( s ) [ | | F ( G ( s ) ) s | | 1 ] + E t p d a t a ( t ) [ | | G ( F ( t ) ) t | | 1 ]
Under the constraint of cycle consistency loss, both G and F satisfy the forward cycle consistency for image s. The image style transfer cycle takes s back to the original image after one cycle ( s G ( s ) F ( G ( s ) ) s ). The same holds for image t.

3.2.3. Identity Loss

The loss [38] is designed to train the network to recognize image styles. For the generators, the output is an identity mapping when real samples are used as input. Its expression is as follows:
L i d e n t i t y ( G , F ) = E s p d a t a ( s ) [ | | F ( s ) s | | 1 ] + E t p d a t a ( t ) [ | | G ( t ) t | | 1 ]

3.2.4. Full Objective

The full objective of the image translation network is
L ( G , F , D S , D T ) = L G A N ( G , D T , S , T ) + L G A N ( F , D s , T , S ) + λ L c y c ( G , F ) + L i d e n t i t y ( G , F )
where λ is the cycle consistency loss coefficient.
The ultimate goal is to optimize
G * , F * = a r g m i n G , F m a x D S , D T ( G , F , D S , D T )

3.3. Adversarial Adaptive Segmentation Network

As shown in the second stage in Figure 2, based on the intermediate domain outputs in the first step, the adversarial-based domain adaptive segmentation network achieves the alignment of the semantic features of the two domains and outputs the terrain classification results. The whole training process of STDM-UDA is listed in Algorithm 1.
Algorithm 1 The training process of STDM-UDA.
1: Input :   s S , t T , and the y s .
2: Stage 1 :
3:Initialize image translation network { G , F , D S , D T } .
4:for number of image translation iterations do
5:   train { G , F , D S , D T } with Formula (7).
6:end for
7:Get the s by the G ( S ) .
8: Stage 2 :
9:Initialize the M and the D.
10:for number of segmentation iterations do
11:   train M with Formula (10).
12:   train D with Formula (11).
13:end for
The adaptive classification network consists of a segmentation network M and a domain discrimination network D. The M output the segmentation probability map M ( s ) of translated source domain image s and the target domain image segmentation probability map M ( t ) . The predicted segmentation map of the image is obtained by using a softmax operation on M ( s ) and M ( t ) . The D discriminates the domain features learned by the M and measures the similarity between the two domain distributions to reduce the difference between the source and target domain. On this basis, we add a measure of domain feature similarity to complement the adversarial loss in an explicit metric to further facilitate the learning of domain-invariant features by the M.
The objective function of the M mainly consists of adversarial loss and segmentation loss [41], which are expressed as
L s e g = 1 H W H , W c = 1 C 1 [ c = y s h w ] log P s h w c
L a d v = E t T [ D ( M ( t ) ) ] + E s S [ 1 D ( M ( s ) ) ]
where y s is the label map of s, C is the number of classes, and 1 [ · ] is an indicator function with a value of 1 if the condition is true and 0 otherwise. H and W are the height and width of the output probability map. P s is the translated source domain probability of the output of M, defined as P s = M ( s ) .
L M = λ s i m L s i m ( D ( M ( s ) ) , D ( M ( t ) ) ) + s e g + λ a d v L a d v
where L s i m represents a function that measures the similarity of features or distributions, which is a linear combination of kl divergence and SSIM [42]. λ a d v and λ s i m represent the adversarial loss coefficient and the similarity loss coefficient.
And the objective function of the D is the adversarial loss, which is expressed as follows:
L D = E s S [ log D ( M ( s ) ) ] E t T [ log ( 1 D ( M ( t ) ) ) ]
Additionally, in the testing phase, we employed dilate prediction to mitigate errors due to insufficient contextual information in pixels at the edges of image blocks.

4. Experiments

In this section, the experimental results and model setting of STDM-UDA are shown. In Section 4.1, the experimental data and subgroups are introduced. The setting and index are described in Section 4.2 and Section 4.3, respectively. The results of STDM-UDA are shown in Section 4.4.

4.1. Experimental Dataset

To evaluate the effectiveness and robustness of the proposed method, experiments were conducted on five high-resolution single-channel SAR images. Details of the experimental data are shown in Table 1. Figure 5 shows the SAR image and its corresponding ground truth of Shandong and Pohang are displayed in Figure 6 and Figure 7. The data are divided into three pairs according to the degree of the domain gap and the challenges of migration. The aim is to demonstrate the feasibility of STDM-UDA at different levels of domain differences. Differing only in the imaging region and polarization, the Shandong (China) and Pohang (Republic of Korea) data were used as the first pair of experimental data. They have smaller differences in imaging mode and appearance. Considering only the consistency of the bands, the PoDelt (Italy) and Rosenheim (Germany) data were the second pair of experimental data. The PoDelta and JiuJiang (China) data with the largest differences were used as the third pair of experimental data.
The broad scenes of the first group contain the same five terrain categories, i.e., water, green, building, farmland, and road. The remaining two data groups contain four terrain categories, i.e., water, forest, building, and farmland. Their color indicator is illustrated at the bottom of Figure 5. The ground truth of all SAR images discussed in this study was derived through manual labeling. With respect to the expertise required and the difficulty of identification, all terrain types except the four mentioned were categorized as “other”. Notably, the “other” class encompasses diverse and intricate terrains. Including it in the training and testing phases would hinder the learning process for these labeled terrains and diminish interpretability. Hence, the "other" class is disregarded during both training and testing.
All experiments were performed using the online platform ModelArts, implemented on the Mindspore 1.6.0 framework with Ascend-910 NPUs.

4.2. Implementation Details

4.2.1. Data Preprocessing

All broad scene data are compressed into dynamic ranges with a truncation threshold of 95%. The preprocessed SAR images are sampled without dilation to obtain the train set and dilation is employed to obtain the test set, where the dilated size is 100 and the block size of both training and test images is 512. S1 and S2 in Table 1 show the number of samples under different sampling methods. In addition, the single-channel SAR images in the experiment are converted into pseudo-three-channel RGB images. The specific method is to copy the single-channel data value of the image three times to form a three-channel image.
The input SAR images utilized in all network experiments underwent no data augmentation apart from dynamic range truncation and channel replication of the original data.

4.2.2. Architecture

CycleGAN was used for the image style transfer network. The segmentation network M uses the DeepLabv2 [41] architecture based on ResNet101 [43]. The discriminator D consists of five convolutional layers, where the activation layer uses LeakyReLU and α is 0.2. The structure of D is shown in Table 2.

4.2.3. Training Details

We train STDM-UDA for 56,000 iterations with non-dilated sampled data. The training settings for the image style transformation network are consistent with CycleGAN. Our batch size is 2 in the adaptive segmentation network. The segmentation network M uses an SGD optimizer with a learning rate of 0.00025, a weight decay of 0.0005, and a momentum of 0.9. The discriminator D uses the Adam optimizer with a learning rate of 0.0001, β 1 of 0.9, and β 2 of 0.99. Both learning rates adopt a linear decline strategy.

4.3. Classification Accuracy Index

The classification accuracy of the experiments is calculated quantitatively based on the ground truth (GT) labels of the images. Overall classification [20,44] performance was evaluated using overall accuracy (OA), kappa coefficient, mean intersection over union (MIoU), and frequency-weighted intersection over union (FWIoU). The classification performance of each category was evaluated using precision [45]. For the convenience of representation, the total number of pixels whose real category j is identified as a category i is denoted as p i j , the total number of samples is denoted as N, and the number of categories is denoted as C. The accuracy metrics are defined as follows:
O A : It is the percentage of accurately classified pixels out of all pixels.
O A = i = 0 C p i i i = 0 C j = 0 C p i j
K a p p a : It is an indicator for consistency check and can also be used to measure the effect of classification.
K a p p a = O A P e 1 P e , P e = 1 N 2 i = 1 C ( j = 0 C p i j ) × ( j = 0 C p j i )
where P e is the hypothetical probability of chance agreement.
M I o U : It calculates the ratio of the intersection and union of two sets of true and predicted values.
M I o U = 1 C + 1 i = 0 C p i i j = 0 C p i j + j = 0 C p j i p i i
F W I o U : It is an improvement of MIoU, which sets weights according to the frequency of occurrence of categories.
F W I o U = 1 i = 0 C j = 0 C p i j × i = 0 C p i i j = 0 C p i j j = 0 C p i j + j = 0 C p j i p i i
Precision: It is the proportion of all correctly predicted positive samples to all positively predicted positive samples.
P r e c i s i o n i = p i i j = 0 C p i j
Among all the above measures, O A is the most used. The higher value of these accuracy metrics indicates the better semantic segmentation performance of the model.

4.4. Results and Comparison

The proposed SMDM-UDA model is compared with multiple domain adaptive methods for land-cover classification performance under three data conditions to demonstrate its effectiveness. AdaptSegNet [46] treats semantic segmentation as a structured output that includes spatial similarities between source and target domains and performs an adaptation of the output space at different feature levels. In AdvEnt [47], the entropy loss and the confrontation loss are used to complement each other to realize the UDA task based on pixel prediction entropy loss. The EPOSearch [48] combines gradient descent and carefully controlled ascent and traverses the Pareto front until the required solution is reached. In the comparison, only the structure of the single-step adversarial domain adaptive segmentation model is used as the Baseline. DM-UDA adds domain measurement auxiliary information based on the Baseline. STDM-UDA adds style transfer and domain metric auxiliary information on the Baseline. In all methods, the target domain label information is not used for model training, but only for model evaluation.

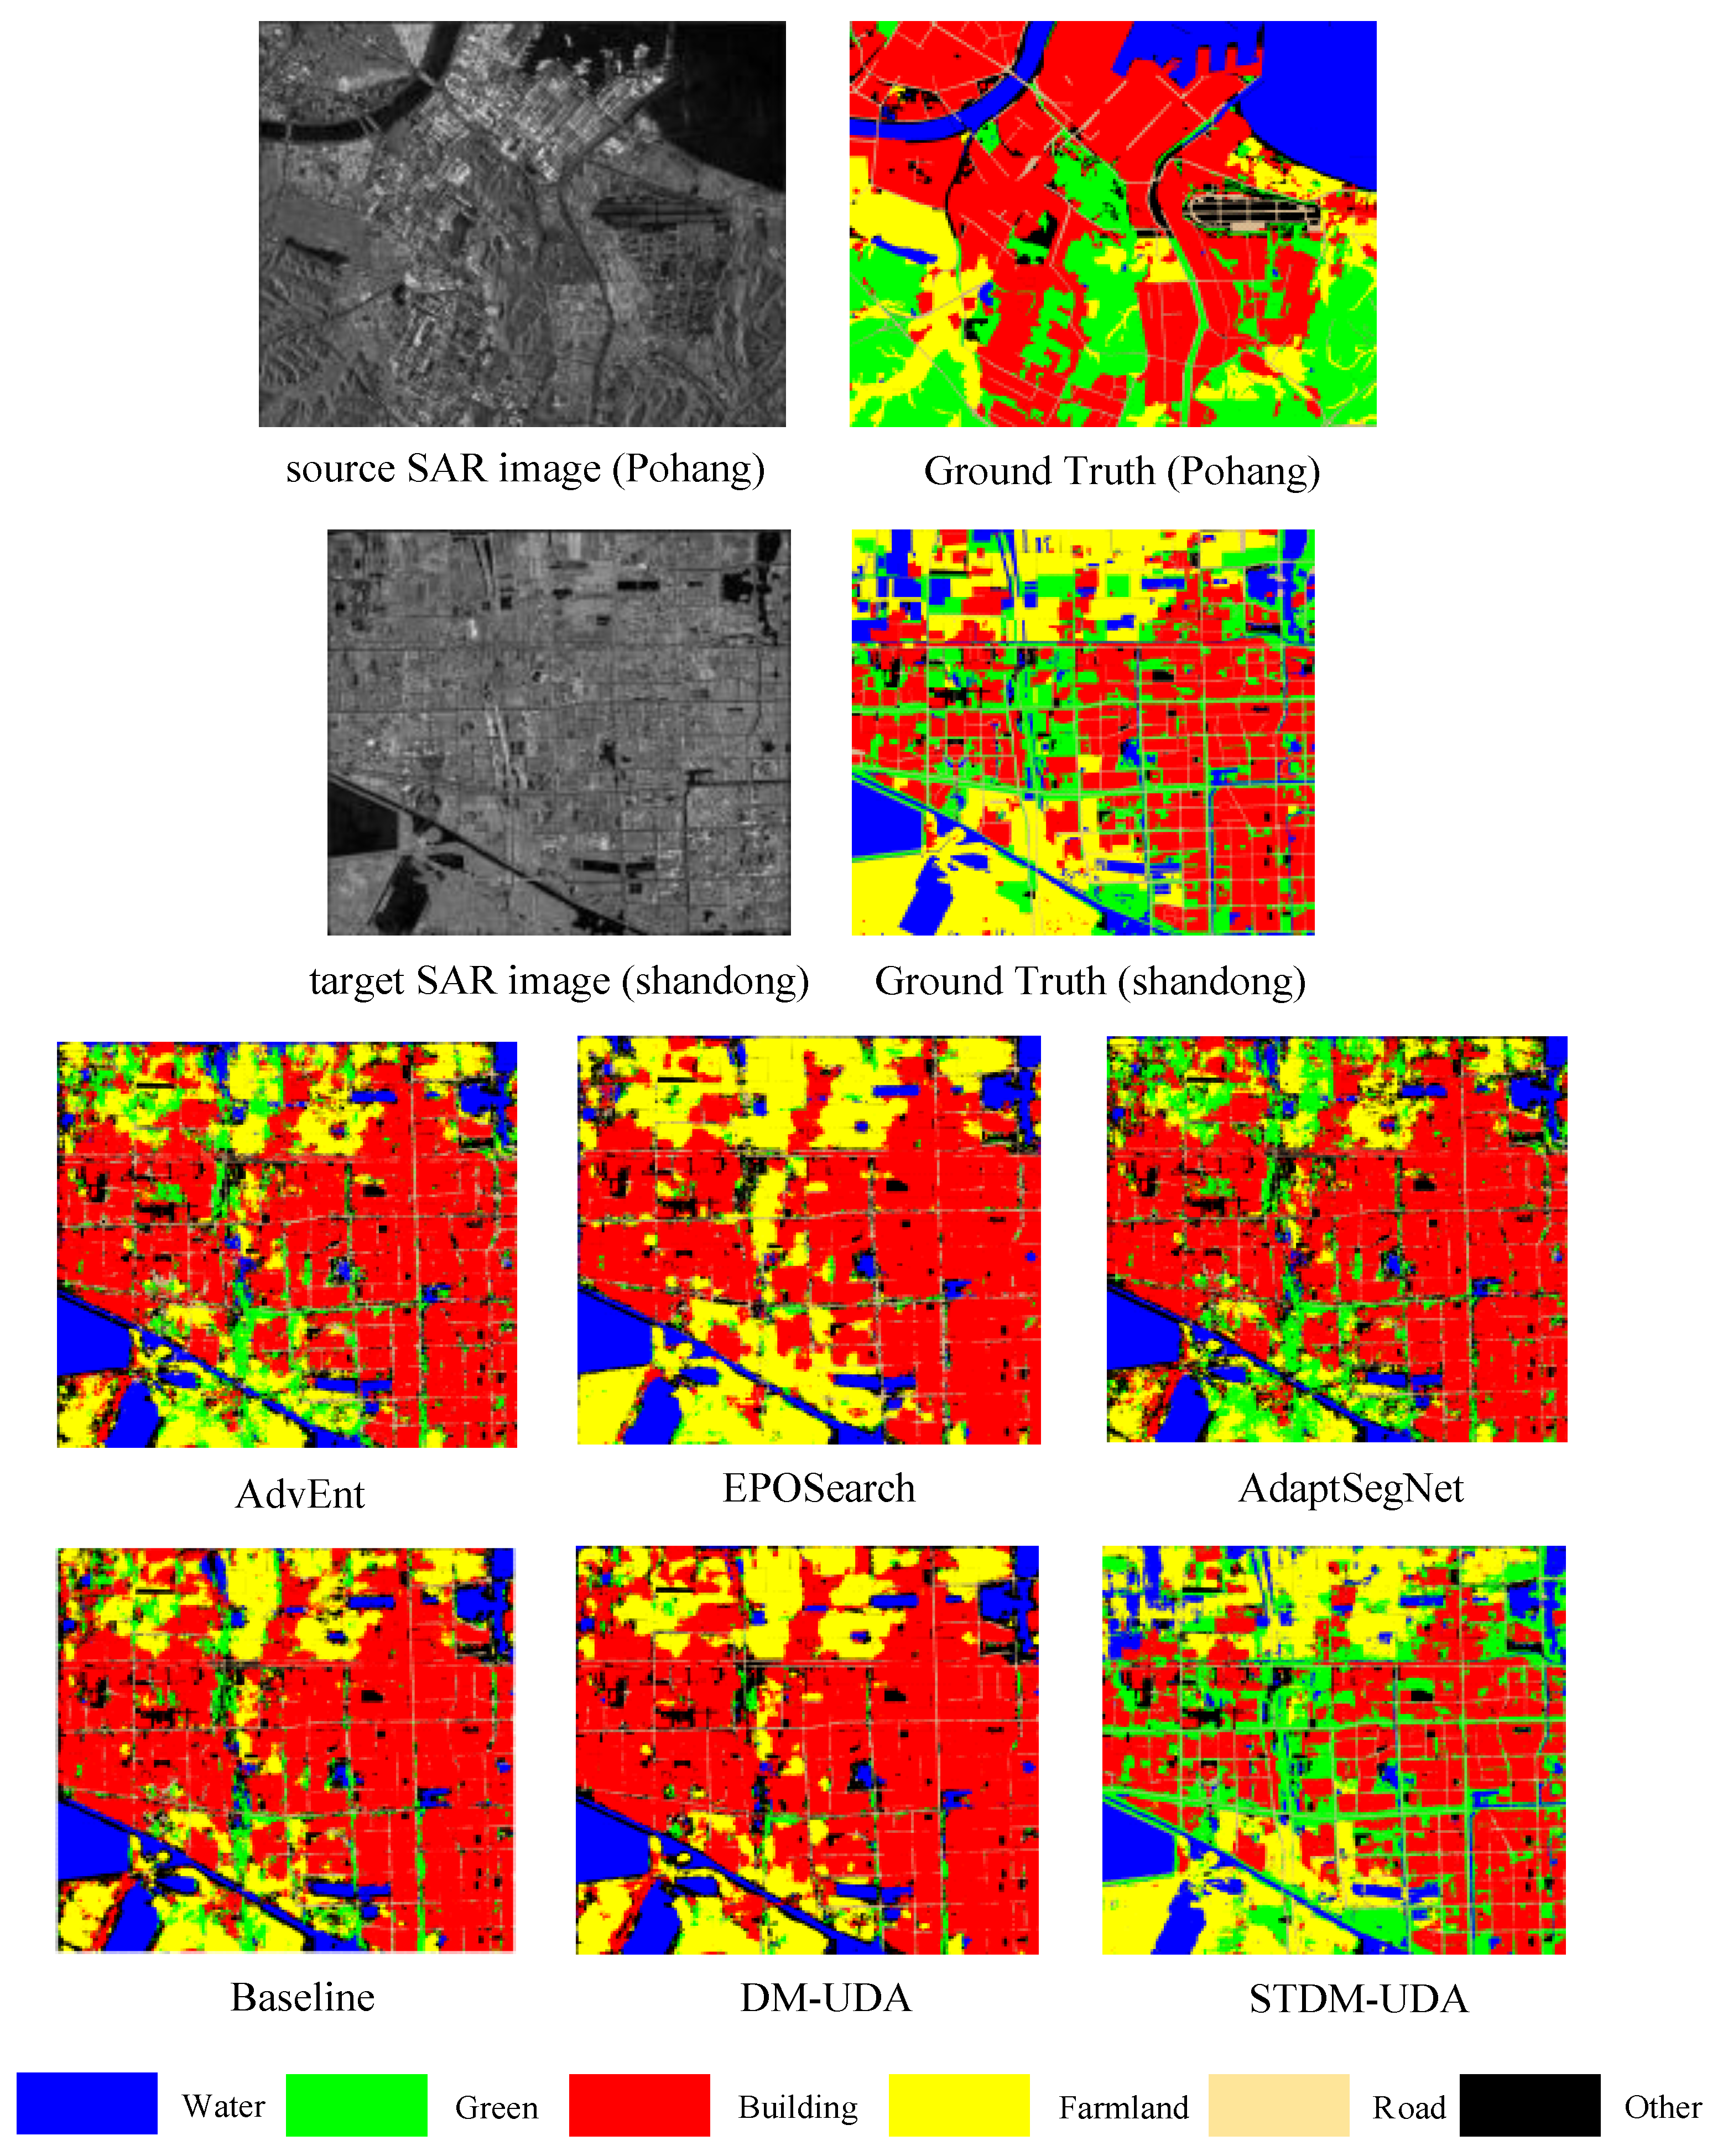
4.4.1. Comparison Results on Shandong

The Pohang dataset exhibits a well-defined concentration of ground-category regions, with distinct class boundaries and relatively straightforward classification challenges. Conversely, the Shandong dataset showcases a more dispersed and intertwined regional distribution of terrain categories, leading to intricate classification complexities. Consequently, for this group, we designated the Pohang dataset as the source domain and the Shandong dataset as the target domain to increase the challenge to all models. Figure 5 shows the visualization results of multiple comparison methods on the Pohang → Shandong data. It can be seen that EPOSearch, Baseline, and DM-UDA are hardly able to identify green regions effectively. The AdaptSegNet and AdvEnt, although they improve the ability of green in homogeneous regions, still do not effectively identify green regions intermixed with buildings. Compared to other methods, STDM-UDA has fewer misclassified isolated pixel points and has better recognition of the remaining terrain categories except for water.
Table 3 compares the accuracy rate P and four overall evaluation indicators of each classification method on the Pohang → Shandong data. These indicators of SMDM-UDA are higher than other methods except that the P of the water category is slightly lower than that of the Baseline. This is due to less degradation in precision caused by the high recall of the model to the water regions. In addition, STDM-UDA has at least a 20% performance improvement over Baseline in four overall metrics. It even has a nearly 30% improvement in M I o U . This becomes achievable due to the inclusion of a two-step independent domain adaptive network within STDM-UDA. This network facilitates the alignment of source domain information with the target domain across multiple-level features.

4.4.2. Comparison Results on Rosenheim

It is consistent with the previous set of source domain and target domain setting principles. In the PoDelta data, the regional distribution of ground categories is concentrated. We set the PoDelta data as the source domain and the Rosenheim data as the target domain. Figure 6 shows the visualization results of multiple comparison methods on the PoDelta → Rosenheim data. AdaptSegNet, AdvEnt, and Baseline methods have good classification performance in forest regions, but poor classification ability in building regions. While EPOSearch, DM-UDA, and STDM-UDA have better identification in building regions, they lack identification in forests.
Table 4 compares the accuracy rate P and four overall evaluation indicators of each classification method on the PoDelta → Rosenheim data. Baseline has the best classification performance on regions of water and farmland. The STDM-UDA and DM-UDA have strong discriminative abilities in forest and building regions. In addition, compared with other networks, STDM-UDA has about 2% improvement in O A , K a p p a , and F W I o U , and is on par with EPOSearch in M I o u .

4.4.3. Comparison Results on JiuJiang

The PoDelta data are still used as the source domain, and the target domain are JiuJiang data. Figure 7 shows the visualization results of multiple comparison methods on the PoDelta → JiuJiang data. The classification performance of AdaptSegNet and AdvEnt on buildings and water is relatively poor. Compared with AdaptSegNet and AdvEnt, DM-UDA improves the classification performance of water regions, but still cannot effectively identify forest regions. EPOSearch, Baseline, and STDM-UDA are relatively close and better in visualization results.
Table 5 compares the accuracy rate P and four overall evaluation indicators of each classification method on the PoDelta → JiuJiang data. Compared with EPOSearch, AdaptSegNet, and AdvEnt, Baseline and DM-UDA have a small improvement in O A , K a p p a , and F W I o u , while the STDM-UDA has a 7% improvement. This demonstrates that a two-step domain adaptive framework facilitates SAR image terrain classification. But there is a large gap between the M I o u of STDM-UDA and EPOSearch. This may be caused by misclassification of forest regions with a small proportion of pixels.

5. Discussion

In this section, the terrain classification results are critically analyzed and discussed in order to place them in a broader context.
STDM-UDA comprises two distinct components. The style transfer network considers only the coherence of low-level statistical data across images from both the source and target domains, allowing for flexible selection of domains. Nevertheless, domain adaptive segmentation networks must not only reconcile domain disparities in the semantic feature space of an image but also accomplish image feature classification, thereby restricting the choice of both source and target domains. As depicted in the ground truth of PoDelta in Figure 6, there is a notable scarcity of forest and buildings compared to water and farmland in this scene. When utilizing PoDelta as the source domain, the qualitative classification outcomes of Rosenheim and JiuJiang indicate that the substantial imbalance in data categories within the source domain significantly diminishes the model’s capability to discern the boundaries of these sparse terrains in the target domain. Conversely, with the Pohang source data, characterized by a more equitable terrain distribution, STDM-UDA exhibits a marked advantage in both qualitative and quantitative classification evaluations. The analyses above demonstrate that STDM-UDA effectively transfers terrain information from source domains featuring balanced terrain distributions, while still retaining a certain sparse terrain recognition capability on an unbalanced source.
Moreover, the efficacy of style transfer and domain metrics in STDM-UDA is showcased through both qualitative and quantitative terrain classification across the above three experimental scenes in Section 4.4. The findings reveal that features extracted by the model solely in feature space under single-step DA are inevitably influenced by low-level statistical disparities among image domains, diminishing the model’s capability to discern distinct terrain edges. Introducing domain metrics atop this framework can enhance the model’s edge perception ability, yet it may diminish the feature disparities between rare and other terrains. STDM-UDA incorporates a style transfer and extends single-step DA into multi-step DA. This approach enhances the resemblance between SAR images from source and target domains in image space, thus mitigating low-level feature interference and yielding superior classification performance across the experiment’s entire dataset. This indicates that aligning domain differences in both image space and feature space plays a crucial role in the effectiveness of STDM-UDA for terrain classification tasks.

6. Conclusions

In this paper, a multi-step unsupervised domain adaptive framework called STDM-UDA is proposed. STDM-UDA transfers the labeling information of SAR images into the source domain and implements terrain classification on the unlabeled target domain to reduce the dependence on labeled samples and improve model generalization. First, the source domain image undergoes a style transformation via a network to produce a translated source domain with the target domain’s style, thus minimizing domain gaps in image space. Then, an adaptive segmentation network extracts image features while simultaneously aligning domain differences in feature space and facilitating terrain classification. Additionally, domain metrics are integrated to offer supplementary feature distribution information to the model. Experiments conducted across three SAR scenes showcase the efficacy of STDM-UDA’s learning and classification regarding domain disparities induced by various imaging parameters under examination. The findings further indicate that STDM-UDA exhibits enhanced capabilities in feature learning and migration, particularly on source domain data characterized by balanced terrain classes. Furthermore, the ablation analysis of STDM-UDA reveals the terrain classification task’s greater sensitivity to spatial domain disparities in images over those in feature space. In other words, the efficacy of the classification is significantly influenced by the quality of the style transfer network. This underscores the imperative and effectiveness of concurrently constraining differences between image and feature space domains.
In the future, we aim to address the bias stemming from the source domain’s terrain distribution, thereby enhancing the adaptability of our proposed method across a broader spectrum of source domain data. Furthermore, integrating multimodal data can offer a more comprehensive and complementary terrain perspective. Hence, our future work will try to explore the use of multimodal data semantic information to improve SAR terrain classification method.

Author Contributions

Conceptualization, Z.R. and Y.Z.; Data curation, W.L. and F.S.; Formal analysis, Z.R. and Z.D.; Investigation, Z.R. and Y.Z.; Methodology, Z.D. and Y.Z.; Project administration, B.H.; Resources, B.H. and W.L.; Software, Y.Z.; Validation, Z.R., Z.D. and Y.Z.; Writing—original draft, Z.D.; Writing—review and editing, Z.R. All authors have read and agreed to the published version of the manuscript.

Funding

This work was supported in part by the National Natural Science Foundation of China under Grant 62101405, 62171347, 62371373, and 62271377. Research project of Shaanxi Coalfield Geological Group Co., Ltd. SMDZ-2023CX-14. Shaanxi Province Water Conservancy Science and Technology announces the list, leading the breakthrough project LKJ2024-06. Key scientific research projects linked by Shaanxi Provincial Department and Municipal Government 2022GD-TSLD-61-3.

Data Availability Statement

The data presented in this study are not publicly available due to privacy restrictions. Some or all data, models, or codes generated or used during the study are available from the corresponding author upon request ([email protected]).

Conflicts of Interest

The authors declare no conflicts of interest.

References

  1. Song, Y.; Li, J.; Gao, P.; Li, L.; Tian, T.; Tian, J. Two-Stage Cross-Modality Transfer Learning Method for Military-Civilian SAR Ship Recognition. IEEE Geosci. Remote Sens. Lett. 2022, 19, 1–5. [Google Scholar] [CrossRef]
  2. Knuth, R.; Thiel, C.; Thiel, C.; Eckardt, R.; Richter, N.; Schmullius, C. Multisensor SAR analysis for forest monitoring in boreal and tropical forest environments. In Proceedings of the 2009 IEEE International Geoscience and Remote Sensing Symposium, Cape Town, South Africa, 12–17 July 2009; Volume 5, pp. V-126–V-129. [Google Scholar] [CrossRef]
  3. Satake, M.; Kobayashi, T.; Uemoto, J.; Umehara, T.; Kojima, S.; Matsuoka, T.; Nadai, A.; Uratsuka, S. Damage estimation of the Great East Japan earthquake with airborne SAR (PI-SAR2) data. In Proceedings of the 2012 IEEE International Geoscience and Remote Sensing Symposium, Munich, Germany, 22–27 July 2012; pp. 1190–1191. [Google Scholar] [CrossRef]
  4. Li, X.M.; Sun, Y.; Zhang, Q. Extraction of Sea Ice Cover by Sentinel-1 SAR Based on Support Vector Machine With Unsupervised Generation of Training Data. IEEE Trans. Geosci. Remote Sens. 2021, 59, 3040–3053. [Google Scholar] [CrossRef]
  5. Song, H.; Huang, B.; Zhang, K. A Globally Statistical Active Contour Model for Segmentation of Oil Slick in SAR Imagery. IEEE J. Sel. Top. Appl. Earth Obs. Remote Sens. 2013, 6, 2402–2409. [Google Scholar] [CrossRef]
  6. Esch, T.; Schenk, A.; Ullmann, T.; Thiel, M.; Roth, A.; Dech, S. Characterization of Land Cover Types in TerraSAR-X Images by Combined Analysis of Speckle Statistics and Intensity Information. IEEE Trans. Geosci. Remote Sens. 2011, 49, 1911–1925. [Google Scholar] [CrossRef]
  7. Satalino, G.; Panciera, R.; Balenzano, A.; Mattia, F.; Walker, J. COSMO-SkyMed multi-temporal data for land cover classification and soil moisture retrieval over an agricultural site in Southern Australia. In Proceedings of the 2012 IEEE International Geoscience and Remote Sensing Symposium, Munich, Germany, 22–27 July 2012; pp. 5701–5704. [Google Scholar] [CrossRef]
  8. Gamba, P.; Aldrighi, M. SAR Data Classification of Urban Areas by Means of Segmentation Techniques and Ancillary Optical Data. IEEE J. Sel. Top. Appl. Earth Obs. Remote Sens. 2012, 5, 1140–1148. [Google Scholar] [CrossRef]
  9. Ampe, E.M.; Vanhamel, I.; Salvadore, E.; Dams, J.; Bashir, I.; Demarchi, L.; Chan, J.C.W.; Sahli, H.; Canters, F.; Batelaan, O. Impact of Urban Land-Cover Classification on Groundwater Recharge Uncertainty. IEEE J. Sel. Top. Appl. Earth Obs. Remote Sens. 2012, 5, 1859–1867. [Google Scholar] [CrossRef]
  10. Zhu, X.X.; Montazeri, S.; Ali, M.; Hua, Y.; Wang, Y.; Mou, L.; Shi, Y.; Xu, F.; Bamler, R. Deep learning meets SAR: Concepts, models, pitfalls, and perspectives. IEEE Geosci. Remote Sens. Mag. 2021, 9, 143–172. [Google Scholar] [CrossRef]
  11. Lin, T.Y.; Dollar, P.; Girshick, R.; He, K.; Hariharan, B.; Belongie, S. Feature Pyramid Networks for Object Detection. In Proceedings of the IEEE Conference on Computer Vision and Pattern Recognition (CVPR), Honolulu, HI, USA, 21–26 July 2017. [Google Scholar]
  12. Dosovitskiy, A.; Beyer, L.; Kolesnikov, A.; Weissenborn, D.; Zhai, X.; Unterthiner, T.; Dehghani, M.; Minderer, M.; Heigold, G.; Gelly, S.; et al. An image is worth 16×16 words: Transformers for image recognition at scale. arXiv 2020, arXiv:2010.11929. [Google Scholar]
  13. Sun, Z.; Li, J.; Liu, P.; Cao, W.; Yu, T.; Gu, X. SAR Image Classification Using Greedy Hierarchical Learning With Unsupervised Stacked CAEs. IEEE Trans. Geosci. Remote Sens. 2021, 59, 5721–5739. [Google Scholar] [CrossRef]
  14. Geng, J.; Jiang, W.; Deng, X. Multi-scale deep feature learning network with bilateral filtering for SAR image classification. ISPRS J. Photogramm. Remote Sens. 2020, 167, 201–213. [Google Scholar] [CrossRef]
  15. Wang, C.; Gu, H.; Su, W. SAR Image Classification Using Contrastive Learning and Pseudo-Labels With Limited Data. IEEE Geosci. Remote Sens. Lett. 2022, 19, 1–5. [Google Scholar] [CrossRef]
  16. Shermeyer, J.; Hogan, D.; Brown, J.; Van Etten, A.; Weir, N.; Pacifici, F.; Hansch, R.; Bastidas, A.; Soenen, S.; Bacastow, T.; et al. SpaceNet 6: Multi-sensor all weather mapping dataset. In Proceedings of the IEEE/CVF Conference on Computer Vision and Pattern Recognition Workshops, Seattle, WA, USA, 14–19 June 2020; pp. 196–197. [Google Scholar]
  17. Li, Y.; Yuan, L.; Vasconcelos, N. Bidirectional Learning for Domain Adaptation of Semantic Segmentation. In Proceedings of the IEEE/CVF Conference on Computer Vision and Pattern Recognition (CVPR), Long Beach, CA, USA, 15–20 June 2019. [Google Scholar]
  18. Zhang, A.; Yang, X.; Fang, S.; Ai, J. Region level SAR image classification using deep features and spatial constraints. ISPRS J. Photogramm. Remote Sens. 2020, 163, 36–48. [Google Scholar] [CrossRef]
  19. Li, Y.; Li, X.; Sun, Q.; Dong, Q. SAR Image Classification Using CNN Embeddings and Metric Learning. IEEE Geosci. Remote Sens. Lett. 2022, 19, 1–5. [Google Scholar] [CrossRef]
  20. Geng, J.; Wang, H.; Fan, J.; Ma, X. SAR Image Classification via Deep Recurrent Encoding Neural Networks. IEEE Trans. Geosci. Remote Sens. 2018, 56, 2255–2269. [Google Scholar] [CrossRef]
  21. Zhang, Z.; Yang, J.; Du, Y. Deep Convolutional Generative Adversarial Network With Autoencoder for Semisupervised SAR Image Classification. IEEE Geosci. Remote Sens. Lett. 2022, 19, 1–5. [Google Scholar] [CrossRef]
  22. Chatterjee, A.; Saha, J.; Mukherjee, J.; Aikat, S.; Misra, A. Unsupervised Land Cover Classification of Hybrid and Dual-Polarized Images Using Deep Convolutional Neural Network. IEEE Geosci. Remote Sens. Lett. 2021, 18, 969–973. [Google Scholar] [CrossRef]
  23. Zhang, P.; Jiang, Y.; Li, B.; Li, M.; Yazid Boudaren, M.E.; Song, W.; Wu, Y. High-Order Triplet CRF-Pcanet for Unsupervised Segmentation of SAR Image. In Proceedings of the IGARSS 2020–2020 IEEE International Geoscience and Remote Sensing Symposium, Waikoloa, HI, USA, 17 February 2020; pp. 1460–1463. [Google Scholar] [CrossRef]
  24. Zuo, Y.; Guo, J.; Zhang, Y.; Lei, B.; Hu, Y.; Wang, M. A deep vector quantization clustering method for polarimetric SAR images. Remote Sens. 2021, 13, 2127. [Google Scholar] [CrossRef]
  25. Zuo, Y.; Guo, J.; Zhang, Y.; Hu, Y.; Lei, B.; Qiu, X.; Ding, C. Winner Takes All: A Superpixel Aided Voting Algorithm for Training Unsupervised PolSAR CNN Classifiers. IEEE Trans. Geosci. Remote Sens. 2022, 60, 1–19. [Google Scholar] [CrossRef]
  26. He, K.; Chen, X.; Xie, S.; Li, Y.; Dollár, P.; Girshick, R. Masked Autoencoders Are Scalable Vision Learners. In Proceedings of the IEEE/CVF Conference on Computer Vision and Pattern Recognition (CVPR), New Orleans, LA, USA, 18–24 June 2022; pp. 16000–16009. [Google Scholar]
  27. Wang, H.; Xing, C.; Yin, J.; Yang, J. Land Cover Classification for Polarimetric SAR Images Based on Vision Transformer. Remote Sens. 2022, 14, 4656. [Google Scholar] [CrossRef]
  28. Sun, X.; Wang, P.; Lu, W.; Zhu, Z.; Lu, X.; He, Q.; Li, J.; Rong, X.; Yang, Z.; Chang, H.; et al. RingMo: A Remote Sensing Foundation Model with Masked Image Modeling. IEEE Trans. Geosci. Remote. Sens. 2023, 61, 1–23. [Google Scholar] [CrossRef]
  29. Tzeng, E.; Hoffman, J.; Darrell, T.; Saenko, K. Simultaneous Deep Transfer Across Domains and Tasks. In Proceedings of the IEEE International Conference on Computer Vision (ICCV), Santiago, Chile, 7–13 December 2015. [Google Scholar]
  30. Bousmalis, K.; Silberman, N.; Dohan, D.; Erhan, D.; Krishnan, D. Unsupervised Pixel-Level Domain Adaptation With Generative Adversarial Networks. In Proceedings of the IEEE Conference on Computer Vision and Pattern Recognition (CVPR), Honolulu, HI, USA, 21–26 July 2017. [Google Scholar]
  31. Zhao, S.; Zhang, Z.; Zhang, T.; Guo, W.; Luo, Y. Transferable SAR Image Classification Crossing Different Satellites Under Open Set Condition. IEEE Geosci. Remote Sens. Lett. 2022, 19, 1–5. [Google Scholar] [CrossRef]
  32. Tzeng, E.; Hoffman, J.; Zhang, N.; Saenko, K.; Darrell, T. Deep domain confusion: Maximizing for domain invariance. arXiv 2014, arXiv:1412.3474. [Google Scholar]
  33. Long, M.; Cao, Y.; Wang, J.; Jordan, M. Learning Transferable Features with Deep Adaptation Networks. Proc. Mach. Learn. Res. 2015, 37, 97–105. [Google Scholar]
  34. Geng, J.; Deng, X.; Ma, X.; Jiang, W. Transfer Learning for SAR Image Classification Via Deep Joint Distribution Adaptation Networks. IEEE Trans. Geosci. Remote Sens. 2020, 58, 5377–5392. [Google Scholar] [CrossRef]
  35. Rostami, M.; Kolouri, S.; Eaton, E.; Kim, K. Deep transfer learning for few-shot SAR image classification. Remote Sens. 2019, 11, 1374. [Google Scholar] [CrossRef]
  36. Kim, J.; Shin, S.; Kim, S.; Kim, Y. EO-Augmented Building Segmentation for Airborne SAR Imagery. IEEE Geosci. Remote Sens. Lett. 2022, 19, 1–5. [Google Scholar] [CrossRef]
  37. Huang, Z.; Dumitru, C.O.; Pan, Z.; Lei, B.; Datcu, M. Classification of Large-Scale High-Resolution SAR Images With Deep Transfer Learning. IEEE Geosci. Remote Sens. Lett. 2021, 18, 107–111. [Google Scholar] [CrossRef]
  38. Zhu, J.Y.; Park, T.; Isola, P.; Efros, A.A. Unpaired Image-To-Image Translation Using Cycle-Consistent Adversarial Networks. In Proceedings of the IEEE International Conference on Computer Vision (ICCV), Venice, Italy, 22–29 October 2017. [Google Scholar]
  39. Zhang, M.; Li, W.; Tao, R.; Wang, S. Transfer Learning for Optical and SAR Data Correspondence Identification With Limited Training Labels. IEEE J. Sel. Top. Appl. Earth Obs. Remote Sens. 2021, 14, 1545–1557. [Google Scholar] [CrossRef]
  40. Goodfellow, I.; Pouget-Abadie, J.; Mirza, M.; Xu, B.; Warde-Farley, D.; Ozair, S.; Courville, A.; Bengio, Y. Generative adversarial networks. Commun. ACM 2020, 63, 139–144. [Google Scholar] [CrossRef]
  41. Chen, L.C.; Papandreou, G.; Kokkinos, I.; Murphy, K.; Yuille, A.L. DeepLab: Semantic Image Segmentation with Deep Convolutional Nets, Atrous Convolution, and Fully Connected CRFs. IEEE Trans. Pattern Anal. Mach. Intell. 2018, 40, 834–848. [Google Scholar] [CrossRef]
  42. Wang, Z.; Bovik, A.; Sheikh, H.; Simoncelli, E. Image quality assessment: From error visibility to structural similarity. IEEE Trans. Image Process. 2004, 13, 600–612. [Google Scholar] [CrossRef] [PubMed]
  43. He, K.; Zhang, X.; Ren, S.; Sun, J. Deep Residual Learning for Image Recognition. In Proceedings of the IEEE Conference on Computer Vision and Pattern Recognition (CVPR), Las Vegas, NE, USA, 27–30 June 2016. [Google Scholar]
  44. Ren, Z.; Hou, B.; Wu, Q.; Wen, Z.; Jiao, L. A distribution and structure match generative adversarial network for SAR image classification. IEEE Trans. Geosci. Remote Sens. 2020, 58, 3864–3880. [Google Scholar] [CrossRef]
  45. Yang, M.; Jiao, L.; Liu, F.; Hou, B.; Yang, S.; Zhang, Y.; Wang, J. Coarse-to-fine contrastive self-supervised feature learning for land-cover classification in SAR images with limited labeled data. IEEE Trans. Image Process. 2022, 31, 6502–6516. [Google Scholar] [CrossRef] [PubMed]
  46. Tsai, Y.H.; Hung, W.C.; Schulter, S.; Sohn, K.; Yang, M.H.; Chandraker, M. Learning to Adapt Structured Output Space for Semantic Segmentation. In Proceedings of the IEEE Conference on Computer Vision and Pattern Recognition (CVPR), Salt Lake City, UT, USA, 18–23 June 2018. [Google Scholar]
  47. Vu, T.H.; Jain, H.; Bucher, M.; Cord, M.; Perez, P. ADVENT: Adversarial Entropy Minimization for Domain Adaptation in Semantic Segmentation. In Proceedings of the IEEE/CVF Conference on Computer Vision and Pattern Recognition (CVPR), Long Beach, CA, USA, 15–20 June 2019. [Google Scholar]
  48. Mahapatra, D.; Rajan, V. Multi-Task Learning with User Preferences: Gradient Descent with Controlled Ascent in Pareto Optimization. Proc. Mach. Learn. Res. 2020, 119, 6597–6607. [Google Scholar]
Figure 1. SAR images under different radar imaging parameters: (a) 1 m resolution, (b) 3 m resolution, (c) 25 m resolution, (d) HH polarization, (e) VV polarization.
Remotesensing 16 01901 g001
Figure 2. The framework of STMD-UDA. STMD-UDA consists of two independent training processes, marked by red and blue, respectively.
Remotesensing 16 01901 g002
Figure 3. (a) Direct sampling. (b) Dilated sampling. The red region in the dilated sampling is the dilated region for which predictions are discarded during the test phase. The blue boxes are reserved predicted results.
Remotesensing 16 01901 g003
Figure 4. The framework of image-to-image translation network.
Remotesensing 16 01901 g004
Figure 5. Visual classification results of various methods on Shandong.
Remotesensing 16 01901 g005
Figure 6. Visual classification results of various methods on Rosenheim.
Remotesensing 16 01901 g006
Figure 7. Visual classification results of various methods on JiuJiang.
Remotesensing 16 01901 g007
Table 1. Details of the experimental SAR data.
AreaImaging TimeSourceImage SizesResolutionBandPolarizationS1S2
PoDelta27 September 2007Cosmo-SkyMed18,308 × 16,7162.5 mXHH11203074
Rosenheim27 January 2008TerraSAR-X7691 × 72241.75 mXHH210552
JiuJiang24 November 2016GF-38000 × 80003 mCDV224625
Shandong16 April 2017GF-310,240 × 92161 mCVV360928
Pohang13 July 2018GF-39728 × 76801 mCHH285744
S1: Number of samples without dilate sampling. S2: Number of samples with dilate sampling.
Table 2. Discriminator D network architecture.
LayersInput → Output ShapeLayer Information
1 ( w , h , c ) ( w 2 , h 2 , 64 ) CONV-(N64, K4 × 4, S2, P1), LeakyReLU (0.2)
2 ( w 2 , h 2 , 64 ) ( w 4 , h 4 , 128 ) CONV-(N128, K4 × 4, S2, P1), LeakyReLU (0.2)
3 ( w 4 , h 4 , 128 ) ( w 8 , h 8 , 256 ) CONV-(N256, K4 × 4, S2, P1), LeakyReLU (0.2)
4 ( w 8 , h 8 , 256 ) ( w 16 , h 16 , 512 ) CONV-(N512, K4 × 4, S2, P1), LeakyReLU (0.2)
5 ( w 16 , h 16 , 512 ) ( w 32 , h 32 , 1 ) CONV-(N1, K4 × 4, S2, P1)
Table 3. Classification results on Shandong (%).
MethodPrecisionOAKappaMIoUFWIoU
WaterGreenBuildingFarmlandRoad
AdaptSegNet90.330.967.867.344.755.440.436.641.6
AdvEnt85.035.469.166.837.257.643.633.643.4
EPOSearch88.041.070.163.849.363.450.341.246.7
Baseline92.035.364.071.656.558.944.334.143.5
DM-UDA90.040.262.171.060.460.645.939.743.6
STDM-UDA89.764.388.582.574.280.073.263.468.0
The bold in a number indicates that it is the highest value in the column.
Table 4. Classification results on Rosenheim (%).
MethodPrecisionOAKappaMIoUFWIoU
WaterForestBuildingFarmland
AdaptSegNet81.680.557.179.466.951.451.351.5
AdvEnt61.294.868.971.066.351.551.353.0
EPOSearch94.484.070.672.666.650.252.352.2
Baseline99.161.858.585.766.852.150.752.6
DM-UDA88.096.077.571.867.551.250.653.6
STDM-UDA86.694.778.671.969.053.152.355.0
The bold in a number indicates that it is the highest value in the column.
Table 5. Classification results on JiuJiang (%).
MethodPrecisionOAKappaMIoUFWIoU
WaterForestBuildingFarmland
AdaptSegNet86.589.198.385.565.050.845.759.0
AdvEnt88.289.497.784.466.753.348.260.8
EPOSearch99.387.793.979.676.666.763.770.2
Baseline98.491.298.984.677.767.760.473.3
DM-UDA99.299.698.876.379.969.855.772.6
STDM-UDA97.896.696.989.783.775.950.479.9
The bold in a number indicates that it is the highest value in the column.
Disclaimer/Publisher’s Note: The statements, opinions and data contained in all publications are solely those of the individual author(s) and contributor(s) and not of MDPI and/or the editor(s). MDPI and/or the editor(s) disclaim responsibility for any injury to people or property resulting from any ideas, methods, instructions or products referred to in the content.

