Article

A Registration Method of Overlap Aware Point Clouds Based on Transformer-to-Transformer Regression

1
School of Computer Science and Engineering, Nanjing University of Science and Technology, Nanjing 210094, China
2
School of Electronic and Information Engineering, Guangxi Normal University, Guilin 541004, China
*
Author to whom correspondence should be addressed.
Remote Sens. 2024, 16(11), 1898; https://doi.org/10.3390/rs16111898
Submission received: 7 March 2024 / Revised: 22 May 2024 / Accepted: 23 May 2024 / Published: 25 May 2024

Abstract

:
Transformer has recently become widely adopted in point cloud registration. Nevertheless, Transformer is unsuitable for handling dense point clouds due to resource constraints and the sheer volume of data. We propose a method for directly regressing the rigid relative transformation of dense point cloud pairs. Specifically, we divide the dense point clouds into blocks according to the down-sampled superpoints. During training, we randomly select point cloud blocks with varying overlap ratios, and during testing, we introduce the overlap-aware Rotation-Invariant Geometric Transformer Cross-Encoder (RIG-Transformer), which predicts superpoints situated within the common area of the point cloud pairs. The dense points corresponding to the superpoints are inputted into the Transformer Cross-Encoder to estimate their correspondences. Through the fusion of our RIG-Transformer and Transformer Cross-Encoder, we propose Transformer-to-Transformer Regression (TTReg), which leverages dense point clouds from overlapping regions for both training and testing phases, calculating the relative transformation of the dense points by using the predicted correspondences without random sample consensus (RANSAC). We have evaluated our method on challenging benchmark datasets, including 3DMatch, 3DLoMatch, ModelNet, and ModelLoNet, demonstrating up to a 7.2 % improvement in registration recall. The improvements are attributed to our RIG-Transformer module and regression mechanism, which makes the features of superpoints more discriminative.

1. Introduction

Point cloud registration is a critical research area within the realms of computer vision and robotics, serving as pivotal function in diverse applications including 3D object reconstruction, scene comprehension, and robotic manipulation [1,2]. Achieving precise alignment of point clouds enables the amalgamation of data from varied sources, thereby supporting activities such as environmental modeling, object identification, and augmented reality applications. Enhancing the efficiency and precision of point cloud registration algorithms empowers researchers to elevate the performance of autonomous systems, robotic perception, and augmented reality applications, consequently driving progress across sectors spanning industrial automation to immersive virtual reality encounters.
Recently, there has been a notable increase in research within the domain of point cloud registration focusing on deep learning methodologies. These innovative strategies utilize neural networks to directly acquire descriptions from 3D points, eliminating the necessity for manual feature engineering and tackling issues like varying point density and noise. Fully Convolutional Geometric Features (FCGF) [3] is a deep learning method that seeks to extract geometric features directly from point clouds. Through the application of fully convolutional neural networks, FCGF can effectively capture both local and global geometric details, facilitating precise point cloud registration amidst noise and partial overlap. FCGCF [4] incorporates color data from point clouds into the FCGF network structure, merging geometric structural details with color features for enhanced representation. By fusing geometric and color information, the feature descriptors are enhanced in distinguishing points with high similarity in three-dimensional geometric structures. Udpreg [5] proposes a distribution consistency loss function based on a mixture of Gaussian models to supervise the network in learning its posterior distribution probabilities. It combines this approach with the Sinkhorn algorithm [6] to handle partial point cloud registration, aiding the network in extracting discriminative local features. Through unsupervised learning, UDPReg achieves label-free point cloud registration. GeoTransformer [7] introduces a method to extract global geometric features from the position coordinates of superpoints. It presents a geometric Transformer for learning global features and introduces the overlap circle loss function, treating superpoint feature learning as metric learning. By combining this approach with the Sinkhorn method, GeoTransformer achieves point cloud registration without the need for RANSAC [8]. RoITr [9] introduces a network based on the Transformer architecture utilizing channel-shared weights to leverage the global properties of Transformer. Building upon the GeoTransformer framework, it embeds geometric features from self-attention modules into cross-attention modules to achieve rotation invariance in the Transformer structure. RegTR [10] utilizes a superpoint correspondence projection function to directly constrain the features interacting with the Transformer Cross-Encoder and the voxelized superpoint coordinates. This method replaces RANSAC and directly regresses the relative transformation matrix. RORNet [11] divides point clouds into several small blocks and learns the latent features of overlapping regions within these blocks. This approach reduces the feature uncertainty caused by global contrast and subsequently selects highly confident keypoints from the overlapping regions for point cloud registration. HR-Net [12] introduces a dense point matching module to refine the matching relationships of dense points and utilizes a recursive strategy to globally match superpoints of point clouds and locally adjust dense point clouds layer by layer, thereby estimating a more accurate transformation matrix. Roreg [13] addresses the point cloud registration challenge by focusing on directional descriptors and local rotation techniques. The directional descriptors are categorized into rotational equivariance and rotational invariance components. Equivariance mandates that descriptors are invariant to transformations in the relative point positions within the point cloud, whereas invariance ensures that registration outcomes are insensitive to changes in scale, rotations, or translations of the point cloud. A local rotation approach is devised to integrate rough rotations for significant angle adjustments with precise rotations for minor angle variations, aiming to ascertain the optimal rotation amount and improve registration precision.
Combining the 3D coordinates and features of superpoints, RegTR [10] employs Transformer to directly perform global information interaction on superpoints. However, the coordinates of superpoints are sparse, and the computation on superpoints is voxelized around the centers of point cloud blocks, introducing errors in superpoint coordinates, especially for point clouds with small areas of overlap. We seek to leverage the global properties of Transformer to extract and incorporate global information from dense point clouds. Nevertheless, due to the limitations of Transformer in terms of data length and computational resources, direct processing of dense point clouds is not feasible. Through multiple experiments and data analysis, we discovered that the similarity between the neighborhoods of points outside the overlapping region and those inside the overlapping region has a significant influence on point cloud registration. Points within the overlapping region have less significance for point cloud registration due to their uniform structure. Therefore, it is crucial to select the overlapping region and features with higher discriminative power within this region to enhance the registration’s effectiveness. Drawing inspiration from previous studies [7,9,10], we segmented the point cloud registration procedure into two distinct stages. Initially, we leverage Transformer’s overarching characteristics to differentiate the overlapping and non-overlapping zones, thereby converting the point-to-point matching challenge into a classification task across these areas. Subsequently, we select representative dense keypoints within the overlapping region using a Transformer Cross-Encoder to directly regress the relative transformation.

2. Materials and Methods

2.1. Problem Setting

Our objective is to utilize dense point clouds to compute the relative rigid transformation matrix T * S E ( 3 ) between point cloud pairs P 0 R 3 × M and Q 0 R 3 × N by minimizing the Equation (1) defined as follows:
F = min T * ( p ^ j , q ^ k ) C ^ p d T * ( p ^ j ) q ^ k ) 2 ,
where C ^ p d = ( p ^ j , q ^ k ) p ^ j p d Q , q ^ k q d Q } , which is the set of predicted dense correspondences; ( p ^ j , q ^ k ) is a pair of correspondence; and · 2 is L 2 norm.

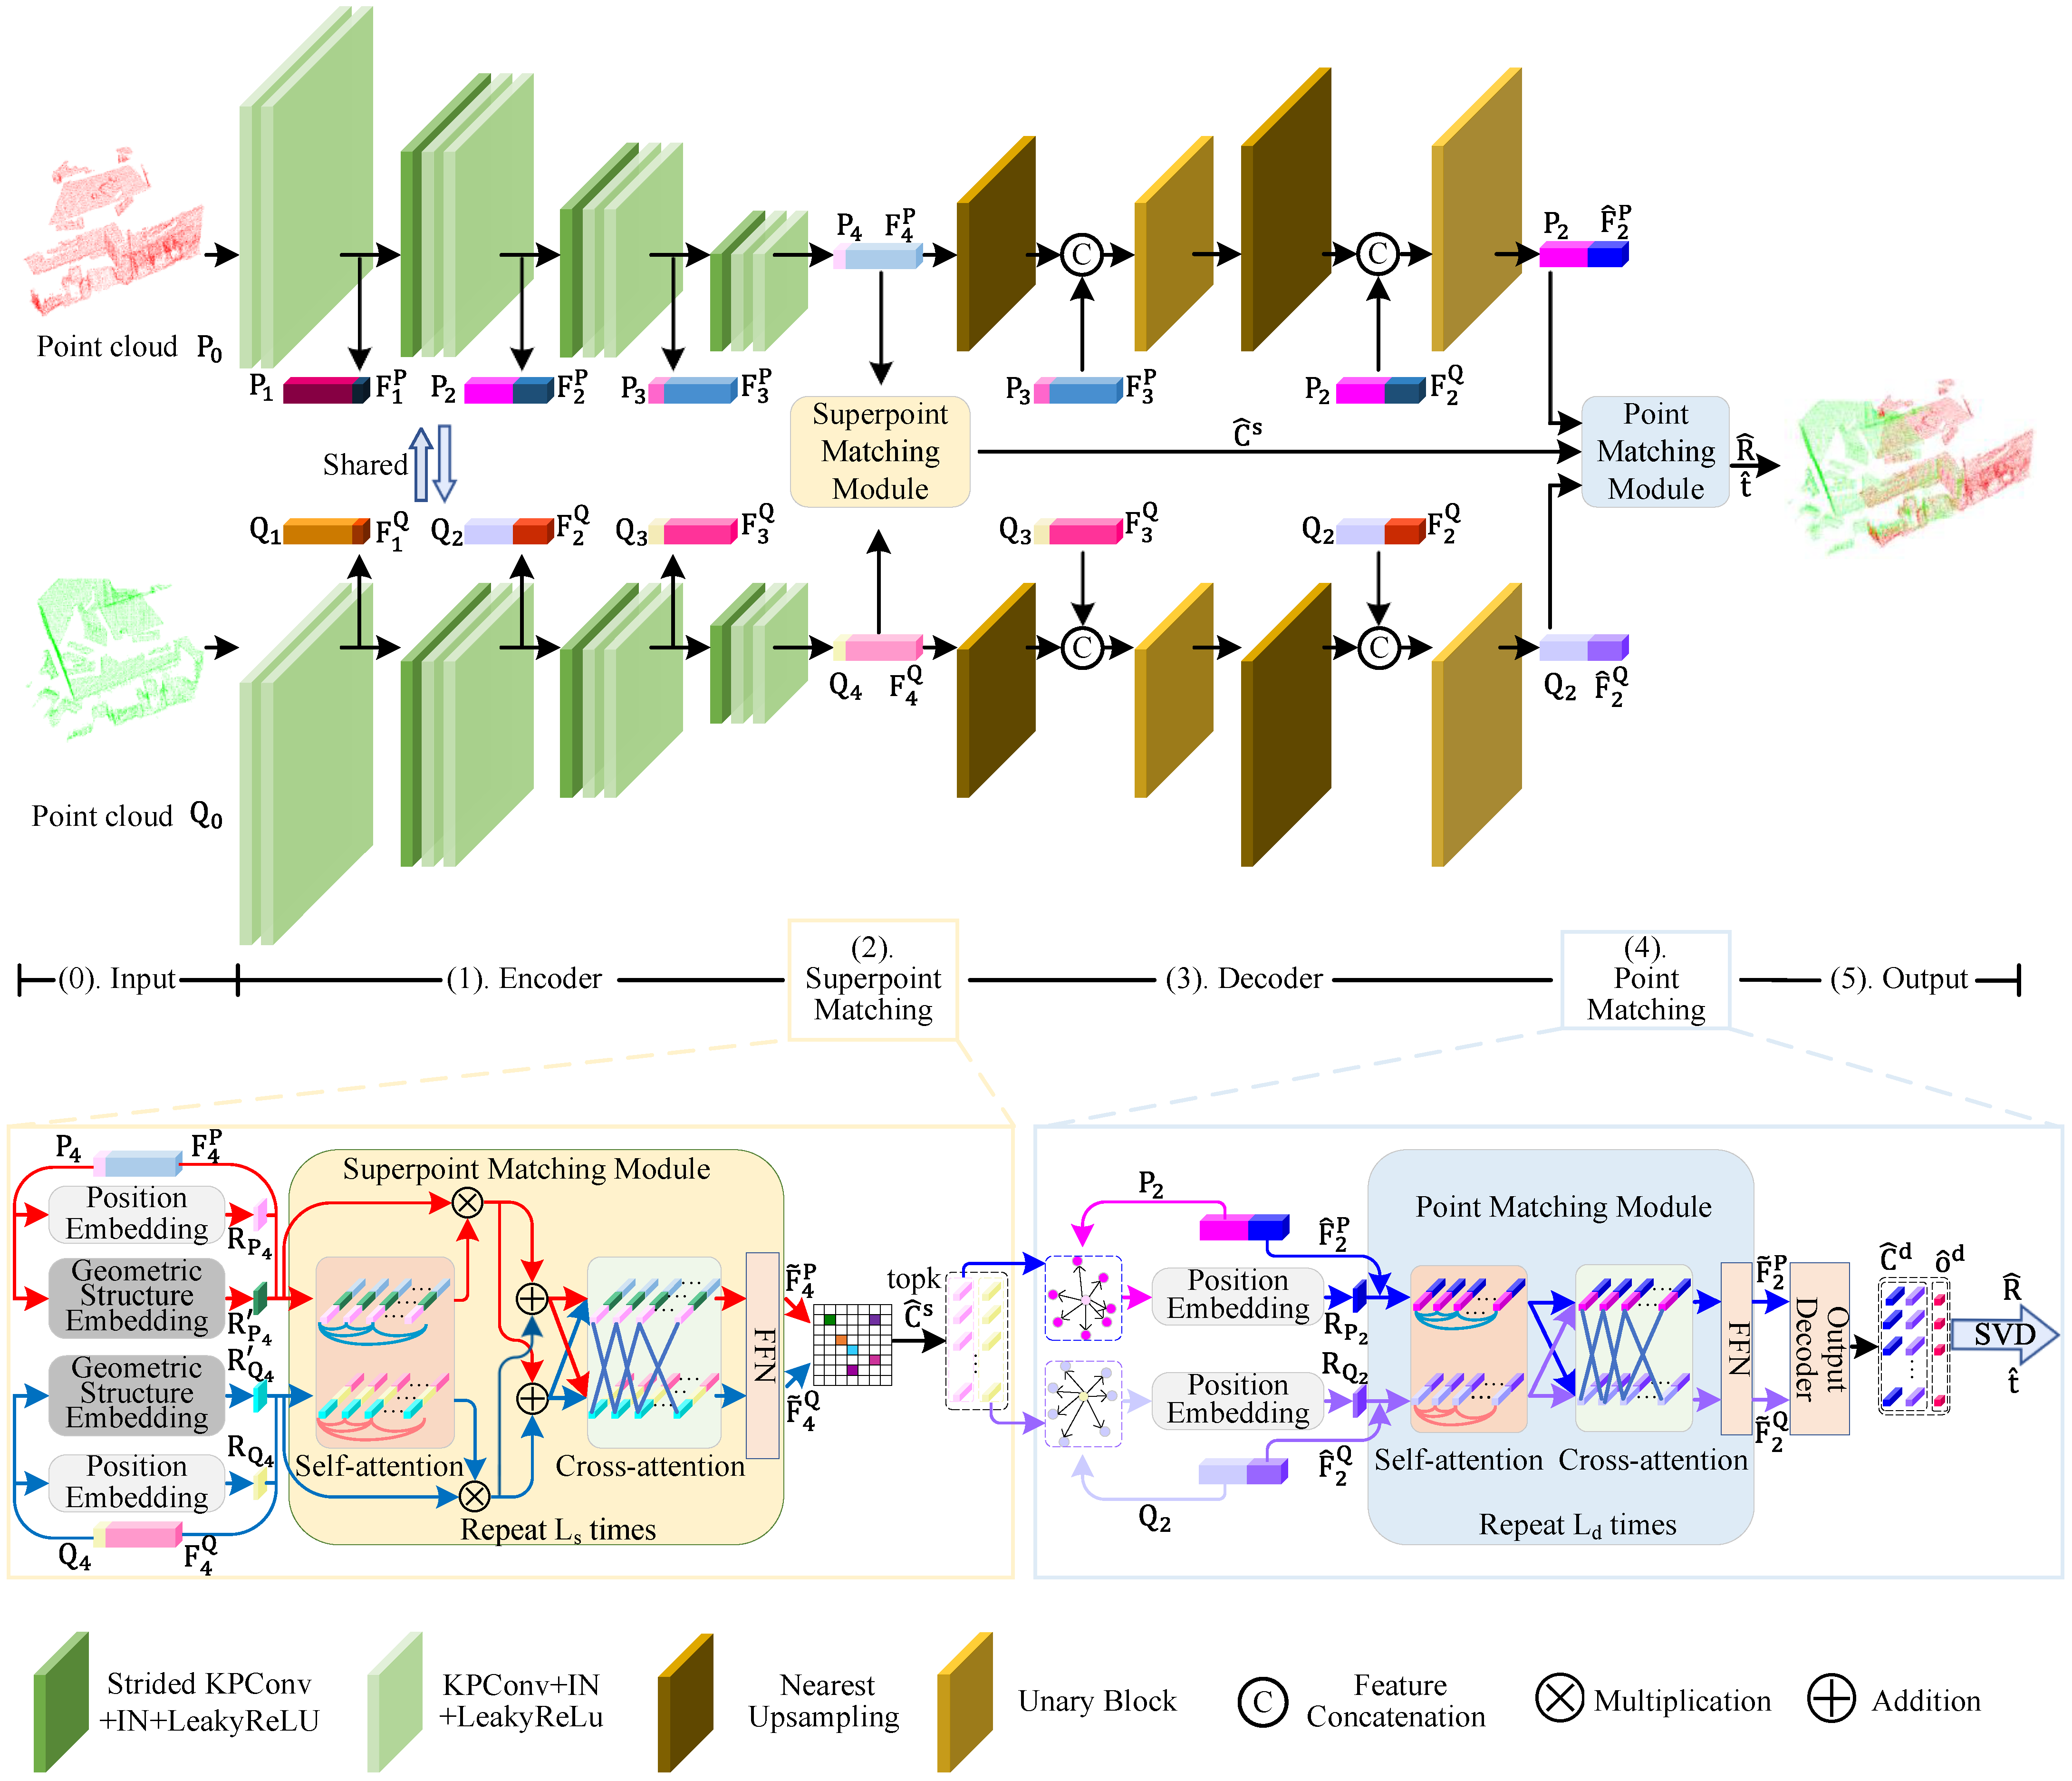
2.2. Overview of Our Method

Our approach, named TTReg, utilizes a global transformer to select dense correspondences related to sparse superpoints within the common area to estimate the transformation (See Figure 1). TTReg consists of an encoder–decoder feature extraction module, a sparse superpoint matching module, and a dense point matching module (see Figure 2). The encoder–decoder utilizes the KPConv [14] backbone as a feature extraction module and computes downsampling points of different levels (Section 2.3). The sparse superpoint matching module utilizes our RIG-Transformer to select matching superpoints located in overlapping regions to generate dense point clouds (Section 2.4). We partition dense points and superpoints into spatially clustered blocks. During training, we randomly select point cloud blocks with varying overlap ratios, and during testing, we choose dense points corresponding to superpoints selected by RIG-Transformer. Then, the dense point matching module directly regresses the correspondences of input dense point clouds, enabling the computation of relative transformation between dense point cloud pairs (Section 2.5). We introduce different loss functions to supervise superpoint matching module and dense point matching module to learn the correspondences and predict the transformation (Section 2.6). Our contributions are summarized as follows:
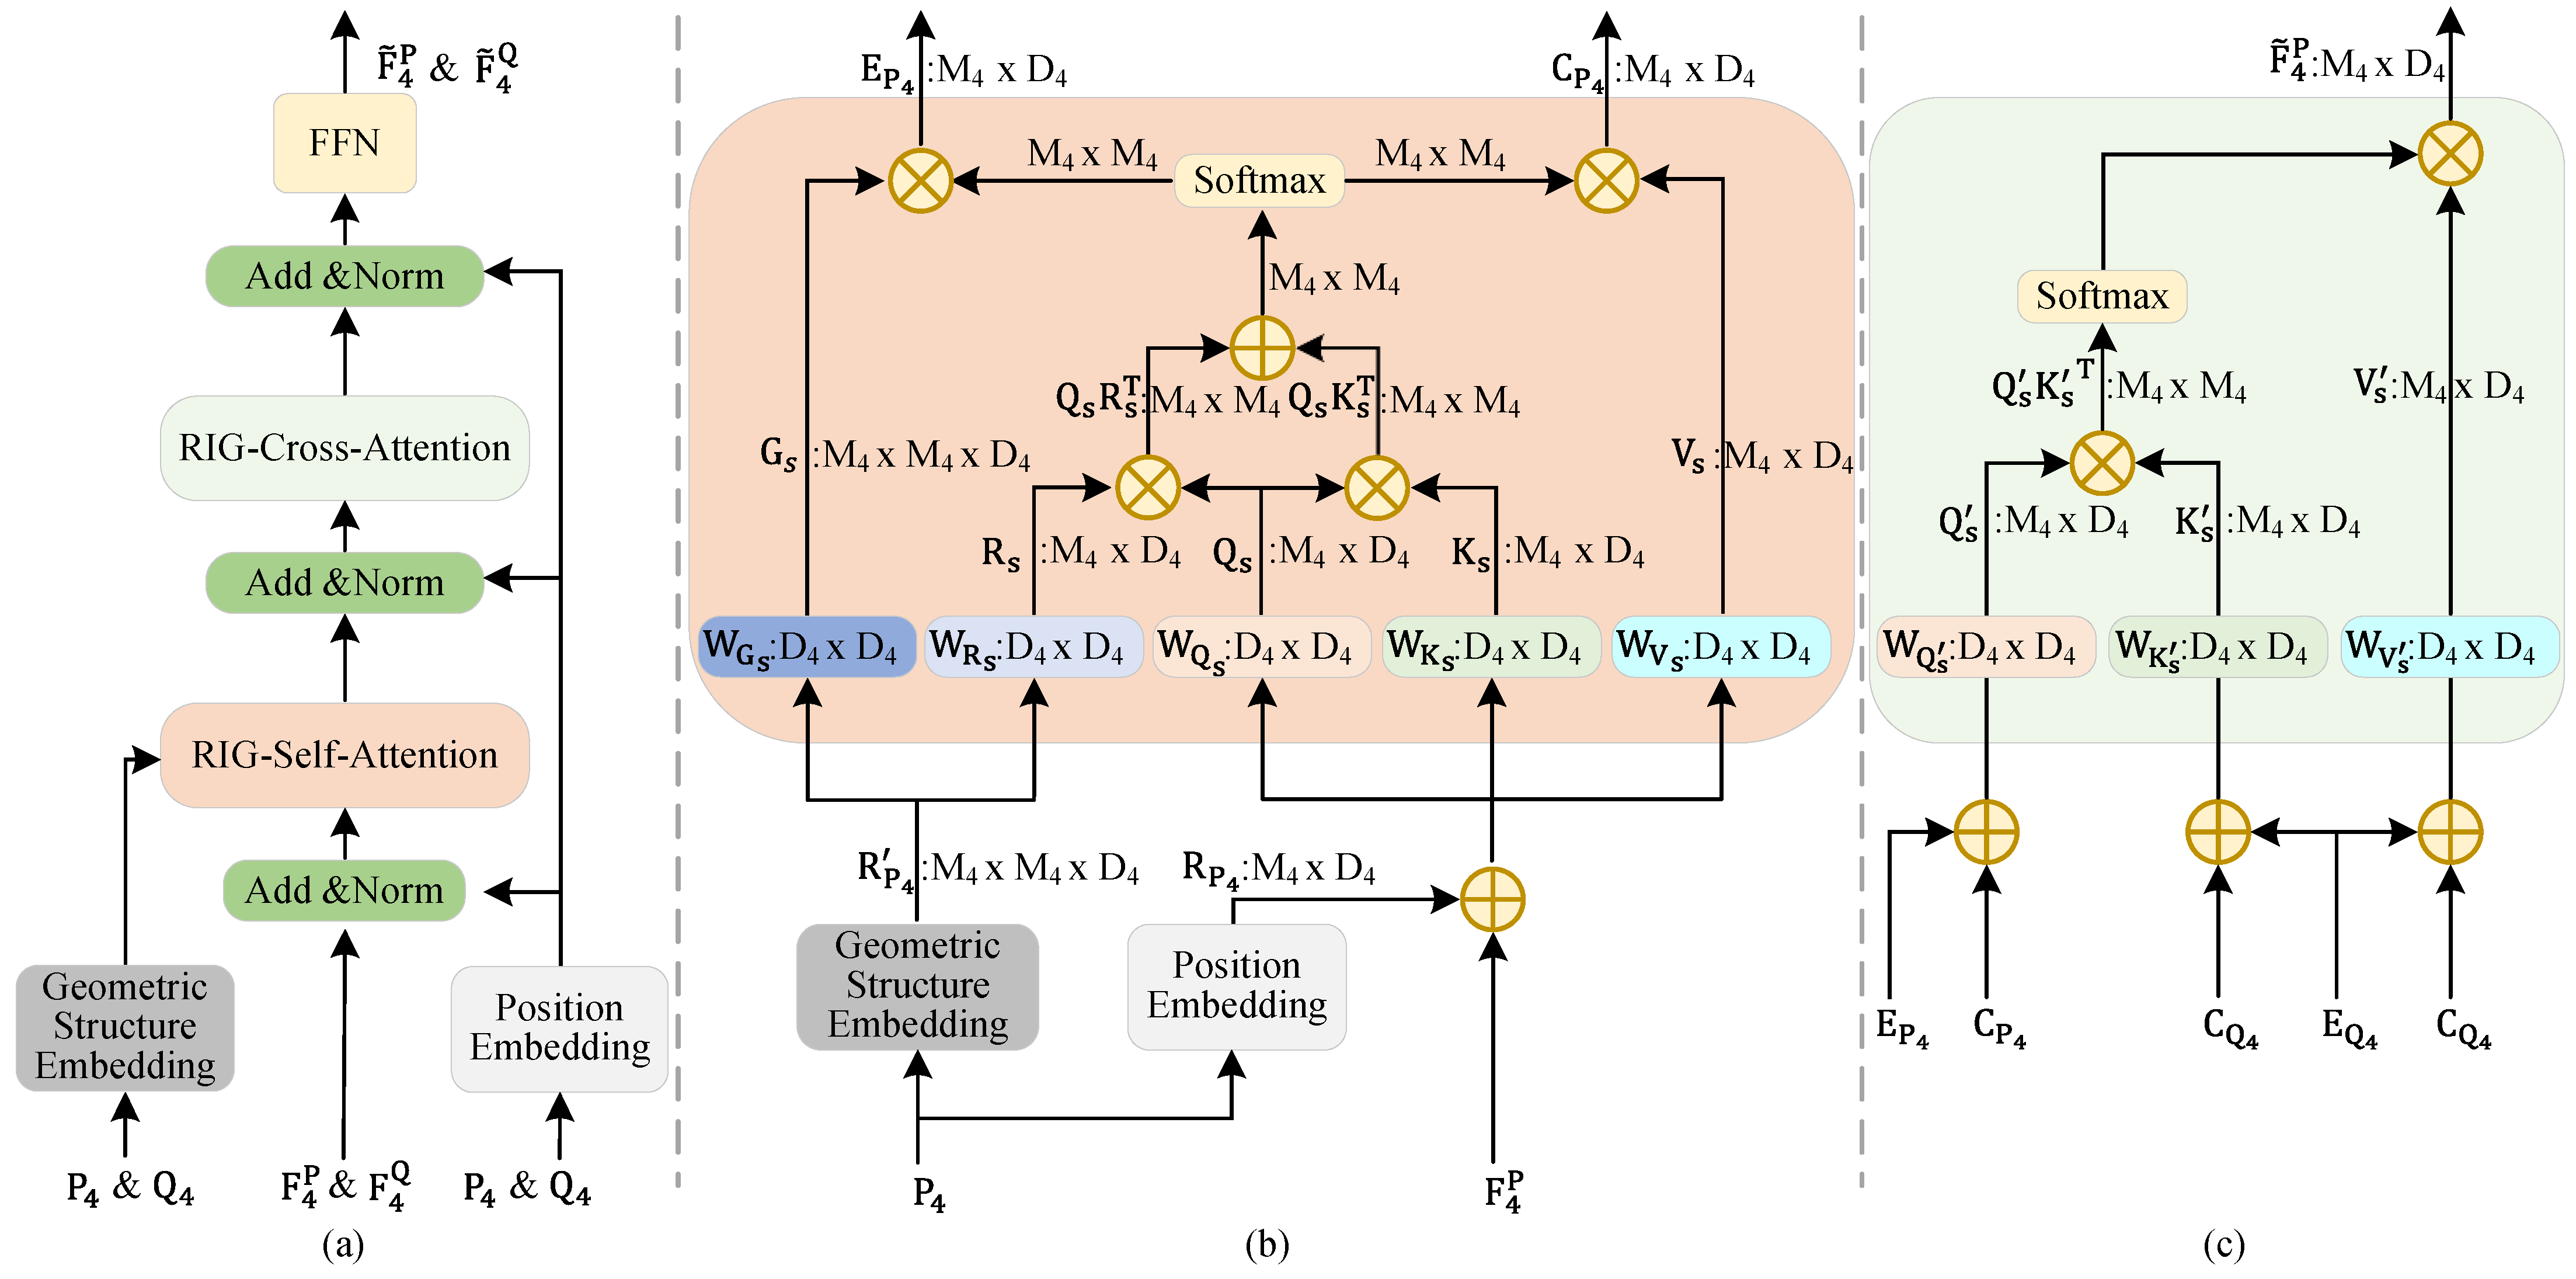
  • We propose a Rotation-Invariant Geometric Transformer Cross-Encoder module (RIG-Transformer) that combines the geometric features and positional encoding of superpoint coordinates to extract more distinctive features for predicting superpoints located in the overlapping region.
  • Through the fusion of our RIG-Transformer and Transformer Cross-Encoder, we introduce a Transformer-to-Transformer dense regression (TTReg) that leverages dense point clouds from overlapping regions for both training and testing phases to compute the transformation matrix.
  • Through extensive experiments, our method showcases strong matching capabilities on public 3DMatch and ModelNet benchmark, with a notable improvement of 7.2% in matching recall on datasets with small overlap ratios.

2.3. Feature Extraction and Correspondences Sampling

We utilize KPConv [14] as our feature extractor. The original point cloud pairs, represented as P 0 R 3 × M 0 and Q 0 R 3 × N 0 , are voxelized to calculate the downsampled 3D points P j R 3 × M j and Q j R 3 × N j , where M j and N j denote the number of 3D points obtained at each convolutional layer. Unlike Farthest Point Sampling (FPS) [15,16], we calculate the centroids of adjacent points within a voxel radius V to derive the downsampled point clouds P j and Q j . These downsampled point clouds are then utilized for feature extraction in the subsequent KPConv layers, resulting in feature representations F j P R D j × M j and F j Q R D j × N j .
The architecture for 3DMatch and 3DLoMatch illustrated in Figure 2 is adopted. We apply a 3-layer stridden KPConv convolutional structure to the original point cloud, involving three downsampling steps. Conversely, we perform two upsampling steps during the upsampling stage, resulting in one less upsampling step compared to the downsampling step. This is because point clouds are dense, requiring uniform voxelization to adapt to our correspondence loss function. The choice of upsampling steps follows the settings in Predator [17]. For the ModelNet and ModelLoNet datasets, a 2-layer downsampling and 1-layer upsampling encoder–decoder structure is employed.
To illustrate the sampling and aggregation method between sparse superpoints and dense point clouds used in our architecture of 3DMatch and 3DLoMatch (as shown in Figure 2), we first perform downsampling and feature extraction using the KPConv network. This process yields the lowest-level sparse 3D point cloud superpoints P 4 and Q 4 , along with their corresponding features F 4 P and F 4 Q . We adopt the data grouping method proposed in [17,18], where each superpoint serves as the center of a circle to divide the dense point clouds P 2 and Q 2 into 3D data blocks. The Euclidean distances between the dense points in P 4 and P 2 , as well as Q 4 and Q 2 , are computed. The dense points that are closest to the superpoints are assigned to the corresponding data blocks. The grouping method for mapping the dense points Q 0 and P 0 to superpoints is defined by Equation (2):
G k Q 4 = q 4 Q 4 | k = a r g m i n l ( q 4 q 2 , l 2 ) , q 2 , l Q 2 ,
where q 4 represents a superpoint obtained by downsampling the point cloud Q 0 , and q 2 denotes a dense 3D point of Q 0 that needs to be grouped. The symbol · denotes the Euclidean distance of 3D points. The same grouping strategy is applied to the other point cloud P 0 .
After the grouping process of dense 3D point clouds, as shown in Figure 3, we calculate the neighborhood points for each superpoint P 4 and Q 4 by considering the points in G k P 4 and G k Q 4 . For each superpoint, we compute the distance to its farthest neighboring point, which is used to measure the overlap region. By applying the relative transformation, we transform the superpoints P 4 and the dense points P 2 from point clouds P 0 into the Q 0 coordinates, denoted as P 2 , P 4 from P 0 . We then measure the overlap between superpoint pairs P 2 and Q 2 . The overlap is determined based on whether the dense points P 4 , Q 4 are contained within the overlap region of superpoints P 2 , Q 2 or not. The threshold for the overlapping region is represented as o t h r , which is used to select the dense point pairs. The selected superpoints in the overlap region of P 4 and Q 4 are denoted as P 4 o and Q 4 o , respectively, and the dense points related to P 4 o and Q 4 o are denoted as P 2 o and Q 2 o , respectively. We select dense points around superpoints based on the size of the overlapping region of the aligned point clouds. Dense point block pairs with larger overlapping regions are chosen to train our network architecture. In Figure 3, dense point block pairs of (a) are considered to be located in the overlapping region due to a large overlap area, while those in (b) and (j) are discarded as they either have no overlap or a small overlap region.

2.4. Superpoint Matching Module

We propose a Rotation-Invariant Geometric Transformer Cross-Encoder module, referred to as RIG-Transformer. Figure 4a depicts the computational flowchart, and Figure 4b,c depicts our RIG-self-attention and RIG-cross-attention, respectively. Through incorporating geometric features and positional encoding, we start by adding and normalizing the input features, a slight deviation from the typical attention mechanism. We compute the geometric features R P 4 and R Q 4 , as well as the positional encoding R P 4 and R Q 4 of superpoint P 4 and Q 4 . These values are then combined with the feature vectors F 4 P and F 4 Q of the superpoints and fed into RIG-Transformer to calculate the interaction features of the point cloud pairs.
For instance, considering the point cloud P 0 , we compute the feature vectors for RIG-self-attention, following the process and dimensions depicted in Figure 4. Utilizing the superpoint P 4 and feature vector F 4 P extracted by KPConv [14] as input, we not only calculate the initial attention [19] components Q s , K s , V s , but also compute weighted geometric feature encodings G s and R s . Subsequently, we derive the geometric branch feature E P 4 and contextual feature C P 4 based on the attention weights. The definitions of the individual variables are provided as follows:
G s = R P 4 W G s ,
R s = R P 4 W R s ,
Q s = ( F 4 P + R P 4 ) W Q s ,
K s = ( F 4 P + R P 4 ) W K s ,
V s = ( F 4 P + R P 4 ) W V s ,
E P = S o f t m a x ( Q s R s + Q s K s T D s ) G s ,
C P = S o f t m a x ( Q s R s + Q s K s T D s ) V s ,
where W G s , W R s represent the learnable weights for geometric features; W Q s , W K s , and W V s denote the learnable self-attention weights for the features of superpoints P 4 and Q 4 ; and D s indicates the dimension of the features F 4 P and F 4 Q of P 4 and Q 4 . It is noteworthy that W G s , W R s , W Q s , W K s , and W V s share weights between point clouds P 0 and Q 0 . Similarly, taking Q 4 and F 4 Q as inputs to the self-attention module RIG-self-attention, we replace the corresponding input variables according to the computation methods in Equations (3)–(9) to calculate E Q 4 and C Q 4 for subsequent feature interactions.
We input the calculated E P 4 , C P 4 , E Q 4 , and C Q 4 from the above computations into RIG-cross-attention, as illustrated in Figure 4c. We compute the rotation-invariant geometric feature F ˜ 4 P after the interaction, with the calculation of variables defined as follows:
Q s = ( E P + C P ) W Q s ,
K s = ( E Q + C Q ) W K s ,
V s = ( E Q + C Q ) W V s ,
F ˜ 4 P = S o f t m a x ( Q s K s T D s ) V s ,
where W Q s , W K s and W V s are the learnable shared weights for point clouds P 4 and Q 4 . By swapping the input order of E P 4 and E Q 4 , C P 4 and C Q 4 in Figure 4c, we obtain the output features F ˜ 4 Q . As shown in Figure 2, the obtained F ˜ 4 P and F ˜ 4 Q are further processed through the FFN module, which consists of two layers of linear transformation units, to facilitate multiple interactions and the fusion of features. The calculated features serve as new F ˜ 4 P and F ˜ 4 Q . We iterate the computation of RIG-Transformer L s times to enhance the correlation between intrinsic and interaction features of the point clouds, resulting in the final output feature vectors F ˜ 4 P and F ˜ 4 Q with geometric properties and rotation invariance.
To extract the optimal matching dense 3D points C ^ d , during the training phase, we compute neighboring points from P 4 and Q 4 and randomly select matching superpoints C ^ s , followed by selecting densely related points for training our network. During the testing phase, we calculate the optimal matching superpoints and then select the densely related points in the dense point matching module. To select the best matching superpoints, we first normalize the features F ˜ 4 P and F ˜ 4 Q mixed with geometric features and positional encoding. Subsequently, we compute the Gaussian correlation matrix C ˜ s for the normalized features, with the Gaussian correlation formula for a pair of superpoints defined as follows:
C ˜ ij s = e x p ( F ˜ 4 p i F ˜ 4 q j 2 2 ) .
To enhance the discriminative feature matching of superpoints, we normalize the correlation matrix C ˜ ij s using bidirectional normalization [7,20,21]. Bidirectional normalization refers to normalizing the feature correlation matrix in rows and columns separately. The formula is defined as follows:
C ^ ij s = C ˜ ij s k = 1 | P 4 | C ˜ ik s · C ˜ ij s k = 1 | Q 4 | C ˜ kj s .
After bidirectional normalization, we select the top K best-matching pairs of superpoints based on the matching scores and extract the related dense points. These dense matching points not only possess richer geometric features but are also located in overlapping regions. This reduces the impact on point cloud registration performance from points structurally similar but located outside the overlapping regions.

2.5. Point Matching Module

Due to the quadratic relationship between weight matrices and data length in the attention mechanism of Transformer, existing methods are unable to directly process dense point clouds with Transformer. Furthermore, numerous dense point pairs correspond to points in the overlapping areas. Thus, we choose the top K matching point pairs C ^ s using the predicted superpoints containing global information. Subsequently, we index the dense 3D matching point pairs located in overlapping regions based on the relationship between superpoints and dense points. The predicted dense matching points are denoted as C ^ d , containing the dense three-dimensional points P 2 and Q 2 of point clouds P 0 and Q 0 , along with their respective features F ^ 2 P and F ^ 2 Q .
Since F ^ 2 P and F ^ 2 Q are dense point cloud features extracted by the KPConv network, they have more accurate coordinates compared to sparse superpoints. We utilize a Transformer Cross-Encoder to interactively exchange information among the dense point features located within the overlapping regions outputted by the RIG-Transformer module. In the interaction, we fuse the positional encoding [10,19] of the respective dense point coordinates. The incorporation of positional encoding not only enhances the robustness of the features but also allows us to use them for subsequent prediction of corresponding point coordinates and determining if the predicted points reside in overlapping areas. Based on the predicted dense corresponding points, we calculate the transformation matrix.
Our dense point cloud matching module is primarily composed of a Transformer Cross-Encoder module and an output decoding module. The Transformer Cross-Encoder module consists of a self-attention module, cross-attention module, and FFN module. In Figure 5a, the overall calculation process of attention is depicted, Figure 5b represents the calculation of self-attention for feature extraction, and Figure 5c illustrates the attention interaction calculation between two point clouds. The FFN module comprises two layers of linear transformation units, serving to transform and integrate feature channels in the interaction of multi-layer attention.
Taking dense spatial coordinates P 2 and the features F ^ 2 P of point cloud P 0 located in the overlapping region as an example, we illustrate the feature fusion and interaction of dense point feature pairs in Figure 5b,c. Firstly, P 2 are encoded using sine encoding, followed by the fusion with the feature F ^ 2 P to calculate the self-attention context feature C P 2 . The formulas for feature fusion and the self-attention of Q d , K d , and V d and the context feature C P 2 are defined as follows:
Q d = ( F ^ 2 P + R P 2 ) W Q d ,
K d = ( F ^ 2 P + R P 2 ) W K d ,
V d = ( F ^ 2 P + R P 2 ) W V d ,
C 2 P = S o f t m a x ( Q d K d T D d ) V s ,
where the variables Q d , K d , and V d of self-attention are shared. The corresponding learnable weights W Q d , W K d , and W V d are shared by the dense point clouds P 2 and Q 2 of point clouds P 0 and Q 0 . Similarly, we replace the input variables of the self-attention module (b) in the Transformer Cross-Encoder in Figure 5 with Q 2 and F ^ 2 Q and compute the global context feature vector C Q 2 of point cloud Q 0 based on Equations (16)–(19). Consequently, we have obtained the context feature vectors C P 2 and C Q 2 of the matching point pairs of dense point clouds P 0 and Q 0 within the overlapping region, which serve as inputs to the cross-attention module for further feature fusion.
The computational process of the cross-attention is illustrated in Figure 5c. Subsequently, we input C P 2 and C Q 2 into the cross-attention module (c) in sequential order (first C P 2 and then C Q 2 ), and compute the interacted feature F ˜ 2 P , which integrates more accurate encoding of dense spatial coordinates and contains global feature interaction information of the point cloud to be matched, thus possessing better discriminative power. The corresponding formula for this computation is defined as follows:
Q d = C P 2 W Q d ,
K s = C Q 2 W K d ,
V s = C Q 2 W V d ,
F ˜ 2 P = S o f t m a x ( Q d K d T D d ) V d ,
where W Q d , W K d , and W V d are the learnable parameters of the cross-attention variables Q d , Q d , and Q d . Similarly, we interchange the input order of C P 2 and C Q 2 in Figure 5c and the corresponding computation Formulas (20)–(23). By first computing in the sequence of C Q 2 and then C P 2 , we obtain the feature F ˜ 2 Q for dense point pairs located in the overlapping region. The resulting F ˜ 2 P and F ˜ 2 Q contain positional encoding and feature information from the other, representing dense global features with enhanced discriminative power. These features will be directly utilized in the output decoding module to predict corresponding point coordinates and overlap scores.
We feed F ˜ 2 P and F ˜ 2 Q as inputs to the output decoding module, which consists of four linear layers. Among these layers, three are utilized for predicting the corresponding coordinates of points, while the fourth linear layer is responsible for predicting scores indicating whether the matched points are within the overlapping area. The network structure is illustrated in Figure 6, and the detailed mathematical expressions are presented as follows:
P ^ 2 o = R e L U ( R e L U ( F ˜ 2 Q W 1 + b 1 ) W 2 + b 2 ) ) W 3 + b 3 Q ^ 2 o = R e L U ( R e L U ( F ˜ 2 P W 1 + b 1 ) W 2 + b 2 ) ) W 3 + b 3 ,
o ^ P 2 = F ˜ 2 Q W 1 + b 1 o ^ Q 2 = F ˜ 2 P W 1 + b 1 ,
where W 1 , W 2 , W 3 , b 1 , b 2 , b 3 , W 1 , and b 1 are the learnable weights of the corresponding point and overlap prediction linear layers in the output decoding module. We concatenate the dense points located in the common area P 2 o with the predicted corresponding points Q ^ 2 o . Similarly, we concatenate the dense points Q 2 o within the common area with the network-predicted corresponding points Q ^ 2 o . After concatenation, we obtain dense matched points P ^ 2 d and Q ^ 2 d in the overlapping region with a data length of M 2 o + N 2 o . The corresponding overlap score is denoted as o ^ 2 d , and the formulas are defined as follows:
P ^ d = P 2 o P ^ 2 o , Q ^ d = Q ^ 2 o Q 2 o , o ^ d = o ^ P 2 o ^ Q 2 ,
we calculate the relative transformation matrix R ^ and t ^ of the point cloud to be matched by minimizing the loss function of dense matching points:
R ^ , t ^ = arg min j M 2 o + N 2 o o ^ j R p ^ j + t q ^ j 2 ,
where M 2 o and N 2 o represent the data lengths of P 2 o and Q ^ 2 o , Q 2 o , and P ^ 2 o , respectively. p ^ j , q ^ j , and o ^ j are the estimated corresponding points and overlap score weights from Equation (26). We obtain our estimated relative pose transformation matrix by solving Equation (27) using the Kabsch–Umeyama algorithm [22,23] for the optimal solution.

2.6. Loss Function

Our optimization target loss L comprises two parts: the superpoint loss L s and the dense point loss L d , i.e., L = L s + L d . The superpoint loss function constrains and predicts superpoint correspondences located in the overlapping region, while the dense point loss function directly enforces the architecture to predict dense correspondences.

2.6.1. Superpoint Correspondences Loss Function

We utilize the overlapping circle loss from [7] to choose the K best pairs of superpoints with the greatest similarity scores. The function is defined as follows:
L s P 0 = 1 | A | G j P A log [ 1 + G k Q ε p j e λ j k β p j , k ( d j k Δ p ) · G l Q ε n j e β n j , l ( Δ n d j k ) ] ,
where d j k = F ˜ s p j F ˜ s q k 2 represents the distance between feature vectors and F ˜ s p j and F ˜ s q k are the features of superpoints in point clouds P 0 and Q 0 , respectively. Following the three-level downsampling of point clouds as shown in Figure 2, we have F ˜ s p j F ˜ s P 4 and F ˜ s q k F ˜ s Q 4 and λ j k = ( o j k ) 1 2 , where o j k denotes the degree of overlap between dense points corresponding to the superpoint pair G j P and G k Q . We use β p j , k = γ ( d j k Δ p ) and β n j , l = γ ( Δ n d j l ) to weight the matching points and non-matching points, respectively, enhancing the discriminative power of the function, where we set the hyperparameters Δ p = 0.1 and Δ n = 1.4 as suggested in [7]. Similarly, the loss function L s Q 0 for Q 0 is computed using a similar method, resulting in the complete superpoint loss function L s = ( L s P 0 + L s Q 0 ) / 2 .

2.6.2. Point Correspondences Loss Function

The dense point loss function comprises three components: overlap loss, corresponding point loss, and feature loss, i.e., L d = L d o + L d c + L d f , which, respectively, constrain the overlapping regions in three-dimensional space, match corresponding points in three-dimensional space, and supervise the learning of the joint network for feature vector space matching.

Overlap Loss

Through the superpoint matching module in Section 2.4, we obtained dense point pairs located in the overlapping region. To facilitate the network in acquiring additional characteristics of corresponding areas, we divide the point cloud match pairs into overlapping and non-overlapping regions. We further constrain the dense points corresponding to matching superpoints with similar structures but low overlap rates using a cross-entropy loss function. This helps reduce matching errors and improve matching accuracy, and the formula for overlap score constraint is defined as follows:
L d o P 0 = 1 M d j M d o p j g t · log o ^ p j + 1 o p j g t · log 1 o ^ p j ,
where o ^ p j represents the likelihood score of the network predicting if points are belong the overlapping area, we calculate o p j g t utilizing the method proposed in [17,24], defined by the formula:
o p j g t = 1 , T g t p j N N T g t p j , Q 0 < r d 0 , o t h e r w i s e ,
where T g t represents the rigid transformation matrix of the ground truth relative pose change for the pair of point clouds, r d is the threshold to determine whether a pair of dense matching points match, and N N ( · ) denotes the spatial nearest neighbor calculation. Similarly, we can derive the dense overlap loss function L d o Q 0 of Q 0 , and the complete dense point overlap loss function is given by L d o = L d o P 0 + L d o Q 0 .

Corresponding Point Loss

We constrain the three-dimensional points in the overlapping region by minimizing the Euclidean distance 1 of the corresponding points in three-dimensional space. For dense points outside the overlapping region, we use the overlap degree as a weight. The formula is defined as follows:
L d c P 0 = 1 j o p j g t j M d o p j g t T g t p j d q ^ j d ,
where o p j g t is the ground truth overlap degree, p j d and q ^ k d are a pair of dense matching points as in Equation (26), and M d is the number of dense three-dimensional points within the overlapped region in point cloud P 0 . Similarly, we calculate the corresponding point loss function L d c Q 0 for the point cloud Q 0 . The overall corresponding point loss function is given by L d c = L d c P 0 + L d c Q 0 .

Feature Loss

We utilize the infoNCE loss [10] to supervise the network learning of dense point feature vectors, encouraging the network to learn more similar features for matching points. Here, p d P ^ d and q d Q ^ d represent a pair of dense matching points as in Equation (26). The definition of the feature loss function infoNCE is as follows:
L d f P 0 = E p d P ^ d log g p d , p p d g p d , p p d + n p d g p , n p d .
We measure the similarity of features using a logarithmic bilinear function [10], where the function g · , · is defined as:
g ( x , q ) = e x p ( g ¯ p T W g g ¯ q T ) ,
where g p F ˜ d P , with F ˜ d P representing the dense feature obtained from the three times downsampled and two times upsampled feature extraction network structure shown in Figure 2. g ¯ q is the feature vector of its corresponding point. p p d and n p d indicate whether the point in Q ^ d matches p d , with the matching determined by the positive boundary V and negative boundary 2 V , where V is the radius of the voxel size. W f is a learnable weight matrix that is diagonal and symmetric. Similarly, the overall feature loss is given by L d f = L d f P 0 + L d f Q 0 .

3. Results

3.1. Datasets

3.1.1. Indoor Benchmarks: 3DMatch and 3DLoMatch

The 3DMatch [25] and 3DLoMatch [17] datasets were introduced to address the challenges of 3D scene understanding and alignment. The datasets consist of RGB-D scans of various indoor scenes, and provide aligned point clouds and RGB images for each scene, along with ground truth transformations that represent the accurate relative poses between pairs of point clouds. One key feature of the datasets is their diversity in terms of scene types, object categories, and sensor noise. The scenes include different indoor environments, such as living rooms, kitchens, and offices, with varying levels of clutter and occlusion. This diversity helps to analyze generalization capabilities for point cloud registration algorithms. The 3DLoMatch dataset contains significant geometric variations, occlusions, and partial overlaps (between 10 % and 30%), but the overlaping regions are smaller than those in 3DMatch (>30%), making accurate alignment and pose estimation difficult. This makes the dataset suitable for evaluating the performance of various point cloud registration methods under realistic conditions.

3.1.2. Synthetic Benchmarks: ModelNet and ModelLoNet

We also utilize the ModelNet40 [26] benchmark to further assess our model. We follow the dataset settings proposed by [10,17,27] to obtain ModelNet and ModelLoNet, respectively. These datasets exhibit varying average overlapping regions, with ModelNet at 73.5 % overlap and ModelLoNet at 53.6 % . The ModelNet40 dataset provides a well-balanced distribution of object categories, including chairs, tables, airplanes, cars, and more, guaranteeing representation from diverse classes. The objects within this dataset are captured from multiple angles and poses, offering a realistic and comprehensive depiction of real-world objects. This diversity presents challenges for algorithms, as they need to handle the different orientations, partial views, and inherent noise present in the data.

3.2. Experiment Details

For 3DMatch and ModelNet40, we set the voxel size V to 0.025 m and 0.015 m, respectively, with the voxel size doubling at each downsampling step. Training is conducted only on 3DMatch and ModelNet datasets, and evaluation testing is performed not only on 3DMatch and ModelNet, but also on 3DLoMatch and ModelLonet. We select 32 superpoints, with a maximum of 64 dense points associated with each superpoint in the training and testing phases of 3DMatch. For the ModelNet40 dataset, we unify the data length of training superpoint, testing superpoints, as well as the maximum length of dense points associated with each superpoint to 128. We utilize the AdamW optimizer with a consistent initial learning rate of 0.0001. For 3DMatch, the learning rate is decreased by half every 20 epochs, whereas for ModelNet, it is halved every 100 epochs. Training concludes upon reaching 900k iterations. The training and testing processes are carried out on an Nvidia RTX 3090Ti GPU. We set the batch size to 1 for both 3DMatch and ModelNet40.

3.3. Evaluation

3.3.1. Evaluation of 3DMatch and 3DLoMatch

In order to evaluate our approach’s effectiveness, we utilize the registration recall (RR) metric configuration proposed in [10,17,28] for measuring the success rate of registration. Moreover, we apply the relative rotation error (RRE) to evaluate the accuracy of rotation matrices and the relative translation error (RTE) to assess discrepancies in translation vector estimations, commonly employed for analyzing transformation matrix errors. RegTR [10] directly regresses poses using sparse superpoints, which serves as our baseline for assessment (see Table 1).
In Table 1, the methods above the line are based on RANSAC, and those below are non-RANSAC methods. Our method notably enhances point cloud registration performance within limited overlapping regions, with an increase of over 7 percentage points and lower registration errors. Moreover, it also demonstrates better registration performance for highly overlapping point clouds.
To showcase the exceptional capability of our suggested model, we illustrate the validation set’s test performance curves throughout the training phase, as displayed in Figure 7. The initial row illustrates the test curves for the 3DMatch dataset, whereas the subsequent row exhibits the test curves for ModelNet. These graphs depict the RR, RRE, and RTE. Our model converges rapidly, attains superior registration recall rates, and demonstrates reduced matching errors.
In Figure 8, we present the point cloud registration capability on the 3DLoMatch dataset, focusing on areas with small degrees of overlap and high structural similarity outside the overlapping regions. It can be observed that our method generates more feature correspondences, predominantly within the overlap regions, while the baseline method produces more correspondences within the overlap regions but also includes some erroneous matches outside these regions, significantly impacting registration capability.

3.3.2. Evaluation of ModelNet and ModelLoNet

In the case of the ModelNet and ModelLoNet benchmarks, we refer to the relevant method [10,12] to evaluate point cloud registration error using the RRE, RTE, and Chamfer distance (CD). Since RR is a key metric for assessing the success of point cloud registration, we further assess the performance of our method in terms of its RR.
Similarly, we provide detailed demonstrations of the registration performance on ModelNet and ModelLoNet in Table 2 and Figure 7 and Figure 9. The experimental results show that the proposed TTReg not only accomplishes strong performance in registration in real-world scenarios but also achieves significant improvements on synthesized datasets. The dense matching points computed by our method are mainly concentrated within the overlap regions, effectively enhancing the registration performance.

3.4. Ablation

To corroborate the efficacy of our TTReg, we evaluate the impact of L s repetitions of the proposed RIG-Transformer on the 3DMatch and ModelNet; the low-overlap 3DLoMatch and ModelLoNet benchmarks will also be evaluated. Following prior works [10,17,27], we assess the RR, RRE, and RTE for 3DMatch and 3DLoMatch, while for the ModelNet and ModelLoNet datasets, we evaluate the CD, RRE, and RTE. The quantitative performance metrics for 3DMatch and 3DLoMatch are presented in Table 3, while those for ModelNet and ModelLoNet are shown in Table 4.
We consider values of L s = 3 , 4 , 5 , with the maximum value limited to 5 due to computational constraints. From Table 3 and Table 4, we observed that increasing L s appropriately leads to improved matching performance, with optimal results achieved at L s = 5 . Further increasing L s may offer additional improvements. However, due to computational limitations, we do not test cases where L s > 5 . Notably, our method incurs significantly lower costs when increasing L s compared to previous methods, as we only match the dense points with the highest correspondence in the overlapping regions, greatly reducing the computational resources required.

4. Discussion

To further investigate the impact of L s repetition times of RIG-Transformer during the training process on registration performance, we visualize the evaluation curves for 3DMatch and ModelNet (see Figure 10). The RR improves with increasing L s , while the RRE and RTE decrease as L s increases. The evaluation curves during the training process align with the registration performance presented in Table 3 and Table 4.
Furthermore, we analyze the distribution of dense points in the overlapping regions predicted by the RIG-Transformer module. The corresponding dense points are illustrated in Figure 11 and Figure 12. We first compute the sparse matching keypoints predicted by the baseline [10] and the dense corresponding points obtained by our RIG-Transformer module. Then, we align the point clouds P 0 and Q 0 using the ground truth point cloud relative pose transformation. The gray connecting lines in the figures link the predicted matching corresponding points. In point cloud pairs with high common ratios, sparse corresponding keypoints are predominantly located in the overlapping regions. Conversely, for tow point cloud with low common ratios, numerous unmatching keypoints appear within non-overlapping areas. On the other hand, in point cloud pairs with low common area ratios between point cloud pairs, numerous unmatched keypoints appear in the non-overlapping areas.
Our model predicts dense points that are primarily clustered within the overlapping regions, particularly in regions with low overlap ratios. This outcome is credited to our model’s enhanced capacity to thoroughly investigate the structural characteristics of point cloud sets, leading to improved registration performance by directly predicting the relative pose transformation of point clouds.

5. Conclusions

Our proposed method calculates the relative transformation of point clouds by regressing the corresponding point coordinates of dense point clouds using two cascaded Transformers. We divide the point cloud registration into two steps. Firstly, we divide the points of pairs of point clouds into overlapping and non-overlapping regions. The proposed RIG-Transformer is used to distinguish the best-matching sparse superpoints located in the overlapping region, which transforms the point-to-point matching into a binary classification, reducing the difficulty of classification. The proposed RIG-Transformer integrates point cloud geometric features and positional encoding, possessing rotational invariance. By extracting more complex geometric features, and improving the robustness of feature matching, RIG-Transformer can effectively filter out incorrect superpoint correspondences with high structural similarity outside the overlapping area. Subsequently, the dense point clouds are indexed through the spatial clustering relationship between point cloud superpoints and dense point clouds. The dense point clouds located in the overlapping region play a key role in point cloud registration and have high spatial coordinate accuracy. By using the Transformer Cross-Encoder, corresponding point coordinates can be regressed with higher precision, thereby enhancing the estimated transformation accuracy of point clouds. By combining RIG-Transformer with a Transformer Cross-Encoder, we directly regress the transformation between dense points within the overlapping region. Our approach leverages both the geometric properties of features and the precision of the point coordinates in dense point clouds. Importantly, our regression mechanism avoids the time overhead incurred by using RANSAC. However, due to constraints on computational resources, we did not conduct extensive testing on the interaction times of RIG-Transformer.

Author Contributions

Conceptualization, Y.Z.; methodology, Y.Z.; software, Y.Z.; validation, Y.Z.; formal analysis, Y.Z.; investigation, Y.Z.; resources, Y.Z.; data curation, Y.Z.; writing—original draft preparation, Y.Z.; writing—review and editing, Y.Z., L.C., Q.Z., J.Z., H.W. and M.R.; visualization, Y.Z.; supervision, Y.Z. and M.R.; project administration, Y.Z. and M.R.; funding acquisition, M.R. All authors have read and agreed to the published version of the manuscript.

Funding

This research was supported in part by the National Natural Science Foundation of China under Grant 61703209 and Grant 62272231, in part by the Natural Science Foundation of the Higher Education Institutions of Jiangsu Province (No. 19KJB520022), in part by the Qing Lan Project of Jiangsu Province (2021), and in part by the Cultivation Object of Major Scientific Research Project of CZIMT (No. 2019ZDXM06). The APC was funded by Nanjing University of Science and Technology.

Data Availability Statement

All datasets used in this study are publicly available. The 3DMatch dataset is available at https://share.phys.ethz.ch/~gsg/pairwise_reg/3dmatch.zip, accessed on 15 August 2023, and the ModelNet dataset is available at https://shapenet.cs.stanford.edu/media/modelnet40_ply_hdf5_2048.zip, accessed on 15 August 2023).

Conflicts of Interest

The authors declare no conflicts of interest.

Abbreviations

The following abbreviations are used in this manuscript:
RIG-Transformer Rotation-Invariant Geometric Transformer Cross-Encoder
TTRegTransformer-to-Transformer Regression
RANSAC Random Sample Consensus
FPS Farthest Point Sampling
RR Registration Recall
RRE Relative Rotation Error
RTE Relative Translation Error
CD Chamfer Distance

References

  1. Chen, Y.; Mei, Y.; Yu, B.; Xu, W.; Wu, Y.; Zhang, D.; Yan, X. A robust multi-local to global with outlier filtering for point cloud registration. Remote Sens. 2023, 15, 5641. [Google Scholar] [CrossRef]
  2. Sumetheeprasit, B.; Rosales Martinez, R.; Paul, H.; Shimonomura, K. Long-range 3D reconstruction based on flexible configuration stereo vision using multiple aerial robots. Remote Sens. 2024, 16, 234. [Google Scholar] [CrossRef]
  3. Choy, C.; Park, J.; Koltun, V. Fully convolutional geometric features. In Proceedings of the IEEE/CVF International Conference on Computer Vision, Seoul, Republic of Korea, 27 October–2 November 2019; pp. 8958–8966. [Google Scholar]
  4. Han, T.; Zhang, R.; Kan, J.; Dong, R.; Zhao, X.; Yao, S. A point cloud registration framework with color information integration. Remote Sens. 2024, 16, 743. [Google Scholar] [CrossRef]
  5. Mei, G.; Tang, H.; Huang, X.; Wang, W.; Liu, J.; Zhang, J.; Van Gool, L.; Wu, Q. Unsupervised deep probabilistic approach for partial point cloud registration. In Proceedings of the IEEE/CVF Conference on Computer Vision and Pattern Recognition, Vancouver, BC, Canada, 17–24 June 2023; pp. 13611–13620. [Google Scholar]
  6. Cuturi, M. Sinkhorn distances: Lightspeed computation of optimal transport. Adv. Neural Inf. Process. Syst. 2013, 26, 2292–2300. [Google Scholar]
  7. Qin, Z.; Yu, H.; Wang, C.; Guo, Y.; Peng, Y.; Xu, K. Geometric transformer for fast and robust point cloud registration. In Proceedings of the IEEE/CVF Conference on Computer Vision and Pattern Recognition, New Orleans, LA, USA, 18–24 June 2022; pp. 11143–11152. [Google Scholar]
  8. Fischler, M.A.; Bolles, R.C. Random sample consensus: A paradigm for model fitting with applications to image analysis and automated cartography. Commun. ACM 1981, 24, 381–395. [Google Scholar] [CrossRef]
  9. Yu, H.; Qin, Z.; Hou, J.; Saleh, M.; Li, D.; Busam, B.; Ilic, S. Rotation-invariant transformer for point cloud matching. In Proceedings of the IEEE/CVF Conference on Computer Vision and Pattern Recognition, Vancouver, BC, Canada, 17–24 June 2023; pp. 5384–5393. [Google Scholar]
  10. Yew, Z.J.; Lee, G.H. Regtr: End-to-end point cloud correspondences with transformers. In Proceedings of the IEEE/CVF Conference on Computer Vision and Pattern Recognition, New Orleans, LA, USA, 18–24 June 2022; pp. 6677–6686. [Google Scholar]
  11. Wu, Y.; Zhang, Y.; Ma, W.; Gong, M.; Fan, X.; Zhang, M.; Qin, A.; Miao, Q. Rornet: Partial-to-partial registration network with reliable overlapping representations. IEEE Trans. Neural Netw. Learn. Syst. 2023. [Google Scholar] [CrossRef] [PubMed]
  12. Zhao, Y.; Chen, L.; Hu, B.; Wang, H.; Ren, M. HR-Net: Point cloud registration with hierarchical coarse-to-fine regression network. Comput. Electr. Eng. 2024, 113, 109056. [Google Scholar] [CrossRef]
  13. Wang, H.; Liu, Y.; Hu, Q.; Wang, B.; Chen, J.; Dong, Z.; Guo, Y.; Wang, W.; Yang, B. Roreg: Pairwise point cloud registration with oriented descriptors and local rotations. IEEE Trans. Pattern Anal. Mach. Intell. 2023, 45, 10376–10393. [Google Scholar] [CrossRef] [PubMed]
  14. Thomas, H.; Qi, C.R.; Deschaud, J.E.; Marcotegui, B.; Goulette, F.; Guibas, L.J. Kpconv: Flexible and deformable convolution for point clouds. In Proceedings of the IEEE/CVF International Conference on Computer Vision, Seoul, Republic of Korea, 27 October–2 November 2019; pp. 6411–6420. [Google Scholar]
  15. Qi, C.R.; Su, H.; Mo, K.; Guibas, L.J. Pointnet: Deep learning on point sets for 3D classification and segmentation. In Proceedings of the IEEE Conference on Computer Vision and Pattern Recognition, Honolulu, HI, USA, 21–26 July 2017; pp. 652–660. [Google Scholar]
  16. Arya, S.; Mount, D.M.; Netanyahu, N.S.; Silverman, R.; Wu, A.Y. ANN: A library for approximate nearest neighbor searching. ACM Trans. Math. Softw. (TOMS) 1999, 26, 469–483. [Google Scholar]
  17. Huang, S.; Gojcic, Z.; Usvyatsov, M.; Wieser, A.; Schindler, K. Predator: Registration of 3d point clouds with low overlap. In Proceedings of the IEEE/CVF Conference on Computer Vision and Pattern Recognition, Nashville, TN, USA, 19–25 June 2021; pp. 4267–4276. [Google Scholar]
  18. Li, J.; Chen, B.M.; Lee, G.H. SO-Net: Self-organizing network for point cloud analysis. In Proceedings of the 2018 IEEE/CVF Conference on Computer Vision and Pattern Recognition, Salt Lake City, UT, USA, 18–23 June 2018; pp. 9397–9406. [Google Scholar]
  19. Vaswani, A.; Shazeer, N.; Parmar, N.; Uszkoreit, J.; Jones, L.; Gomez, A.N.; Kaiser, Ł.; Polosukhin, I. Attention is all you need. Adv. Neural Inf. Process. Syst. 2017, 30. [Google Scholar]
  20. Rocco, I.; Cimpoi, M.; Arandjelović, R.; Torii, A.; Pajdla, T.; Sivic, J. Neighbourhood consensus networks. Adv. Neural Inf. Process. Syst. 2018, 31, 1651–1662. [Google Scholar]
  21. Sun, J.; Shen, Z.; Wang, Y.; Bao, H.; Zhou, X. LoFTR: Detector-free local feature matching with transformers. In Proceedings of the IEEE/CVF Conference on Computer Vision and Pattern Recognition, Nashville, TN, USA, 19–25 June 2021; pp. 8922–8931. [Google Scholar]
  22. Kabsch, W. A solution for the best rotation to relate two sets of vectors. Acta Crystallogr. Sect. A Cryst. Phys. Diffr. Theor. Gen. Crystallogr. 1976, 32, 922–923. [Google Scholar] [CrossRef]
  23. Umeyama, S. Least-squares estimation of transformation parameters between two point patterns. IEEE Trans. Pattern Anal. Mach. Intell. 1991, 13, 376–380. [Google Scholar] [CrossRef]
  24. Lu, F.; Chen, G.; Liu, Y.; Zhang, L.; Qu, S.; Liu, S.; Gu, R. Hregnet: A hierarchical network for large-scale outdoor lidar point cloud registration. In Proceedings of the IEEE/CVF International Conference on Computer Vision, Montreal, BC, Canada, 11–17 October 2021; pp. 16014–16023. [Google Scholar]
  25. Zeng, A.; Song, S.; Nießner, M.; Fisher, M.; Xiao, J.; Funkhouser, T. 3dmatch: Learning local geometric descriptors from rgb-d reconstructions. In Proceedings of the IEEE Conference on Computer Vision and Pattern Recognition, Honolulu, HI, USA, 21–26 July 2017; pp. 1802–1811. [Google Scholar]
  26. Wu, Z.; Song, S.; Khosla, A.; Yu, F.; Zhang, L.; Tang, X.; Xiao, J. 3D shapenets: A deep representation for volumetric shapes. In Proceedings of the IEEE Conference on Computer Vision and Pattern Recognition, Boston, MA, USA, 7–12 June 2015; pp. 1912–1920. [Google Scholar]
  27. Yew, Z.J.; Lee, G.H. Rpm-net: Robust point matching using learned features. In Proceedings of the IEEE/CVF Conference on Computer Vision and Pattern Recognition, Seattle, WA, USA, 13–19 June 2020; pp. 11824–11833. [Google Scholar]
  28. Bai, X.; Luo, Z.; Zhou, L.; Fu, H.; Quan, L.; Tai, C.L. D3feat: Joint learning of dense detection and description of 3d local features. In Proceedings of the IEEE/CVF Conference on Computer Vision and Pattern Recognition, Seattle, WA, USA, 13–19 June 2020; pp. 6359–6367. [Google Scholar]
  29. Gojcic, Z.; Zhou, C.; Wegner, J.D.; Wieser, A. The perfect match: 3d point cloud matching with smoothed densities. In Proceedings of the IEEE/CVF Conference on Computer Vision and Pattern Recognition, Long Beach, CA, USA, 15–20 June 2019; pp. 5545–5554. [Google Scholar]
  30. Xu, H.; Liu, S.; Wang, G.; Liu, G.; Zeng, B. Omnet: Learning overlapping mask for partial-to-partial point cloud registration. In Proceedings of the IEEE/CVF International Conference on Computer Vision, Nashville, TN, USA, 19–25 June 2021; pp. 3132–3141. [Google Scholar]
  31. Choy, C.; Dong, W.; Koltun, V. Deep global registration. In Proceedings of the IEEE/CVF Conference on Computer Vision and Pattern Recognition, Seattle, WA, USA, 13–19 June 2020; pp. 2514–2523. [Google Scholar]
  32. Cao, A.Q.; Puy, G.; Boulch, A.; Marlet, R. PCAM: Product of cross-attention matrices for rigid registration of point clouds. In Proceedings of the IEEE/CVF International Conference on Computer Vision, Nashville, TN, USA, 19–25 June 2021; pp. 13229–13238. [Google Scholar]
  33. Aoki, Y.; Goforth, H.; Srivatsan, R.A.; Lucey, S. Pointnetlk: Robust & efficient point cloud registration using pointnet. In Proceedings of the IEEE/CVF Conference on Computer Vision and Pattern Recognition, Long Beach, CA, USA, 15–20 June 2019; pp. 7163–7172. [Google Scholar]
  34. Wang, Y.; Solomon, J.M. Deep closest point: Learning representations for point cloud registration. In Proceedings of the IEEE/CVF International Conference on Computer Vision, Seoul, Republic of Korea, 27 October–2 November 2019; pp. 3523–3532. [Google Scholar]
Figure 1. Our TTReg predicts dense correspondences in the overlap region and estimates the transformation of point clouds with regions of low overlap. Points in red and green represent point clouds P 0 and Q 0 , respectively, and gray lines represent the relationship of correspondences.
Remotesensing 16 01898 g001
Figure 2. Overview of our TTReg architecture. F 4 P and F 4 Q are features of superpoints P 4 and Q 4 . F 2 P and F 2 Q represent features of dense points P 2 and Q 2 . Our RIG-Transformer serves as the superpoint matching module for selecting the optimal matching superpoint pairs C ^ s within the overlap area. The point matching module encodes the feature F 2 P and F 2 Q of dense points P 2 and Q 2 corresponding to C ^ s , and predicts the dense correspondences C ^ d . Finally, the relative transformation matrices R ^ and t ^ are calculated utilizing dense correspondences C ^ d .
Remotesensing 16 01898 g002
Figure 3. The selection of a superpoint and its corresponding dense points. (a) represents the selected dense matching point cloud block with a relatively large overlapping region, while (b) and (j) represent dense point cloud blocks with no or small overlapping region.
Remotesensing 16 01898 g003
Figure 4. Overview of our RIG-Transformer module: (a) depicts an overall computation of the RIG-Transformer module, (b,c) depict the RIG-self-attention and RIG-cross-attention.
Remotesensing 16 01898 g004
Figure 5. The dense matching module structure: (a) depicts the overall computation of the dense matching module, (b,c) depict the calculation of the self-attention and cross-attention modules.
Remotesensing 16 01898 g005
Figure 6. The overview of output decoder structure and transformation calculation.
Remotesensing 16 01898 g006
Figure 7. The evaluation curves during the training process for 3DMatch (ac) and ModelNet (df).
Remotesensing 16 01898 g007
Figure 8. The performance of our method on 3DLoMath. Each column corresponds to different pairs of point clouds. The red and green points signify point clouds P 0 and Q 0 . Row (a) shows the superpoint correspondences obtained by the baseline, row (b) displays the dense point correspondences computed by our method, row (c) illustrates the registration of the baseline, row (d) depicts the registration of our method, and row (e) showcases the registration using ground truth poses.
Remotesensing 16 01898 g008
Figure 9. The performance of our method on ModelLoNet. Columns correspond to different point cloud pairs. The red and green points signify point cloud P 0 and Q 0 . Row (a) shows the superpoint correspondences obtained by the baseline method, row (b) displays the dense point correspondences computed by our method, row (c) illustrates the registration of the baseline, row (d) depicts the registration of our method, and row (e) showcases the registration using ground truth poses.
Remotesensing 16 01898 g009
Figure 10. The impact of RIG-Transformer layer L s on registration performance during the training process for 3DMatch (ac) and ModelNet (df).
Remotesensing 16 01898 g010
Figure 11. Predicted 3DLoMatch overlap area. Points in red and green represent point clouds P 0 and Q 0 , respectively; gray lines represent the connection relationship between corresponding points. The first row (a) shows the correspondence of sparse matching keypoints from the baseline, and the second row (b) displays the correspondence of dense points predicted by our model located in the overlapping area, with each row representing a pair of point clouds to be matched.
Remotesensing 16 01898 g011
Figure 12. Predicted ModelLoNet overlap area, where points in red represent point cloud P 0 , points in green represent point cloud Q 0 , and gray lines represent the relationship between corresponding points. The first row (a) shows the correspondence of sparse matching keypoints from the baseline, and the second row (b) displays the correspondence of dense points predicted by our model located in the overlapping area, with each row representing a pair of point clouds to be matched.
Remotesensing 16 01898 g012
Table 1. The registration performance on 3DMatch and 3DLoMatch datasets.
Model3DMatch3DLoMatch
RR (%)↑RRE (°)↓RTE (m)↓RR (%)↑RRE (°)↓RTE (m)↓
3DSN [29]78.42.1990.07133.03.5280.103
FCGF [3]85.11.9490.06640.13.1470.100
D3Feat [28]81.62.1610.06737.23.3610.103
Predator-5k [17]89.02.0290.06459.83.0480.093
Predator-1k [17]90.52.0620.06862.53.1590.096
Predator-NR [17]62.72.5820.07524.05.8860.148
OMNet [30]35.94.1660.1058.47.2990.151
DGR [31]85.32.1030.06748.73.9540.113
PCAM [32]85.51.8080.05954.93.5290.099
RegTR [10]92.01.5670.04964.82.8270.077
HR-Net [12]93.11.4240.04467.62.5130.073
Ours93.81.4480.04373.02.2710.065
Note: ↑ represents the higher the better, ↓ indicates the lower the better, and bold font represents the best.
Table 2. The registration performance on ModelNet and ModelLoNet datasets.
ModelModelNetModelLoNet
RR (%)↑RRE (°)↓RTE (m)↓CD (m)↓RR (%)↑RRE (°)↓RTE (m)↓CD (m)↓
PointNetLK [33]-29.7250.2970.02350-48.5670.5070.0367
OMNet [30]-2.94700.0320.00150-6.51700.1290.0074
DCP-v2 [34]-11.9750.1710.01170-16.5010.3000.0268
RPM-Net [27]-1.71200.0180.00085-7.34200.1240.0050
Predator [17]-1.73900.0190.00089-5.23500.1320.0083
RegTR [10] 96.29 * 1.47300.0140.00078 68.17 * 3.93000.0870.0037
HR-Net [12]97.71 *1.19700.0110.0007274.33 * 3.57100.0780.0034
Ours 97.24 1.35380.0110.00078 72.35 3.95800.0860.0039
Note: ↑ represents the higher the better, ↓ indicates the lower the better. - indicates that the original paper does not provide these data. * represents the results we reproduce, and bold font represents the best.
Table 3. The ablation performance on 3DMatch and 3DLoMatch datasets.
Model3DMatch3DLoMatch
RR (%)↑RRE (°)↓RTE (m)↓RR (%)↑RRE (°)↓RTE (m)↓
Baseline [10]92.01.5670.04964.82.8270.077
L s = 3 92.21.4940.04467.52.2890.070
L s = 4 93.81.5160.04571.42.2120.068
L s = 5 93.81.4480.04373.02.2710.065
Note: ↑ represents the higher the better, ↓ indicates the lower the better, and bold font represents the best.
Table 4. The ablation performance on ModelNet and ModelLoNet datasets.
ModelModelNetModelLoNet
RR (%)↑RRE (°)↓RTE (m)↓CD (m)↓RR (%)↑RRE (°)↓RTE (m)↓CD (m)↓
Baseline [10] 96.29 * 1.47300.0140.00078 68.17 * 3.93000.0870.0037
L s = 3 96.05 1.81280.0150.00086 70.14 4.56550.0890.0038
L s = 4 97.08 1.55210.0130.00083 70.77 4.22190.0860.0038
L s = 5 97.241.35380.0110.0007872.353.95800.0860.0039
Note: ↑ represents the higher the better, ↓ indicates the lower the better. * represents the results we reproduce, and bold font represents the best.
Disclaimer/Publisher’s Note: The statements, opinions and data contained in all publications are solely those of the individual author(s) and contributor(s) and not of MDPI and/or the editor(s). MDPI and/or the editor(s) disclaim responsibility for any injury to people or property resulting from any ideas, methods, instructions or products referred to in the content.

