Article

Decline in Ice Coverage and Ice-Free Period Extension in the Kara and Laptev Seas during 1979–2022

by
Pavel Shabanov
1,*,
Alexander Osadchiev
1,
Natalya Shabanova
2 and
Stanislav Ogorodov
2
1
Shirshov Institute of Oceanology, Russian Academy of Sciences, 36 Nakhimovsky Avenue, Moscow 117997, Russia
2
Laboratory of Geoecology of the North, Faculty of Geography, Lomonosov Moscow State University, GSP-1, Leninskie Gory, Moscow 119991, Russia
*
Author to whom correspondence should be addressed.
Remote Sens. 2024, 16(11), 1875; https://doi.org/10.3390/rs16111875
Submission received: 29 March 2024 / Revised: 17 May 2024 / Accepted: 21 May 2024 / Published: 24 May 2024

Abstract

:
The duration of ice-free periods in different parts of the Arctic Ocean plays a great role in processes in the climate system and defines the most comfortable sea ice conditions for economic activity. Based on satellite-derived sea ice concentration data acquired by passive microwave instruments, we identified the spatial distribution of the dates of sea ice retreat (DOR), dates of sea ice advance (DOA), and the resulting ice-free period duration (IFP) between these days for the Kara and Laptev seas during 1979–2022. The monthly decline in sea ice extent was detected from June to October in both seas, i.e., during the whole ice-free period. The annual mean sea ice extent during 2011–2021 decreased by 19.0% and 12.8% relative to the long-term average during 1981–2010 in the Kara and Laptev seas, respectively. The statistically significant (95% confidence level) positive IFP trends were detected for the majority of areas of the Kara and Laptev seas. Averaged IFP trends were estimated equal to +20.2 day/decade and +16.2 day/decade, respectively. The observed DOR tendency to earlier sea ice melting plays a greater role in the total IFP extension, as compared to later sea ice formation related to the DOA tendency. We reveal that regions of inflow of warm Atlantic waters to the Kara Sea demonstrate the largest long-term trends in DOA, DOR, and IFP associated with the decrease in ice coverage, that highlights the process of atlantification. Also, the Great Siberian Polynya in the Laptev Sea is the area of the largest long-term decreasing trend in DOR.

1. Introduction

Sea ice is among the key features of the Arctic Ocean and plays a great role in the regulation of Earth’s climate. The decline in Arctic sea ice, which has been registered during the last two decades, has been addressed in many studies [1,2,3,4,5,6,7,8]. Satellite-derived sea ice concentration, which has been available since 1979, has been used to assess inter-annual variability of ice coverage and calculate the related long-term trends [9,10,11,12,13]. Ice coverage in the Arctic Ocean was relatively stable till the end of the 1990s, which was followed by a distinct negative yearly trend in ice coverage [1,10,12]. In particular, 18 minimal values of the mid-September ice extent have been registered during the last 18 years.
Many studies have demonstrated that the decline in ice coverage in the whole Arctic Ocean, as well as in its certain regions is governed by large-scale atmospheric processes including the changes in atmospheric thermodynamic forcing, advection of moist air masses, increase in downward longwave radiation, decline in snowfall, etc. [14,15,16,17,18]. Another important factor is the amplification of Arctic warming by reduced ice coverage associated with the decreased albedo, increased heat loss from the ocean, changes in cloud conditions, etc. [19,20,21,22,23,24,25].
The Kara and Laptev seas, in contrast to the Barents Sea, are completely covered by ice during winter and spring. In summer and autumn, the ice coverage in both seas has demonstrated a distinct negative trend during the two last decades [11,26]. Only some studies have focused on the inter-annual variability of ice conditions in the Kara Sea [26,27,28,29,30,31] and the Laptev Sea [31,32,33,34]. They described its dependence on atmospheric conditions mainly by straightforward statistical analysis, e.g., correlation and/or empirical orthogonal function analysis.
In this study, we also analyze the influence of external forcing conditions on the inter-annual variability of ice coverage in the Kara and Laptev seas. In contrast to previous studies, we focus on specific regional oceanographic and atmospheric processes and do not deal with general large-scale climate indices such as the North Atlantic Oscillation (NAO), Atlantic Multidecadal Oscillation (AMO), etc. These climate indices are calculated over spatial scales that are larger than the spatial scales of the water bodies we are studying. A simple comparison of NAO/AMO or other indices with sea ice time series would not provide much information on a regional scale, which is our main focus. The influence of atmospheric and oceanic changes in the Atlantic Ocean is different for the Kara and Laptev seas. Based on our expertise in regional processes, which govern the temperature of the sea surface layer in the study area, we distinguish different regions of the Kara and Laptev seas with different ice conditions. For these regions, we analyze yearly trends of earlier ice melting and later ice formation and describe their relation with the inter-annual variability of regional oceanographic and atmospheric conditions. The novelty of our research lies in the detailed description and quantitative and qualitative analysis of changes in sea ice conditions and the duration of the ice-free period in the Kara and Laptev seas on a regional scale, based on remote sensing microwave climate data records. Due to the observed decline in sea ice extent and the high inter-annual variability of sea ice conditions, comprehensive regional studies are necessary. And such studies are difficult to imagine without the basic statistical analysis provided by our research.
This paper is organized as follows. In Section 2, we describe the features of the study area and provide general information about the satellite sea ice concentration and extent datasets used in this study. Also the procedure of ice-free period detection is described in Section 2. In Section 3, the detailed analysis of ice-free period key dates and duration (long-terms means and trends), as well as spatial distribution of these parameters in the Kara and Laptev Seas, are provided. The discussion is given in Section 4 followed by the summary and conclusions in Section 5.

2. Materials and Methods

2.1. Study Area

The regional boundaries of the Kara and Laptev seas applied in this work are similar to those used in many other studies [35,36] and were taken from [37]. In accordance with the National Snow and Ice Data Center’s (NSIDC) polar stereographic projection, 1431 and 1329 cells from an irregular grid were selected to describe ice-free period key dates in the Kara and Laptev seas, respectively. Using annual data, the long-term annual means (LTM) and linear trends were calculated for every grid cell. The LTMs were also spatially averaged over the whole sea domains to provide averaged statistics for both seas. Linear trends were estimated by the least-squares best fit and tested with the original two-tailed t-test for the null hypothesis of no trend against the alternative of a trend significant at the 5% level. The chosen 95% confidence level (or 5% significance level) is good because it strikes a balance between accuracy and conservatism. A higher confidence level, such as 99% (1% significance level), would provide a more conservative estimate of potential decline but may not reflect the true risks for economic activity or biological sustainability. On the other hand, a lower confidence level, such as 90%, would provide a more optimistic estimate of potential sea ice losses but may not adequately account for severe and extreme events. Also, a 95% confidence level aligns with academic standards and regulatory requirements, making it easier to compare and evaluate risks across different studies. Confidence levels of 99% and especially 99.5% seem too high to us for adequate statistical description.

2.2. Sea Ice Concentration Data

For the 1979–2022 period, the following annual ice-free period characteristics were calculated: dates of sea ice retreat (DOR), dates of sea ice advance (DOA), and the total ice-free period duration (IFP), defined as the number of days between the DOA and DOR. The DOR and DOA were identified using the daily sea ice concentration (SIC) time series from the NOAA/NSIDC Climate Data Record of Passive Microwave Daily Northern Hemisphere Sea Ice Concentration dataset, NSIDC-G02202, version 4 [38]. The dataset is based on observations from NASA’s Scanning Multichannel Microwave Radiometer (SMMR), and the series of the Defense Meteorological Satellite Program’s (DMSP) Special Sensor Microwave Imager (SSM/I) and Special Sensor Microwave Imager/Sounder (SSMIS) sensors.
SIC data in this dataset were calculated from a combination of ice concentration estimates from state-of-the-art algorithms, namely, the NASA Team algorithm [39] and the NASA Bootstrap algorithm [40]. The NSIDC-G02202, version 4, dataset covers the time period from 1979 to 2022 with a spatial resolution of 25 km. Monthly data from the NSIDC Sea Ice Index, G02135, version 3 [41], were used to estimate the sea ice extent (SIE, the summed area of grid cells where SIC ≥ 15%) changes in both seas during 1979–2022. The dataset provides monthly SIE values for the Arctic seas, including the Kara and Laptev seas. Following NSIDC recommendations, we used SIE instead of area to analyze the sea ice decline in the Kara and Laptev seas. SIE does not require precise measurements of SIC at every grid cell, because it deals with the threshold value. Also, simply counting the grid cells that meet the threshold, which includes most grid cells within the sea ice perimeter, reduces day-to-day variability in sea ice numbers [42]. The sea ice charts from the Arctic and Antarctic Research Institute (AARI, Russia, St. Petersburg, http://old.aari.ru/odata/_d0015.php?lang=1&mod=1&yy=2024, accessed on 20 May 2024) were considered as a reference source for sea ice conditions during the melt and freeze periods in 1996–2022, with records taken every 7–10 days. The fast ice data were processed from AARI sea ice charts (http://wdc.aari.ru/datasets/d0015/arcice/, accessed on 20 May 2024). The sea ice charts are presented in SIGRID-3 format, which is close to the ESRI shapefile vector data storage format [43]. These ice charts are available from 1997 in a coarse resolution only and from 2008 in spatial resolution, as at present. We analyzed the homogeneous (in terms of used methods) period 2008–2022 to identify the fast ice long-term spatial distribution for the Kara and Laptev seas [44].

2.3. Ice-Free Period Detection Procedure

For each grid cell, SIC daily time series during 1979–2022 were calculated. DOR and DOA were determined using the 15% threshold method as described in [45,46]. This SIC threshold is commonly used to define open water cells from those covered by sea ice [40,42]. In most cases in the Kara and Laptev seas, the ice-free period could be clearly determined from SIC time series. But some annual SIC time series are complicated with several relatively small periods within the melting/freezing seasons, especially during the spring–summer season, when SIC values could drop above/below the threshold for several days. The length of these episodes varies from 1 day up to several weeks. In addition, the day-to-day noise (ranged as 0–60%) in SIC time series could be found even in September. Such outliers in SIC time series can be smoothed by filters, e.g., rolling N-days mean windows. Instead of using running means [46], we applied a 7-day boxcar running median to the SIC time series to reduce the noise, which is caused by short-term sea ice drift [47,48] or “spill-over” problems near the coastal zones [49].
In this study, we focus on the longest consecutive ice-free periods reconstructed in individual grid cells. In cases when several open water episodes during cold seasons occurred, we used a conservative approach, based on an estimation of the longest consecutive ice-free period. In particular, we selected the first day when the SIC was above/below 15% within the longest consecutive time period to define DOA/DOR. Episodes with early retreat followed by the presence of sea ice were excluded from the analysis. If DOR was registered earlier than 15 March, or DOA was registered later than 31 December, such values were also excluded.

3. Results

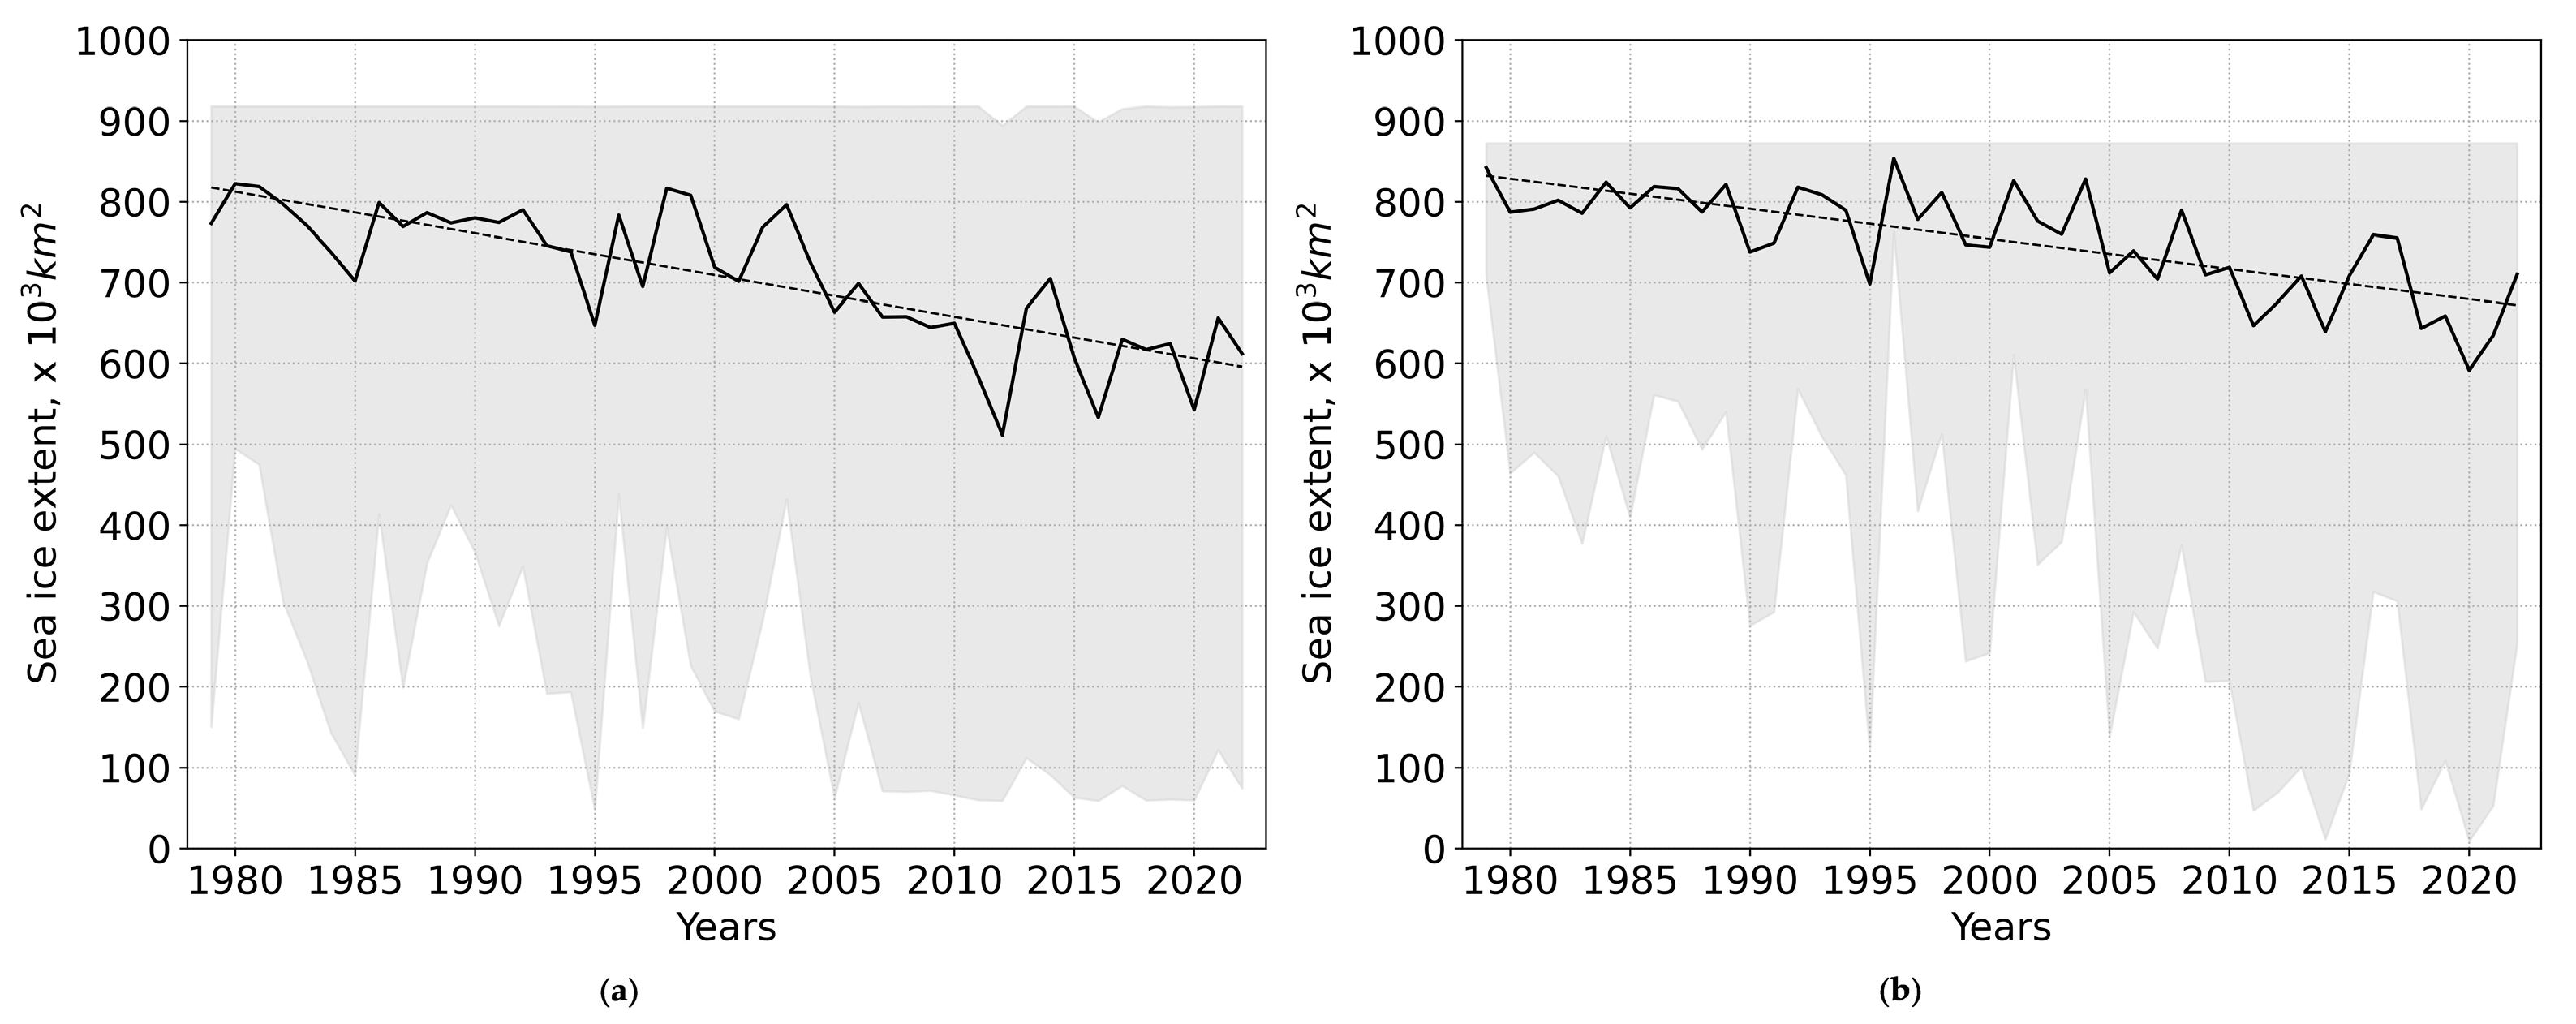
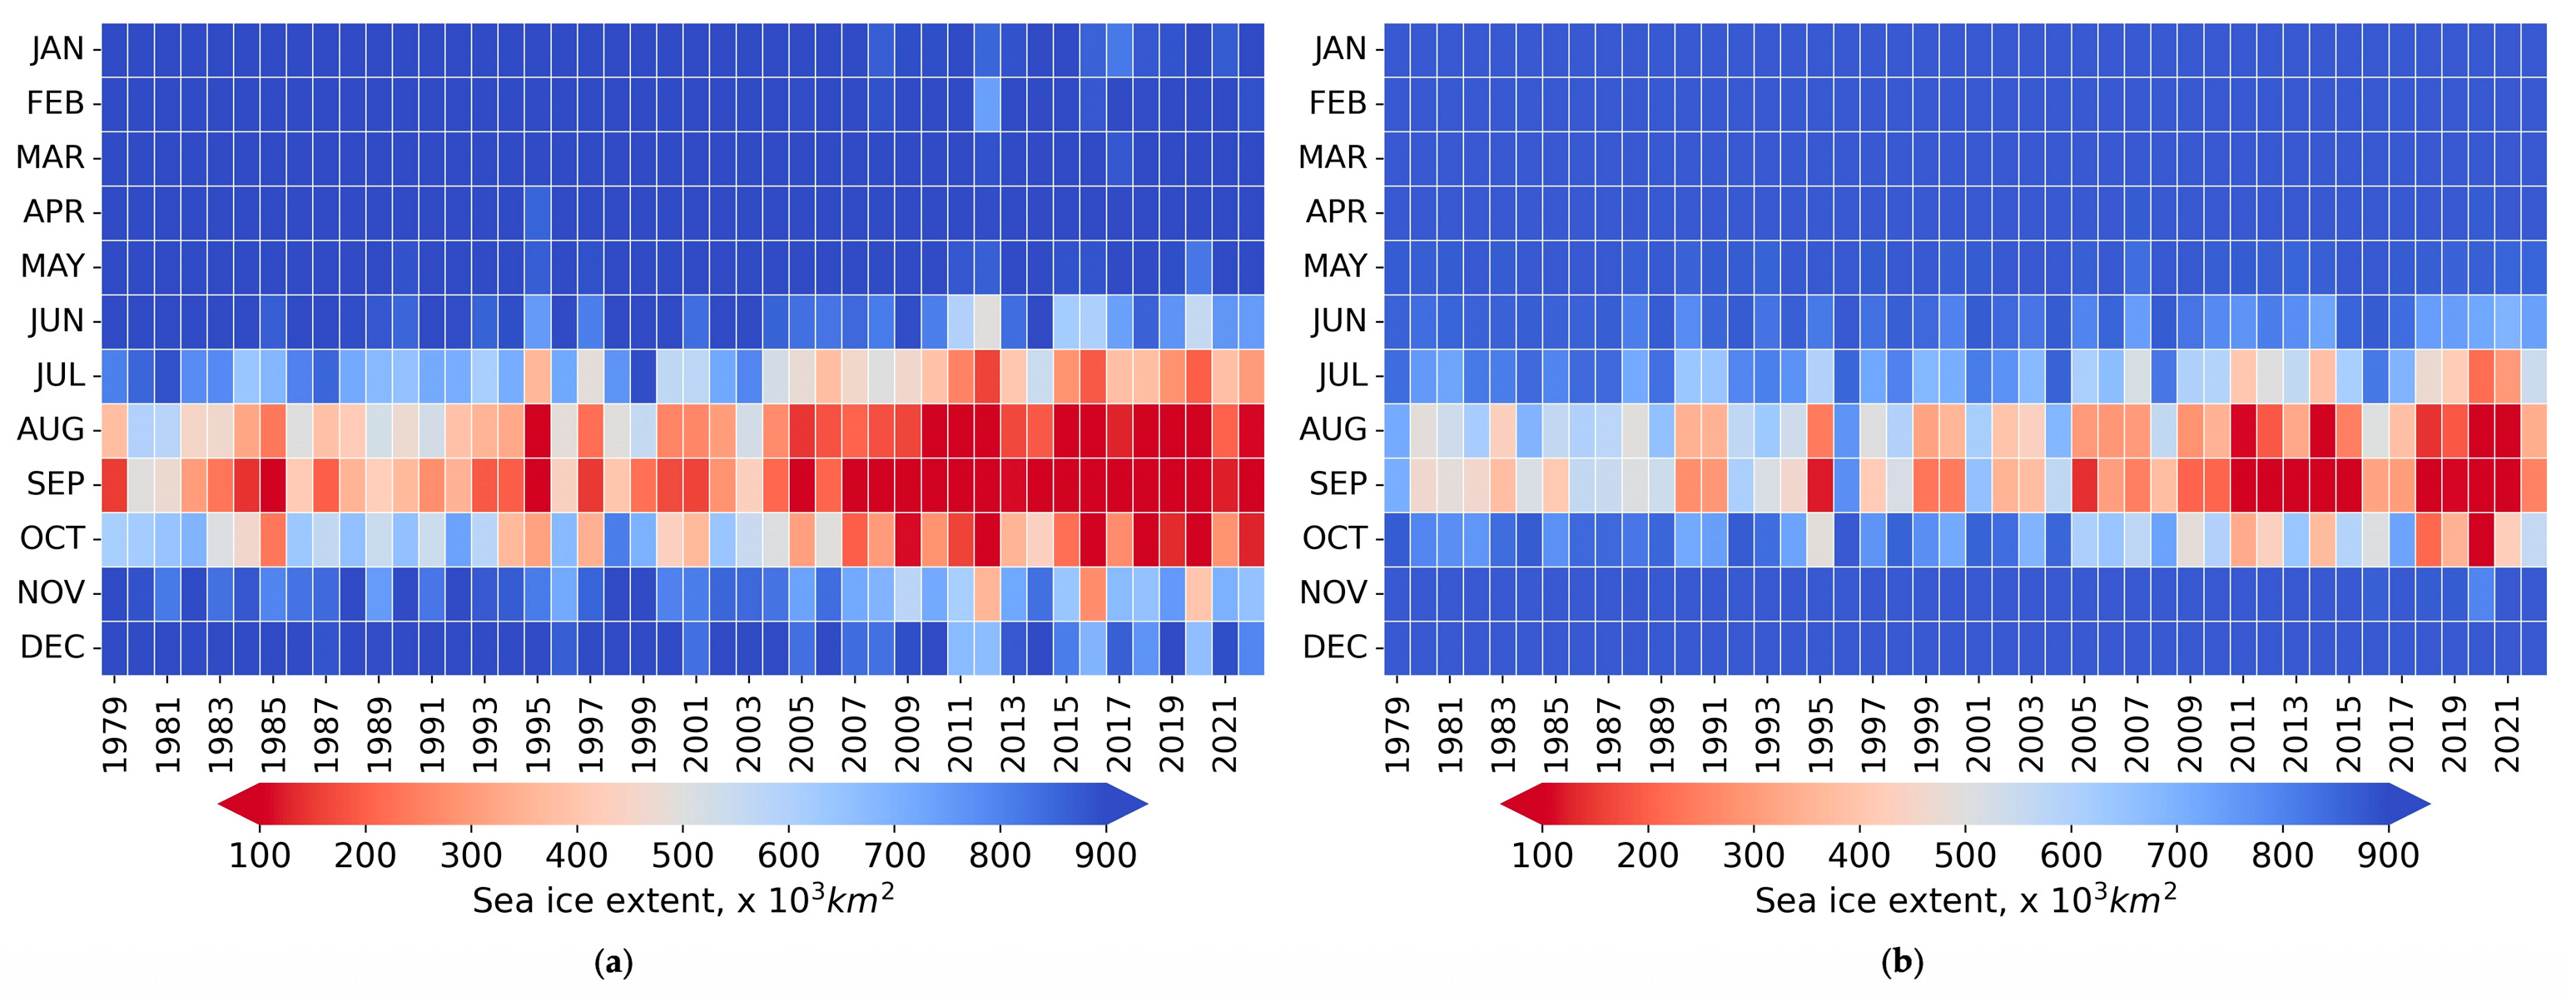
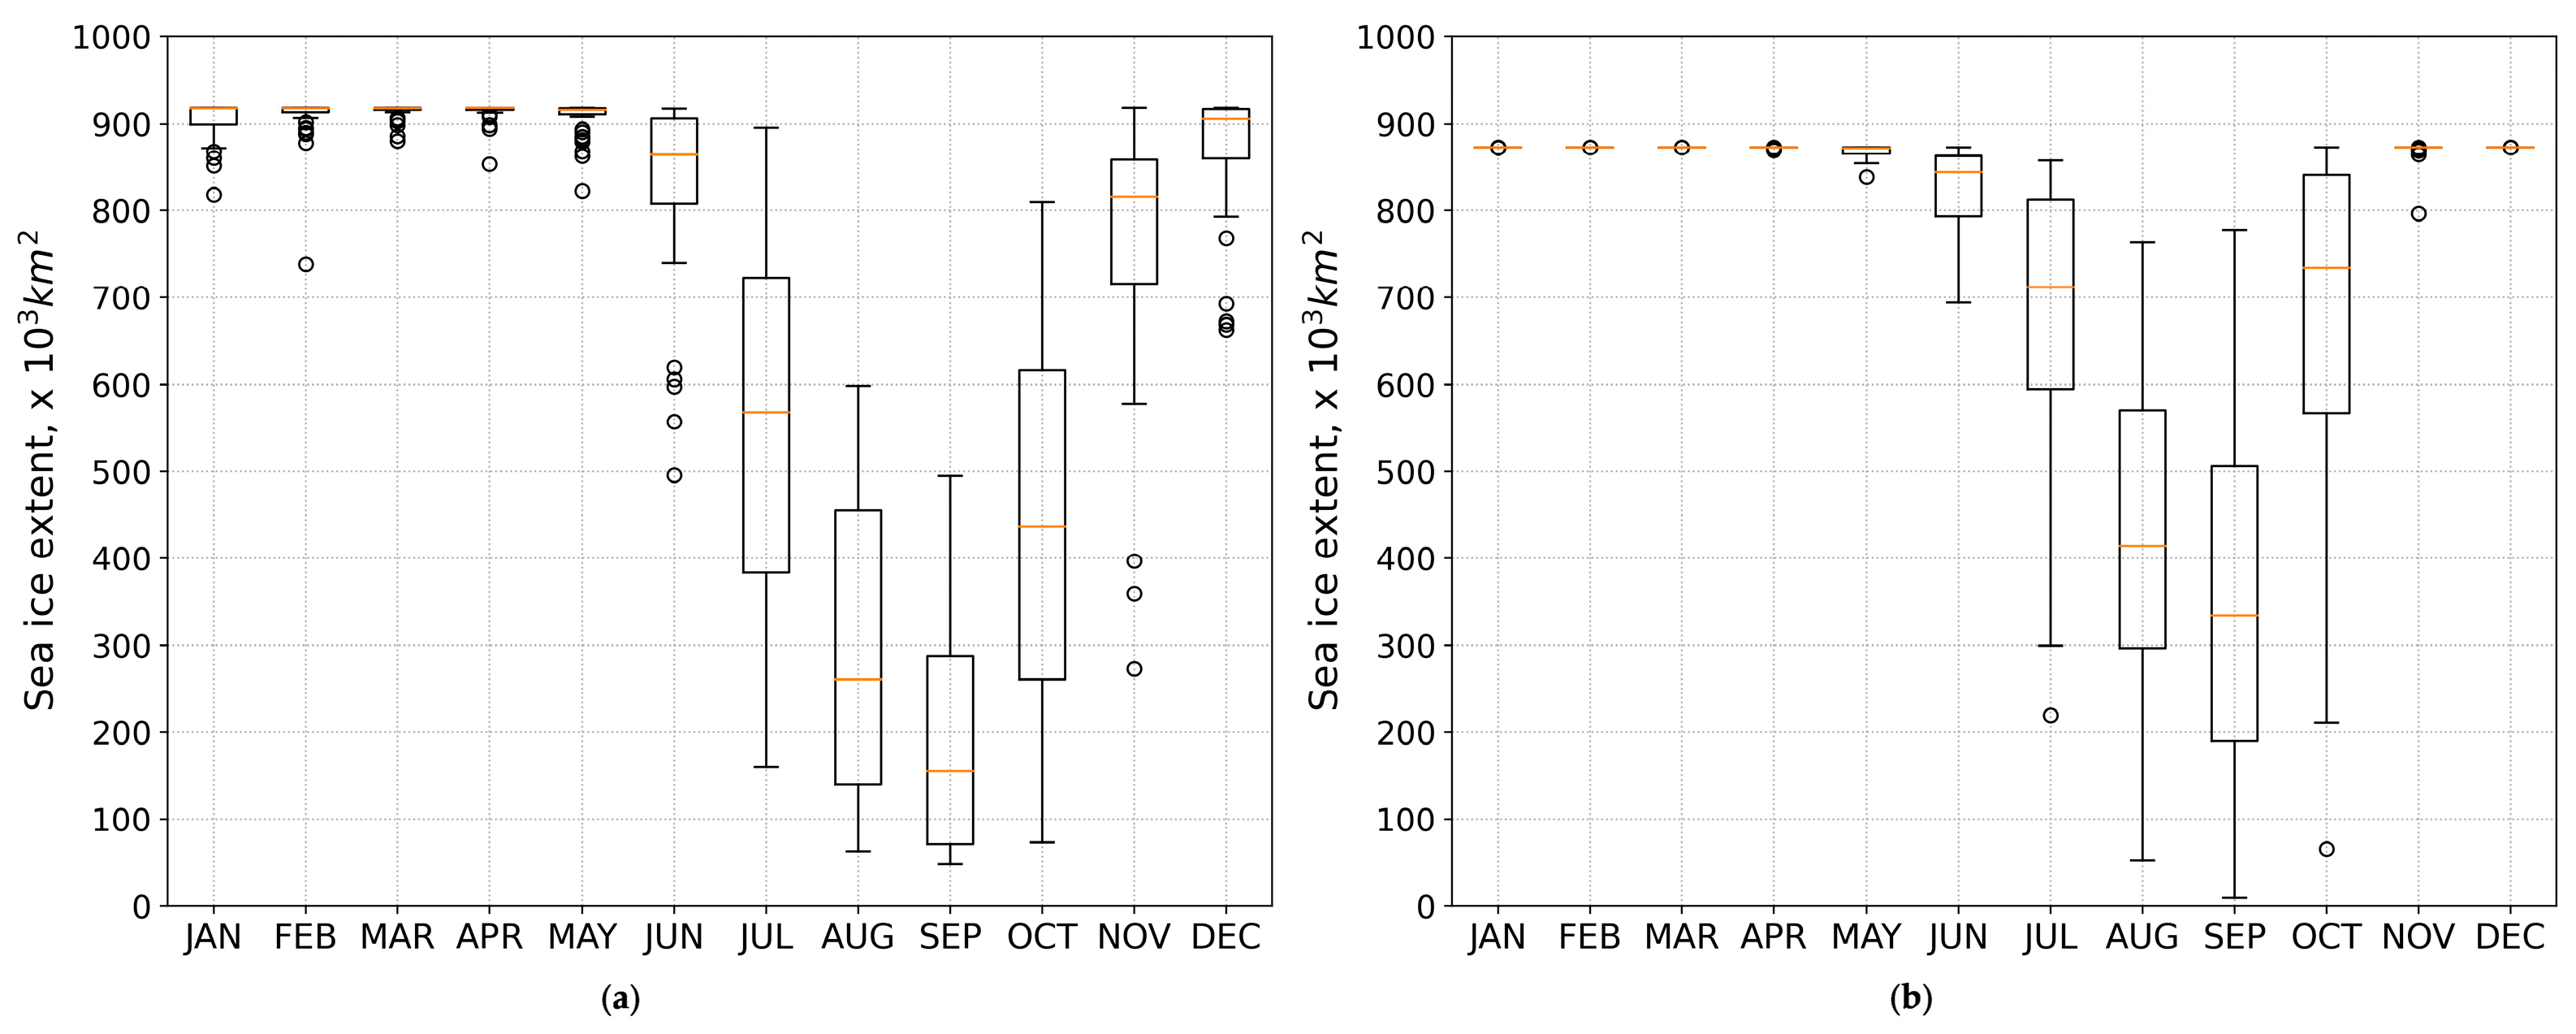
3.1. Sea Ice Extent Decline

Since 1979, SIE in the Arctic Ocean has reduced dramatically [1,11,35]. Intense SIE decline was particularly observed in the Kara and Laptev seas at the beginning of the 21st century (Figure 1). According to the NSIDC Sea Ice Index, G02135, version 3 [41], the mean SIE for the 2011–2020 period decreased by 18.7% and 12.8% relative to the long-term values during 1981–2010 in the Kara and Laptev seas, respectively. Statistically significant negative trends in annual mean SIE were found for both seas (Figure 2). More rapid decline in annual mean SIE is observed in the Kara Sea (−5.2 × 10³ km2/year) than in the Laptev Sea (−3.7 × 10³ km2/year).
In the Kara Sea, statistically significant negative trends were found in monthly SIE for all months except April, and their values vary from −0.3 × 10³ km2/year in March to −13.6 × 10³ km2/year in July. In the Laptev Sea, statistically significant negative trends were found in monthly SIE from May till October. SIE monthly linear trends vary from −0.2 × 10³ km2 in May to −11.5 × 10³ km2/year in October (Figure 3). The negative trends are grouped near September with very similar values, namely, −10.3 × 10³ km2/year in August, −11.2 × 10³ km2/year in September and −11.5 × 10³ km2/year in October.
The monthly distribution of SIE trends in the Kara Sea could be described by a “W-shaped” form, while in the Laptev Sea this distribution has a “U-shaped” form. Relatively weak SIE monthly trends in September in the Kara Sea could be interpreted as a relative melting limit under very low sea ice area and volume. In the Laptev Sea, every next month within the ice-free period shows higher SIE trends until November, followed by low changes in December (Figure 3).
In the Laptev Sea, the highest inter-annual variability of the monthly mean SIE is observed in August and September (standard deviation is 191.4 × 10³ km2 and 202.1 × 10³ km2, respectively), while the greatest variability of the monthly mean SIE in the Kara Sea is detected in July and October (standard deviation is 210.4 × 10³ km2 and 212.0 × 10³ km2, respectively) (Figure 4).

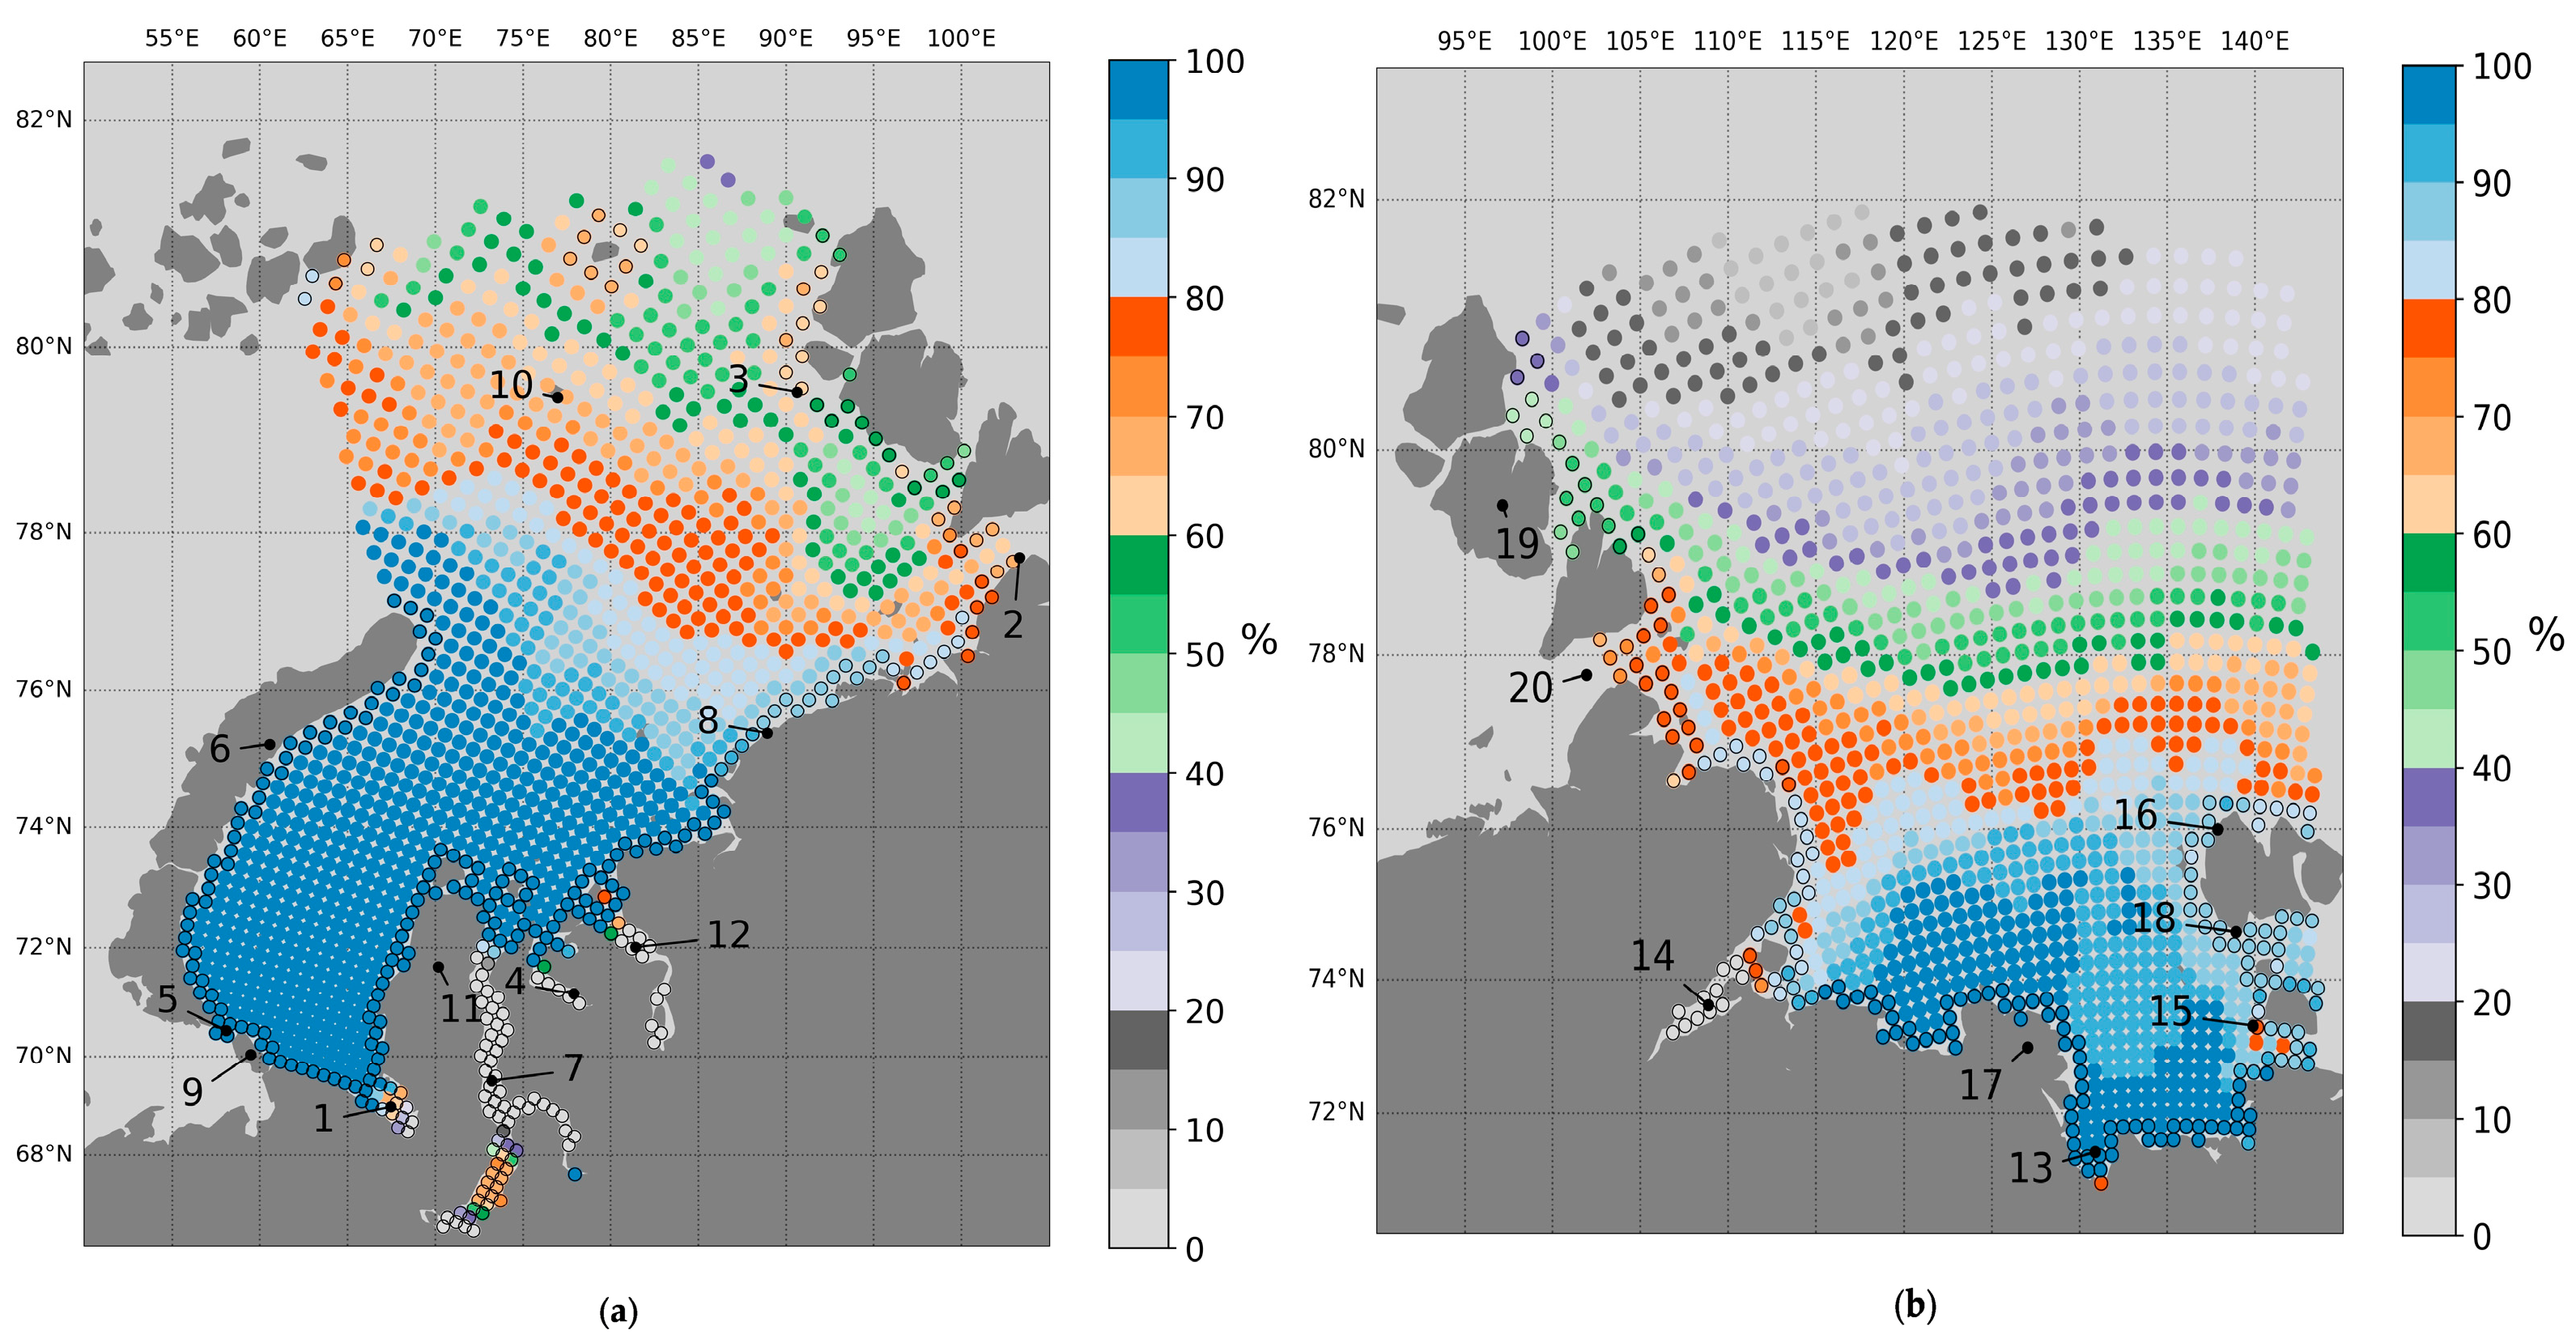
3.2. Frequency of Annual Sea Ice Retreat

The rapid increasing of the ice-free area in the Arctic Ocean in summer accelerated in the 2000s. After 2007, more than 50% of the Arctic Ocean became free from sea ice during warm seasons [50]. However, the regions to the north of 75° N in the Kara Sea and especially in the Laptev Sea did not become totally ice-free every year. Using SIC data from the NSIDC G02202 archive, we estimated the frequency of annual sea ice retreat during 1979–2022 in the Kara and Laptev seas. The frequency of annual sea ice retreat is the ratio of the number of years when the open water season was at least 10 days to the total number of years covered by observations (44 years for the 1979–2022 period). This ratio is expressed as a percentage and is shown in Figure 5.
The resulting frequency of annual sea ice retreat has a sub-latitudinal distribution for both seas and decreases from south to north. Near the shoreline, the regular retreat is observed, i.e., the frequency of annual sea ice retreat is 100% (Figure 5).
According to coastal observations of sea ice at stationary polar stations in the Laptev Sea (Figure 5), the frequency of annual retreat during 1985–2015 for the Sannikov Strait is 80%, for the Kotelny it is 80%, and for the Kigilyah it is 93% [51]. In the Kara Sea, the frequency of annual retreat for the same time period for the Sterlegova station is 87%, for the Vize it is 50%, for the Golomyanniy it is 40%, and for the Cheluskin it is 49% [52]. These examples show that, even during the past four decades when sea ice has been observed to be declining, the northern Arctic regions can still be covered by sea ice for the entire warm season in certain years. In comparison, the same frequency, but for longer periods, for the Cheluskin (1946–2015) is 49%, for the Vize (1933–2014) it is 37%, for the Kotelny (1937–2014) it is 73%, and for the Kigilyah (1935–2014) it is 86%.
Anomalously low frequencies (<40%) were observed in the Baydaratskaya Gulf, the Gulf of Ob, and the Gyda Yuribey Gulf in the Kara Sea and in Khatanga Gulf in the Laptev Sea (Figure 5). These anomalies were also found in the NSIDC Sea Ice Index images, but not proved by sea ice charts provided by AARI. Such low frequencies were marked as “invalid data” and were not taken into account for further calculations. After filtering the invalid data in the frequency of annual sea ice retreat, 1342 and 1313 grid cells for the Kara and Laptev seas, respectively, remained for the analysis of the duration of ice-free periods.

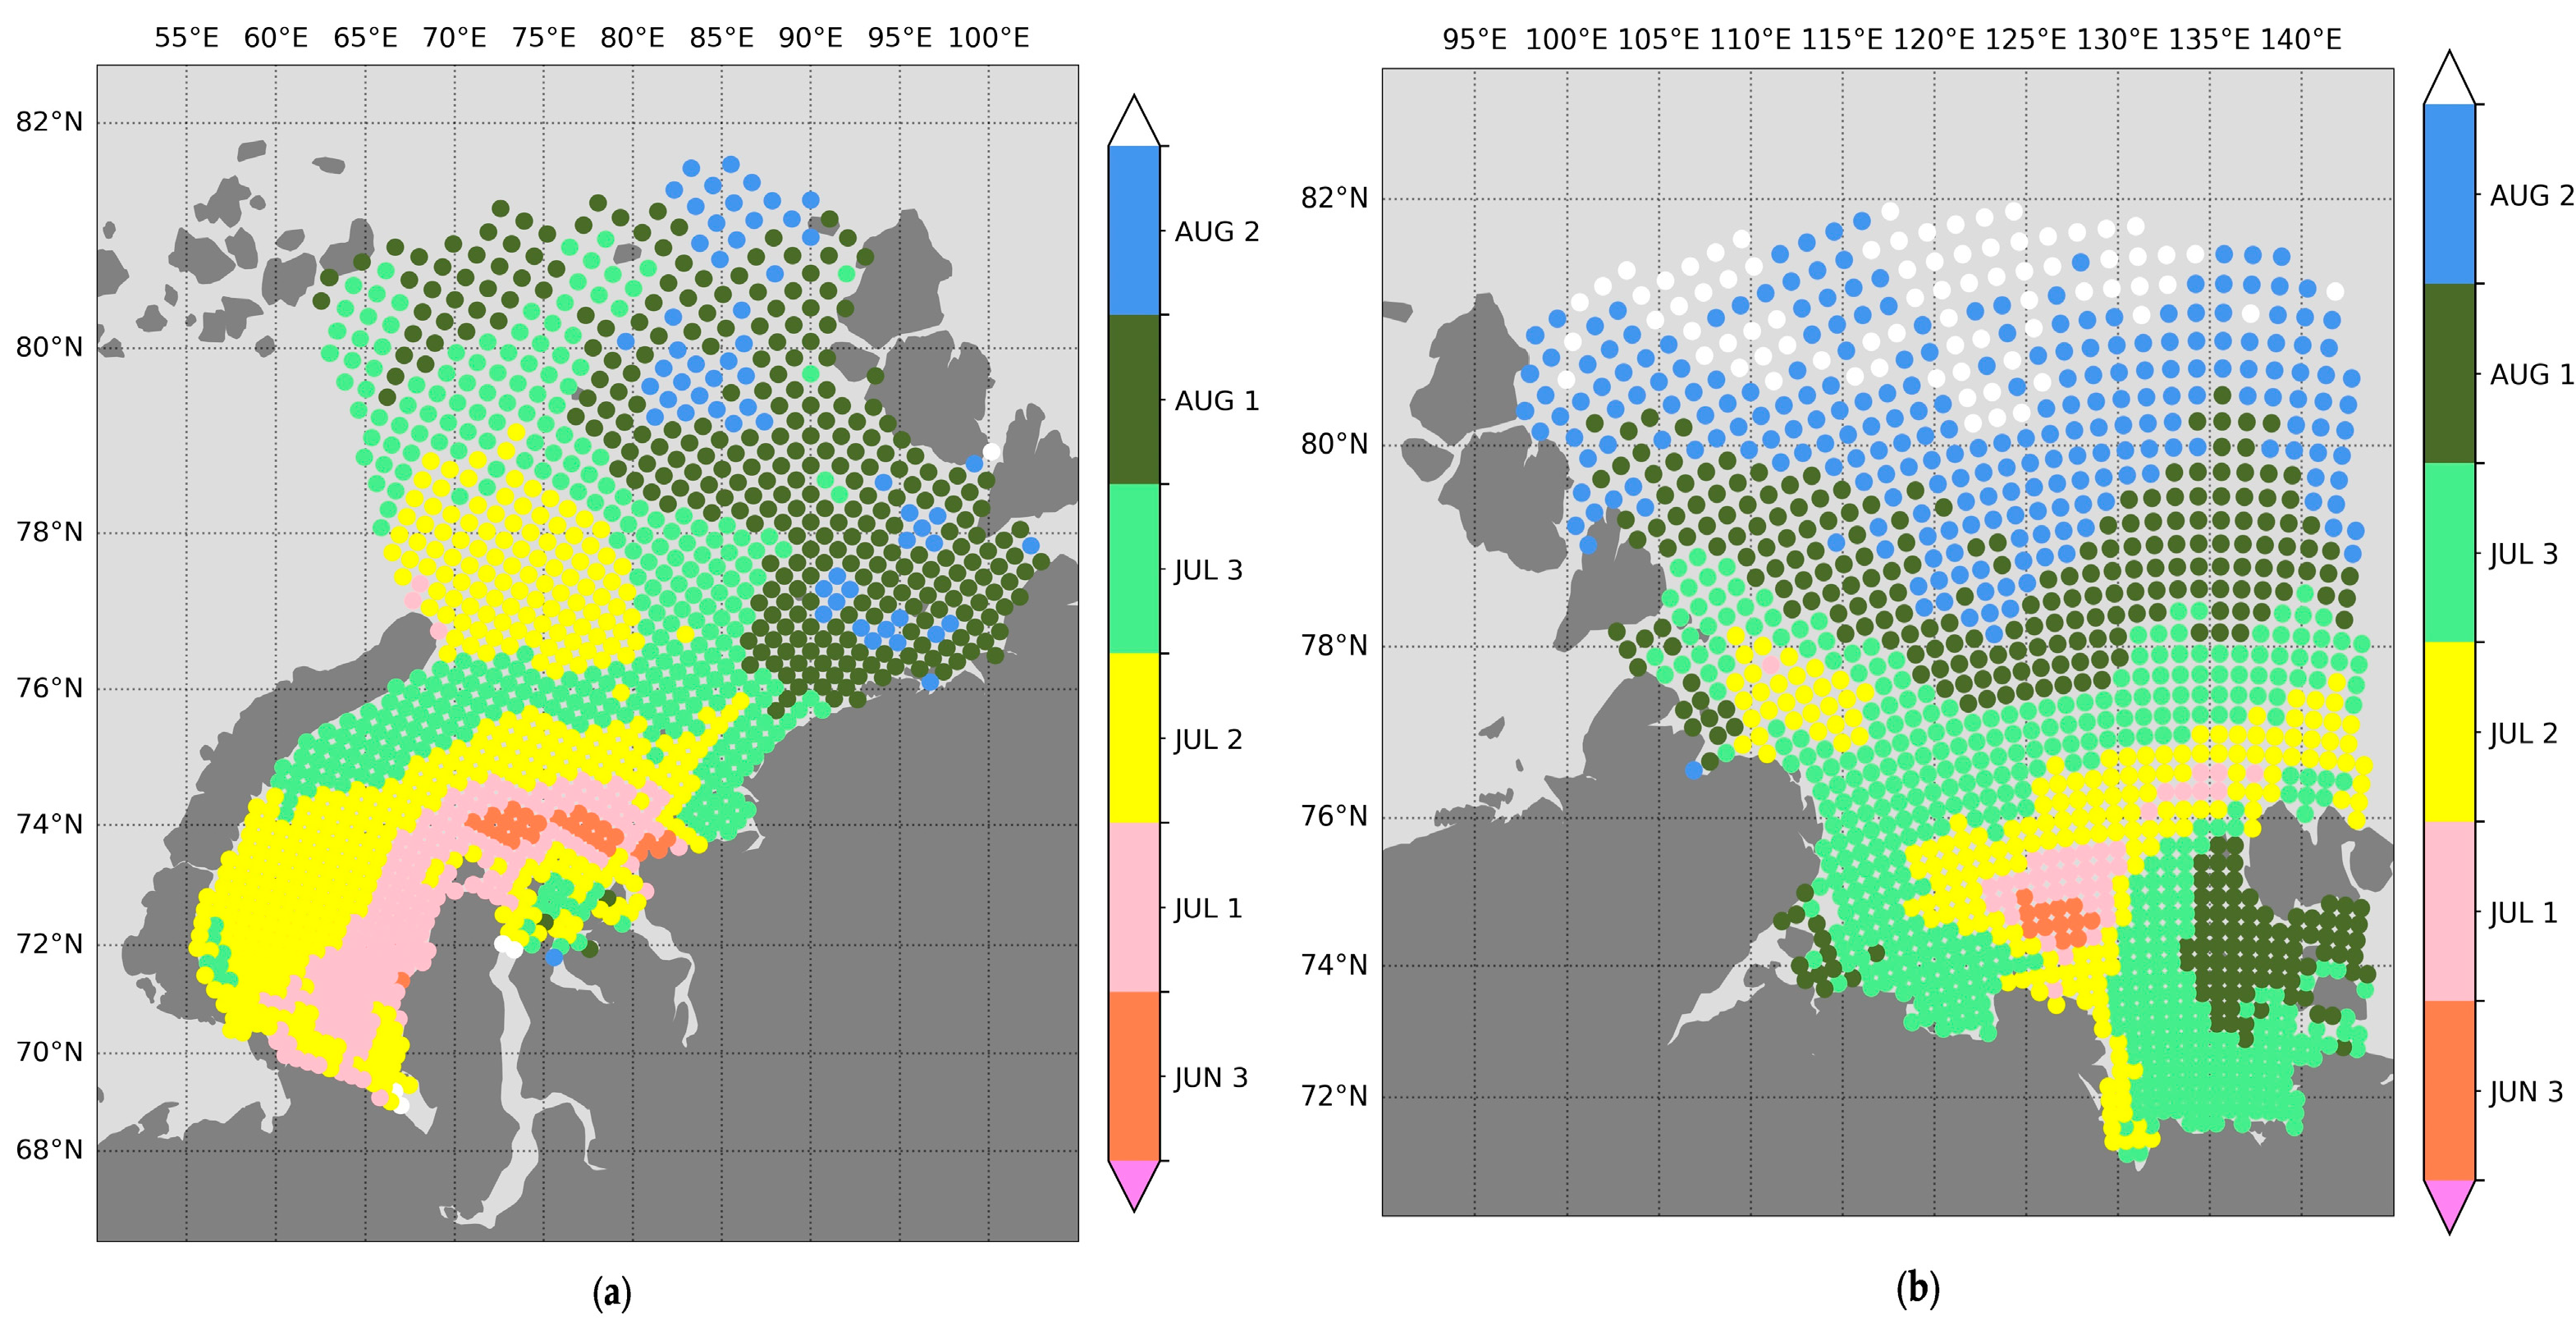
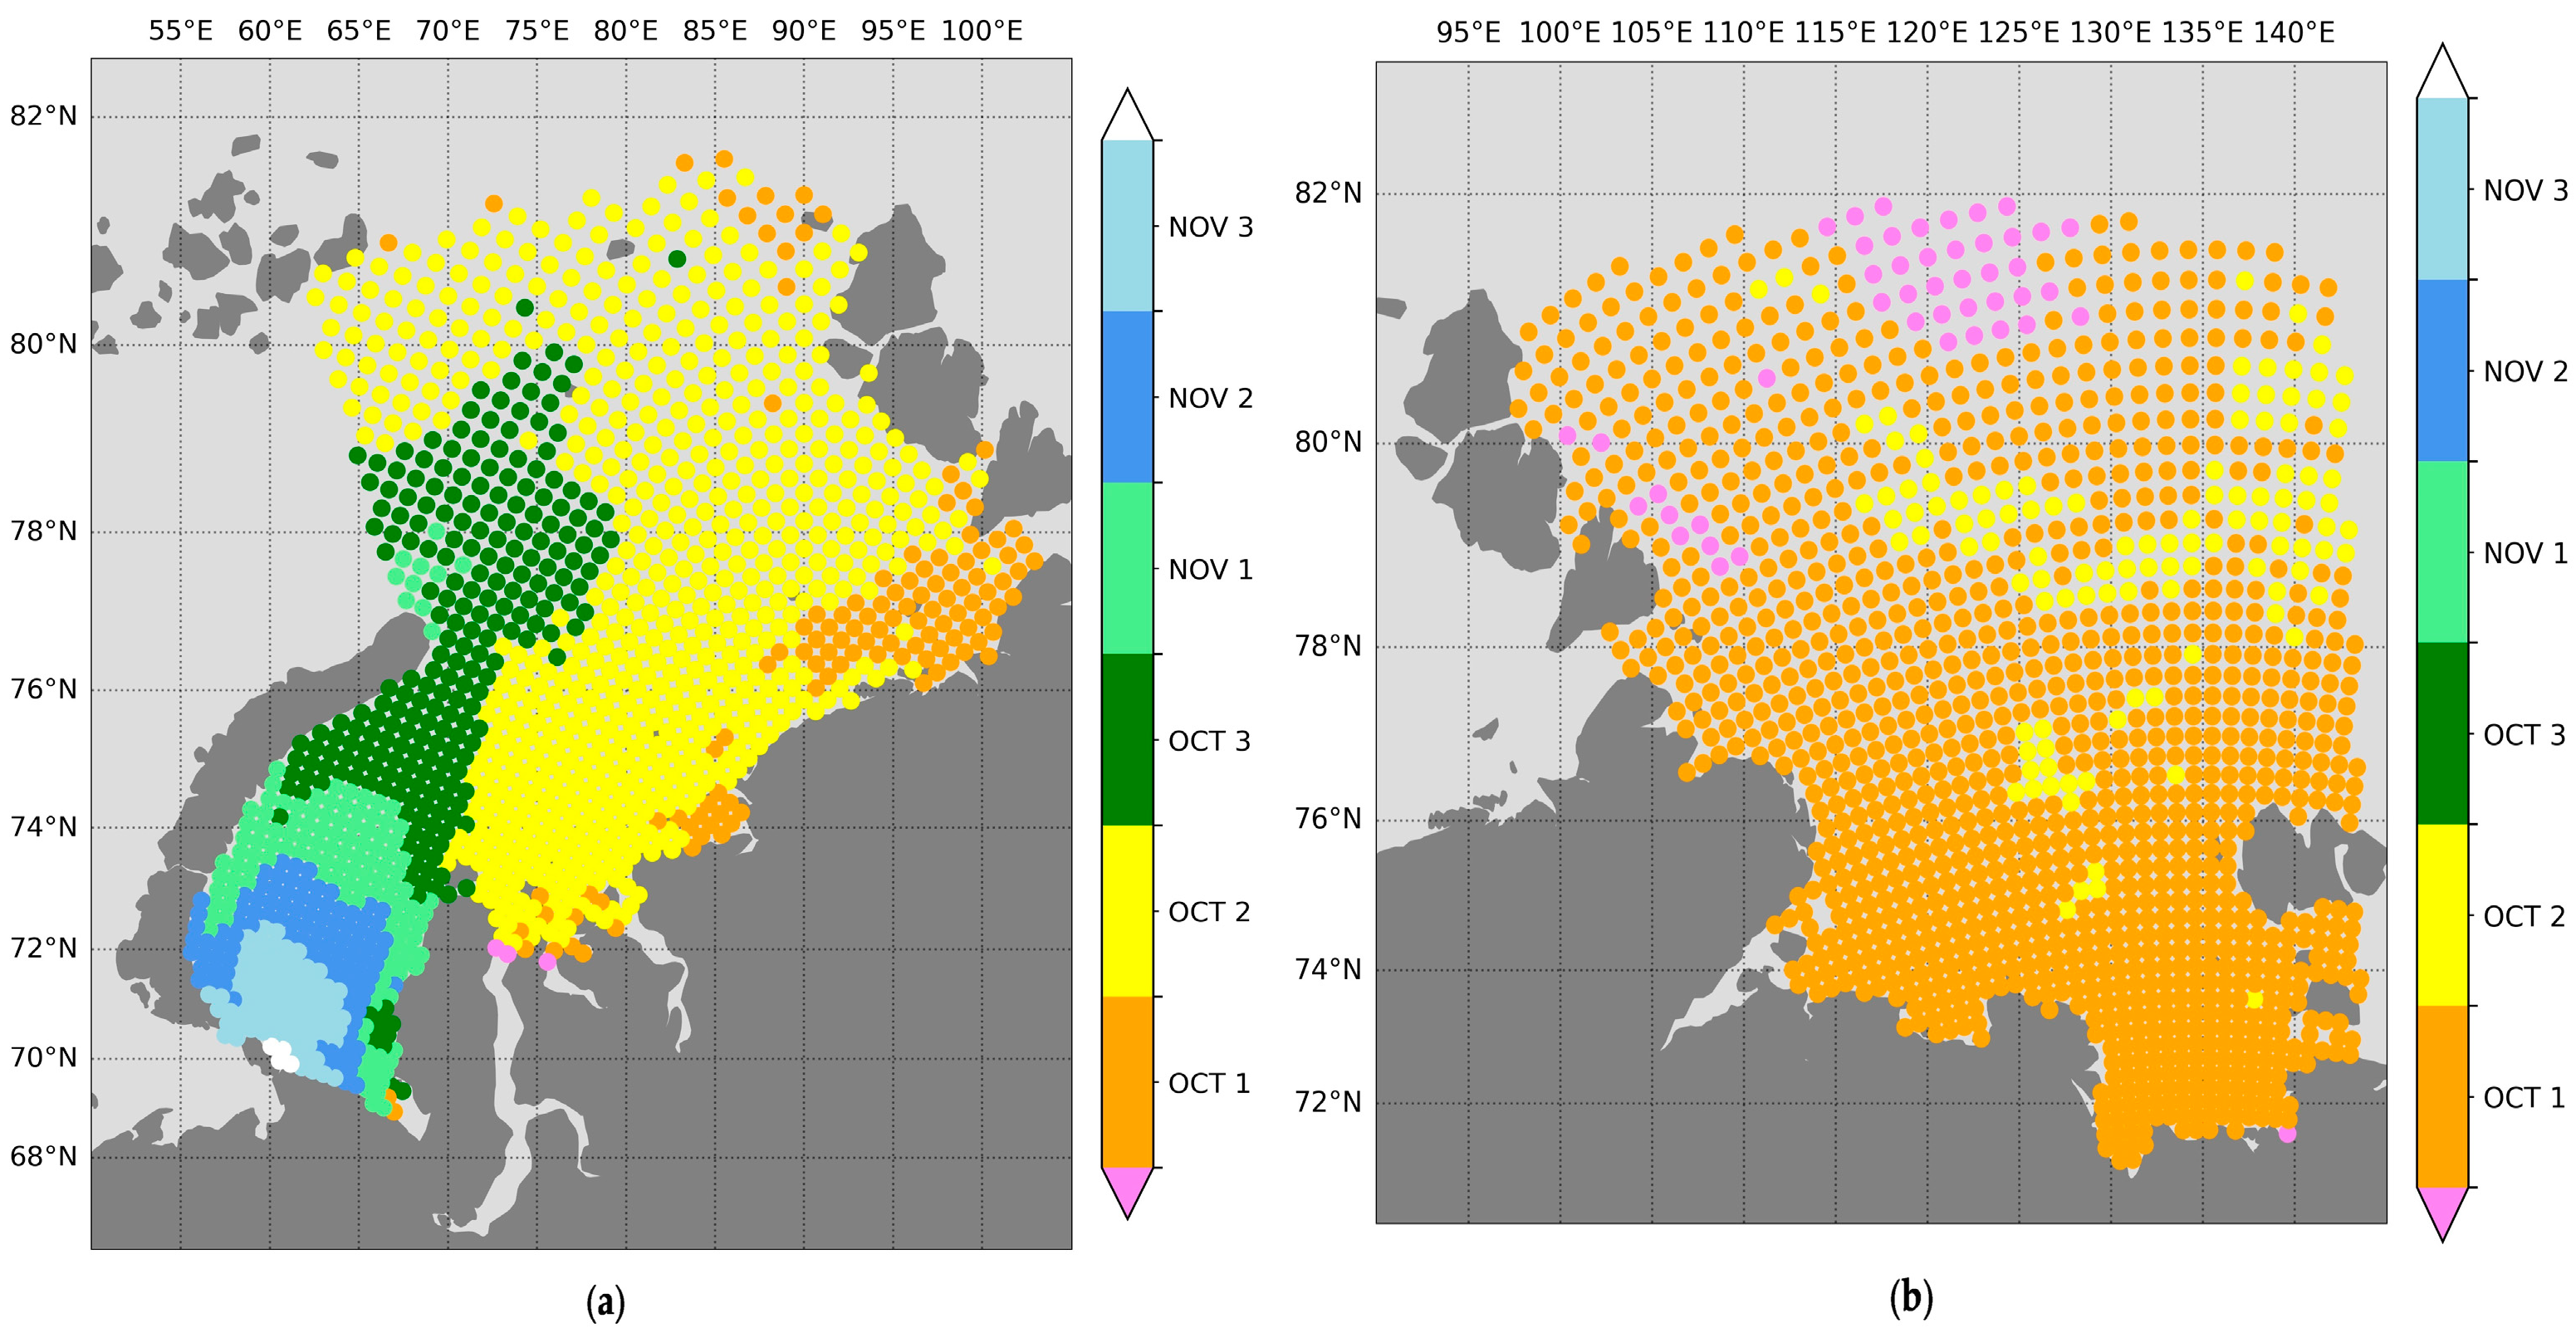
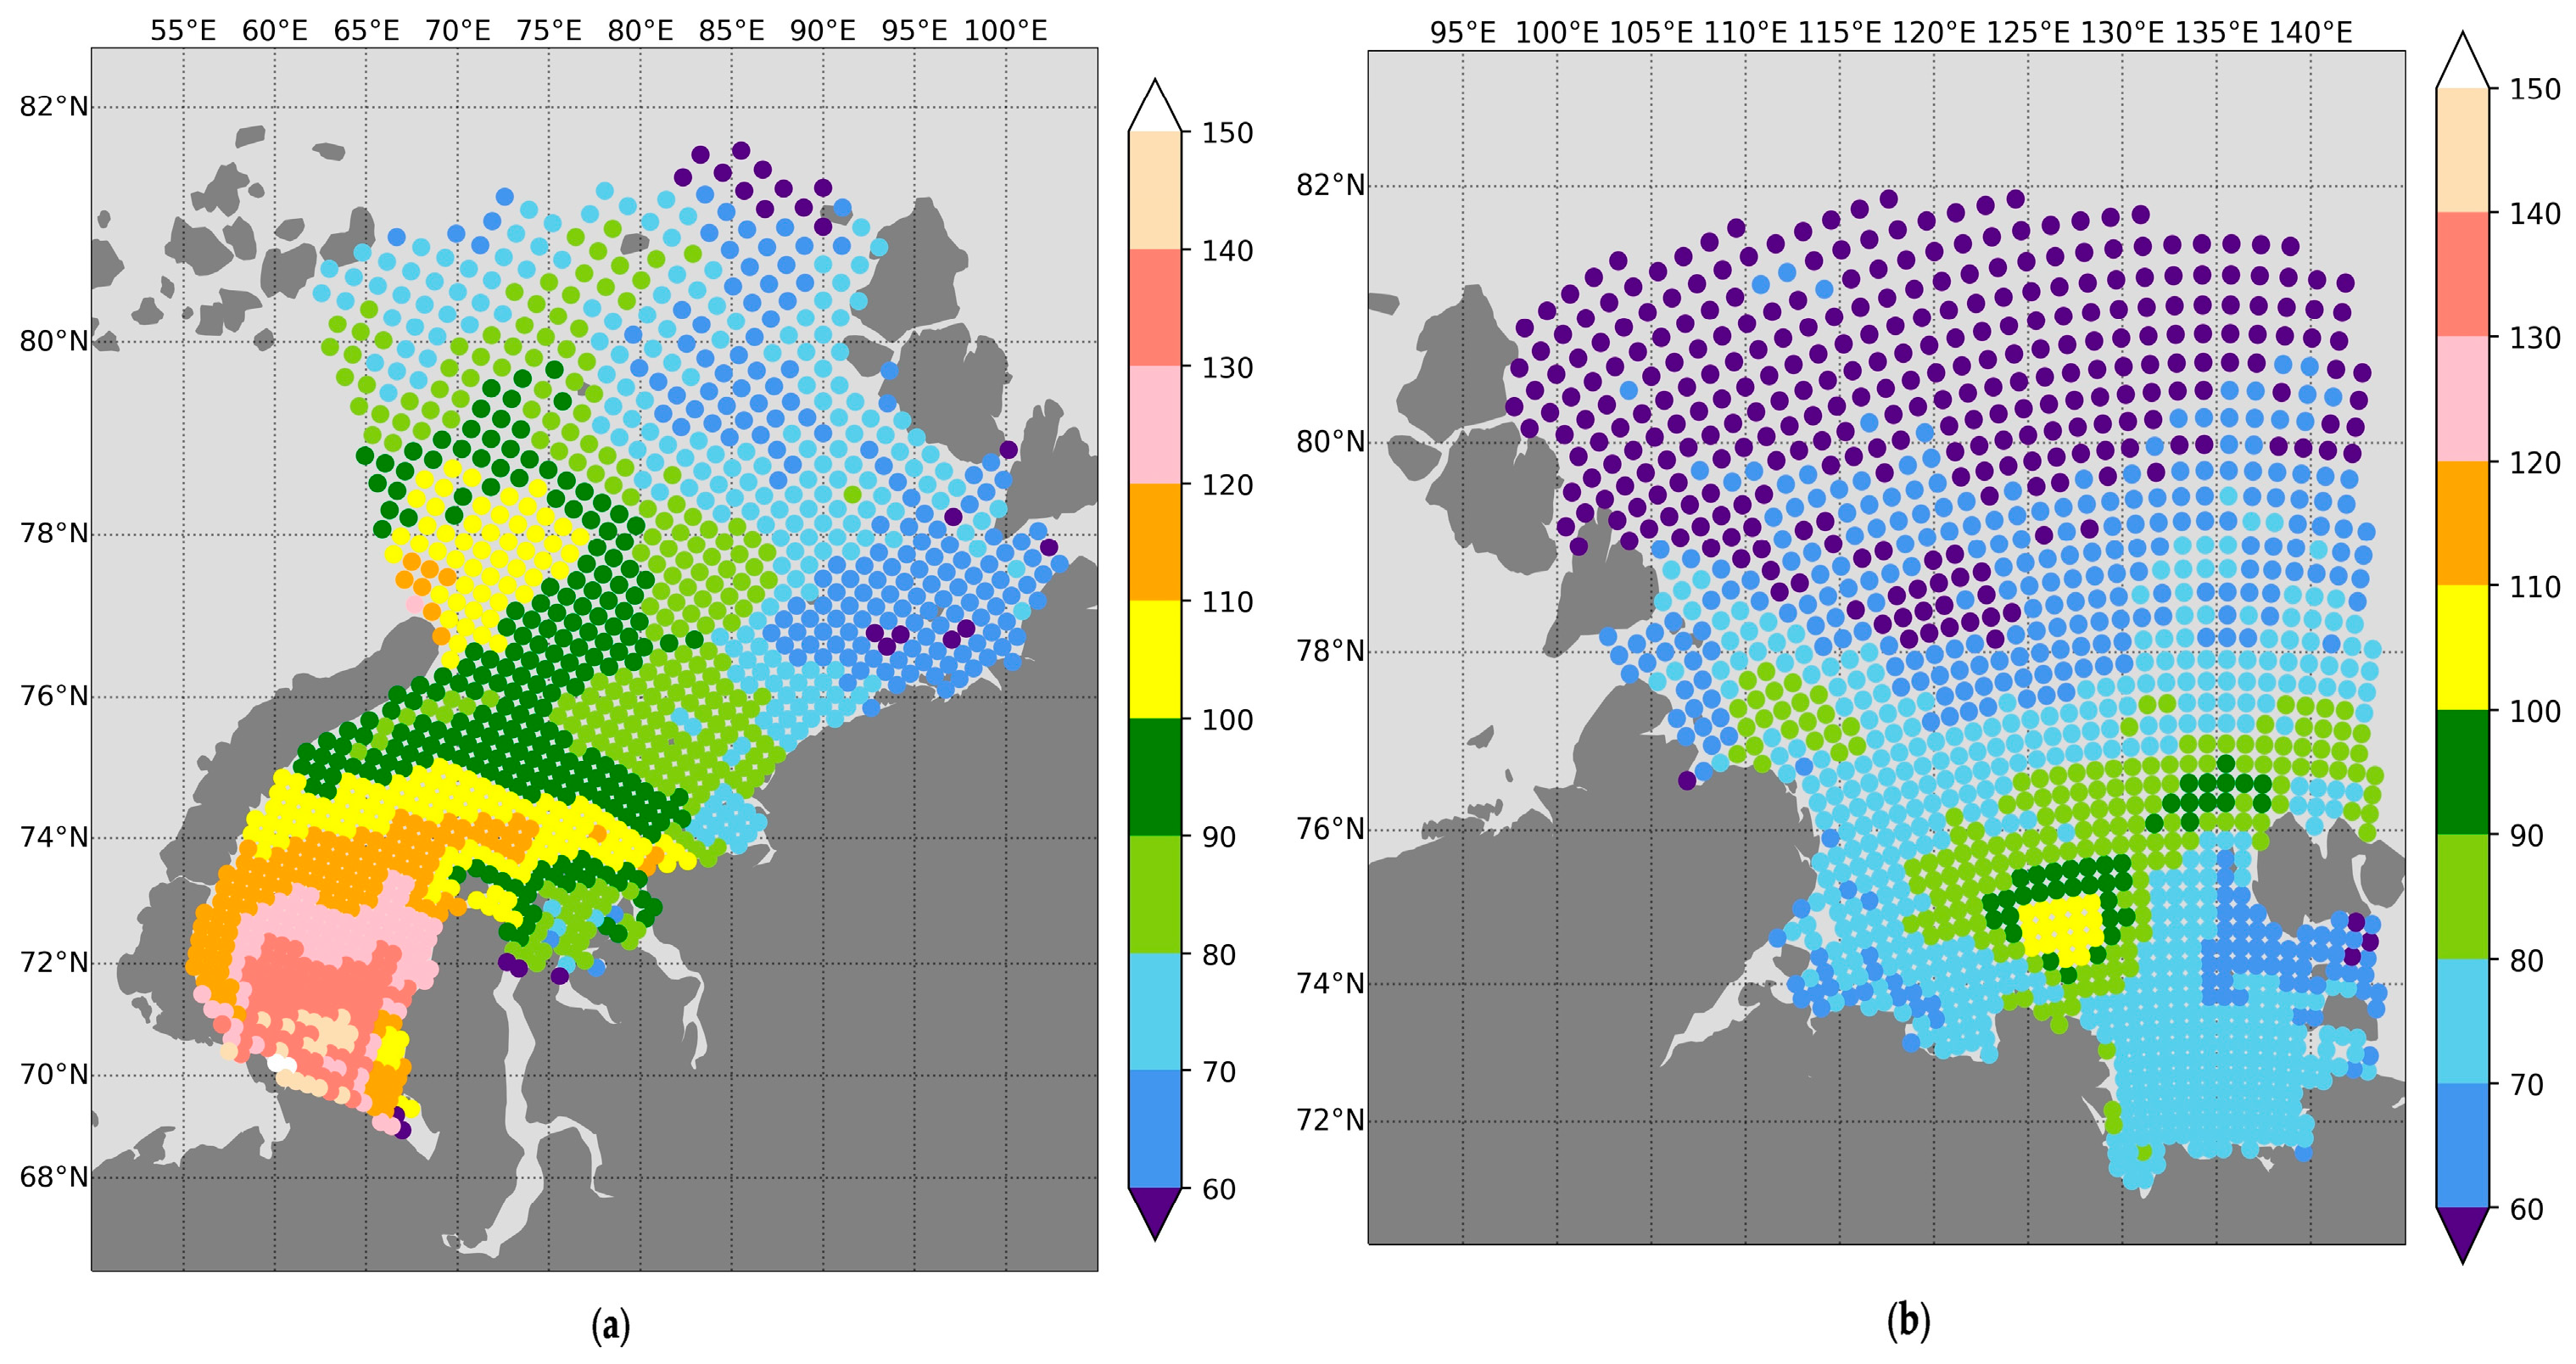
3.3. Regional Distribution of LTM for DOR, DOA, and IFP

SIE decline naturally leads to an increase in the durations of ice-free periods. Based on the filtered data, the LTM of DOR, DOA, and IFP were calculated for the Kara and Laptev seas during 1979–2022. The main statistical parameters averaged over the sea domains for key dates and duration of ice-free periods are presented in Table 1. In the Kara Sea, the LTM ice-free period starts on 22 July and ends on 24 October. In the Laptev Sea, the ice-free period is shorter and starts later on 31 July and ends on 8 October. The averaged over the sea domains LTM IFP is estimated as 69 ± 13 days (mean ± standard deviation) in the Laptev Sea and as 94 ± 22 days in the Kara Sea for 1979–2022.
The LTM DOR varies from the second ten-day period of June to the second ten-day period of August and covers more than two months in the Kara and Laptev seas (Figure 6). For the majority of the area of the Laptev Sea, in the southern regions, the DOR begins between the last ten-day period of July and the first ten-day period of August. In the areas to the north of 80° N, the DOR occurs in the third ten-day period of August or later. In the Kara Sea, an earlier LTM for DOR is occurring in the first ten-day period of July. The earliest LTMs for DOR are observed near the Ob and Yenisei gulfs, which is equal to the last ten-day period of June.
The influence of flaw polynyas on LTM for DOR in both seas is detected even using satellite data with a spatial resolution of 25 km. Large flaw polynyas are formed during the cold season, seaward from the fast ice (Figure 7), and provide favorable conditions, i.e., thin ice, for earlier sea ice retreat [53].
In the Kara and Laptev seas, the LTM for DOA varies from the first ten-day period of October to the third ten-day period of November and covers more than two months (Figure 8). In the majority of the area of the Laptev Sea, DOA occurs in the first ten-day period of October. Starting from the second ten-day period of October, the Laptev Sea is already covered by sea ice. The LTM for DOA in the Kara Sea occurs later. Most of the northeastern part of the Kara Sea freezes during the second ten-day period of October. In regions adjacent to the Vilkitsky Strait and Severnaya Zemlya, DOA occurs in early October, while near the northern cape of Novaya Zemlya DOA is observed in the last ten-day period of October. At the same time, in the southwestern part of the Kara Sea, DOA varies from the first ten-day period of December in the south near Vaigach Island, to the last ten-day period of October near the northern part of Novaya Zemlya. DOA in the southwestern part of the Kara Sea decreases from south to north. Note that near the Kara Gates Strait, the observed LTM for DOA occurs later than in the surrounding areas, namely, in the first ten-day period of November. This feature is caused by the influence of warmer and saltier Barents Sea waters, which inflow into the Kara Sea in this area [54,55]. The late occurrence of DOA near the northern cape of Novaya Zemlya is associated with the spreading of warm surface water from the Barents Sea caused by eastward propagation of the Barents Sea branch of Atlantic water [56].
The spatial distribution of LTM for IFP directly depends on the spatial distribution of DOR and DOA trends (Figure 9). According to NSIDC G02202, version 4, SIC data, the IFP varied from 33 to 151 days in the Kara Sea and from 28 to 107 days in the Laptev Sea during 1979–2022. There is a significant difference in distribution of the LTM for IFP between the northeastern and southwestern regions of the Kara Sea. The averaged LTM for IFP for the northeastern part of the Kara Sea is near 86–89 days, which is 31–34 days less than in the southwestern part.
In the southwestern part of the Kara Sea, the LTM for IFP decreases from south to north. Near Vaigach Island, the LTM for IFP reaches more than 140 days, while in the area of Novaya Zemlya it is only 100 days. At the same time, a shorter IFP equal to 90–100 days is observed near the Ob and Yenisei river estuaries. In the northeastern part of the Kara Sea, the LTM for IFP decreases from west to east. The longest LTM for IFP (more than 110 days) is observed near the northern cape of Novaya Zemlya, at the border with the Barents Sea. In the east, near the Chelyuskin Cape at the same 77° N latitude, the LTM for IFP is less than 70 days.

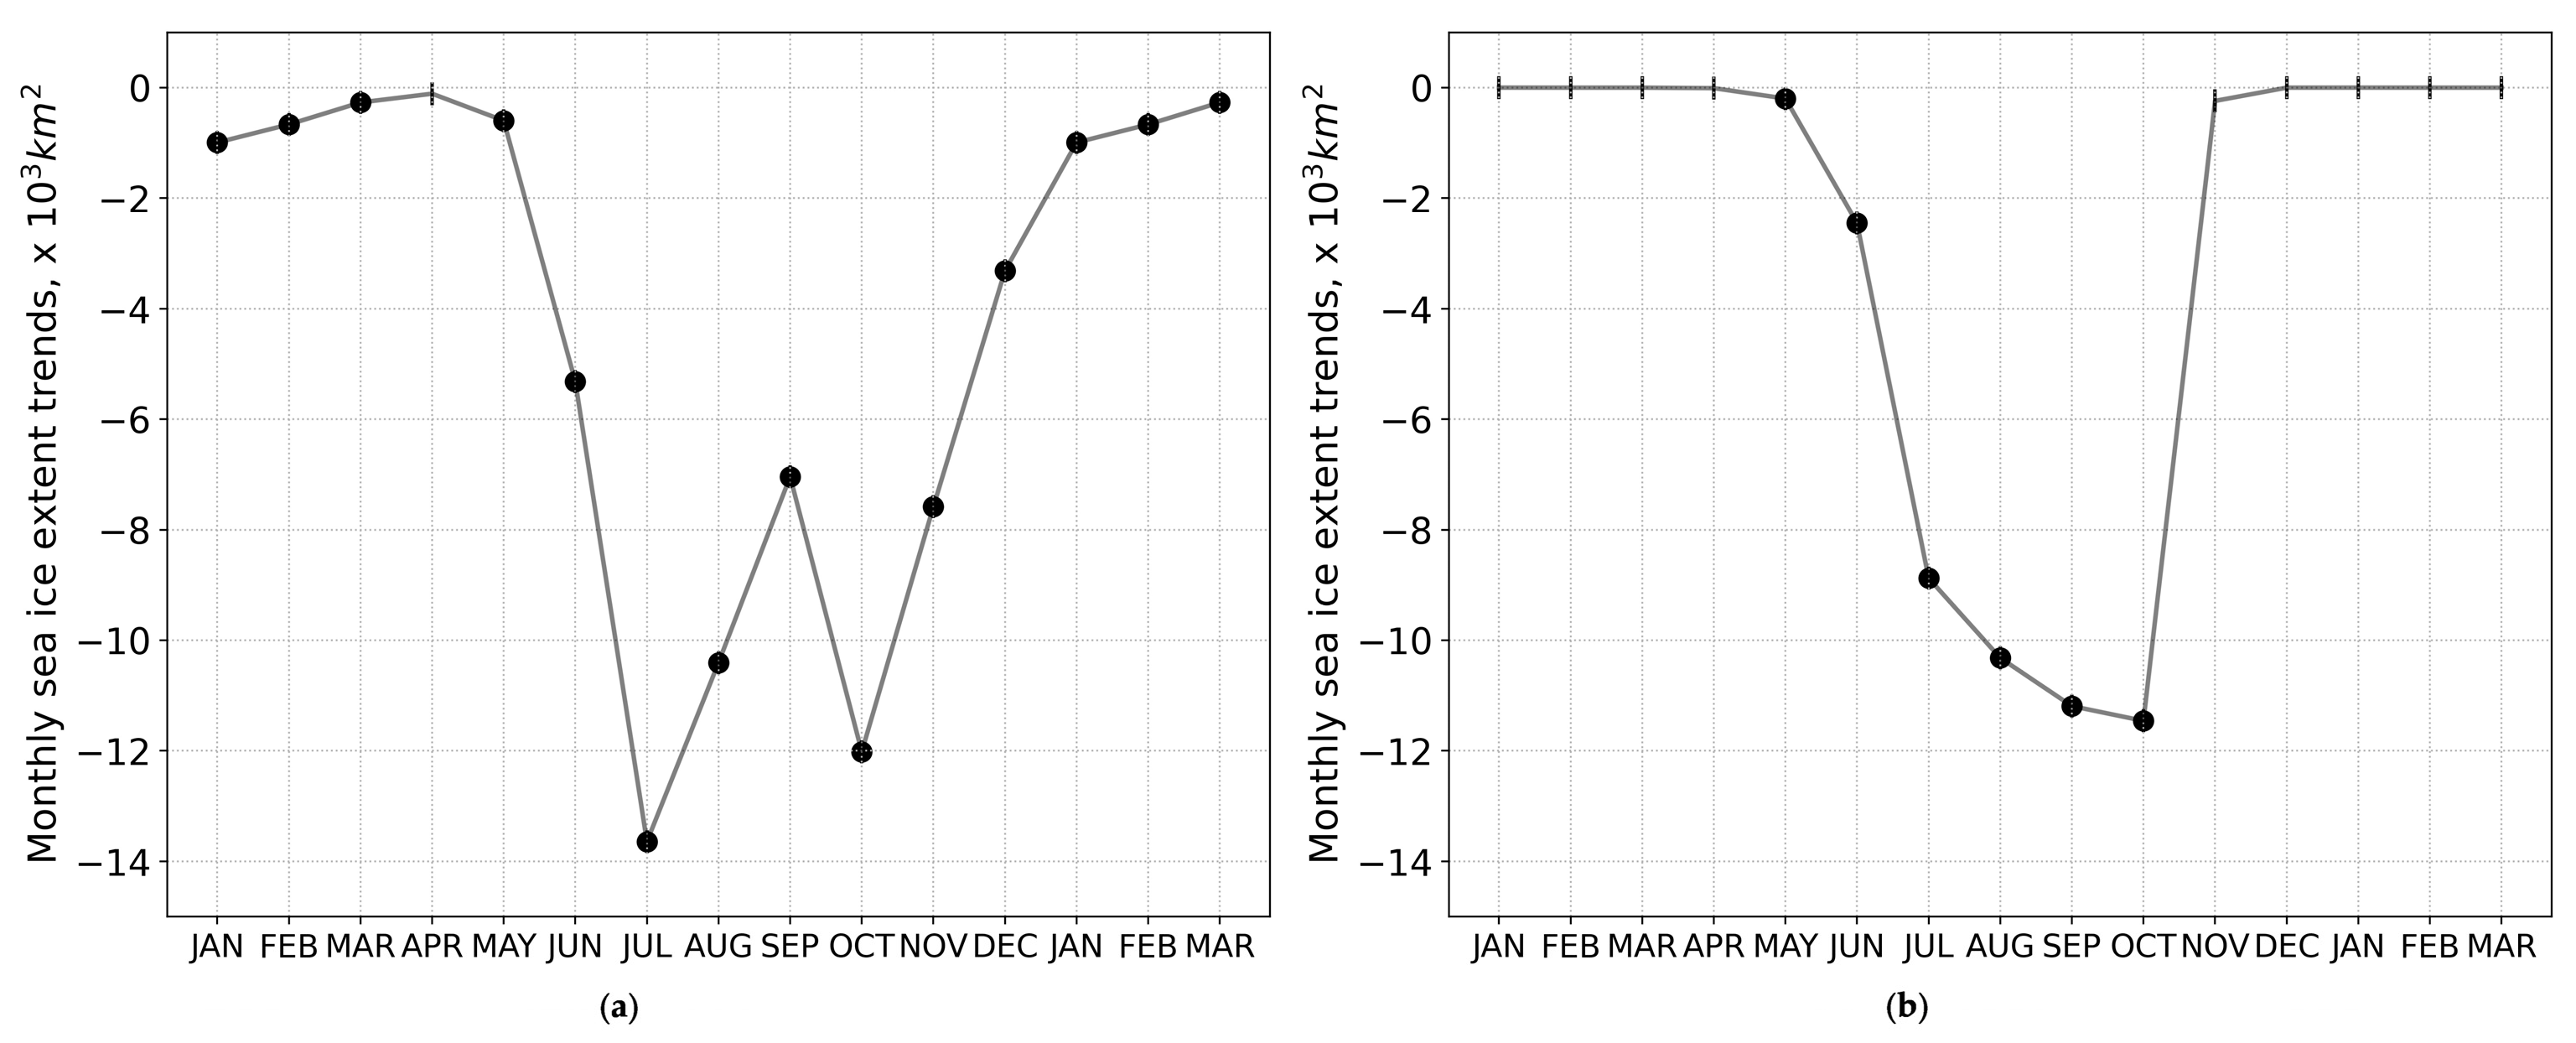
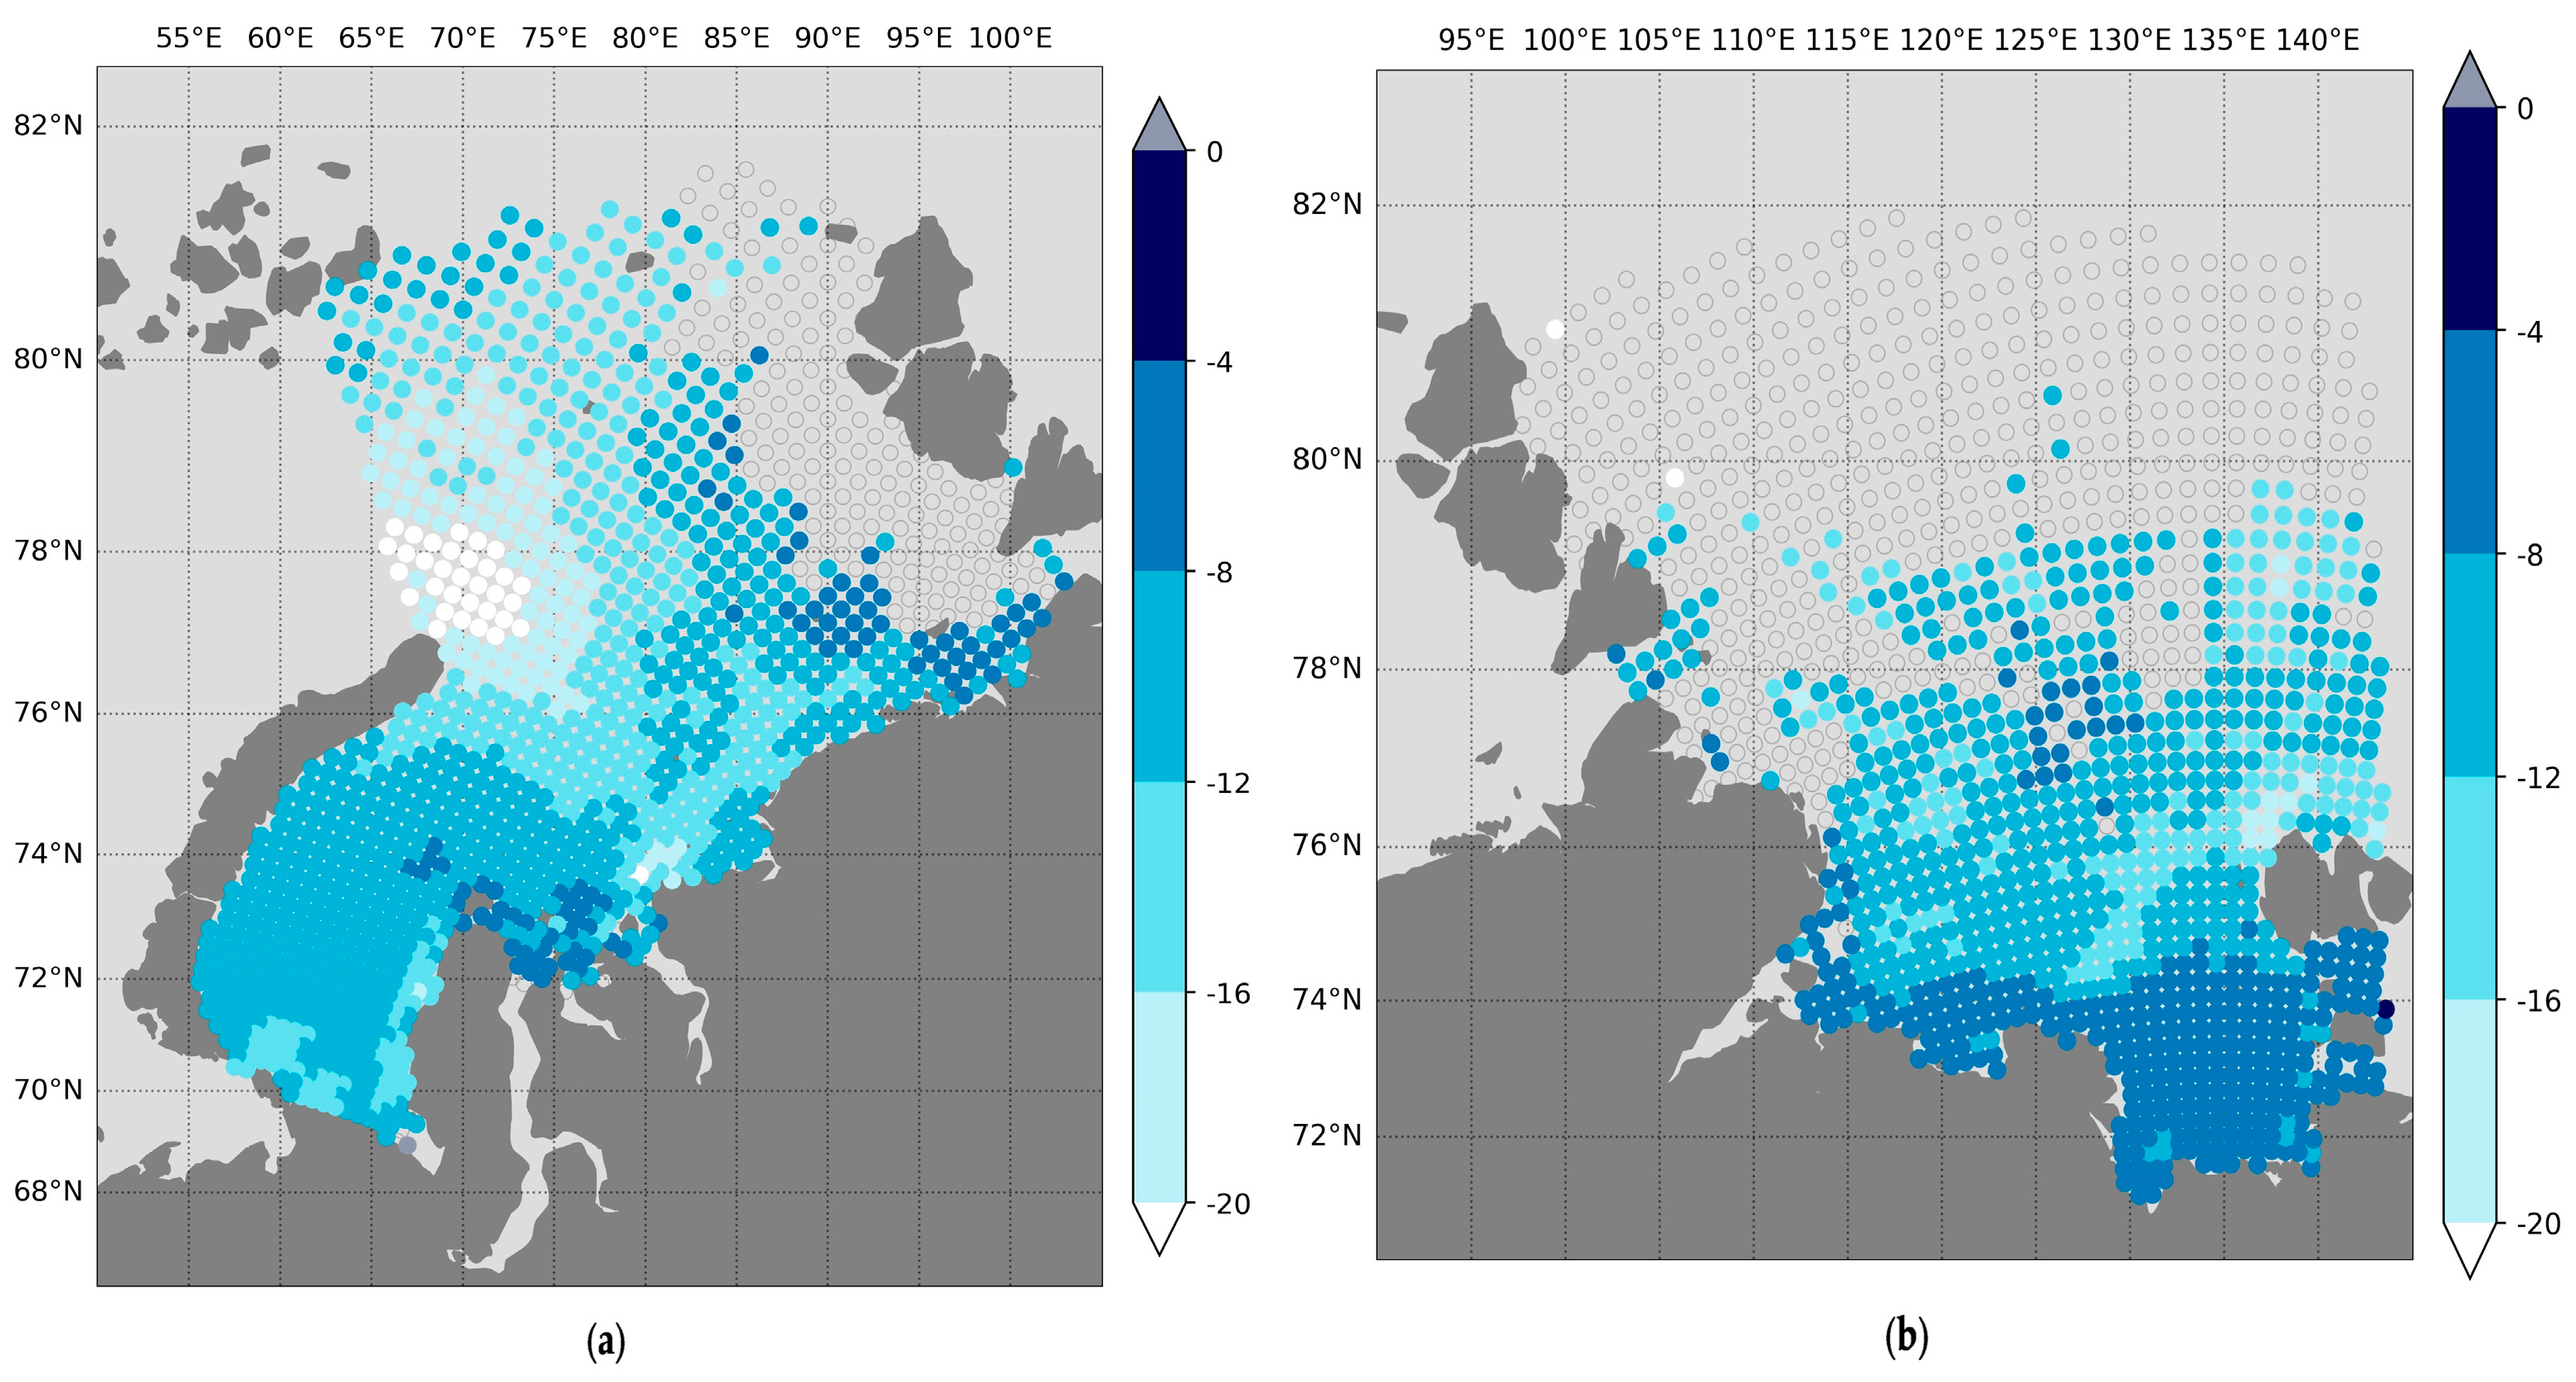
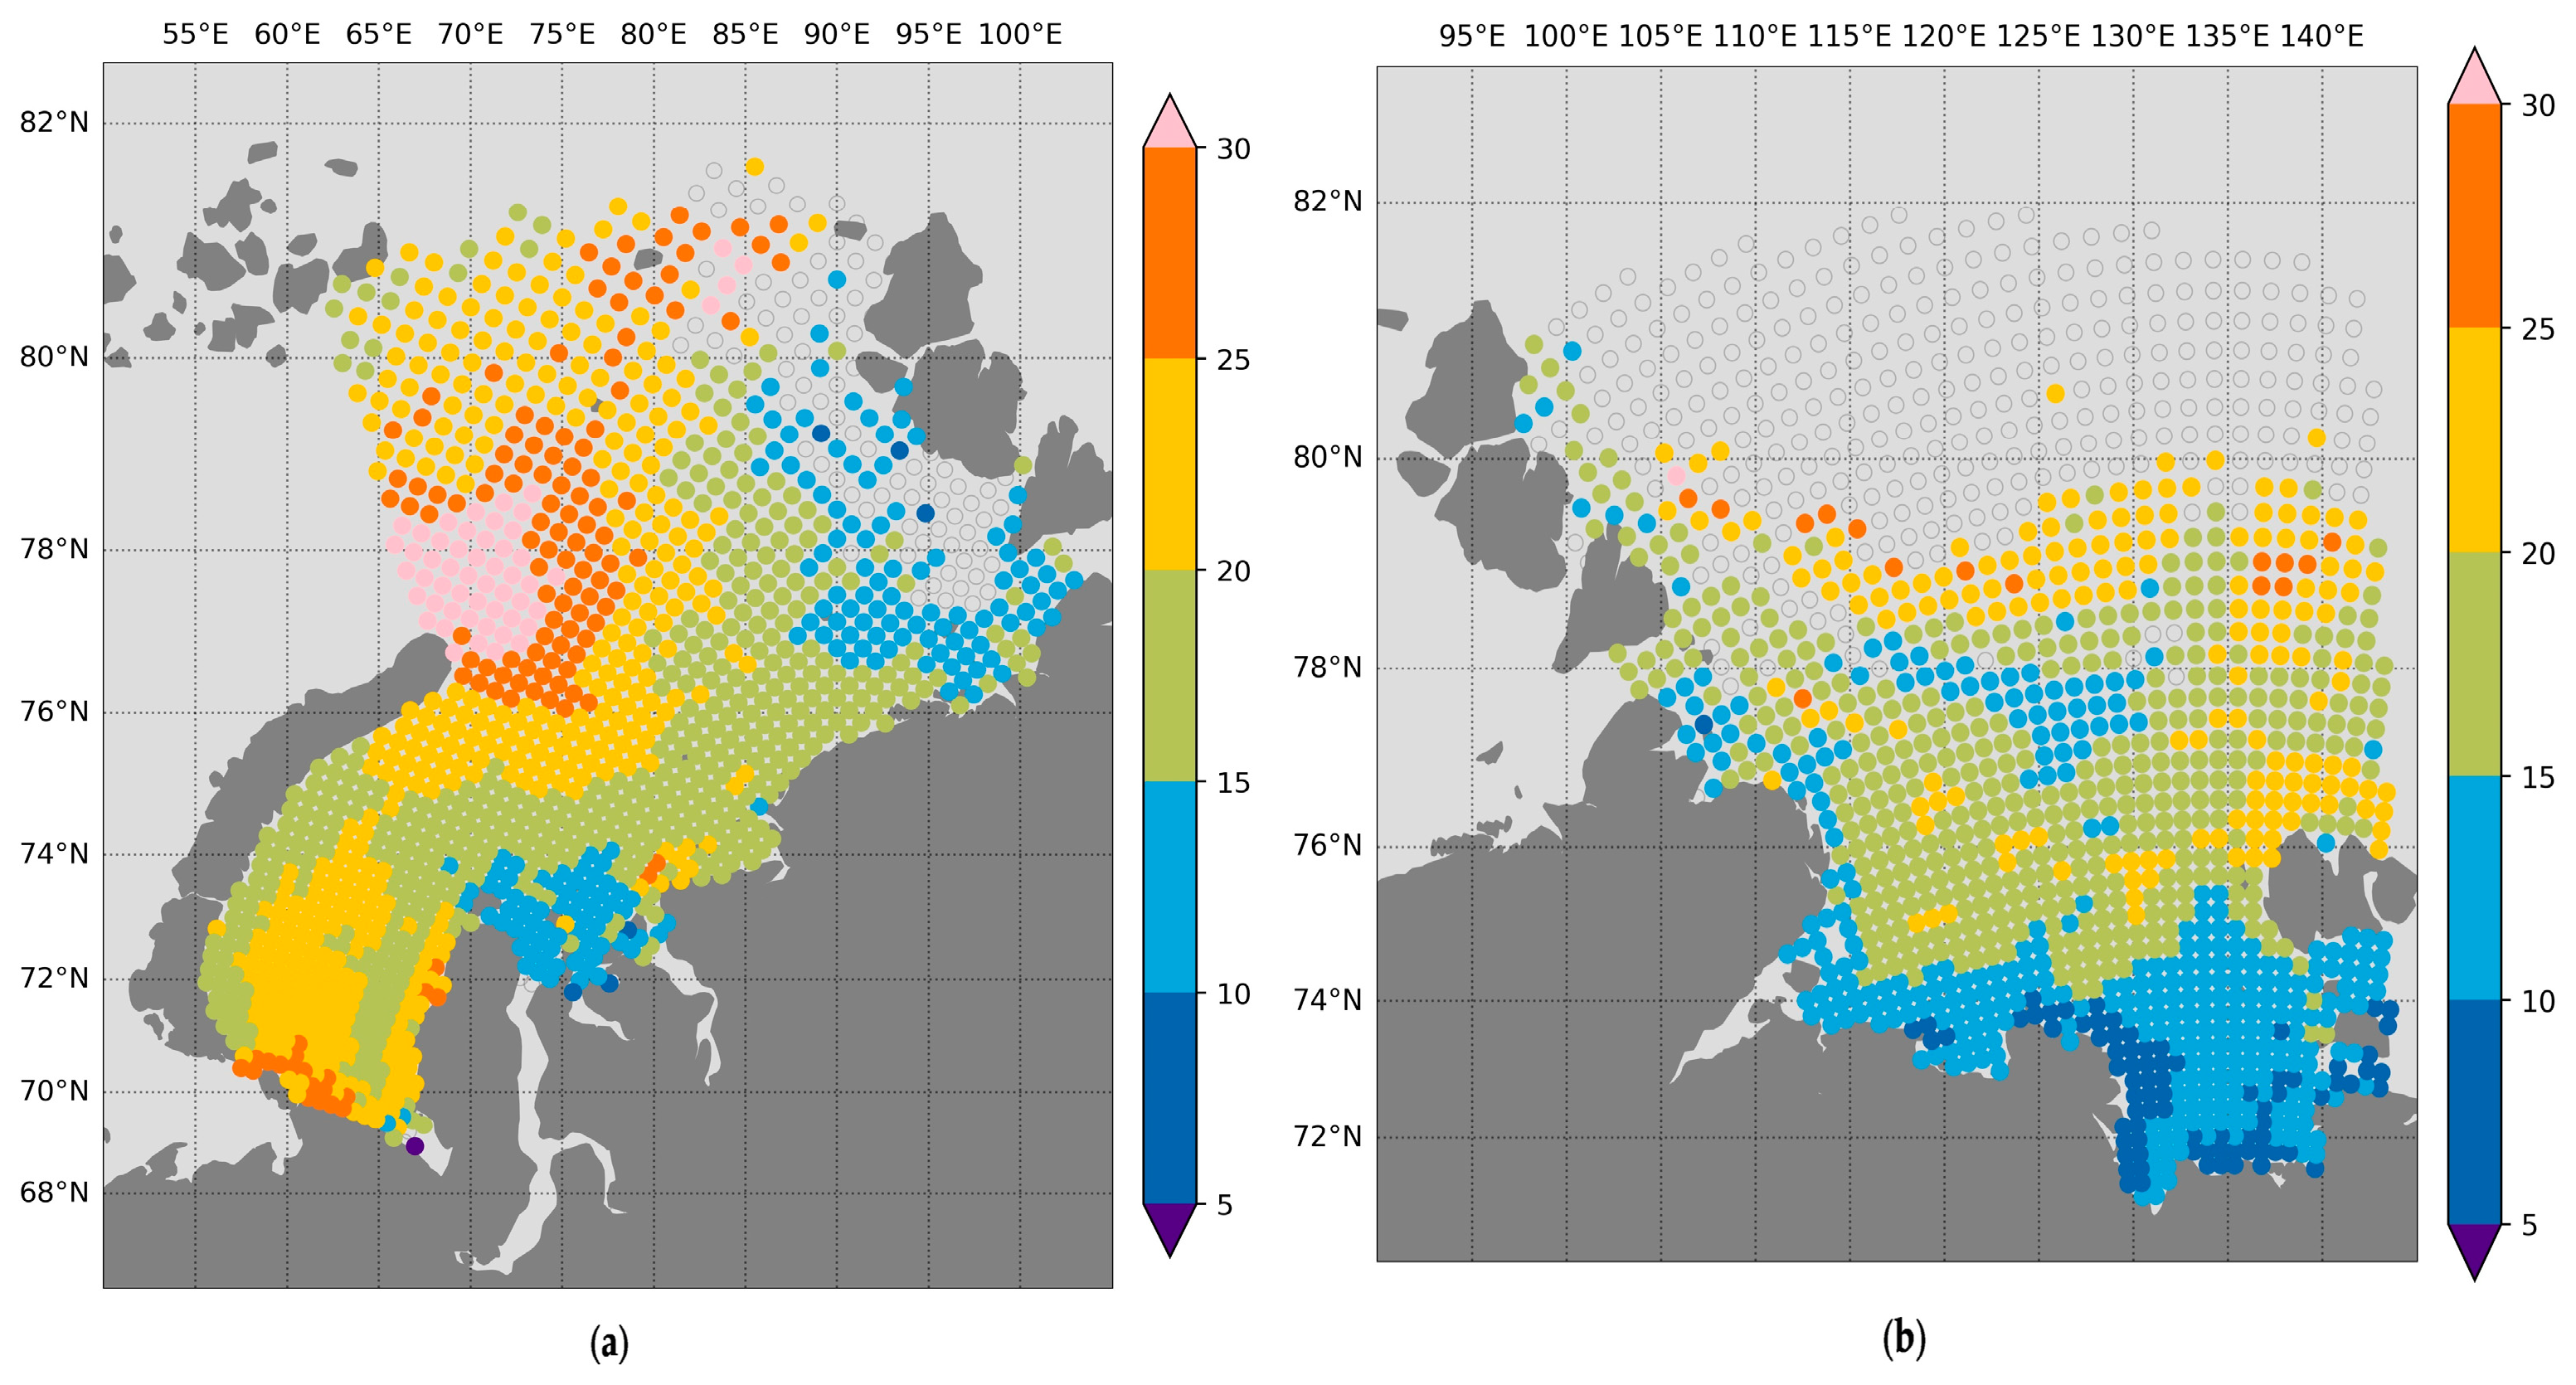
3.4. Trends in DOR, DOA, and IFP during 1979–2022

SIE decline naturally leads to an increase in ice-free duration. The observed significant SIE decline in July and October in the Kara Sea and in September–October in the Laptev Sea is correlated with DOR and DOA. To estimate the rate of ice-free period change, DOR, DOA, and IFP trends were calculated for the Kara and Laptev seas during 1979–2022. Strong negative trends in DOR and positive trends in DOA were found for both seas. Such a combination of statistically significant trends leads to high ice-free period duration trends. The main statistical parameters averaged over the sea domains for ice-free period key dates (DOR, DOA) and duration (IFP) are presented in Table 2.
DOR decadal trends indicate that ice-free periods start earlier for the majority of areas in the Kara and Laptev seas. A statistically significant shift in DOR to earlier dates (negative trends) is noted in 88% of the considered grid cells of the Kara Sea, except in the north-easternmost regions (to the east of 85° E and north of 77° N). In the Laptev Sea, statistically significant negative DOR trends are observed in 66% of grid cells and only to the south of 79–80° N and east of 100° E (Figure 10). Statistically significant DOR trends in the seas vary from −3.8 days/decade to −23.4 days/decade. The averaged DOR trends are −11.5 and −9.5 days/decade in the Kara and Laptev seas, respectively.
The largest negative DOR trends, which are less than −20 days/decade, are observed at the border with the Barents Sea near northern part of Novaya Zemlya. This area of rapid DOR change extends up to 81° N and violates the relatively homogeneous distribution of DOR trends in the Kara Sea. Smaller trends (greater than −7 days/decade) are observed near the Ob and Yenisei gulfs, as well as in the northeastern part of the sea. In the areas adjacent to Vaigach Island and the western coast of the Yamal Peninsula, DOR trends are estimated to be less than −12 days/decade.
In the Laptev Sea, negative DOR trends increase from south to north. South of 74° N, where great volumes of fast ice is formed, the distribution of DOR trends is fairly uniform, and the rates are smaller than in the open sea areas and exceed −8 days/decade. Increased DOR trends (less than −12 days/decade) are observed in the area, where the Great Siberian Polynya (stretching from the Lena Delta to Kotelny Island) is formed during cold seasons [57].
DOA decadal trends indicate that ice formation occurs later for the majority of areas in the Kara and Laptev seas (Figure 11). A statistically significant shift in DOA to later dates (positive trends) is noted in 97% of the considered grid cells of the Kara Sea. In the Laptev Sea, statistically significant changes in DOA are observed in 78% and only to the south of 80° N. Statistically significant DOR trends in both seas vary from +1.6 days/decade to +23.1 days/decade. The average DOR trends are +8.7 and +6.7 days/decade in the Kara and Laptev seas, respectively.
In the Laptev Sea, the DOR trends increase from south to north. Thus, the lowest statistically significant trends, less than +3 days/decade, are observed to the east of the Lena Delta. In the southern regions and coastal areas, DOA trends increase to +5 days/decade. To the north of 75° N, DOA trends are up to +9 days/decade. The highest changes, which exceed +10 days/decade, are observed to the north of 79° N. North of 80° N, DOA trends are statistically insignificant at the 95% confidence level.
In the Kara Sea, the DOA trends are higher than in the Laptev Sea. The lowest statistically significant DOA trends, equal to +3 + 6 days/decade, are observed to the north of the Ob and Yenisei gulfs, as well as along the northeastern coast. The highest DOA trends, which are greater than +10 days/decade, are observed at the border with the Barents Sea, near the northern cape of Novaya Zemlya and also near Vaigach Island. In both cases, the warm inflow from the Barents Sea contribute to high change rates. Thus, the rapid reduction in the winter ice cover in the Barents Sea significantly affects the timing of the ice-free period end in the Kara Sea [8,58].
Statistically significant negative DOR trends (earlier retreat) and statistically significant positive DOA trends (later advance) simultaneously contribute to significant IFP increase. Trends toward later DOA are consistent with the effects of earlier DOR that increase the amount of solar radiation absorbed by the ocean and increase sea surface temperatures, which delay freeze-up [59]. A statistically significant IFP increase (positive trends) is noted in 94% and 77% of the considered grid cells in the Kara and Laptev seas, respectively (Figure 12). In the Laptev Sea, statistically significant IFP trends are observed only to the south of 80° N. The IFP increases statistically significantly over the majority of the area of the Kara Sea, except the eastern part adjacent to Severnaya Zemlya.
Statistically significant IFP trends in both seas vary from +6.8 days/decade to more than +30 days/decade. The averaged IFP trends are +20.2 and +16.2 days/decade in the Kara and Laptev seas, respectively. The spatial distribution of IFP trends crucially depends on the spatial distribution of DOR and DOA trends. Despite the fact that DOR/DOA trends are comparable, the DOR trends contribute more to the total IFP extension in both seas.
In the Laptev Sea, IFP trends mainly increase from south to north. The lowest statistically significant trends, which are less than +10 days/decade, are observed to the east of the Lena Delta. At the border of statistically significant IFP trends, near 79° N, the trends are estimated to be greater than +20 days/decade. The Kara Sea has a greater increase in IFP from east to west, especially in the northeastern part of the sea. The highest IFP trends are observed at the border with the Barents Sea and exceed +30 days/decade. At the same time, at the east part of the Kara Sea near Severnaya Zemlya, IFP trends are less than +10 days/decade, up to statistically insignificant values. In the southwestern part of the Kara Sea, the highest IFP trends are observed near Vaigach Island and exceed +25 days/decade. In the areas adjacent to the Ob and Yenisei gulfs, there are noticeably lower IFP trends, which are less than +15 days/decade.

4. Discussion

The IFP LTM and trend spatial distribution features mostly depend on the DOR spatial distribution rather than on the DOA. We determine three processes that increase IFP in the Kara and Laptev seas. First, early DOR are observed in the areas adjacent to the large river mouths, namely, the Ob and Yenisei gulfs in the Kara Sea and the Lena Delta in the Laptev Sea (Figure 6). This feature is caused by the inflow of warm river water to the seas and the related intensification of sea ice melting in spring and early summer. However, discharges of these rivers significantly decrease by late autumn; therefore, they do not affect DOA (Figure 8). Note that winter and spring discharge rates of these rivers have been growing during the last decades, and river temperatures have also been growing [60,61]. However, these processes result in only a slight decrease in DOR and increase in IFP LTMs at the areas adjacent to river mouths (Figure 10 and Figure 12). Also, the lowest DOA trend is observed in the central and northeastern part of the Kara Sea and in southern and southeastern parts of the Laptev Sea (Figure 11). These areas correspond to spreading areas of the Ob-Yenisei and Lena plumes [62,63] and, therefore, they are the areas of early ice formation in autumn due to strong vertical stratification [64,65]. The inflow of warm water from the Barents Sea to the Kara Sea is the most important process that causes sea ice reduction in the study area [55,56]. This process affects both DOR and DOA and its influence is localized along the eastern coast of Novaya Zemlya (Figure 6 and Figure 8). The area with the latest DOA in the Kara Sea is associated with inflow through the Kara Gates Strait, while the shift of DOR is similar for both the inflow of the Barents Sea water through the Kara Gates Strait and to the north from Novaya Zemlya. Atlantification, i.e., the increased influence of warm Atlantic water on the surface layer, which has been observed in the Barents Sea during the last decades [66] results in positive DOA and IFP LTMs (the largest in the study area) and a negative DOR LTM northward from Novaya Zemlya (Figure 10, Figure 11 and Figure 12).
Early DOR and the smaller IFP values in the Laptev Sea are also associated with areas of the formation of flaw polynyas [53,57] (Figure 6 and Figure 9). These polynyas provide favorable conditions for earlier sea ice retreat due to low ice thickness. Note that they do not affect DOA (Figure 8). Polynyas have demonstrated significant influence on sea ice decrease during the last decades [67], resulting in negative DOR and positive IFP LTMs (Figure 10 and Figure 12).
During the last decades, an increase in the ice-free period duration has been observed in most areas of the Kara and Laptev seas. While maintaining the current rate of global warming, it could be predicted with a high degree of confidence that the seasonal sea ice extent in the Kara and Laptev seas will continue to decrease. And, as a result, the ice-free period duration will continue to increase too. The potential for IFP expansion remains, but this expansion cannot continue indefinitely. It is unlikely that in the next decade, even in the western part of the Kara Sea, the sea ice cover will significantly decrease in winter and will cease to be continuous. With a high degree of confidence, we can say that if the current rates of sea ice cover decline during the winter season in the Barents Sea will continue in winter, the western part of the Kara Sea will continue to be cleared of sea ice earlier due to the influence of the warm waters of the Barents Sea. For the Laptev Sea, we can expect with high confidence a continued IFP duration extension and a spatial decrease to the north of the sea ice zone during the warm period.
Sea ice conditions play a great role in the coastal dynamics of the Kara and Laptev seas [68]. Sea ice limits the interaction between the land and seawater, and fast ice protects the coasts from wave and thermal impacts. Observed advection of warmer air and significant increases in the summer air temperature with wind–wave activity accelerate the thermal abrasion and thermal denudation processes in the Kara and Laptev seas’ coastal zones during the extended ice-free period.

5. Summary and Conclusions

A regional qualitative description and detailed statistical analysis of changes in sea ice conditions and the duration of the ice-free period in the Kara and Laptev seas with a focus on regional features are presented.
Based on the NSIDC Sea Ice Index, version 3, dataset, we have analyzed the SIE changes in the Kara and Laptev seas. We examined the annual values of SIE and found a rapid decline in both seas (Figure 1). The average change rates are similar, but the decline in the Kara Sea is 40% faster than in the Laptev Sea. For the last decade 2011–2020, SIE decreased by 18.7% in the Kara Sea and 12.8% in the Laptev Sea compared to the average values for the 1981–2010 period. Additionally, statistically significant negative trends (95% confidence level) were found in the monthly SIE during the ice-free months (Figure 3 and Figure 4), indicating an extension of the ice-free period. The observed changes in sea ice conditions are closely related to the average long-term IFP values. Based on the NSIDC G02202 dataset, version 4, the averaged IFP long-term values were calculated and compared between the two seas. The spatial features of these LTM IFPs has been described (Figure 6, Figure 8 and Figure 9). It was found that the averaged LTM IFP is longer by about 40% in the Kara Sea compared to the Laptev Sea. This difference in LTM IFP corresponds to a similar difference in the annual SIE trends.
We examined the regional IFP features in the Kara and Laptev seas, focusing on the annual changes in IFP duration. The research includes a baseline statistical analysis of regional change for the 1979–2022 period in DOR and DOA, based on the NSIDC G02202, version 4, sea ice concentration dataset. The difference between DOA and DOR, expressed in days, determines the IFP duration. We showed that the ice-free period duration IFP experienced a statistically significant (95% confidence level) increase over 94% and 77% of the considered grid cells in the Kara and Laptev seas, respectively. The average IFP trends are +16.2 days/decade in the Laptev Sea and +20.2 days/decade in the Kara Sea. Statistically significant negative trends in DOR and positive trends in DOA combine and contribute to significant increases in IFP. Despite the same scale, the earlier retreat contributes more than later advance to the total reduction in the ice-free period duration. The average DOR trends are +6.7 and +8.7 days/decade and the average DOR trends are −9.5 and −11.5 days/decade in the Laptev Sea and the Kara Sea, respectively. Neither of these processes plays a decisive role, as both contribute equally to the overall increase in the ice-free duration.

Author Contributions

Conceptualization, P.S. and A.O.; investigation, P.S.; methodology, P.S. and N.S.; software, P.S.; writing—original draft preparation, P.S., A.O. and N.S.; writing—review and editing, P.S., A.O., N.S. and S.O.; visualization, P.S.; project administration, P.S. and S.O.; funding acquisition, S.O. and A.O. All authors have read and agreed to the published version of the manuscript.

Funding

The study of sea ice variability in the Kara and Laptev seas during 1979–2022 was funded by the Russian Science Foundation, research project № 22-17-00097. The study of oceanographic processes based on experience of field measurements in the Kara and Laptev seas, carried out by A. Osadchiev, was supported by the Russian Science Foundation, research project № 23-17-00087. The collection, digitalization, and storage of fast ice data in Russian Arctic seas were carried out under the state task of the Shirshov Institute of Oceanology № FMWE-2024-0017.

Data Availability Statement

Sea ice concentration data can be freely accessed from the National Snow and Ice Data Center (NSIDC) at https://nsidc.org/data/g02202/versions/4 (accessed on 21 March 2024). Sea ice extent monthly data also can be freely accessed from NSIDC at https://nsidc.org/data/g02135/versions/3 (accessed on 21 March 2024). Distributed in Sigrid-3 format, which is similar to shapefile format, fast ice data can be found in the AARI archive at http://wdc.aari.ru/datasets/d0015/arcice (accessed on 20 May 2024).

Acknowledgments

The authors thank the anonymous reviewers. Their constructive comments to improve this article are greatly appreciated.

Conflicts of Interest

The authors declare no conflicts of interest.

References

  1. Comiso, J.C.; Parkinson, C.L.; Gersten, R.; Stock, L. Accelerated Decline in the Arctic Sea Ice Cover. Geophys. Res. Lett. 2008, 35, 2007GL031972. [Google Scholar] [CrossRef]
  2. Stroeve, J.; Holland, M.M.; Meier, W.; Scambos, T.; Serreze, M. Arctic Sea Ice Decline: Faster than Forecast. Geophys. Res. Lett. 2007, 34, 2007GL029703. [Google Scholar] [CrossRef]
  3. Stroeve, J.C.; Serreze, M.C.; Holland, M.M.; Kay, J.E.; Malanik, J.; Barrett, A.P. The Arctic’s Rapidly Shrinking Sea Ice Cover: A Research Synthesis. Clim. Chang. 2012, 110, 1005–1027. [Google Scholar] [CrossRef]
  4. Vihma, T. Effects of Arctic Sea Ice Decline on Weather and Climate: A Review. Surv. Geophys. 2014, 35, 1175–1214. [Google Scholar] [CrossRef]
  5. Gao, Y.; Sun, J.; Li, F.; He, S.; Sandven, S.; Yan, Q.; Zhang, Z.; Lohmann, K.; Keenlyside, N.; Furevik, T.; et al. Arctic Sea Ice and Eurasian Climate: A Review. Adv. Atmos. Sci. 2015, 32, 92–114. [Google Scholar] [CrossRef]
  6. Zhang, R. Mechanisms for Low-Frequency Variability of Summer Arctic Sea Ice Extent. Proc. Natl. Acad. Sci. USA 2015, 112, 4570–4575. [Google Scholar] [CrossRef] [PubMed]
  7. Stroeve, J.; Notz, D. Changing State of Arctic Sea Ice across All Seasons. Environ. Res. Lett. 2018, 13, 103001. [Google Scholar] [CrossRef]
  8. Liu, Z.; Risi, C.; Codron, F.; Jian, Z.; Wei, Z.; He, X.; Poulsen, C.J.; Wang, Y.; Chen, D.; Ma, W.; et al. Atmospheric Forcing Dominates Winter Barents-Kara Sea Ice Variability on Interannual to Decadal Time Scales. Proc. Natl. Acad. Sci. USA 2022, 119, e2120770119. [Google Scholar] [CrossRef]
  9. Deser, C.; Teng, H. Evolution of Arctic Sea Ice Concentration Trends and the Role of Atmospheric Circulation Forcing, 1979–2007. Geophys. Res. Lett. 2008, 35, 2007GL032023. [Google Scholar] [CrossRef]
  10. Kay, J.E.; Holland, M.M.; Jahn, A. Inter-annual to Multi-decadal Arctic Sea Ice Extent Trends in a Warming World. Geophys. Res. Lett. 2011, 38, 2011GL048008. [Google Scholar] [CrossRef]
  11. Cavalieri, D.J.; Parkinson, C.L. Arctic Sea Ice Variability and Trends, 1979–2010. Cryosphere 2012, 6, 881–889. [Google Scholar] [CrossRef]
  12. Serreze, M.C.; Stroeve, J. Arctic Sea Ice Trends, Variability and Implications for Seasonal Ice Forecasting. Phil. Trans. R. Soc. A 2015, 373, 20140159. [Google Scholar] [CrossRef] [PubMed]
  13. Wang, Y.; Bi, H.; Huang, H.; Liu, Y.; Liu, Y.; Liang, X.; Fu, M.; Zhang, Z. Satellite-Observed Trends in the Arctic Sea Ice Concentration for the Period 1979–2016. J. Ocean. Limnol. 2019, 37, 18–37. [Google Scholar] [CrossRef]
  14. Francis, J.A.; Hunter, E. Changes in the Fabric of the Arctic’s Greenhouse Blanket. Environ. Res. Lett. 2007, 2, 045011. [Google Scholar] [CrossRef]
  15. Polyakov, I.V.; Walsh, J.E.; Kwok, R. Recent Changes of Arctic Multiyear Sea Ice Coverage and the Likely Causes. Bull. Amer. Meteor. Soc. 2012, 93, 145–151. [Google Scholar] [CrossRef]
  16. Screen, J.A.; Simmonds, I. Declining Summer Snowfall in the Arctic: Causes, Impacts and Feedbacks. Clim. Dyn. 2012, 38, 2243–2256. [Google Scholar] [CrossRef]
  17. Kapsch, M.-L.; Graversen, R.G.; Tjernström, M. Springtime Atmospheric Energy Transport and the Control of Arctic Summer Sea-Ice Extent. Nat. Clim. Chang. 2013, 3, 744–748. [Google Scholar] [CrossRef]
  18. Olonscheck, D.; Mauritsen, T.; Notz, D. Arctic Sea-Ice Variability Is Primarily Driven by Atmospheric Temperature Fluctuations. Nat. Geosci. 2019, 12, 430–434. [Google Scholar] [CrossRef]
  19. Graversen, R.G.; Wang, M. Polar Amplification in a Coupled Climate Model with Locked Albedo. Clim. Dyn. 2009, 33, 629–643. [Google Scholar] [CrossRef]
  20. Screen, J.A.; Simmonds, I. The Central Role of Diminishing Sea Ice in Recent Arctic Temperature Amplification. Nature 2010, 464, 1334–1337. [Google Scholar] [CrossRef]
  21. Flanner, M.G.; Shell, K.M.; Barlage, M.; Perovich, D.K.; Tschudi, M.A. Radiative Forcing and Albedo Feedback from the Northern Hemisphere Cryosphere between 1979 and 2008. Nat. Geosci. 2011, 4, 151–155. [Google Scholar] [CrossRef]
  22. Sedlar, J.; Tjernström, M.; Mauritsen, T.; Shupe, M.D.; Brooks, I.M.; Persson, P.O.G.; Birch, C.E.; Leck, C.; Sirevaag, A.; Nicolaus, M. A Transitioning Arctic Surface Energy Budget: The Impacts of Solar Zenith Angle, Surface Albedo and Cloud Radiative Forcing. Clim. Dyn. 2011, 37, 1643–1660. [Google Scholar] [CrossRef]
  23. Serreze, M.C.; Barry, R.G. Processes and Impacts of Arctic Amplification: A Research Synthesis. Glob. Planet. Chang. 2011, 77, 85–96. [Google Scholar] [CrossRef]
  24. Cohen, J.; Zhang, X.; Francis, J.; Jung, T.; Kwok, R.; Overland, J.; Ballinger, T.J.; Bhatt, U.S.; Chen, H.W.; Coumou, D.; et al. Divergent Consensuses on Arctic Amplification Influence on Midlatitude Severe Winter Weather. Nat. Clim. Chang. 2020, 10, 20–29. [Google Scholar] [CrossRef]
  25. Previdi, M.; Smith, K.L.; Polvani, L.M. Arctic Amplification of Climate Change: A Review of Underlying Mechanisms. Environ. Res. Lett. 2021, 16, 093003. [Google Scholar] [CrossRef]
  26. Duan, C.; Dong, S.; Xie, Z.; Wang, Z. Temporal Variability and Trends of Sea Ice in the Kara Sea and Their Relationship with Atmospheric Factors. Polar Sci. 2019, 20, 136–147. [Google Scholar] [CrossRef]
  27. Belchansky, G.I.; Mordvintsev, I.N.; Ovchinnikov, G.K.; Douglas, D.C. Assessing Trends in Arctic Sea-Ice Distribution in the Barents and Kara Seas Using the Kosmos–Okean Satellite Series. Polar Rec. 1995, 31, 129–134. [Google Scholar] [CrossRef]
  28. Ahn, J.; Hong, S.; Cho, J.; Lee, Y.-W.; Lee, H. Statistical Modeling of Sea Ice Concentration Using Satellite Imagery and Climate Reanalysis Data in the Barents and Kara Seas, 1979–2012. Remote Sens. 2014, 6, 5520–5540. [Google Scholar] [CrossRef]
  29. Kumar, A.; Yadav, J.; Mohan, R. Spatio-Temporal Change and Variability of Barents-Kara Sea Ice, in the Arctic: Ocean and Atmospheric Implications. Sci. Total Environ. 2021, 753, 142046. [Google Scholar] [CrossRef]
  30. Dong, C.; Nie, H.; Luo, X.; Wei, H.; Zhao, W. Mechanisms for the Link between Onset and Duration of Open Water in the Kara Sea. Acta Oceanol. Sin. 2021, 40, 119–128. [Google Scholar] [CrossRef]
  31. Wang, S.; Nath, D.; Chen, W. Nonstationary Relationship between Sea Ice over Kara–Laptev Seas during August–September and Ural Blocking in the Following Winter. Int. J. Climatol. 2021, 41, E1608–E1622. [Google Scholar] [CrossRef]
  32. Bareiss, J.; Gorgen, K. Spatial and Temporal Variability of Sea Ice in the Laptev Sea: Analyses and Review of Satellite Passive-Microwave Data and Model Results, 1979 to 2002. Glob. Planet. Chang. 2005, 48, 28–54. [Google Scholar] [CrossRef]
  33. Selyuzhenok, V.; Krumpen, T.; Mahoney, A.; Janout, M.; Gerdes, R. Seasonal and Interannual Variability of Fast Ice Extent in the Southeastern L Aptev S Ea between 1999 and 2013. JGR Oceans 2015, 120, 7791–7806. [Google Scholar] [CrossRef]
  34. Rehder, Z.; Niederdrenk, A.L.; Kaleschke, L.; Kutzbach, L. Analyzing Links between Simulated Laptev Sea Sea Ice and Atmospheric Conditions over Adjoining Landmasses Using Causal-Effect Networks. Cryosphere 2020, 14, 4201–4215. [Google Scholar] [CrossRef]
  35. Peng, G.; Meier, W.N. Temporal and Regional Variability of Arctic Sea-Ice Coverage from Satellite Data. Ann. Glaciol. 2018, 59, 191–200. [Google Scholar] [CrossRef]
  36. Bliss, A.C.; Anderson, M.R. Arctic Sea Ice Melt Onset Timing From Passive Microwave-Based and Surface Air Temperature-Based Methods. JGR Atmos. 2018, 123, 9063–9080. [Google Scholar] [CrossRef]
  37. Meier, W.N.; Stroeve, J.; Fetterer, F. Whither Arctic Sea Ice? A Clear Signal of Decline Regionally, Seasonally and Extending beyond the Satellite Record. Ann. Glaciol. 2007, 46, 428–434. [Google Scholar] [CrossRef]
  38. Meier, W.; Fetterer, F.; Windnagel, A.; Stewart, S. NOAA/NSIDC Climate Data Record of Passive Microwave Sea Ice Concentration, Version 4 [Data Set]; National Snow and Ice Data Center: Boulder, CO, USA, 2021. [Google Scholar] [CrossRef]
  39. Cavalieri, D.J.; Gloersen, P.; Campbell, W.J. Determination of Sea Ice Parameters with the NIMBUS 7 SMMR. J. Geophys. Res. 1984, 89, 5355–5369. [Google Scholar] [CrossRef]
  40. Comiso, J.C. Characteristics of Arctic Winter Sea Ice from Satellite Multispectral Microwave Observations. J. Geophys. Res. 1986, 91, 975–994. [Google Scholar] [CrossRef]
  41. Fetterer, F.; Knowles, K.; Meier, W.N.; Savoie, M.; Windnagel, A.K. Sea Ice Index, Version 3 [Data Set]; National Snow and Ice Data Center: Boulder, CO, USA, 2017. [Google Scholar] [CrossRef]
  42. Matthews, J.L.; Peng, G.; Meier, W.N.; Brown, O. Sensitivity of Arctic Sea Ice Extent to Sea Ice Concentration Threshold Choice and Its Implication to Ice Coverage Decadal Trends and Statistical Projections. Remote Sens. 2020, 12, 807. [Google Scholar] [CrossRef]
  43. JCOMM Expert Team on Sea Ice. SIGRID-3: A Vector Archive Format for Sea Ice Georeferenced Information and Data; Version 3.0; WMO & IOC: Geneva, Switzerland, 2014; 40p, (WMO TD: 1214), (JCOMM Technical Report, 23). [Google Scholar] [CrossRef]
  44. Afanasyeva, E.V.; Alekseeva, T.A.; Sokolova, J.V.; Demchev, D.M.; Chufarova, M.S.; Bychenkov, Y.D.; Devyataev, O.S. AARI methodology for sea ice charts composition. Russ. Arct. 2019, 7, 5–20. [Google Scholar] [CrossRef]
  45. Peng, G.; Steele, M.; Bliss, A.; Meier, W.; Dickinson, S. Temporal Means and Variability of Arctic Sea Ice Melt and Freeze Season Climate Indicators Using a Satellite Climate Data Record. Remote Sens. 2018, 10, 1328. [Google Scholar] [CrossRef]
  46. Bliss, A.C.; Steele, M.; Peng, G.; Meier, W.N.; Dickinson, S. Regional Variability of Arctic Sea Ice Seasonal Change Climate Indicators from a Passive Microwave Climate Data Record. Environ. Res. Lett. 2019, 14, 045003. [Google Scholar] [CrossRef]
  47. Comiso, J.C. A Rapidly Declining Perennial Sea Ice Cover in the Arctic. Geophys. Res. Lett. 2002, 29, 17-1–17-4. [Google Scholar] [CrossRef]
  48. Steele, M.; Dickinson, S.; Zhang, J.; Lindsay, R.W. Seasonal Ice Loss in the Beaufort Sea: Toward Synchrony and Prediction. JGR Oceans 2015, 120, 1118–1132. [Google Scholar] [CrossRef]
  49. Lavergne, T.; Sørensen, A.M.; Kern, S.; Tonboe, R.; Notz, D.; Aaboe, S.; Bell, L.; Dybkjær, G.; Eastwood, S.; Gabarro, C.; et al. Version 2 of the EUMETSAT OSI SAF and ESA CCI Sea-Ice Concentration Climate Data Records. Cryosphere 2019, 13, 49–78. [Google Scholar] [CrossRef]
  50. Ivanov, V.V.; Alekseev, V.A.; Alekseeva, T.A.; Koldunov, N.V.; Repina, I.A.; Smirnov, A.V. Is Arctic Ice Cover Becoming Seasonal? Issled. Zemli Iz Kosmosa 2013, 4, 50–65. [Google Scholar] [CrossRef]
  51. Dumanskaya, I.O. Ice Conditions in the Seas of the Asian Part of Russia; IG SOTsIN: Obninsk, Russia, 2017; ISBN 978-5-9908623-6-4. [Google Scholar]
  52. Dumanskaya, I.O. Ice Conditions in the Seas of the European Part of Russia; IG SOTsIN: Obninsk, Russia, 2014; ISBN 978-5-91070-064-6. [Google Scholar]
  53. Winsor, P.; Björk, G. Polynya Activity in the Arctic Ocean from 1958 to 1997. J. Geophys. Res. 2000, 105, 8789–8803. [Google Scholar] [CrossRef]
  54. Isaksen, K.; Nordli, Ø.; Ivanov, B.; Køltzow, M.A.Ø.; Aaboe, S.; Gjelten, H.M.; Mezghani, A.; Eastwood, S.; Førland, E.; Benestad, R.E.; et al. Exceptional Warming over the Barents Area. Sci. Rep. 2022, 12, 9371. [Google Scholar] [CrossRef]
  55. Kozlov, I.E.; Kopyshov, I.O.; Frey, D.I.; Morozov, E.G.; Medvedev, I.P.; Shiryborova, A.I.; Silvestrova, K.P.; Gavrikov, A.V.; Ezhova, E.A.; Soloviev, D.M.; et al. Multi-Sensor Observations Reveal Large-Amplitude Nonlinear Internal Waves in the Kara Gates, Arctic Ocean. Remote Sens. 2023, 15, 5769. [Google Scholar] [CrossRef]
  56. Osadchiev, A.; Viting, K.; Frey, D.; Demeshko, D.; Dzhamalova, A.; Nurlibaeva, A.; Gordey, A.; Krechik, V.; Spivak, E.; Semiletov, I.; et al. Structure and Circulation of Atlantic Water Masses in the St. Anna Trough in the Kara Sea. Front. Mar. Sci. 2022, 9, 915674. [Google Scholar] [CrossRef]
  57. Dmitrenko, I.; Tyshko, K.; Kirillov, S.; Eicken, H.; Holemann, J.; Kassens, H. Impact of Flaw Polynyas on the Hydrography of the Laptev Sea. Glob. Planet. Chang. 2005, 48, 9–27. [Google Scholar] [CrossRef]
  58. Yamagami, Y.; Watanabe, M.; Mori, M.; Ono, J. Barents-Kara Sea-Ice Decline Attributed to Surface Warming in the Gulf Stream. Nat. Commun. 2022, 13, 3767. [Google Scholar] [CrossRef] [PubMed]
  59. Steele, M.; Dickinson, S. The Phenology of Arctic Ocean Surface Warming. JGR Oceans 2016, 121, 6847–6861. [Google Scholar] [CrossRef] [PubMed]
  60. Magritsky, D.V.; Vasilenko, A.N.; Frolova, N.L.; Shevchenko, A.I. Temporal and Spatial Patterns of Changes in Thermal Regime of the Rivers in the Northeast of the Asian Part of Russia. 1. Assessment of Changes in the Water Temperature. Water Resour. 2023, 50, 190–201. [Google Scholar] [CrossRef]
  61. Magritsky, D.V.; Vasilenko, A.N.; Frolova, N.L. Temporal and Spatial Patterns of Changes in Thermal Regime of the Rivers in the Northeast of the Asian Part of Russia. 2. Changes in the Heat Flux. Water Resour. 2023, 50, 202–214. [Google Scholar] [CrossRef]
  62. Osadchiev, A.A.; Frey, D.I.; Shchuka, S.A.; Tilinina, N.D.; Morozov, E.G.; Zavialov, P.O. Structure of the Freshened Surface Layer in the Kara Sea During Ice-Free Periods. JGR Oceans 2021, 126, e2020JC016486. [Google Scholar] [CrossRef]
  63. Osadchiev, A.; Frey, D.; Spivak, E.; Shchuka, S.; Tilinina, N.; Semiletov, I. Structure and Inter-Annual Variability of the Freshened Surface Layer in the Laptev and East-Siberian Seas During Ice-Free Periods. Front. Mar. Sci. 2021, 8, 735011. [Google Scholar] [CrossRef]
  64. Osadchiev, A.; Zabudkina, Z.; Rogozhin, V.; Frey, D.; Gordey, A.; Spivak, E.; Salyuk, A.; Semiletov, I.; Sedakov, R. Structure of the Ob-Yenisei Plume in the Kara Sea Shortly before Autumn Ice Formation. Front. Mar. Sci. 2023, 10, 1129331. [Google Scholar] [CrossRef]
  65. Osadchiev, A.; Sedakov, R.; Frey, D.; Gordey, A.; Rogozhin, V.; Zabudkina, Z.; Spivak, E.; Kuskova, E.; Sazhin, A.; Semiletov, I. Intense Zonal Freshwater Transport in the Eurasian Arctic during Ice-Covered Season Revealed by in Situ Measurements. Sci. Rep. 2023, 13, 16508. [Google Scholar] [CrossRef]
  66. Polyakov, I.V.; Alkire, M.B.; Bluhm, B.A.; Brown, K.A.; Carmack, E.C.; Chierici, M.; Danielson, S.L.; Ellingsen, I.; Ershova, E.A.; Gårdfeldt, K.; et al. Borealization of the Arctic Ocean in Response to Anomalous Advection From Sub-Arctic Seas. Front. Mar. Sci. 2020, 7, 491. [Google Scholar] [CrossRef]
  67. Willmes, S.; Heinemann, G.; Schnaase, F. Patterns of Wintertime Arctic Sea-Ice Leads and Their Relation to Winds and Ocean Currents. Cryosphere 2023, 17, 3291–3308. [Google Scholar] [CrossRef]
  68. Ogorodov, S.; Aleksyutina, D.; Baranskaya, A.; Shabanova, N.; Shilova, O. Coastal Erosion of the Russian Arctic: An Overview. J. Coast. Res. 2020, 95, 599. [Google Scholar] [CrossRef]
Figure 1. SIE variability in the (a) Kara and (b) Laptev seas during 1979–2022. Black solid line indicates annual mean values, gray shade indicates monthly minimum and maximum SIE, and dashed lines indicate long-term trends.
Remotesensing 16 01875 g001
Figure 2. Monthly SIE values in the (a) Kara and (b) Laptev seas during 1979–2022.
Remotesensing 16 01875 g002
Figure 3. SIE trends in the (a) Kara and (b) Laptev seas during 1979–2022. Black dots indicate statistically significant trends at a 95% confidence level.
Remotesensing 16 01875 g003
Figure 4. Boxplot for the monthly SIE in the (a) Kara and (b) Laptev seas during 1979–2022. The orange line represents the median.
Remotesensing 16 01875 g004
Figure 5. Frequency of annual sea ice retreat in the Kara (a) and Laptev (b) seas during 1979–2022. Numbers indicate locations of geographical objects or in situ measurements at stationary polar stations: 1—Baydaratskaya Gulf, 2—Buor-Khaya Gulf, 3—Chelyuskin Cape, 4—Golomyanii Island, 5—Gyda Yuribey Gulf, 6—Kara Gates Strait, 7—Khatanga Gulf, 8—Kigiliakh, 9—Kotelny Island, 10—Lena Delta, 11—Novaya Zemlya, 12—Gulf of Ob, 13—Sannikov Strait, 14—Severnaya Zemlya, 15—Sterlegova Cape, 16—Vaigach Island, 17—Vilkitsky Strait, 18—Vize Island, 19—Yamal Peninsula, 20—Yenisei Gulf.
Remotesensing 16 01875 g005
Figure 6. Spatial distribution of LTM for DOR (monthly ten-day periods) in the Kara (a) and Laptev (b) seas during 1979–2022.
Remotesensing 16 01875 g006
Figure 7. Spatial distribution of fast ice frequency (%) in the first ten-day period of April in the (a) Kara and (b) Laptev seas during 2008–2022.
Remotesensing 16 01875 g007
Figure 8. Spatial distribution of LTM for DOA (monthly ten-day periods) in the (a) Kara and (b) Laptev seas during 1979–2022.
Remotesensing 16 01875 g008
Figure 9. Spatial distribution of LTM for IFP in the Kara (a) and Laptev (b) seas during 1979–2022.
Remotesensing 16 01875 g009
Figure 10. Spatial distribution of DOR trends (days/decade) in the (a) Kara and (b) Laptev seas during 1979–2022.
Remotesensing 16 01875 g010
Figure 11. Spatial distribution of DOA trends (days/decade) in the (a) Kara and (b) Laptev seas during 1979–2022.
Remotesensing 16 01875 g011
Figure 12. Spatial distribution of IFP trends (days/decade) in the (a) Kara and (b) Laptev seas during 1979–2022.
Remotesensing 16 01875 g012
Table 1. The main statistical parameters (mean, standard deviation, and five-number summary) of LTM for IFP, DOA, and DOR during 1979–2022.
IFP, DaysDOADOR
KaraLaptevKaraLaptevKaraLaptev
Mean946924 October8 October22 July31 July
Standard deviation22131331112
Minimum332824 September22 September25 June26 June
Q1, 25%776114 October6 October15 July23 July
Q2, 50%917119 October8 October21 July30 July
Q3, 75%1097730 October10 October1 August9 August
Maximum1511074 December16 October23 August29 August
Table 2. The main statistical parameters (mean, standard deviation, minimum, percentiles, and maximum) for IFP, DOA, and DOR linear trends (day/decade) during 1979–2022.
IFPDOADOR
KaraLaptevKaraLaptevKaraLaptev
Mean20.216.08.76.7−11.9−9.5
Standard deviation5.04.32.42.23.22.8
Minimum−17.56.84.11.6−22.7−23.4
25%17.212.37.15.1−13.5−11.3
50%19.916.38.86.7−11.3−9.5
75%22.919.010.17.9−9.9−7.0
Maximum39.835.623.113.312.8−3.8
Disclaimer/Publisher’s Note: The statements, opinions and data contained in all publications are solely those of the individual author(s) and contributor(s) and not of MDPI and/or the editor(s). MDPI and/or the editor(s) disclaim responsibility for any injury to people or property resulting from any ideas, methods, instructions or products referred to in the content.

