Article

Investigating Wind Characteristics and Temporal Variations in the Lower Troposphere over the Northeastern Qinghai–Tibet Plateau Using a Doppler LiDAR

1
Plateau Atmosphere and Environment Key Laboratory of Sichuan Province, School of Atmospheric Sciences, Chengdu University of Information Technology, Chengdu 610225, China
2
China Meteorological Administration Key Laboratory for Aviation Meteorology, Beijing 100081, China
3
Hubei Key Laboratory for Heavy Rain Monitoring and Warning Research, Institute of Heavy Rain, China Meteorological Administration, Wuhan 430205, China
4
Qinghai Sub-Bureau of Civil Aviation Administration of China, Northwest Region Air Traffic Management Bureau, Xining 810000, China
*
Author to whom correspondence should be addressed.
Remote Sens. 2024, 16(11), 1840; https://doi.org/10.3390/rs16111840
Submission received: 8 May 2024 / Revised: 19 May 2024 / Accepted: 20 May 2024 / Published: 22 May 2024

Abstract

:
Knowledge of wind field characteristics and variation principles in complex topographical regions is of great importance for the development of numerical prediction models, aviation safety support, and wind energy utilization. However, there has been limited research focused on the lower-tropospheric wind fields in the Qinghai-Tibet Plateau. This paper aims to study the wind characteristics, vertical distributions, and temporal variations in the northeast of the plateau by analyzing a four-year continuous dataset collected from a Doppler wind LiDAR deployed in Xining, Qinghai Province of China. The results indicate that the prevailing horizontal wind direction in the low levels is primarily influenced by the mountain-valley wind circulation. However, as the altitude increases, the prevailing winds are predominantly affected by the westerlies. From a diurnal perspective, noticeable transition processes between up-valley and down-valley winds can be observed. The west-northwest wind (down-valley wind) dominates from late night to morning, while the east-southeast wind (up-valley wind) prevails from afternoon to early evening. The vertical winds in the low levels exhibit a downward motion during the daytime and an upward motion during the nighttime. In this plateau valley, the wind shear exponent is found to be highest in spring and lowest in winter, and it is generally lower during the daytime compared to the nighttime.

Graphical Abstract

1. Introduction

The lower troposphere is the primary region for the exchange of material, water, and energy between the free atmosphere and the planetary boundary layer (PBL). Observing and studying wind fields in the lower troposphere are crucial for understanding the intricate land-atmosphere physical processes and improving the accuracy of numerical models in simulating and forecasting the climate, the weather, and air pollution [1,2,3]. Additionally, they play an essential role in bridge design, aviation flight safety support, and wind power utilization [4,5,6].
The characteristics of wind fields within the lower troposphere are influenced by many natural and anthropogenic factors, such as atmospheric dynamics, thermal conditions, terrains, underlying surface properties, and the built environment. In recent years, numerous researchers have investigated the lower-tropospheric wind fields in various regions with different instruments [7,8,9,10,11,12,13,14]. For example, Resmi (2019) [15] analyzed observations from the Sound Detection and Ranging (SODAR) in the Ganges River basin in India and revealed that the wind speeds can reach their peak between 10 m and 200 m levels during the monsoon season. Moreover, the wind fields in the lower troposphere of this region exhibit seasonal variations due to the impact of large-scale flow patterns or disturbances. Zhang (2021) [16] utilized data from anemometers installed at different heights on a 325 m meteorological tower to investigate the low-level winds in Beijing. Their findings indicated that high wind speeds in Beijing primarily originate from the northwest, while low wind speeds predominantly come from the south. Additionally, the wind direction exhibits seasonal variations, with northwest winds prevailing in winter and southwest winds dominating in summer; spring and autumn can be considered transitional seasons. Li (2023) [17] employed a decade-long dataset from a microwave-band wind profile radar located in the Shenzhen Pearl River Estuary to investigate temporal variations in lower-tropospheric winds. The results demonstrated a decreasing trend in lower-tropospheric wind speed in this transitional region between the ocean and land on an interannual scale. Notably, the decrease in wind speed during winter is more pronounced than in summer, and the decline is more significant in the upper PBL compared to the lower PBL.
With the advancement of photoelectric technology and components, the Doppler wind LiDAR (DWL) has rapidly developed and gradually emerged as one of the more sophisticated forms of wind observation equipment [18,19]. Due to its good accuracy and high spatiotemporal resolution, the DWL has been widely utilized by numerous scientists for detecting wind fields in the lower troposphere [20,21,22,23,24,25,26,27]. To obtain a comprehensive understanding of the wind characteristics in central London, Wood (2013) [28] employed a scanning DWL to observe the airflow patterns over the Thames River. They found that the highest wind speeds were observed at the center of the river channel. The interaction between north-south airflow and the river led to a decrease in turbulence intensity. On clear days, the airflow velocity above the river channel exhibited significant variations. Similarly, Yi (2023) [29] utilized the DWL to examine the wind fields at altitudes ranging from 40 m to 200 m above the surface on Jeju Island, South Korea. They pointed out that the maximum wind speeds occurred at lower-altitude areas during the daytime, while they were observed at higher-altitude areas during the nighttime.
The Qinghai-Tibet Plateau (QTP) is located in southwestern China, and it is known as the highest plateau in the world. The complex topography of the QTP results in uneven thermal and water vapor conditions, significant land-atmosphere interactions, and intricate kinetic processes within the lower troposphere [30,31]. However, the meteorological observation network in this region is limited due to its challenging natural conditions and complex terrains. Only a few scientific observation experiments have been conducted on the lower-troposphere winds in the central, southern, and western parts of the QTP [32,33,34,35,36]. According to the radiosonde data collected at Namco Lake (located in the central QTP), Lü (2008) [37] found that the lake’s cold effect prolongs the turbulent mixing time of the PBL. Additionally, the diurnal variation of the lake-land breeze in the PBL is significant under sunny conditions. This lake-land breeze can even extend beyond the PBL’s height and reach into the middle troposphere. Another study by Wang (2010) [38] focused on wind measurements from a meteorological tower in the Lulang Valley, located in the southeast QTP. They discovered that the wind field in this low-lying area is rarely influenced by external flows and has a very low annual wind speed. They also suggested that the average wind speed in March is higher than in any other month, while September has the lowest average wind speed. The daily maximum wind speed peaks in March and reaches its lowest point in July.
Due to the vast coverage and complex terrains of the QTP, the lower troposphere likely exhibits different effects on various underlying surfaces. However, there has been limited research focused on the detailed observation and analysis of the lower-tropospheric wind fields in the northeast region of the QTP, despite it being one of the most densely populated subregions of the plateau. This paper aims to examine the wind characteristics and variations in this plateau subregion by analyzing a four-year, continuous, high-spatial-resolution wind dataset collected from a DWL deployed in Xining, Qinghai Province. This study intends to establish a foundation for local meteorological operations, relevant research, and other domains, such as wind power utilization and tourism resource development. In the following sections, Section 2 provides information on the study area, instrument, measurement, and methods used. Section 3 presents a detailed analysis and the results of wind characteristics, including vertical distributions, seasonal and diurnal changes, and the relationship between wind speed and height. In Section 4, we compare and discuss our findings with those reported in previous studies. Finally, the main conclusions are summarized in Section 5.

2. Instrument, Data, and Methods

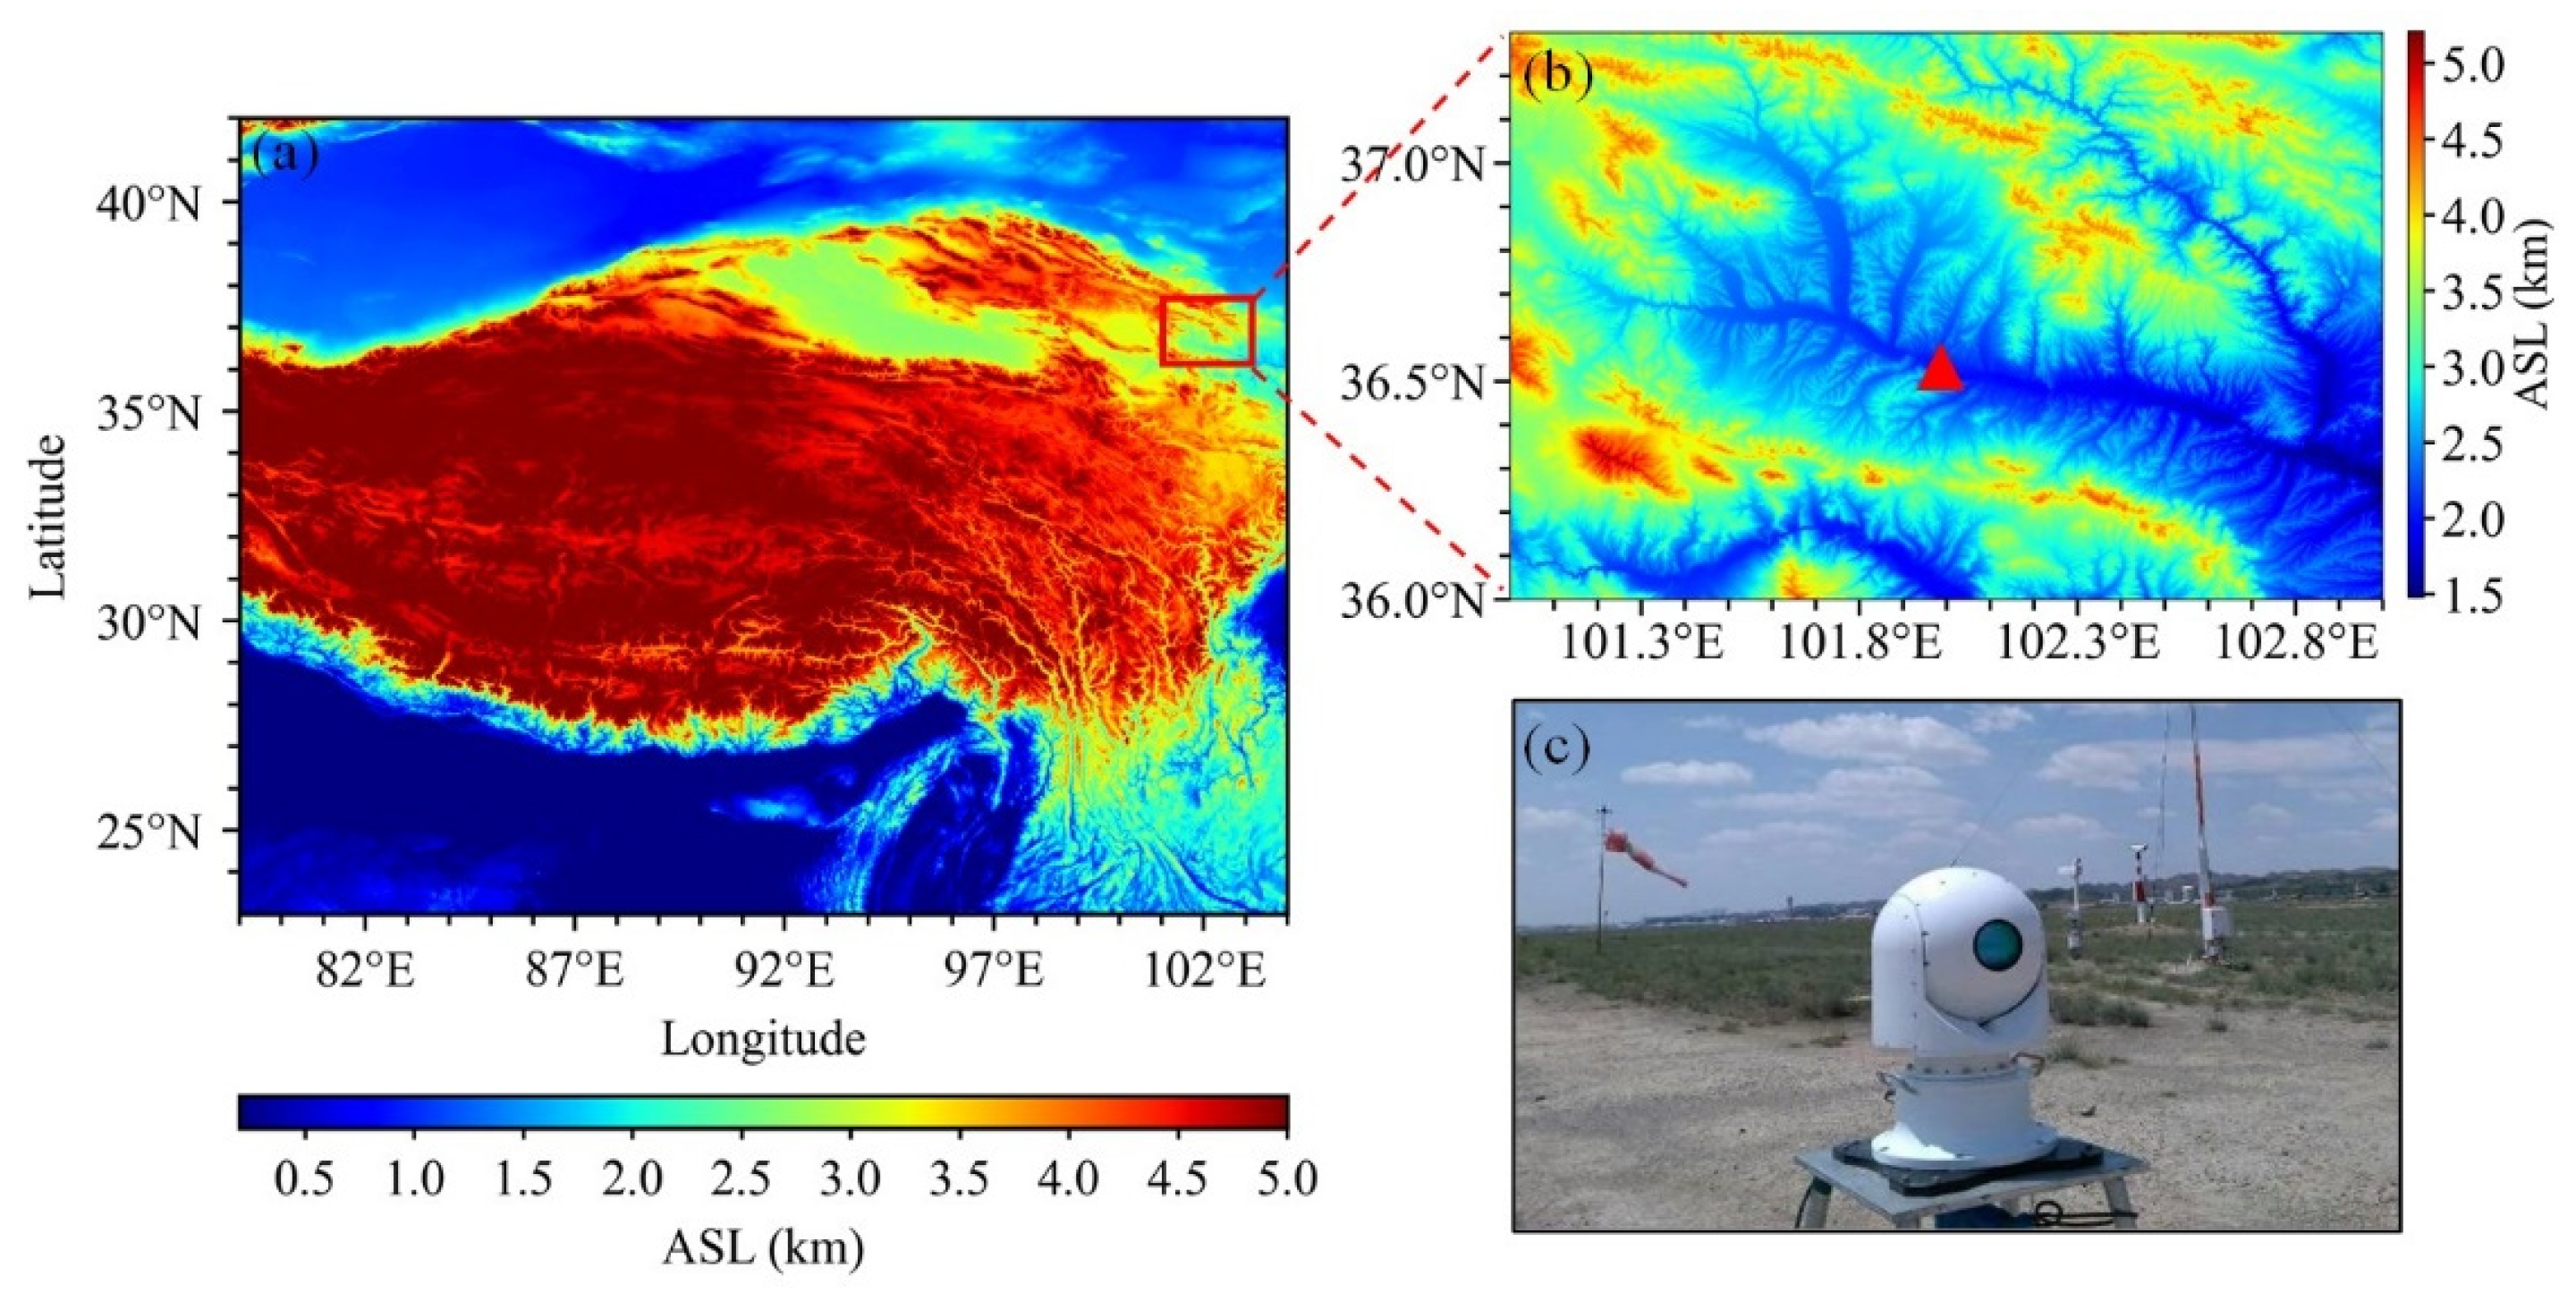
2.1. Observation Site, Instrument, and Measurement

The wind measurements utilized in this study were obtained from a three-dimensional DWL between 2019 and 2022 at a site (36.53°N, 102.04°E, 2160 m above sea level) situated in the Xining City of the Huangshui River Valley. As shown in Figure 1, the valley exhibits an east-southeast to west-northwest orientation, with an overall upward trend in average elevation along this axis. The observation site is set at the center of the valley, encompassed by towering mountains and deep ravines, wherein elevation gradients surpassing 2 km are prevalent. Due to the influences of solar radiation and temperature differentials, such topography can lead to frequent alterations in local wind patterns and complicated terrain-induced turbulence. Consequently, the local wind fields become considerably intricate and challenging to forecast. Moreover, the venturi effect induced by the terrain amplifies wind speeds when westerly and easterly winds ingress into the valley.
The DWL is a fully fiber-optic, pulsed, coherent LiDAR manufactured by the No. 209 Institute of China North Industries Group Corporation Limited. It emits laser pulse signals and receives backscattered signals from atmospheric aerosols. By analyzing the Doppler frequency shift of the returned signals, the DWL determines the radial velocities of targets and the corresponding horizontal and vertical winds. Operating at a wavelength of 1.55 µm, the LiDAR has a maximum horizontal detection range of 10 km and a maximum vertical detection height of 3–5 km, depending on atmospheric conditions. The spatial resolution of the DWL is 28 m. The main technical parameters of the DWL are listed in Table 1. The DWL regularly operates in a cycle of four scanning modes, including the Plan Position Indicator mode (PPI), the Doppler Beam Swing mode (DBS), the Range Height Indicator mode (RHI), and the Glide Path mode (GP), with a total duration of 12 min. For the statistical analysis of wind characteristics at the observation site, in this study, only measurements from the DBS mode, namely, vertical profiles of horizontal and vertical wind speed and direction, were utilized. The duration of the DBS mode is 3 s. Previous research has extensively verified the reliability and accuracy of wind profiles obtained through the DBS technique using Doppler LiDAR [39,40,41]. Notably, Fan et al. (2017) [19] conducted an evaluation of the same DWL used in this study by comparing it with radiosonde observations. Their validation concluded that the mean error, standard deviation, and correlation coefficient of horizontal wind speeds between the two instruments are <0.5 m/s, 0.405 m/s, and 0.963, respectively.
To preliminarily assess the detection performance of the DWL, the monthly data acquisition rate (MDAR) was calculated at various heights above the ground level (AGL), as illustrated in Figure 2. The MDAR is defined as the ratio of effective data counts to the total operating data counts within vertical intervals over a month. Figure 2 demonstrates a decrease in the MDAR with increasing height, attributable to the decline in aerosol particle concentration from the surface to the upper atmosphere. In general, the MDARs below 2.5 km maintain an annual value exceeding 60%, while the MDARs around 3.5 km decrease to below 40% for most months. From March to August, the MDARs above 2.5 km are higher compared to those from September to February. This disparity can be primarily attributed to the stronger solar heating effect and increased turbulent activity during the former period, resulting in enhanced aerosol diffusion. Additionally, it is worth noting that the occurrence of more frequent sand-dust weather triggered by cold air in the local area during spring can also contribute to larger MDARs at high altitudes, relative to other seasons [42].

2.2. Methods

The following methods were implemented before the subsequent analysis. First, the dataset was divided into four groups to analyze the seasonal variation of winds over the observation site. Second, probability distributions of horizontal and vertical winds at different height layers were computed to compare the measurements from a vertical perspective. Third, to explore the diurnal changes of wind fields at different levels of the local atmosphere, four representative height layers were defined as follows: the near-surface layer (NL, 70 m, AGL), the lower layer (LL, 884 m, AGL), the middle layer (ML, 1650 m, AGL), and the upper layer (UL, 2465 m, AGL). These specific height layers were selected based on observation results from previous research [42,43,44,45] to approximately represent the bottom of the boundary layer up to the free atmosphere. Fourth, an empirical relationship between the horizontal wind speed and the height in the research area was investigated using the power law function. This function is commonly used to describe wind patterns above a solid boundary [46,47,48], as follows
V 2 = V 1 ( Z 2 Z 1 ) α
where V 1 (m/s) and V 2 (m/s) represent the horizontal wind speeds at heights Z 1 (m) and Z 2 (m), respectively. α is the wind shear exponent, which indicates the increasing rate of wind speed with height. A large α typically denotes a rapid vertical growth in wind speed, while a small α suggests a more gradual increase. Herein, average wind speeds at different heights were calculated, and a curve-fitting analysis was performed to determine the value of α .

3. Results

In this section, a comprehensive analysis of wind characteristics and variabilities at this plateau site is conducted, focusing on vertical distributions, seasonal variations, and diurnal changes of horizontal and vertical winds. Furthermore, empirical relationships between horizontal wind speeds and heights specific to the local area are proposed.

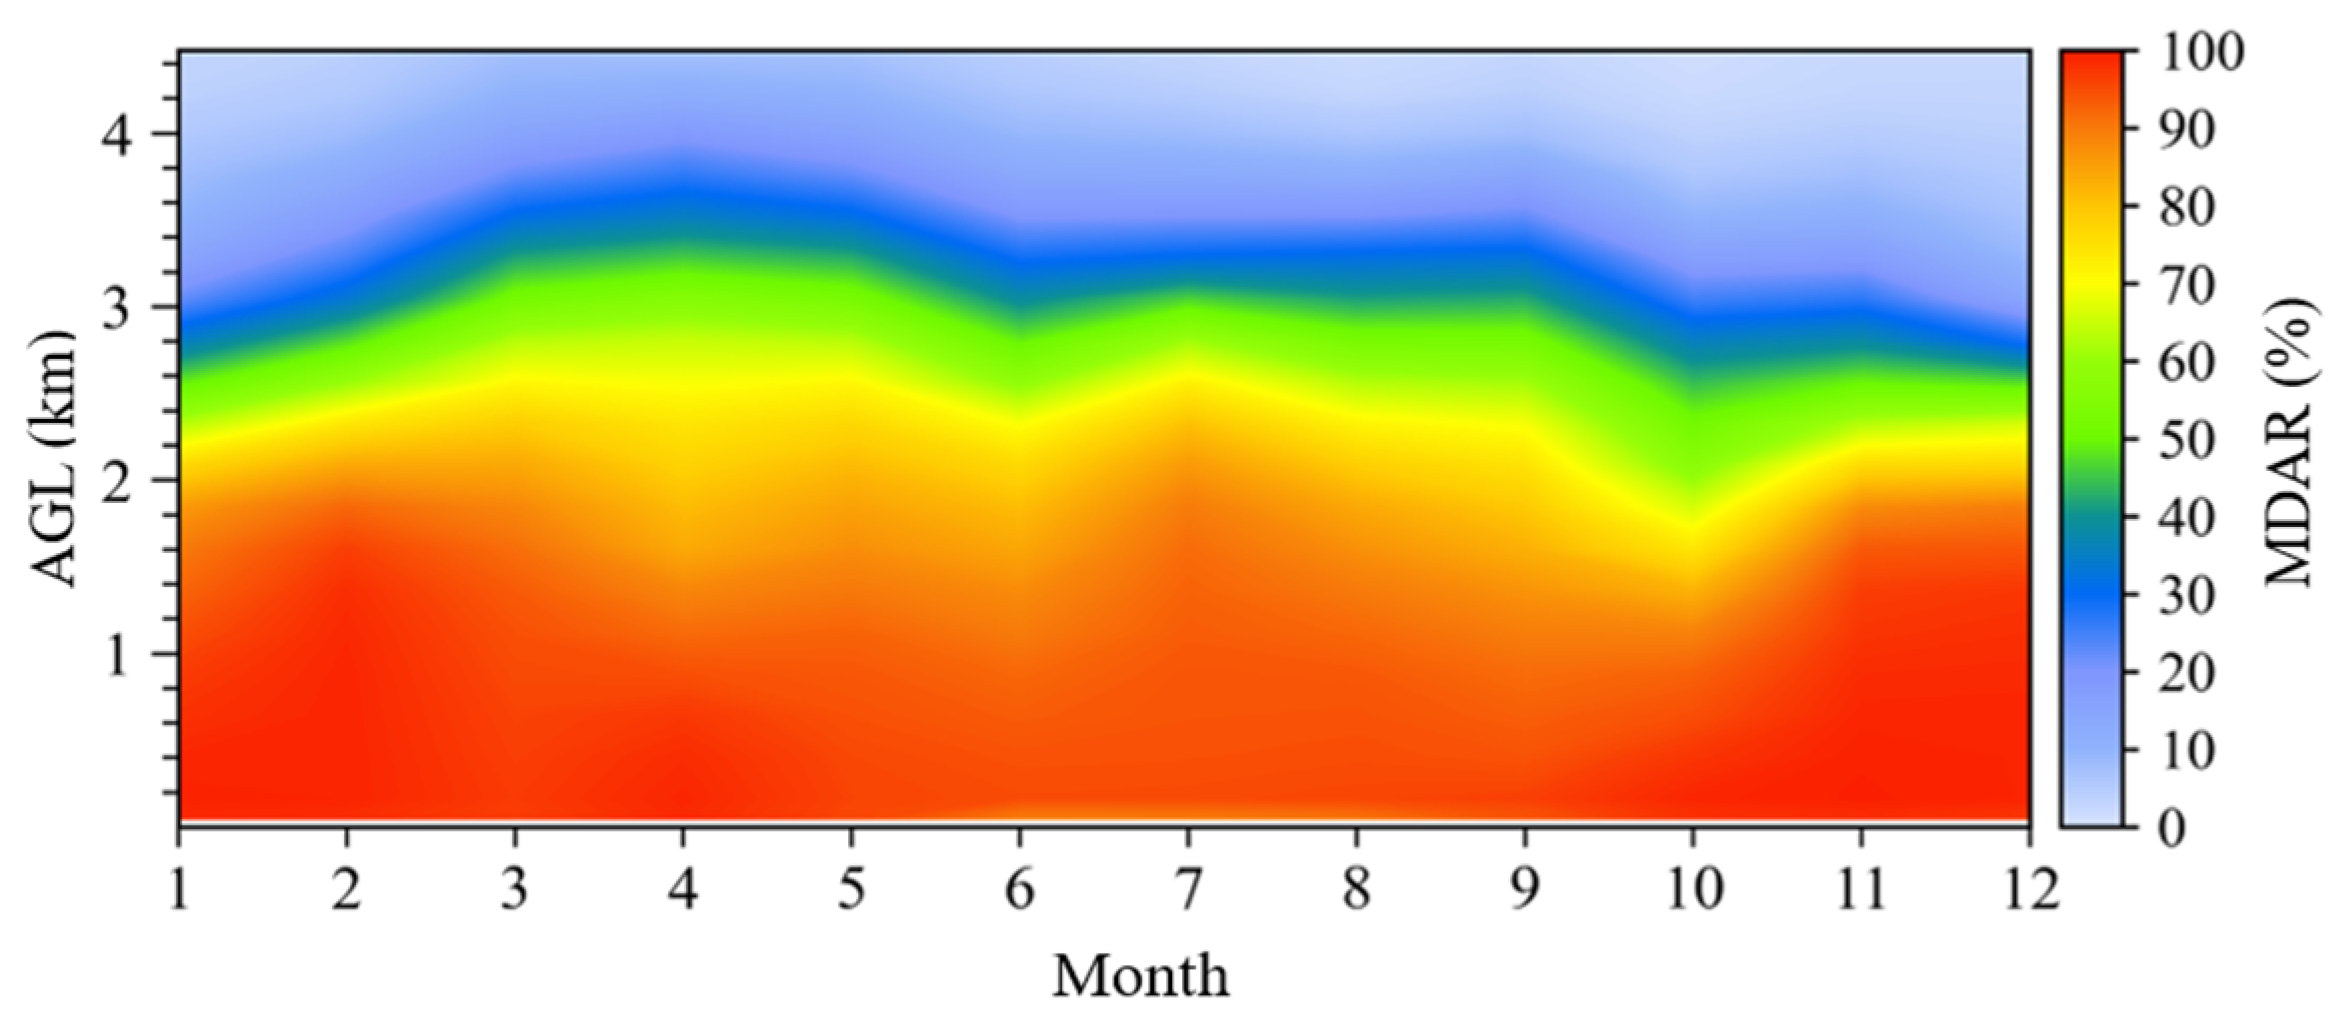
3.1. Vertical Distributions and Seasonal Variations of Winds

Figure 3 illustrates the probability distributions of the horizontal wind direction (HWD), horizontal wind speed (HWS), and vertical wind speed (VWS) at various height levels during different seasons. Note that the positive values of the VWS indicate upward motion, while negative values represent downward motion.
It can be observed from Figure 3(a1–d1) that the prevailing wind directions at lower levels (below approximately 1.5 km, 2.0 km, 1.4 km, and 1.0 km for spring, summer, autumn, and winter, respectively) over the site are east-southeast and west-northwest. This is consistent with the orientation of the valley and is mainly influenced by the mountain-valley wind circulation and topographic-forcing winds of synoptic systems. However, the development height of the east-southeast wind (up-valley wind) varies with the seasons, with the highest top in summer (more than 2 km), followed by spring and autumn (around 1.5 km), and the lowest top in winter (around 1 km). The development height of the west-northwest wind (down-valley wind) is much lower than that of the up-valley wind. The down-valley wind mainly concentrates below 800 m, and its proportion in cold seasons can be higher than in warm seasons. As the altitude exceeds the top of the east-southeast wind layer, the upper atmospheric HWD transitions to be westerly across all seasons due to the influence of the westerlies, a prevailing wind belt in the mid-latitudes of the Northern Hemisphere under the influence of Coriolis force.
The vertical probability distributions of the HWS are displayed in Figure 3(a2–d2). A moderate increase in the HWS with height is found under 2.5 km, 3.0 km, 2.4 km, and 1.5 km for spring, summer, autumn, and winter, respectively. However, above these heights, the wind speed shows a significantly larger increasing rate in all seasons. Moreover, the HWS in cold seasons is generally higher than in warm seasons, particularly in winter, when the HWS in the upper atmosphere can reach a maximum compared to other seasons. This may be attributed to the fact that the upper-level high-speed winds from the westerlies exhibit their maximum volume vertically from 500 hPa to 100 hPa during winter [49]. Regarding the concentration of HWS distribution, the lower atmosphere exhibits a higher concentration than the upper atmosphere, primarily below 5 m/s in summer (under 3 km) and autumn (under 2.5 km) [50], with low wind speeds constituting relatively small proportions in winter and spring.
As shown in Figure 3(a3–d3), the VWS within 200 m predominantly ranges from −0.2 to 0.2 m/s, indicating a comparable intensity of upward and downward air motions in this height range. This observation highlights the presence of vertical turbulence resulting from topographical factors and relatively disordered turbulent activities in the local near-surface layer [51]. For heights above 200 m, the air is mainly dominated by updrafts with speeds ranging from 0 to 0.3 m/s.

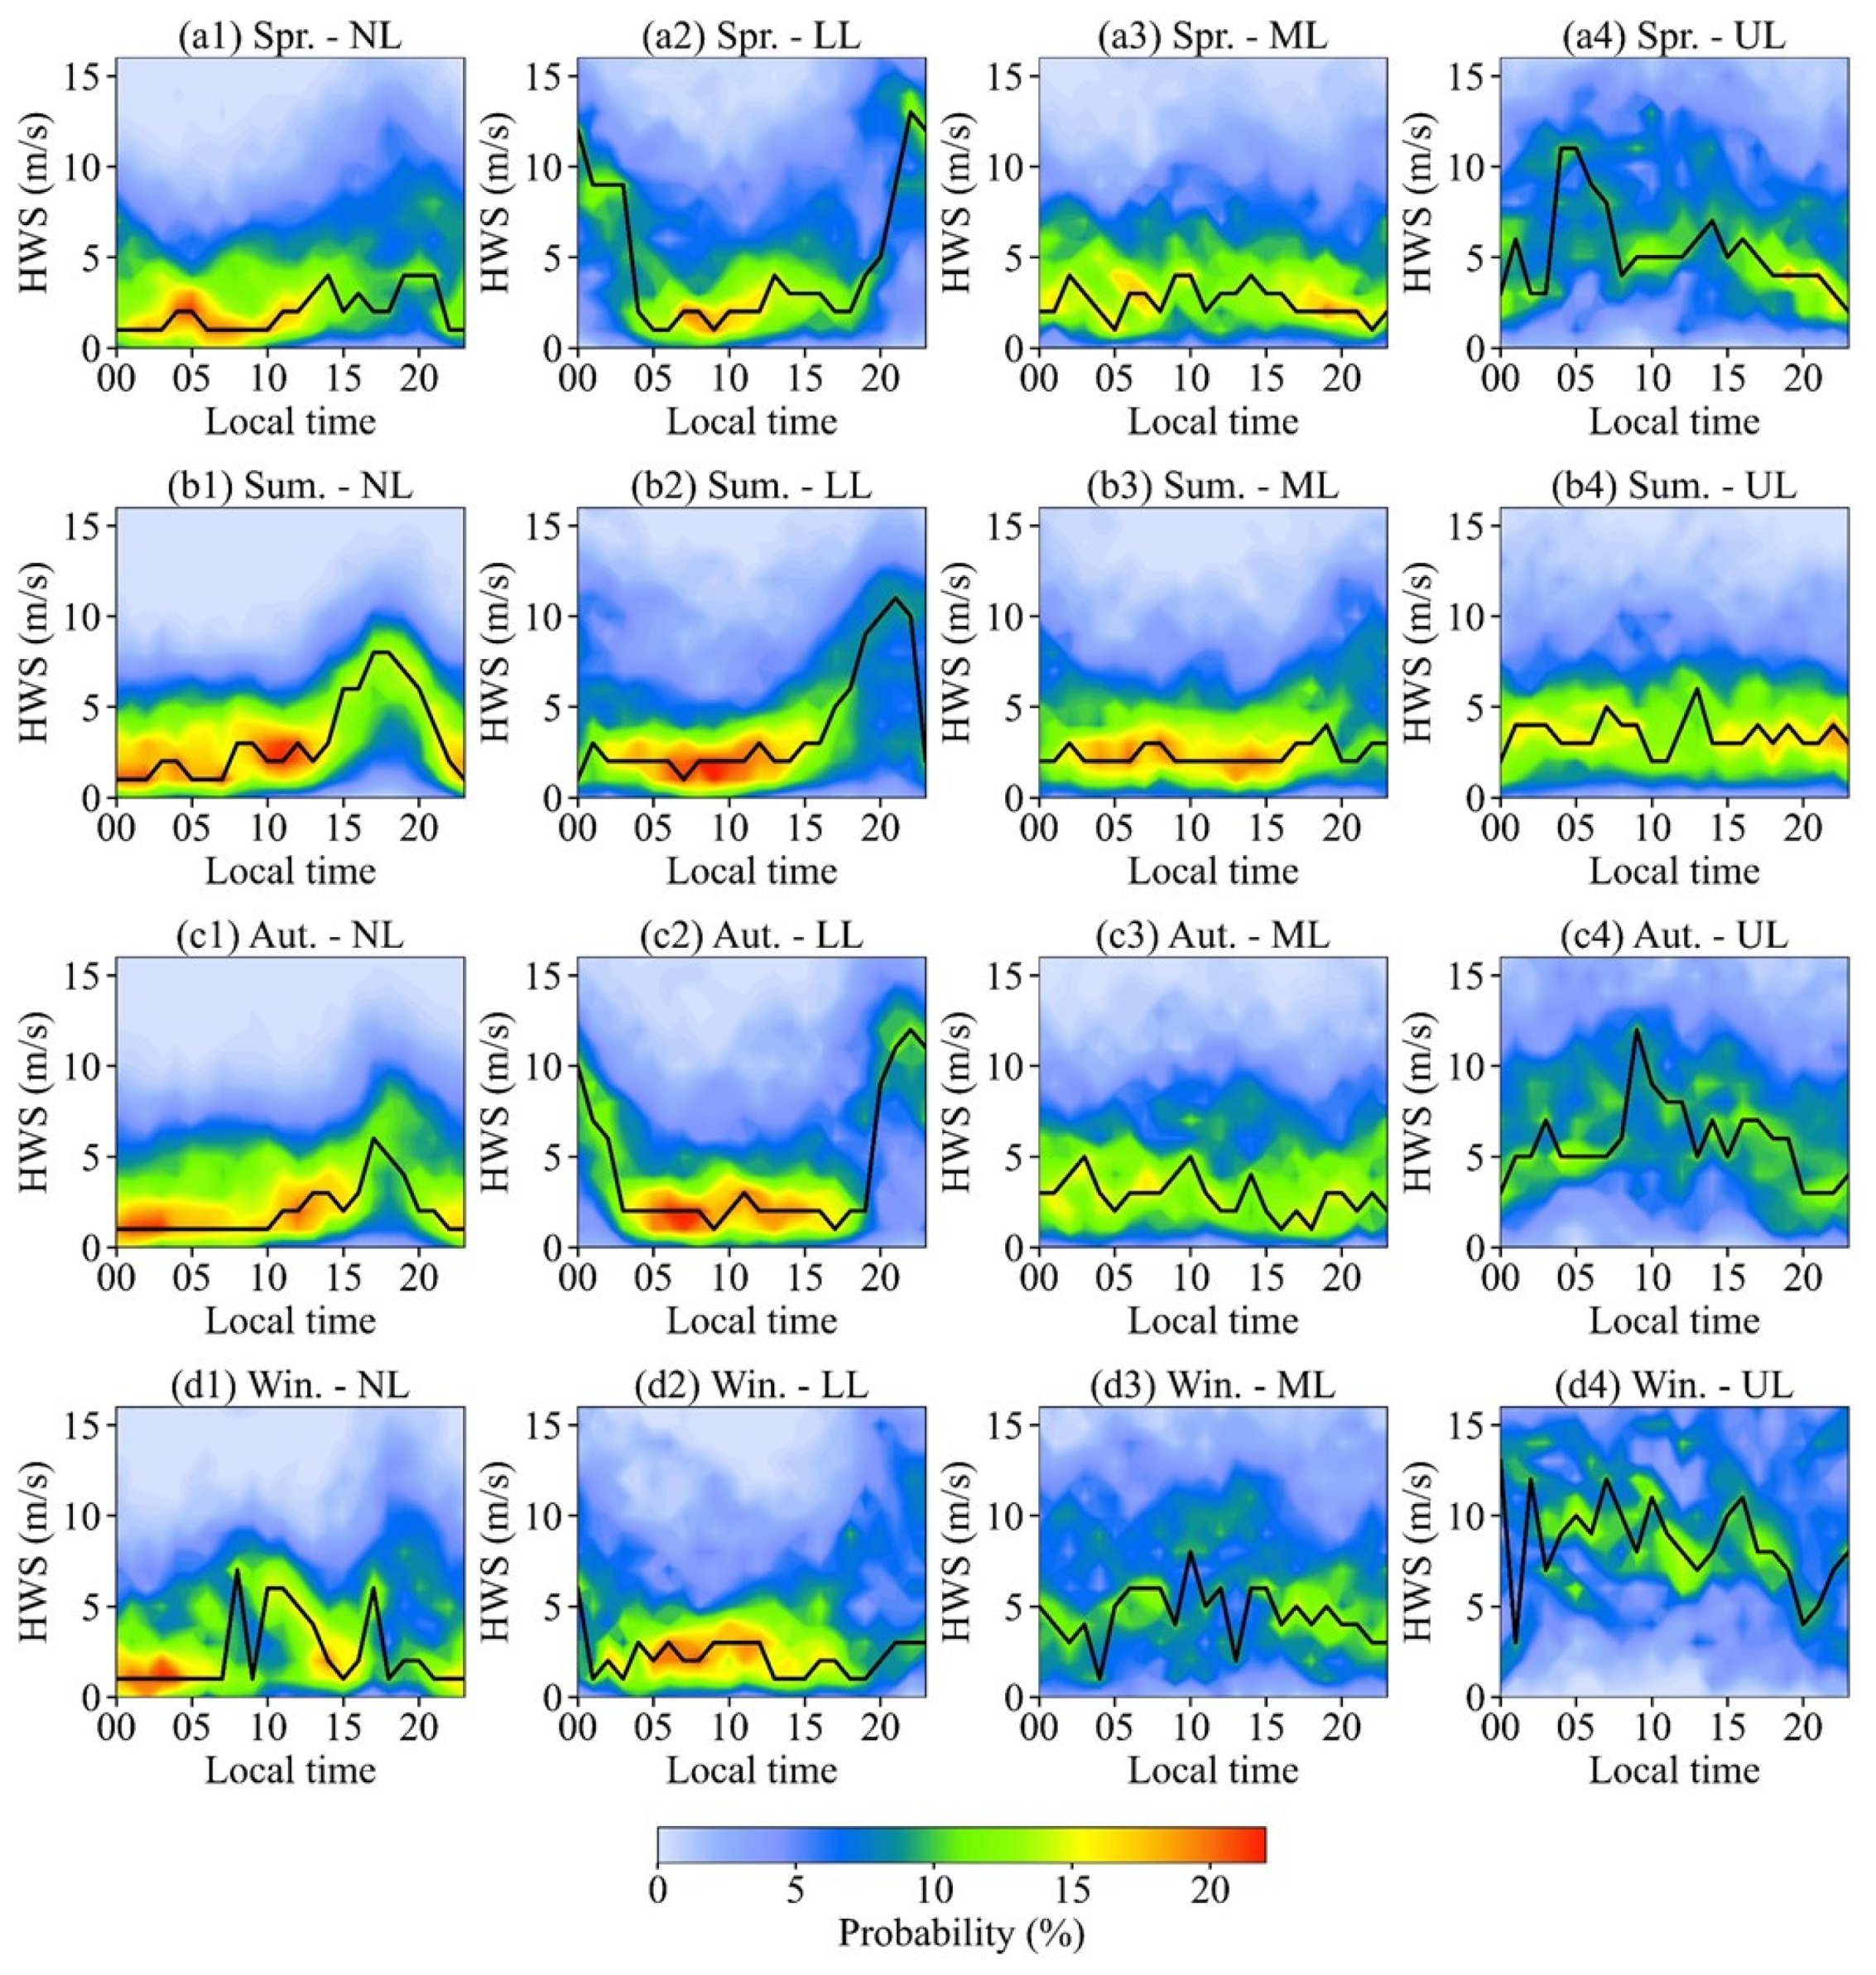
3.2. Diurnal Variations of Winds

Probability distributions of the HWD, HWS, and VWS at different hours in four representative layers of the local atmosphere during four seasons were further calculated to investigate the wind’s diurnal variabilities and characteristics. Note that the local average sunrise times for spring, summer, autumn, and winter during the observation period are approximately 07:00 L.T., 06:04 L.T., 07:09 L.T., and 08:15 L.T., respectively. The corresponding average sunset times are 19:18 L.T., 20:19 L.T., 18:37 L.T., and 18:18 L.T., respectively. Figure 4 presents the hourly probability distribution of the HWD. Figure 4(a1–d1) illustrate that the prominent transition feature of the wind direction in the NL was observed in all seasons. Specifically, the west-northwest wind (down-valley wind) dominates from late night to morning, while the east-southeast wind (up-valley wind) prevails from afternoon to early evening. In both spring and summer, the down-valley wind shifts to the up-valley wind around 11:00 local time (L.T., which is the same as Beijing Standard Time), which is consistent with the findings of Liu et al. (2010) [52]. In autumn, the transition of the wind direction occurs around 13:00 L.T., while in winter, it tends to be delayed until around 15:00 L.T. due to the later sunrise and the weakest solar radiation, leading to slower mountain heating. Additionally, the duration of down-valley wind is the shortest in spring, lasting for approximately 7 h, followed by summer and autumn. It is the longest in winter when it can persist for around 13 h. The strength of the mountain-valley wind circulation weakens with height. As illustrated in Figure 4(a2–d2), although the transition of wind directions in the LL can still be observed in autumn and winter, the duration of down-valley wind becomes shorter compared to the NL. In spring and summer, east-southeast winds prevail throughout the day in the LL.
The influence of the upper-level westerly winds in the ML varies seasonally, as depicted in Figure 4(a3–d3). In summer, the ML is minimally affected by the westerlies, while in winter it is predominantly influenced by the westerly winds. Summer and winter exhibit prevailing east-southeast and westerly winds throughout the day, respectively. At a height up to the UL (Figure 4(a4–d4), it becomes evident that westerly winds dominate in spring, autumn, and winter. However, the diurnal variation of the wind direction in summer resembles that at the ML in spring and autumn, with westerly winds prevailing from 05:00 L.T. to 17:00 L.T., and east-southeast winds prevailing at other times. Furthermore, in summer, the wind direction shows more dispersion due to stronger turbulence and convective activity. Generally, the NL experiences the influence of mountain–valley wind circulation, which weakens with increasing height, while the impact of the westerlies belt gradually strengthens.
Figure 5 illustrates the hourly probability distribution of the HWS. Figure 5(a1–d1) indicate a gradual increase in the HWS from the afternoon to the early evening in the NL. Moreover, the distribution of the HWS appears to be more concentrated during warm seasons or nighttime compared to cold seasons or daytime. As the height rises into the LL (Figure 5(a2–d2)), the diurnal pattern of the HWS changes, particularly for high winds, which become significantly stronger and occur relatively later compared to the NL. The occurrence time of high winds also varies across seasons, with the earliest occurrence in summer, around 17:00 L.T., followed by spring and autumn, around 18:00 L.T. and 19:00 L.T., respectively. The latest occurrence is observed in winter, featuring weaker characteristics. In the ML (Figure 5(a3–d3)), the diurnal changes in the HWS significantly weaken, with no evident peak or hourly difference. However, during winter, the horizontal wind speed becomes more scattered, as it is influenced by the westerlies, and the proportion of high winds starts to increase again. Up to the UL (Figure 5(a4–d4)), the westerly high-speed wind exerts a more significant influence on all four seasons, resulting in a more dispersed distribution of the HWS. The average wind speed at this level also exhibits peaks, which may be attributed to the activity of the jet stream and high-altitude fluctuations [53].
The hourly probability distributions of the VWS are depicted in Figure 6. It can be found from Figure 6(a1–d1) that the VWS also displays an apparent diurnal change due to the impact of the local mountain-valley wind circulation. During the daytime, the VWS shows a downward motion in the NL, whereas during the nighttime an upward motion dominates. The predominant period of updraft or downdraft also changes with the seasons. Additionally, the probability distribution of the VWS at different times exhibits the greatest dispersion in summer and the highest concentration in winter, which is directly related to the strongest and weakest convection activities. As the mountain-valley wind circulation gradually weakens with increasing height, the proportion and predominate period of downward motion also gradually decrease in all seasons. Up to the LL (Figure 6(a2–d2)), the periods of downdrafts become shorter, occurring between 12:00 and 17:00 L.T. in summer and 13:00 and 16:00 L.T. in spring. In autumn and winter, updrafts nearly dominate throughout the day. Further up to the ML (Figure 6(a3–d3)) and the UL (Figure 6(a4–d4)), the atmosphere exhibits upward motions throughout the entire day in all seasons, with the VWS ranging from 0 to 0.3 m/s.

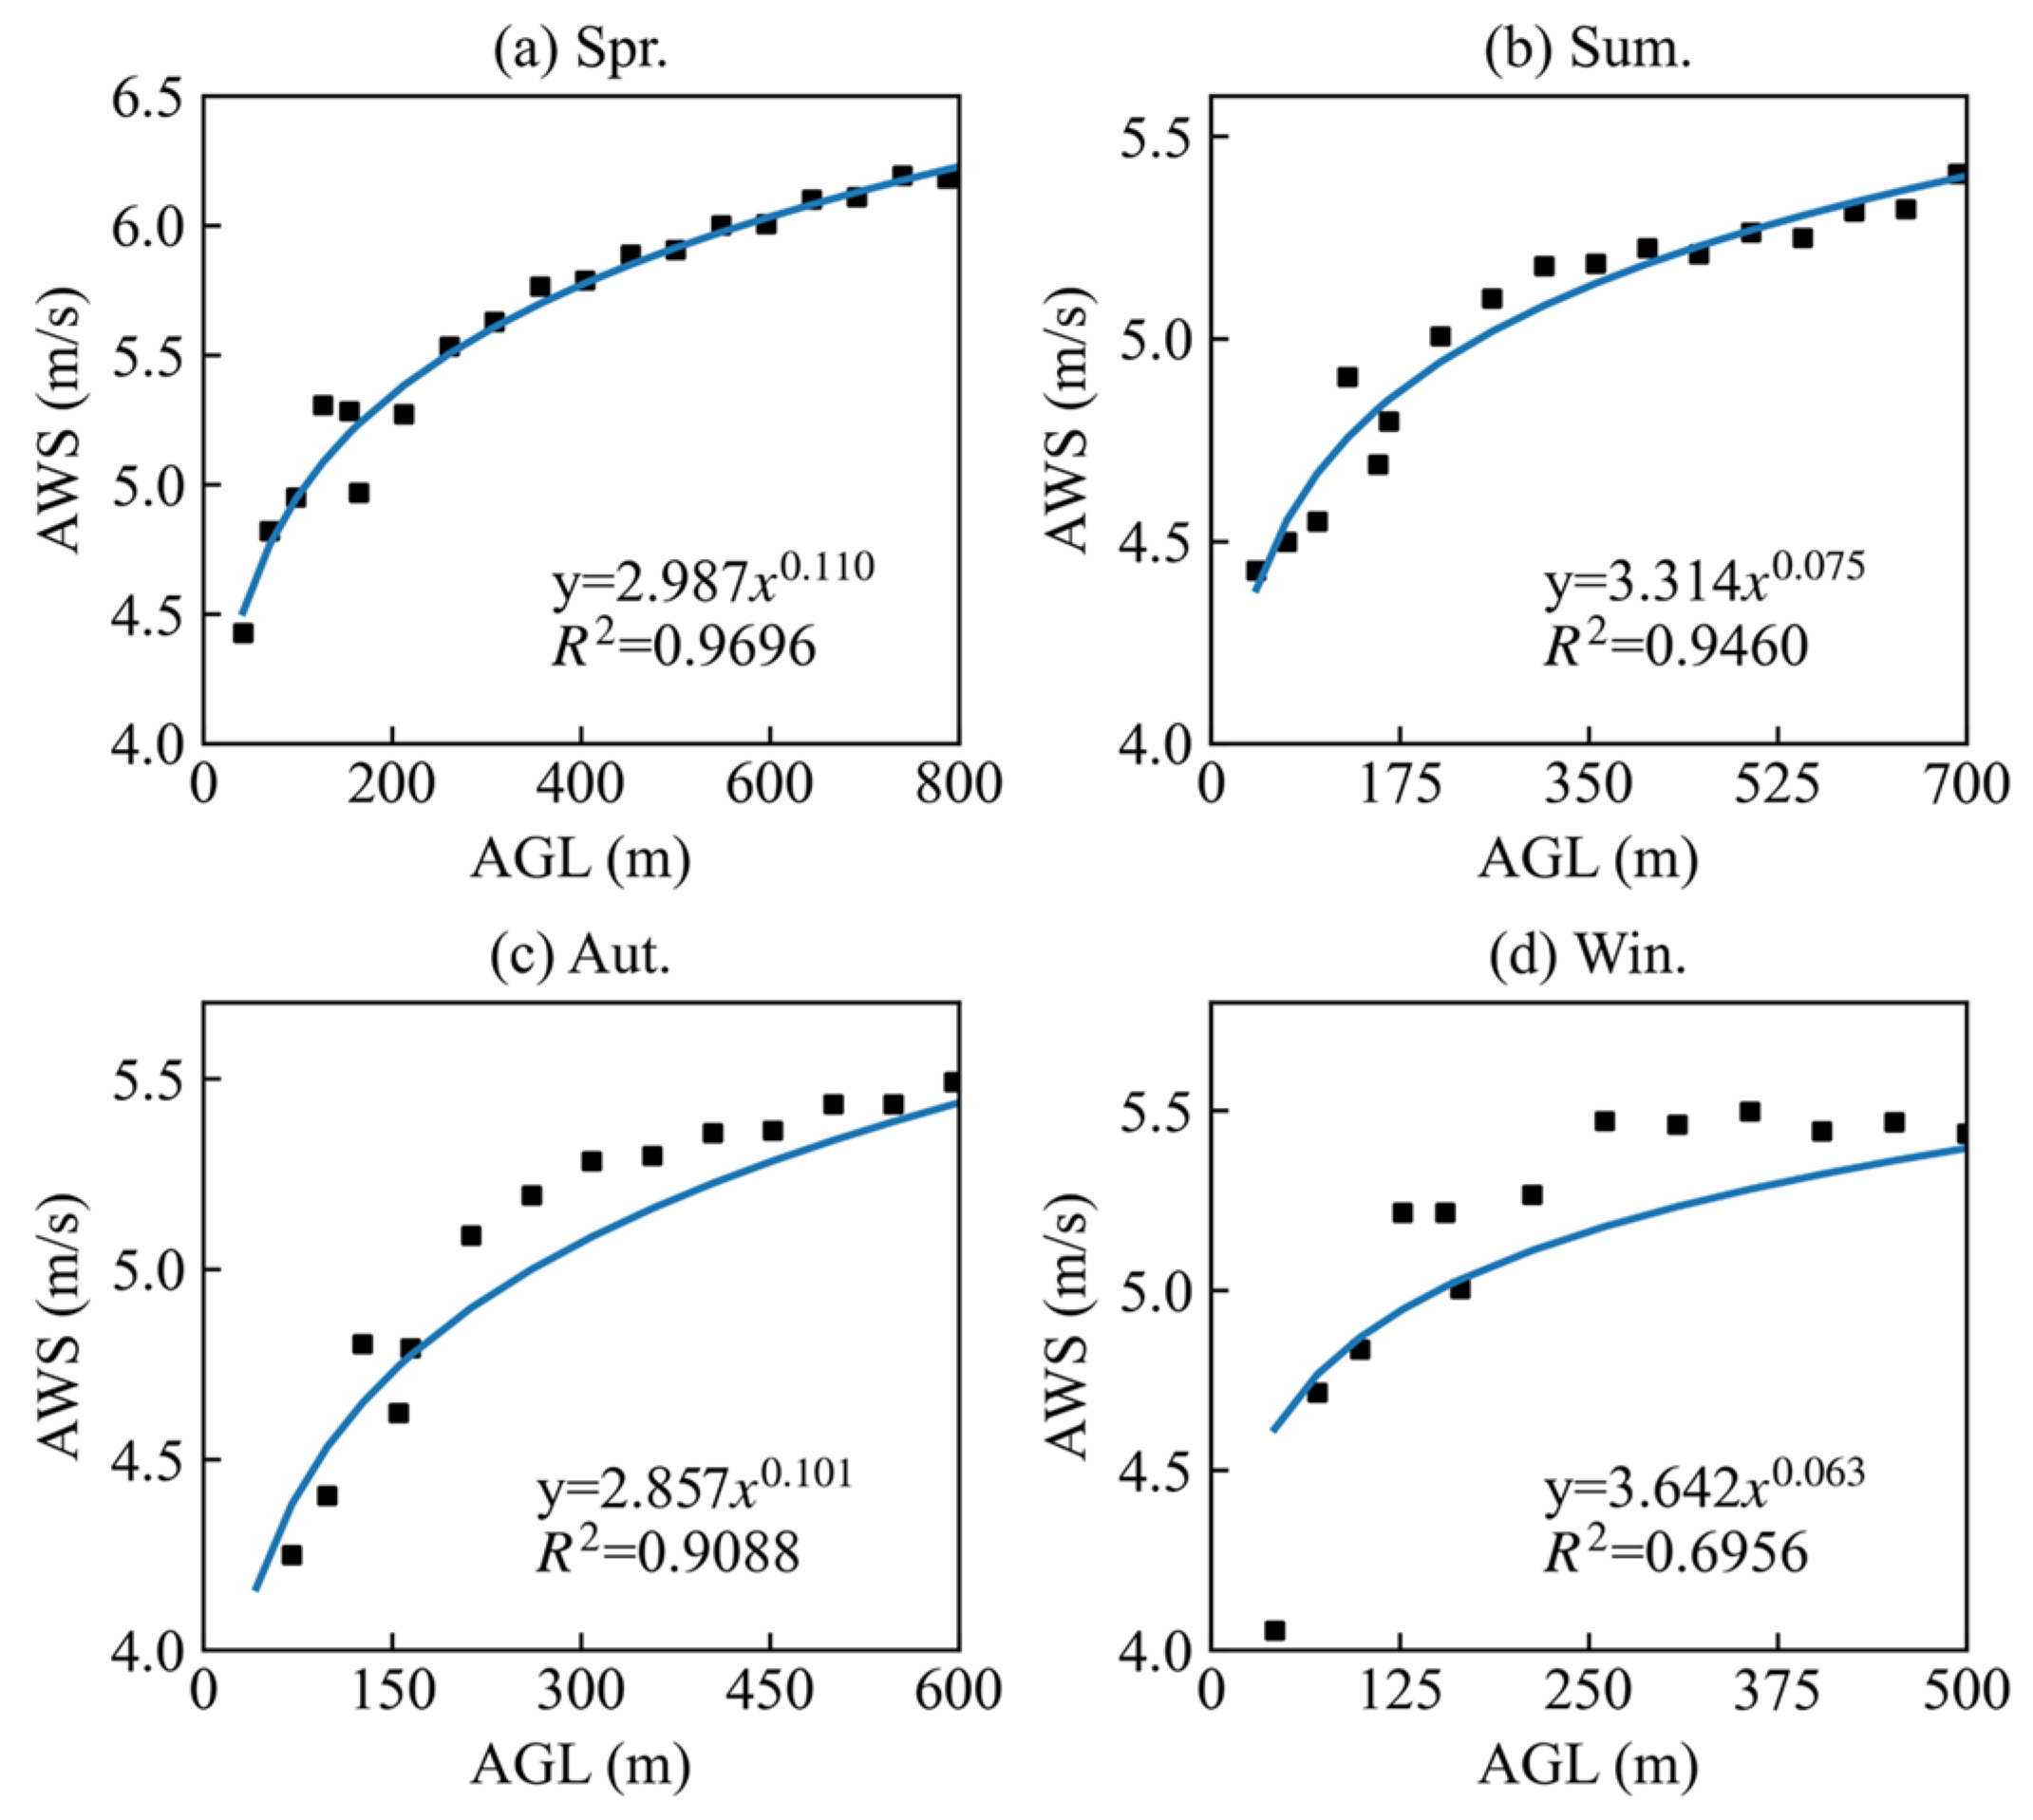
3.3. Empirical Relationship between Horizontal Wind Speed and Height and Its Variation

To quantify the relationship between horizontal wind speed and height in the local PBL, arithmetic averages of the HWS were calculated at different height layers, and empirical power law functions were fitted using the least square method. Ma et al. [42] discovered that the monthly averages of PBL top heights in Xining City during the morning (08:00 L.T.) and early night (20:00 L.T.) range from 1.5 km to 3.3 km and 0.4 km to 3.2 km, respectively. The PBL top height is highest in spring, followed by summer and autumn, and lowest in winter. In this study, to ensure the accuracy of the fitted relationship within the PBL, the fitted observations were conservatively limited to 800 m, 700 m, 600 m, and 500 m for spring, summer, autumn, and winter, respectively. Additionally, to eliminate the influence of other high wind speeds caused by the low-level jet, samples that met Bonner’s (1968) [54] criteria for low-level jet stream determination were excluded before fitting. Figure 7 presents the variation of the averaged wind speed with height and the fitted results for four seasons. It is evident that the observed average wind speeds closely follow the power law distribution with height. The goodness-of-fit values for the four seasons, namely, spring, summer, autumn, and winter, are 0.9696, 0.946, 0.9088, and 0.6956, respectively. The fitted relationships can be expressed as
V ¯ = 2.987 Z 0.110 ,   s p r i n g , 3.314 Z 0.075 ,   s u m m e r , 2.857 Z 0.101 ,   a u t u m n , 3.642 Z 0.063 ,   w i n t e r ,
where V ¯ (m/s) and Z (m) represent the averaged horizontal wind speed and height above the ground, respectively. The wind shear exponent α is associated with the ground roughness, which is typically 0.107, 0.146, and 0.25 for sea surfaces, open fields, and cities and towns in China [55]. According to China’s national standard for wind energy resource assessment methodology for wind farms (2002), α is usually approximated as 1/7 (~0.1428). However, the convergence of air within the canyon often leads to the venturi effect, which reduces the difference in wind speed between layers. Consequently, the overall α is expected to be less than 1/7 [56]. Moreover, α varies during different periods due to changes in thermal conditions [57]. In this plateau valley, influenced by terrain, heat, and dynamics, the α consistently remains lower than 1/7 throughout the seasons in this study. Notably, the maximum value of α (0.11) occurs in spring, while the minimum value (0.063) occurs in winter. The results indicate that the vertical gradient of wind speed is most pronounced and undergoes rapid changes with height in spring, whereas it is least pronounced with slower changes occurring with height in winter.
To further investigate the diurnal variations of the wind shear exponent, the hourly averaged α values were individually fitted for different seasons, as shown in Figure 8. Throughout all seasons, the α values are smaller during the daytime compared to the nighttime. This pattern can be attributed to the solar radiation during daytime, which heats the atmosphere, strengthens momentum exchange, and reduces the gradient of wind speed between upper and lower air layers, consequently leading to a decrease in α. Conversely, during the night, the decrease in surface temperature results in weakened turbulence, a larger wind speed gradient, and, consequently, an increase in α. The differences between the maximum and minimum α values for spring, summer, autumn, and winter are 0.328, 0.310, 0.369, and 0.368, respectively, indicating that the diurnal change of α is minimal in summer and maximal in autumn. Note that due to the influence of the terrain, the minimum α in all seasons can fall below 0, which is consistent with results observed in mountain areas reported by Li et al. (2008) [58].

4. Discussion

Different topographical and climatological features can result in distinct wind patterns in the lower troposphere. However, due to the constraints of harsh natural environments and sparse observational networks, research on the vertical characteristics and variations of lower-troposphere wind fields over the northeastern QTP has been limited. Therefore, in this section, we further discuss our results in comparison to existing research findings that focus on several other regions in China.
In the hinterland of the Taklimakan Desert in northwest China, wind characteristics in spring and autumn exhibit similarities. In summer, the easterly wind thickens, and the dominant wind direction shifts from easterly to westerly from the lower to the upper layers [59]. These wind field characteristics are similar to our findings over the northeastern QTP. In Ningbo, a coastal city in eastern China, prevailing winds in the low levels throughout the year predominantly come from the north-northwest and south-southeast, influenced by the East Asian monsoon [60]. However, in our study area, prevailing winds come from the east-southeast and west-northwest due to the influence of mountain-valley wind circulation. Likewise, Huangsi in Hebei province, northern China, surrounded by mountains on three sides and influenced by local mountain-valley wind circulation [61], experiences prevailing valley winds during the day and prevailing mountain winds at night, with seasonal variations in the transition time [62,63,64]. Xichang City, located on the southeastern edge of the QTP, exhibits stronger convection in summer and weaker convection in winter. Surface-layer winds are influenced by topography, and the impact of large-scale atmospheric circulation becomes more prominent with increasing height [65]. These findings align with our study in terms of the spatiotemporal characteristics of the wind fields.
There are variations in the wind shear exponent α across different regions. For example, a coastal wind farm in Shandong, eastern China, has a comprehensive wind shear exponent of 0.1495 [66]. In Ulanqab of inner Mongolia, the fitting results of α for four typical months (January, April, July, and October) obtained from a wind measurement tower are 0.0936, 0.0695, 0.0813, and 0.1219, respectively [67]. Regarding the diurnal variation of α, many previous studies align with our findings. For instance, there is a consistent pattern of larger α during the night and smaller α during the day observed in various regions, such as Malta, Namibia, and Saudi Arabia [68,69,70].

5. Conclusions

Observing and studying wind fields in complex geographical regions hold significant importance in enhancing local meteorological operations and parameterization schemes of numerical models. Additionally, they can also contribute to the advancement of local aviation flight safety and the wind energy industry. This manuscript focuses on investigating the wind field characteristics and temporal variabilities in Xining City, located in the Huangshui River Valley in the northeast of the Qinghai-Tibet Plateau, using a four-year dataset from a Doppler wind LiDAR. The primary findings can be summarized as follows:
(1)
The lower-tropospheric-prevailing HWD in this area is primarily influenced by the mountain-valley wind circulation throughout the year. However, as the altitude increases, the prevailing winds are predominantly affected by the westerlies. The development height of up-valley winds varies significantly across seasons, with the highest top observed in summer, followed by spring and autumn, and the lowest top occurring in winter. In the upper layer, the bottom of the high-speed wind layer is lower in cold seasons compared to warm seasons. This can be attributed to the thicker and stronger westerlies during cold seasons, resulting in a higher rate of increase in high-speed winds. Under 200 m, the occurrence of updrafts and downdrafts is relatively similar due to turbulent activities. However, at heights above 200 m, updrafts predominantly dominate the airflow.
(2)
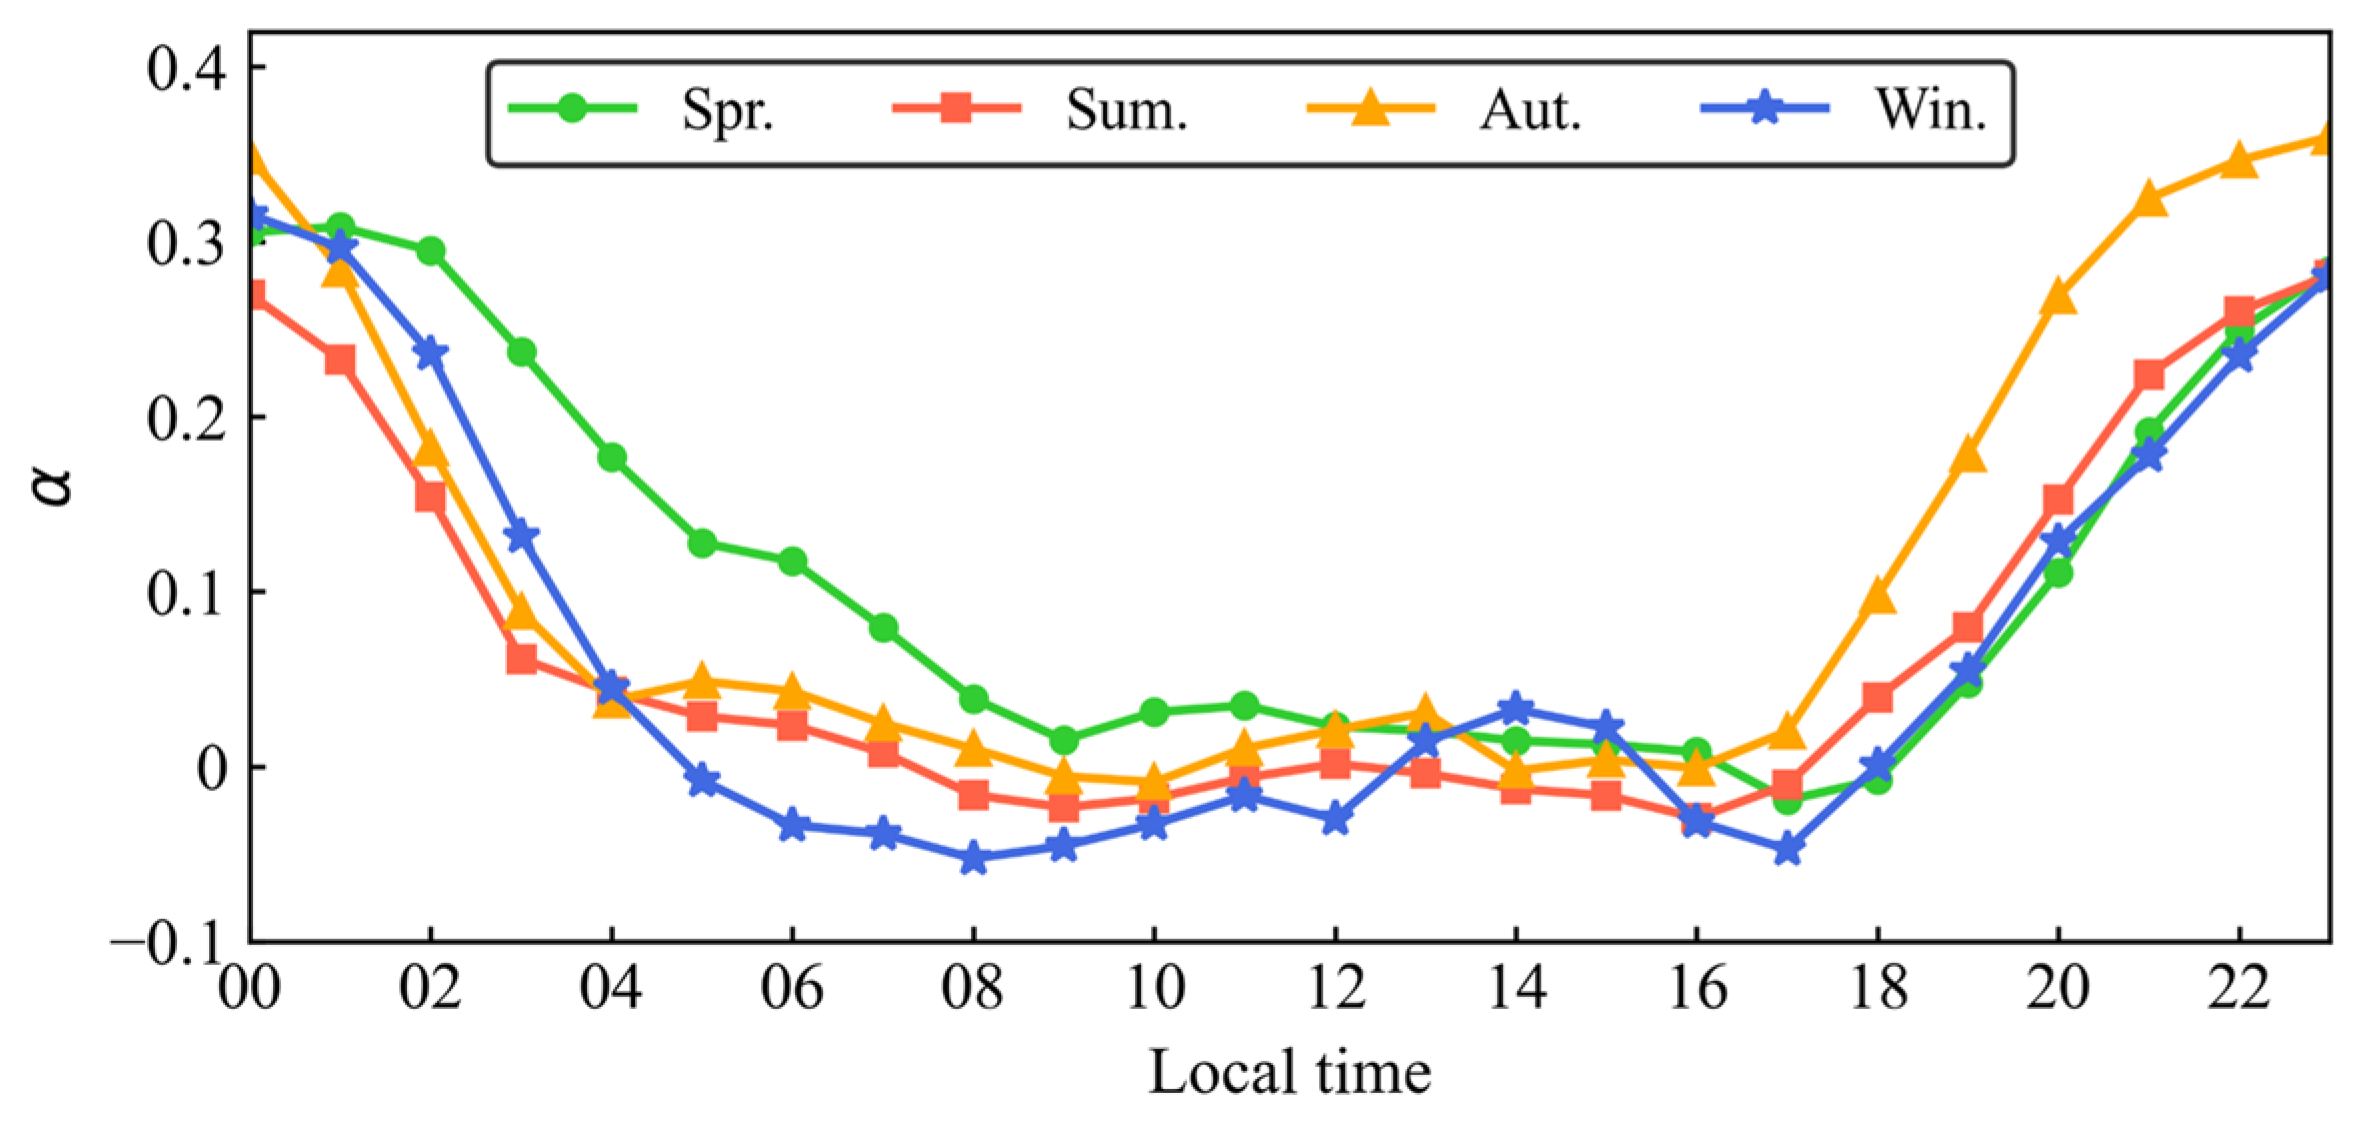
From a diurnal perspective, noticeable transition processes between down-valley and up-valley winds can be observed. The down-valley wind dominates from late night to morning, while the up-valley wind prevails from afternoon to early evening. The transition from down-valley winds to up-valley winds occurs earlier in warm seasons compared to cold seasons, specifically around 11:00 L.T. in summer and spring, 13:00 L.T. in autumn, and 15:00 L.T. in winter. Additionally, it is worth mentioning that the duration of down-valley winds is shortest in spring but longest in winter. As the altitude increases, the mountain-valley wind pattern weakens, while the influence of the westerlies gradually intensifies.
(3)
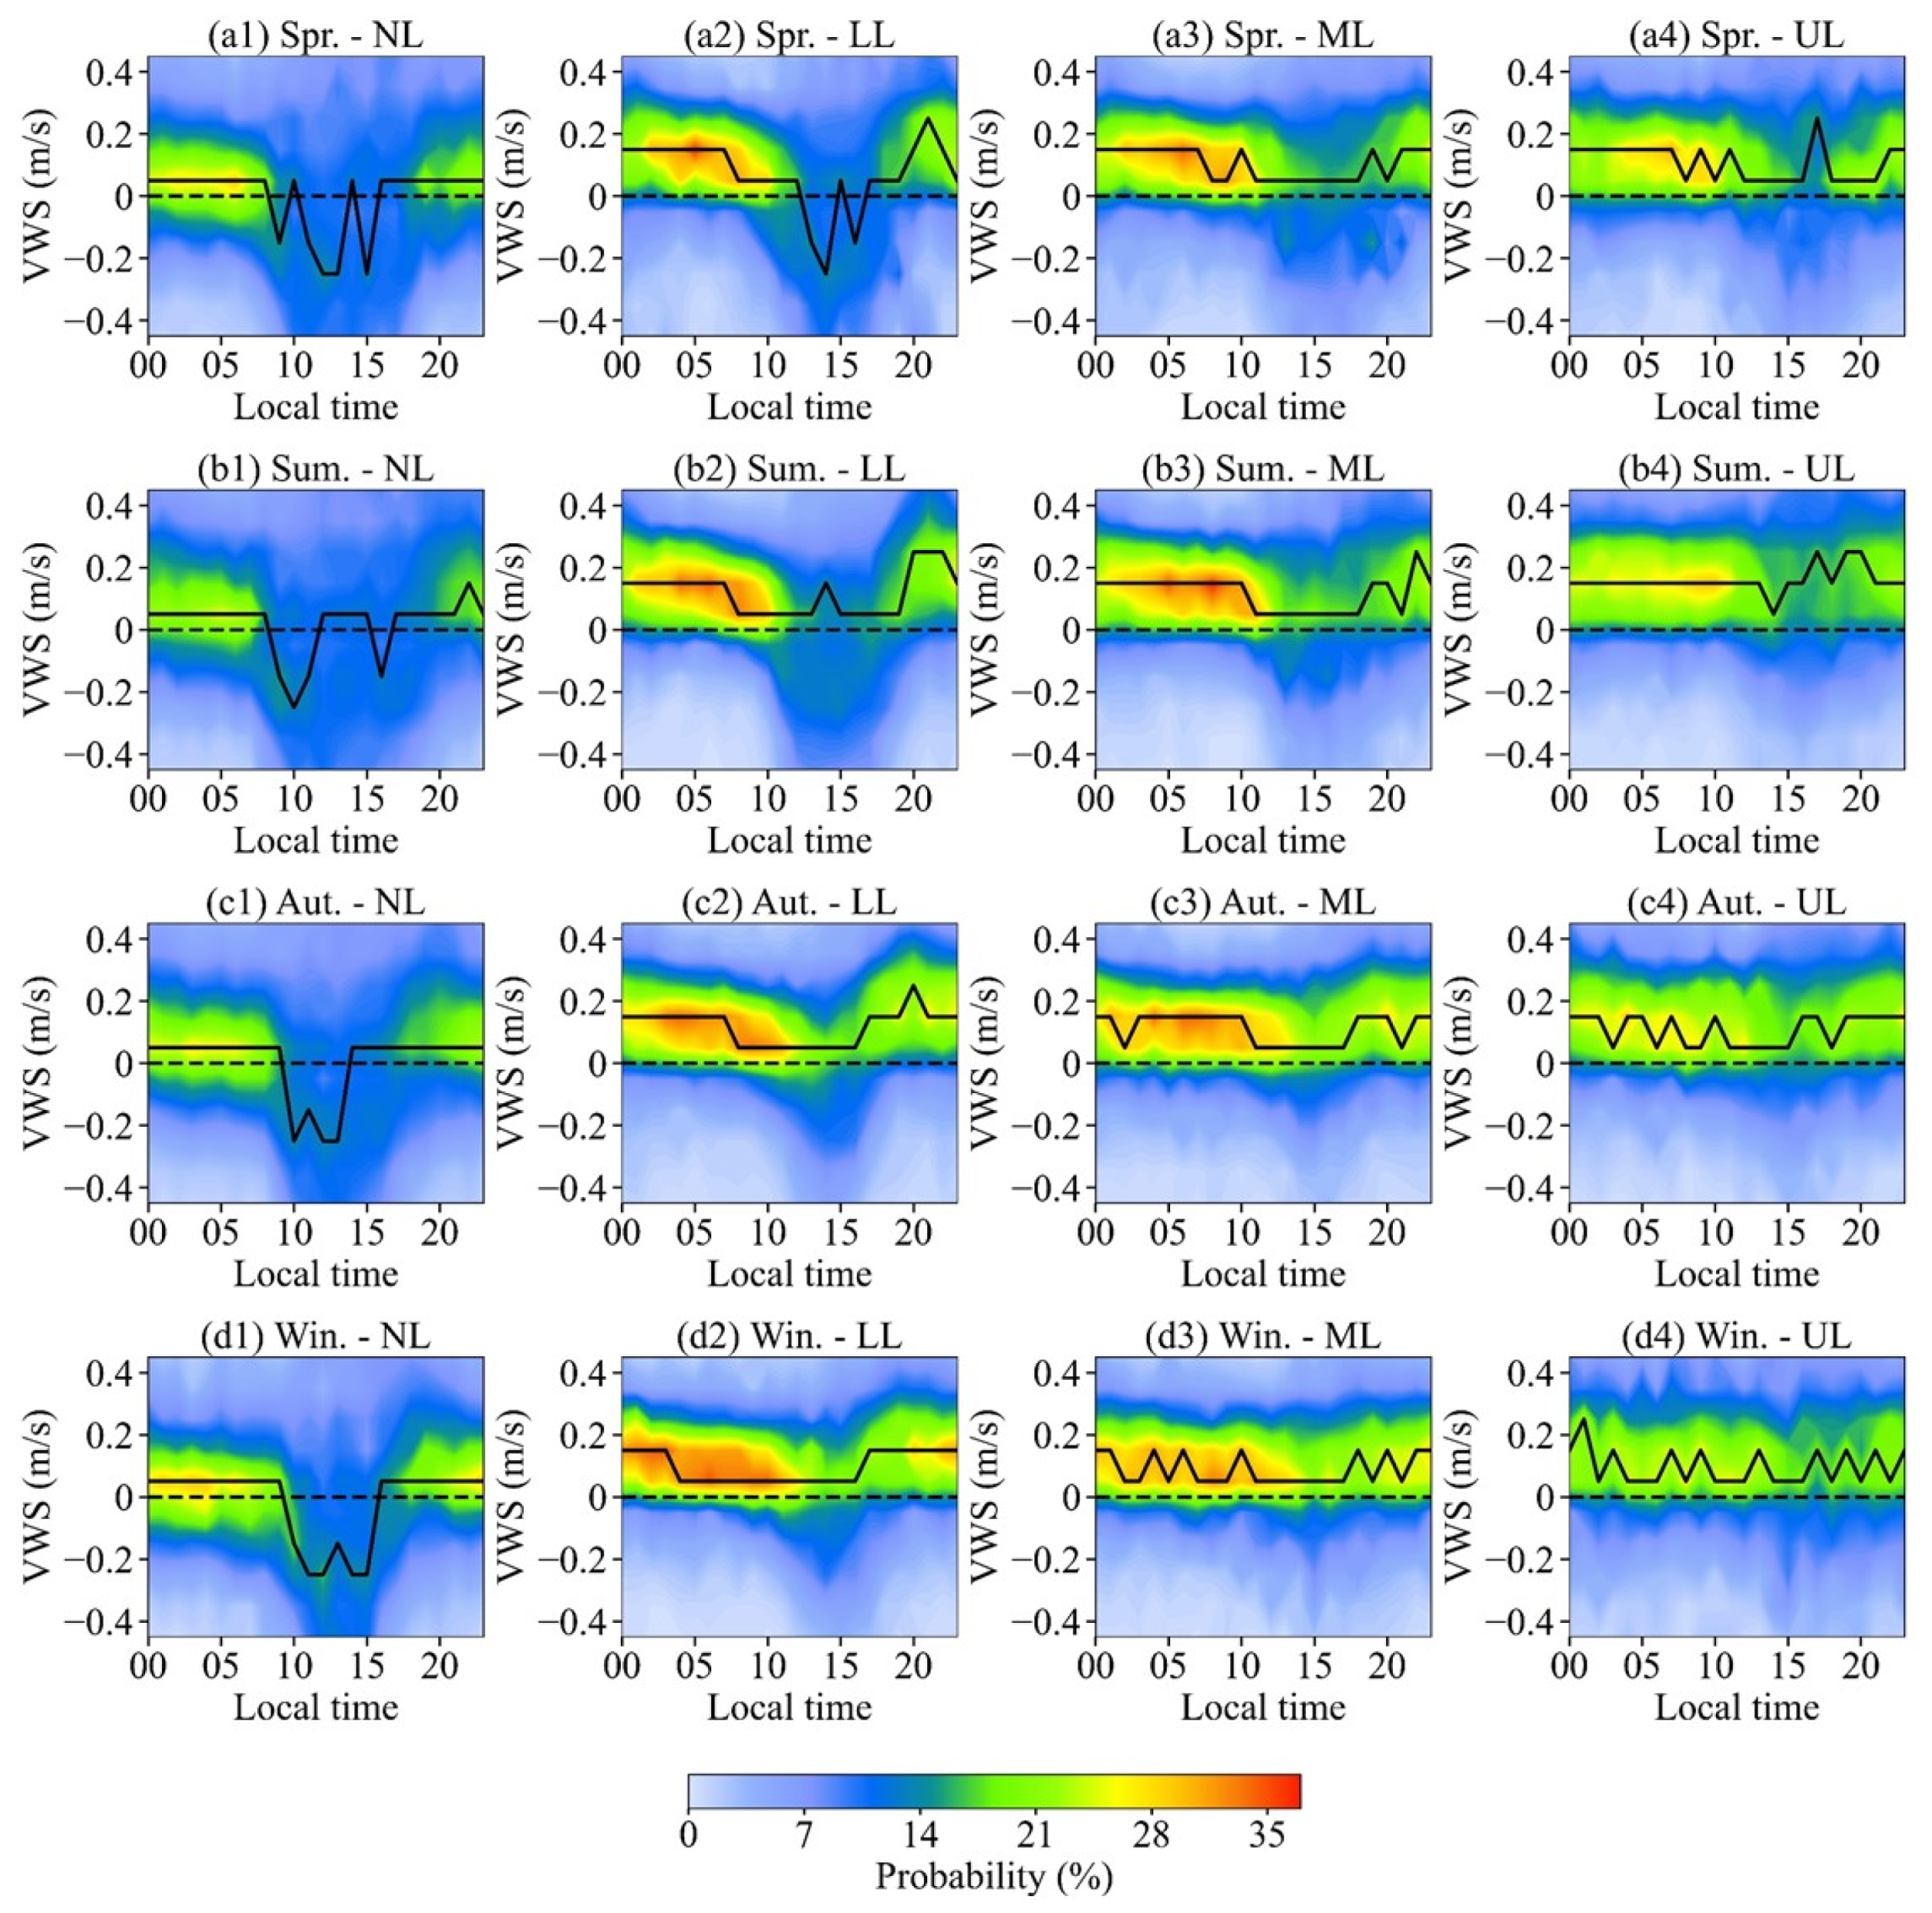
In the NL and LL, there is a significant acceleration of high winds during the afternoon to early evening. However, the occurrence time of high winds varies across seasons, with the earliest in summer, followed by spring and autumn, and the latest in winter. Due to the impact of the mountain-valley circulation, vertical winds in the NL exhibit a downward motion during the daytime and an upward motion during the nighttime. Up to the ML and the UL, the vertical air motion is primarily controlled by updrafts throughout the day.
(4)
In this plateau valley, the wind shear exponent is found to be highest in spring, followed by autumn and summer, and lowest in winter. Furthermore, it is observed that the wind shear exponent is generally lower during the daytime compared to the nighttime. However, due to the unique terrain characteristics, negative values of the wind shear exponent can be observed during certain hours of the daytime in all seasons.

Author Contributions

Conceptualization, J.Z. and D.X.; methodology, J.Z. and T.P.; software, Y.L., Y.W. and Y.C.; validation, Y.L., X.H., Y.C. and D.X.; formal analysis, Y.L., X.W. and T.P.; investigation, J.Z. and T.P.; resources, X.H.; data curation, Y.W. and D.X.; writing—original draft preparation, Y.L. and Y.W.; writing—review and editing, J.Z. and X.W.; visualization, J.Z. and Y.C.; supervision, X.W.; project administration, Y.L. and T.P.; funding acquisition, D.X. All authors have read and agreed to the published version of the manuscript.

Funding

This research was funded by the National Key Research and Development Program of China (Grant No. 2023YFC3007501), the Open Foundation of the China Meteorological Administration Key Laboratory for Aviation Meteorology, and the Innovation Ability Promotion Plan Project of Chengdu University of Information Science and Technology (Grant No. KYQN202307).

Data Availability Statement

The data used in this study are available upon request from the corresponding author due to privacy restrictions.

Acknowledgments

The authors thank the anonymous reviewers for their constructive comments and suggestions, which greatly improved this paper.

Conflicts of Interest

The authors declare no conflicts of interest.

References

  1. García-Gutiérrez, A.; Domínguez, D.; López, D.; Gonzalo, J. Atmospheric boundary layer wind profile estimation using neural networks applied to Lidar measurements. Sensors 2021, 21, 3659. [Google Scholar] [CrossRef] [PubMed]
  2. Yang, S.C.; Cheng, F.Y.; Wang, L.J.; Wang, S.H.; Hsu, C.H. Impact of Lidar data assimilation on planetary boundary layer wind and PM2.5 prediction in Taiwan. Atmos. Environ. 2022, 277, 119064. [Google Scholar] [CrossRef]
  3. Jiang, Y.; Zhao, T.; Wang, H.; Wang, Q.; Chang, L.; Tan, C. Analysis on atmospheric boundary layer and regional transport during PM2.5 Pollution episodes in Fuzhou. Chin. Environ. Sci. 2015, 35, 347–355. (In Chinese) [Google Scholar]
  4. Midjiyawa, Z.; Cheynet, E.; Reuder, J.; Ágústsson, H.; Kvamsdal, T. Potential and challenges of wind measurements using met-masts in complex topography for bridge design: Part II-Spectral flow characteristics. J. Wind Eng. Ind. Aerod. 2021, 211, 104585. [Google Scholar] [CrossRef]
  5. Baumann-Stanzer, K. The UHF wind profiler at Vienna airport-data quality control and comparisons to Rawinsonde data. Meteorol. Atmos. Phys. 2004, 85, 165–174. [Google Scholar] [CrossRef]
  6. Floors, R.; Troen, I.; Peña, A. Using Observed and Modelled Heat Fluxes for Improved Extrapolation of Wind Distributions. Bound. Layer Meteorol. 2023, 188, 75–101. [Google Scholar] [CrossRef]
  7. Smedman, A.S.; Högström, U. Turbulent characteristics of a shallow convective internal boundary layer. Bound. Layer Meteorol. 1983, 25, 271–287. [Google Scholar] [CrossRef]
  8. Abu Bakr, E.H.; Wieringa, J. A boundary-layer model for the determination of hourly surface wind characteristics in a representative tropical African region. Bound. Layer Meteorol. 1988, 45, 325–353. [Google Scholar] [CrossRef]
  9. Ricciardelli, F.; Polimeno, S. Some characteristics of the wind flow in the lower Urban Boundary Layer. J. Wind Eng. Ind. Aerod. 2006, 94, 815–832. [Google Scholar] [CrossRef]
  10. Mahrt, L. Characteristics of submeso winds in the stable boundary layer. Bound. Layer Meteorol. 2009, 130, 1–14. [Google Scholar] [CrossRef]
  11. Milan, P.; Wächter, M.; Peinke, J. Turbulent character of wind energy. Phys. Rev. Lett. 2013, 110, 138701. [Google Scholar] [CrossRef] [PubMed]
  12. Herrera-Mejía, L.; Hoyos, C.D. Characterization of the atmospheric boundary layer in a narrow tropical valley using remote-sensing and radiosonde observations and the WRF model: The Aburrá Valley case-study. Q. J. R. Meteor. Soc. 2019, 145, 2641–2665. [Google Scholar] [CrossRef]
  13. Wu, A.; Li, G. Roles of the Topographically-Affected Boundary Layer Low-Level Jet in the Moisture Transport Process of Nocturnal Rainstorms in Mountainous Areas around the Western Sichuan Basin. Atmosphere 2022, 14, 84. [Google Scholar] [CrossRef]
  14. Chen, T.; Fu, J.Y.; Chan, P.W.; He, Y.C.; Liu, A.M.; Zhou, W. Wind characteristics in typhoon boundary layer at coastal areas observed via a Lidar profiler. J. Wind. Eng. Ind. Aerod. 2023, 232, 105253. [Google Scholar] [CrossRef]
  15. Resmi, E.A.; Murugavel, P.; Dinesh, G.; Balaji, B.; Leena, P.P.; Mercy, V.; Sathy, N.; Subharthi, C.; Yogesh, T.; Anandakumar, K.; et al. Observed diurnal and intraseasonal variations in boundary layer winds over Ganges valley. J. Atmos. Sol.-Terr. Phy. 2019, 188, 11–25. [Google Scholar] [CrossRef]
  16. Zhang, S.; Li, B.; Solari, G.; Zhang, X.; Xu, X. A refined study of atmospheric wind properties in the Beijing urban area based on a 325 m meteorological tower. Atmosphere 2021, 12, 786. [Google Scholar] [CrossRef]
  17. Li, L.; Zhou, Q.J.; Chan, P.W.; Yang, H.L. Variation of virtual temperature and wind in the atmospheric boundary layer over the Pearl River estuary during 2011–2020. Front. Environ. Sci. 2023, 10, 2691. [Google Scholar] [CrossRef]
  18. Dai, L.; Xin, J.; Zuo, H.; Ma, Y.; Zhang, L.; Wu, X.; Ma, Y.; Jia, D.; Wu, F. Multilevel Validation of Doppler Wind Lidar by the 325 m Meteorological Tower in the Planetary Boundary Layer of Beijing. Atmosphere 2020, 11, 1051. [Google Scholar] [CrossRef]
  19. Fan, Q.; Zhu, K.; Zheng, J.; Zhang, J.; Zhou, D.; Zhang, F. Detection performance analysis of all-fiber coherent wind lidar under different weather types. Chin. J. Lasers 2017, 44, 10. (In Chinese) [Google Scholar]
  20. Song, M.; Wang, Y.; Mamtimin, A.; Gao, J.; Aihaiti, A.; Zhou, C.; Yang, F.; Huo, W.; Wen, C.; Wang, B. Applicability Assessment of Coherent Doppler Wind LiDAR for Monitoring during Dusty Weather at the Northern Edge of the Tibetan Plateau. Remote Sens. 2022, 14, 5264. [Google Scholar] [CrossRef]
  21. Zhang, Z.; Zhang, J.; Wu, G.; Gao, R. Evaluation of wind lidar data inmegacities experiment on integrated meteorological observation. J. Trop. Meteorol. 2022, 38, 253–264. (In Chinese) [Google Scholar]
  22. Jiang, P.; Yuan, J.; Wu, K.; Wang, L.; Xia, H. Turbulence Detection in the Atmospheric Boundary Layer Using Coherent Doppler Wind Lidar and Microwave Radiometer. Remote Sens. 2022, 14, 2951. [Google Scholar] [CrossRef]
  23. Yuan, J.; Wu, Y.; Shu, Z.; Su, L.; Tang, D.; Yang, Y.; Dong, J.; Yu, S.; Zhang, Z.; Xia, H. Real-Time Synchronous 3-D Detection of Air Pollution and Wind Using a Solo Coherent Doppler Wind Lidar. Remote Sens. 2022, 14, 2809. [Google Scholar] [CrossRef]
  24. Wang, L.; Yuan, J.; Xia, H.; Zhao, L.; Wu, Y. Marine Mixed Layer Height Detection Using Ship-Borne Coherent Doppler Wind Lidar Based on Constant Turbulence Threshold. Remote Sens. 2022, 14, 745. [Google Scholar] [CrossRef]
  25. Smalikho, I.N.; Banakh, V.A. Measurements of wind turbulence parameters by a conically scanning coherent Doppler lidar in the atmospheric boundary layer. Atmos. Meas. Tech. 2017, 10, 4191–4208. [Google Scholar] [CrossRef]
  26. Banakh, V.; Smalikho, I. Lidar Studies of Wind Turbulence in the Stable Atmospheric Boundary Layer. Remote Sens. 2018, 10, 1219. [Google Scholar] [CrossRef]
  27. Yuan, J.; Su, L.; Xia, H.; Li, Y.; Zhang, M.; Zhen, G.; Li, J. Microburst, Windshear, Gust Front, and Vortex Detection in Mega Airport Using a Single Coherent Doppler Wind Lidar. Remote Sens. 2022, 14, 1626. [Google Scholar] [CrossRef]
  28. Wood, C.; Pauscher, L.; Ward, H.; Kotthaus, S.; Barlow, J.; Gouvea, M.; Lane, S.; Grimmond, C. Wind observations above an urban river using a new lidar technique, scintillometry and anemometry. Sci. Total Environ. 2013, 442, 527–533. [Google Scholar] [CrossRef]
  29. Yi, D.W.; Choi, H.W.; Lee, S.S.; Lee, Y.H. Understanding the Characteristics of Vertical Structures for Wind Speed Observations via Wind-LIDAR on Jeju Island. Atmosphere 2023, 14, 1260. [Google Scholar] [CrossRef]
  30. Egger, J.; Bajrachaya, S.; Egger, U.; Heinrich, R.; Reuder, J.; Shayka, P.; Wendt, H.; Wirth, V. Diurnal Winds in the Himalayan Kali Gandaki Valley. Part I: Observations. Mon. Wea. Rev. 2000, 128, 1106–1122. [Google Scholar] [CrossRef]
  31. Zängl, G.; Egger, J.; Wirh, V. Diurnal Winds in the Himalayan Kali Gandaki Valley. Part II: Modeling. Mon. Wea. Rev. 2001, 129, 1062–1080. [Google Scholar] [CrossRef]
  32. Bian, L.; Xu, X.; Lu, L.; Gao, Z.; Zhou, M.; Liu, H. Analyses of turbulence parameters in the near-surface layer at Qamdo of the southeastern Tibetan Plateau. Adv. Atmos. Sci. 2003, 20, 369–378. [Google Scholar] [CrossRef]
  33. Chen, X.; Ma, Y.; Hu, Z.; He, H.; Luo, B. Analysis of atmospheric structure in Gaize region of western Tibetan plateau during pre-onset and onset of monsoon. Chin. J. Atmos. Sci. 2010, 34, 83–94. (In Chinese) [Google Scholar]
  34. Chen, X.; Anel, J.; Su, Z.; De, I.; Kelder, H.; Peet, J.; Ma, Y. The deep atmospheric boundary layer and its significance to the stratosphere and troposphere exchange over the Tibetan Plateau. PLoS ONE 2013, 8, e56909. [Google Scholar] [CrossRef]
  35. Li, M.; Dai, Y.; Ma, Y.; Zhong, L.; Lü, S. Analysis on structure of atmospheric boundary layer and energy exchange of surface layer over mount Qomolangma region. Plateau Meteorol. 2006, 25, 807–813. (In Chinese) [Google Scholar]
  36. Lai, Y.; Chen, X.; Ma, Y.; Chen, D.; Zhaxi, S. Impacts of the westerlies on planetary boundary layer growth over a valley on the north side of the central Himalayas. J. Geophys. Res. Atmos. 2021, 126, e2020JD033928. [Google Scholar] [CrossRef]
  37. Lü, Y.; Ma, Y.; Li, M.; Sun, F. Study on characteristic of atmospheric boundary layer over lake Namco region, Tibetan Plateau. Plateau Meteorol. 2008, 27, 1205–1210. (In Chinese) [Google Scholar]
  38. Wang, Y.; Ma, Y.; Zhu, Z.; Li, M. Variation characteristics of meteorological elements in near surface layer over the Lulang valley of southeastern Tibetan Plateau. Plateau Meteorol. 2010, 29, 63–69. (In Chinese) [Google Scholar]
  39. Li, C.; Zhao, P.; Peng, T.; Feng, L.; Zhou, J.; Luo, X.; Zhou, D. Technical research of 3-D wind lidar. Laser Technol. 2017, 41, 703–707. (In Chinese) [Google Scholar]
  40. Huang, X.; Zheng, J.; Zhang, J.; Ma, X.; Tian, W.; Hua, Z. Study on the structure and characteristics of a low-level wind shear process that happened over Xining Airport. Laser Technol. 2022, 46, 206–212. (In Chinese) [Google Scholar]
  41. Robey, R.; Lundquist, J.K. Behavior and mechanisms of Doppler wind lidar error in varying stability regimes. Atmos. Meas. Tech. 2022, 15, 4585–4622. [Google Scholar] [CrossRef]
  42. Ma, Y.; Li, Y.; Yang, J.; Zeng, T.; Zhang, A.; Zhang, C. Relationships between boundary layer height and different disaster weathers in north-central Qinghai Province. Plateau Meteorol. 2019, 38, 1048–1057. (In Chinese) [Google Scholar]
  43. Zhou, W.; Yang, S.; Jiang, X.; Guo, Q. Estimating planetary boundary layer height over the Tibetan Plateau using COSMIC radio occultation data. Acta Meteorol. Sin. 2018, 76, 117–133. (In Chinese) [Google Scholar]
  44. Xu, X.; Zhou, M.; Chen, J.; Bian, L.; Zhang, G.; Liu, H.; Li, S.; Zhang, H.; Zhao, Y. A comprehensive physical pattern of land-air dynamic and thermal structure on the Qinghai-Xizang Plateau. Sci. Chin. Ser. D 2002, 45, 577–594. [Google Scholar] [CrossRef]
  45. Zhang, G.; Xu, X.; Wang, J. A dynamic study of Ekman characteristics by using 1998 SCSMEX and TIPEX boundary layer data. Adv. Atmos. Sci. 2003, 20, 349–356. [Google Scholar] [CrossRef]
  46. Gu, X.; Wu, H.; Xu, L.; Wei, W. Precision analysis of wind speed prediction based on different calculation methods of wind shear exponent. Renew. Energ. Resour. 2019, 37, 1362–1367. (In Chinese) [Google Scholar]
  47. Chen, S.; Duan, Y.; Li, Q. Fitting of wind shear index in the boundary layer of landfalling typhoons based on high tower observation. J. Appl. Meteorol. Sci. 2022, 33, 155–166. (In Chinese) [Google Scholar]
  48. Xü, H.; Gong, Q.; Zhu, L.; Shen, L.; Gu, Z.; Chao, H.; Wang, Y.; Chen, J. Comparisons of wind resources based on wind shear indices at various temporal scales. J. Meteorol. Environ. 2022, 38, 106–112. (In Chinese) [Google Scholar]
  49. Yao, H.; Li, D. Spatial structure of East Asia subtropical jet stream and its relation with winter air temperature in China. Chin. J. Atmos. Sci. 2013, 37, 881–890. (In Chinese) [Google Scholar]
  50. Ma, M.; Qi, D.; Shen, H.; Zhang, J. Research on the characteristics of wind and thermal field for atmospheric boundary layer in Xining. J. Nat. Resour. 2014, 29, 1196–1206. (In Chinese) [Google Scholar]
  51. Zhu, C.; Ma, Y.; Chen, X. Atmospheric boundary layer structure in the west and the southeastern periphery of the Tibetan Plateau during the pre-monsoon period. J. Glaciol. Geocryol. 2011, 33, 325–333. (In Chinese) [Google Scholar]
  52. Liu, R.; Zhang, G.; Xiao, H.; Zhou, W. Analysis on the characteristics of daily variation of cloud and precipitation over the Huangshui river valley in summer. Arid Zone Res. 2010, 27, 135–141. (In Chinese) [Google Scholar] [CrossRef]
  53. Kuang, X.; Zhang, Y. The seasonal variation of the East Asian Subtropical Westerly Jet and its thermal mechanism. Acta Meteorol. Sin. 2006, 64, 564–575. (In Chinese) [Google Scholar]
  54. Bonner, W. Climatology of the low level jet. Mon. Wea. Rev. 1968, 96, 833–850. [Google Scholar] [CrossRef]
  55. Zhu, R.; Xue, H. Calculation of wind energy and distribution of wind energy in China. Meteorol. Mon. 1981, 8, 26–28. (In Chinese) [Google Scholar]
  56. Li, Y.; Liang, H.; Wang, S.; Zhou, Q.; Guo, X.; Qiao, H. Study of the near surface wind shear daily variation characteristics based on China’s wind power resources professional observation network. J. Nat. Res. 2012, 27, 1362–1372. (In Chinese) [Google Scholar]
  57. Chen, M. Analysis of several factors influencing the wind shear index. In Proceedings of the 2013 Annual Meeting of the Chinese Society of Electrical Engineering, Chengdu, China, 20 November 2013. (In Chinese). [Google Scholar]
  58. Li, H.; Zhu, R. Discussion on the influence of wind shear index on hub height. In Proceedings of the Asian Wind Energy Congress, Beijing, China, 25 June 2008. (In Chinese). [Google Scholar]
  59. Wang, K.; He, Q.; Wang, M.; Hu, Y.; Li, X. Wind field at boundary layer in the hinterland of the Taklimakan desert. J. Desert Res. 2012, 32, 1029–1034. (In Chinese) [Google Scholar]
  60. Shi, W. Study on the Characteristics of Atmospheric Boundary Layer Wind Field in Hangzhou Bay Area. Master’s Thesis, Nanjing University, Nanjing, China, 2019. (In Chinese). [Google Scholar]
  61. Cao, Y.; Chen, H.; Wang, P. Analysis of the data reliability and wind field characteristics near surface boundary layer with Doppler sodar observations. Plateau Meteorol. 2017, 36, 1315–1324. (In Chinese) [Google Scholar]
  62. Yang, X.; Ai, L.; Li, C. Study on characteristics of urban crown-level mountain-valley wind in Sanming City. Straits Sci. 2023, 1, 22–26. (In Chinese) [Google Scholar]
  63. Ji, G.; Zhang, L.; Xing, L.; Zhao, M.; Lu, W. Mountain-valley winds and the diffusion of pollutants in mountainous areas. Environ. Res. 1984, 2, 10–15. (In Chinese) [Google Scholar]
  64. Tan, J.; Yuan, Y.; Li, Y.; Li, Y. A study of wind system in a sophisticated relief in the mountain area. Climatic Environ. Res. 2001, 6, 493–497. (In Chinese) [Google Scholar]
  65. Li, Y.; Yan, H.; Mo, F.; Fang, P. The analysis of wind field characteristics of the atmospheric boundary layer in Xichang 2014. J. Xichang Univ. (Nat. Sci. Ed.). 2015, 29, 55–58. (In Chinese) [Google Scholar]
  66. Ma, H.; Qü, N.; Li, C.; Wang, S. Study on wind shear exponents of wind farms. Power Syst. Clean Energy 2012, 28, 88–90. (In Chinese) [Google Scholar]
  67. Xü, B.; Wu, T.; Li, W. Screening of calculation methods for wind shear exponent. Trans. Chin. Soc. Agric. Eng. 2014, 30, 188–194. (In Chinese) [Google Scholar]
  68. Farrugia, R.N. The wind shear exponent in a mediterranean island climate. Renew. Energ. 2003, 28, 647–653. [Google Scholar] [CrossRef]
  69. Okorie, M.E.; Inambao, F.; Chiguvare, Z. Evaluation of wind shear coefficients, surface roughness and energy yields over inland locations in Namibia. Procedia Manuf. 2017, 7, 630–638. [Google Scholar] [CrossRef]
  70. Rehman, S.; Al-Abbai, M.N. Wind shear coefficient, turbulence intensity and wind power potential assessment for Dhulom, Saudi Arabia. Renew. Energ. 2008, 33, 2653–2660. [Google Scholar] [CrossRef]
Figure 1. Location (a) and surrounding terrains (b) of the observation site (red triangle) and outdoor view of the Doppler wind LiDAR (DWL) (c). In subgraph (b), ASL represents the abbreviation for above sea level.
Remotesensing 16 01840 g001
Figure 2. Monthly data acquisition rates (MDARs) of the Doppler wind LiDAR (DWL) at various heights above the ground level (AGL) in different months.
Remotesensing 16 01840 g002
Figure 3. Probability distributions of horizontal wind direction (HWD, the left panel, (a1d1)), horizontal wind speed (HWS, the middle panel, (a2d2)), and vertical wind speed (VWS, the right panel, (a3d3)) at various height levels during the four seasons. The subgraphs from the first row to the fourth row represent spring, summer, autumn, and winter, respectively. The solid line represents the averaged results.
Remotesensing 16 01840 g003
Figure 4. Probability distribution of horizontal wind direction (HWD) at different hours in the near-surface layer (NL, 70 m above ground level, the 1st panel, (a1d1)), the lower layer (LL, 884 m above ground level, the 2nd panel, (a2d2)), the middle layer (ML, 1650 m, above ground level, the 3rd panel, (a3d3)), and the upper layer (UL, 2465 m above ground level, the 4th panel, (a4d4)) during the four seasons. In subgraphs, the solid line represents the averaged HWDs.
Remotesensing 16 01840 g004
Figure 5. Probability distribution of horizontal wind speed (HWS) at different hours in the near-surface layer (NL, 70 m above ground level, the 1st panel, (a1d1)), the lower layer (LL, 884 m above ground level, the 2nd panel, (a2d2)), the middle layer (ML, 1650 m, above ground level, the 3rd panel, (a3d3)), and the upper layer (UL, 2465 m above ground level, the 4th panel, (a4d4)) for four seasons. In subgraphs, the solid line represents the averaged HWSs.
Remotesensing 16 01840 g005
Figure 6. Probability distribution of vertical wind speed (VWS) at different hours in the near-surface layer (NL, 70 m above ground level, the 1st panel, (a1d1)), the lower layer (LL, 884 m above ground level, the 2nd panel, (a2d2)), the middle layer (ML, 1650 m, above ground level, the 3rd panel, (a3d3)), and the upper layer (UL, 2465 m above ground level, the 4th panel, (a4d4)) for four seasons. In subgraphs, the solid line represents the averaged VWSs.
Remotesensing 16 01840 g006
Figure 7. Arithmetic averages of the horizontal wind speed (AWS) at different height layers within the local PBL and the fitted power law relationships for four seasons.
Remotesensing 16 01840 g007
Figure 8. The hourly averaged α for different seasons.
Remotesensing 16 01840 g008
Table 1. Main specifications of the Doppler wind LiDAR (DWL).
ItemsSpecificationsValues
1laser wavelength (µm)1.55
2power dissipation (W)≤250 (average power)
3weight (kg)65
4volume (mm)420 × 700
5power supply (V)220
6scanning modeDBS, PPI, RHI, etc.
7scan range (azimuth/pitch) (°)0–360/−10–+190
8wind speed measurable range (m/s)0–75
9available detection range (km)≤10
10velocity accuracy (m/s)≤0.1 (radial direction)
11directional angle accuracy (°)≤0.1
12height resolution (m)28
13temporal resolution (s)≥3
14measurementssignal-to-noise ratio, radial velocity, horizontal and vertical wind speed and direction, etc.
Disclaimer/Publisher’s Note: The statements, opinions and data contained in all publications are solely those of the individual author(s) and contributor(s) and not of MDPI and/or the editor(s). MDPI and/or the editor(s) disclaim responsibility for any injury to people or property resulting from any ideas, methods, instructions or products referred to in the content.

