Technical Note

Modeling with Hysteresis Better Captures Grassland Growth in Asian Drylands

1
School of Geographical Sciences, Nanjing University of Information Science and Technology, Nanjing 210044, China
2
School of Ecology and Applied Meteorology, Nanjing University of Information Science and Technology, Nanjing 210044, China
3
College of Geographical Science, Inner Mongolia Normal University, Hohhot 010028, China
4
Changwang School of Honors, Nanjing University of Information Science and Technology, Nanjing 210044, China
5
School of Remote sensing & Geomatics Engineering, Nanjing University of Information Science and Technology, Nanjing 210044, China
*
Author to whom correspondence should be addressed.
Remote Sens. 2024, 16(11), 1838; https://doi.org/10.3390/rs16111838
Submission received: 27 March 2024 / Revised: 4 May 2024 / Accepted: 17 May 2024 / Published: 22 May 2024

Abstract

:
Climate warming hampers grassland growth, particularly in dryland regions. To preserve robust grassland growth and ensure the resilience of grassland in these arid areas, a comprehensive understanding of the interactions between vegetation and climate is imperative. However, existing studies often analyze climate–vegetation interactions using concurrent vegetation indices and meteorological data, neglecting time-lagged influences from various determinants. To address this void, we employed the random forest machine learning method to predict the grassland NDVI (Normalized Difference Vegetation Index) in Asian drylands (including five central Asia countries, the Republic of Mongolia, and Parts of China) from 2001 to 2020, incorporating time-lag influences. We evaluated the prediction model’s performance using three indexes, namely the coefficient of determination (R2), root-mean-square error (RMSE), and Mean Absolute Error (MAE). The results underscore the superiority of the model incorporating time-lag influences, demonstrating its enhanced capability to capture the grassland NDVI in Asian drylands (R2 ≥ 0.915, RMSE ≤ 0.033, MAE ≤ 0.019). Conversely, the model without time-lag influences exhibited relatively poor performance, notably inferior to the time-lag-inclusive model. The latter result aligns closely with remote sensing observations and more accurately reproduces the spatial distributions of the grassland NDVI in Asian drylands. Over the study period, the grassland NDVI in Asian drylands exhibited a weak decreasing trend, primarily concentrated in the western region. Notably, key factors influencing the grassland NDVI included the average grassland NDVI in the previous month, total precipitation in the current month, and average soil moisture in the previous month. This study not only pioneers a novel approach to predicting grassland growth but also contributes valuable insights for formulating sustainable strategies to preserve the integrity of grassland ecosystems.

1. Introduction

As one of the most widely distributed vegetation types in terrestrial ecosystems [1], grasslands play a vital role in regulating the global carbon cycle and sustaining the structure and function of ecosystems [2,3]. Grassland ecosystems also serve as a key indicator of global climate change, with physiological processes such as photosynthesis and respiration linking natural moisture, atmosphere, and soil [4]. However, the growth of grasslands is strongly influenced by the external environment, especially in dryland areas [5,6]. In the context of climate warming, frequent extreme events profoundly impact grassland growth [7,8]. Recent extensive research on the impacts of climate change on grassland growth indicates that rising temperatures and increased drought could hinder growth or even lead to stagnation [9,10,11,12]. Therefore, obtaining reliable and objective information on grassland growth in a timely manner is crucial [13].
To safeguard grassland growth in dryland areas, it is imperative to accurately simulate the vegetation growth process and predict growth conditions. However, predicting vegetation growth using current tools is challenging [14]. Among the available tools, process-based ecosystem models play a vital and beneficial role in predicting vegetation growth [3]. Achieving accurate predictions of vegetation growth requires these models to reproduce multiple processes with greater precision and realism [15,16]. However, process-based ecosystem models face limitations in accurately replicating key ecosystem processes such as photosynthesis and respiration [16,17]. Recognizing these limitations, machine learning methods have emerged as promising alternatives, capable of comprehensively considering influential factors reflecting ecosystem processes. Machine learning methods effectively compensate for the shortcomings of process-based ecosystem models [18]. Techniques such as support vector machines, random forests, and gradient-boosted trees are employed to elucidate relationships between variables and predictor variables [11,18]. However, research on predicting vegetation growth in Asian drylands remains relatively limited [11,19]. Many scholars have investigated the prediction of vegetation NDVI growth using this method. For instance, Li et al. employed the extreme gradient boosting machine learning method to establish a relationship model between vegetation NDVI and meteorological factors in mainland China. They discovered that the machine learning model exhibits strong performance in replicating the spatial and seasonal variations in satellite-derived NDVI throughout China [11]. Peng et al., on the other hand, utilized a novel machine learning method to forecast the NDVI growth of vegetation during the growing season in China under extreme conditions. The findings indicate that the machine learning method demonstrates stability and high accuracy even amidst severe drought conditions [19]. These studies successfully replicated the spatial and temporal distributions of vegetation growth in China, employing machine learning to assess its accuracy in predicting growth under extreme drought conditions. Machine learning was an important tool for predicting vegetation growth, enhancing our overall predictive capabilities. It is conducive to the timely acquisition of reliable, objective, and timely information on vegetation growth.
Asian drylands boast abundant grassland resources, playing a crucial role in the sustainable development of the local livestock economy [20,21]. For centuries, the indigenous communities have relied on the plentiful resources of the grasslands for the growth of animal husbandry, establishing them as a pivotal industry essential for their survival [22]. Consequently, forecasting information regarding Asian dryland grasslands plays a crucial guiding role in shaping local animal husbandry practices. In-depth research has studied the response mechanism of the grassland NDVI and climate change. A discernible time-lag effect was observed between the grassland NDVI and various climate elements, indicating a delayed response [23,24,25,26]. In Asian drylands, the grassland NDVI in the current month showed a stronger response to solar radiation and the previous month’s soil moisture, without significant lag effects from temperature and total precipitation [25]. This suggests that changes in climatic factors could impact the grassland NDVI within a few months. However, there are few studies that consider the influence of time lag in predicting the grassland growth of Asian drylands, highlighting a notable gap in the current scientific literature. Employing the random forest machine learning method, we developed an NDVI prediction model for Asian dryland grasslands, incorporating both time-lag influences and their absence. Our main research objectives were (1) to evaluate the accuracy of the grassland NDVI predictions from 2001 to 2020, accounting for and excluding time-lag influences; (2) to investigate the spatiotemporal distributions of the NDVI in Asian grasslands from 2001 to 2020 using the two distinct models; and (3) to identify the primary climate factors influencing the NDVI in arid Asian regions based on the outcomes derived from the two models.

2. Materials and Methods
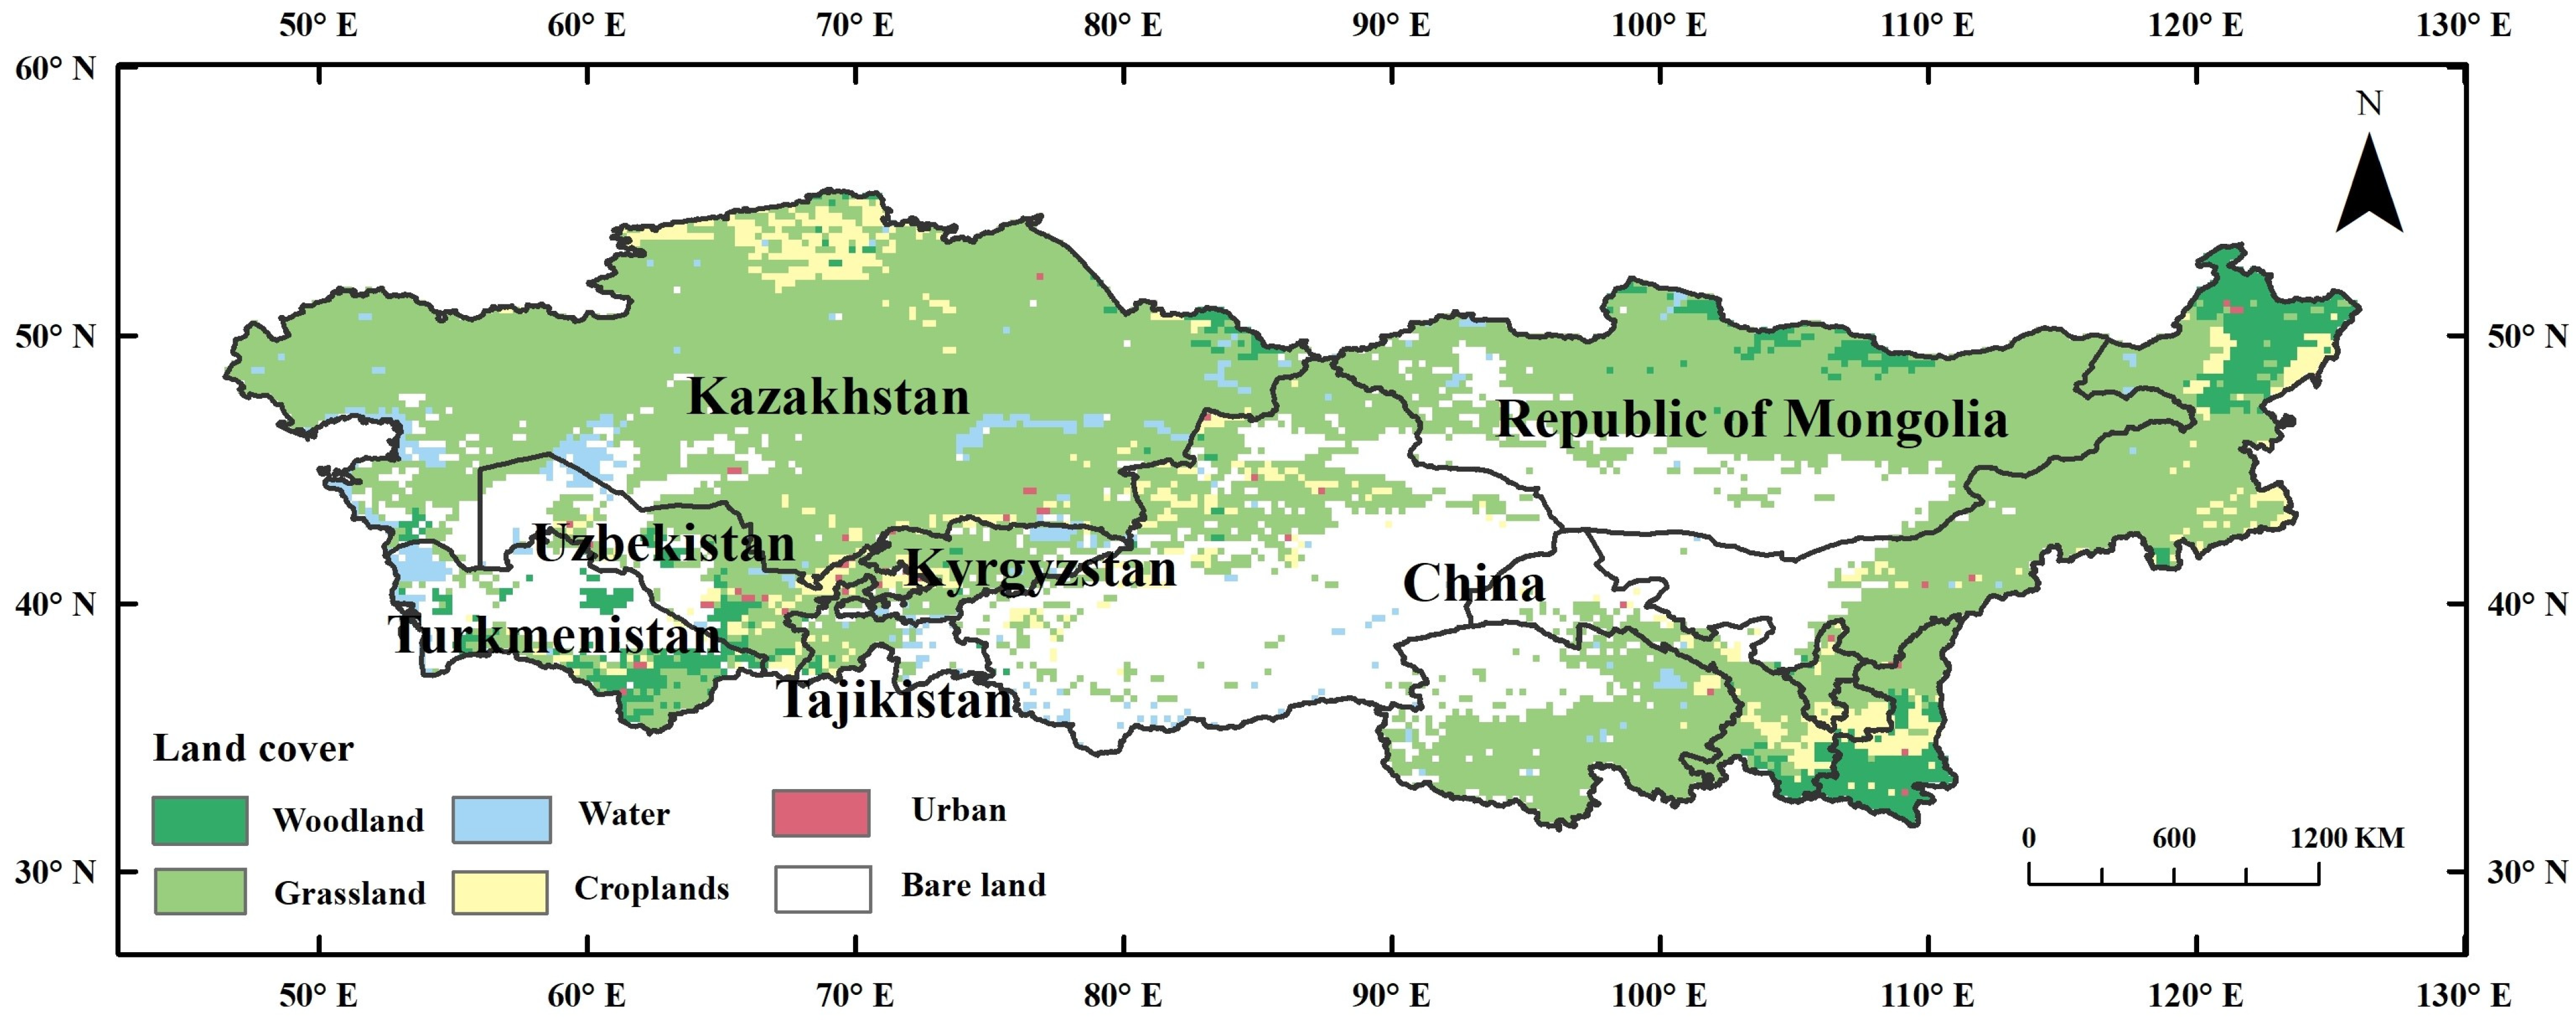
2.1. Study Area

The research area is the Asian drylands, ranging from 46.49° to 126.08°E and 31.54° to 55.43°N, geographically covering six countries: Kazakhstan, Kyrgyzstan, Tajikistan, Turkmenistan, Uzbekistan, and Mongolia, as well as certain regions of China, namely Inner Mongolia, Shaanxi, Ningxia, Gansu, Qinghai, and Xinjiang (refer to Figure 1, adapted from MODIS land cover product, specifically MCD12C1, accessible at https://lpdaac.usgs.gov/pro-ucts/mcd12c1v006/ (accessed on 18 May 2018)). Spanning over 10 million square kilometers, this region features a distinctive continental arid climate characterized by frequent droughts, low precipitation, and escalating temperatures [27,28]. The eastern Asian drylands experience fewer than 200 mm of annual precipitation, featuring a cold and dry winter and high temperatures in summer [29,30]. The western part (the five central Asia countries) holds an annual precipitation of 300–500 mm, and this region witnesses cold winters, hot summers, and substantial day-to-day temperature variations [29,31]. Under arid and semiarid climatic conditions [32], the main land use type is grassland, with sparse vegetation and extensive desert areas in the central region.

2.2. Data Resources

2.2.1. MODIS NDVI

The MODIS NDVI (Normalized Difference Vegetation Index) data are sourced from the National Aeronautics and Space Administration’s (NASA) Moderate Resolution Imaging Spectroradiometer (MODIS) Vegetation Index (VI) product (MOD13C2) (https://ladsweb.modaps.eosdis.nasa.gov) (accessed on 15 April 2022). This dataset spans the period from January 2001 to December 2020, featuring a spatial resolution of 0.05° × 0.05° and a temporal resolution of 1 month. This dataset underwent rigorous preprocessing, including geometric, atmospheric, and radiometric corrections, as well as validation procedures to reduce the impact of atmospheric factors such as cloud shadows and aerosols [33]. The monthly MOD13C2 data are widely recognized for their reliability and are extensively employed for monitoring vegetation conditions at both regional and global scales [34,35].

2.2.2. Climate Dataset

Climate variables include temperature, precipitation, scPDSI (self-calibrating Palmer Drought Severity Index), minimum air temperature, and maximum air temperature. These datasets were obtained from the monthly gridded Climatic Research Unit Time-Series version 4.05 (CRU TS4.05), which is provided by the Climatic Research Unit (CRU) at the University of East Anglia, UK (https://catalogue.ceda.ac.uk/uuid/c26a65020a5e4b80b20018f148556681) (accessed on 21 April 2022) [36]. It features a spatial resolution of 0.5° × 0.5° and a temporal resolution of 1 month, encompassing the period from January 2001 to December 2020. Currently, CRU is one of the most extensively utilized climate datasets. It integrates several well-known existing databases and uses angular distance weighted interpolation to generate global monthly data covering the land surface from 1901 to 2020.
Solar radiation data for model training and testing are sourced from the European Centre for Medium-Range Weather Forecasts (ECMWF) version 5 reanalysis (ERA5) dataset (https://cds.climate.copernicus.eu/cdsapp#!/home) (accessed on 27 April 2022). Representing the latest generation of ECWMF reanalysis data, ERA5 offers improved spatial and temporal resolution, as well as enhanced radiative transfer modeling compared with its predecessor, ERA interim reanalysis [11]. These data can be acquired from 1979 to the present, with a spatial resolution of 0.1° × 0.1° and a temporal resolution of 1 month. For this study, data from January 2001 to December 2020 are utilized.
Vapor Pressure Deficit (VPD) datasets are extracted from the Terra-Climate dataset provided by the University of Idaho (https://climate.northwestknowledge.net/TERRACLIMATE/index_directDownloads.php) (accessed on 5 March 2023). The Terra-Climate dataset provides vpd information at a spatial resolution of 1/24° × 1/24°, with a temporal resolution of 1 month. The data cover the time period from January 2001 to December 2020.

2.2.3. Soil Moisture

The daily soil moisture datasets are obtained from the soil moisture dataset within the European Space Agency (ESA) Climate Change Initiative Program (CCI) (https://www.esa-soilmoisture-cci.org) (accessed on 6 May 2022). It is featured with a spatial resolution of 0.25° × 0.25°, and the data span from January 2001 to December 2020. The soil moisture product was derived by synthesizing an active microwave soil moisture product produced by Bartalis et al. [37] and Wagner et al. [38] and a passive microwave soil moisture product developed by Vrije Universiteit Amsterdam in collaboration with NASA [39,40]. This composite product accurately represents soil moisture levels at a depth ranging from 0 to 10 cm. Due to limitations in satellite sensor coverage, there were significant gaps in the data, resulting in missing pixels. Thus, we removed the missing data points (7%) and computed monthly averages of soil moisture data, ensuring comprehensive coverage of the study area on a month-by-month basis.

2.2.4. Land Use Data

The land cover data were resourced from NASA’s MODIS land cover product MCD12C1 (https://lpdaac.usgs.gov/products/mcd12c1v006/) (accessed on 18 May 2018). This dataset features a spatial resolution of 0.05° × 0.05°. This particular research focused on identifying grassland image elements that remained consistent throughout the entire period from 2001 to 2020. This approach was employed to some extent to mitigate the land use impact.

2.3. Method

2.3.1. Trend Analyses

We used least squares linear regression to analyze the spatial trends of the grassland NDVI in the dryland areas of Asia from 2001 to 2020. F-test was used to analyze the significance of the trends [41].
S l o p e = n i = 1 n i × N D V I i i = 1 n i × i = 1 n N D V I i n i = 1 n i 2 ( i = 1 n i ) 2
where S l o p e is the slope of the image element, N D V I i is the mean value of NDVI in the ith year, and n is the length of the study.
Although the observed NDVI indeed provides valuable data on current vegetation conditions over Asia’s drylands, there are several compelling reasons for focusing our trend analysis on predicted NDVI. Firstly, the predicted NDVI reveals possible future vegetation patterns under certain environments, allowing model accuracy assessment through comparison with actual observations. Secondly, the reliable NDVI prediction model helps identify links between vegetation growth and the environment, enhancing ecological understanding. Finally, the predicted NDVI supplements observed data, especially in data-scarce or observation-challenging areas, offering a fuller picture of vegetation trends.

2.3.2. Random Forest

The random forest algorithm, proposed and developed by Leo Breiman and Adele Cutler [42], stands out as a powerful tool for addressing both classification and regression problems. Its core concept diverges from the conventional approach of constructing a single, large decision tree using the entire training dataset. Instead, the random forest technique generates multiple decision trees using different subsets of training samples and attributes. These individual decision trees are then combined in a random fashion to create a more robust and effective model, enhancing the overall performance of the random forest model [43,44].
The MODIS NDVI product was used to represent vegetation growth, a choice commonly employed in previous research [4,5]. Previous studies identified a significant time-lag effect on the grassland NDVI in Asian drylands [25]. Because vegetation growth in a current month is influenced by the preceding month, the NDVI from the previous month was also incorporated into the model as an explanatory variable during training. This study utilized MODIS NDVI data from 2001 to 2020 in Asian drylands as the dependent variable, with various other factors serving as independent variables (See Table 1). Each image for each explanatory variable covered an area of 30,528 pixels, for a total of 240 images for a variable. The overall dataset for the random forest encompassed 7,326,720 samples, with 70% allocated for training and 30% for validation.

2.3.3. Statistical Analysis

Two models were developed using the random forest machine learning method to predict the grassland NDVI in Asian drylands. One model excluded time-lag influences, while the other incorporated these influences. The precision differences were then compared between the two models. R2 was used to measure how effectively each model explained the variation in the data; RMSE served as a metric to measure the standard deviation between the true and predicted values; and MAE was used to measure the size of the gap between the true and predicted values [3,42].
R 2 = 1 i = 1 n ( y i y ^ i ) 2 i = 1 n ( y i y ¯ i ) 2
R M S E = 1 n i = 1 n ( y i y ^ i ) 2
M A E = 1 n i = 1 n | y i y ^ i |

3. Results

3.1. Evaluation of Model Performance in Predicting Grassland NDVI in Asian Drylands

The results reveal that the NDVI model incorporating time-lag effects outperforms the model without time-lag across all evaluation indices. The overall coefficient of determination for the model considering time-lag influences was 0.92, whereas the NDVI prediction model without time-lag influences achieved a coefficient of determination of 0.89 (Figure 2a,b). The R2 values indicated that these models could explain 92% and 89% of the variations in the grassland NDVI, respectively. Further, the RMSE and MAE values of the model considering time-lag influences were 0.033 and 0.019, respectively, while values of the model without time-lag influences were 0.037 and 0.022, respectively (Figure 2a,b). The results from the three evaluation metrics collectively demonstrate that the model considering time-lag influences outperformed the model without time-lag influences in predicting the grassland NDVI in Asian drylands. As depicted in Figure 2, both models fitted well with observations, with the majority of NDVI values clustering between 0 and 0.25. This visual representation affirmed the reliability and accuracy of the developed models in capturing the dynamics of the grassland NDVI in the study region.
Figure 2. Density scatter plot showing the relationship between the observed MODIS and predicted NDVI values. Notes: (a) illustrates MODIS NDVI versus predicted NDVI with time-lag influences considered, while (b) depicts MODIS NDVI versus predicted NDVI without time-lag influences. The black line represents the 1:1 correspondence, and the red line indicates the regression line. According to the spatial distributions of R2, the developed model for predicting grassland NDVI considering time-lag influences outperformed the model without time-lag influences (Figure 3). Regions exhibiting notably high R2 values were mainly concentrated in Kazakhstan (Figure 3a,b). Regarding RMSE index, the grassland NDVI model considering time-lag influences demonstrated superior performance compared with the model without time-lag influences, particularly in the northeastern part of the Mongolian Plateau and Kazakhstan (Figure 3c,d). Evaluating the MAE values from the two models, the areas with relatively high MAE of the model considering time-lag influences were mainly distributed in the central part of the Mongolian Plateau and Kazakhstan (Figure 3e,f). The spatial distributions of these three indexes (R2, RMSE, MAE) collectively indicate that both models were effective in predicting grassland NDVI in Asian drylands. However, the model considering time-lag influences exhibited superior performance, especially in the Kazakhstan region (Figure 3). These findings highlight the significance of considering time-lag influences to enhance the accuracy of predictions, particularly in specific geographical areas.
Remotesensing 16 01838 g002
Figure 3. Spatial distributions of three indexes of grassland NDVI without time-lag influences and grassland NDVI with time-lag influences. Notes: (a,b) coefficient of determination (R2); (c,d) root-mean-square error (RMSE); (e,f) root-mean-square error (MAE).
Remotesensing 16 01838 g003

3.2. Comparing Spatiotemporal Variations between the Two Models

We reproduced the annual variation in the mean grassland NDVI in Asian drylands from 2001 to 2020 (Figure 4). The annual average grassland NDVI with time-lag influences was closer to the observed MODIS NDVI. The average NDVI for the grassland NDVI model, both with a time-lag influence (0.17) and without it (0.21), was higher than the annual mean NDVI derived from MODIS NDVI (0.14). Among the three NDVI values, all had consistent fluctuations in the grassland NDVI change (Figure 4). The time series of MODIS NDVI and NDVI from the two models showed a weak decreasing trend from 2001 to 2020.
We could observe that both models were able to reproduce the spatial distributions of the annual mean grassland NDVI in Asian drylands, and they were consistent with the spatial distributions of the observed MODIS NDVI (Figure 5a–c). The model considering time-lag influences was better than that without time-lag influences, as the former model was similar to the observed annual mean MODIS NDVI (Figure 5b). The annual mean NDVI decreased from the periphery to the center (both for the five central Asia countries and the Mongolia Plateau) (Figure 5a–c). Compared with the annual mean NDVI predicted by the model without time-lag influences, the annual mean NDVI predicted by the model considering time-lag influences was more accurate in the central and southern Kazakhstan and Inner Mongolia regions (Figure 5b,c).

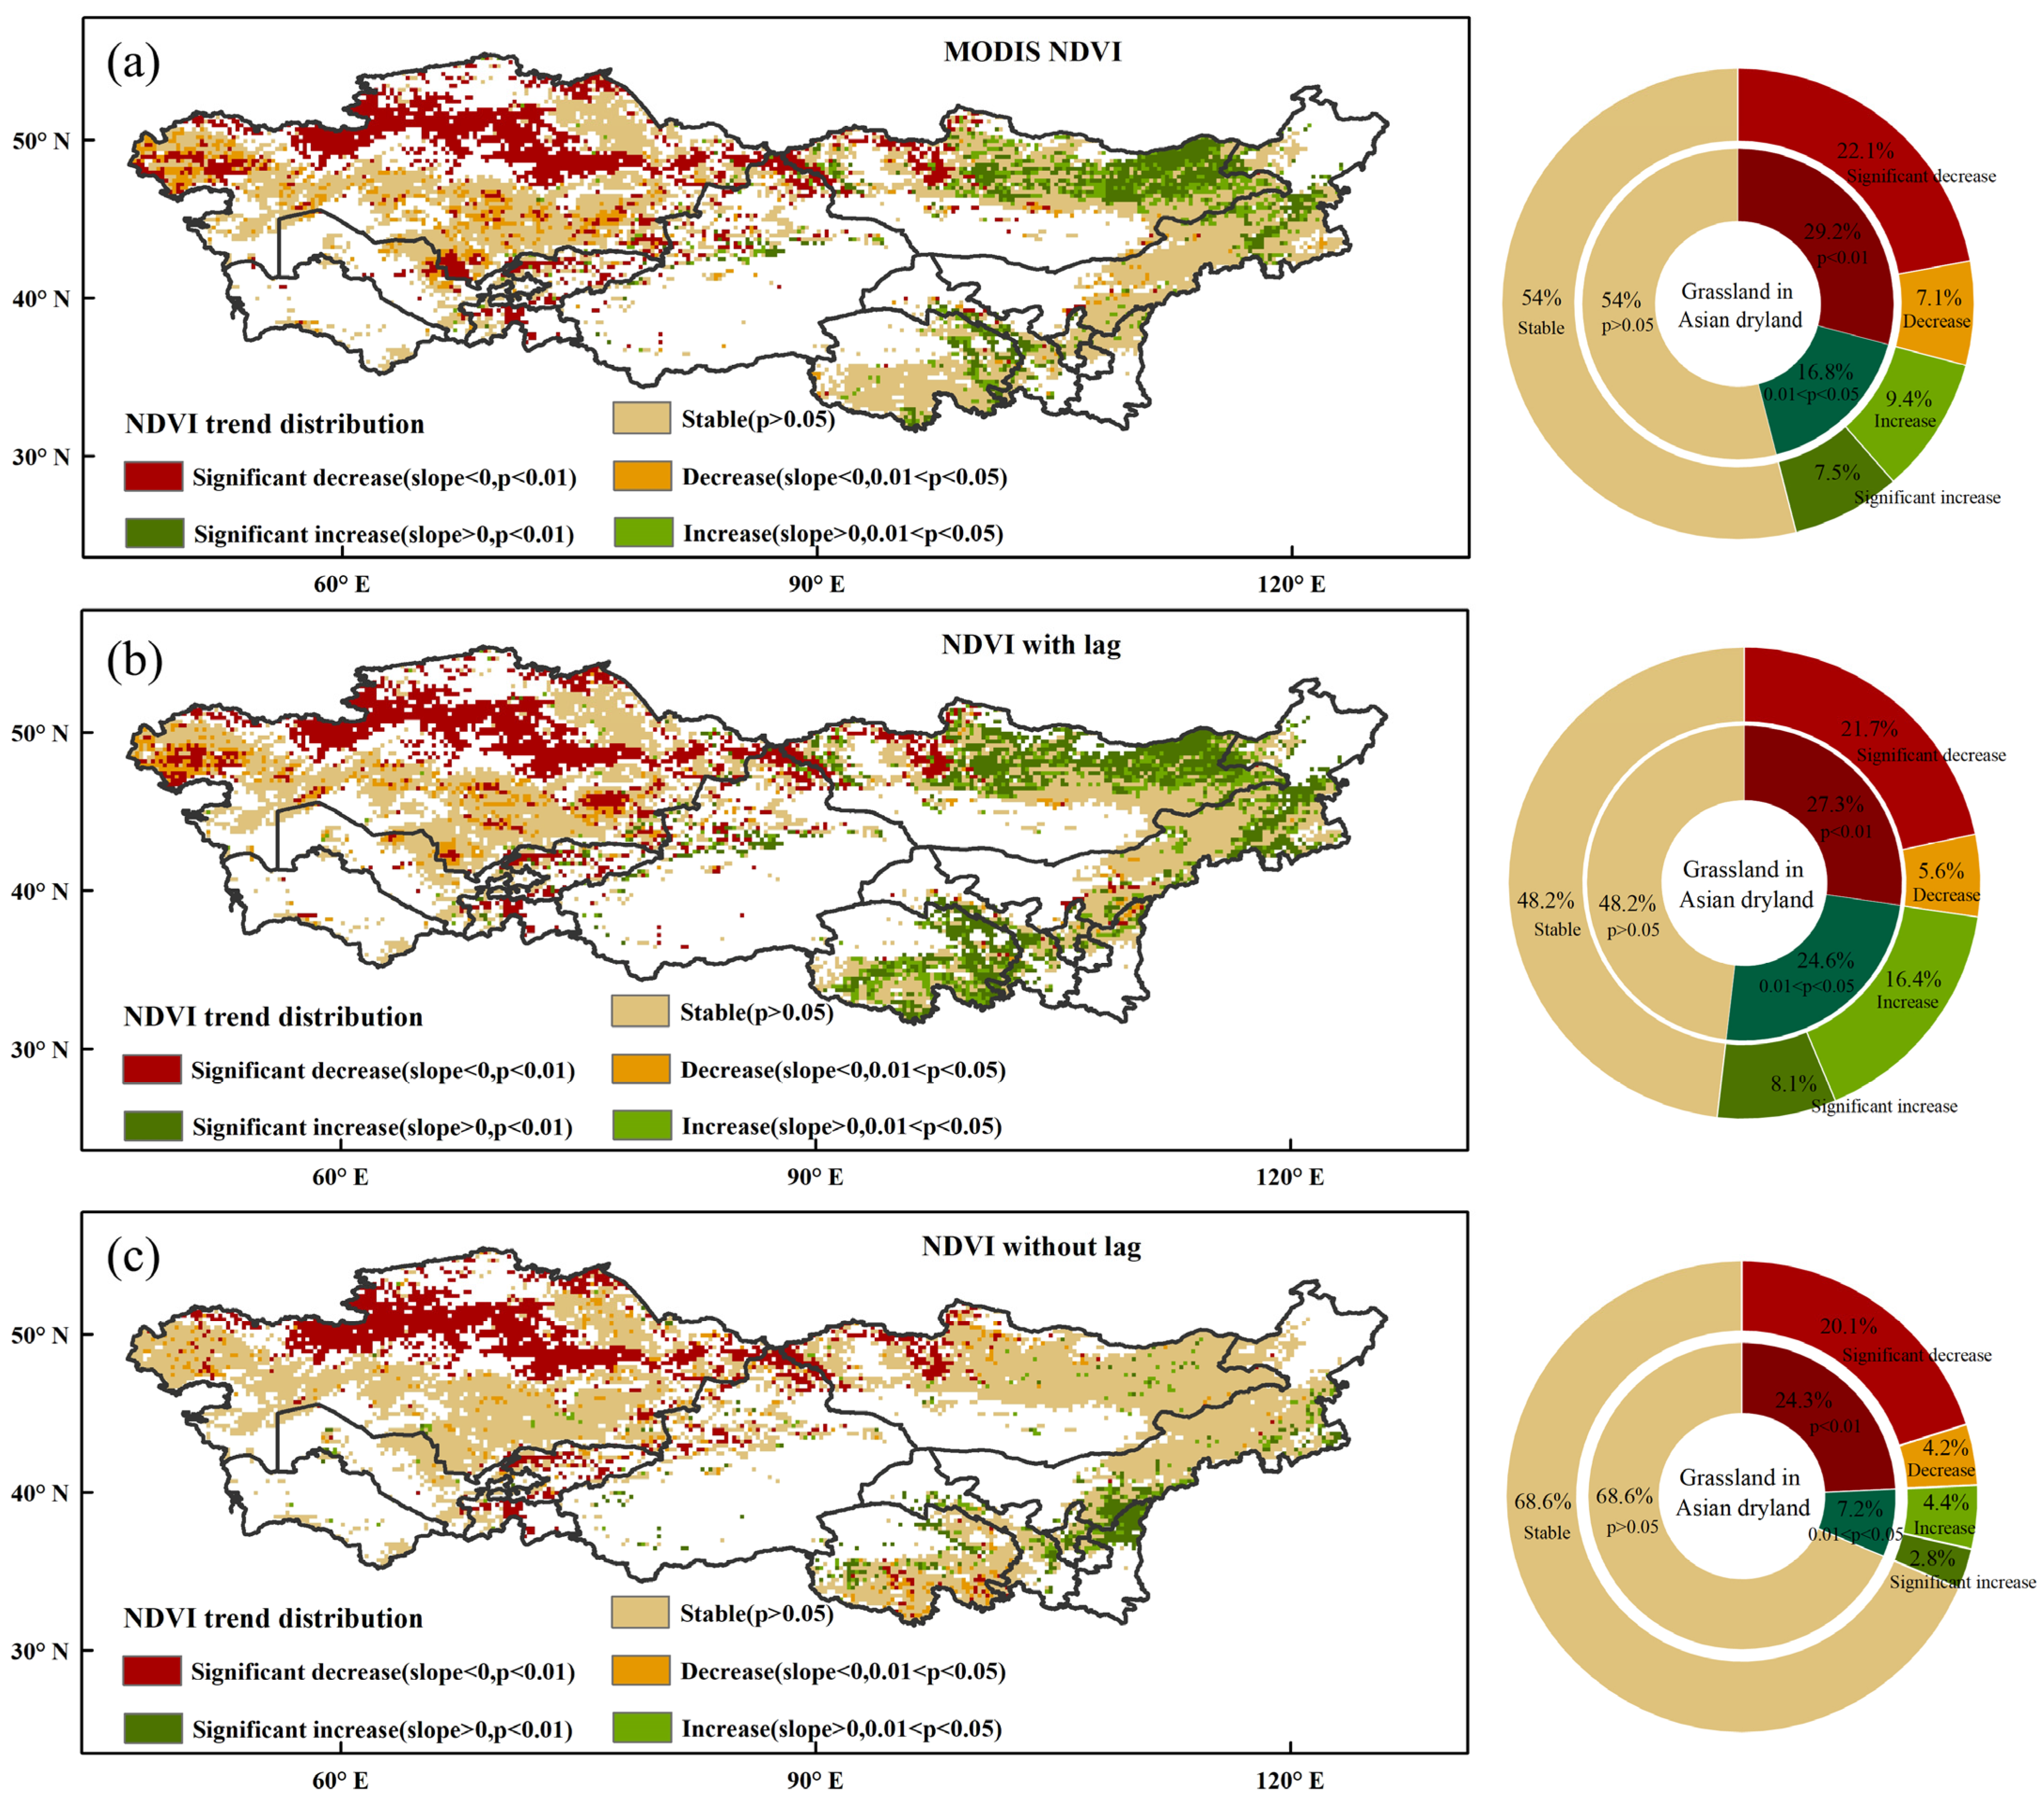
3.3. Comparing NDVI Trend Spatial Distributions between the Two Models

We analyzed the spatial trends of the grassland NDVI in Asian drylands from 2001 to 2020 using least-squares linear regression. The spatial trends of the predicted grassland NDVI considering time-lag influences were closer to that of the MODIS NDVI (Figure 6a,b) compared with the model simulations without time-lag influences (Figure 6c). From the MODIS NDVI, 54% of the grassland regions had unchanged NDVI values in Asian drylands (marked in stable), mainly located in Kazakhstan, Inner Mongolia, and Qinghai of China. A fifth (22%) of the grassland areas featured with significantly decreased NDVI values were located in northern Kazakhstan, whereas most of the areas with significant increases were located in the northeastern Republic of Mongolia, Inner Mongolia, and Qinghai (8%) (Figure 6a). The distribution of the five spatial trend types in the model output, taking into account time-lag influences, was superior to that of the model output without considering time-lag influences (Figure 6). In terms of concrete values, the grassland NDVI remained stable in 54%, 48%, and 69% of the grassland areas for (i) MODIS NDVI, (ii) predicted NDVI with time-lag, and (iii) predicted NDVI without time-lag, respectively (Figure 6a). Conversely, the grassland NDVI significantly decreased in 22%, 22%, and 20% (Figure 6b) and significantly increased in 8%, 8%, and 3% (Figure 6c) of the grassland areas in Dryland Asia for (i) MODIS NDVI, (ii) predicted NDVI with time-lag, and (iii) predicted NDVI without time-lag, respectively (Figure 6b).

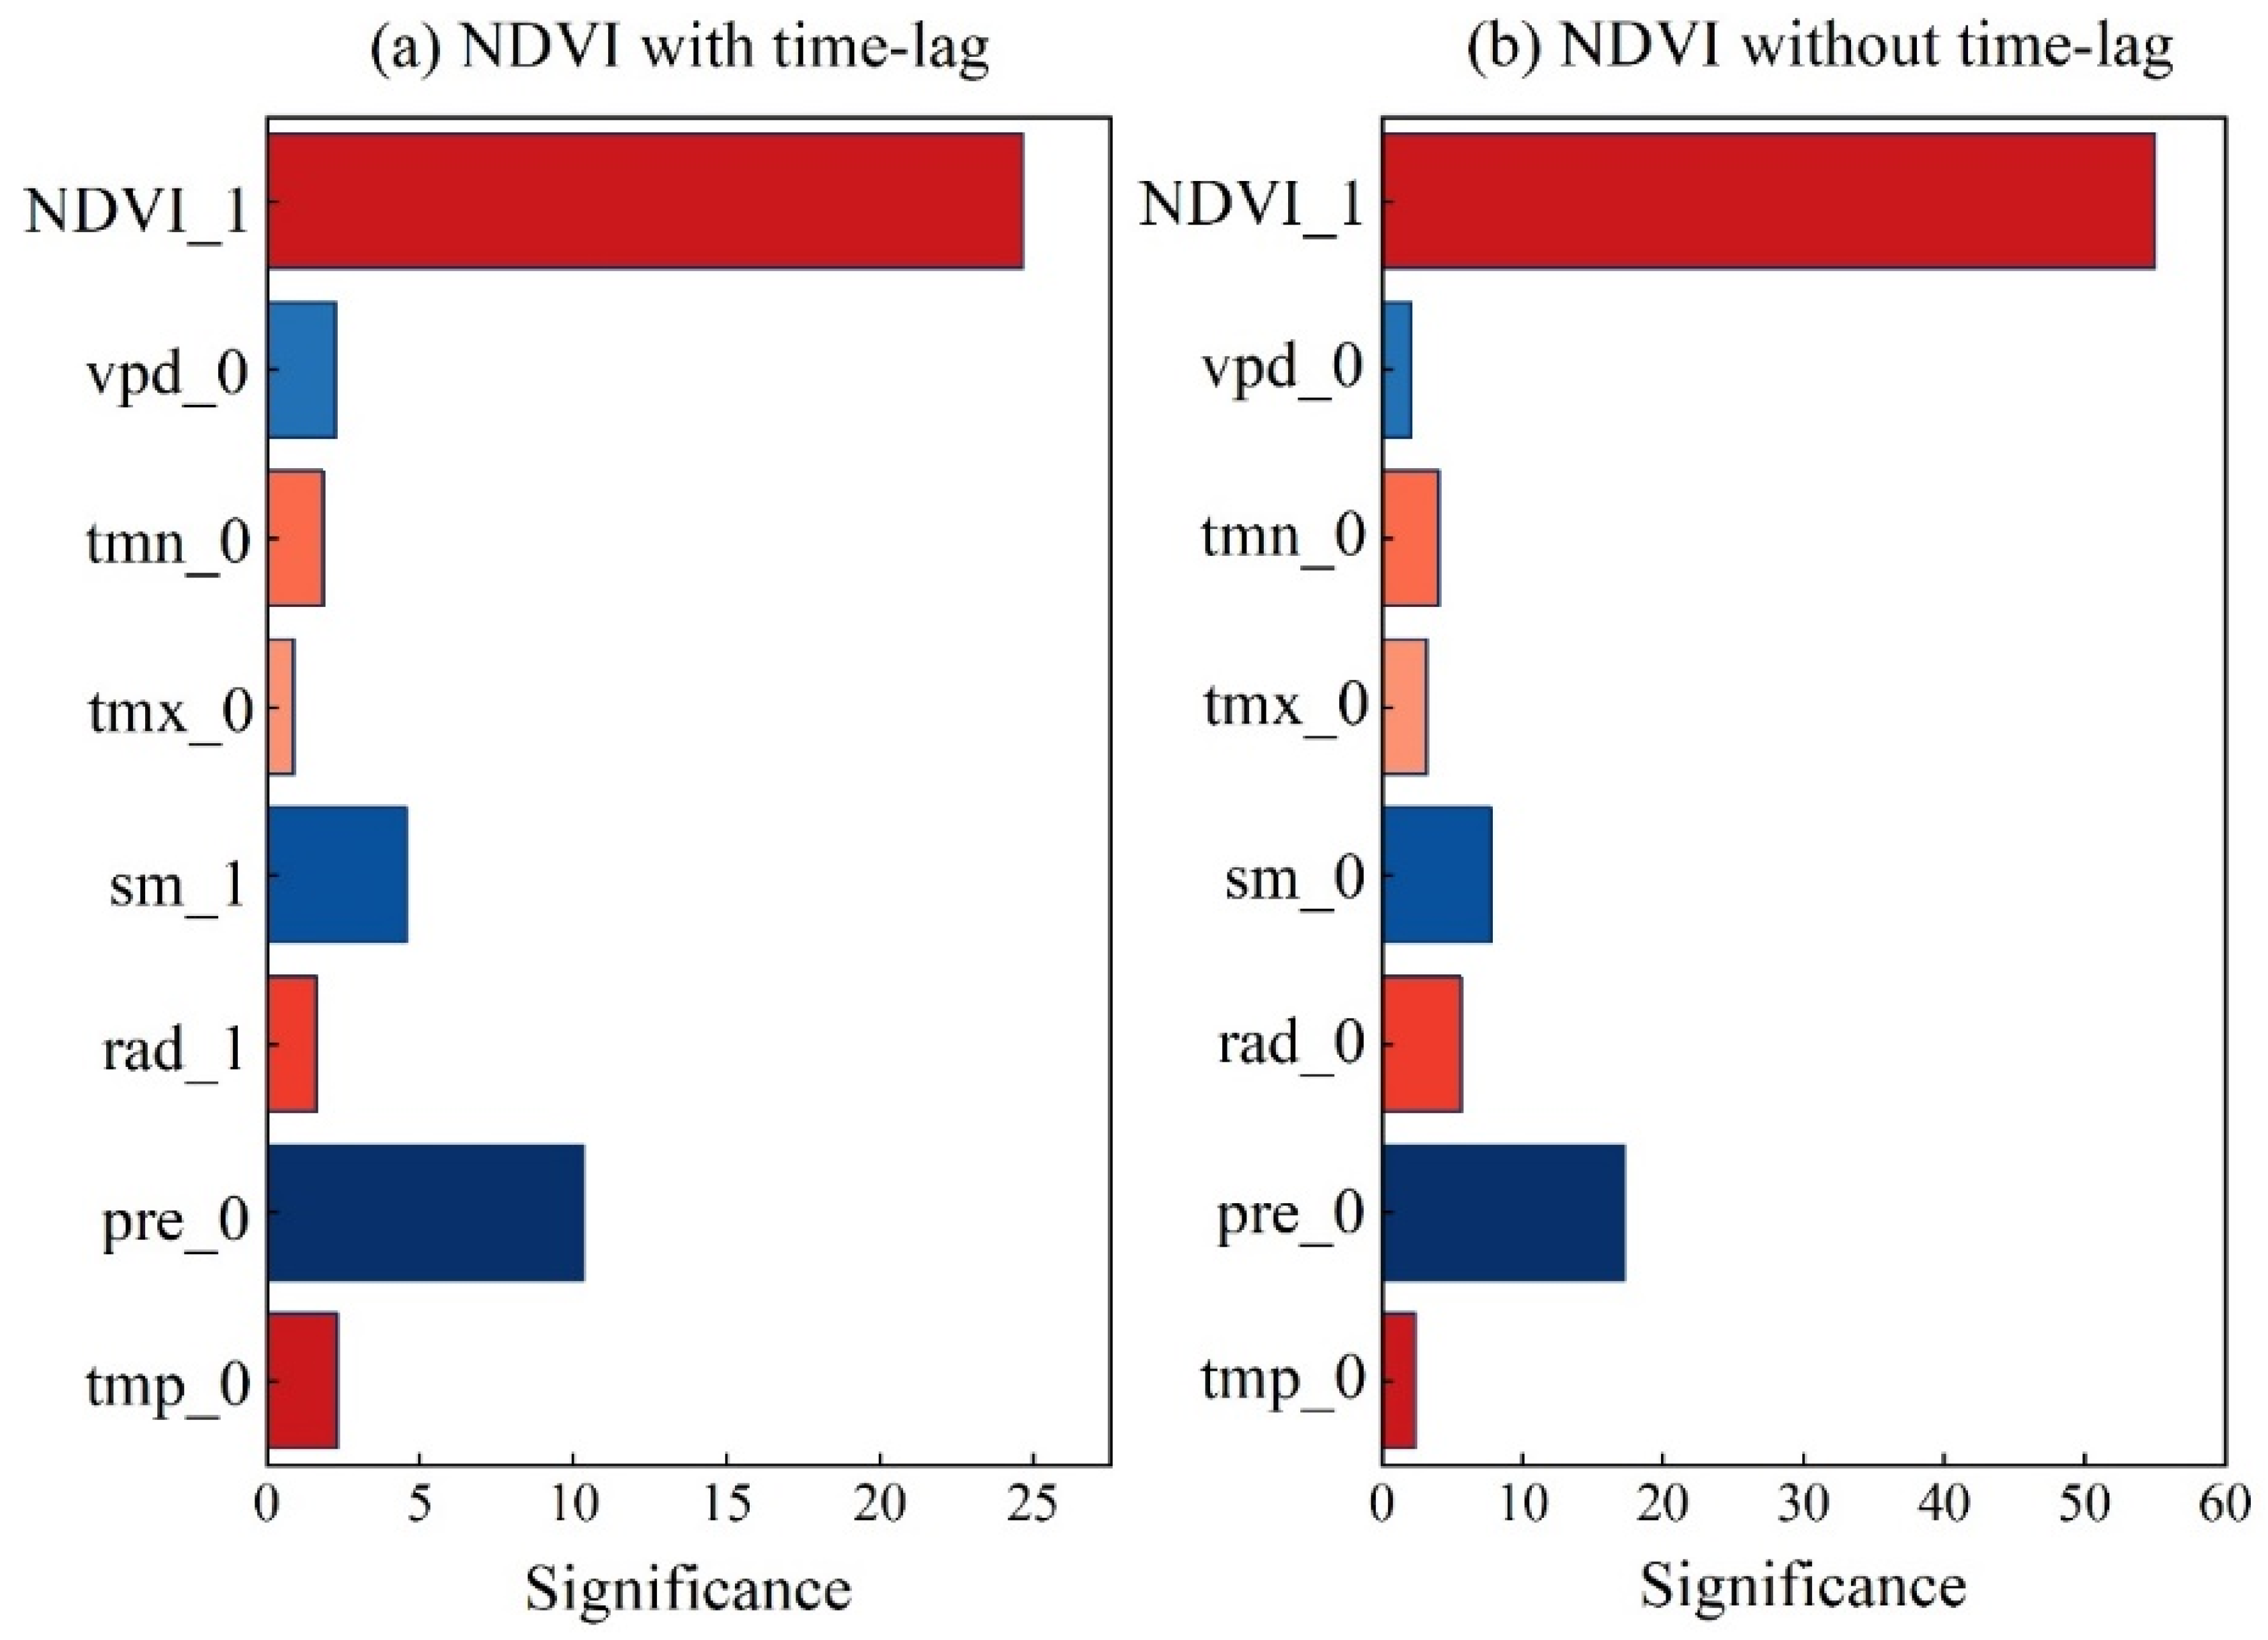
3.4. Importance of the Variables from Random Forest

Figure 7a,b illustrates the relative importance of the two models with and without considering the time-lag influences by model outputs. NDVI_1 was most important for the grassland NDVI in Asian drylands from 2001 to 2020, with importance values of 24.7 and 55.0 for the two models. The second most important factor was pre_0, with importance values of 10.3 and 17.2 for the two models. Except for NDVI_1 and pre_0, sm_1 and vpd_0 were important for the grassland NDVI in Asian drylands. For the model considering time-lag influences, NDVI_1 and moisture variables (pre_0, sm_1, and vpd_0) were the major determinants for the grassland NDVI in Asian drylands, and they accounted for about 86.3% of the overall importance. In comparison, for the model without considering time-lag influences, NDVI_1, pre_0, sm_0, and rad_0 were the major determinants, which accounted for about 87.9% of the overall importance. Hence, soil moisture from the previous month played a crucial role in influencing the current month’s grassland NDVI, as depicted in Figure 7a.

4. Discussion

Machine learning methods have been demonstrated in this study to possess remarkable capabilities in predicting the grassland NDVI, consistent with the findings of numerous previous studies [19,45,46]. Additionally, several studies have suggested that lag effects have a substantial impact on vegetation growth. Miao [25] investigated the response of the grassland NDVI to soil moisture and solar radiation with a one-month time lag in Asian drylands, while Chen [47] et al. identified a strong positive relationship between soil moisture and the NDVI, with the NDVI typically lagging behind soil moisture by one month. Two models were developed utilizing the random forest algorithm, with and without considering time-lag influences, for the prediction of the grassland NDVI in Asian drylands. We highlighted the strong performance of both models in capturing the spatial and temporal variations and trends of the grassland NDVI in Asian drylands, while the model considering time-lag influences outperformed the other one. Thus, the integration of time-lag influences and machine learning presents a novel perspective for predicting the grassland NDVI and significantly enhances prediction accuracy.
Whether considering time-lag influence or not, the prediction results for the entire Asian grassland exhibit consistency. Over the period from 2001 to 2020, the grassland NDVI in Asian drylands generally exhibited a weak decreasing trend. Grasslands in eastern Asia generally demonstrate a growth trend in the NDVI, while the NDVI in western Asian dryland grasslands shows a slightly declining trend, with the most pronounced decline observed in northern Kazakhstan. We postulate that the factors driving grassland decline can be attributed to two main factors: climate change and human activities. Research has demonstrated five Central Asia countries witnessing an increase in aridity, marked by the severest drought in the northwestern part of Kazakhstan and a gradual reduction in overall precipitation [4,32,48]. This shift in climate patterns was likely a primary driver behind the declining grassland NDVI in northern Kazakhstan. Meanwhile, the degradation of grassland in northern Kazakhstan could be attributed to human activities, including intensified overgrazing, economic challenges faced by countries after the Soviet Union’s dissolution, and suboptimal government policies for grassland preservation [49]. Concerning the regions experiencing grassland NDVI growth, we attribute this phenomenon primarily to climate factors, particularly in northeastern Mongolia, Inner Mongolia, and Qinghai. The results of numerous studies in this region also align with our findings, indicating a consistent increasing trend in the NDVI [50,51]. This was primarily due to precipitation on the Mongolian plateau originating from both the westerly belt and the East Asian monsoon [52]. The northern part of the Mongolian Plateau is influenced by the westerly belt, resulting in higher precipitation in the north and lower levels in the south. The eastern part is influenced by the East Asian monsoon, providing more abundant rainfall, and both rain and warmth coincided, leading to a gradual increase in precipitation from the west to the east [52]. Consequently, the varying trends in the grassland NDVI across different regions of Asian drylands can be attributed to their distinct natural conditions. Therefore, the prediction of grassland growth by machine learning is particularly significant for understanding vegetation physiology and managing human activities. Nonetheless, the prediction of grassland growth in Asian dryland areas was not only related to climatic influences but also to human activities, vegetation physiological processes, and natural hazards. These multifaceted elements might potentially affect the accuracy of grassland growth predictions. Therefore, future endeavors aimed at forecasting grassland growth must comprehensively address the confluence of climatic influences and natural hazards.
The grassland NDVI is typically influenced by various concurrent climatic factors, including temperature and precipitation [53,54]. However, our study reveals a distinctive pattern, as we observed that soil moisture in the preceding month exerts a robust influence on the grassland NDVI, surpassing the impact of temperature on the grassland NDVI in grasslands. Our study identified specific climate variables that played a particularly crucial role in determining the grassland NDVI in the study area, including precipitation in the current month, soil moisture in the previous month, and vapor pressure deficit in the current month. Moisture is often regarded as the primary factor controlling vegetation growth in arid and semiarid areas [55]. Previous studies have commonly used precipitation as a key factor of moisture availability [56,57], but they have often overlooked the underlying mechanisms governing moisture dynamics. In arid and semiarid areas, a significant portion of surface-layer soil moisture originates from precipitation [58], while changes in soil moisture in deeper layers were determined by fluctuations in groundwater depth [59]. When deeper soil layers are well-hydrated, hydraulic redistribution can enhance the efficiency of the root system to absorb and transport water [59], i.e., the conductive movement of water from the wetter part of the soil to the drier part of the soil via the plant’s root system [59]. This, in turn, benefits plants by optimizing resource utilization and extending the availability of soil moisture [60]. This mechanism likely explains why soil moisture from the previous month is critical for the grassland NDVI in the current month. Therefore, soil moisture serves as a more accurate indicator of water availability for grasslands in arid regions. In research pertaining to grassland drought, numerous scholars have acknowledged the significance of soil water. They have conducted analyses to examine its impact on vegetation growth, establishing thresholds based on varying soil moisture levels [61,62].
Understanding the interplay between the NDVI and soil properties, climate, and other environmental factors is imperative for predicting grassland growth and productivity. While spectral indexes, notably the Normalized Difference Vegetation Index (NDVI), serve as reliable indicators of vegetation growth and productivity, the augmentation of learning machine models with additional spectral indexes presents an opportunity for a more holistic comprehension of grassland ecosystems. For instance, the incorporation of the Normalized Difference Water Index (NDWI) could elucidate soil moisture content dynamics, whereas the inclusion of the Soil Adjusted Vegetation Index (SAVI) could mitigate soil background effects [59,60,61]. By incorporating these additional indexes, we can cultivate more realistic models that encompass a broader spectrum of environmental variables. This, in turn, could lead to more accurate predictions of grassland growth and productivity across diverse conditions, such as different temperature scenarios or grazing intensities. Furthermore, the integration of soil properties, climate data, and other environmental factors into these models unveils the potential to reveal previously unrecognized patterns and relationships. For example, factors such as soil nutrients, pH levels, or the presence of specific minerals may exert a substantial influence on grassland growth dynamics. By including these factors in the models, we can attain a deeper understanding of their impacts on vegetation dynamics [5,34].

5. Conclusions

To ensure the resilient growth of grasslands in Asian drylands, understanding the impact of time-lag influences on the grassland NDVI is crucial. Employing a random forest machine learning approach and incorporating seven meteorological elements with MODIS NDVI observations, we predicted the grassland NDVI in Asian drylands, considering or not considering time-lag influences. The grassland NDVI model considering time-lag influences demonstrated relatively higher accuracy, as indicated by R2, RMSE, and MAE compared with the model without time-lag influences. The annual mean NDVI predicted by the model considering time-lag influences closely aligned with the MODIS NDVI. The annual mean NDVI in Asian drylands demonstrated a weak decreasing trend from 2001 to 2020. In terms of spatial variations, the grassland NDVI remained stable in the majority of areas, significantly decreasing in northern Kazakhstan and significantly increasing in northeastern Republic of Mongolia, Inner Mongolia, and Qinghai. Notably, more areas showed a decrease in the grassland NDVI than those exhibiting an increase. The main factors affecting the grassland NDVI were NDVI in the previous month, the current month’s total precipitation, and the previous month’s soil moisture. The precise prediction of the grassland NDVI serves as a valuable scientific reference for both grass growth and livestock development in Asian drylands.

Author Contributions

L.M. and Q.L. designed the research; Y.Z. performed the research; L.M., G.B., E.A., Y.Z. and Z.Z. wrote the initial draft, and all authors contributed to the final manuscript. All authors have read and agreed to the published version of the manuscript.

Funding

The research received support from the National Natural Science Foundation of China (42101295), the Natural Science Foundation of Jiangsu Province (BK20210657). Qiang Liu acknowledges additional support from the Jiangsu Distinguished Professor Program of the People’s Government of Jiangsu Province, China.

Data Availability Statement

The data that support the findings of this study are available within the manuscript.

Conflicts of Interest

All the authors have no competing interests to declare.

References

  1. Chen, C.; Li, G.; Peng, J. Spatio-temporal characteristics of Xinjiang grassland NDVI and its response to climate change from 1981 to 2018. Acta Ecol. Sin. 2023, 43, 1537–1552. [Google Scholar]
  2. Afuye, G.A.; Kalumba, A.M.; Busayo, E.T.; Orimoloye, I.R. A bibliometric review of vegetation response to climate change. Environ. Sci. Pollut. Res. 2021, 1–13. [Google Scholar] [CrossRef] [PubMed]
  3. Bonan, G. Climate Change and Terrestrial Ecosystem Modeling; Cambridge University Press: Cambridge, UK, 2019. [Google Scholar]
  4. Zhang, Q.; Yuan, X.; Chen, X.; LUO, G.; Li, L. Vegetation change and its response to climate change in Central Asia from 1982 to 2012. Chin. J. Plant Ecol. 2016, 40, 13–23. [Google Scholar] [CrossRef]
  5. Miao, L.; Sun, Z.; Ren, Y.; Schierhorn, F.; Müller, D. Grassland greening on the Mongolian Plateau despite higher grazing intensity. Land Degrad. Dev. 2021, 32, 792–802. [Google Scholar] [CrossRef]
  6. Geng, Q.; Chen, X.; He, X.; Tian, Z. Vegetation dynamics and its response to climate change and human activities based on different vegetation types in China. Acta Ecol. Sin. 2022, 42, 3557–3568. [Google Scholar]
  7. Schimel, D.S.; House, J.I.; Hibbard, K.A.; Bousquet, P.; Ciais, P.; Peylin, P.; Braswell, B.H.; Apps, M.J.; Baker, D.; Bondeau, A. Recent patterns and mechanisms of carbon exchange by terrestrial ecosystems. Nature 2001, 414, 169–172. [Google Scholar] [CrossRef]
  8. Zhang, J.; Yuan, M.; Zhang, J.; HW, L.; Wang, J.; Zhang, X.; Ju, P.; Jiang, H.; Chen, H.; Zhu, Q. Responses of the NDVI of alpine grasslands on the Qinghai-Tibetan Plateau to climate change and human activities over the last 30 years. Acta Ecol. Sin. 2020, 40, 6269–6281. [Google Scholar]
  9. Liu, Y.Y.; Van Dijk, A.I.; De Jeu, R.A.; Canadell, J.G.; McCabe, M.F.; Evans, J.P.; Wang, G. Recent reversal in loss of global terrestrial biomass. Nat. Clim. Chang. 2015, 5, 470–474. [Google Scholar] [CrossRef]
  10. Ray, D.; Ramankutty, N.; Mueller, N.; West, P.; Foley, J. Recent patterns of crop yield growth and stagnation. Nat. Commun. 2012, 3, 1293. [Google Scholar] [CrossRef] [PubMed]
  11. Li, X.; Yuan, W.; Dong, W. A machine learning method for predicting vegetation indices in China. Remote Sens. 2021, 13, 1147. [Google Scholar] [CrossRef]
  12. Yuan, W.; Zheng, Y.; Piao, S.; Ciais, P.; Lombardozzi, D.; Wang, Y.; Ryu, Y.; Chen, G.; Dong, W.; Hu, Z. Increased atmospheric vapor pressure deficit reduces global vegetation growth. Sci. Adv. 2019, 5, eaax1396. [Google Scholar] [CrossRef]
  13. Becker-Reshef, I.; Vermote, E.; Lindeman, M.; Justice, C. A generalized regression-based model for forecasting winter wheat yields in Kansas and Ukraine using MODIS data. Remote Sens. Environ. 2010, 114, 1312–1323. [Google Scholar] [CrossRef]
  14. Friedlingstein, P.; Jones, M.W.; O’sullivan, M.; Andrew, R.M.; Bakker, D.C.; Hauck, J.; Le Quéré, C.; Peters, G.P.; Peters, W.; Pongratz, J. Global carbon budget 2021. Earth Syst. Sci. Data 2022, 14, 1917–2005. [Google Scholar] [CrossRef]
  15. Li, S.; Yuan, W.; Ciais, P.; Viovy, N.; Ito, A.; Jia, B.; Zhu, D. Benchmark estimates for aboveground litterfall data derived from ecosystem models. Environ. Res. Lett. 2019, 14, 084020. [Google Scholar] [CrossRef]
  16. Xia, J.; Yuan, W.; Lienert, S.; Joos, F.; Ciais, P.; Viovy, N.; Wang, Y.p.; Wang, X.; Zhang, H.; Chen, Y. Global patterns in net primary production allocation regulated by environmental conditions and forest stand age: A model-data comparison. J. Geophys. Res. Biogeosci. 2019, 124, 2039–2059. [Google Scholar] [CrossRef]
  17. Jung, N.-C.; Popescu, I.; Kelderman, P.; Solomatine, D.P.; Price, R.K. Application of model trees and other machine learning techniques for algal growth prediction in Yongdam reservoir, Republic of Korea. J. Hydroinform. 2010, 12, 262–274. [Google Scholar] [CrossRef]
  18. Xia, J.; Ma, M.; Liang, T.; Wu, C.; Yang, Y.; Zhang, L.; Zhang, Y.; Yuan, W. Estimates of grassland biomass and turnover time on the Tibetan Plateau. Environ. Res. Lett. 2018, 13, 014020. [Google Scholar] [CrossRef]
  19. Peng, Q.; Li, X.; Shen, R.; He, B.; Chen, X.; Peng, Y.; Yuan, W. How well can we predict vegetation growth through the coming growing season? Sci. Remote Sens. 2022, 5, 100043. [Google Scholar] [CrossRef]
  20. LI, X.; Chen, Y.; Zhang, Y.; Fan, Y.; Zhou, T.; Xie, F. Impact of climate change on desert steppe in northern China. Adv. Earth Sci. 2002, 17, 254. [Google Scholar]
  21. Yang, S.; Liu, J.; Wang, C.; Zhang, T.; Dong, X.; Liu, Y. Vegetation dynamics influenced by climate change and human activities in the Hanjiang River Basin, central China. Ecol. Indic. 2022, 145, 109586. [Google Scholar] [CrossRef]
  22. Sneath, D.J.S. State policy and pasture degradation in Inner Asia. Science 1998, 281, 1147–1148. [Google Scholar] [CrossRef]
  23. Braswell, B.; Schimel, D.S.; Linder, E.; Moore Iii, B. The response of global terrestrial ecosystems to interannual temperature variability. Science 1997, 278, 870–873. [Google Scholar] [CrossRef]
  24. Wu, D.; Zhao, X.; Liang, S.; Zhou, T.; Huang, K.; Tang, B.; Zhao, W. Time-lag effects of global vegetation responses to climate change. Glob. Chang. Biol. 2015, 21, 3520–3531. [Google Scholar] [CrossRef]
  25. Miao, L.; Zhang, Y.; Chuai, X.; Bao, G.; He, Y.; Zhu, J. Effects of climatic factors and their time-lag on grassland NDVI in Asian drylands. Chinese Journal of Plant Ecology. Chin. J. Plant Ecol. 2022, 47, 1375. [Google Scholar] [CrossRef]
  26. Liu, H.; Zhang, A.; Liu, C.; Zhao, Y.; Zhao, A.; Wang, D. Analysis of the time-lag effects of climate factors on grassland productivity in Inner Mongolia. Glob. Ecol. Conserv. 2021, 30, e01751. [Google Scholar] [CrossRef]
  27. Jin, K.; Wang, F.; Han, J.; Shi, S.; Ding, W. Contribution of climatic change and human activities to vegetation NDVI change over China during 1982–2015. Acta Geogr. Sin. 2020, 75, 961–974. [Google Scholar]
  28. Hu, R.; Jiang, F.; Wang, Y.; Li, J.; Li, Y.; Abdimijit, A.; Luo, G.; Zhang, J. Arid ecological and geographical conditions in five countries of central Asia. Arid. Zone Res. 2014, 31, 1–12. [Google Scholar]
  29. Chen, S.; Guo, J.; Guo, Z.; Gao, R.; Shi, Y. Discipline of temporal and spatial variation of annual mean air temperature in arid and semiarid region in northwest China in the recent 46 years. Arid. Land Geogr. 2009, 32, 364–372. [Google Scholar]
  30. Huang, R.; Xu, L.; Liu, J. Research on spatio-temporal change of temperature in the Northwest Arid Area. Acta Ecol. Sin. 2013, 33, 4078–4089. [Google Scholar] [CrossRef]
  31. Miao, L.; Jiang, C.; He, B.; Liu, Q.; Zhu, F.; Cui, X. Response of vegetation coverage to climate change in Mongolian Plateau during recent 10 years. Acta Ecol. Sin. 2014, 34, 1295–1301. [Google Scholar]
  32. Yin, G.; Meng, X.; Wang, H.; Hu, Z.; Sun, Z. Spatial-temporal variation of vegetation and its correlation with climate change in Central Asia during the period of 1982–2012. Acta Ecol. Sin. 2017, 37, 3149–3163. [Google Scholar]
  33. Pedelty, J.; Devadiga, S.; Masuoka, E.; Brown, M.; Pinzon, J.; Tucker, C.; Vermote, E.; Prince, S.; Nagol, J.; Justice, C. Generating a long-term land data record from the AVHRR and MODIS instruments. In Proceedings of the 2007 IEEE international Geoscience and remote sensing Symposium, Barcelona, Spain, 23–28 July 2007; pp. 1021–1025. [Google Scholar] [CrossRef]
  34. Tian, S.; Van Dijk, A.; Tregoning, P.; Renzullo, L.J. Forecasting dryland vegetation condition months in advance through satellite data assimilation. Nat. Commun. 2019, 10, 469. [Google Scholar] [CrossRef]
  35. Zhang, H.; Zhang, X.; Shang, Y.; Kattel, G.; Miao, L. Continuously Vegetation Greening over Inner Mongolia for the Past Three Decades. Remote Sens. 2021, 13, 2446. [Google Scholar] [CrossRef]
  36. Harris, I.; Jones, P.; Osborn, T. CRU TS4.05: Climatic Research Unit (CRU) Time-Series (TS) Version 4.05 of High-Resolution Gridded Data of Month-by-Month Variation in Climate (Jan. 1901–Dec. 2020); NERC EDS Centre for Environmental Data Analysis, University of East Anglia Climatic Research Unit: Norwich, UK, 2021. [Google Scholar]
  37. Bartalis, Z.; Wagner, W.; Naeimi, V.; Hasenauer, S.; Scipal, K.; Bonekamp, H.; Figa, J.; Anderson, C. Initial soil moisture retrievals from the METOP-A Advanced Scatterometer (ASCAT). Geophys. Res. Lett. 2007, 34. [Google Scholar] [CrossRef]
  38. Wagner, W.; Lemoine, G.; Rott, H. A method for estimating soil moisture from ERS scatterometer and soil data. Remote Sens. Environ. 1999, 70, 191–207. [Google Scholar] [CrossRef]
  39. De Jeu, R.A.; Wagner, W.; Holmes, T.; Dolman, A.; Van De Giesen, N.; Friesen, J. Global soil moisture patterns observed by space borne microwave radiometers and scatterometers. Surv. Geophys. 2008, 29, 399–420. [Google Scholar] [CrossRef]
  40. Owe, M.; de Jeu, R.; Holmes, T. Multisensor historical climatology of satellite-derived global land surface moisture. J. Geophys. Res. Earth Surf. 2008, 113. [Google Scholar] [CrossRef]
  41. Yin, L.; Feng, X.; Fu, B.; Chen, Y.; Wang, X.; Tao, F. Irrigation water consumption of irrigated cropland and its dominant factor in China from 1982 to 2015. Adv. Water Resour. 2020, 143, 103661. [Google Scholar] [CrossRef]
  42. Leo, B. Random Forests. Mach. Learn. 2001, 45, 5–32. [Google Scholar]
  43. Amit, Y.; Geman, D. Shape quantization and recognition with randomized trees. Neural Comput. 1997, 9, 1545–1588. [Google Scholar] [CrossRef]
  44. Breiman, L. Randomizing outputs to increase prediction accuracy. Mach. Learn. 2000, 40, 229–242. [Google Scholar] [CrossRef]
  45. Dong, J.; Lu, H.; Wang, Y.; Ye, T.; Yuan, W. Estimating winter wheat yield based on a light use efficiency model and wheat variety data. ISPRS J. Photogramm. Remote Sens. 2020, 160, 18–32. [Google Scholar] [CrossRef]
  46. Johnson, M.D.; Hsieh, W.W.; Cannon, A.J.; Davidson, A.; Bédard, F. Crop yield forecasting on the Canadian Prairies by remotely sensed vegetation indices and machine learning methods. Agric. For. Meteorol. 2016, 218, 74–84. [Google Scholar] [CrossRef]
  47. Chen, T.; de Jeu, R.; Liu, Y.; van der Werf, G.; Dolman, A. Using satellite based soil moisture to quantify the water driven variability in NDVI: A case study over mainland Australia. Remote Sens. Environ. 2014, 140, 330–338. [Google Scholar] [CrossRef]
  48. Cheng, X.; Zhou, Z.; Li, W.; Shangguan, D.; Wang, X.; Zhang, X.; Hao, J.; Lin, Q. Monitoring drought situation and analyzing influencing factors in Central Asia using MODIS data. Trans. Chin. Soc. Agric. Eng. 2022, 38, 128–137. [Google Scholar]
  49. Zou, X.; Song, D.; Chen, S. Ecological carrying capacity of grasslands and animal husbandry sustainability in Central Asia. J. Resour. Ecol. 2019, 10, 598–604. [Google Scholar]
  50. Du, J.; Bao, G.; Tong, S.; Huang, X.; Wendurina; Meili; Bao, Y. Variations in vegetation cover and its relationship with climate change and human activities in Mongolia during the period 1982–2015. Acta Pratacult. Sin. 2021, 30, 1–13. [Google Scholar]
  51. Luo, S.; Liu, H.; Gong, H. Nonlinear trends and spatial pattern analysis of vegetation cover change in China from 1982 to 2018. Acta Ecol. Sin. 2022, 42, 8331–8342. [Google Scholar]
  52. Dong, Y.; Yan, H.; Du, W.; Hu, Y. Spatio-temporal analysis of grassland carrying capacity in Mongolian Plateau based on supply-consumption relationship. J. Nat. Resour. 2019, 34, 1093–1107. [Google Scholar] [CrossRef]
  53. Pearson, R.G.; Phillips, S.J.; Loranty, M.M.; Beck, P.S.; Damoulas, T.; Knight, S.J.; Goetz, S.J. Shifts in Arctic vegetation and associated feedbacks under climate change. Nat. Clim. Chang. 2013, 3, 673–677. [Google Scholar] [CrossRef]
  54. Wang, M.; An, Z.; Wang, S. The Time Lag Effect Improves Prediction of the Effects of Climate Change on Vegetation Growth in Southwest China. Remote Sens. 2022, 14, 5580. [Google Scholar] [CrossRef]
  55. Wang, T.; Wedin, D.A.; Franz, T.E.; Hiller, J. Effect of vegetation on the temporal stability of soil moisture in grass-stabilized semi-arid sand dunes. J. Hydrol. 2015, 521, 447–459. [Google Scholar] [CrossRef]
  56. Shi, Y.; Jin, N.; Ma, X.; Wu, B.; He, Q.; Yue, C.; Yu, Q. Attribution of climate and human activities to vegetation change in China using machine learning techniques. Agric. For. Meteorol. 2020, 294, 108246. [Google Scholar] [CrossRef]
  57. Zhang, R.; Zhao, X.; Zuo, X.; Qu, H.; Degen, A.A.; Luo, Y.; Ma, X.; Chen, M.; Liu, L.; Chen, J. Impacts of Precipitation on Ecosystem Carbon Fluxes in Desert-Grasslands in Inner Mongolia, China. J. Geophys. Res. Atmos. 2019, 124, 1266–1276. [Google Scholar] [CrossRef]
  58. Zou, H.; Gao, G.; FU, B. The relationship between grassland ecosystem and soil water in arid and semi-arid areas: A review. Acta Ecol. Sin. 2016, 36, 3127–3136. [Google Scholar]
  59. Zhao, S.; Zhao, X.; Li, Y.; Mao, W.; Wang, N.; Chen, Y.; Lu, J.; Chen, X.; Wang, R.; Yang, X. A review on the driving effect of groundwater depth on the evolution of sandy plant soil systems in arid and semi-arid region. Acta Ecol. Sin. 2022, 42, 9898–9908. [Google Scholar]
  60. Liu, J.; Gao, Q.; Zhu, Y.; Wang, K. Hydraulic Redistribution: Newly Recognized Small Cycle Within the Soil-Plant-Atmosphere Continuum. Chin. J. Plant Ecol. 2007, 31, 794–803. [Google Scholar]
  61. Li, X.; Piao, S.; Huntingford, C.; Peñuelas, J.; Yang, H.; Xu, H.; Chen, A.; Friedlingstein, P.; Keenan, T.F.; Sitch, S. Global variations in critical drought thresholds that impact vegetation. Natl. Sci. Rev. 2023, 10, nwad049. [Google Scholar] [CrossRef]
  62. Sun, M.; Li, X.; Xu, H.; Wang, K.; Anniwaer, N.; Hong, S. Drought thresholds that impact vegetation reveal the divergent responses of vegetation growth to drought across China. Glob. Chang. Biol. 2024, 30, e16998. [Google Scholar] [CrossRef]
Figure 1. The geographical location of Asian drylands. The land cover information was adapted from MODIS land cover product (i.e., MCD12C1, accessible at https://lpdaac.usgs.gov/pro-ucts/mcd12c1v006/) (accessed on 18 May 2018).
Remotesensing 16 01838 g001
Figure 4. The interannual variability of predicted annual NDVI (with and without lagging effect) compared with MODIS NDVI in Asian grasslands from 2001 to 2020. The left y-axis corresponds to the bar graph, while the right y-axis pertains to the line graph. The pink buffers represent 95% confidence intervals surrounding the annual average NDVI.
Remotesensing 16 01838 g004
Figure 5. Spatial distributions of the average MODIS NDVI (a) and predicted NDVI with (b) and without (c) time-lag influences.
Remotesensing 16 01838 g005
Figure 6. Spatial trends of grassland NDVI in Asian drylands. Notes: (a) MODIS NDVI; (b) predicted NDVI with time-lag influence; (c) predicted NDVI without time-lag influence.
Remotesensing 16 01838 g006
Figure 7. Relative importance of the selected explanatory variables for the predicted grassland NDVI in Asian drylands. Notes: NDVI_1 represents NDVI in the previous month; pre_0 represents precipitation in the current month; sm_0 represents soil moisture in the current month; sm_1 represents soil moisture in the previous month; rad_0 represents solar radiation in the current month; vpd_0 represents vapor pressure deficit in the current month.
Remotesensing 16 01838 g007
Table 1. Model details: independent variable, dependent variable, and random forest parameter.
Independent VariableDependent VariableTemporal ResolutionSpatial ResolutionTime SpanModel Parameter
with time-lagtmp_0, pre_0, rad_1, sm_1
tmx_0, tmn_0, vpd_0, NDVI_1
NDVIOne month0.25°January 2001–December 202070% training set,
30% validation set
without time-lagtmp_0, pre_0, rad_0, sm_0
tmx_0, tmn_0, vpd_0, NDVI_1
NDVIOne month0.25°January 2001–December 202070% training set,
30% validation set
Notes: NDVI_1 represents NDVI in the previous month; tmp_0 represents temperature in the current month; pre_0 represents precipitation in the current month; sm_0 represents soil moisture in the current month; sm_1 represents soil moisture in the previous month; rad_0 represents solar radiation in the current month; rad_1 represents solar radiation in the previous month; vpd_0 represents vapor pressure deficit in the current month; tmn_0 represents minimum temperature in the current month; tmx_0 represents maximum temperature in the current month.
Disclaimer/Publisher’s Note: The statements, opinions and data contained in all publications are solely those of the individual author(s) and contributor(s) and not of MDPI and/or the editor(s). MDPI and/or the editor(s) disclaim responsibility for any injury to people or property resulting from any ideas, methods, instructions or products referred to in the content.

