Abstract
Evapotranspiration is a key driver of water and energy exchanges between terrestrial surfaces and the atmosphere, significantly influencing ecosystem balances. This study focuses on the Yellow River Basin (YRB), where evapotranspiration impacts both ecological dynamics and human activities. By analyzing actual evapotranspiration data from 1982 to 2017, this research provides insights into its spatial and temporal patterns within the YRB. Furthermore, a comprehensive assessment and comparative analysis were performed on four distinct evapotranspiration product datasets: GLDAS-Noah, ERA5-Land, GLEAM v3.8a, and MOD16A2. Employing the Geodetector model, the research identified seven key influencing factors—the digital elevation model (DEM), slope, aspect, precipitation, temperature, soil moisture, and normalized difference vegetation index (NDVI)—and analyzed their impact on evapotranspiration variations, yielding the following insights: (1) Based on the monthly-scale actual evapotranspiration dataset from 1982 to 2017, the annual average evapotranspiration in the YRB fluctuated between 375 and 473 mm, with an average value of 425 mm. A declining trend in the region’s overall evapotranspiration was discerned using the Theil–Sen median slope estimator and Mann–Kendall trend test. (2) The datasets from GLDAS-Noah, ERA5-Land, and GLEAM exhibited the highest correlation with the observed datasets, all exceeding a correlation coefficient of 0.96. In contrast, the MOD16A2 dataset showed the least favorable performance. The ERA5-Land dataset was particularly noteworthy for its close alignment with observational benchmarks, as evidenced by the lowest recorded root mean square error (RMSE) of 5.09 mm, indicative of its outstanding precision. (3) Employing the Geodetector model, a thorough analysis was conducted of the interactions between evapotranspiration and seven critical determinants. The findings revealed that precipitation and the NDVI were the most significant factors influencing evapotranspiration, with q-values of 0.59 and 0.42 in 2010, and 0.71 and 0.59 in 2015, respectively. These results underscore their pivotal role as the main drivers of evapotranspiration variability within the YRB. Conversely, the q-values for slope in 2010 and 2015 were only 0.01 and nearly zero, respectively, indicating their minimal impact on the dynamics of evapotranspiration in the YRB.
1. Introduction
Evapotranspiration from land surfaces constitutes a crucial element in both the terrestrial energy balance and the hydrological cycle [1,2,3]. This process, characterized by the phase transition of water, plays a pivotal role in energy absorption, exerting a substantial influence on ambient atmospheric conditions. Concurrently, it facilitates the recirculation of atmospheric precipitation back into the atmosphere, thereby critically modulating the atmospheric moisture equilibrium [4,5]. Given these dynamics, evapotranspiration emerges as a key driver with profound implications for climate patterns at both regional and global scales. Furthermore, the dynamics of evapotranspiration are intimately interconnected with the process of photosynthesis in vegetation, exerting a direct influence on plant growth and development. This interaction holds substantial significance for various applications, including agricultural production, precise drought monitoring, and strategic crop planning [6,7]. Consequently, the accurate quantification of actual evapotranspiration at the basin level becomes imperative for the efficient management, utilization, and strategic distribution of water resources within the watershed [8,9].
In the current stage, the direct observation of actual evapotranspiration remains elusive in many global regions. To address this, a variety of methodologies are employed for its estimation, with prevalent traditional approaches including the water balance method, the surface energy balance method, and the complementary correlation theory [10,11,12]. The swift advancements in remote sensing technology have given rise to an abundance of remote-sensing-derived evapotranspiration products. A breadth of international research underscores the efficacy of these remote-sensing-based evapotranspiration estimations, particularly at extensive basin scales. However, given the diversity in estimation models across different products, a thorough evaluation of these products is imperative in varied climatic zones before application. Adjustments or integrative modifications might be necessary to bolster the applicability and precision of these datasets within specific research contexts.
In the preceding decades, the field has witnessed the development of global evapotranspiration datasets characterized by diverse spatial and temporal resolutions. This advancement has been facilitated through the integration of methodologies such as remote sensing, reanalysis data, advanced land surface modeling, and sophisticated data assimilation techniques. Notable examples of these datasets include MOD16A2 [13,14,15,16], GLDAS [17,18,19,20,21,22,23], GLEAM [24,25,26,27,28], and ERA5_Land [29,30,31,32], which have found extensive application across various research domains. While these datasets offer invaluable insights for long-term and large-scale regional studies, the rigorous validation and comprehensive evaluation of these products remain imperative before their deployment in research or practical applications.
The Yellow River region, predominantly comprising arid and semi-arid zones, is characterized by its fragile ecological system and heightened sensitivity to climatic alterations, positioning it as a focal area for studies on land–atmosphere interactions. In the context of ongoing climate change, the Yellow River basin (YRB) is experiencing substantial shifts in temperature and precipitation patterns, which are expected to consequentially alter evapotranspiration dynamics. Thus, in an era marked by significant global climatic transformations and intensified human activities, gaining a deeper understanding of evapotranspiration responses under these influences is of paramount importance. Such insights are not only critical for ecological research but also vital for informing water resource management and optimizing agricultural irrigation strategies within the YRB. The objectives of this research are threefold: (1) to delineate the spatiotemporal characteristics of evapotranspiration within the YRB; (2) to undertake an exhaustive performance evaluation and comparative analysis of four distinct evapotranspiration products specific to the YRB; and (3) to employ the Geodetector method in analyzing the spatiotemporal dynamics of evapotranspiration across the basin, with an emphasis on pinpointing critical influencing factors.
2. Data and Methods
2.1. Study Area
The YRB, extending from 95°E to 120°E and from 32°N to 42°N, spans an impressive length of approximately 1900 km east to west and a breadth of about 1100 km north to south, encompassing a vast area of 795,000 square km [33]. This extensive basin is characterized by its broad expanse and a multitude of mountain ranges, manifesting a pronounced topographical gradient from the eastern to the western extents. Additionally, the basin exhibits significant geomorphological diversity across its various subregions. Moreover, the YRB exhibits marked climatic diversity across its various regions. This diversity is characterized by significant annual and seasonal variations in climatic parameters. Predominantly, the basin experiences annual precipitation levels that range from 200 to 650 mm. Notably, regions encompassing the southern portions of the middle and upper reaches, as well as the lower reaches of the basin, frequently surpass this range, receiving more than 650 mm of rainfall annually. Figure 1 presents a detailed representation of the YRB’s geographical location, coupled with an analysis of its long-term mean evapotranspiration. The data clearly indicate that these instances of evapotranspiration span a range from 134 to 641 mm, highlighting the climatic variability within the basin.
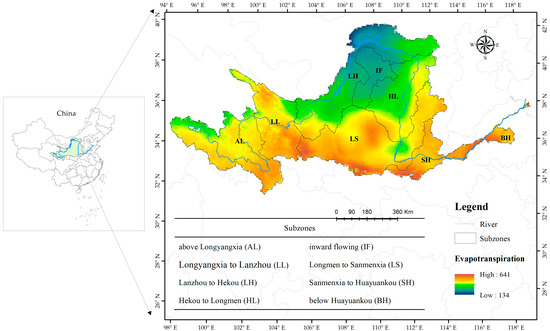
Figure 1.
Geographical location and long-term average evapotranspiration of the study area.
2.2. Data
In this study, we have utilized four widely recognized remote-sensing datasets for actual evapotranspiration, which include GLDAS-Noah, ERA5-Land, GLEAM v3.8a, and MOD16A2. The detailed temporal sequences, spatial resolutions, and origins of these datasets are systematically outlined in Table 1. To assess the effectiveness of the four evapotranspiration products within the YRB, we employed the actual terrestrial evapotranspiration dataset (1982–2017) provided by the National Tibetan Plateau Data Center, China (http://data.tpdc.ac.cn (accessed on 20 June 2023)) [34,35]. This version 1.5 dataset, developed through the complementary evapotranspiration method, is integral to research on long-term hydrological cycles and climate change. The terrestrial actual evapotranspiration is measured in millimeters per month, featuring a monthly temporal resolution and a spatial resolution of 0.1°. Furthermore, to facilitate a detailed analysis of factors influencing evapotranspiration within the YRB, this study incorporated seven key variables: the digital elevation model (DEM), slope, aspect, precipitation, temperature, soil moisture, and normalized difference vegetation index (NDVI), concentrating on the years 2010 and 2015 [36,37,38,39,40]. The data preprocessing entailed a series of steps, including image resampling and categorization of impacts. The DEM data were sourced from the Geospatial Data Cloud (http://www.gscloud.cn (accessed on 20 June 2023)), with slope and aspect aspects being derived from the DEM. Additional variables such as precipitation, temperature, and soil moisture were obtained from the National Tibetan Plateau Data Center (http://data.tpdc.ac.cn (accessed on 30 June 2023)). The precipitation data were sourced from a 1 km-resolution monthly precipitation dataset for China, temperature data were derived from a 1 km-resolution monthly average temperature dataset, and soil moisture data were extracted from a soil moisture dataset in the China dataset. The NDVI was extracted from the moderate resolution imaging spectroradiometer (MODIS) Terra Vegetation Indices product MOD13A2, a dataset produced by NASA that provides vegetation index data at a 1 km spatial resolution over 16-day intervals (https://earthdata.nasa.gov/ (accessed on 30 June 2023)). Figure 2 presents the spatial distribution of these seven pivotal influencing factors in 2010.

Table 1.
A comprehensive description of the evapotranspiration product datasets in this study.
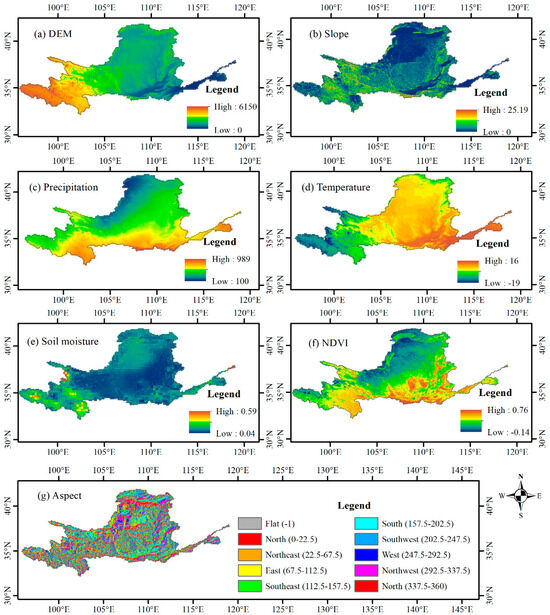
Figure 2.
Spatial characterization of influential factors on evapotranspiration across the YRB.
2.3. Methodology
In this study, we utilized the modified Mann–Kendall (MMK) trend test to conduct a comprehensive analysis of the spatiotemporal trends in evapotranspiration within the Yellow River Basin. The MMK, recognized for its robustness as a non-parametric approach, excels at detecting underlying trends within time-series data. For an in-depth understanding of the computational methodologies, readers are directed to explore the procedures elaborated in pertinent scholarly articles [35,36]. To assess the suitability of four evapotranspiration products within the YRB, this study employs the Taylor diagram methodology for an integrated evaluation of their precision metrics [41]. The Taylor diagram, proposed by Taylor in 2001 [42], is a polar plot that incorporates three critical evaluative parameters—correlation coefficient, root mean square error (RMSE), and standard deviation—comparing model data against observational data. This diagram adeptly encapsulates the congruence between simulation and observation, offering a clear visual assessment of the model’s comparative advantages and overall performance.
To dissect the determinants influencing evapotranspiration within the YRB, our study harnesses the Geodetector method, innovatively developed by Professor Wang Jinfeng and his team [43]. This methodology is adept at exploring spatial heterogeneity and the impact factors of geographic spatial elements [44,45]. The Geodetector encompasses four distinct modules: the factor detector, interaction detector, risk area detector, and ecological detector. In our research, we primarily focus on factor and interaction detectors. The factor detector within the Geodetector framework is designed to identify and quantify the impact of individual influencing factors, while the interaction detector is employed to elucidate the synergistic effects of multiple factors on the dependent variable, proving invaluable in the investigation of complex geographic feature-driven mechanisms [46,47,48]. In this study, we have identified seven key factors, as depicted in Figure 2, namely, the DEM, slope, aspect, precipitation, temperature, soil moisture, and NDVI. These factors were systematically analyzed using the Geodetector method to unravel the underlying driving mechanisms influencing evapotranspiration.
3. Results
3.1. Spatio-Temporal Dynamics of Evapotranspiration across the YRB
Based on the monthly scale actual evapotranspiration dataset in the YRB from 1982 to 2017, this study accurately calculated the annual evapotranspiration values for each year within this period. Figure 3 meticulously illustrates the temporal variations in evapotranspiration over these years. A detailed analysis of the figure reveals that the annual mean evapotranspiration in the YRB exhibits fluctuations within a range of 375–473 mm, with an overall multi-year mean of 425 mm. Notably, the data indicate a discernible declining trend in the annual average evapotranspiration, which is a critical observation for understanding the hydrological and climatic changes in the region. Figure 4 illustrates the spatial distribution of actual annual and seasonal average evapotranspiration within the YRB over the period of 1982 to 2017. On a broader scale, a noticeable gradient in evapotranspiration is observed, with values progressively increasing from the northwest towards the southeast regions of the basin. The basin-wide mean annual evapotranspiration is quantified at 422 mm. A detailed regional analysis reveals the following hierarchy in annual average evapotranspiration—BH (537 mm), SH (521 mm), LS (490 mm), LL (478 mm), AL (459 mm), HL (385 mm), LH (311 mm), and IF (265 mm)—delineating a clear spatial variability across different sub-regions.
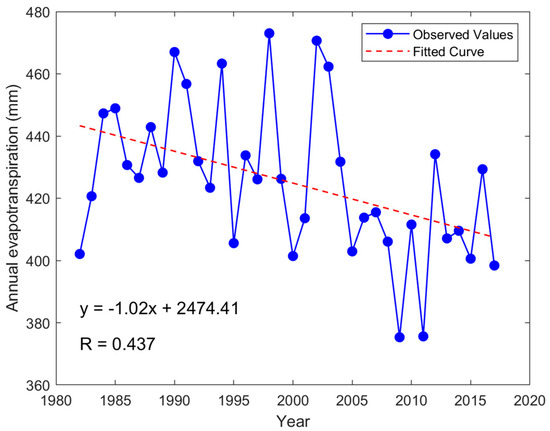
Figure 3.
Annual variability of evapotranspiration across the YRB: a temporal analysis.
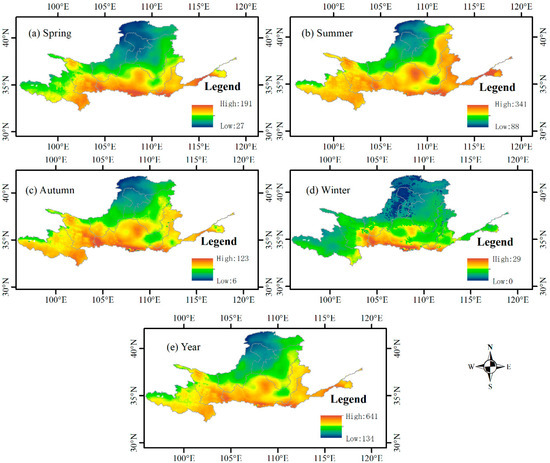
Figure 4.
Spatial distribution of actual annual and seasonal average evapotranspiration in the YRB from 1982 to 2017 (unit: mm).
In an endeavor to meticulously examine the trend variations of actual evapotranspiration within the YRB, this study incorporated the Theil–Sen median slope estimator coupled with the Mann–Kendall trend test for a comprehensive analysis. Figure 5 delineates the evapotranspiration trend dynamics across the basin. The color coding in the figure is as follows: red denotes a trend of increase, yellow indicates stability with no significant change, and green reflects a trend of decrease. Upon aggregating and analyzing the mean values of pixel-wise trend characteristics across various sub-regions of the YRB, it was ascertained that the values for LH, HL, IF, LS, LL, BH, SH, and AL are −1.25, −1.84, 0.09, −1.85, −0.67, −2.75, −3.54, and 0.80, respectively. From an overarching perspective, the period spanning from 1982 to 2017 witnessed a general downtrend in evapotranspiration across the basin. Notably, the sub-regions IF and AL exhibited a non-significant increase trend, which stands in contrast to the predominantly declining trend observed in the remaining sub-regions.
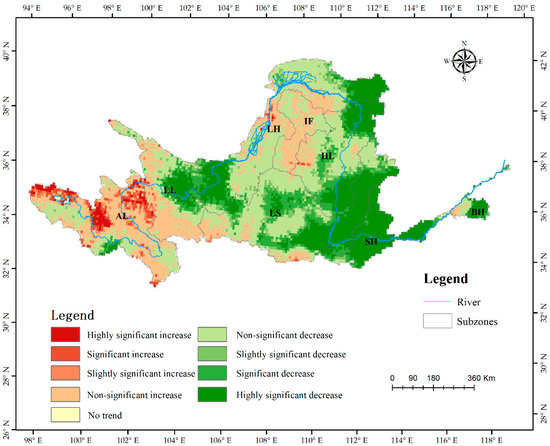
Figure 5.
Characterizing the trends of actual evapotranspiration in the YRB (1982–2017).
To delve deeper into the intra-annual fluctuation patterns of monthly evapotranspiration within the YRB, this study computed the mean monthly evapotranspiration values spanning from 1982 to 2017. Figure 6 elucidates the temporal dynamics of evapotranspiration throughout the year. The hierarchical sequence of monthly evapotranspiration volumes, arranged in descending order, is observed as follows: July, recording the peak at 85.29 mm, followed by August at 77.68 mm, June at 70.74 mm, May at 55.83 mm, September at 48.67 mm, April at 33.30 mm, October at 21.21 mm, March at 19.18 mm, February at 6.93 mm, and January at 2.07 mm, culminating with December registering the lowest at 1.11 mm. With the advent of spring, there is a notable uptick in temperatures accompanied by a gradual increase in precipitation. This climatic shift, coupled with the onset of the vegetation growth season, contributes to a marked escalation in evapotranspiration, culminating in a yearly apex during July.
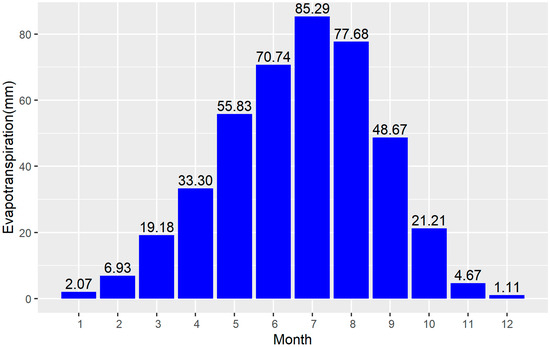
Figure 6.
Intra-annual variation of evapotranspiration in the YRB.
3.2. Accuracy Assessment of Four Evapotranspiration Products
To evaluate the suitability of four evapotranspiration products for the YRB, we conducted a comparative analysis between these products and the actual evapotranspiration dataset specific to the basin. The temporal scope of the actual dataset extends from 1982 to 2017, aligning with our selected timeframe for GLDAS-Noah, ERA5-Land, and GLEAM v3.8a. Due to the MODIS product’s initiation in 2000, the corresponding MOD16A2 data were consequently selected from 2000 to 2017. We computed the multi-annual monthly mean evapotranspiration values based on these designated periods. Figure 7 illustrates scatter plots that juxtapose the four evapotranspiration products against the actual dataset. The ERA5-Land dataset exhibits the highest correlation coefficient of 0.99, signifying an exceptional alignment with the actual data. This is closely followed by GLEAM v3.8a with a correlation of 0.98, GLDAS-Noah at 0.97, and MOD16A2 at 0.82. When considering the RMSE, the respective values for each product are ERA5-Land (8.31 mm), GLDAS-Noah (10.25 mm), GLEAM v3.8a (11.83 mm), and MOD16A2 (20.80 mm). Overall, the datasets of GLDAS-Noah, ERA5-Land, and GLEAM v3.8a demonstrate superior applicability within the YRB when compared to the MOD16A2 dataset.
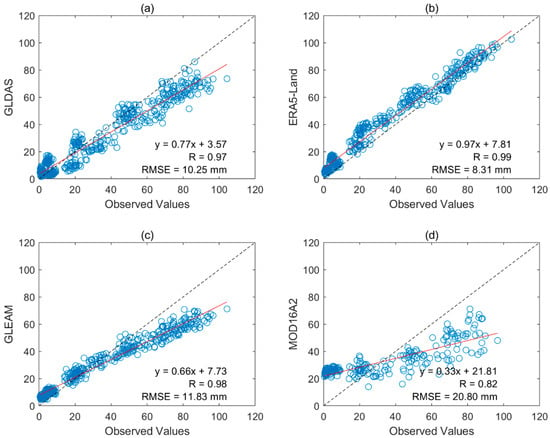
Figure 7.
Comparative analysis of four evapotranspiration products with the actual evapotranspiration dataset: (a) GLDAS-Noah, (b) ERA5-Land, (c) GLEAM v3.8a, and (d) MOD16A2.
To rigorously illustrate the efficacy of the four evapotranspiration products, we have utilized the Taylor diagram as a visual tool. The Taylor diagram serves as an integrative graphical representation that simultaneously conveys three critical statistical metrics: the standard deviation, RMSE, and correlation coefficient. This multifaceted diagram affords a more nuanced and intuitive visualization compared to conventional plots that are limited to the correlation and RMSE on the axes, thereby offering a holistic and lucid evaluation of the performance attributes of the evapotranspiration products. To mitigate the potential confounding effects associated with differing temporal scales, a uniform period from 2000 to 2017 was adopted for the analysis of the four evapotranspiration datasets. Figure 8a illustrates the temporal dynamics of the four evapotranspiration products in comparison with the actual evapotranspiration dataset, while Figure 8b furnishes a Taylor diagram delineating their comparative performance. Insights drawn from Figure 8 reveal that the GLDAS-Noah, ERA5-Land, and GLEAM datasets exhibit the closest concordance with the observed dataset, each registering a correlation coefficient surpassing the 0.96 threshold. Among these, ERA5-Land is distinguished by its proximity to the observational benchmark, with an RMSE recorded at a minimal 5.09 mm, thus reflecting its superlative overall accuracy. The Taylor diagram distinctly articulates the precision hierarchy of the evapotranspiration datasets within the YRB, ranking them as follows: ERA5-Land > GLDAS-Noah > GLEAM > MOD16A2.
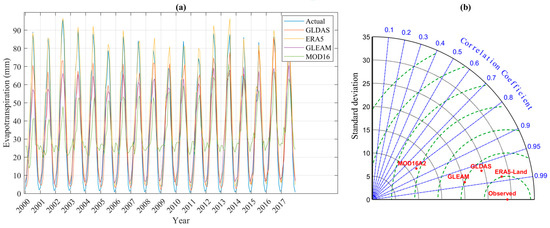
Figure 8.
(a) Temporal dynamics of evapotranspiration data products versus observed evapotranspiration measurements; and (b) Taylor diagram.
3.3. Analysis of Factors Affecting Evapotranspiration in the YRB Based on Geodetector
This study focuses on the years 2010 and 2015 as the primary periods of investigation, scrutinizing the interplay between evapotranspiration and a suite of seven determinants: the DEM, slope, aspect, precipitation, temperature, soil moisture, and NDVI. Within the ArcGIS environment, these factors underwent a comprehensive processing workflow, including rasterization, classification via the natural break method, and the exclusion of outliers. Subsequently, employing the factor detector module within the Geodetector framework, the study probed the extent and dynamics of the influence exerted by these variables on evapotranspiration across the YRB. The analytical arsenal further included both factor detection and interaction detection techniques to assess the compounded effects of inter-factor interactions on evapotranspiration within the YRB. In this context, the q-value served as an indicator of the explanatory strength, with higher values denoting an enhanced explanatory capacity, while the p-value delineated statistical significance, with lower values indicating a greater statistical robustness.
Table 2 and Table 3 present the factor detection analyses for evapotranspiration and its determinants for the years 2010 and 2015, respectively. The q-values in Table 2 categorize the impact of each factor on evapotranspiration, ranked as follows: precipitation > NDVI > slope > DEM > soil moisture > temperature > aspect. In Table 3, the order is as follows: precipitation > NDVI > soil moisture > slope > temperature > DEM > aspect. Notably, precipitation and the NDVI emerged as the dominant factors, with q-values in 2010 of 0.59 and 0.42, respectively, and, in 2015, 0.71 and 0.59, underscoring their pivotal roles as the primary drivers of evapotranspiration variability in the YRB. In contrast, the influence of the slope was minimal, with a q-value of 0.01 in 2010 and approaching zero in 2015, indicating its negligible impact on the region’s evapotranspiration dynamics. The spatial dynamics of evapotranspiration in the YRB are not solely influenced by individual factors but are significantly shaped by the interplay among various determinants characterized by spatial heterogeneity.

Table 2.
The factor detection results of evapotranspiration and various influencing factors in 2010.

Table 3.
The factor detection results of evapotranspiration and various influencing factors in 2015.
Figure 9 and Figure 10 demonstrate that the effects of individual factors on evapotranspiration are interconnected rather than isolated. The interactions between these factors result in both dual-factor enhancement and non-linear amplification. The endogenous interactions between any two factors have a more pronounced effect on evapotranspiration than the impacts of individual factors alone. Remarkably, the interaction between precipitation and elevation in both 2010 and 2015 exhibited the highest explanatory power (2010, q = 0.69; 2015, q = 0.76), highlighting their particularly strong correlation with evapotranspiration and their significant influence on its variability. Furthermore, the interactions between precipitation and other factors were also significant, with interaction q-values ranging from 0.59 to 0.69 in 2010 and from 0.71 to 0.76 in 2015, reinforcing the notion that precipitation and NDVI are the foremost drivers of evapotranspiration dynamics in the YRB.
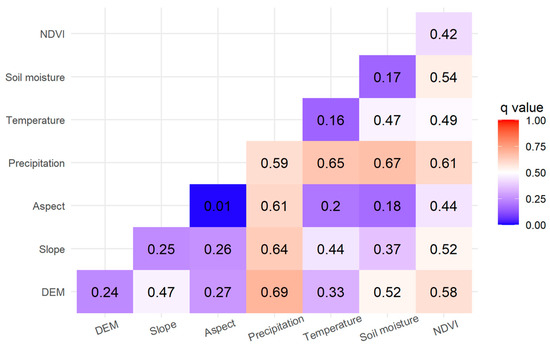
Figure 9.
Interaction detection results of various influencing factors in 2010.
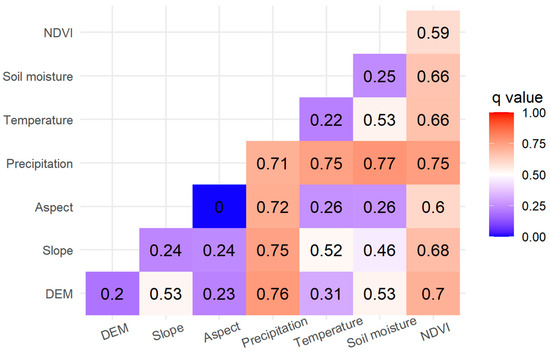
Figure 10.
Interaction detection results of various influencing factors in 2015.
4. Discussion
In the preceding section, we conducted a comprehensive adaptability evaluation of various datasets across the entire YRB. The findings indicate that ERA5-Land outperforms its counterparts, while MOD16A2 exhibits the least satisfactory results. To rigorously assess the adaptability of each dataset, we computed the mean values for four distinct evapotranspiration datasets across all subregions and conducted a comparative analysis with the observed data. Subsequently, we have illustrated these relationships using scatter plots, as presented in Figure 11. These plots are augmented with the corresponding fitted curves, correlation coefficients, and RMSE to provide a nuanced understanding of the dataset performance. Figure 12 and Figure 13 distinctly illustrate the correlation coefficients (R) and RMSE, respectively, for the four evapotranspiration product datasets relative to the observed datasets across different sub-regions. Collectively, these figures provide a comprehensive evaluation of product performance. Among them, ERA5-Land consistently outperforms, as evidenced by its correlation coefficient R ranging from 0.94 to 0.99, with an average of 0.96, and the lowest RMSE spanning 6.14 to 18.61 mm, averaging at 12.57 mm. GLDAS-Noah and GLEAM also demonstrate robust performance, both maintaining correlations above 0.9. Specifically, GLDAS-Noah’s correlation fluctuates between 0.91 and 0.95 (mean: 0.93), whereas GLEAM, despite an average correlation equivalent to ERA5-Land (0.96), extends slightly above 0.95, marginally surpassing ERA5-Land. However, GLEAM’s RMSE does not match ERA5-Land’s efficacy.
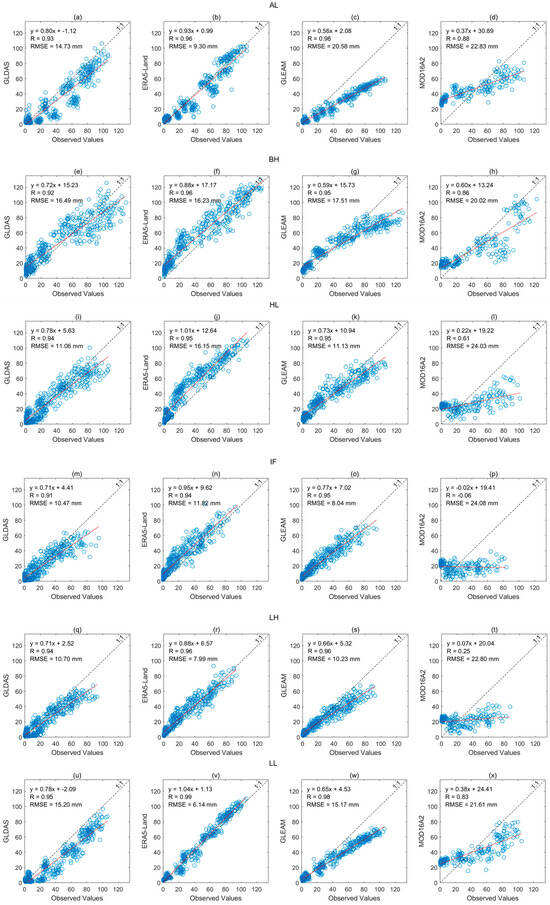
Figure 11.
Scatter plot analysis of four distinct evapotranspiration datasets in comparison with observed data across diverse sub-regions of the YRB: (a–d) for the AL subregion, (e–h) for the BH subregion, (i–l) for the HL subregion, (m–p) for the IF subregion, (q–t) for the LH subregion, and (u–x) for the LL subregion.
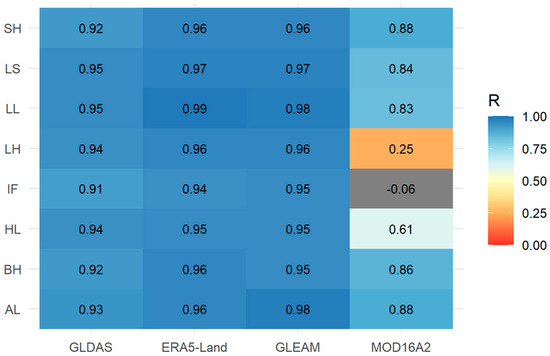
Figure 12.
Correlation coefficients of four evapotranspiration datasets compared with observed data in various sub-regions of the YRB.
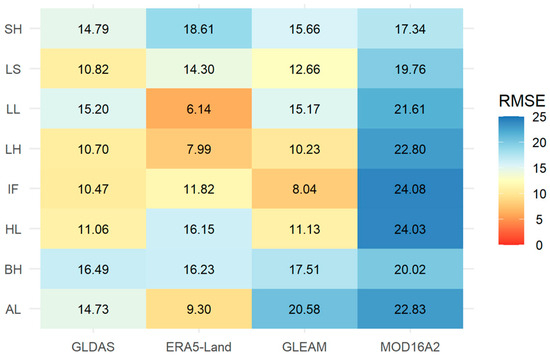
Figure 13.
Comparative assessment of RMSE in four evapotranspiration datasets relative to observed data across sub-regions of the YRB.
Conversely, MOD16A2 exhibits the weakest performance, with two instances of correlation dropping below 0.3. This underperformance is likely due to the impact of meteorological conditions such as clouds and fog, among other factors, during the MOD16A2 imaging process, resulting in significant data gaps in the IF and LH regions. This is a probable cause for the lower R values and elevated RMSE. In regions like AL, BH, HL, LL, LS, and SH, the correlation variability ranges from 0.61 to 0.88, consistently underperforming compared to the other datasets, with RMSEs ranging between 17.34 and 24.08 mm, also higher than their counterparts. Consequently, it is evident that, in the YRB, the GLDAS-Noah, ERA5-Land, and GLEAM datasets demonstrate considerable applicability, whereas MOD16A2 necessitates an enhancement in data quality through product improvement strategies.
5. Conclusions
In this study, we selected the YRB as our primary research area and conducted an in-depth analysis of the spatiotemporal characteristics and evolving trends of evapotranspiration, leveraging actual evapotranspiration datasets from the region. Additionally, this research entailed a comprehensive evaluation and comparative analysis of four distinct evapotranspiration product datasets, namely, GLDAS-Noah, ERA5-Land, GLEAM v3.8a, and MOD16A2. Employing the Geodetector model, we meticulously examined the impact of seven key factors (DEM, slope, aspect, precipitation, temperature, soil moisture, and NDVI) on the variations in evapotranspiration. The following conclusions were drawn:
(1) Drawing on the monthly-scale actual evapotranspiration dataset spanning from 1982 to 2017 for the YRB, this study observes that the annual average evapotranspiration within the basin oscillated between 375 and 473 mm, with a long-term mean standing at 425 mm. Employing the Theil–Sen median slope estimator alongside the Mann–Kendall trend test revealed a general declining trend in the basin’s evapotranspiration.
(2) The assessment of four evapotranspiration products within the YRB revealed that the GLDAS-Noah, ERA5-Land, and GLEAM datasets exhibit superior alignment with the observed data, each demonstrating correlation coefficients surpassing 0.96. Notably, the ERA5-Land dataset stands out for its remarkable closeness to the observational benchmark, as evidenced by the lowest recorded RMSE of merely 5.09 mm, indicative of its exceptional overall accuracy. The precision hierarchy of the evapotranspiration datasets in the YRB is succinctly delineated in the Taylor diagram, ranking in the order of ERA5-Land > GLDAS-Noah > GLEAM > MOD16A2.
(3) This research focused on the years 2010 and 2015, utilizing the Geodetector model to probe the interactions between evapotranspiration and its seven critical determinants: the DEM, slope, topography, precipitation, temperature, soil moisture, and NDVI. In 2010, the ranking of factors by their impact on evapotranspiration was precipitation > NDVI > slope > DEM > soil moisture > temperature > aspect, and, in 2015, precipitation > NDVI > soil moisture > slope > temperature > DEM > aspect. Precipitation and the NDVI emerged as the predominant drivers, with q-values in 2010 of 0.59 and 0.42, respectively, and, in 2015, 0.71 and 0.59, underscoring their central role in driving the variability of evapotranspiration within the YRB. Conversely, the q-values for the slope in 2010 and 2015 were 0.01 and nearly zero, respectively, illustrating their minimal influence on the region’s evapotranspiration dynamics. Therefore, examining the spatiotemporal dynamics of evapotranspiration at the basin level and identifying its driving factors are essential for a deeper understanding of the influence of climate change on the hydrological balance and cycle within the YRB.
Author Contributions
Conceptualization, L.J. and S.C.; methodology, L.J. and S.C.; software, S.C.; validation, S.C., H.Y. and C.Z.; formal analysis, L.J.; investigation, S.C.; resources, S.C.; data curation, L.J.; writing—original draft preparation, L.J.; writing—review and editing, S.C., H.Y. and C.Z.; visualization, L.J.; supervision, H.Y.; project administration, H.Y.; funding acquisition, S.C. All authors have read and agreed to the published version of the manuscript.
Funding
This research was funded by the National Key Research and Development Program of China (grant number 2021YFC3000203), the Natural Science Foundation of Henan Province (grant number 222300420317), the National Key Research and Development Program of China (No. 2021YFC3200201), and the Henan Provincial Key Research and Development Program (grant number 221111321100).
Data Availability Statement
All the data that supports the findings of this study is included in the article, and the raw data can be obtained through a public web site.
Acknowledgments
Thanks to the National Tibetan Plateau/Third Pole Environment Data Center (http://data.tpdc.ac.cn (accessed on 20 June 2023)) for offering the datasets, including the actual terrestrial evapotranspiration dataset, precipitation, temperature, and soil moisture. Sincere thanks are due to the editor and the anonymous reviewers for all the remarks and suggestions that are very helpful and constructive for improving our manuscript.
Conflicts of Interest
The authors declare no conflicts of interest.
References
- Li, S.J.; Wang, G.J.; Sun, S.L.; Chen, H.S.; Bai, P.; Zhou, S.J.; Huang, Y.; Wang, J.; Deng, P. Assessment of Multi-Source Evapotranspiration Products over China Using Eddy Covariance Observations. Remote Sens. 2018, 10, 1692. [Google Scholar] [CrossRef]
- Zhou, J.; Wang, Y.J.; Su, B.D.; Wang, A.Q.; Tao, H.; Zhai, J.Q.; Kundzewicz, Z.W.; Jiang, T. Choice of potential evapotranspiration formulas influences drought assessment: A case study in China. Atmos. Res. 2020, 242, 104979. [Google Scholar] [CrossRef]
- Seneviratne, S.I.; Corti, T.; Davin, E.L.; Hirschi, M.; Jaeger, E.B.; Lehner, I.; Orlowsky, B.; Teuling, A.J. Investigating soil moisture-climate interactions in a changing climate: A review. Earth-Sci. Rev. 2010, 99, 125–161. [Google Scholar] [CrossRef]
- Oki, T.; Kanae, S. Global hydrological cycles and world water resources. Science 2006, 313, 1068–1072. [Google Scholar] [CrossRef] [PubMed]
- Wang, S.; Yang, Y.; Luo, Y.; Rivera, A. Spatial and seasonal variations in evapotranspiration over Canada’s landmass. Hydrol. Earth Syst. Sci. 2013, 17, 3561–3575. [Google Scholar] [CrossRef]
- Fleischmann, A.S.; Laipelt, L.; Papa, F.; Paiva, R.; de Andrade, B.C.; Collischonn, W.; Biudes, M.S.; Kayser, R.; Prigent, C.; Cosio, E.; et al. Patterns and drivers of evapotranspiration in South American wetlands. Nat. Commun. 2023, 14, 6656. [Google Scholar] [CrossRef] [PubMed]
- Wang, C.X.; Graham, R.M.; Wang, K.G.; Gerland, S.; Granskog, M.A. Comparison of ERA5 and ERA-Interim near-surface air temperature, snowfall and precipitation over Arctic sea ice: Effects on sea ice thermodynamics and evolution. Cryosphere 2019, 13, 1661–1679. [Google Scholar] [CrossRef]
- Jalilvand, E.; Tajrishy, M.; Hashemi, S.; Brocca, L. Quantification of irrigation water using remote sensing of soil moisture in a semi-arid region. Remote Sens. Environ. 2019, 231, 111226. [Google Scholar] [CrossRef]
- Huang, D.W.; Wang, J.Y.; Khayatnezhad, M. Estimation of Actual Evapotranspiration Using Soil Moisture Balance and Remote Sensing. Iran. J. Sci. Technol.-Trans. Civ. Eng. 2021, 45, 2779–2786. [Google Scholar] [CrossRef]
- Yan, H.; Wang, S.Q.; Billesbach, D.; Oechel, W.; Zhang, J.H.; Meyers, T.; Martin, T.A.; Matamala, R.; Baldocchi, D.; Bohrer, G.; et al. Global estimation of evapotranspiration using a leaf area index-based surface energy and water balance model. Remote Sens. Environ. 2012, 124, 581–595. [Google Scholar] [CrossRef]
- Chirouze, J.; Boulet, G.; Jarlan, L.; Fieuzal, R.; Rodriguez, J.C.; Ezzahar, J.; Er-Raki, S.; Bigeard, G.; Merlin, O.; Garatuza-Payan, J.; et al. Intercomparison of four remote-sensing-based energy balance methods to retrieve surface evapotranspiration and water stress of irrigated fields in semi-arid climate. Hydrol. Earth Syst. Sci. 2014, 18, 1165–1188. [Google Scholar] [CrossRef]
- Alemayehu, T.; van Griensven, A.; Senay, G.B.; Bauwens, W. Evapotranspiration Mapping in a Heterogeneous Landscape Using Remote Sensing and Global Weather Datasets: Application to the Mara Basin, East Africa. Remote Sens. 2017, 9, 390. [Google Scholar] [CrossRef]
- Mu, Q.Z.; Zhao, M.S.; Running, S.W. Improvements to a MODIS global terrestrial evapotranspiration algorithm. Remote Sens. Environ. 2011, 115, 1781–1800. [Google Scholar] [CrossRef]
- Degano, M.F.; Rivas, R.E.; Carmona, F.; Niclòs, R.; Sánchez, J.M. Evaluation of the MOD16A2 evapotranspiration product in an agricultural area of Argentina, the Pampas region. Egypt. J. Remote Sens. Space Sci. 2021, 24, 319–328. [Google Scholar] [CrossRef]
- Autovino, D.; Minacapilli, M.; Provenzano, G. Modelling bulk surface resistance by MODIS data and assessment of MOD16A2 evapotranspiration product in an irrigation district of Southern Italy. Agric. Water Manag. 2016, 167, 86–94. [Google Scholar] [CrossRef]
- Tito, T.M.; Delgado, R.C.; de Carvalho, D.C.; Teodoro, P.E.; de Almeida, C.T.; da Silva, C.A.; dos Santos, E.B.; da Silva, L.A.S. Assessment of evapotranspiration estimates based on surface and satellite data and its relationship with El Nino-Southern Oscillation in the Rio de Janeiro State. Environ. Monit. Assess. 2020, 192, 449. [Google Scholar] [CrossRef]
- Rodell, M.; Houser, P.R.; Jambor, U.; Gottschalck, J.; Mitchell, K.; Meng, C.J.; Arsenault, K.; Cosgrove, B.; Radakovich, J.; Bosilovich, M.; et al. The global land data assimilation system. Bull. Am. Meteorol. Soc. 2004, 85, 381–394. [Google Scholar] [CrossRef]
- Andam-Akorful, S.A.; Ferreira, V.G.; Awange, J.L.; Forootan, E.; He, X.F. Multi-model and multi-sensor estimations of evapotranspiration over the Volta Basin, West Africa. Int. J. Climatol. 2015, 35, 3132–3145. [Google Scholar] [CrossRef]
- Baik, J.J.; Choi, M.H. Evaluation of geostationary satellite (COMS) based Priestley-Taylor evapotranspiration. Agric. Water Manag. 2015, 159, 77–91. [Google Scholar] [CrossRef]
- Etedali, H.R.; Ahmadi, M. Evaluation of various meteorological datasets in estimation yield and actual evapotranspiration of wheat and maize (case study: Qazvin plain). Agric. Water Manag. 2021, 256, 107080. [Google Scholar] [CrossRef]
- Khan, M.S.; Baik, J.; Choi, M. Inter -comparison of evapotranspiration datasets over heterogeneous landscapes across Australia. Adv. Space Res. 2020, 66, 533–545. [Google Scholar] [CrossRef]
- Khan, M.S.; Liaqat, U.W.; Baik, J.; Choi, M. Stand-alone uncertainty characterization of GLEAM, GLDAS and MOD16 evapotranspiration products using an extended triple collocation approach. Agric. For. Meteorol. 2018, 252, 256–268. [Google Scholar] [CrossRef]
- Panahi, D.M.; Tabas, S.S.; Kalantari, Z.; Ferreira, C.S.S.; Zahabiyoun, B. Spatio-Temporal Assessment of Global Gridded Evapotranspiration Datasets across Iran. Remote Sens. 2021, 13, 1816. [Google Scholar] [CrossRef]
- Miralles, D.G.; Holmes, T.R.H.; De Jeu, R.A.M.; Gash, J.H.; Meesters, A.; Dolman, A.J. Global land-surface evaporation estimated from satellite-based observations. Hydrol. Earth Syst. Sci. 2011, 15, 453–469. [Google Scholar] [CrossRef]
- Jiang, S.H.; Wei, L.Y.; Ren, L.L.; Xu, C.Y.; Zhong, F.; Wang, M.H.; Zhang, L.Q.; Yuan, F.; Liu, Y. Utility of integrated IMERG precipitation and GLEAM potential evapotranspiration products for drought monitoring over mainland China. Atmos. Res. 2021, 247, 105141. [Google Scholar] [CrossRef]
- Liu, J.Y.; Zhang, J.W.; Kong, D.D.; Feng, X.Y.; Feng, S.Y.; Xiao, M.Z. Contributions of Anthropogenic Forcings to Evapotranspiration Changes Over 1980–2020 Using GLEAM and CMIP6 Simulations. J. Geophys. Res. Atmos. 2021, 126, e2021JD035367. [Google Scholar] [CrossRef]
- Long, X.J.; Cui, Y.K. Spatially Downscaling a Global Evapotranspiration Product for End User Using a Deep Neural Network: A Case Study with the GLEAM Product. Remote Sens. 2022, 14, 658. [Google Scholar] [CrossRef]
- Yang, X.Q.; Yong, B.; Ren, L.L.; Zhang, Y.Q.; Long, D. Multi-scale validation of GLEAM evapotranspiration products over China via ChinaFLUX ET measurements. Int. J. Remote Sens. 2017, 38, 5688–5709. [Google Scholar] [CrossRef]
- Muñoz-Sabater, J.; Dutra, E.; Agustí-Panareda, A.; Albergel, C.; Arduini, G.; Balsamo, G.; Boussetta, S.; Choulga, M.; Harrigan, S.; Hersbach, H.; et al. ERA5-Land: A state-of-the-art global reanalysis dataset for land applications. Earth Syst. Sci. Data 2021, 13, 4349–4383. [Google Scholar] [CrossRef]
- Laipelt, L.; Kayser, R.H.B.; Fleischmann, A.S.; Ruhoff, A.; Bastiaanssen, W.; Erickson, T.A.; Melton, F. Long-term monitoring of evapotranspiration using the SEBAL algorithm and Google Earth Engine cloud computing. ISPRS J. Photogramm. Remote Sens. 2021, 178, 81–96. [Google Scholar] [CrossRef]
- Pelosi, A.; Chirico, G.B. Regional assessment of daily reference evapotranspiration: Can ground observations be replaced by blending ERA5-Land meteorological reanalysis and CM-SAF satellite-based radiation data? Agric. Water Manag. 2021, 258, 107169. [Google Scholar] [CrossRef]
- Pelosi, A.; Terribile, F.; D’Urso, G.; Chirico, G.B. Comparison of ERA5-Land and UERRA MESCAN-SURFEX Reanalysis Data with Spatially Interpolated Weather Observations for the Regional Assessment of Reference Evapotranspiration. Water 2020, 12, 1669. [Google Scholar] [CrossRef]
- Zhao, X.Y.; Xia, H.M.; Pan, L.; Song, H.Q.; Niu, W.H.; Wang, R.M.; Li, R.M.; Bian, X.Q.; Guo, Y.; Qin, Y.C. Drought Monitoring over Yellow River Basin from 2003–2019 Using Reconstructed MODIS Land Surface Temperature in Google Earth Engine. Remote Sens. 2021, 13, 3748. [Google Scholar] [CrossRef]
- Ma, N.; Szilagyi, J.; Zhang, Y.S.; Liu, W.B. Complementary-Relationship-Based Modeling of Terrestrial Evapotranspiration Across China during 1982–2012: Validations and Spatiotemporal Analyses. J. Geophys. Res. Atmos. 2019, 124, 4326–4351. [Google Scholar] [CrossRef]
- Ma, N.; Szilagyi, J. The CR of Evaporation: A Calibration-Free Diagnostic and Benchmarking Tool for Large-Scale Terrestrial Evapotranspiration Modeling. Water Resour. Res. 2019, 55, 7246–7274. [Google Scholar] [CrossRef]
- Peng, S.Z.; Ding, Y.X.; Wen, Z.M.; Chen, Y.M.; Cao, Y.; Ren, J.Y. Spatiotemporal change and trend analysis of potential evapotranspiration over the Loess Plateau of China during 2011–2100. Agric. For. Meteorol. 2017, 233, 183–194. [Google Scholar] [CrossRef]
- Ding, Y.X.; Peng, S.Z. Spatiotemporal Trends and Attribution of Drought across China from 1901–2100. Sustainability 2020, 12, 477. [Google Scholar] [CrossRef]
- Peng, S.Z.; Ding, Y.X.; Liu, W.Z.; Li, Z. 1 km monthly temperature and precipitation dataset for China from 1901 to 2017. Earth Syst. Sci. Data 2019, 11, 1931–1946. [Google Scholar] [CrossRef]
- Peng, S.Z.; Gang, C.C.; Cao, Y.; Chen, Y.M. Assessment of climate change trends over the Loess Plateau in China from 1901 to 2100. Int. J. Climatol. 2018, 38, 2250–2264. [Google Scholar] [CrossRef]
- Meng, X.J.; Mao, K.B.A.; Meng, F.; Shi, J.C.; Zeng, J.Y.; Shen, X.Y.; Cui, Y.K.; Jiang, L.M.; Guo, Z.H. A fine-resolution soil moisture dataset for China in 2002–2018. Earth Syst. Sci. Data 2021, 13, 3239–3261. [Google Scholar] [CrossRef]
- Kronenberg, R.; Bernhofer, C. A method to adapt radar-derived precipitation fields for climatological applications. Meteorol. Appl. 2015, 22, 636–649. [Google Scholar] [CrossRef]
- Taylor, K.E. Summarizing multiple aspects of model performance in a single diagram. J. Geophys. Res. Atmos. 2001, 106, 7183–7192. [Google Scholar] [CrossRef]
- Wang, J.F.; Li, X.H.; Christakos, G.; Liao, Y.L.; Zhang, T.; Gu, X.; Zheng, X.Y. Geographical Detectors-Based Health Risk Assessment and its Application in the Neural Tube Defects Study of the Heshun Region, China. Int. J. Geogr. Inf. Sci. 2010, 24, 107–127. [Google Scholar] [CrossRef]
- Sun, D.L.; Shi, S.X.; Wen, H.J.; Xu, J.H.; Zhou, X.Z.; Wu, J.P. A hybrid optimization method of factor screening predicated on GeoDetector and Random Forest for Landslide Susceptibility Mapping. Geomorphology 2021, 379, 107623. [Google Scholar] [CrossRef]
- Luo, W.; Liu, C.C. Innovative landslide susceptibility mapping supported by geomorphon and geographical detector methods. Landslides 2018, 15, 465–474. [Google Scholar] [CrossRef]
- Zhou, X.Z.; Wen, H.J.; Zhang, Y.L.; Xu, J.H.; Zhang, W.G. Landslide susceptibility mapping using hybrid random forest with GeoDetector and RFE for factor optimization. Geosci. Front. 2021, 12, 101211. [Google Scholar] [CrossRef]
- Wang, H.Y.; Qin, F.; Xu, C.D.; Li, B.; Guo, L.P.; Wang, Z. Evaluating the suitability of urban development land with a Geodetector. Ecol. Indic. 2021, 123, 107339. [Google Scholar] [CrossRef]
- Chen, W.X.; Yang, L.Y.; Wu, J.H.; Wu, J.H.; Wang, G.Z.; Bian, J.J.; Zeng, J.; Liu, Z.L. Spatio-temporal characteristics and influencing factors of traditional villages in the Yangtze River Basin: A Geodetector model. Herit. Sci. 2023, 11, 111. [Google Scholar] [CrossRef]
Disclaimer/Publisher’s Note: The statements, opinions and data contained in all publications are solely those of the individual author(s) and contributor(s) and not of MDPI and/or the editor(s). MDPI and/or the editor(s) disclaim responsibility for any injury to people or property resulting from any ideas, methods, instructions or products referred to in the content. |
© 2024 by the authors. Licensee MDPI, Basel, Switzerland. This article is an open access article distributed under the terms and conditions of the Creative Commons Attribution (CC BY) license (https://creativecommons.org/licenses/by/4.0/).