Communication

Radiometric Calibration of the Near-Infrared Bands of GF-5-02/DPC for Water Vapor Retrieval

1
Shanghai Institute of Satellite Engineering, Shanghai 201109, China
2
Aerospace Information Research Institute, Chinese Academy of Sciences, Beijing 100101, China
3
Shanghai Academy of Spaceflight Technology, Shanghai 201109, China
4
Jianghuai Advance Technology Center, Hefei 230000, China
5
Anhui Institute of Optics and Fine Mechanics, Chinese Academy of Sciences, Hefei 230031, China
*
Author to whom correspondence should be addressed.
Remote Sens. 2024, 16(10), 1806; https://doi.org/10.3390/rs16101806
Submission received: 24 March 2024 / Revised: 16 May 2024 / Accepted: 16 May 2024 / Published: 20 May 2024

Abstract

:
The GaoFen (GF)-5-02 satellite is one of the new generations of hyperspectral observation satellites launched by China in 2021. The directional polarimetric camera (DPC) is an optical sensor onboard the GF-5-02 satellite. The precipitable water vapor (PWV) is a key detection parameter of DPC. However, the existing PWV data developed using DPC data have significant errors due to the lack of the timely calibration of the two bands (865, 910 nm) of DPC used for PWV retrieval. In order to acquire DPC PWV data with smaller errors, a calibration method is developed for these two bands. The method consists of two parts: (1) calibrate the 865 nm band of the DPC using the cross-calibration method, (2) calibrate the 910 nm band of the DPC according to the calibrated 865 nm band of the DPC. This method effectively addresses the issue of the absence of a calibration method for the water vapor absorption band (910 nm) of the DPC. Regardless of whether AERONET PWV data or SuomiNET PWV data are used as the reference data, the accuracy of the DPC PWV data developed using calibrated DPC data is significantly superior to that of the DPC PWV data retrieved using data before recalibration. This means that the calibration method for the NIR bands of the DPC can effectively enhance the quality of DPC PWV data.

Graphical Abstract

1. Introduction

The GaoFen (GF)-5-02 satellite is one of the new generations of hyperspectral observation satellites launched by China in 2021 [1]. The particulate observing scanning polarimeter (POSP) and directional polarimetric camera (DPC) are two main optical sensors onboard the GF-5-02 satellite. The primary purpose of these two sensors is to detect aerosols, providing crucial data for monitoring atmospheric pollution [2]. Additionally, they aid in correcting data collected by other sensors onboard the GF-5-02 satellite. Since the DPC and POSP data used for aerosol retrieval would be affected by water vapor, it is necessary to use precipitable water vapor (PWV) data to perform absorption correction on the observations of these two sensors before aerosol retrieval. Furthermore, PWV data are also needed for the atmospheric correction of observation data from other sensors onboard the GF-5-02 satellite. Because the distribution of water vapor varies notably in both time and space [3], synchronizing PWV data with the GF-5-02 satellite becomes essential for achieving the high-accuracy atmospheric absorption correction of the data from DPC, POSP, advanced hyperspectral imager (AHSI), and other sensors onboard the GF-5-02 satellite platform. For these reasons, the DPC is equipped with two near-infrared (NIR) bands at 865 and 910 nm (referred to as NIR08 and NIR09 bands), so as to obtain PWV data synchronized with the GF-5-02 satellite. Moreover, due to the significant temporal and spatial differences in the water vapor distribution and the varying transit times of various satellites [4], the DPC is also important to enhance global PWV monitoring.
Recently, a PWV retrieval algorithm has been specifically established for the DPC onboard the GF-5-02 satellite [5]. This algorithm employs the two bands at 865 and 910 nm of the DPC. The core principles of the algorithm are as follows. For any pixel in need of retrieving PWV, the water vapor absorption transmittance (WVAT) of the NIR09 band would be calculated first by dividing the top of the atmosphere (TOA) reflectance of the NIR09 band by that of the NIR08 band. Subsequently, the WVATs of the NIR09 band for various PWV contents are simulated by using a radiative transfer model (RTM). Finally, the one with the smallest difference between the simulated WVAT and the calculated WVAT is selected, and the PWV value corresponding to the simulated WVAT is the PWV retrieval result. To enhance the PWV retrieval efficiency, a look-up table is preconstructed to avoid using the RTM at any one pixel. Nevertheless, due to the systematic errors in the observations of the NIR bands used for monitoring PWV, the DPC PWV data developed through the algorithm exhibit notable errors [5]. To reduce the error of DPC PWV data, it is necessary to perform radiometric calibration at the two bands at 865 and 910 nm.
Due to the lack of a calibration system for DPC, researchers have developed a large number of in-orbit vicarious calibration methods for DPC. Chen et al. conducted radiometric calibration of four bands (443, 490, 565, and 670 nm) of the DPC in the South Atlantic using the Rayleigh calibration method. The results, calculated based on error propagation theory, showed that the errors of the calibration coefficients calculated using this method ranged from 1.24% to 4.76% [6]. A similar method was also employed by Zhu et al. to recalibrate long time series data derived from four bands of the DPC [7]. Qie et al. used two calibration methods, the sun glint inter-band calibration method and the Rayleigh calibration method, to calibrate the intensity bands of DPC [8]. In the study, the Rayleigh calibration method was initially utilized for calibrating the bands at 443, 490, 565, and 670 nm in clear oceanic regions worldwide. Subsequently, the recalibrated band at 565 nm was used as a reference for calibrating the other four DPC bands (443, 490, 670, and 865 nm) in the sun glint areas of the ocean. The assessment results showed that the errors in the calibration coefficients calculated using the Rayleigh calibration method ranged from 1.3% to 4%, and the calibration error would increase with the increase in wavelength. In addition to the above methods, a cross-calibration method between different satellites has been employed for the calibration of the five non-absorption bands (443,490, 565, 670, and 865 nm) of the DPC by Zhu et al. [9]. They conducted the calibration of these five DPC bands at a desert calibration site in North Africa by using MODIS data as a reference. The uncertainty in the calibration coefficients obtained through this method ranged from 2.4% to 3.7%.
Although researchers have developed multiple in-orbit calibration methods for the intensity bands of the DPC, there remains a lack of calibration algorithms for the band at 910 nm of the DPC. Because of the significant impact of water vapor on the observation of this band and the obvious difference in the spatiotemporal distribution of water vapor, calibrating the 910 nm band of the DPC is more challenging compared to the non-absorption bands of the DPC. Although it is feasible to use ocean or desert calibration fields to calibrate the DPC, the calibration process requires high-quality water vapor distribution data. Due to the difficulty of obtaining high-quality water vapor distribution data in unmanned and remote desert or ocean calibration sites, it is difficult to ensure the calibration accuracy of the water vapor absorption (WVA) band of the DPC. For instance, Wang et al. conducted radiometric calibration of the Medium-Resolution Imager (MERSI) onboard the FengYun-3 satellite using multiple calibration sites, including desert and ocean sites [10]. Owing to constraints in the quality of PWV data utilized for calibration input, the assessment results revealed that the error of the calibration coefficient for the WVA band of the MERSI exceeds that of the other bands. This is also the reason why researchers have not yet performed radiometric calibration of the 910 nm band of the DPC.
Since the POSP is equipped with an onboard radiometric calibrator, its observations can be used for the radiometric calibration of the observations of other sensors with similar channels (380, 410, 443, 490, 670, 865, 1380, 1610, and 2250 nm). In this study, the observation data of the 865 nm band of the POSP are used for the radiometric calibration of the 865 nm band of the DPC. It has been proven that the TOA reflectance for the bands at 865 and 910 nm are strongly correlated without considering the effects of the WVA [11]. In this work, the relationship between them is used to calibrate the 910 nm band of the DPC. The 865 nm band of the POSP is firstly used for the calibration of the 865 nm band of the DPC. After that, the observation data of the 910 nm band of the DPC without systematic radiometric calibration errors can be simulated using the observation data of the 865 nm band of the DPC and the WVAT calculated based on ground-based PWV data. It is worth noting that several ground-based networks can provide PWV data with a high accuracy, such as the Aerosol Robotic Network (AERONET) and SuomiNET [12]. Finally, the radiometric calibration coefficients for the 865 and 910 nm bands of the DPC can be determined.
To obtain DPC data with a higher quality and enhance the accuracy of existing PWV data, a radiometric calibration method applicable to the near-infrared bands of GF-5-02/DPC for water vapor retrieval is developed. The structure of this paper is outlined as follows: Section 2 introduces the data utilized. Subsequently, Section 3 presents the radiometric calibration method for the DPC. Section 4 details the results of the radiometric calibration of the DPC. Following that, Section 5 discusses the calibration method. Finally, this study is concluded in Section 6.

2. Materials

2.1. GF-5-02 Data

The GF-5-02 satellite is China’s first comprehensive hyperspectral observation operational satellite designed for ecological and environmental purposes. It was successfully launched on 7 September 2021. The GF-5-02 satellite is a polar orbit satellite operating on a sun-synchronous orbit with an inclination angle of 98.203 degrees and an altitude of 705 km. The local time of the descending node of the GF-5-02 satellite is 10:30 a.m. The DPC and POSP are the two optical payloads of the GF-5-02 satellite. The DPC has eight bands within the spectral range of 0.4–1 μm. The eight bands all have multi-angle observation capabilities. Among them, the three bands at 490, 670, and 865 nm have the capability to observe both intensity and polarization data, while the remaining five bands (443, 565, 763, 765, and 910 nm) can only observe intensity data. The POSP has nine bands in the spectral range of 0.3–2.3 μm. The nine bands of the POSP all have the capability to observe both intensity and polarization data, while they only have single-angle observation capabilities. Since the POSP has an onboard calibration system and the DPC lacks one, calibrating the DPC is one of the important tasks of the POSP [13], in addition to aerosol detection [2]. The onboard radiometric calibration system of the POSP adopts the solar calibration method based on the solar diffuser to achieve the radiometric calibration of the observations of the POSP. The radiance standard is determined by the solar spectral irradiance and the diffuser bidirectional reflectance distribution function in near real time. The solar diffuser stability monitor is utilized to monitor and correct changes in the solar diffuser. These devices ensure that the radiometric calibration of the visible and near-infrared bands of the POSP have an uncertainty of 3% and a systematic error of 0 [13]. The spectral response functions (SRFs) of the bands that the DPC and POSP use are shown in Figure 1. The DPC and POSP data for a total of ten days from 21 to 30 November 2022 are used in this study.

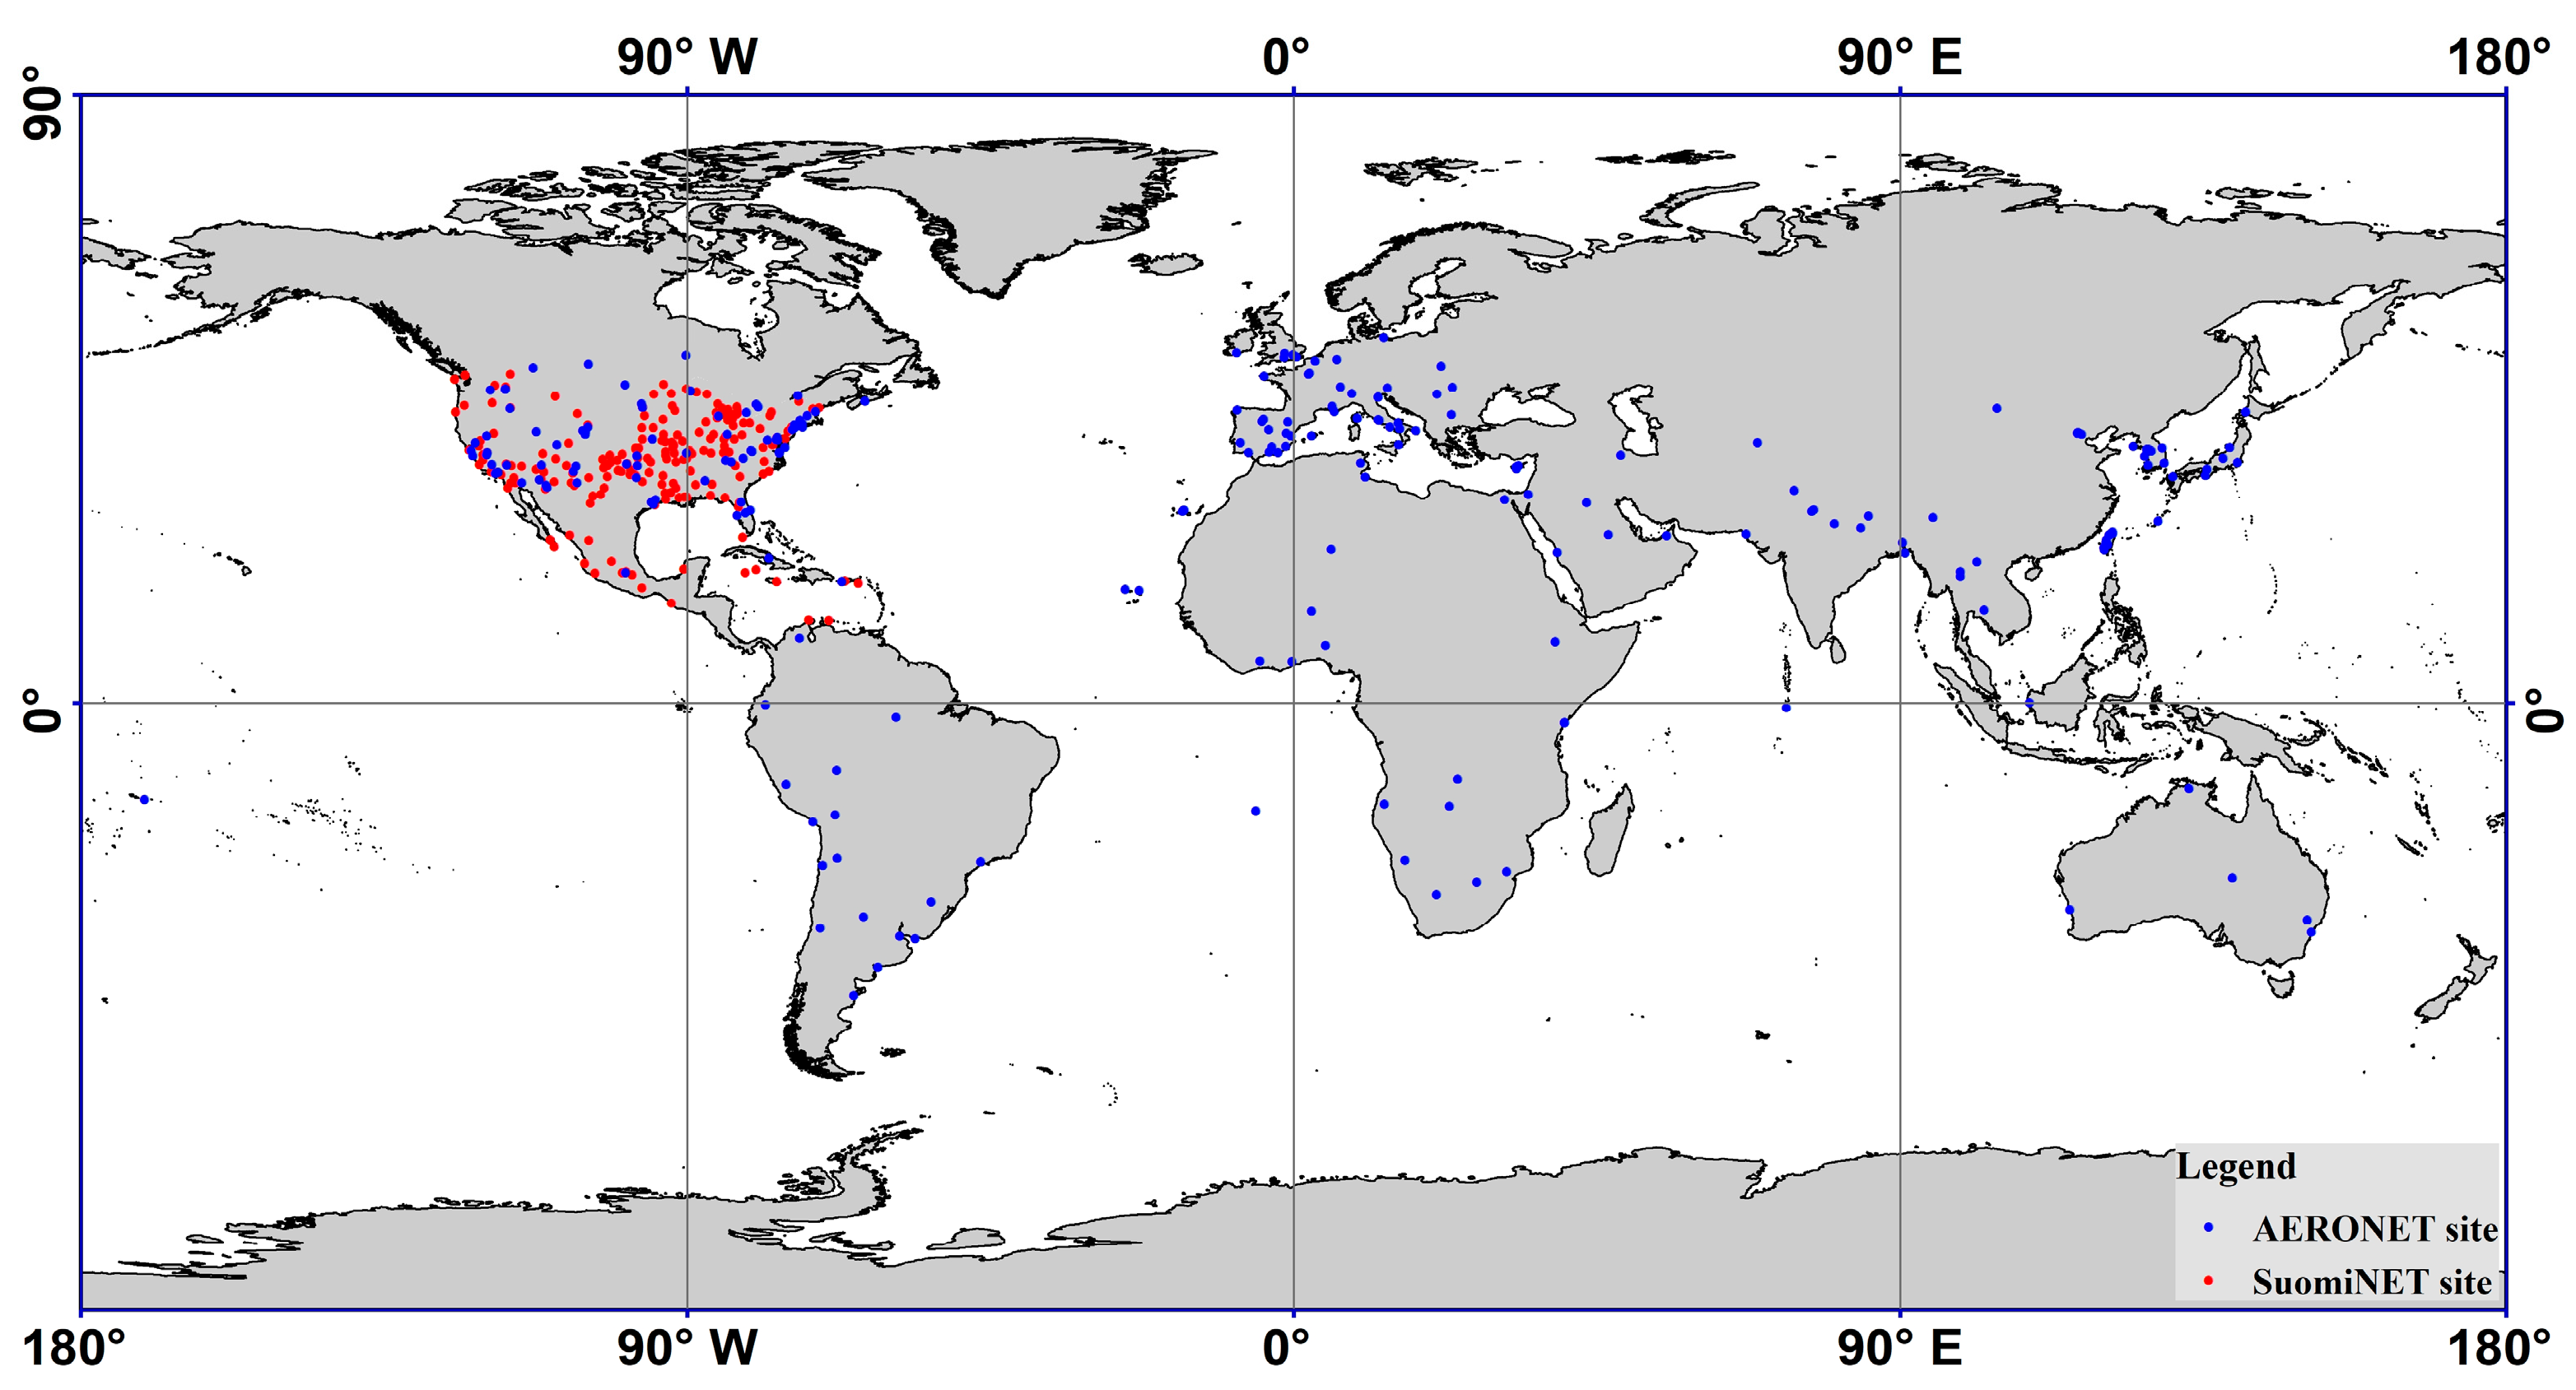
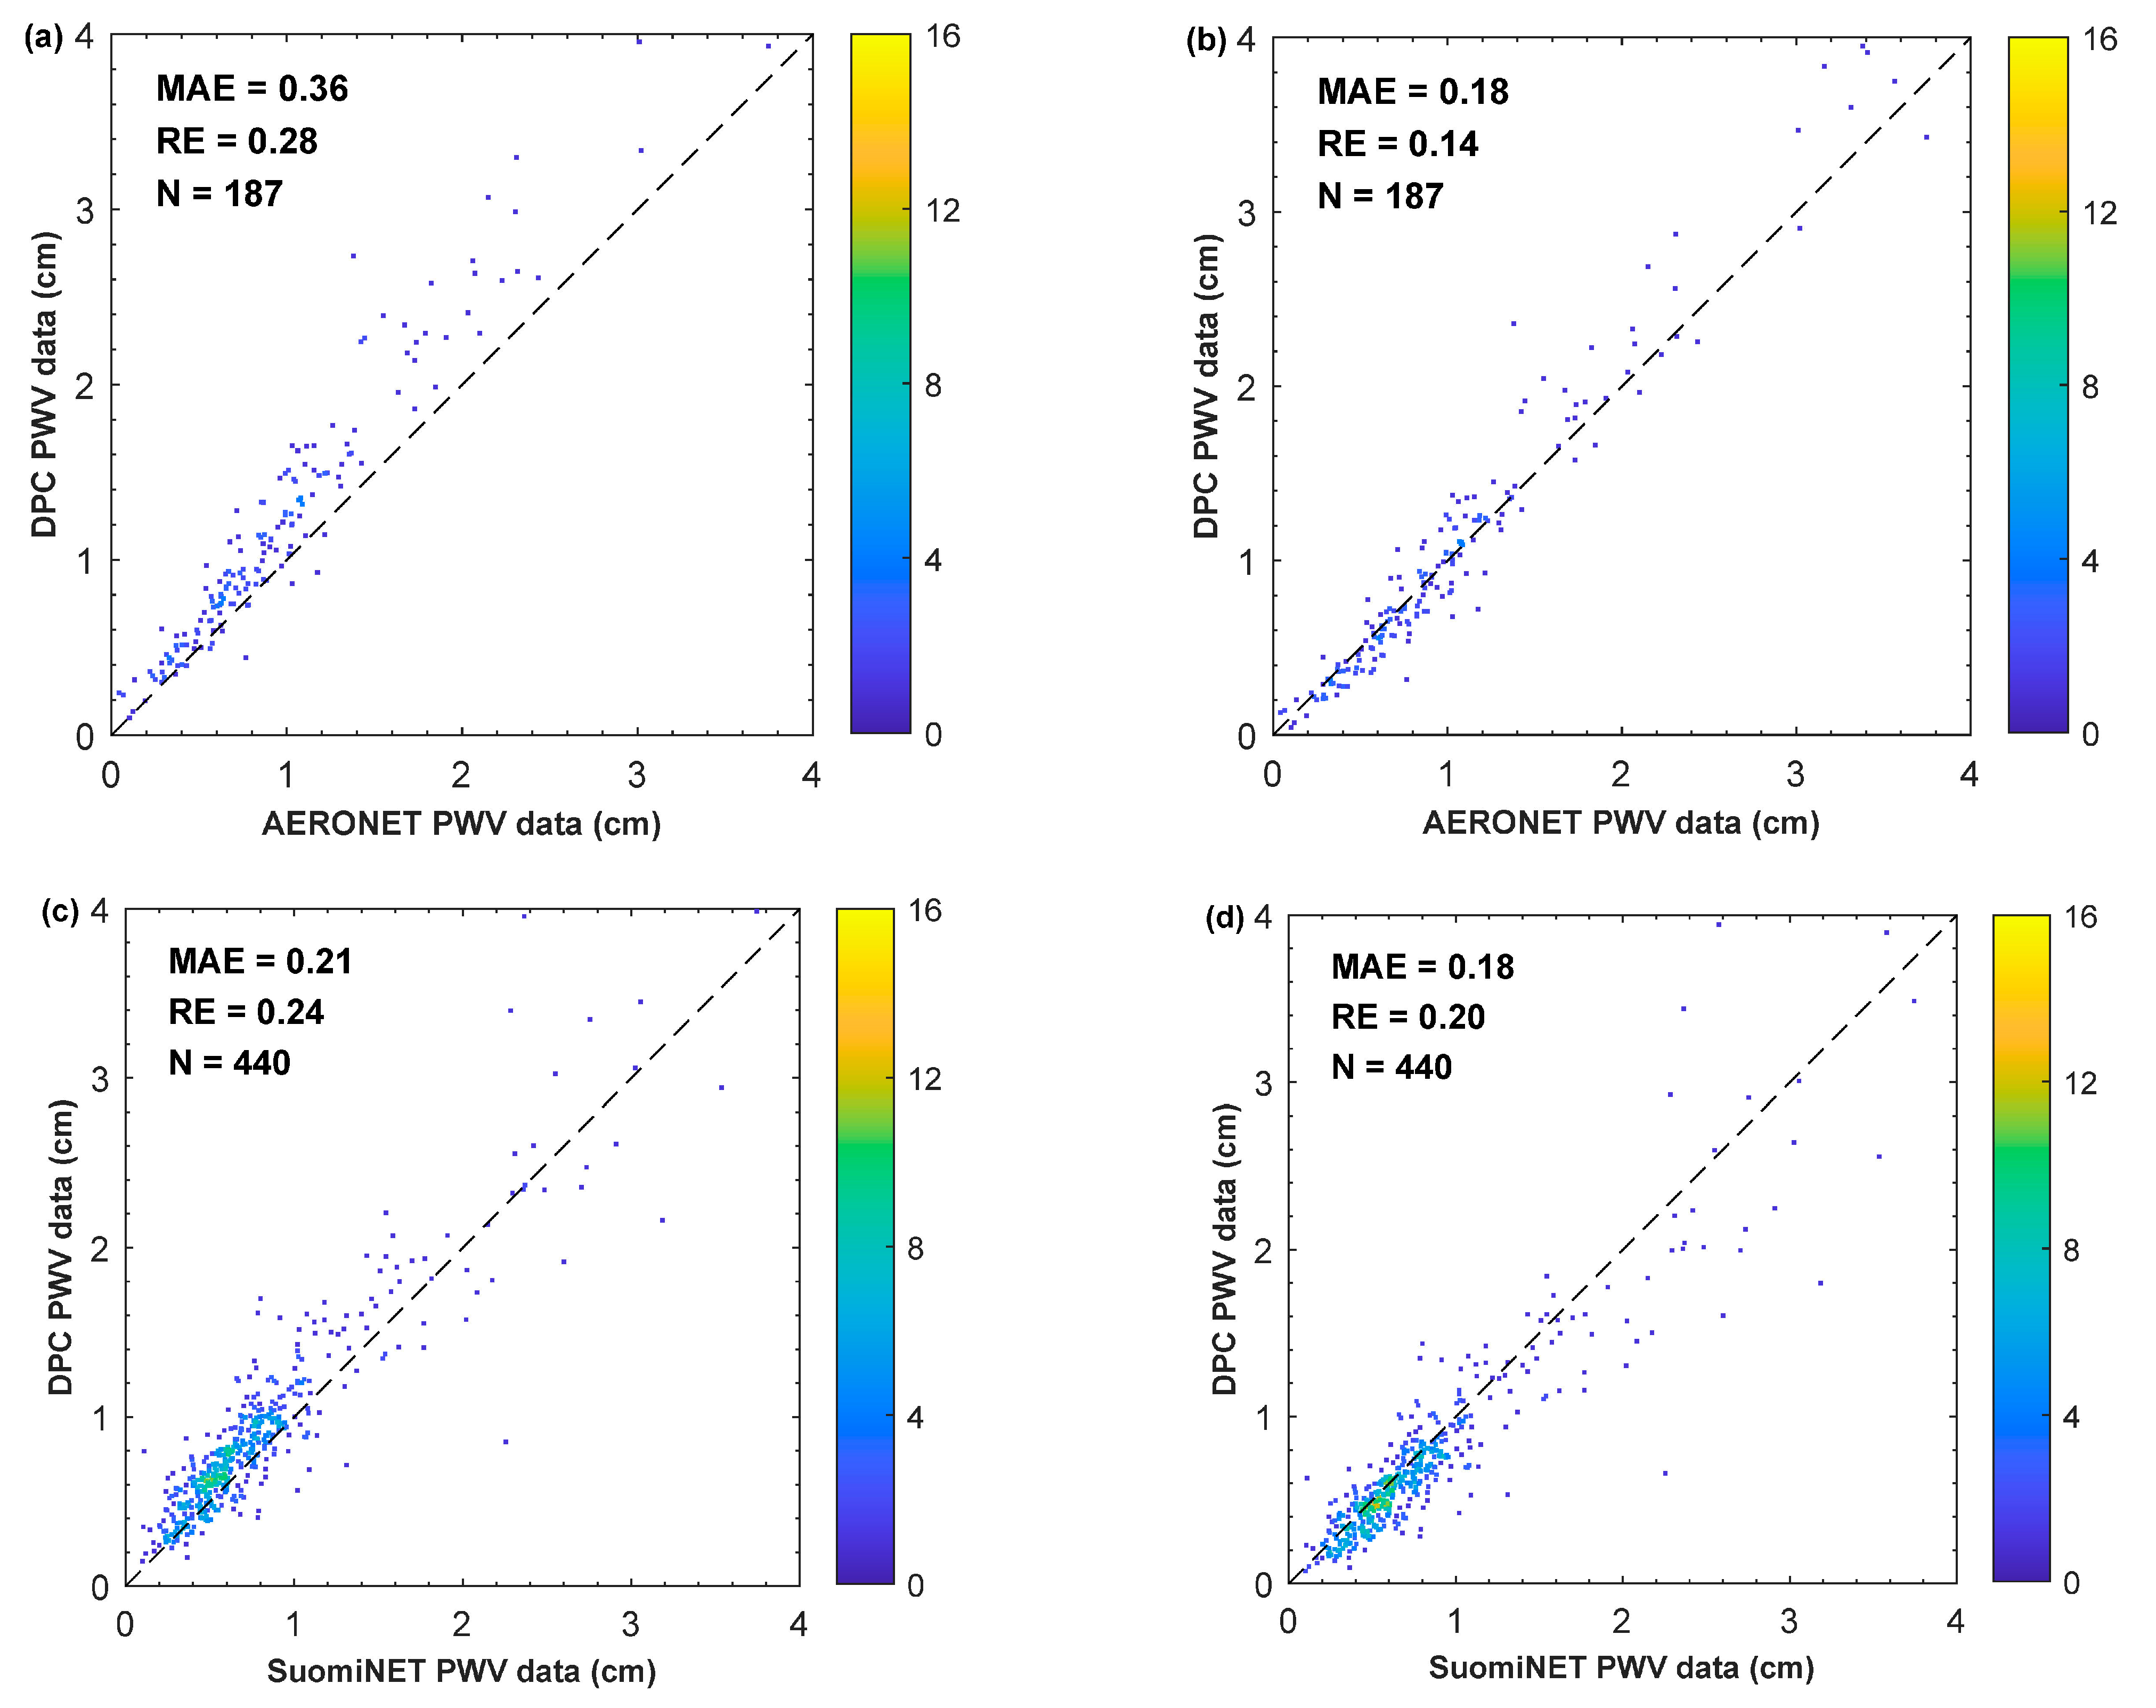
2.2. Ground-Based PWV Data

AERONET and SuomiNET are two ground-based networks that have been in continuous operation for several decades [14,15]. Both networks provide high-quality observations of water vapor, which serve as crucial reference data for assessing the quality of remote sensing PWV data [12,16]. In this work, AERONET data are used to develop the calibration model used for the DPC and to assess the quality of DPC PWV data, and SuomiNET data are employed to assess the accuracy of DPC PWV data. The observations from 229 AERONET sites and 187 SuomiNET sites are utilized in this study. Their spatial distribution is illustrated in Figure 2. The matching results between AERONET data and DPC data are randomly split into two sets in a 7:3 ratio. Among them, 70% of the data is used for calibration, and the remaining 30% of the data is used for the assessment of calibration results.

3. Methods

In this study, the 865 nm band of the DPC is calibrated using the cross-calibration method with the observations of the 865 nm band of the POSP as the reference data. After that, the 910 nm band of the DPC is calibrated according to the DPC calibrated at the 865 nm band.

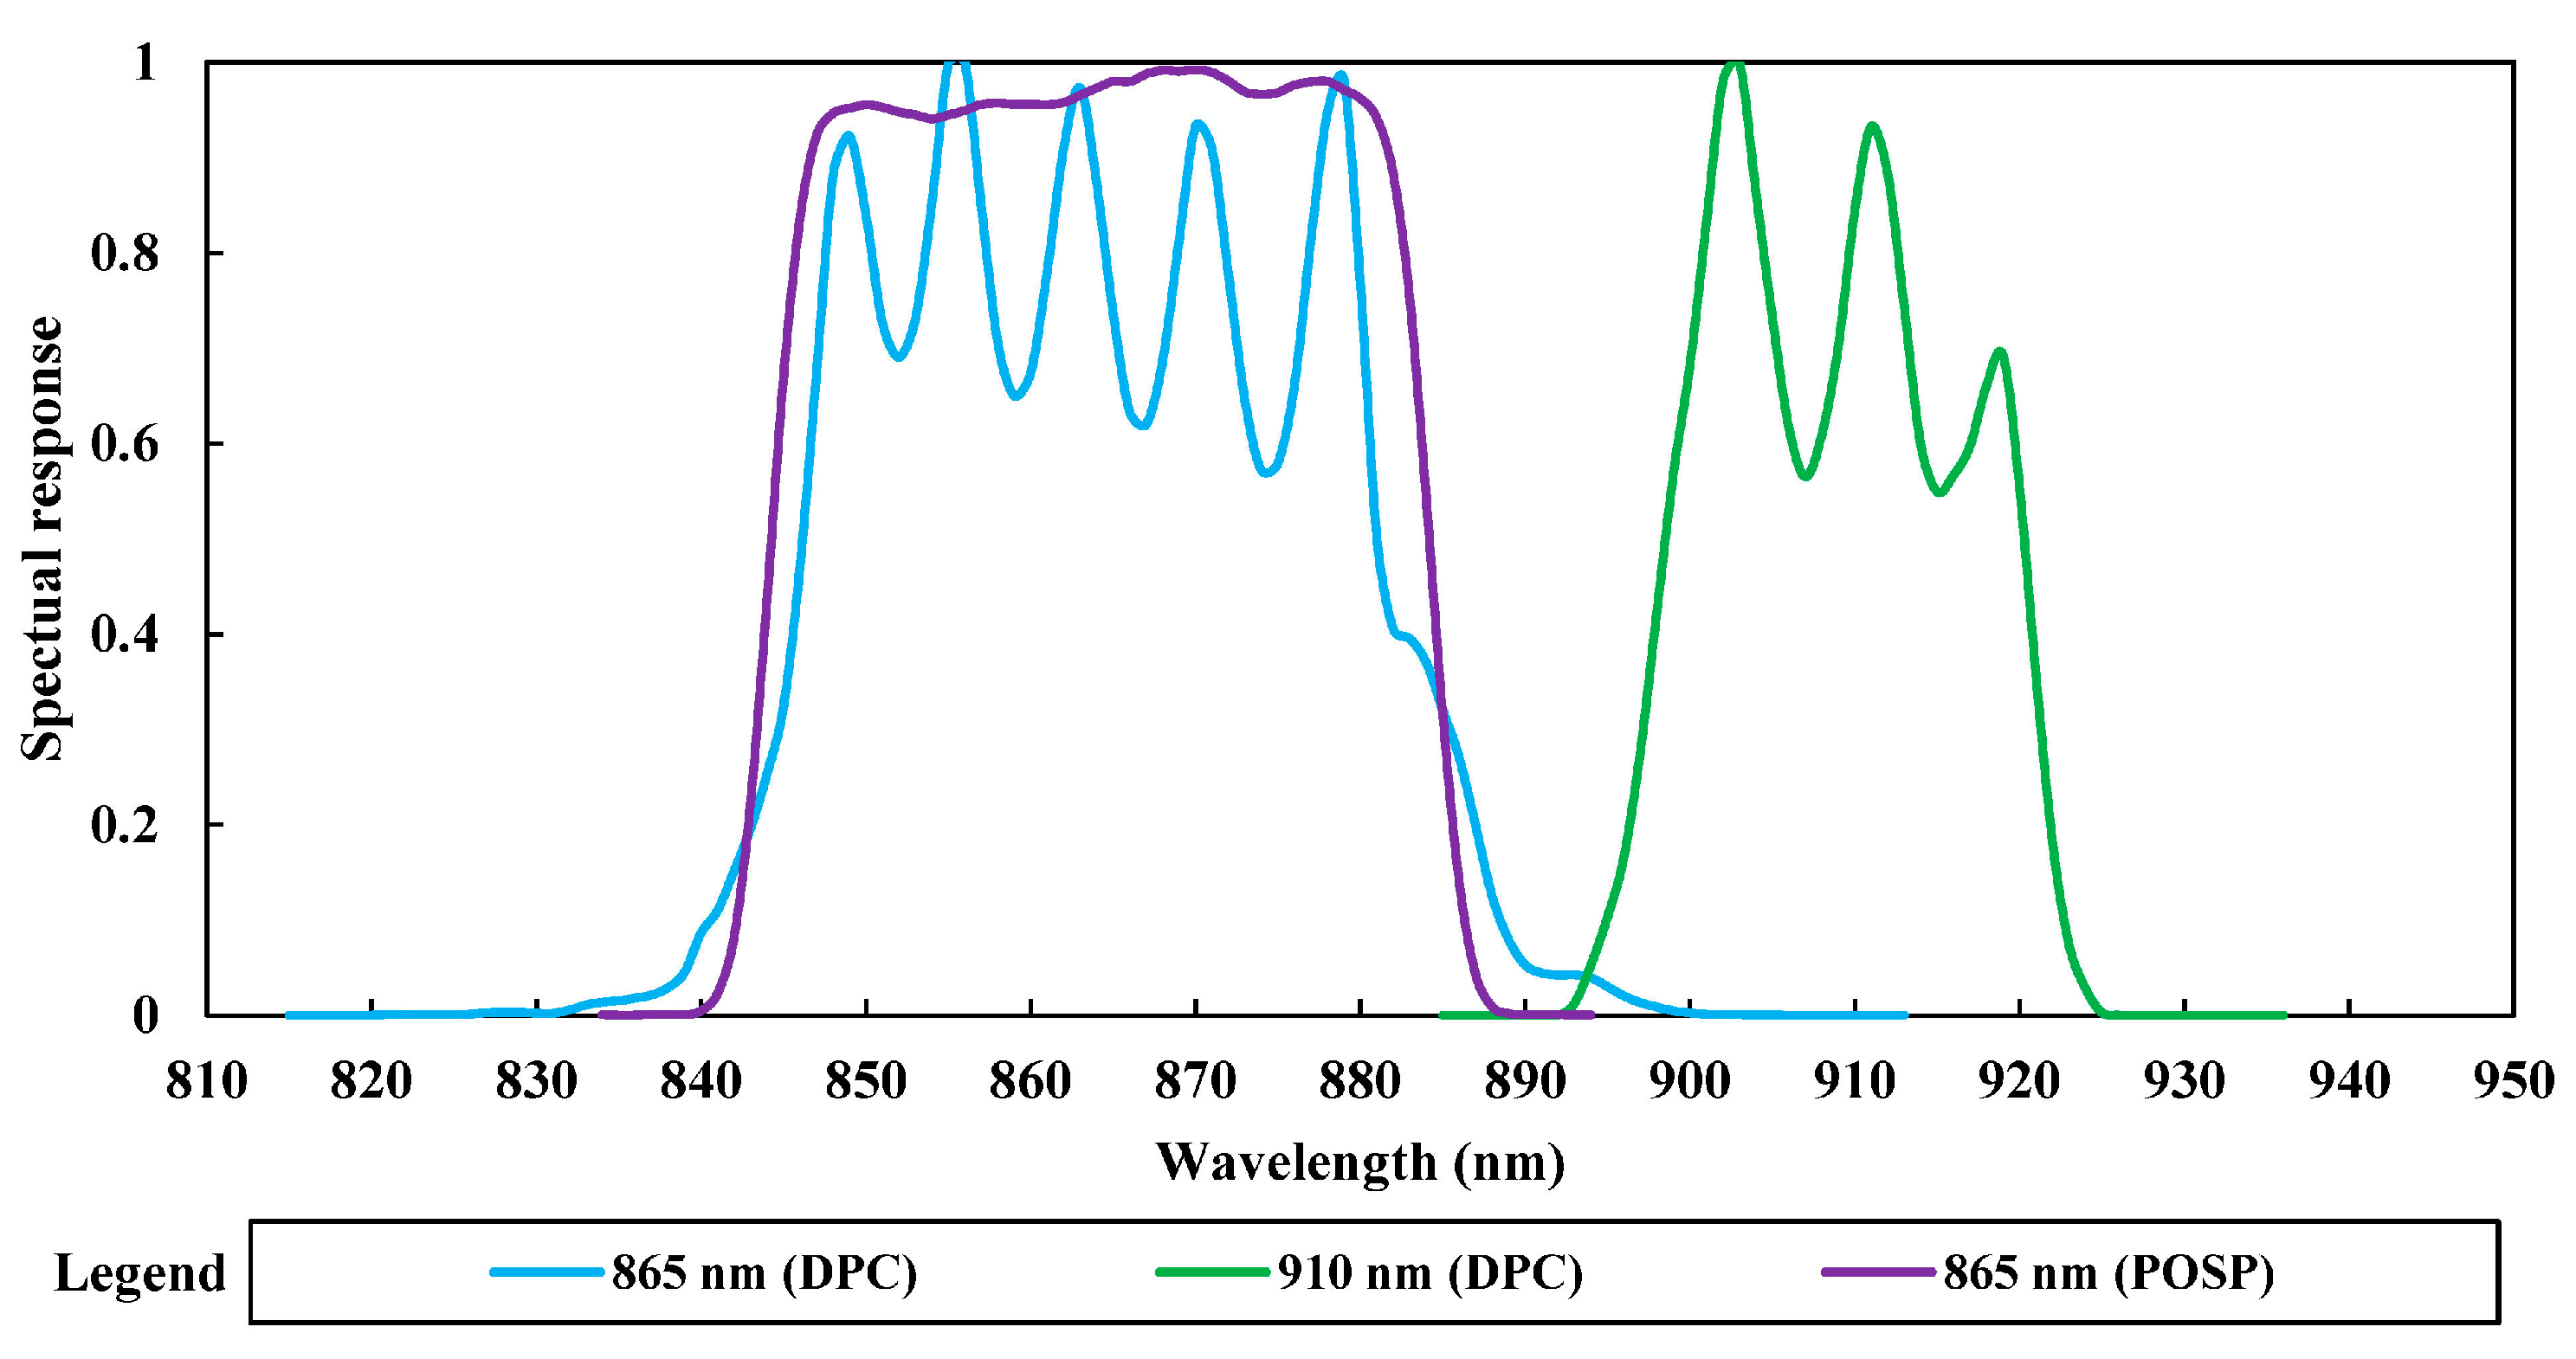
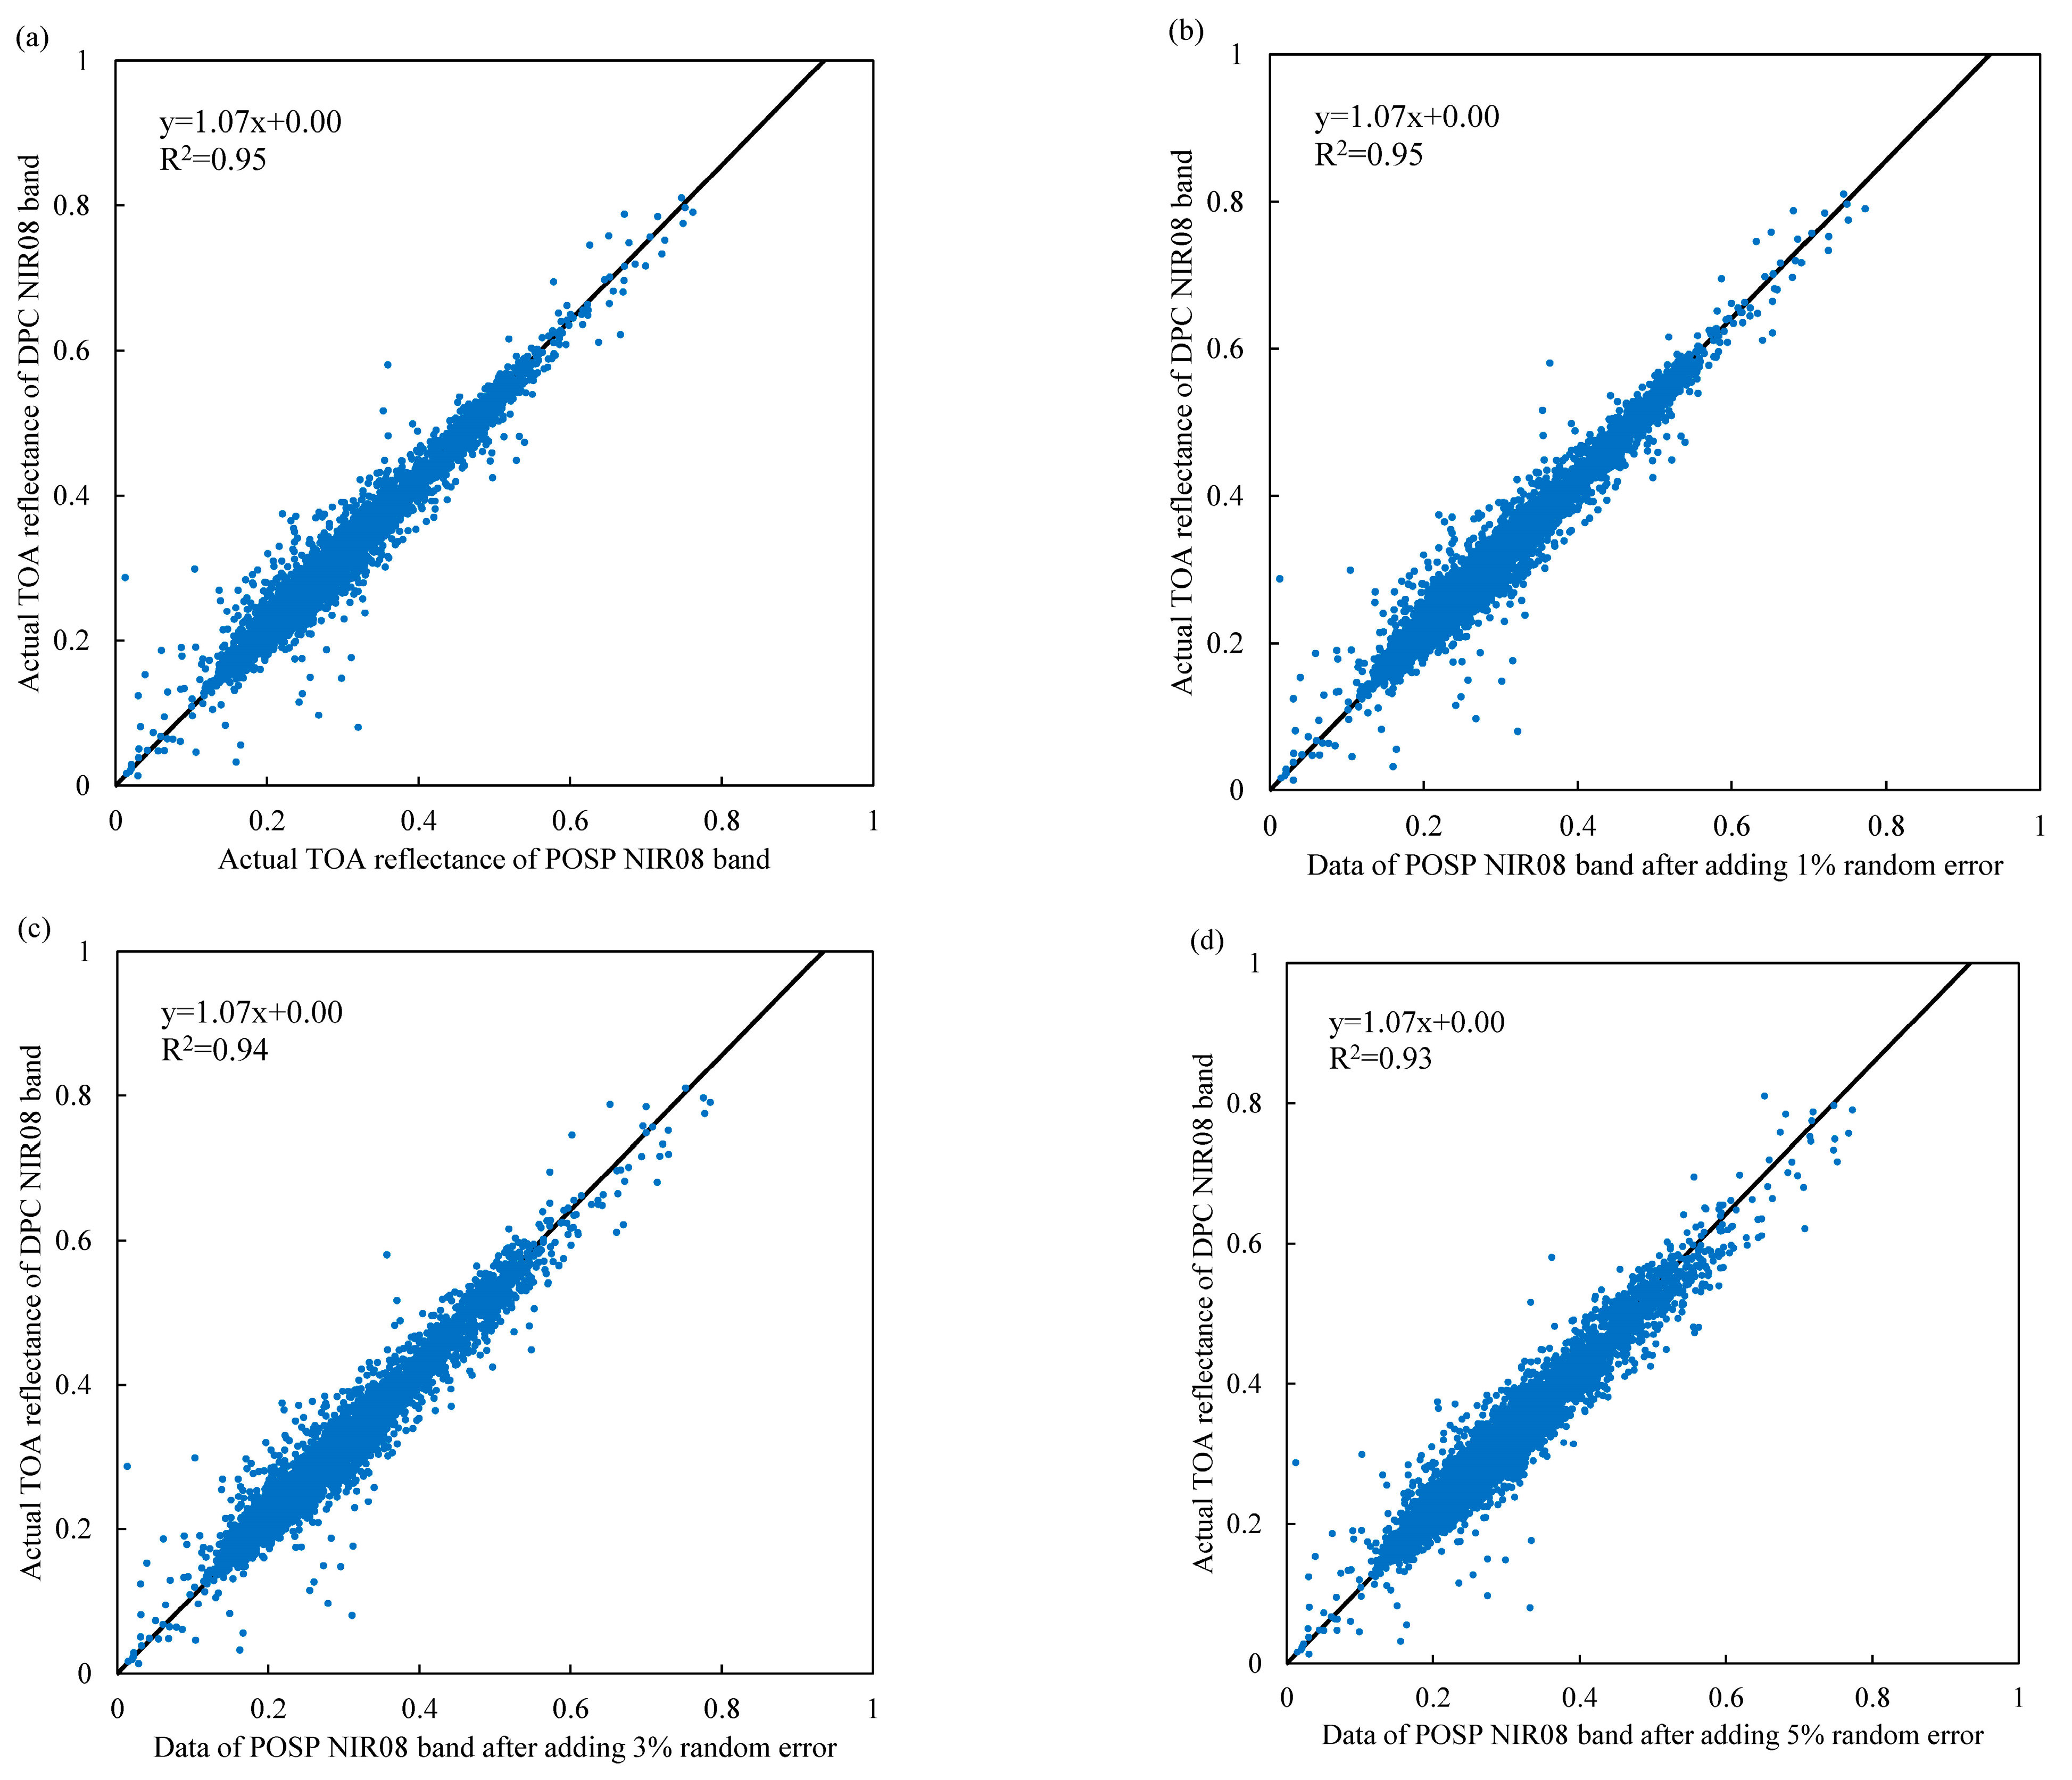
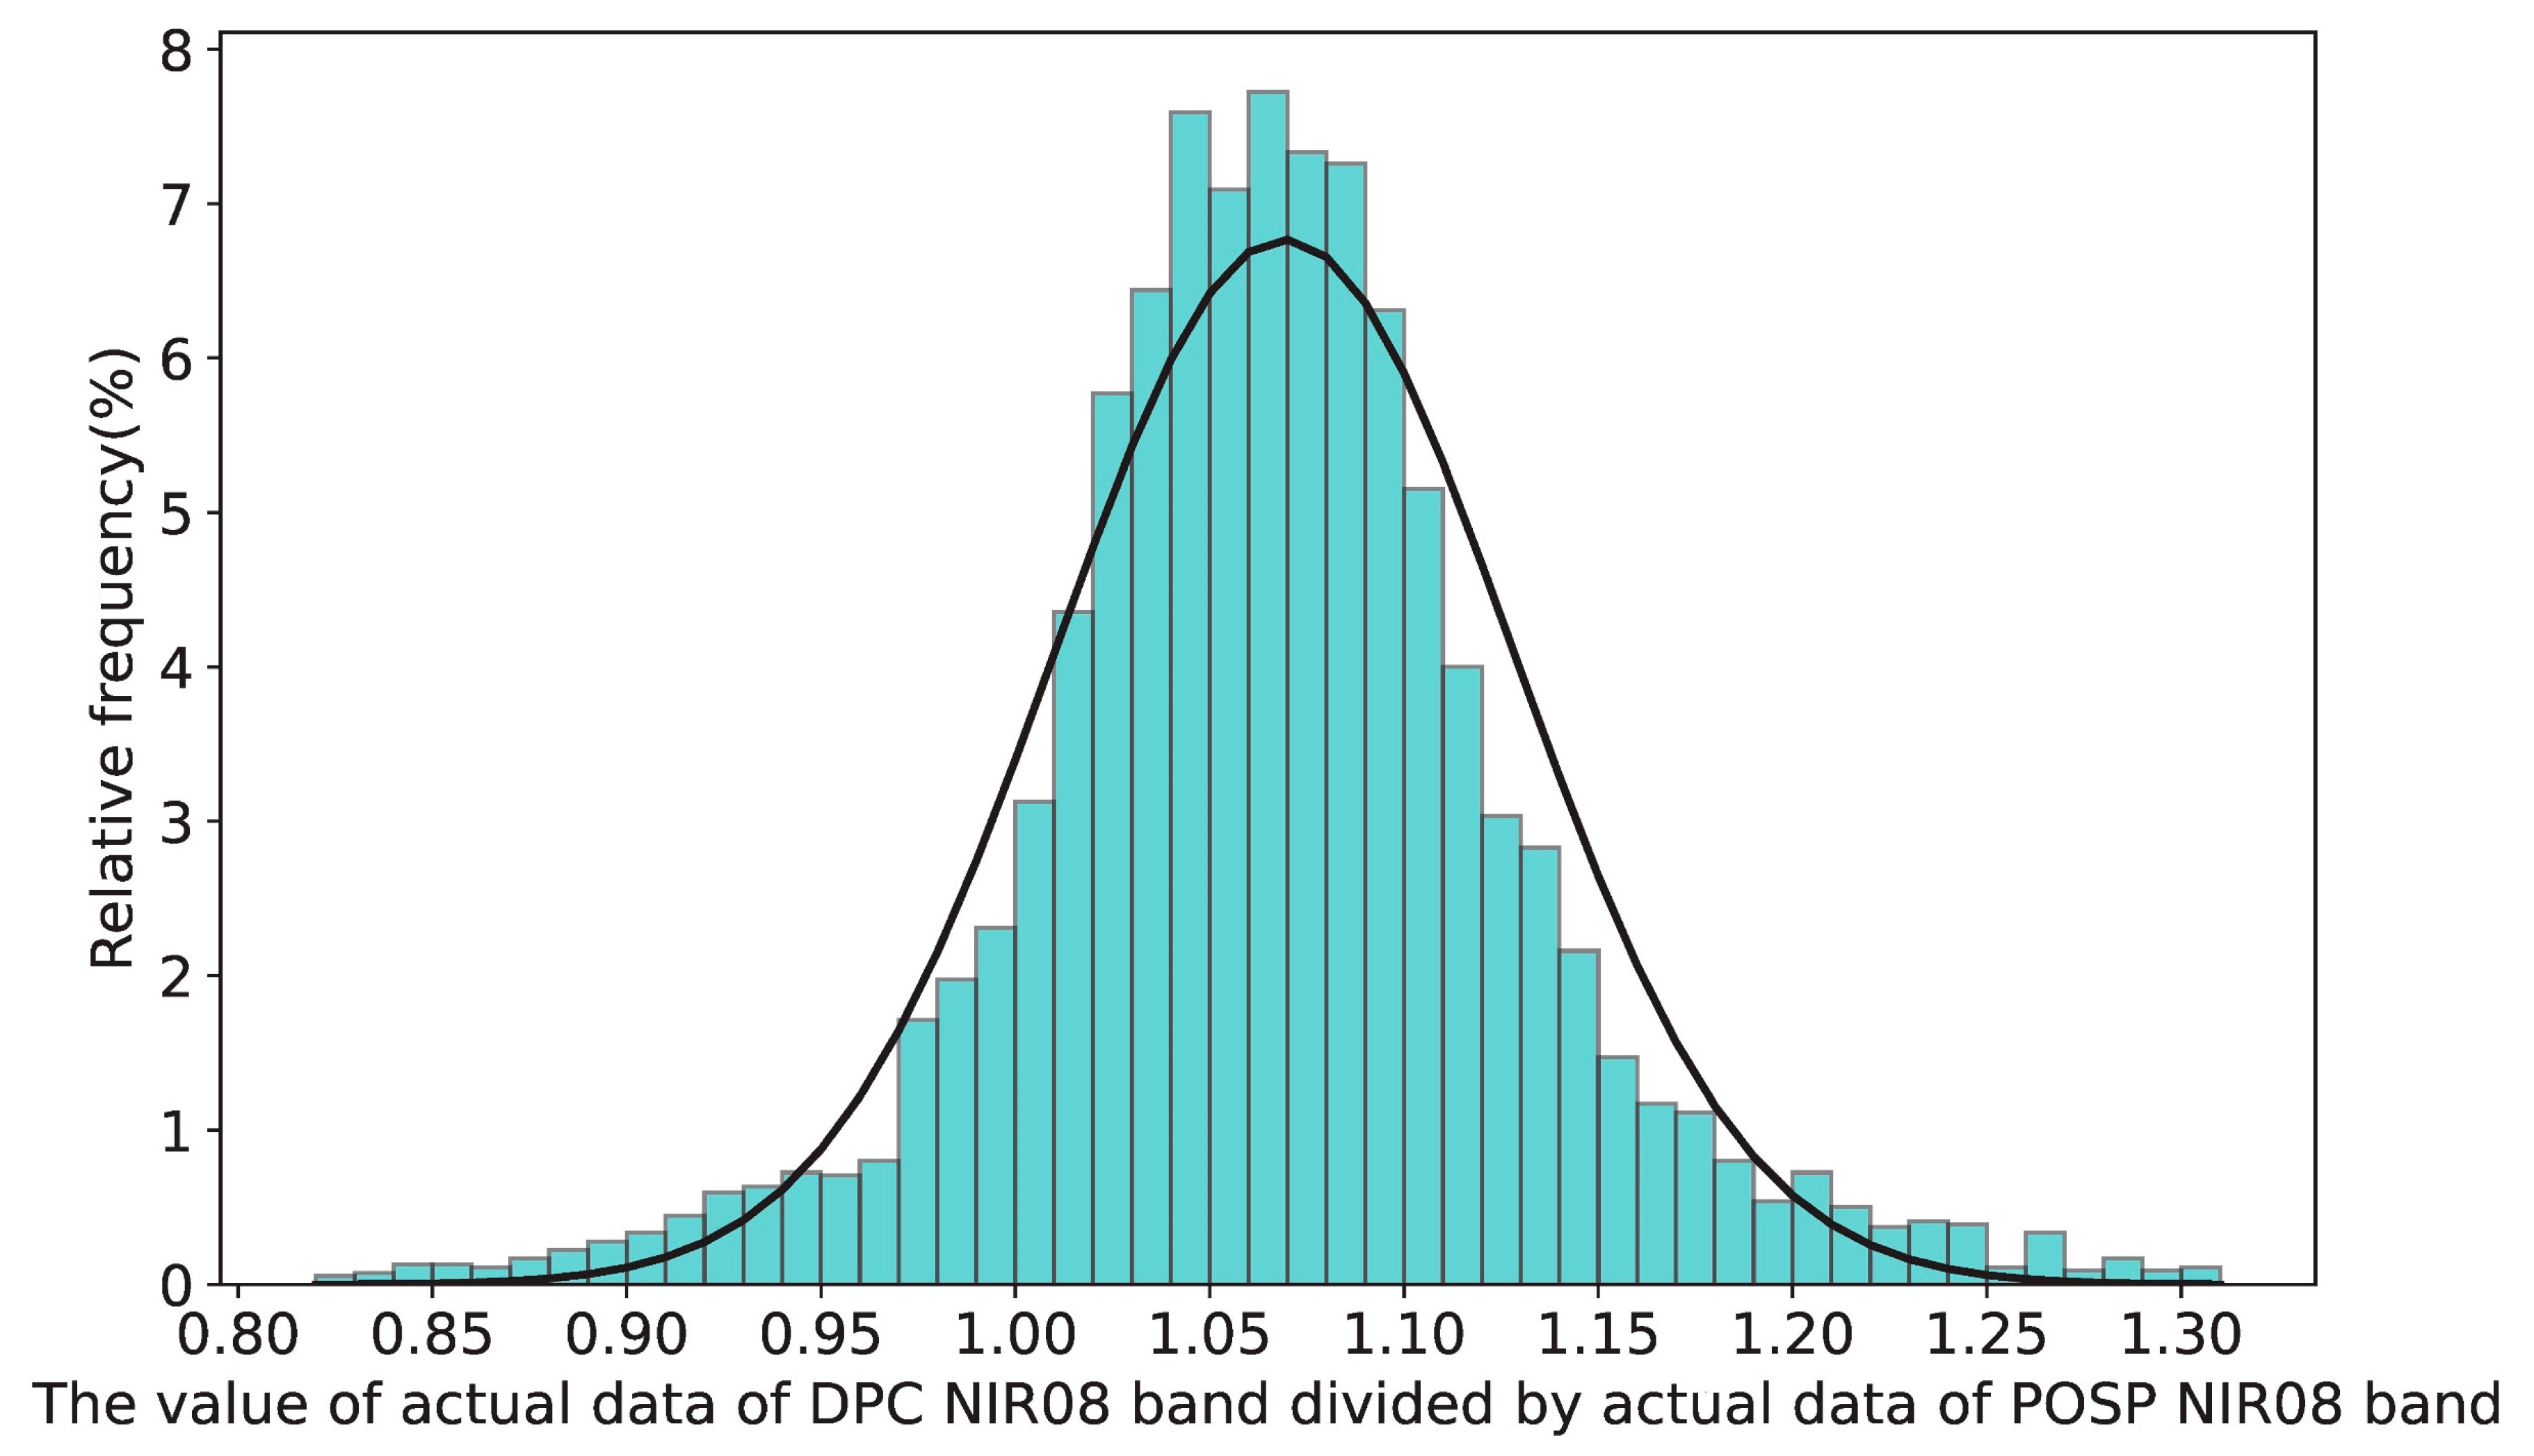
3.1. Radiometric Calibration of the DPC at the NIR08 Band

The data of the 865 nm band of the POSP is used for radiometric calibration of the 865 nm band of the DPC. Due to the fact that the SRFs of the bands at 865 nm for the DPC and POSP are not completely consistent, it is necessary to determine the conversion relationship between the observation data of these two bands before radiometric calibration. In this study, we first use spectral data from typical ground objects (such as rocks, vegetation, and bare soil) and the SRFs of POSP and DPC to determine the surface reflectance of these two bands under different conditions. For any spectral curve (referred to as curve X), the surface reflectance of any band of either the DPC or POSP (referred to as band X) can be calculated using Equation (1) [17]. The spectral reflectance data used are illustrated in Figure 3 [18].
ρ = λ 1 λ 2 S λ × ρ λ d λ λ 1 λ 2 S λ d λ ,
where ρ is the surface reflectance of band X; λ 1 and λ 2 represent the starting and ending wavelengths corresponding to the spectral response function of band X; S λ represents the response of band X at the wavelength equal to λ ; ρ λ denotes the reflectance of curve X at the wavelength equal to λ .
Then, we would use RTM to simulate the observations of these two bands under different aerosol contents (range of AOD at 550 nm: 0–1.5, interval: 0.3), relative azimuth angle (range: 0–360°, interval: 20°), satellite zenith angle (range: 0–70°, interval: 10°) and solar zenith angle (range: 0–70°, interval: 10°). After that, a linear transformation relationship between the observations of the 865 nm band of the DPC after radiometric calibration and the observations of the 865 nm band of the POSP can be determined. Subsequently, we can use the actual observations of the 865 nm band of the POSP to simulate the observations without systematic radiometric calibration error of the 865 nm band of the DPC, and finally calculate the radiometric calibration coefficient of the 865 nm band of the DPC (referred to as k1), according to Equation (2).
k 1 = i = 1 N R 865   n m ,   i / R 865   n m ,   i N ,
where N denotes the count of valid matching results between the observations of DPC and POSP, R 865   n m ,   i is the i-th observation of the 865 nm band of the DPC simulated using the observation data of POSP, and R 865   n m ,   i is the actual observation of the 865 nm band of the DPC with systematic calibration error corresponding to R 865   n m ,   i .
Since the observation times of the DPC and POSP are not equal at all pixels, it is necessary to match DPC and POSP data before calibrating the 865 nm band of the DPC using the observations of the 865 nm band of the POSP. The valid matching results between POSP and DPC data at any given location requires that the following requirements are met: (1) the differences in satellite zenith angle and solar zenith angle between DPC and POSP data are less than 0.005 degrees; (2) the time difference in the observations between DPC and POSP should be less than 5 min. To mitigate the potential negative impact of outliers on the calibration results, we would sort the ratio of R 865   n m to R 865   n m , and the matching results of R 865   n m and R 865   n m corresponding to the top 2% and bottom 2% of the data are not utilized in Equation (2).

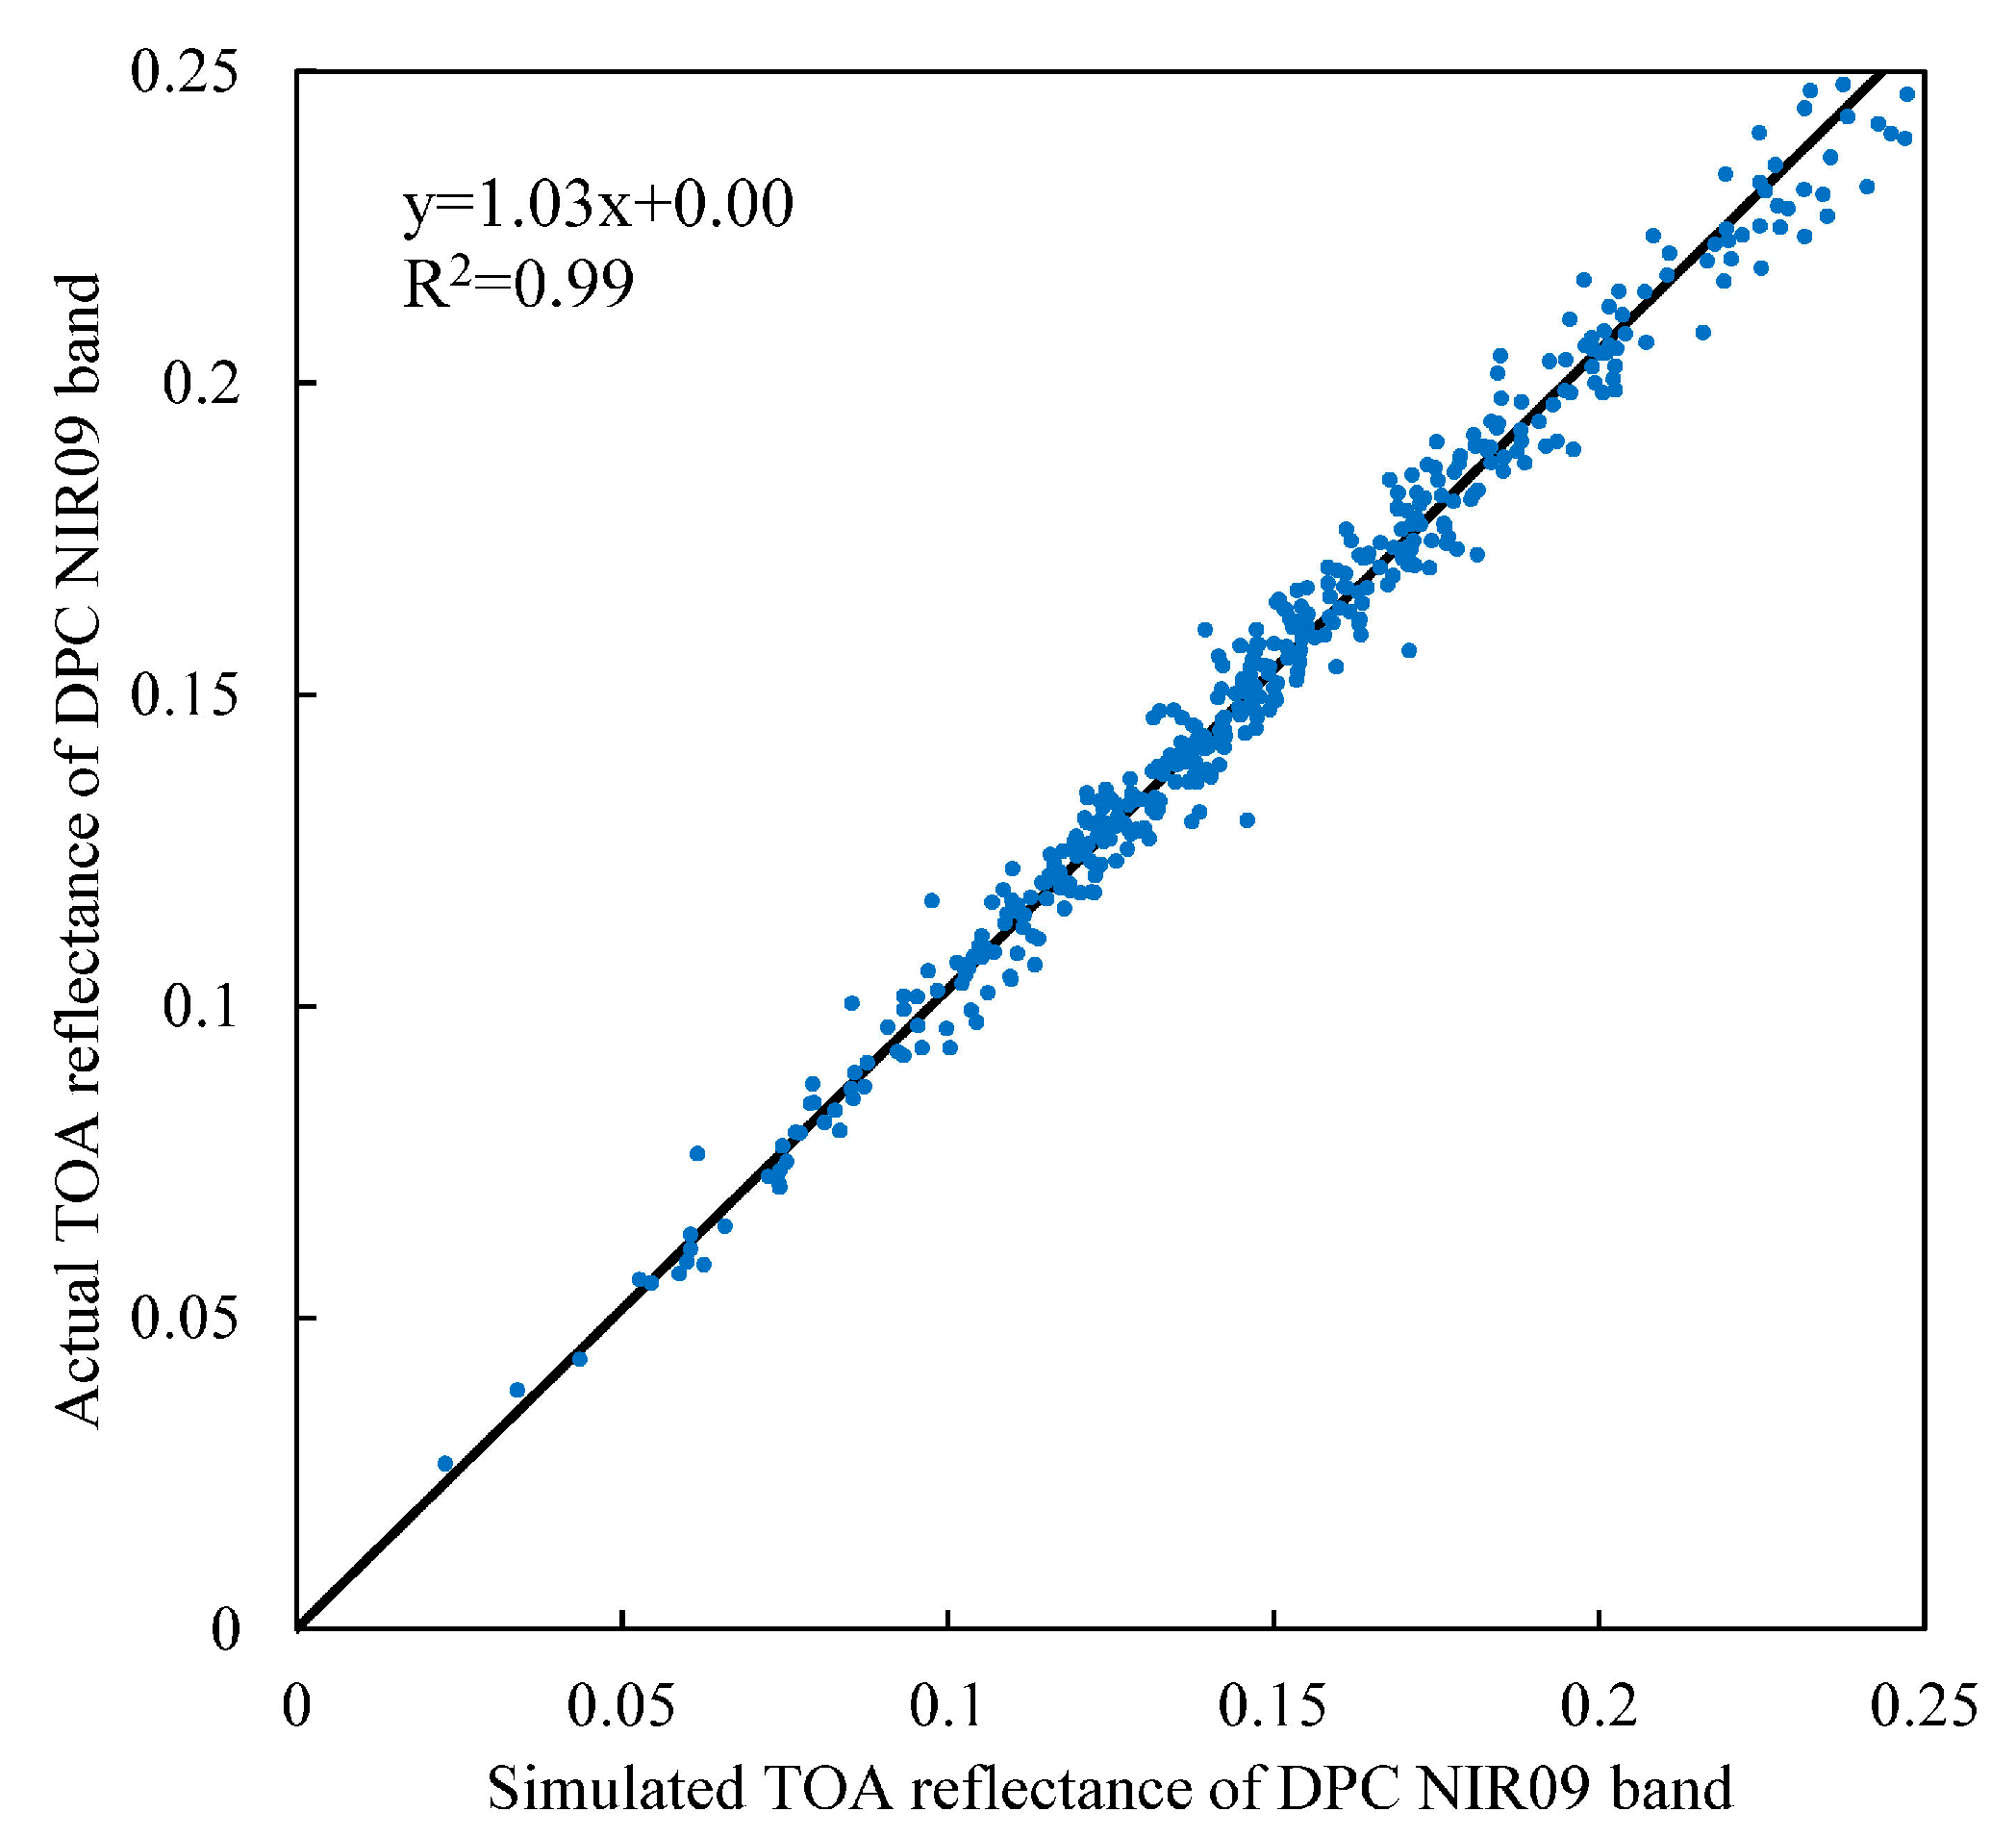
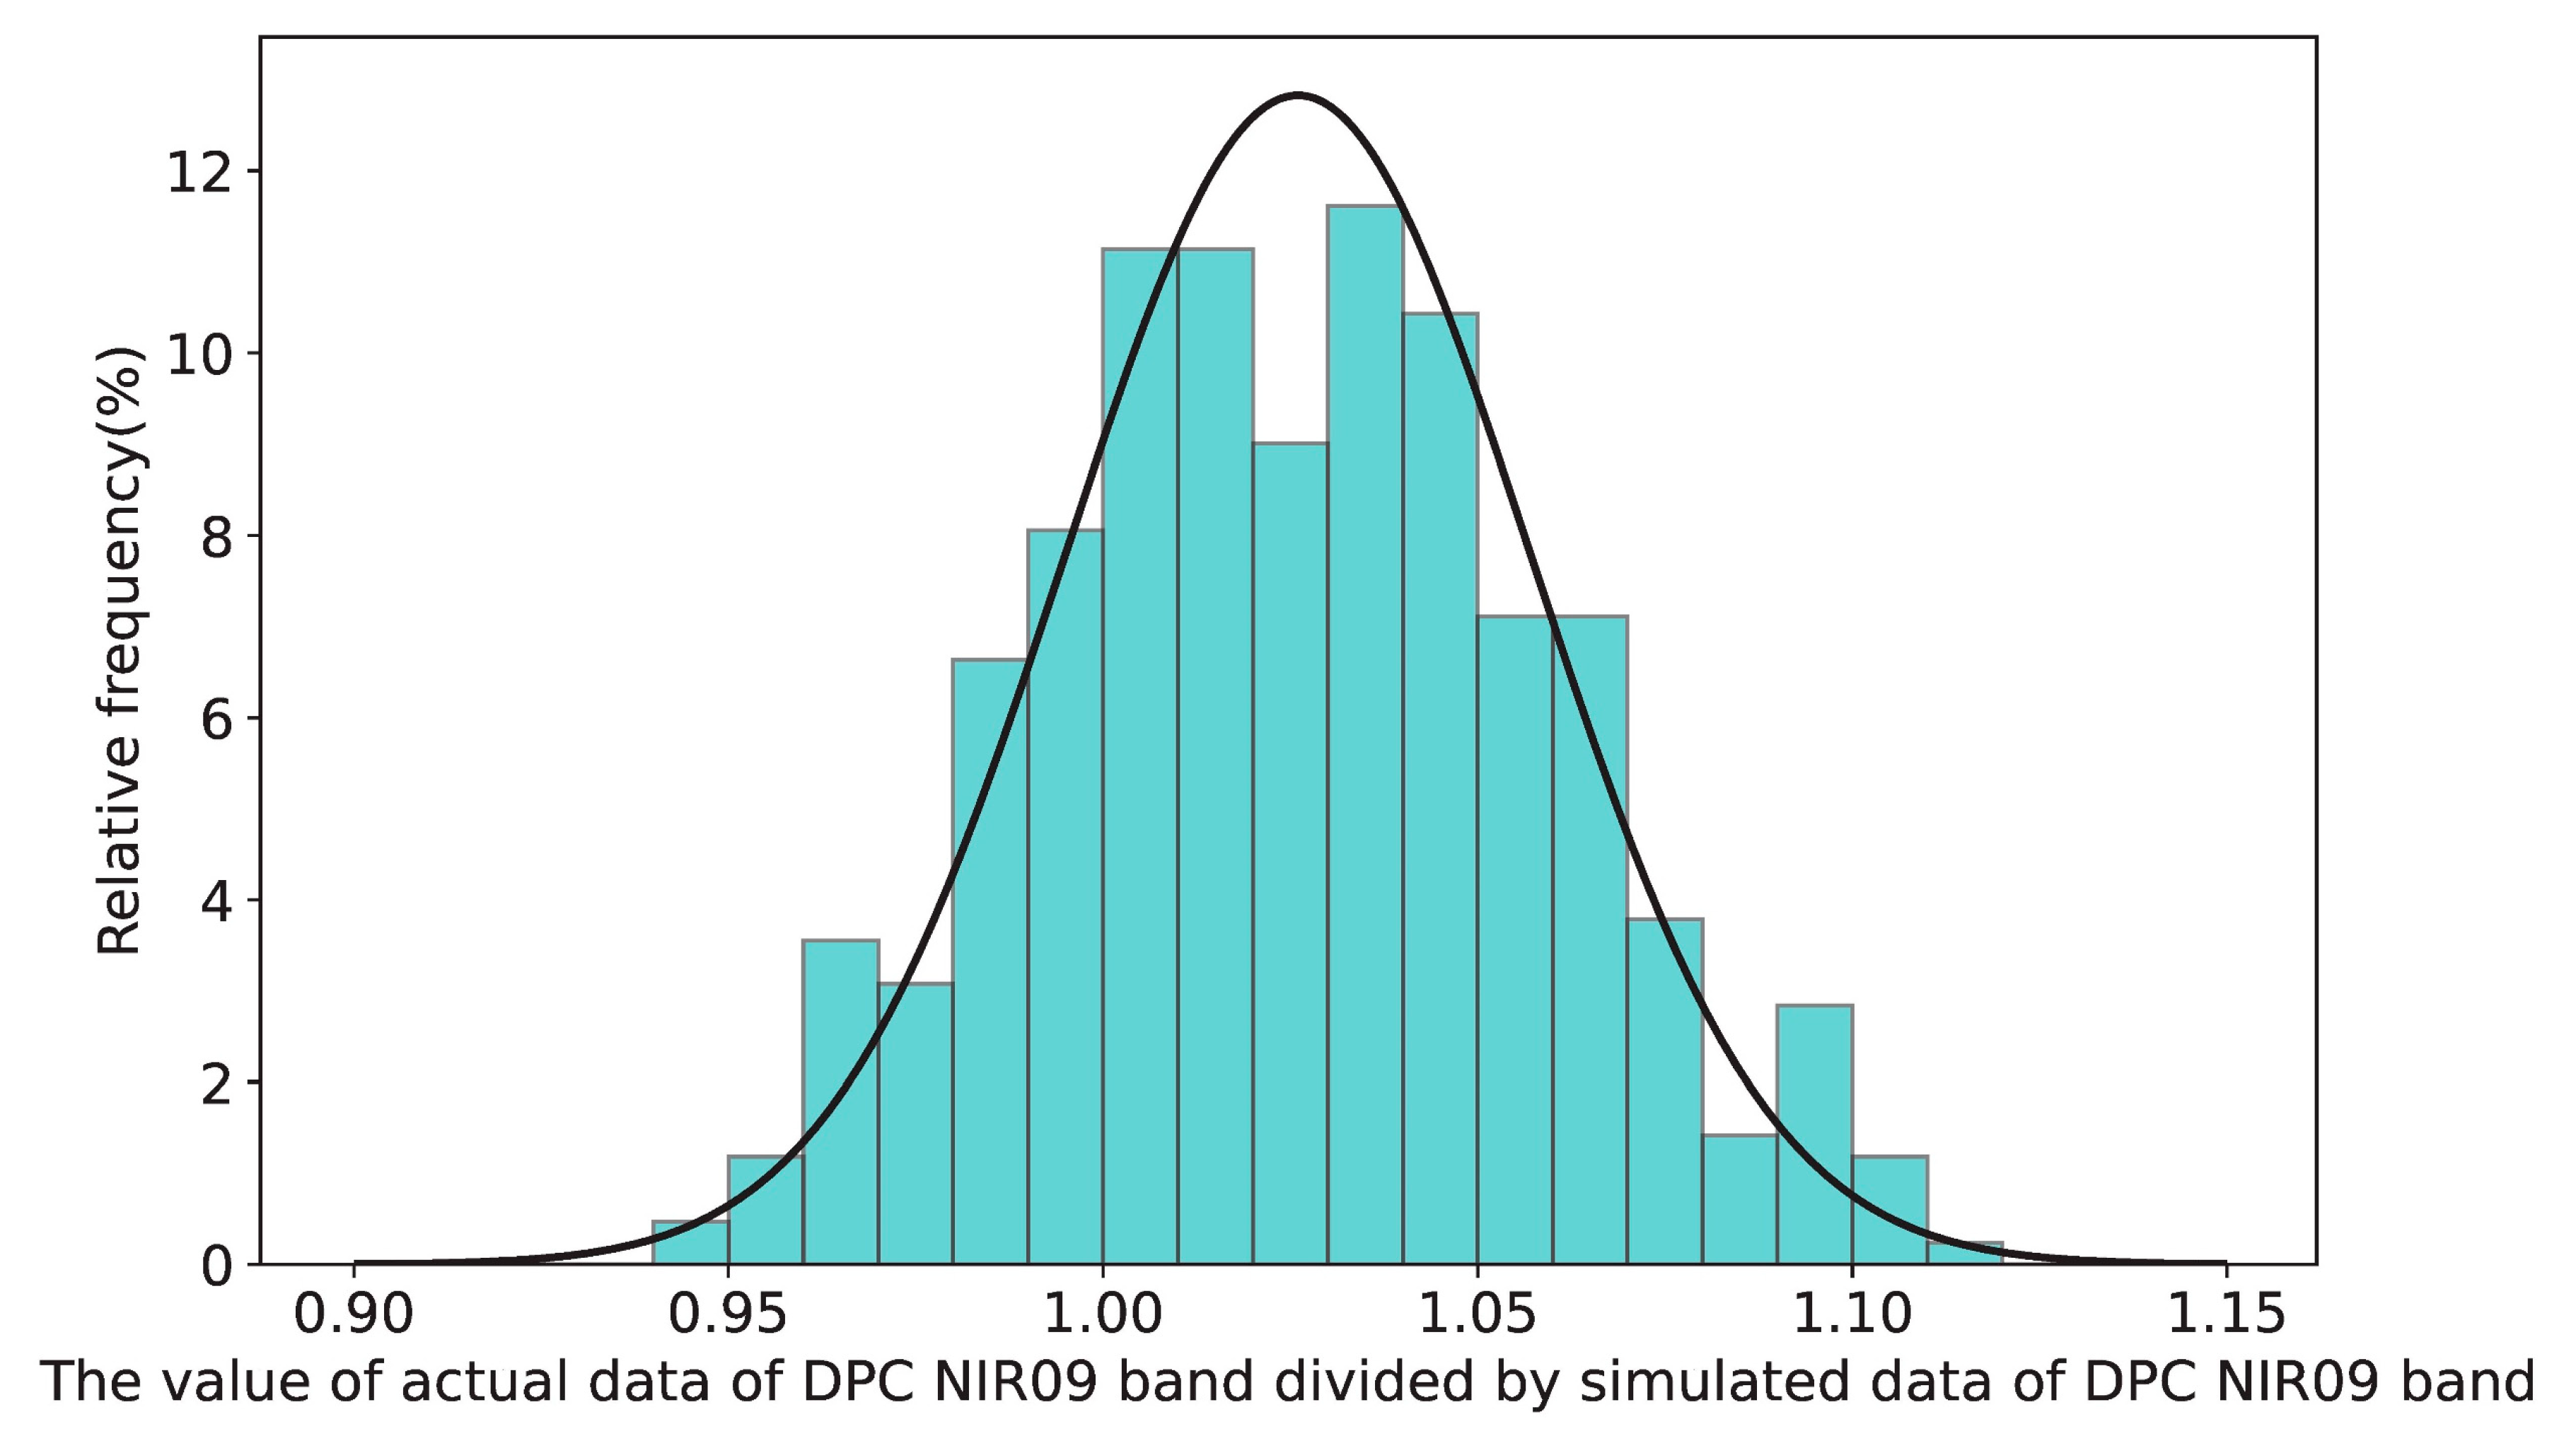
3.2. Radiometric Calibration of the DPC at the NIR09 Band

In this study, the TOA reflectance of the calibrated 865 nm band of the DPC is used to perform radiometric calibration of the 910 nm band of the DPC. When water vapor absorption is not considered, the TOA reflectance observed by the calibrated 865 nm and 910 nm bands of the DPC at the same time and location are equal. Therefore, the conversion relationship between the TOA reflectance of the calibrated 865 and 910 nm bands of the DPC can be expressed using Equation (3). The T in Equation (3) represents the WVAT of the 910 nm band of the DPC. This is equal to the value of the TOA reflectance of the calibrated 910 nm band of the DPC divided by the TOA reflectance of the calibrated 865 nm band of the DPC, and is negatively correlated with the PWV content. This means that before calibrating the 910 nm band of the DPC, it is necessary to calculate the WVAT of the band at 910 nm for all pixels involved in the calibration.
It is important to note that the WVAT of the band at 910 nm corresponding to any pixel can be calculated by inputting the satellite zenith angle, solar zenith angle, and water vapor content into an RTM. Since water vapor content is required for calculating WVAT, only the matching results between DPC data and ground-based PWV data are used for the radiometric calibration of the 910 nm band of the DPC, rather than all DPC data. As mentioned above, 70% of the matching results between the DPC data and AERONET PWV data are used for the calibration of the band at 910 nm. For any pixel participating in the calibration of the 910 nm band of the DPC, the WVAT of the pixel at the 910 nm band can be calculated by using the RTM according to the observation geometry of DPC and AERONET PWV data. As the observations without systematic error for the 910 nm band of the DPC can be calculated using Equation (3), the radiometric calibration coefficient for the 910 nm band of the DPC (referred to as k2) can be computed using Equation (4).
R 910   n m ,   i = R 865   n m ,   i × T i ,
k 2 = i = 1 N R 910   n m ,   i / R 910   n m ,   i N ,
where N denotes the count of valid matching results between the observations of DPC and AERONET; R 865   n m ,   i is the i-th observation of the calibrated 865 nm band of the DPC; T i is the WVAT of the 910 nm band of the DPC, corresponding to R 865   n m ,   i ; R 910 n m , i represents the observation of the calibrated 910 nm band of the DPC, corresponding to R 865   n m ,   i ; and R 910   n m ,   i is the actual observation of the 910 nm band of the DPC, corresponding to R 910   n m ,   i .

4. Results

4.1. Radiometric Calibration Results of the DPC at the NIR08 Band

The errors in the observations of the 865 nm band of the DPC include both random error and systematic error. It is important to note that random error cannot be corrected, while systematic error can be corrected. In this study, we aim to correct the systematic error in the observation data of the 865 nm band of the DPC by using the observations of the 865 nm band of the POSP, rather than the random error. We use k1 to characterize the systematic bias in the observations of the 865 nm band of the DPC. Due to the very close SRFs of the DPC and POSP at the 865 nm band, and the minimal variation in the spectral reflectance of different ground objects near the wavelength of 865 nm, the surface reflectance of the DPC and POSP at the 865 nm band calculated using Equation (1) is highly correlated (R2 = 1.00). In addition, the analysis results of the simulated TOA reflectance of the POSP and DPC at the 865 nm band under different aerosol contents, observational geometries, and surface types show that the simulated observation of these two bands is highly correlated (R2 = 1.00), and the difference between them can be ignored. In other words, the TOA reflectance observed by the 865 nm band of the POSP and the DPC calibrated at the 865 nm band at the same time and location are equal. This indicates that it is feasible to directly use the observation data of the 865 nm band of the POSP to perform radiometric calibration on the 865 nm band of the DPC.
The matching results between the observations of the POSP and DPC at the 865 nm band are illustrated in Figure 4a. The observations of these two bands are highly correlated (R2 = 0.95). This implies that calibrating the 865 nm band of the DPC using the 865 nm band of the POSP is feasible. The analysis based on the actual observations indicates that the calibration coefficient for the 865 nm band of the DPC (i.e., k1) is 1.07. Due to the negligible impact of random errors in the observations of the 865 nm band of the POSP on the calculation result of k1, we did not consider the influence of the uncertainty of the observations of the 865 nm band of the POSP during the cross-calibration process. Next, we used an experiment to show that the random observation error of the 865 nm band of the POSP only has a negligible effect on the calculation results of k1. We added random errors of 1%, 3%, and 5% to the POSP data, shown in Figure 4a, respectively. The matching results between the POSP data with the added random errors and the DPC data are illustrated in Figure 4b–d. By analyzing Figure 4, it can be found that the calculation result of k1 remains unchanged as the random error of the observations of the POSP increase.
In this work, k1 is used to characterize the systematic bias in the observations of the 865 nm band of the DPC, and is equal to the mean of the ratio between the actual observation of the DPC at the NIR08 band (i.e., R 865 n m ) and the actual observation of the POSP at the NIR08 band (i.e., R 865 n m ). The method used to calculate the uncertainty of k1 is as follows. The distribution of the values of R 865 n m / R 865 n m is shown in Figure 5. The mean (i.e., expected value) and standard deviation of the normal distribution corresponding to R 910   n m / R 910   n m are 1.07 and 0.06, respectively. This indicates that the uncertainty of k1 is 0.06. In addition, the expected value of k1 is 1.07, which is consistent with the above calibration result.

4.2. Radiometric Calibration Results of the DPC at the NIR09 Band

The matching results between the actual observations of the DPC at the NIR09 band and the simulated observations of the DPC at the NIR09 band based on the observations of the recalibrated DPC at the NIR08 band and AERONET PWV data are illustrated in Figure 6. The actual and simulated TOA reflectance of the DPC at the NIR09 band exhibit a high degree of linear correlation, and the radiometric calibration coefficient for the DPC at the NIR09 band (i.e., k2) is 1.03.
In this study, k2 is used to characterize the systematic bias in the observations of the 910 nm band of the DPC, and is equal to the mean of the ratio between the actual observation of the DPC at the NIR09 band (i.e., R 910   n m ) and the simulated observation of the NIR09 band (i.e., R 910   n m ) calculated based on AERONET PWV data and the observations of the 865 nm band of the DPC after radiometric calibration. The method used to calculate the uncertainty of k2 is as follows. The distribution of the values of R 910   n m / R 910   n m is shown in Figure 7. The mean (i.e., expected value) and standard deviation of the normal distribution corresponding to R 910   n m / R 910   n m are 1.03 and 0.03, respectively. This indicates that the uncertainty of k2 is 0.03. In addition, the expected value of k2 is 1.03, which is consistent with the above calibration result.

5. Discussion

Due to the systematic radiometric calibration error present in the bands of the DPC that are used for PWV retrieval, the existing DPC PWV data derived from the observations of the uncalibrated DPC have large errors [5]. In order to reduce the error in the DPC PWV data, the DPC at bands at 865 nm and 910 nm used for PWV retrieval is calibrated in this study. It is of interest to determine whether calibrating the DPC at the NIR08 and NIR09 bands can effectively reduce the retrieval error of DPC PWV data. As mentioned earlier, the matching results between the DPC data and AERONET data are randomly split into two sets in a 7:3 ratio. Among them, 30% of the data would be used for the accuracy evaluation of DPC PWV data. Additionally, SuomiNET PWV data, which are independent of AERONET PWV data, are also utilized to validate the DPC PWV data, so as to achieve a more comprehensive accuracy assessment of the DPC PWV data. The accuracy evaluation results of the DPC PWV data based on ground-based PWV data are illustrated in Figure 8.
The validation results based on the AERONET PWV data show that the relative error (RE) and mean absolute error (MAE) for the DPC PWV data developed using data before calibration (referred to as data M1) are 0.28 and 0.36 cm, respectively; the RE and MAE for the DPC PWV data developed using the data after recalibration (referred to as data M2) are 0.14 and 0.18 cm, respectively. Data M2 exhibited a reduction of about 50% in both the MAE and RE compared to data M1. The validation results based on SuomiNET PWV data show that the RE and MAE for data M1 are 0.24 and 0.21 cm, respectively; the RE and MAE for data M2 are 0.20 and 0.18 cm, respectively. Compared with data M1, data M2 show a 17% decrease in the RE, and a 14% decrease in the MAE. The validation results based on both the SuomiNET PWV data and AERONET PWV data show that the RE and MAE for data M1 are 0.25 and 0.26 cm, respectively; the RE and MAE for data M2 are 0.18 and 0.18 cm, respectively. Compared with data M1, data M2 show a 28% decrease in the RE, and a 31% decrease in the MAE. For ease of description, the accuracy improvement of data M2 relative to data M1 is abbreviated as AI21. Due to the calibration model used for DPC being constructed based on the AERONET PWV data and the difference between the SuomiNET PWV data and AERONET PWV data [19], it is reasonable that the AI21 calculated based on the SuomiNET PWV data is worse than the AI21 calculated based on the AERONET PWV data. However, regardless of whether the AERONET PWV data or the SuomiNET PWV data are used as reference data, the accuracy of data M2 is significantly superior to that of data M1.
The distribution of the absolute errors of the DPC PWV data calculated using both the AERONET PWV data and SuomiNET PWV data is shown in Figure 9. Because of the decreasing sensitivity of the NIR water vapor absorption channel with increasing water vapor content [20], the absolute errors of data M1 and data M2 both increase with the increase in the water vapor content. Overall, data M2 demonstrates smaller absolute errors compared to data M1 across all ranges. In conclusion, the validation results based on both the AERONET and SuomiNET data demonstrate that calibrating the DPC at the 865 nm and 910 nm bands is indeed beneficial for reducing the error of the DPC PWV data. In addition to the DPC, there are several sensors with NIR bands used for PWV retrieval, such as MERSI and MODIS. Due to systematic calibration errors in the sensors, the official MERSI PWV data and MODIS PWV data also exhibit significant error [12,21]. In the future, the calibration method developed for DPC at NIR bands can also be applied to the above sensors to reduce the retrieval error of existing PWV data.

6. Conclusions

Water vapor is a key detection parameter of the DPC onboard the GF-5-02 satellite. Recently, researchers have developed a PWV retrieval algorithm for the near-infrared bands (865, 910 nm). However, due to the lack of timely radiometric calibration for the DPC, there are large errors in the existing DPC PWV data. To solve this problem, a radiometric calibration method is developed for the two NIR bands. The NIR08 band of the DPC is calibrated through a cross-calibration method, and the NIR09 band of the DPC is calibrated based on the calibration result of the NIR08 band and AERONET data. The above method effectively solves the problem of the lack of a calibration method for the NIR WVA band at 910 nm of the DPC. The calibration results show that both channels of the DPC used for PWV retrieval have systematic calibration errors. The validation results based on ground-based PWV data show that calibrating these two bands can greatly reduce the error of DPC PWV data. Compared to DPC PWV data derived from the uncalibrated DPC, the RE and MAE for PWV data derived from the DPC after calibration is reduced by at least 14%. This means that the in-orbit calibration method developed in this study is effective in enhancing the quality of DPC data.

Author Contributions

Conceptualization, Y.X., Q.Z., S.Z., W.H., L.Z., X.L., M.Z., Y.L., Z.L. (Zhenhai Liu), Y.W. and Z.L. (Zhengqiang Li); methodology, Y.X. and S.Z.; validation, Y.X.; writing, Y.X., S.Z. and W.H.; funding acquisition, Y.X., S.Z. and Z.L. (Zhengqiang Li). All authors have read and agreed to the published version of the manuscript.

Funding

This research was funded by the National Outstanding Youth Foundation of China (No. 41925019), the National Natural Science Foundation of China (No. 42301463, 42305155), and the Dreams Foundation of Jianghuai Advance Technology Center (No. 2023-ZM01K007).

Data Availability Statement

AERONET data, SuomiNET data, and DPC data are provided by AERONET, SuomiNET, and China Centre for Resources Satellite Data and Application, respectively. The original contributions presented in the study are included in the article, further inquiries can be directed to the corresponding author.

Acknowledgments

The author thanks AERONET and SuomiNET for providing the ground-based PWV data.

Conflicts of Interest

The authors declare no conflicts of interest.

References

  1. Han, Y.F.; Shi, H.L.; Li, Z.W.; Luo, H.Y.; Ding, Y.; Xiong, W.; Hu, Z.Z. Greenhouse gas monitoring instrument on the GF-5 satellite-II: On-orbit spectral calibration. Appl. Opt. 2023, 62, 5839–5849. [Google Scholar] [CrossRef]
  2. Shi, Z.; Xie, Y.S.; Li, Z.Q.; Zhang, Y.; Chen, C.; Mei, L.L.; Xu, H.; Wang, H.F.; Zheng, Y.; Liu, Z.H.; et al. A generalized land surface reflectance reconstruction method for aerosol retrieval: Application to the Particulate Observing Scanning Polarimeter (POSP) onboard GaoFen-5 (02) satellite. Remote Sens. Environ. 2023, 295, 113683. [Google Scholar] [CrossRef]
  3. Cazorla, M.; Giles, D.M.; Herrera, E.; Suárez, L.; Estevan, R.; Andrade, M.; Bastidas, A. Latitudinal and temporal distribution of aerosols and precipitable water vapor in the tropical Andes from AERONET, sounding, and MERRA-2 data. Sci. Rep. 2024, 14, 897. [Google Scholar] [CrossRef]
  4. Xu, J.F.; Liu, Z.Z. Water vapour products from ERA5, MERSI-II/FY-3D, OLCI/Sentinel-3A, OLCI/Sentinel-3B, MODIS/Aqua and MODIS/Terra in Australia: A comparison against in situ GPS water vapour data. Q. J. R. Meteorol. Soc. 2023, 149, 1435–1458. [Google Scholar] [CrossRef]
  5. Wang, C.; Shi, Z.; Xie, Y.Q.; Luo, D.G.; Li, Z.Q.; Wang, D.C.; Chen, X.N. Precipitable Water Vapor Retrieval Based on DPC Onboard GaoFen-5 (02) Satellite. Remote Sens. 2023, 15, 94. [Google Scholar] [CrossRef]
  6. Chen, F.N.; Fan, Y.Z.; Hong, J.; Huang, C.; Li, S.; Yang, B.Y.; Tu, B.H.; Han, L.; Sun, B. In-Flight Radiation Calibration of a Directional Polarimetric Camera at Visible Bands Onboard GF-5. Acta Opt. Sin. 2020, 40, 2328001. [Google Scholar] [CrossRef]
  7. Zhu, S.; Li, Z.; Qie, L.; Xu, H.; Ge, B.; Xie, Y.; Qiao, R.; Xie, Y.; Hong, J.; Meng, B.; et al. In-Flight Relative Radiometric Calibration of a Wide Field of View Directional Polarimetric Camera Based on the Rayleigh Scattering over Ocean. Remote Sens. 2022, 14, 1211. [Google Scholar] [CrossRef]
  8. Qie, L.L.; Li, Z.Q.; Zhu, S.F.; Xu, H.; Xie, Y.S.; Qiao, R.; Hong, J.; Tu, B.H. In-flight radiometric and polarimetric calibration of the Directional Polarimetric Camera onboard the GaoFen-5 satellite over the ocean. Appl. Opt. 2021, 60, 7186–7199. [Google Scholar] [CrossRef] [PubMed]
  9. Zhu, S.F.; Qie, L.L.; Xie, H.; Xie, Y.Q.; Li, Z.Q.; Xie, Y.S.; Ge, B.Y.; Li, K.T. In-Flight Cross Radiometric Calibration of DPC/GaoFen-5 and MODIS/Aqua. Acta Opt. Sin. 2022, 42, 1828008. [Google Scholar] [CrossRef]
  10. Wang, L.; Hu, X.; Chen, L. FY-3C/MERSI caliration for solar band using multi-reflectance stable targets. Opt. Precis. Eng. 2015, 23, 1911–1920. [Google Scholar] [CrossRef]
  11. Li, Z.Q.; Xie, Y.Q.; Hou, W.Z.; Liu, Z.H.; Bai, Z.G.; Hong, J.; Ma, Y.; Huang, H.L.; Lei, X.F.; Sun, X.B.; et al. In-Orbit Test of the Polarized Scanning Atmospheric Corrector (PSAC) Onboard Chinese Environmental Protection and Disaster Monitoring Satellite Constellation HJ-2 A/B. IEEE Trans. Geosci. Remote Sens. 2022, 60, 4108217. [Google Scholar] [CrossRef]
  12. Xie, Y.; Hu, Z.; Hou, W.; Zhang, M.; Wang, Z.; Zhang, L.; Wen, Y.; Zhou, A.; Yuan, M.; Chang, Y.; et al. High-accuracy FY-3A/MERSI precipitable water vapour (PWV) data over the continental United States. Int. J. Remote Sens. 2024, 45, 1368–1384. [Google Scholar] [CrossRef]
  13. Lei, X.; Liu, Z.; Tao, F.; Dong, H.; Hou, W.; Xiang, G.; Qie, L.; Meng, B.; Li, C.; Chen, F.; et al. Data Comparison and Cross-Calibration between Level 1 Products of DPC and POSP Onboard the Chinese GaoFen-5(02) Satellite. Remote Sens. 2023, 15, 1933. [Google Scholar] [CrossRef]
  14. Holben, B.N.; Eck, T.F.; Slutsker, I.; Tanre, D.; Buis, J.P.; Setzer, A.; Vermote, E.; Reagan, J.A.; Kaufman, Y.J.; Nakajima, T.; et al. AERONET—A federated instrument network and data archive for aerosol characterization. Remote Sens. Environ. 1998, 66, 1–16. [Google Scholar] [CrossRef]
  15. Ware, R.H.; Fulker, D.W.; Stein, S.A.; Anderson, D.N.; Avery, S.K.; Clark, R.D.; Droegemeier, K.K.; Kuettner, J.P.; Minster, J.B.; Sorooshian, S. SuomiNet: A real-time national GPS network for atmospheric research and education. Bull. Am. Meteorol. Soc. 2000, 81, 677–694. [Google Scholar] [CrossRef]
  16. Bloshchinskiy, V.D.; Filei, A.A.; Kholodov, E.I. Retrieval of Total Column Water Vapor from Electro-L No. 3 Satellite Data Using Neural Networks. Atmos. Ocean. Opt. 2022, 35, 72–76. [Google Scholar] [CrossRef]
  17. Wang, Z.; Xin, J.; Jia, S.; Li, Q.; Chen, L.; Zhao, S. Retrieval of AOD from GF-1 16 m camera via DDV algorithm. J. Remote Sens. 2015, 19, 530–538. [Google Scholar]
  18. Hou, W.; Li, Z.; Yang, D.; Wang, S.; Xu, H. Hyperspectral and multispectral remote sensing of aerosols based on surface spectral reconstruction by PCA. In Proceedings of the Seventh Symposium on Novel Photoelectronic Detection Technology and Application 2020, Kunming, China, 5–7 November 2020; p. 84. [Google Scholar] [CrossRef]
  19. Xie, Y.; Zhang, M.; Wang, Z.; Wen, Y.; Zhang, L.; Li, Y.; Hou, W.; Liu, Z.; Hong, J.; Lei, X.; et al. Performance of the Semi-empirical Precipitable Water Vapor Retrieval Algorithm Developed for Polarized Scanning Atmospheric Corrector (PSAC) in the Presence of Sensor Decay. IEEE Trans. Geosci. Remote Sens. 2023, 61, 4104411. [Google Scholar] [CrossRef]
  20. Wang, L.; Hu, X.Q.; Xu, N.; Chen, L. Water Vapor Retrievals from Near-infrared Channels of the Advanced Medium Resolution Spectral Imager Instrument onboard the Fengyun-3D Satellite. Adv. Atmos. Sci. 2021, 38, 1351–1366. [Google Scholar] [CrossRef]
  21. He, J.; Liu, Z. Comparison of Satellite-Derived Precipitable Water Vapor Through Near-Infrared Remote Sensing Channels. IEEE Trans. Geosci. Remote Sens. 2019, 57, 10252–10262. [Google Scholar] [CrossRef]
Figure 1. The SRFs of the 865 nm bands of the DPC and POSP and the 910 nm band of the DPC.
Remotesensing 16 01806 g001
Figure 2. Geographical distribution of AERONET and SuomiNET sites. Each solid blue dot represents an AERONET site, and each solid red dot represents a SuomiNET site.
Remotesensing 16 01806 g002
Figure 3. The spectral reflectance data of typical ground objects. Each curve in subfigure (a) represents the spectral reflectance of bare soil at different wavelengths; each curve in subfigure (b) represents the spectral reflectance of vegetation at different wavelengths; and each curve in subfigure (c) represents the spectral reflectance of a rock at different wavelengths.
Remotesensing 16 01806 g003aRemotesensing 16 01806 g003b
Figure 4. Matching results between the actual TOA reflectance data of the DPC at the NIR08 band and the TOA reflectance data of the POSP at the NIR08 band. (a) Actual TOA reflectance data of the POSP at the NIR08 band. (b) TOA reflectance data of the POSP at the NIR08 band after adding 1% random error. (c) TOA reflectance data of the POSP at the NIR08 band after adding 3% random error. (d) TOA reflectance data of the POSP at the NIR08 band after adding 5% random error.
Remotesensing 16 01806 g004
Figure 5. The distribution of the values of R 865 n m / R 865 n m . The black line represents the normal distribution function corresponding to R 865 n m / R 865 n m .
Remotesensing 16 01806 g005
Figure 6. Matching results between the simulated and actual TOA reflectance data of the 910 nm band of the DPC.
Remotesensing 16 01806 g006
Figure 7. The distribution of the values of R 910 n m / R 910 n m . The black line represents the normal distribution function corresponding to R 910 n m / R 910 n m .
Remotesensing 16 01806 g007
Figure 8. Validation results of PWV data retrieved using DPC data before and after radiometric calibration. (a) Validation results of data M1 based on AERONET data. (b) Validation results of data M2 based on AERONET data. (c) Validation results of data M1 based on SuomiNET data. (d) Validation results of data M2 based on SuomiNET data. (e) Validation results of data M1 based on both SuomiNET and AERONET data. (f) Validation results of data M2 based on both SuomiNET and AERONET data.
Remotesensing 16 01806 g008aRemotesensing 16 01806 g008b
Figure 9. The distribution of the absolute error of DPC PWV data. (a) The distribution of the absolute error of data M1. (b) The distribution of the absolute error of data M2. The dashed line is the linear regression line. The red points are the means for specific ranges of absolute error, and the red lines are the mean ± 2σ (standard deviation) of absolute error in a certain range.
Remotesensing 16 01806 g009
Disclaimer/Publisher’s Note: The statements, opinions and data contained in all publications are solely those of the individual author(s) and contributor(s) and not of MDPI and/or the editor(s). MDPI and/or the editor(s) disclaim responsibility for any injury to people or property resulting from any ideas, methods, instructions or products referred to in the content.

