Article

Winter Durum Wheat Disease Severity Detection with Field Spectroscopy in Phenotyping Experiment at Leaf and Canopy Level

by
Dessislava Ganeva
1,*,
Lachezar Filchev
1,
Eugenia Roumenina
1,
Rangel Dragov
2,
Spasimira Nedyalkova
2 and
Violeta Bozhanova
2
1
Space Research and Technology Institute, Bulgarian Academy of Sciences, Acad. Georgi Bonchev St., Bl. 1, 1113 Sofia, Bulgaria
2
Field Crops Institute, Agricultural Academy, 2 Georgi Dimitrov St., 6200 Chirpan, Bulgaria
*
Author to whom correspondence should be addressed.
Remote Sens. 2024, 16(10), 1762; https://doi.org/10.3390/rs16101762
Submission received: 1 April 2024 / Revised: 12 May 2024 / Accepted: 14 May 2024 / Published: 16 May 2024
(This article belongs to the Special Issue Spectral Imaging Technology for Crop Disease Detection)

Abstract

:
Accurate disease severity assessment is critical for plant breeders, as it directly impacts crop yield. While hyperspectral remote sensing has shown promise for disease severity assessment in breeding experiments, most studies have focused on either leaf or canopy levels, neglecting the valuable insights gained from a combined approach. Moreover, many studies have centered on experiments involving a single disease and a few genotypes. However, this approach needs to accurately represent the challenges encountered in field conditions, where multiple diseases could occur simultaneously. To address these gaps, our current study analyses a combination of diseases, yellow rust, brown rust, and yellow leaf spots, collectively evaluated as the percentage of the diseased leaf area relative to the total leaf area (DA) at both leaf and canopy levels, using hyperspectral data from an ASD field spectrometer. We quantitatively estimate overall disease severity across fifty-two winter durum wheat genotypes categorized into early (medium milk) and late (late milk) groups based on the phenophase. Chlorophyll content (CC) within each group is studied concerning infection response, and a correlation analysis is conducted for each group with nine vegetation indices (VI) known for their sensitivity to rust and leaf spot infection in wheat. Subsequent parametric (linear and polynomial) and nonparametric (partial least squares and kernel ridge) regression analyses were performed using all available spectral bands. We found a significant reduction in Leaf CC (>30%) in the late group and Canopy CC (<10%) for both groups. YROI and LRDSI_1 are the VIs that exhibited notable and strong negative correlations with Leaf CC in the late group, with a Pearson coefficient of −0.73 and −0.72, respectively. Interestingly, spectral signatures between the early and late disease groups at both leaf and canopy levels exhibit opposite trends. The regression analysis showed we could retrieve leaf CC only for the late group, with R2 of 0.63 and 0.42 for the cross-validation and test datasets, respectively. Canopy CC retrieval required separate models for each group: the late group achieved R2 of 0.61 and 0.37 (cross-validation and test), while the early group achieved R2 of 0.48 and 0.50. Similar trends were observed for canopy DA, with separate models for early and late groups achieving comparable R2 values of 0.53 and 0.51 (cross-validation) and 0.35 and 0.36 (test), respectively. All of our models had medium accuracy and tended to overfit. In this study, we analyzed the spectral response mechanism associated with durum wheat diseases, offering a novel crop disease severity assessment approach. Additionally, our findings serve as a foundation for detecting resistant wheat varieties, which is the most economical and environmentally friendly management strategy for wheat leaf diseases on a large scale in the future.

1. Introduction

Winter durum wheat (Triticum turgidum ssp. durum (Desf.) Husnot., 2n = 4x = 28; AABB genome) is a vital crop in agricultural landscapes, providing a robust foundation for global food security. Despite constituting less than 10% of global wheat production [1], its economic significance is notable due to its distinctive traits and role in producing essential food items like pasta and other food products (macaroni, couscous, bulgur, and bread).
A critical issue impacting winter durum wheat production is the appearance of pathogens that cause diseases, leading to a decrease in the yield and quality of the grain [2,3]. Yellow leaf spot or tan spot is an economically significant disease occurring in most wheat-growing regions worldwide that causes considerable damage and losses in yield and crop quality. The negative effect on wheat plants is mainly due to reduced photosynthetic area and accelerated leaf senescence [4]. Recently, leaf spots on wheat have been observed more and more often in Bulgaria. Their increased economic importance is due to: the introduction of high-yielding, low-stemmed, sensitive wheat varieties; changes in crop cultivation technology; the increased use of nitrogen fertilizers; and the lag in the use of genetic resistance compared to increased resistance to other foliar pathogens [5,6,7,8,9]. Moreover, new pathogenic strains have emerged with the introduction of foreign varieties. Regrettably, the indigenous Bulgarian varieties lack resistance to these newly identified strains, leading to a noticeable escalation in pathogen prevalence since 2005–2006 [10].
Pathogens such as brown rust, yellow rust, and leaf spots on durum wheat, Figure 1, manifest annually to varying degrees [11].
In the breeding process, alongside all qualitative and quantitative indicators crucial for genotype selection, the manifestation of resistance to pathogens is of great importance. Timely and accurate disease severity detection becomes paramount in effectively managing these threats. Providing such information to breeders, whether brown rust, yellow rust, or leaf spots have appeared, allows them to react promptly for timely observation and marking of genotypes in the field. These three pathogens manifest at different times during the vegetation period depending on meteorological conditions, from late autumn to early spring, continuing until harvest. Traditional disease detection methods, such as visual inspection by plant breeders, often involve laborious field surveys and extensive laboratory analyses. These methods, while established, are time-consuming and may not offer the immediacy required for timely intervention. In recent years, advancements in spectroscopic technologies have opened new avenues for rapid and precise crop health assessment. Leveraging the power of field and laboratory spectroscopy presents a promising opportunity to advance disease severity detection and monitoring in winter durum wheat.
Spectroscopy enables a fast, affordable, and powerful approach for disease detection and severity estimation, both in controlled laboratory settings [14,15,16,17] and directly in the field wheat infected with rust and leaf spots experiences a significant decrease in crop photosynthesis, transpiration, stomatal conductance, leaf area index, changes in leaf moisture and pigment levels, and a reduction of dry matter accumulation [18,19,20]. These physiological and biochemical alterations, including reduced chlorophyll content and disrupted cell structure, lead to distinctive changes in the spectral reflectance of the infected leaves, making them detectable through spectroradiometry and remote sensing techniques [21,22,23]. Consequently, wheat canopies under disease stress exhibit altered spectral properties related to pigmentation, moisture, and biomass. These changes are reflected in specific spectral reflectance bands and derived vegetation indices (VIs) associated with crop growth, such as plant growth status, vegetation coverage, and pigment content [19,24,25]. Based on these established associations, hyperspectral data can effectively be utilized for wheat rust detection and monitoring.
Numerous studies have focused on disease severity assessment using spectral data, primarily through regression analysis at either leaf [14,26] or canopy level [19,21,27]. Alternatively, some studies initially aimed at disease detection by distinguishing healthy from diseased leaves before proceeding to disease severity assessment at the leaf level [28,29,30]. Other studies solely considered disease detection, employing classification techniques at leaf [23,26,31,32] and canopy levels [33,34,35,36].
Studying winter durum wheat disease severity detection with both canopy and leaf spectroscopy in phenotyping experiments offers several advantages over studies focusing solely on one approach. Firstly, combining canopy and leaf spectroscopy provides a more comprehensive understanding of disease dynamics across different spatial scales. Assessing disease severity at the canopy level provides insights into the overall health and productivity of the crop within the field. On the other hand, leaf spectroscopy allows for finer-scale assessments of disease symptoms at the individual leaf level, providing detailed information on disease progression and variation within the crop population. While some studies have explored disease severity detection using both canopy and leaf spectroscopy, they remain relatively scarce [18,37]. These studies have demonstrated promising outcomes for single-disease detection at both leaf and canopy levels. However, crops in field conditions frequently encounter multiple diseases concurrently. This calls for additional investigation to ascertain the efficacy of hyperspectral reflectance data in such complex scenarios. Additionally, to our knowledge, our study is the first conducted under field natural conditions with a large number (fifty-two) of genotypes exhibiting significant variation in their response to the pathogens.
Regressions employing parametric functions or nonparametric algorithms offer viable avenues for assessing disease severity. These algorithms use independent variables such as VIs [27,35], spectral features like the maximum of first derivatives within specific spectrum regions [29], wavelets [38,39], texture information [28,40], or a combination thereof. However, it is worth noting that machine learning algorithms coupled with dimensionality reduction methods could directly handle the hyperspectral data [41,42,43].
With this study, we aimed to automate the assessment of yellow rust, brown rust, and leaf spot diseases in a comprehensive plant breeding field trial under natural conditions. High-throughput phenotyping data obtained from canopy and leaf spectroscopy was integrated with parametric regression and advanced machine learning regression techniques to achieve this.

2. Materials and Methods

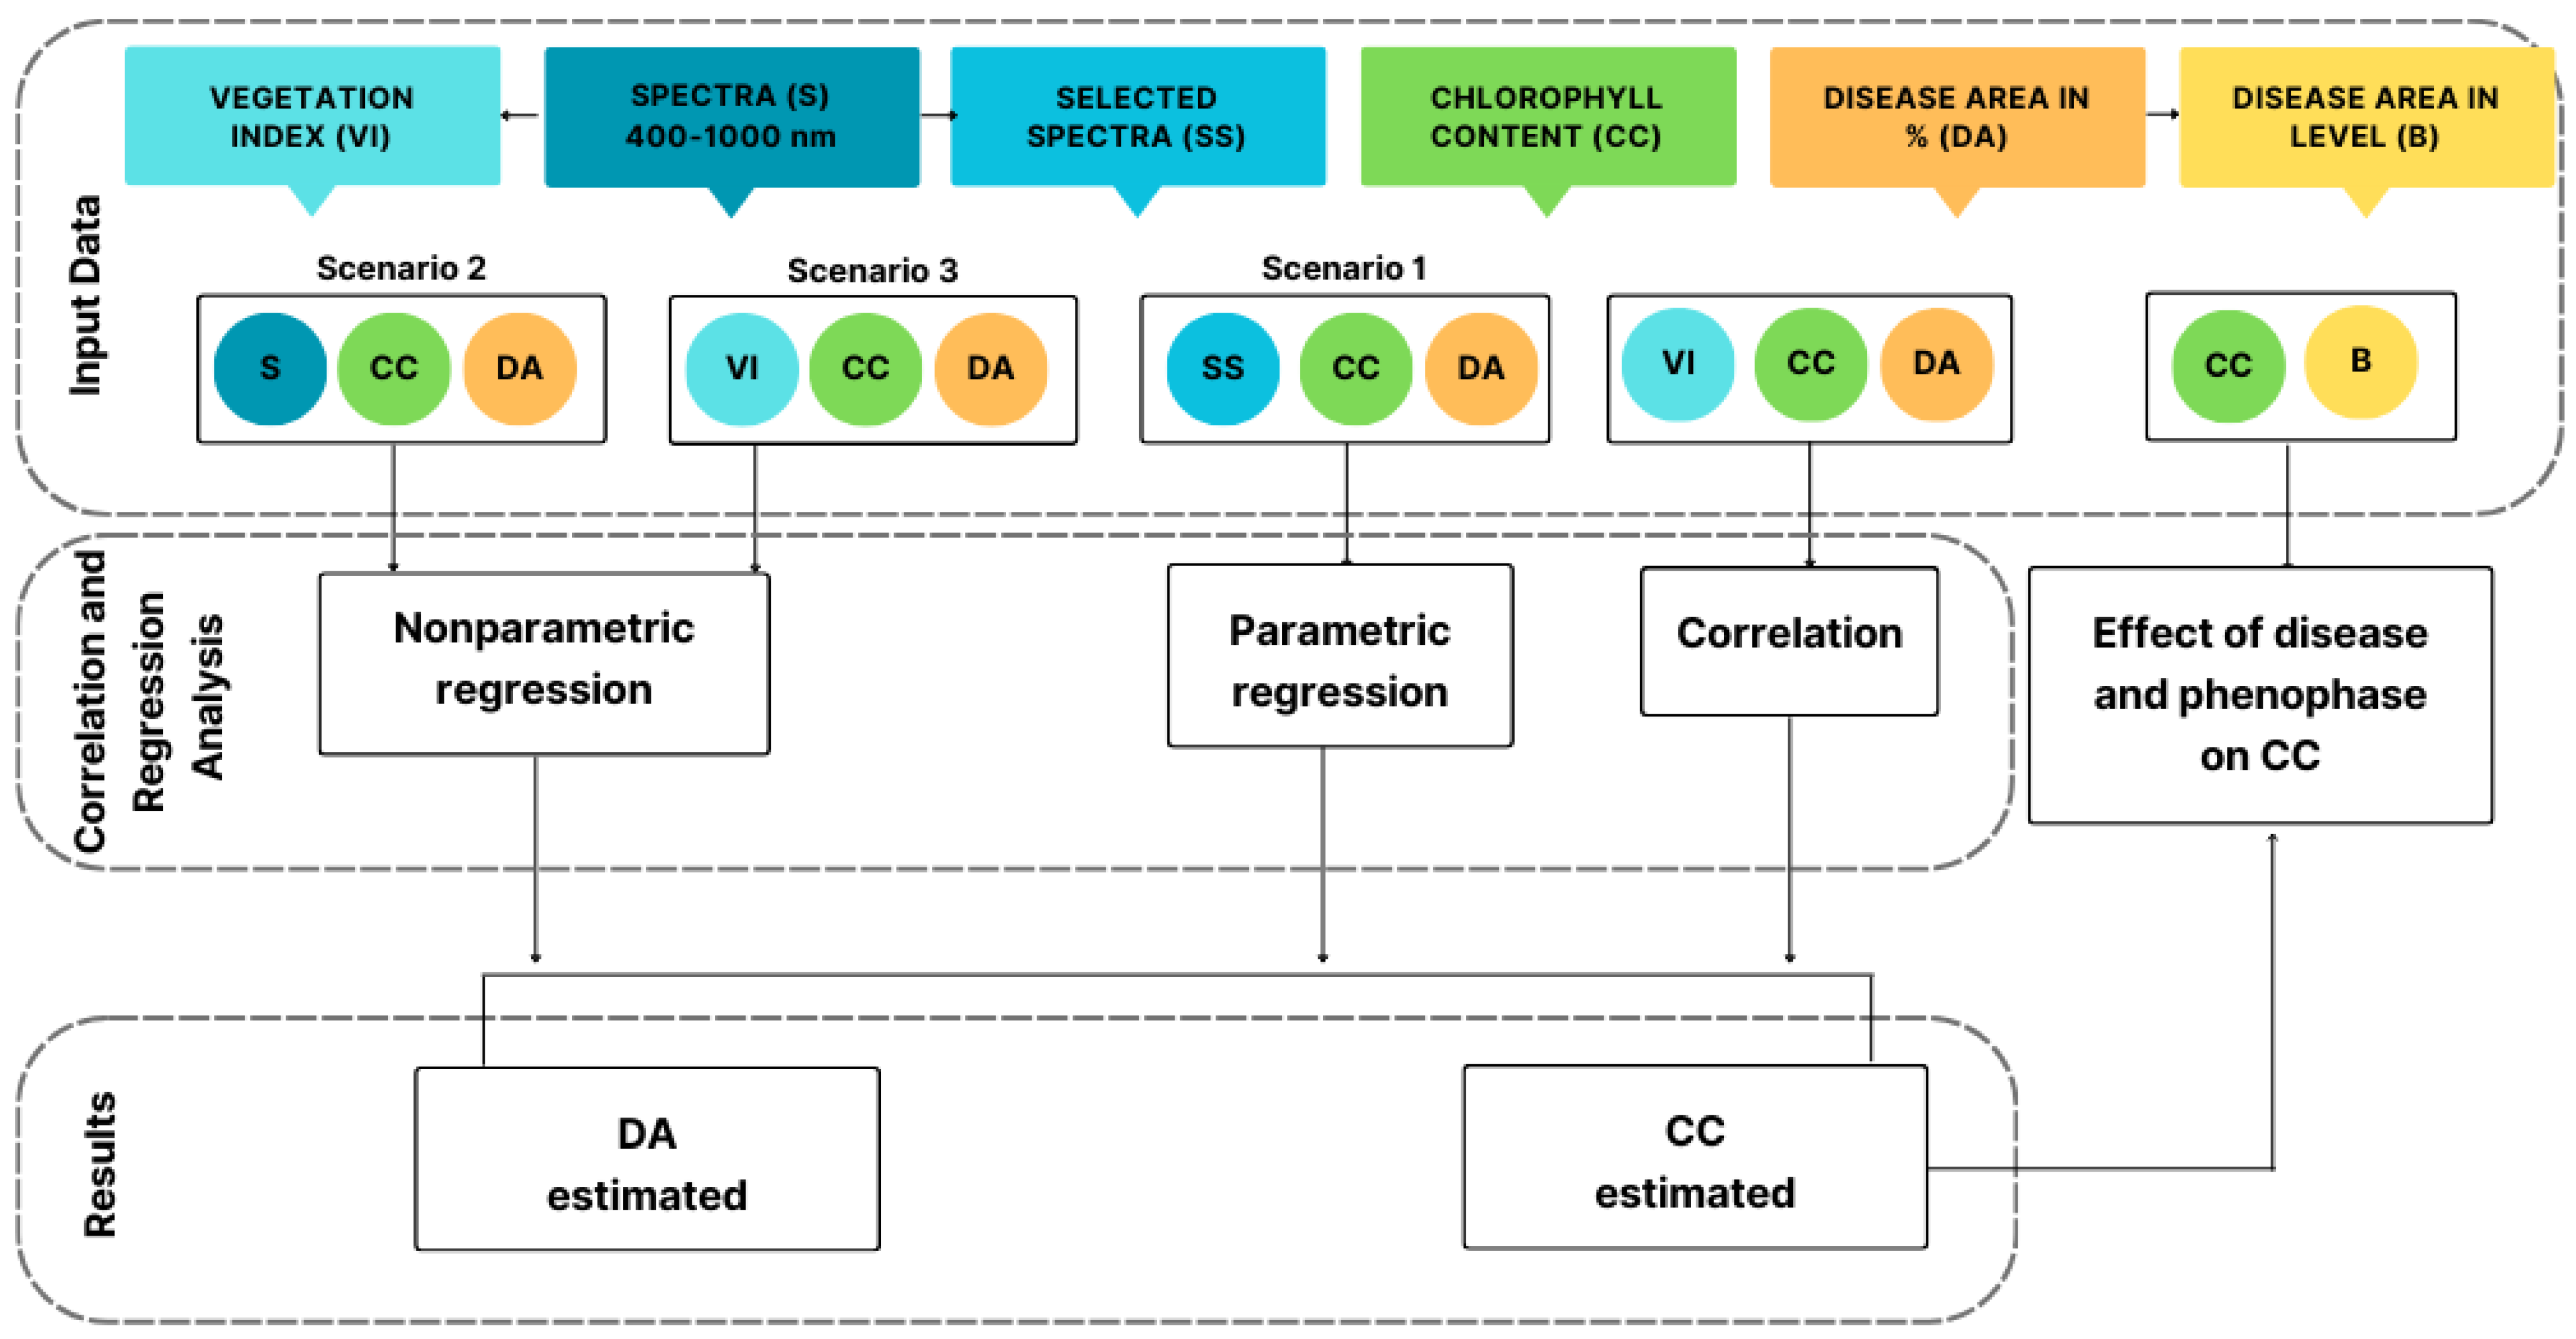
In this study, we utilize both in situ and optical spectral measurements. To evaluate the effectiveness of spectral measurements in estimating disease severity at both leaf and canopy levels, we follow the schematic workflow depicted in Figure 2.

2.1. Investigated Wheat Diseases and Study Area

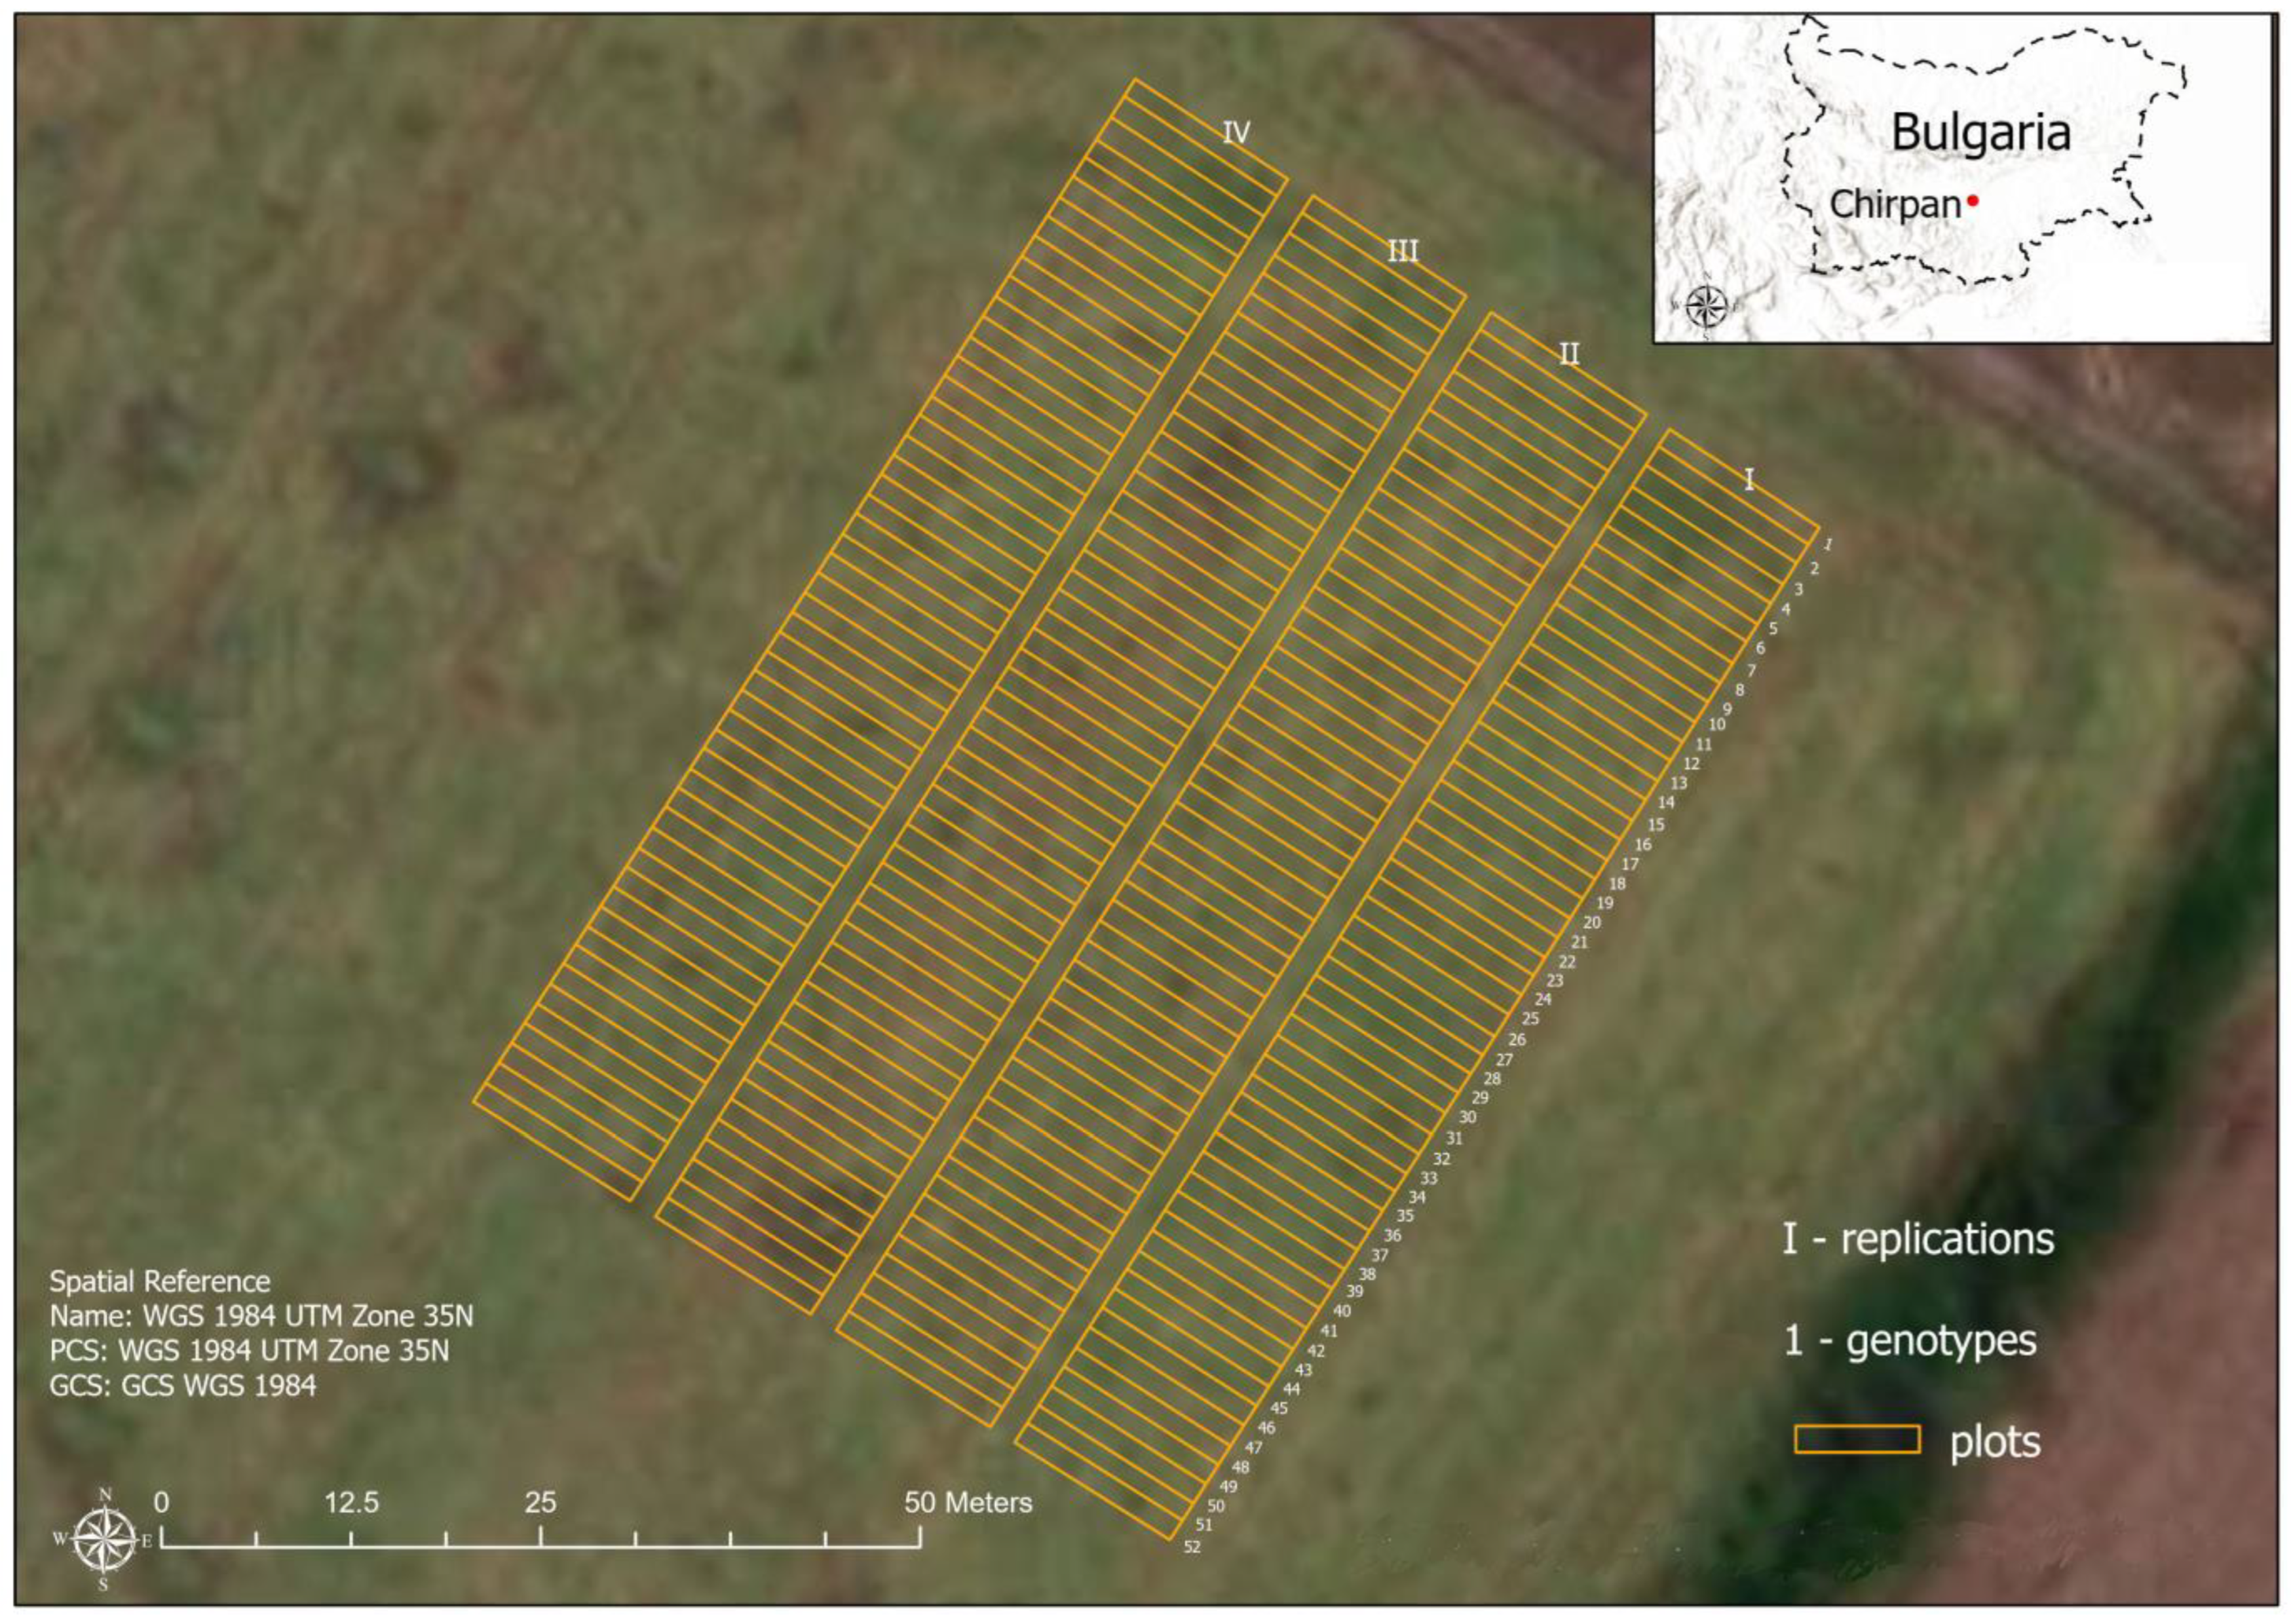
We conducted this study during the 2020/2021 growing season within the breeding fields of the Field Crops Institute, Chirpan (FCI-Chirpan), South Bulgaria (Figure 3). Fifty-two winter durum wheat genotypes (Triticum turgidum L. var. durum) were cultivated in four replicates on flat terrain, with an altitude ranging from 208 to 209 m above sea level. The soil type is identified as Pelic Vertisol, per the World Reference Base for Soil Resources classification system [44]. Genotypes included in the field trial are local varieties, breeding lines, and foreign-origin varieties with different levels of observed pathogen manifestation and varying degrees of resistance to yellow and brown rust and leaf spots.
Crucial weather conditions for the appearance and development of fungal pathogens, such as Puccinia recondita f. sp. Tritici and Puccinia striiformis f. sp. Tritici, which cause brown and yellow rust on cereals, as well as the pathogens associated with the leaf staining complex, occur during the period from April to June in the respective year. In 2021, the air temperature t (°C), the amount of precipitation (mm), and the relative moisture of the air (%) in April fully provided optimal conditions according to the epidemiology of fungal pathogens. In May, there was a significantly smaller amount of precipitation. The relatively good low humidity in the last tenth of the month—about 75%—in parallel with an optimal temperature of about 23 °C, fully facilitates and creates the necessary conditions for developing fungal pathogens causing rust and leaf stains on cereals. Weather conditions in June were favorable for developing fungal diseases on wheat; air temperature, precipitation, and relative humidity remain the optimum for developing Puccinia recondita f. sp. tritic, Pucinia striiformis f. sp. Tritici and tan spots. The three diseases were often observed as mixed infections in the studied genotypes, with yellow and brown rust predominating.

2.2. Input Data

In our study, we generated a minimal amount of digital data, which are not typically collected and stored by breeders. Specifically, at the canopy level, it amounted to 6.7 KB/m2, while at the leaf level, it was 3.4 KB per leaf.

2.2.1. Phenological Observations

During the field measurements, the phenological growth stage for each genotype was recorded with the BBCH scale [45] during the field measurements. All genotypes were in BBCH75 (medium milk) or BBCH77 (late milk). The genotypes in BBCH75 will hereafter be referred to as the “early group” and those at BBCH 77 as the “late group”.

2.2.2. Laboratory Measurements, Leaf Level

At midday on 16 June 2021, several plants per genotype were gathered from the first replicate and transported to the laboratory. The measurements were conducted within a few hours of plant collection on four randomly selected flag leaves.
Each Leaf chlorophyll content (Leaf CC) measurement was taken from the central region of the leaf, excluding areas visibly affected by disease. The measurement was conducted using the OPTI-SCIENCES CCM 300 chlorophyll meter equipped with a leaf clip, and the values are expressed in mg/m2. The measured area is a 3 mm diameter circle [46]. The CCM 300 was calibrated with the provided calibration slide and leaf clip after each power cycle. The measurements obtained from the CCM 300 were calibrated through comparison with laboratory-based determinations of chlorophyll [47].
The leaf spectral reflectance measurements were carried out using the ASD FieldSpec 4 HiRes Field Spectrometer (ASD HH FS4 HiRes) with a contact probe placed at the exact locations where OPTISCIENCES CCM 300 measurements were conducted. The ASD FieldSpec 4 HiRes is a high-resolution spectroradiometer designed for precise spectral data measurements across a wide range of remote sensing applications. It is manufactured by Malvern Panalytical, Cambridge, UK [48]. The instrument offers superior spectral performance with a spectral range that spans from 350 nm to 2500 nm. The spectral resolution is 3 nm in the Visible Near-Infrared (VNIR) range and 8 nm in the Short-Wave Infrared (SWIR) range. The leaf chip contact probe of the ASD Field Spectrometer includes a white reference and a light source transmitted through fiber optics. The measured spot size is 10 mm [48]. Each reading represents an average of 30 spectral reflectance measurements obtained using the instrument to minimize individual measurement errors. This contact method offers advantages such as eliminating atmospheric effects and precisely targeting measurements to the area of interest. This enables a meaningful comparison of results between the two contact methods performed with the CCM 300 and ASD Field Spectrometer.
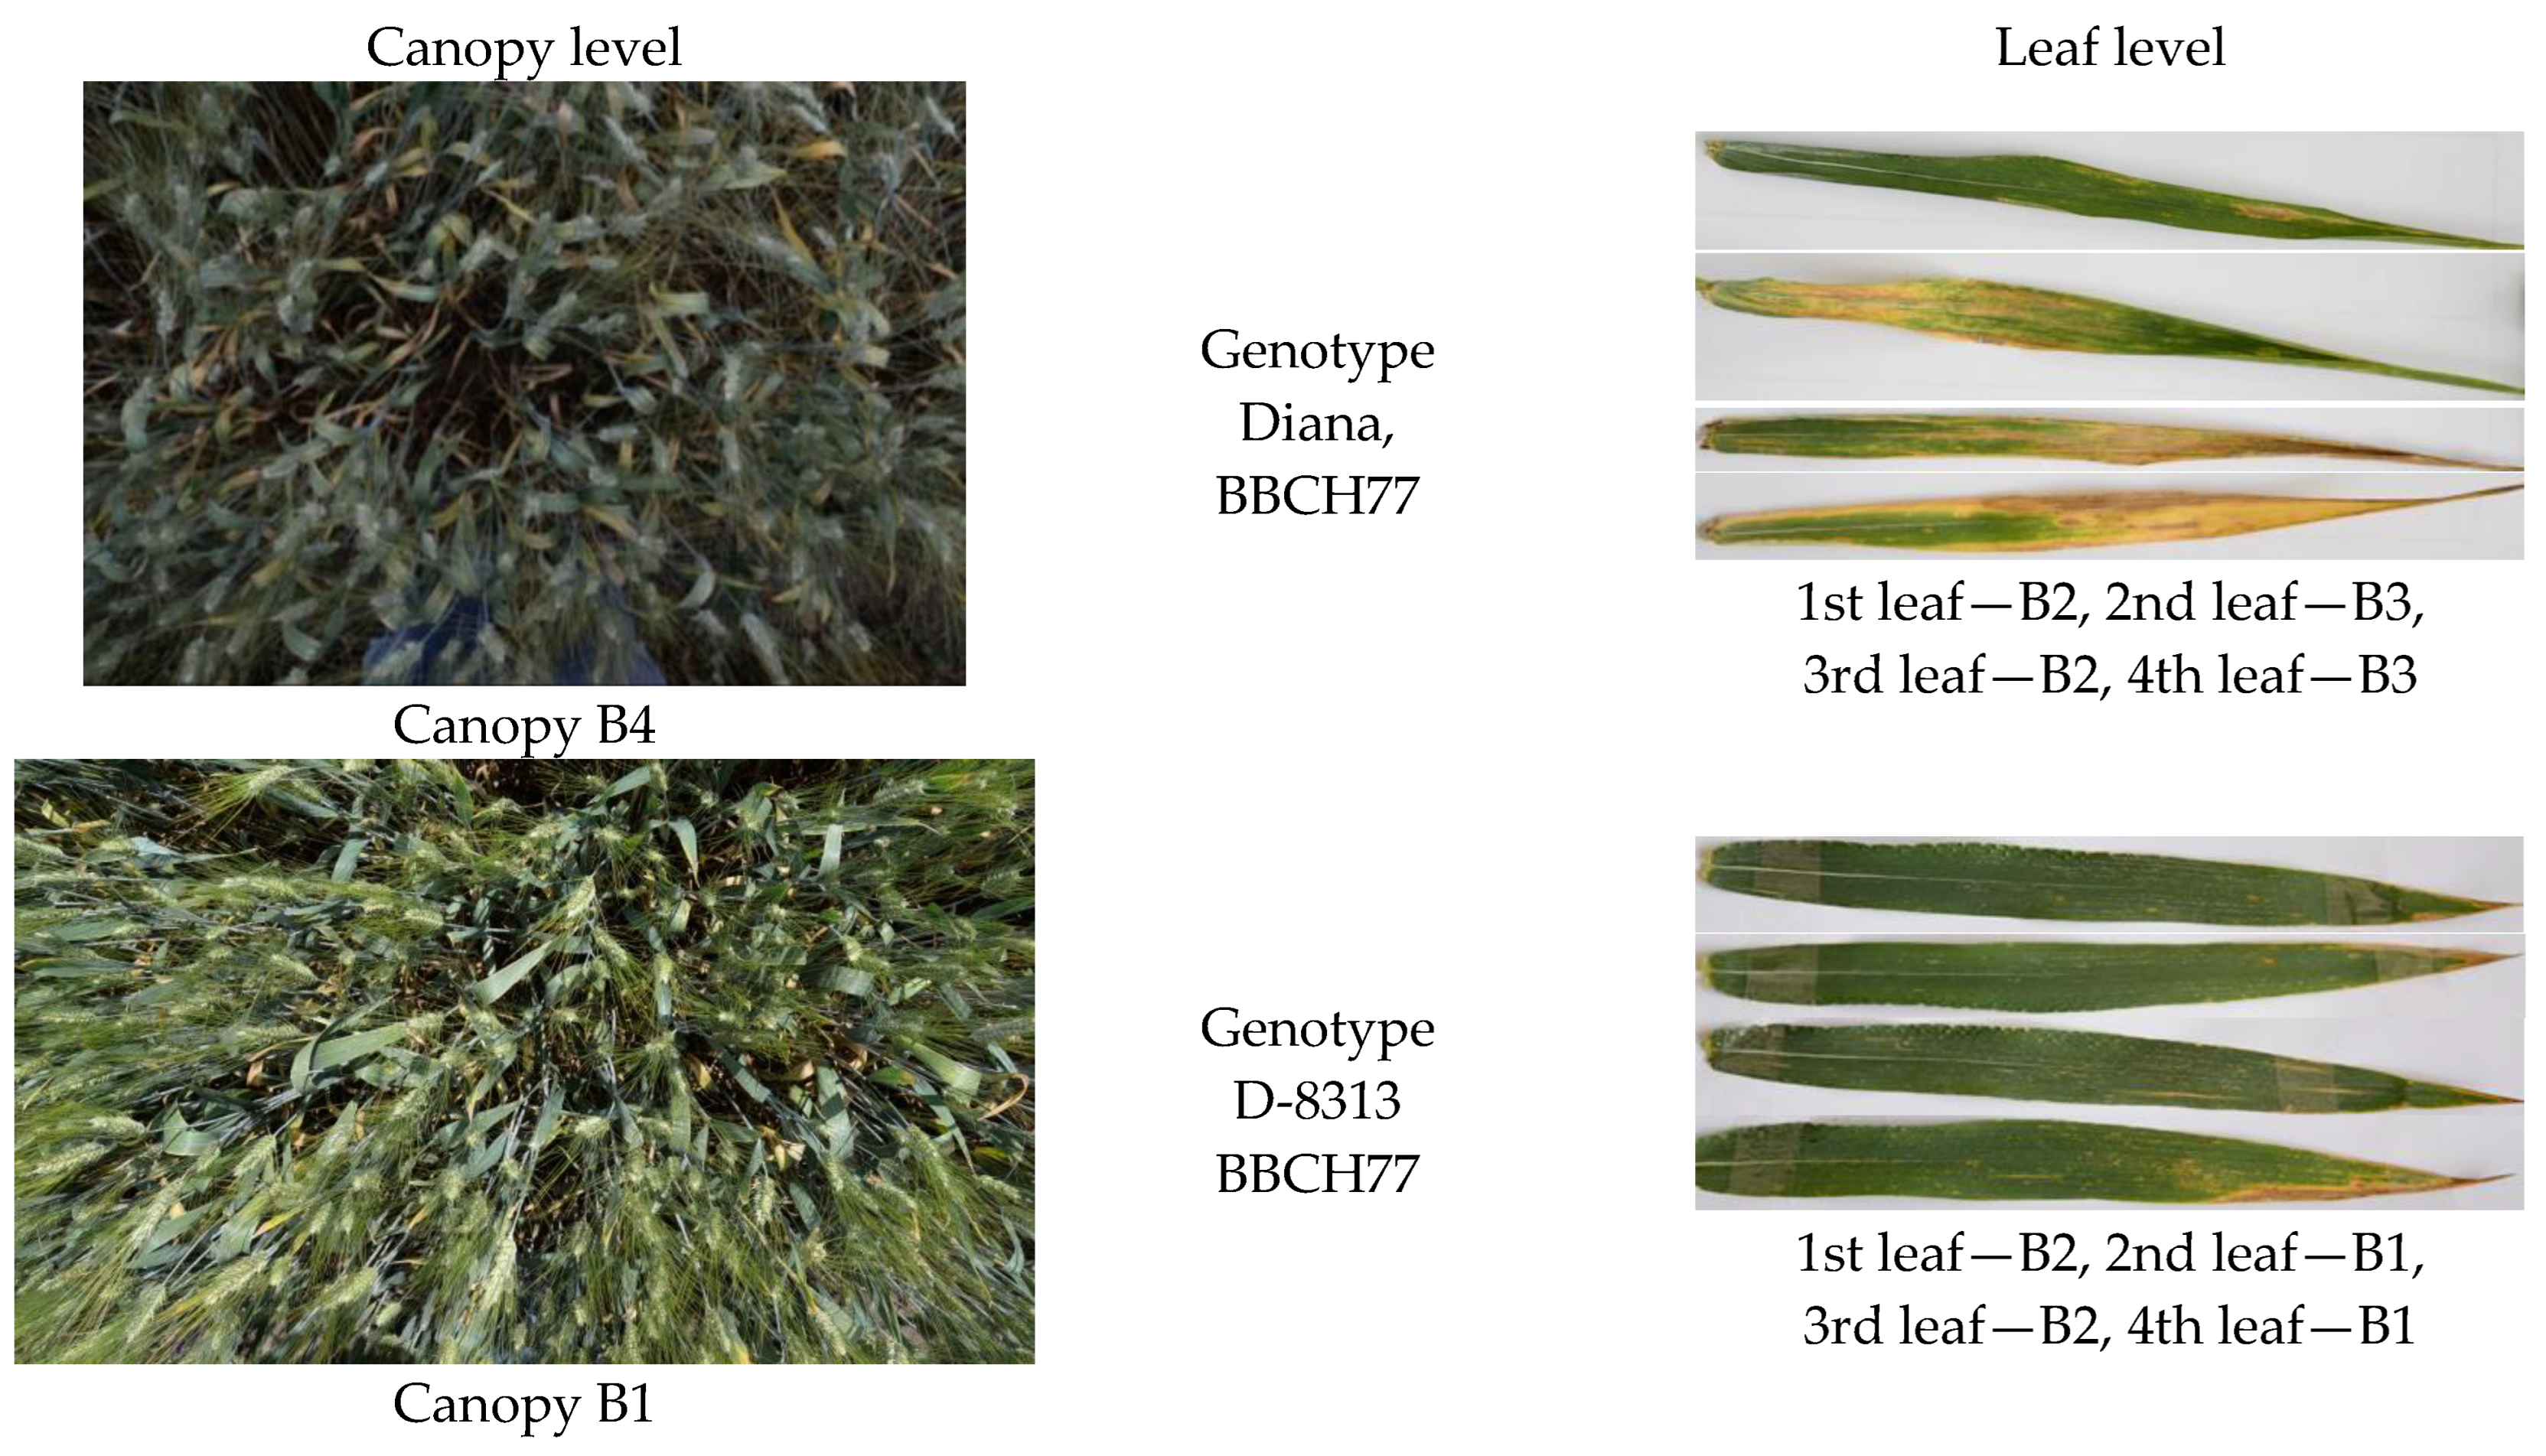
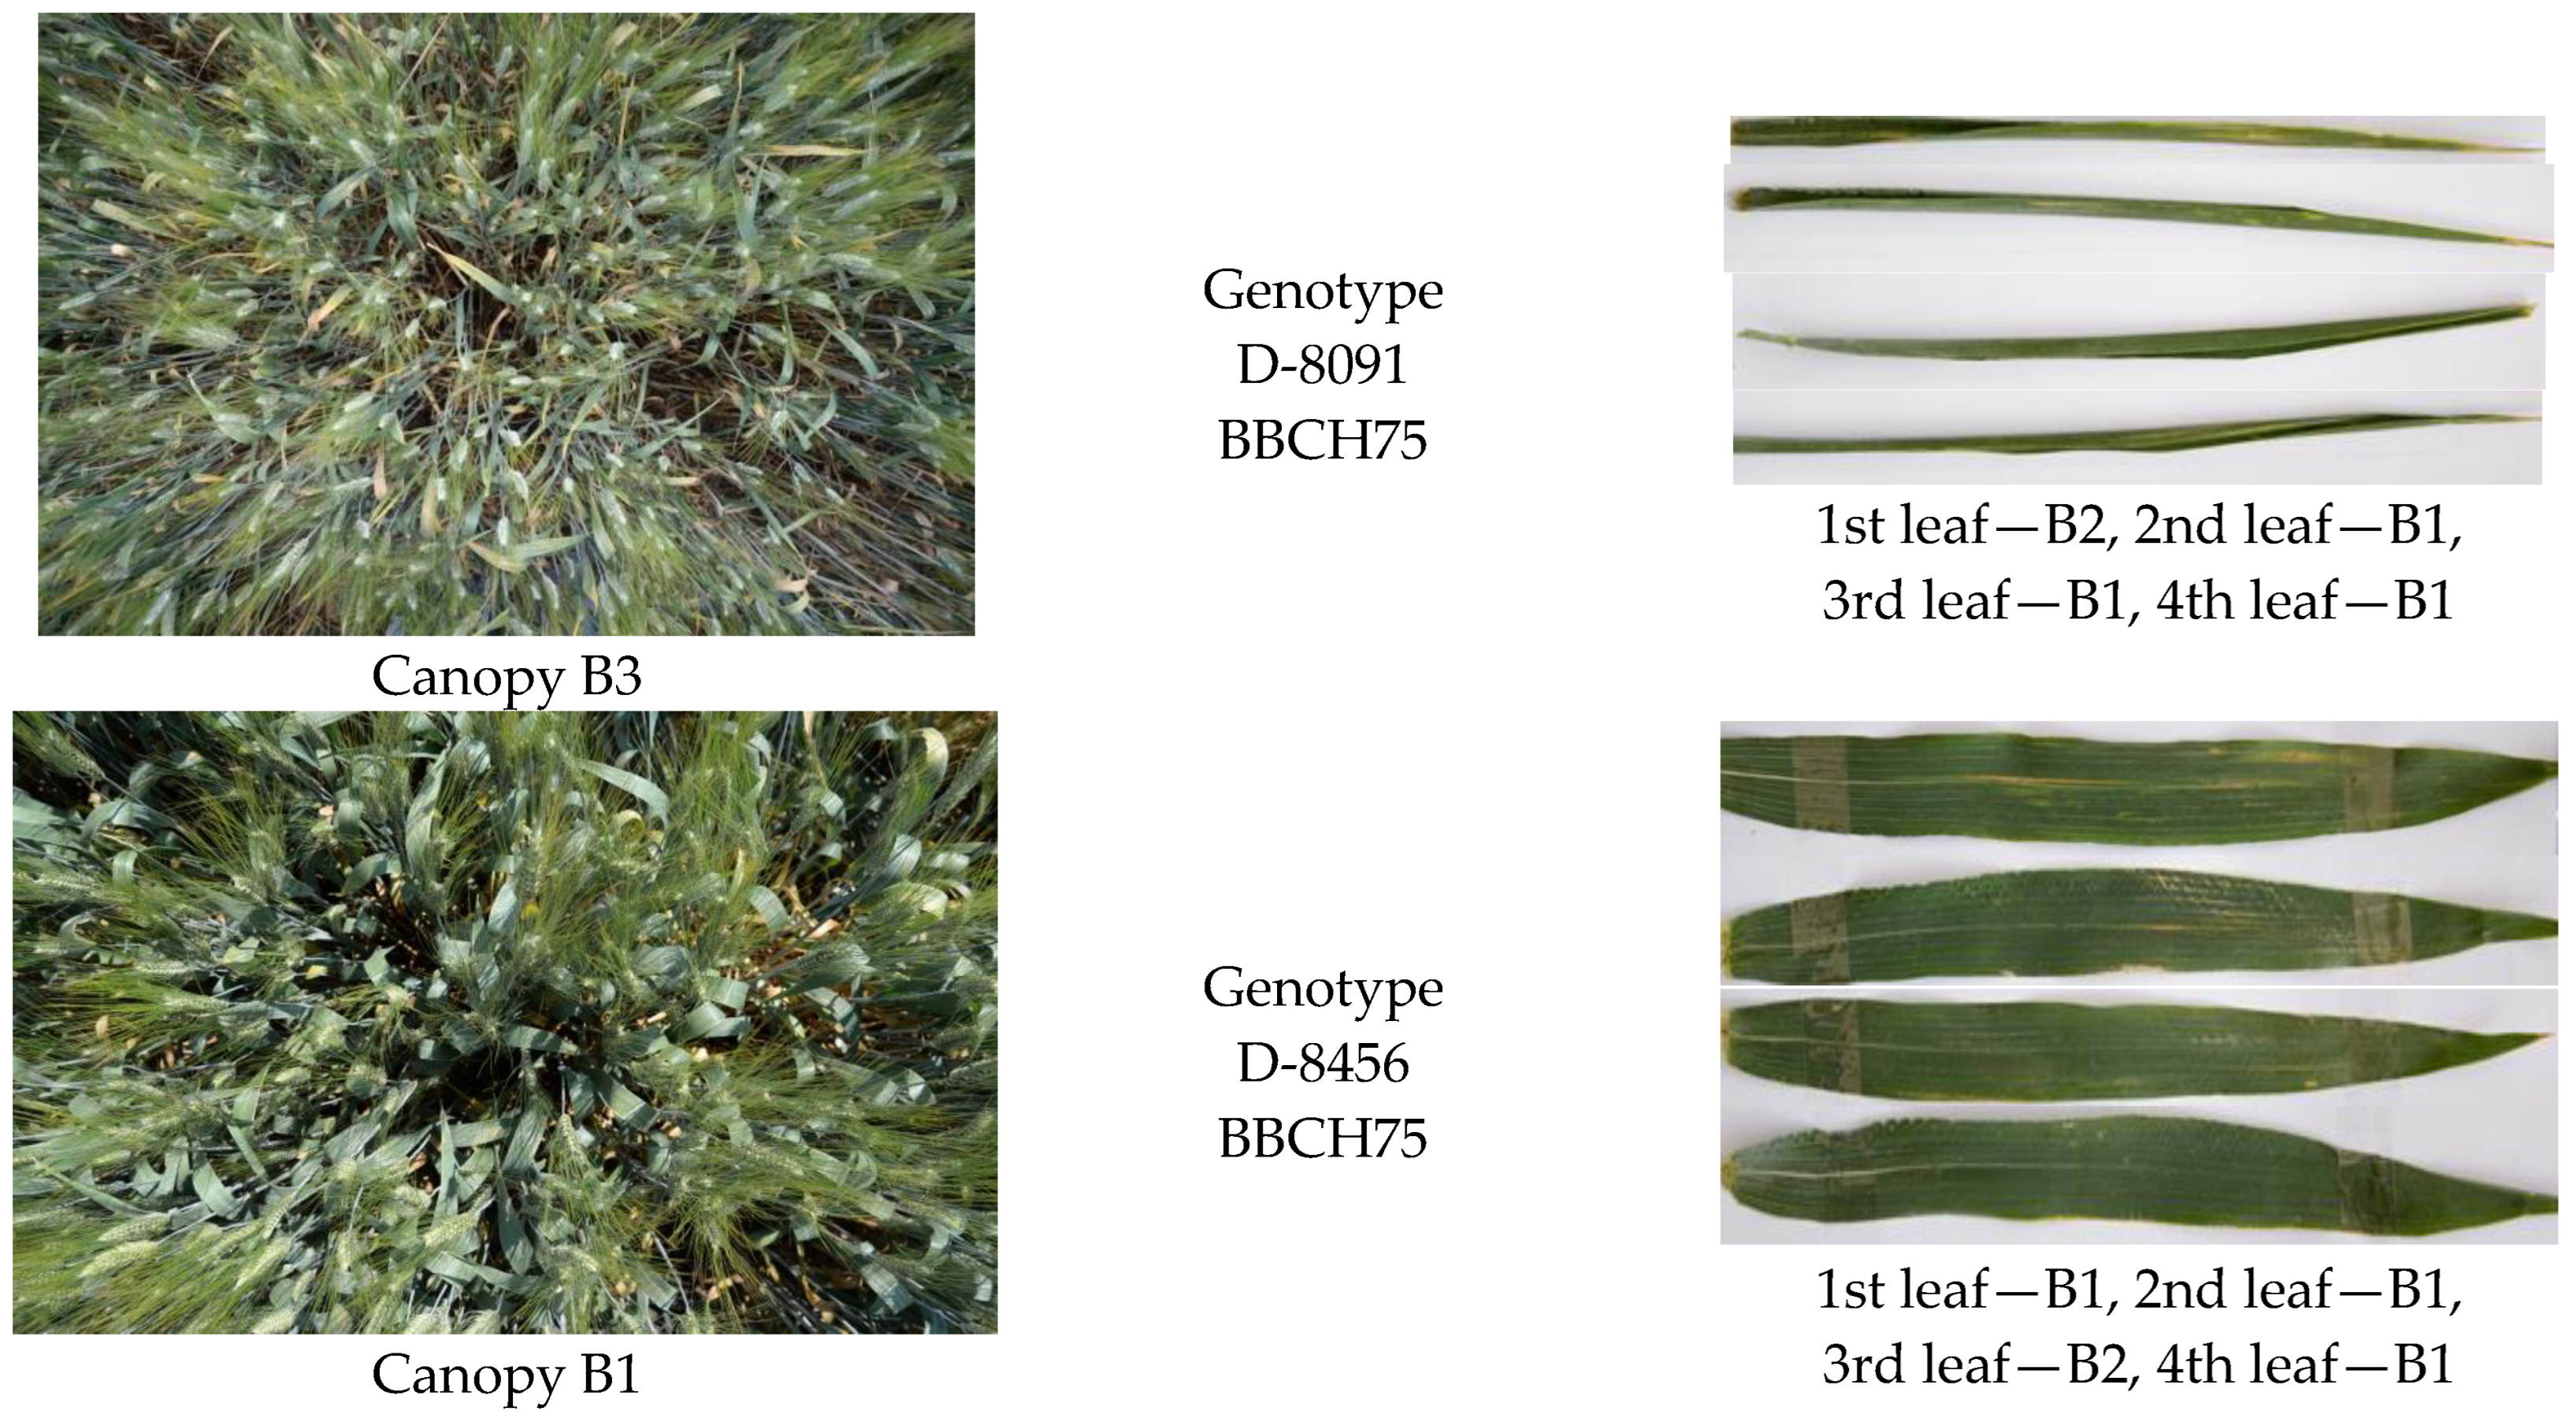
To quantify leaf disease severity, the percentage of the diseased leaf area relative to the total leaf area (DA) was recorded through visual assessment for each leaf. Given the subjective nature of this method, the assessment was conducted by a single crop breeder to mitigate bias stemming from individual differences. Additionally, the leaves were categorized into five disease severity levels, denoted as B, as follows: DA in 0–20% corresponds to B1, DA in 21–40% corresponds to B2, DA in 41–60% corresponds to B3, DA in 61–80% corresponds to B4, and DA in 81–100% corresponds to B5. At the leaf level, the maximum recorded B value was 3, while the minimum was 1. Examples of leaves with the estimated B are shown in Figure 4, right side.

2.2.3. Field Measurements, Canopy Level

The canopy-level measurements and observations were conducted in the field between 16 June and 17 June 2021, from 12 to 3 PM, across the two or four replications.
The canopy chlorophyll content (Canopy CC) was estimated by measuring four randomly selected flag leaves within a 1 m2 central area of each genotype plot. Measurements were obtained from only two repetitions (first and second). The measurement procedure mirrored that of the Leaf CC. The Canopy CC value for each plot represents the averaged values obtained from the measurements of the four flag leaves.
The canopy spectral reflectance measurements were carried out using the same ASD Field Spectrometer as the leaf spectral measurements. Similarly to the leaf spectral measurements, each reading represents an average of 30 spectral reflectance measurements obtained by the instrument. Unlike leaf measurements, the canopy spectral readings were obtained at the center of the four repetitions for the genotype, covering an area of 1 m2 within each plot. The spectra were collected at approximately 1 m above the canopy by positioning the pistol grip with bare fiber optics downward, simulating nadir measurements, when the weather was sunny and cloudless between 10:00 and 15:00. Calibration was conducted before each repetition utilizing a Spectralon calibration plate [49]. Consequently, all genotypes within a repetition were assessed using identical calibration values.
For the canopy disease severity estimation, the disease area (DA) at a plot level was calculated as the averaged DA of 10 flag leaves for each plot. Subsequently, disease severity level (B) was assigned using the same method employed for leaf level. The same breeder performed both leaf and canopy severity assessments. At the canopy level, the maximum recorded B value was 4, while the minimum was 1. Examples of canopy with the estimated DA at different levels are shown in Figure 4, left side.

2.3. Spectra Preprocessing

Bias correction, termed Splice Correction [50,51], was conducted for both the VNIR and SWIR2 regions. This correction involved adjusting these regions to align with the SWIR1 at the splice point. Additionally, all acquired spectra were rectified for any spectroradiometer sensitivity drift observed in the spectral signatures at 1000 nm, following the method outlined by Beal and Eamon (1996) [52]. These preprocessing steps were executed utilizing the ASD software ViewSpec Pro v6.2.0.
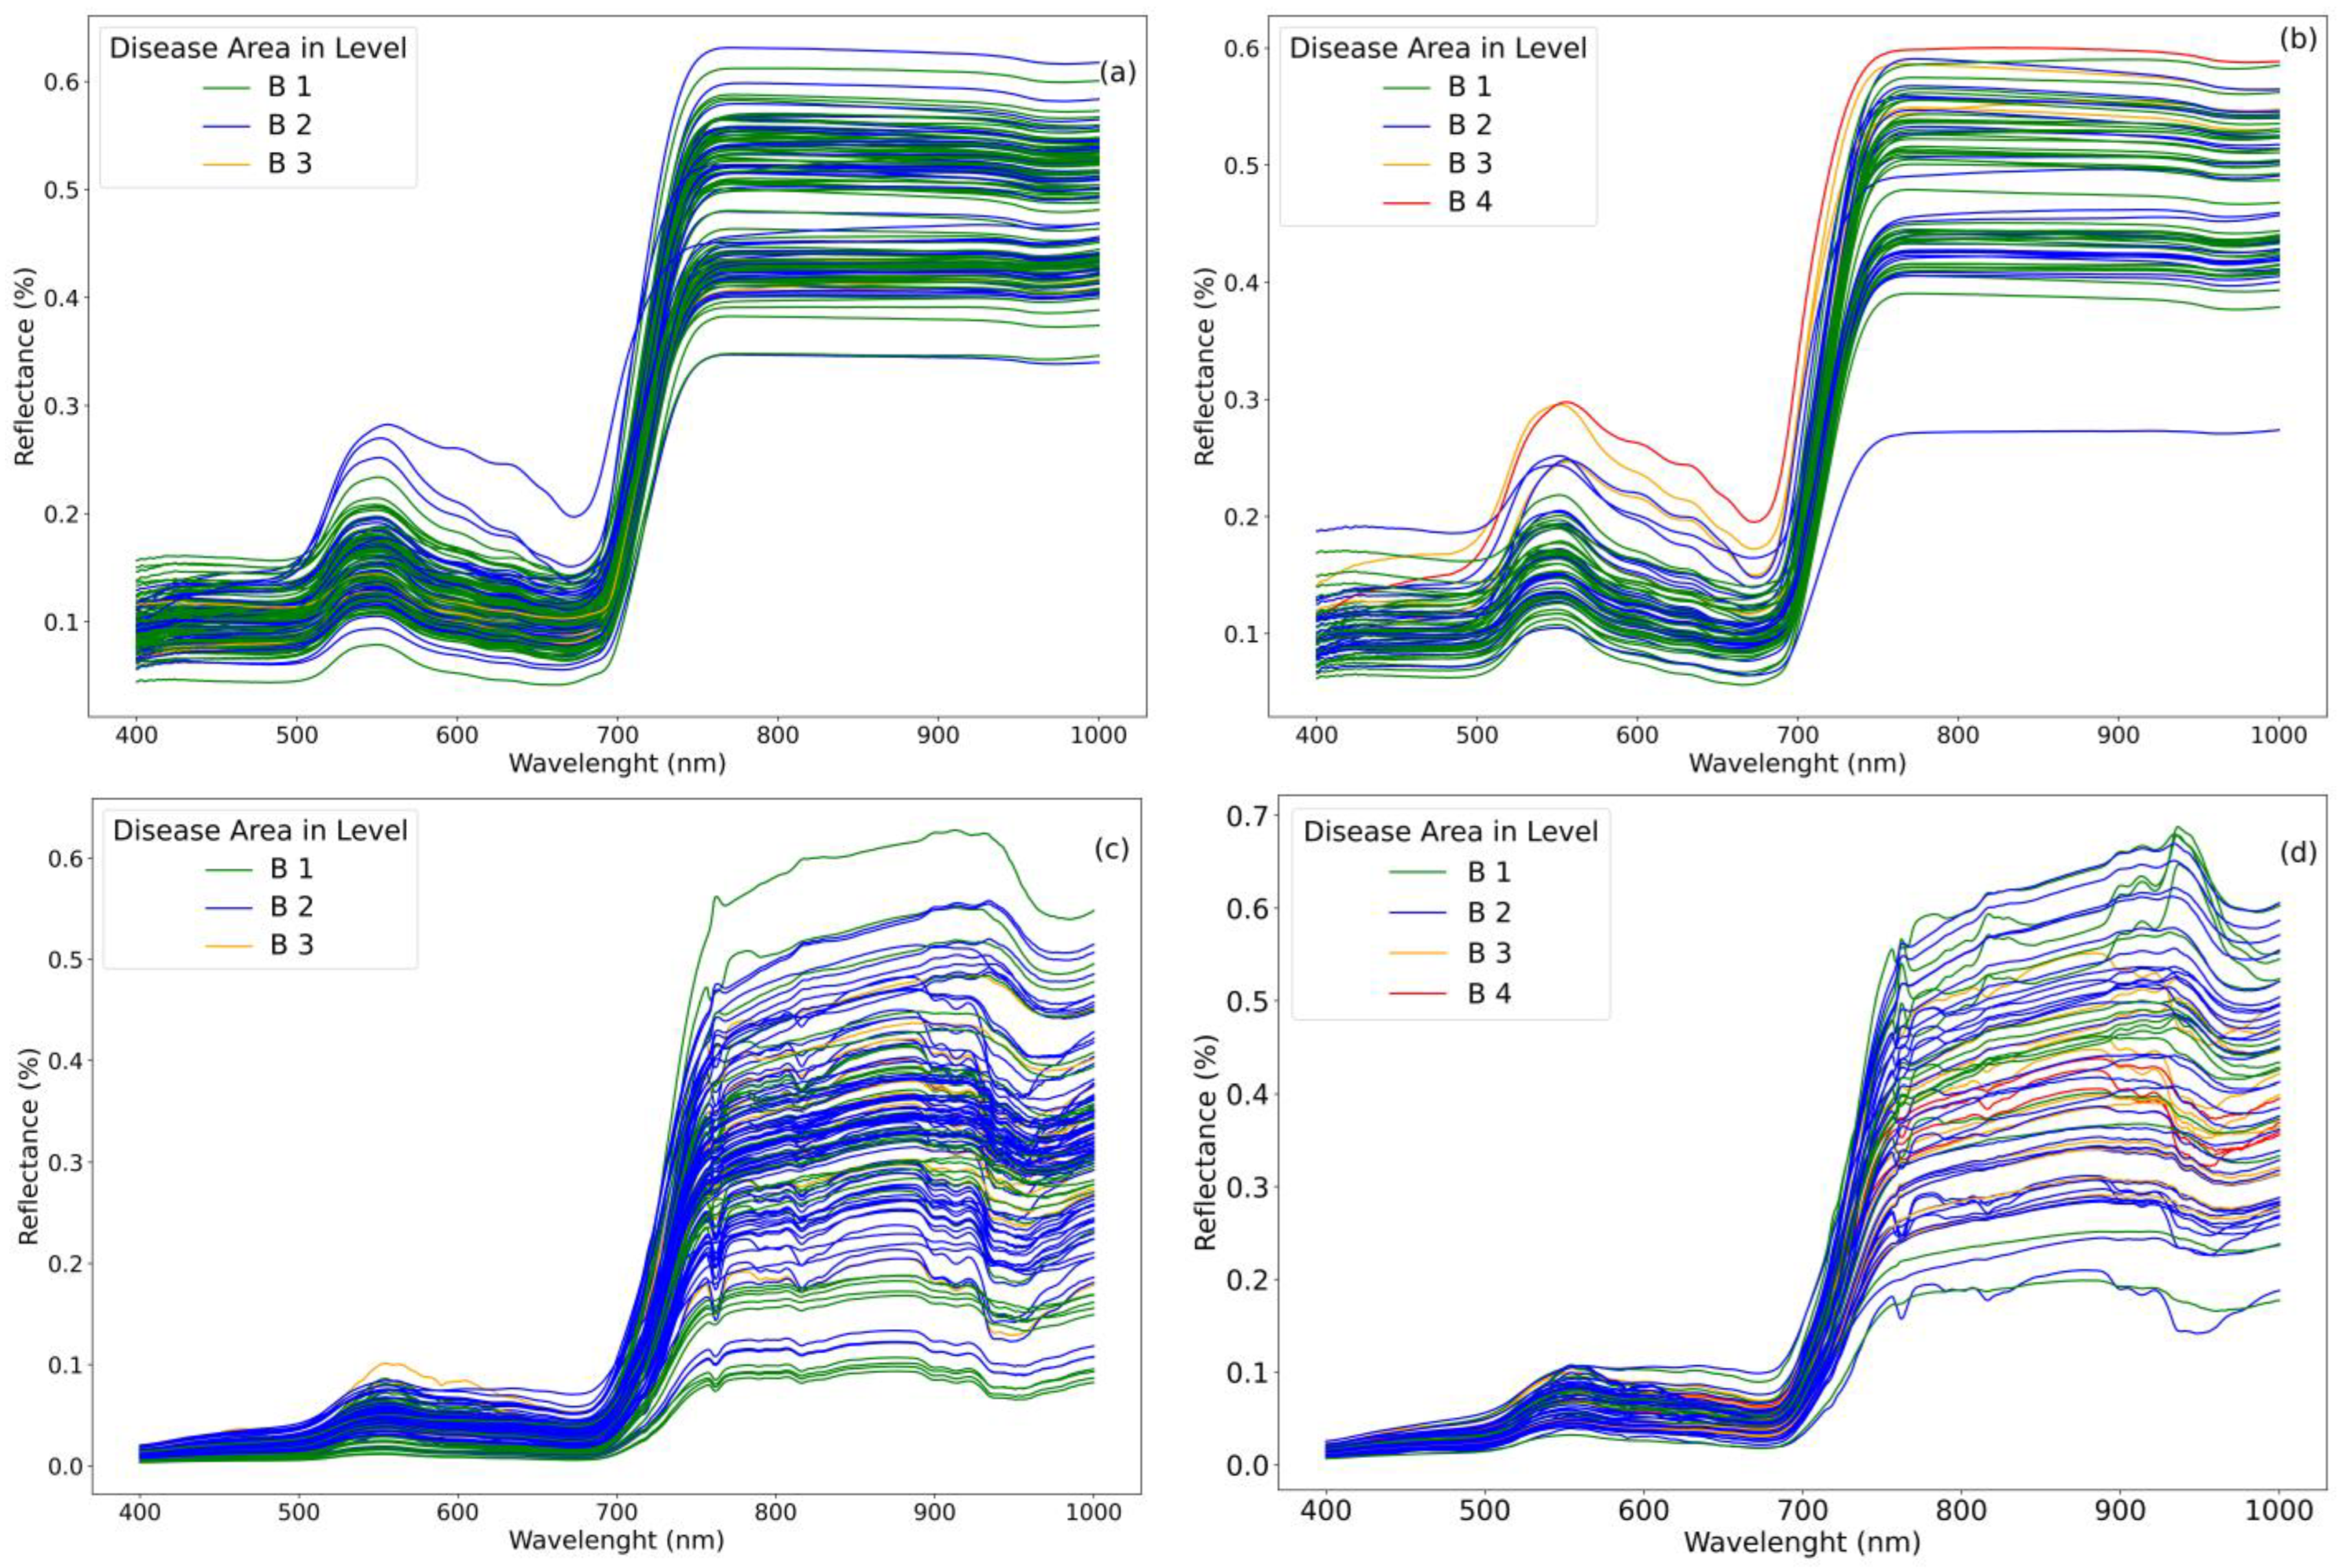
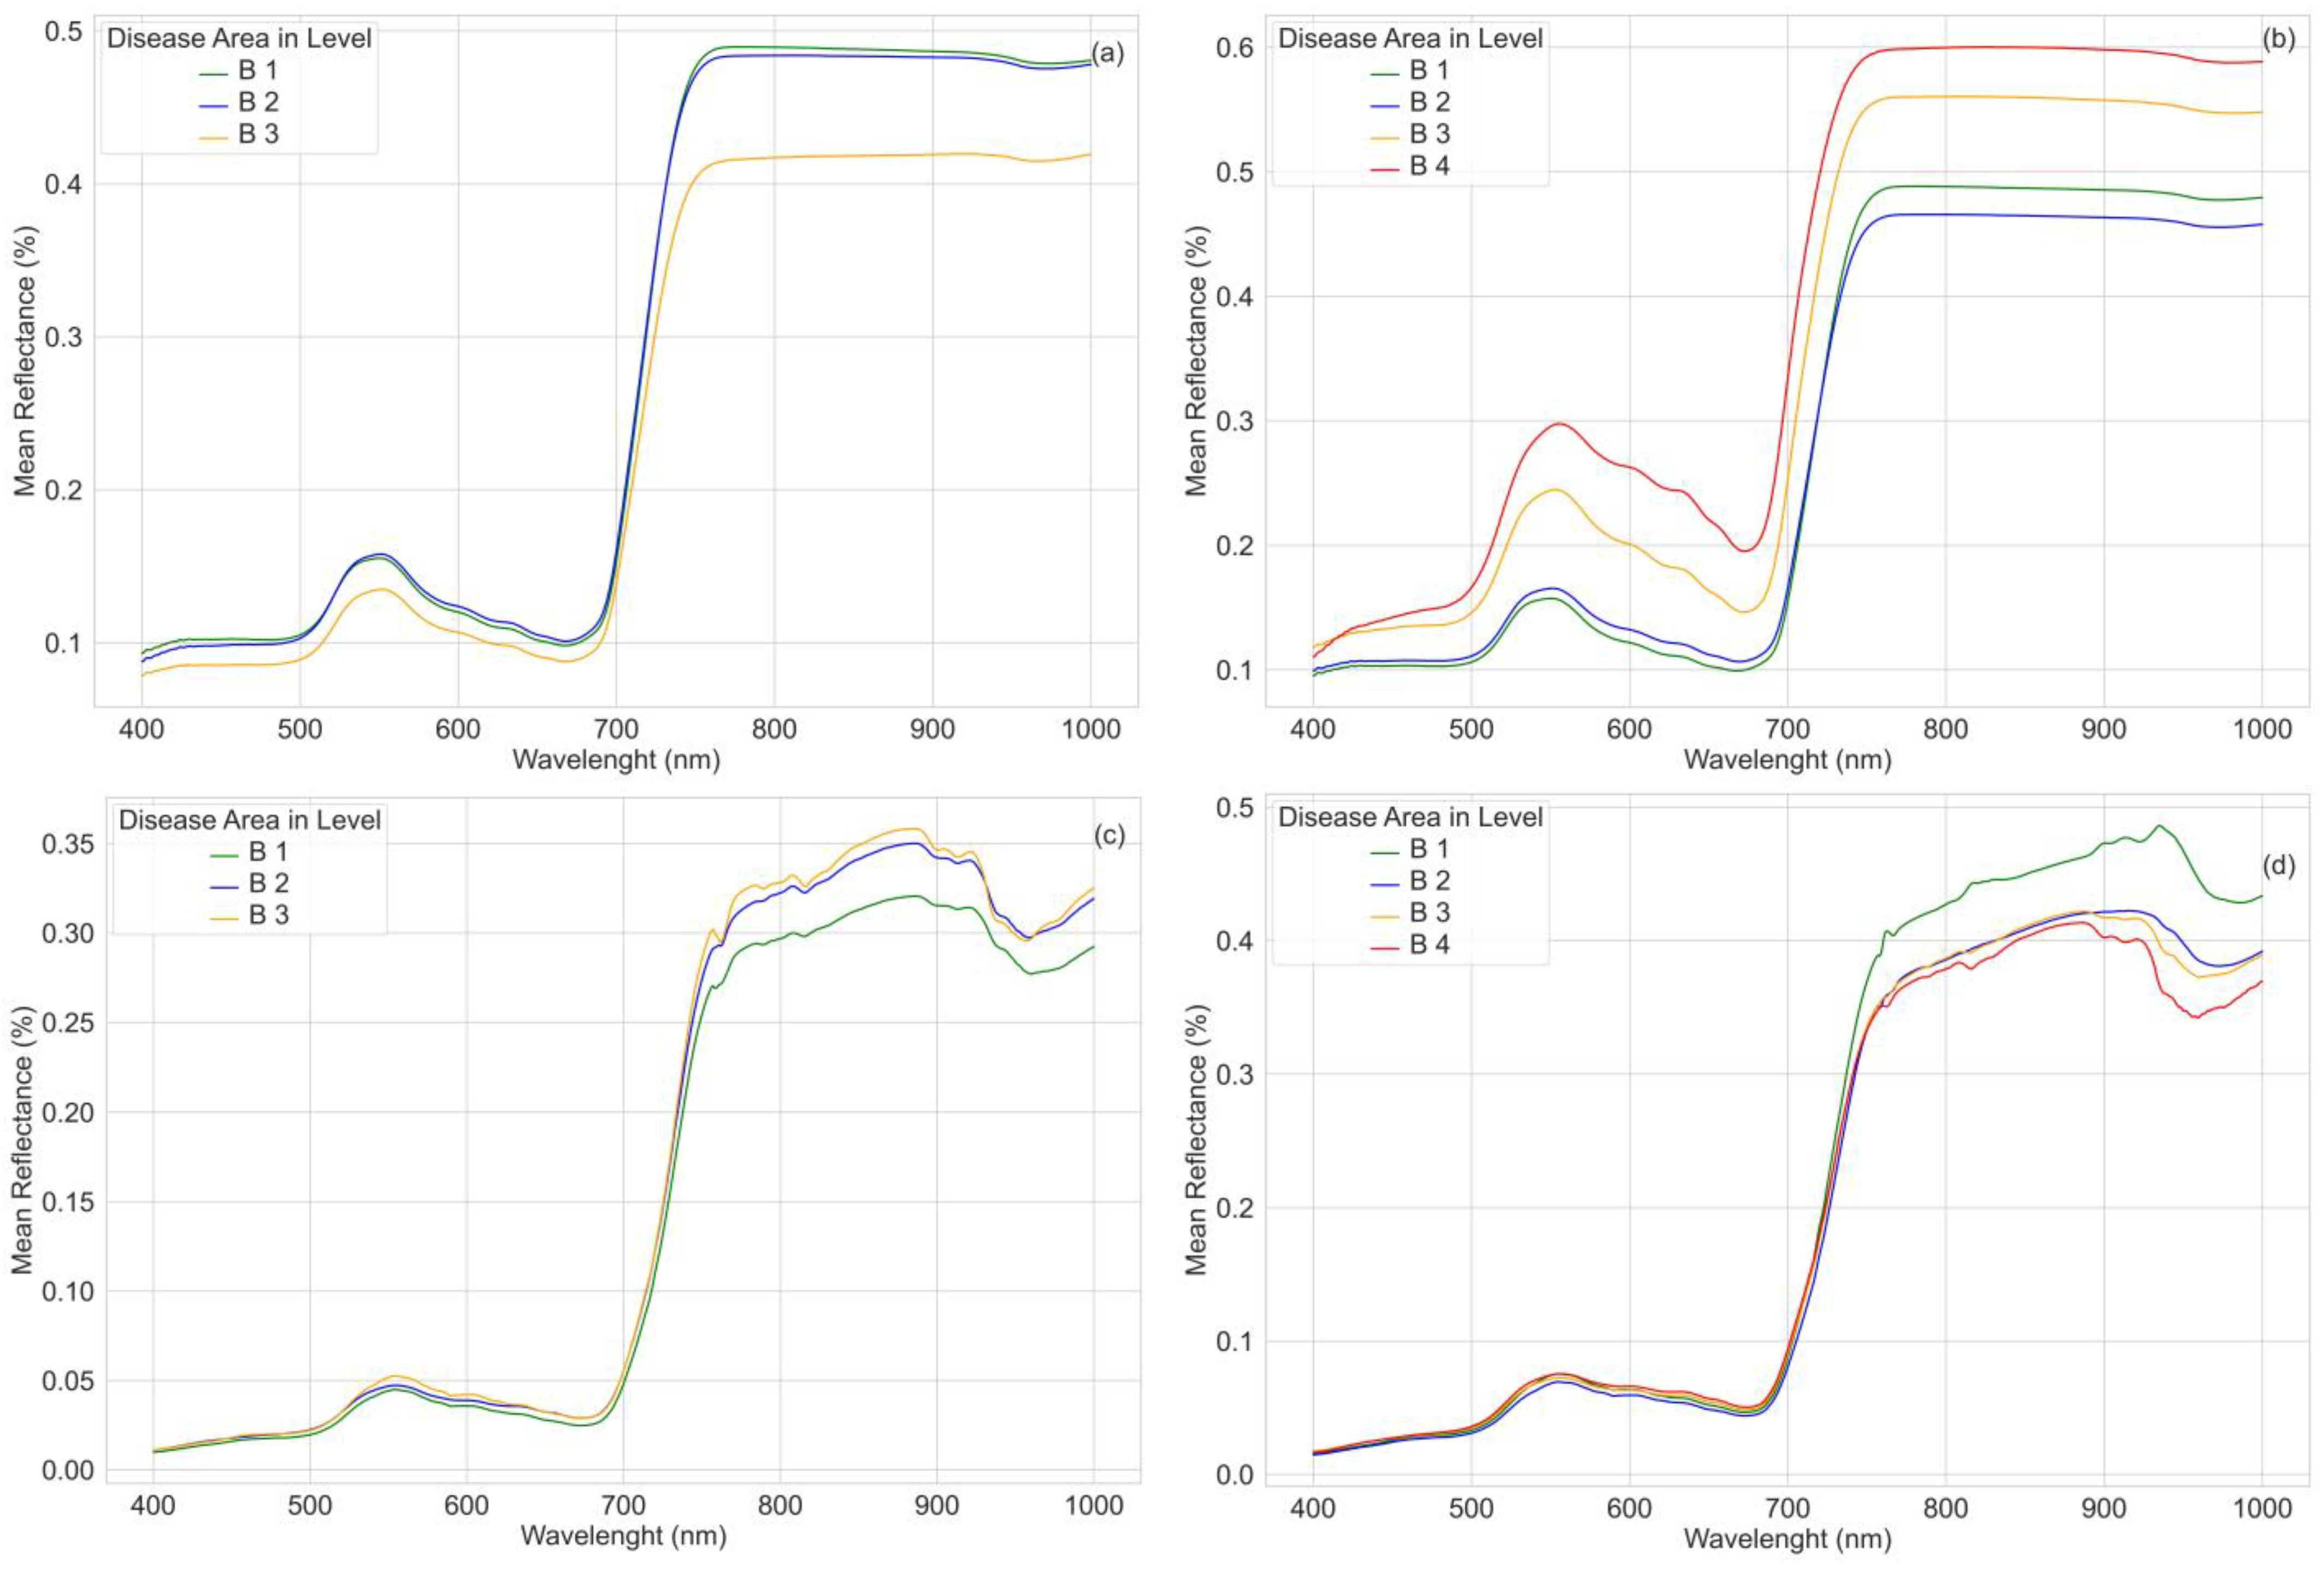
We focused our research on both leaf and canopy levels. While measurements at the leaf level are less burdened by water absorption bands, at the canopy level, they are, and the signal is much noisier. Moreover, while the SWIR range also provides valuable data, the VNIR range offers the most pertinent wavelengths for our research objectives [24]. Consequently, this work used 400 to 1000 nm electromagnetic regions across both leaf and canopy levels. The averaged spectra are shown in Figure 5, and the original spectra used for the regression analysis are shown in Figure A5.
Additionally, a subset of the canopy initially collected spectra were excluded from the analysis (eleven samples from the early group and three samples from the late group) due to elevated levels of noise and measurement anomalies.

2.4. Effect of Disease Severity and Phenophase on Chlorophyll Content

We analyzed the CC for the three groups (all data, early, and late groups) based on the disease severity for normality and equal variance assumption. The normality was tested with the Shapiro–Wilk test [53] and the equal variance with Leneve’s test [54]. Due to the non-normal distribution of our data, for each group, we utilized the nonparametric Kruskal–Wallis test [55] to examine whether a statistically significant difference exists in the median chlorophyll content (CC) across distinct disease severity levels. This analysis aimed to provide further insights into the relationship between senescence impact, chlorophyll content, and disease severity. The Kruskal–Wallis test does not require assumptions about normality and homoscedasticity, making it a robust option for comparing multiple independent samples [56]. With the Kruskal–Wallis method, we employed the commonly used post hoc procedure called Conover-Iman [57]. The statistical analysis was performed in Python, using the SciPy and scikit-posthocs libraries.

2.5. Correlation and Regression Analysis

2.5.1. Correlation Analysis

Correlation analysis was performed for all the data and each group using VI, selected from the literature (Table 1). These indices exhibit sensitivity to rust and leaf spot infection in wheat. The correlation analysis for both parameters DA and CC was evaluated using the Pearson correlation coefficient. Depending on the correlation analysis, a further parametric regression analysis was carried out.

2.5.2. Training and Validation Strategies for the Regression Analysis

We employed cross-validation to evaluate the performance and generalizability of our predictive model. In addition, we set aside a separate test set, distinct from the cross-validation dataset, for final evaluation. The data were partitioned into a 2/3 ratio for the cross-validation dataset and a 1/3 ratio for the test dataset. This approach allows us to rigorously assess the model’s performance and ensure its effectiveness on unseen data.
At the leaf level, the dataset comprises spectral reflectance, DA, CC, and growth stage values, totaling 208 samples, 140 of which are in the early group and 68 in the late group. However, at the canopy level, there are two datasets. The first includes spectral reflectance, DA, and growth stage values, totaling 194 samples, 129 of which are in the early group and 65 in the late group. Additionally, a second canopy level dataset includes spectral reflectance, CC, and growth stage values, with 90 samples, 59 of which are in the early group and 31 in the late group.
Due to variations in sample sizes across different datasets, we implemented k-fold cross-validation, ensuring that each fold contains a comparable number of samples, typically between 12 and 15. Consequently, the distinct elements are outlined in Table 2.

2.5.3. Regression Analysis

To explore whether any of the selected indices could accurately capture disease severity in our study, we conducted parametric regressions using the formulas listed in Table 1, the 16 spectral bands (SS) identified in the Vis in Table 1, along with the linear (1) and polynomic (2) functions. This analysis was referred to as scenario 1 in Figure 2.
f ( x ) = a · x + b
f ( x ) = a · x 2   + b · x + c
Furthermore, we chose two nonparametric algorithms, partial least squares regression (PLSR) [64] and kernel ridge regression (KRR) [65], for our regression analysis. PLSR and KRR offer complementary approaches to regression analysis, providing robust solutions for handling complex datasets and improving the accuracy and generalizability of regression models.
PLSR projects predictor and response variables into latent components that explain maximum covariance. This approach effectively addresses high dimensionality and multicollinearity in the data. By focusing on informative latent variables, PLSR helps avoid overfitting and captures the essential relationships between predictors and the response variable.
On the other hand, KRR utilizes kernel functions to map the data into higher-dimensional feature spaces, capturing complex, nonlinear relationships between predictors and the response variable. By incorporating a penalty term, KRR controls model complexity, mitigating overfitting and enhancing generalizability, particularly in noisy or high-dimensional data situations.
Moreover, with KRR, we employed the Band Analysis Tool (BAT) [43] to identify the most responsive bands for a given variable while also determining the minimum number of bands necessary to maintain an acceptable level of accuracy. A backward band reduction approach was utilized through BAT, whereby the modeling commenced with all bands. Subsequently, the least influential band was eliminated after each iteration, followed by recalibration of the model. Accuracy was assessed at each stage and with each subset of bands, ultimately identifying the most effective bands.
Two additional scenarios were conducted, each using the nonparametric algorithms and different independent feature sets (Figure 2). Scenario 2 used all 601 spectral bands from 400–1000 nm (S), and Scenario 3 used the VIs identified in Table 1.
All scenarios were applied at leaf and canopy levels, separately for both phenological groups, using all available data.
The regression modeling was carried out with the ARTMO toolbox [66,67] (https://artmotoolbox.com/, accessed on 29 February 2024), version 3.31.

3. Results

This Section, organized into subsections, provides a brief overview of the experimental results, aligning with the corresponding subsections outlined in the Materials and Methods Section.

3.1. Effect of Disease Severity and Phenophase on Chlorophyll Content

To study the effect of disease severity and phenophase on chlorophyll content measurement, the studied genotypes were classified based on their BBCH, as shown in Table 3. The reduction in Leaf CC from severity disease level 3–4 over level 1 was under 1% for the genotypes in the early group and almost 31% for the genotypes in the late group. The reduction in Canopy CC from severity disease level 3–4 over level 1 was under 10% for all genotypes.
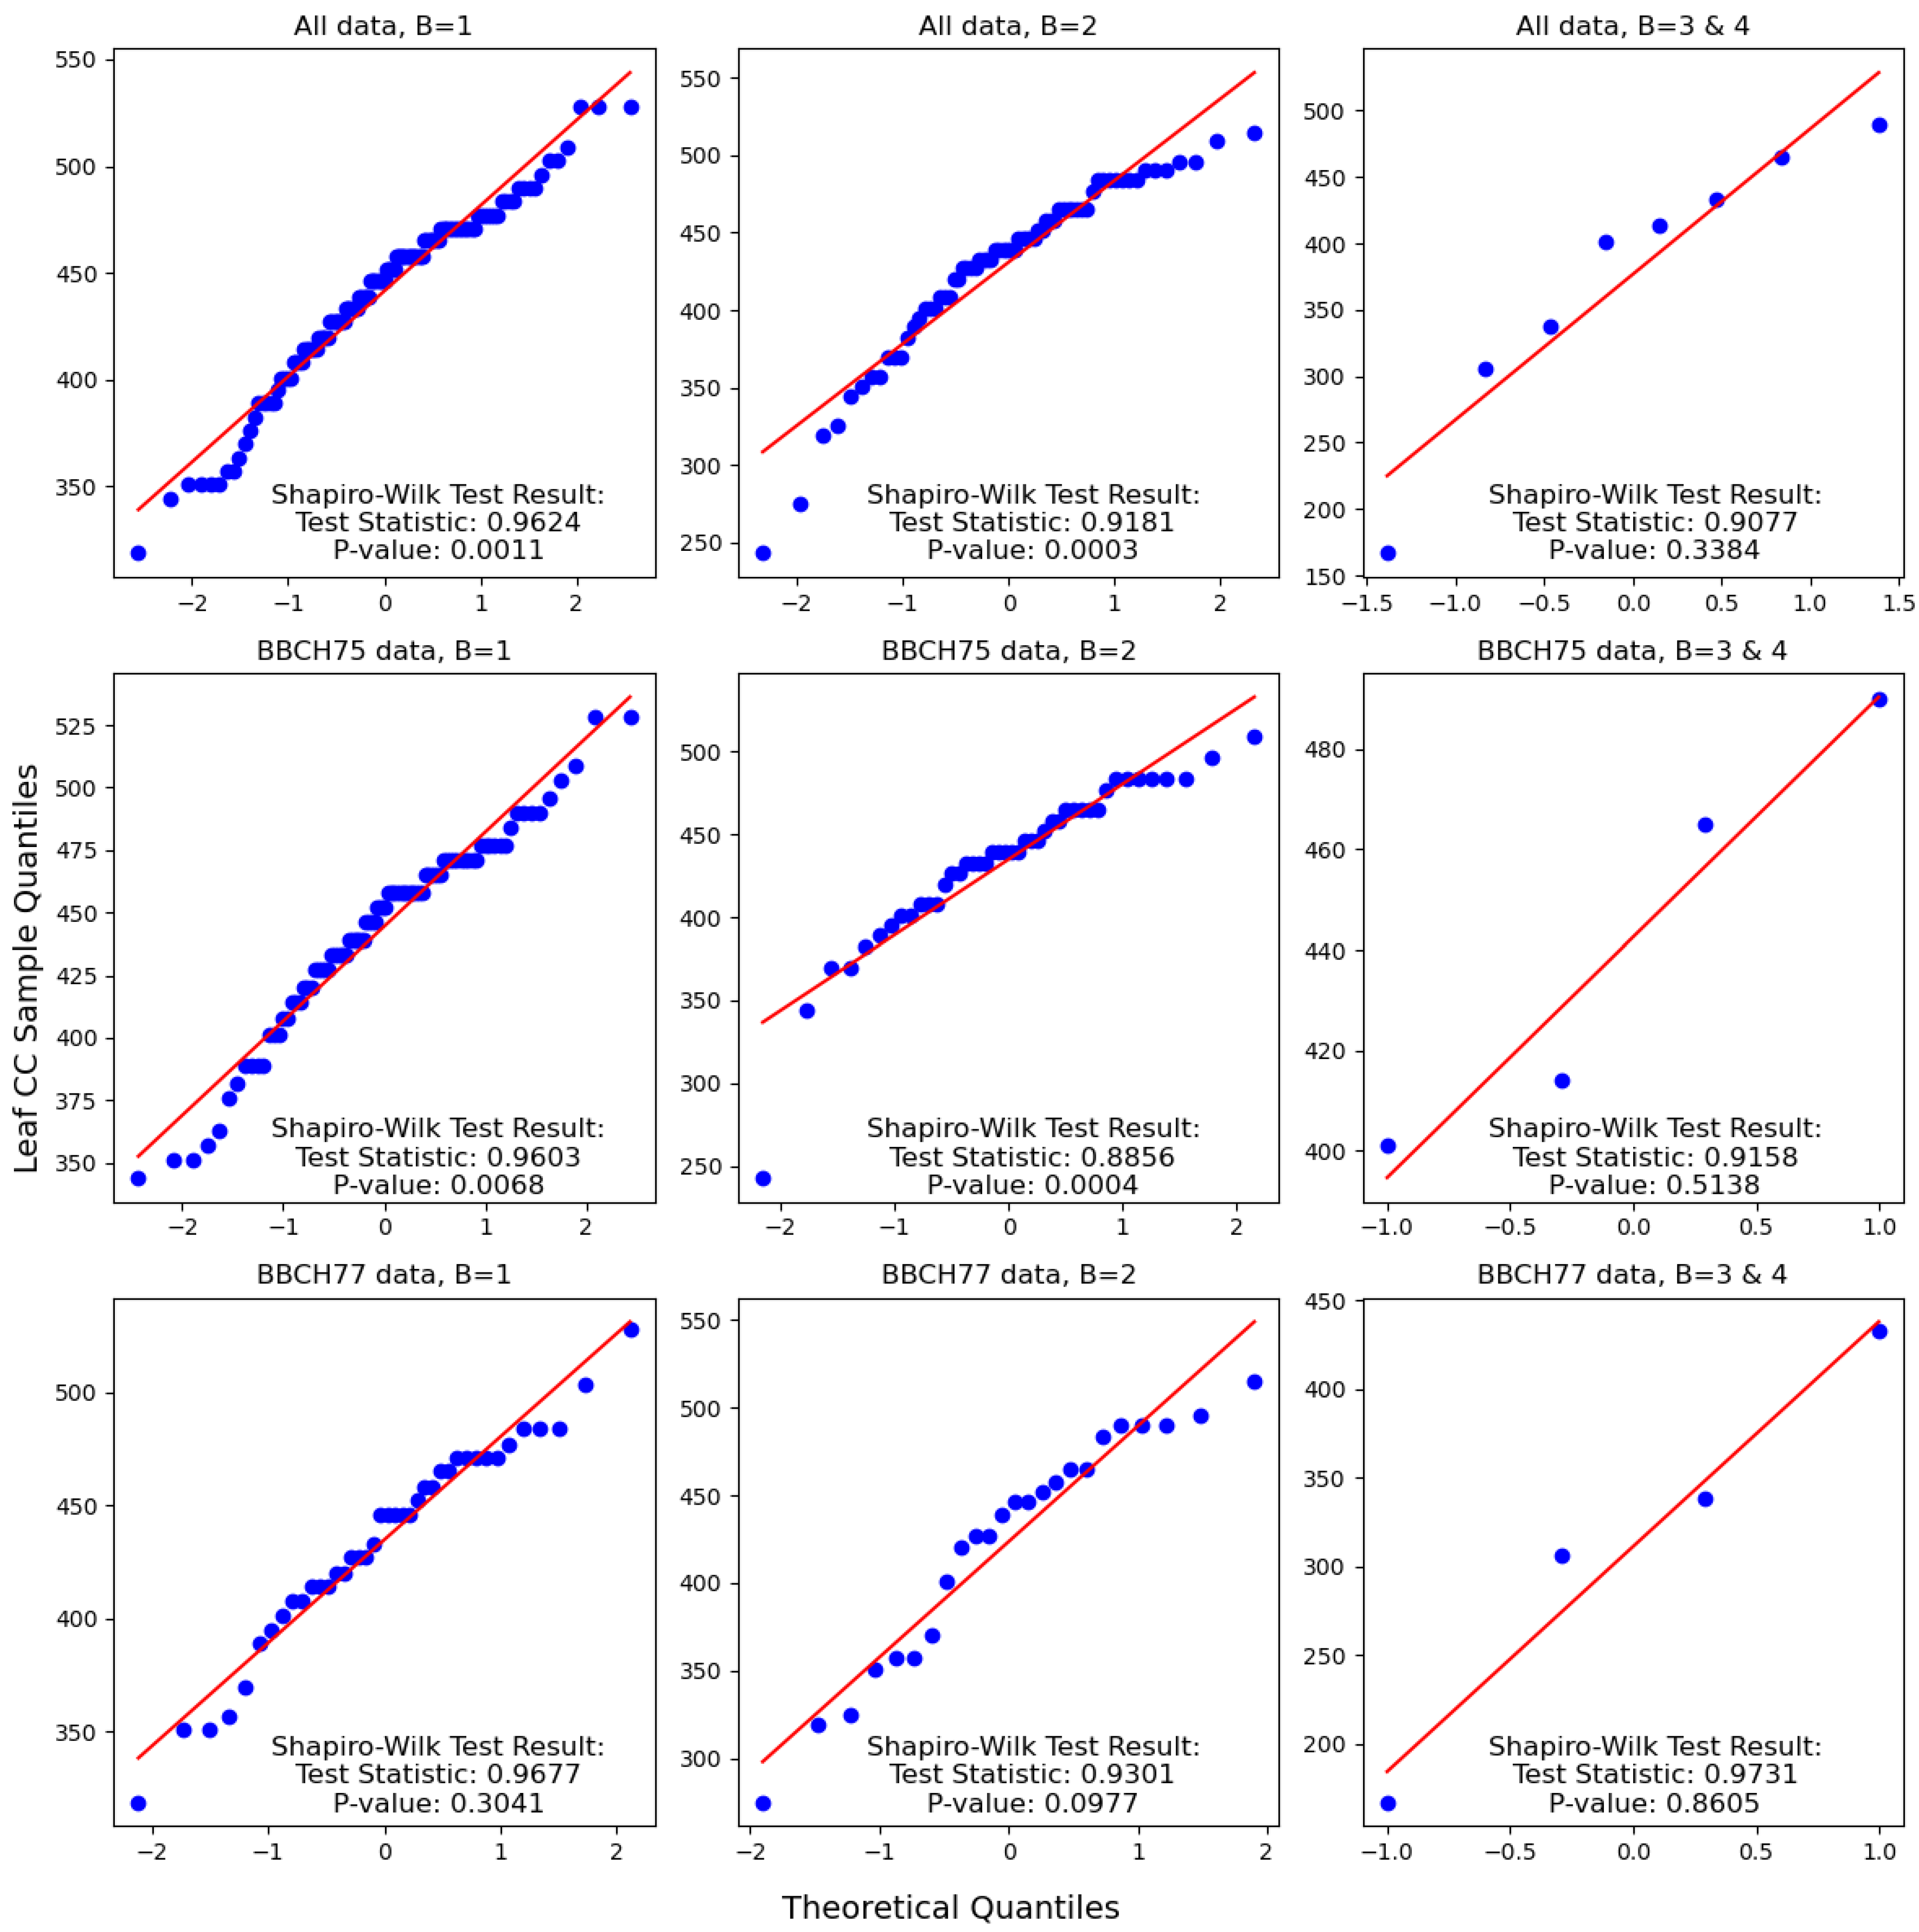
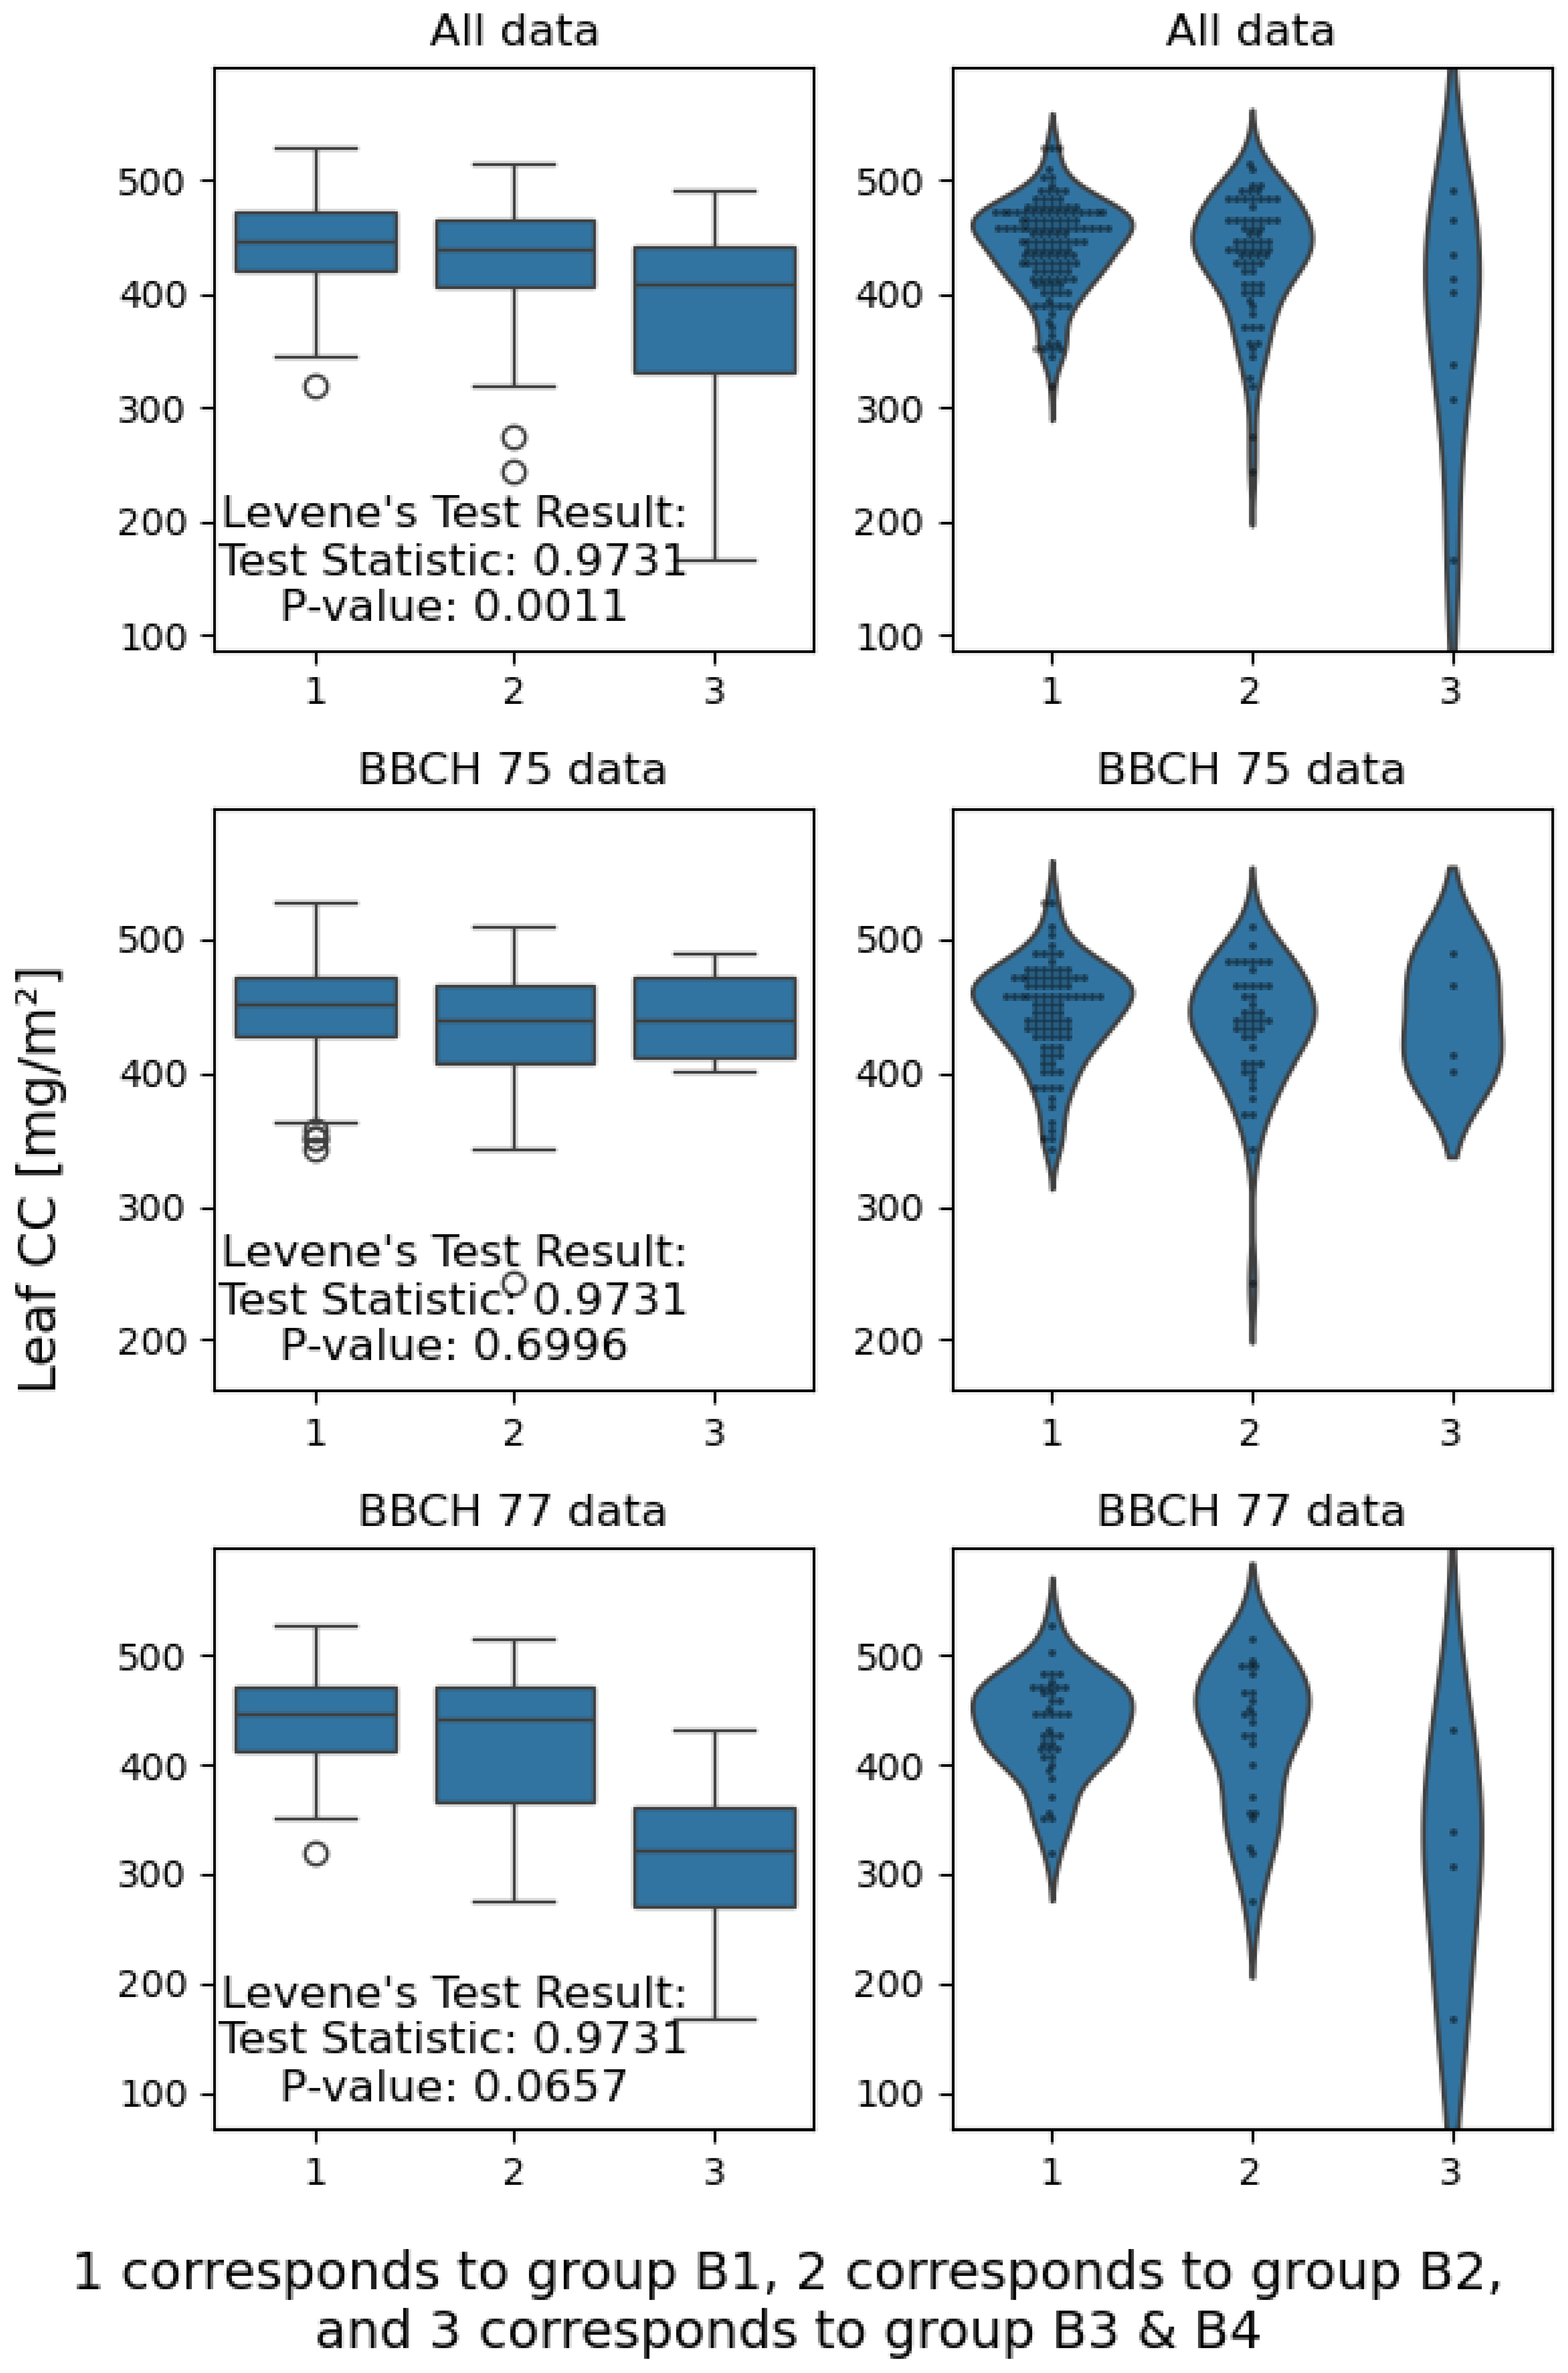
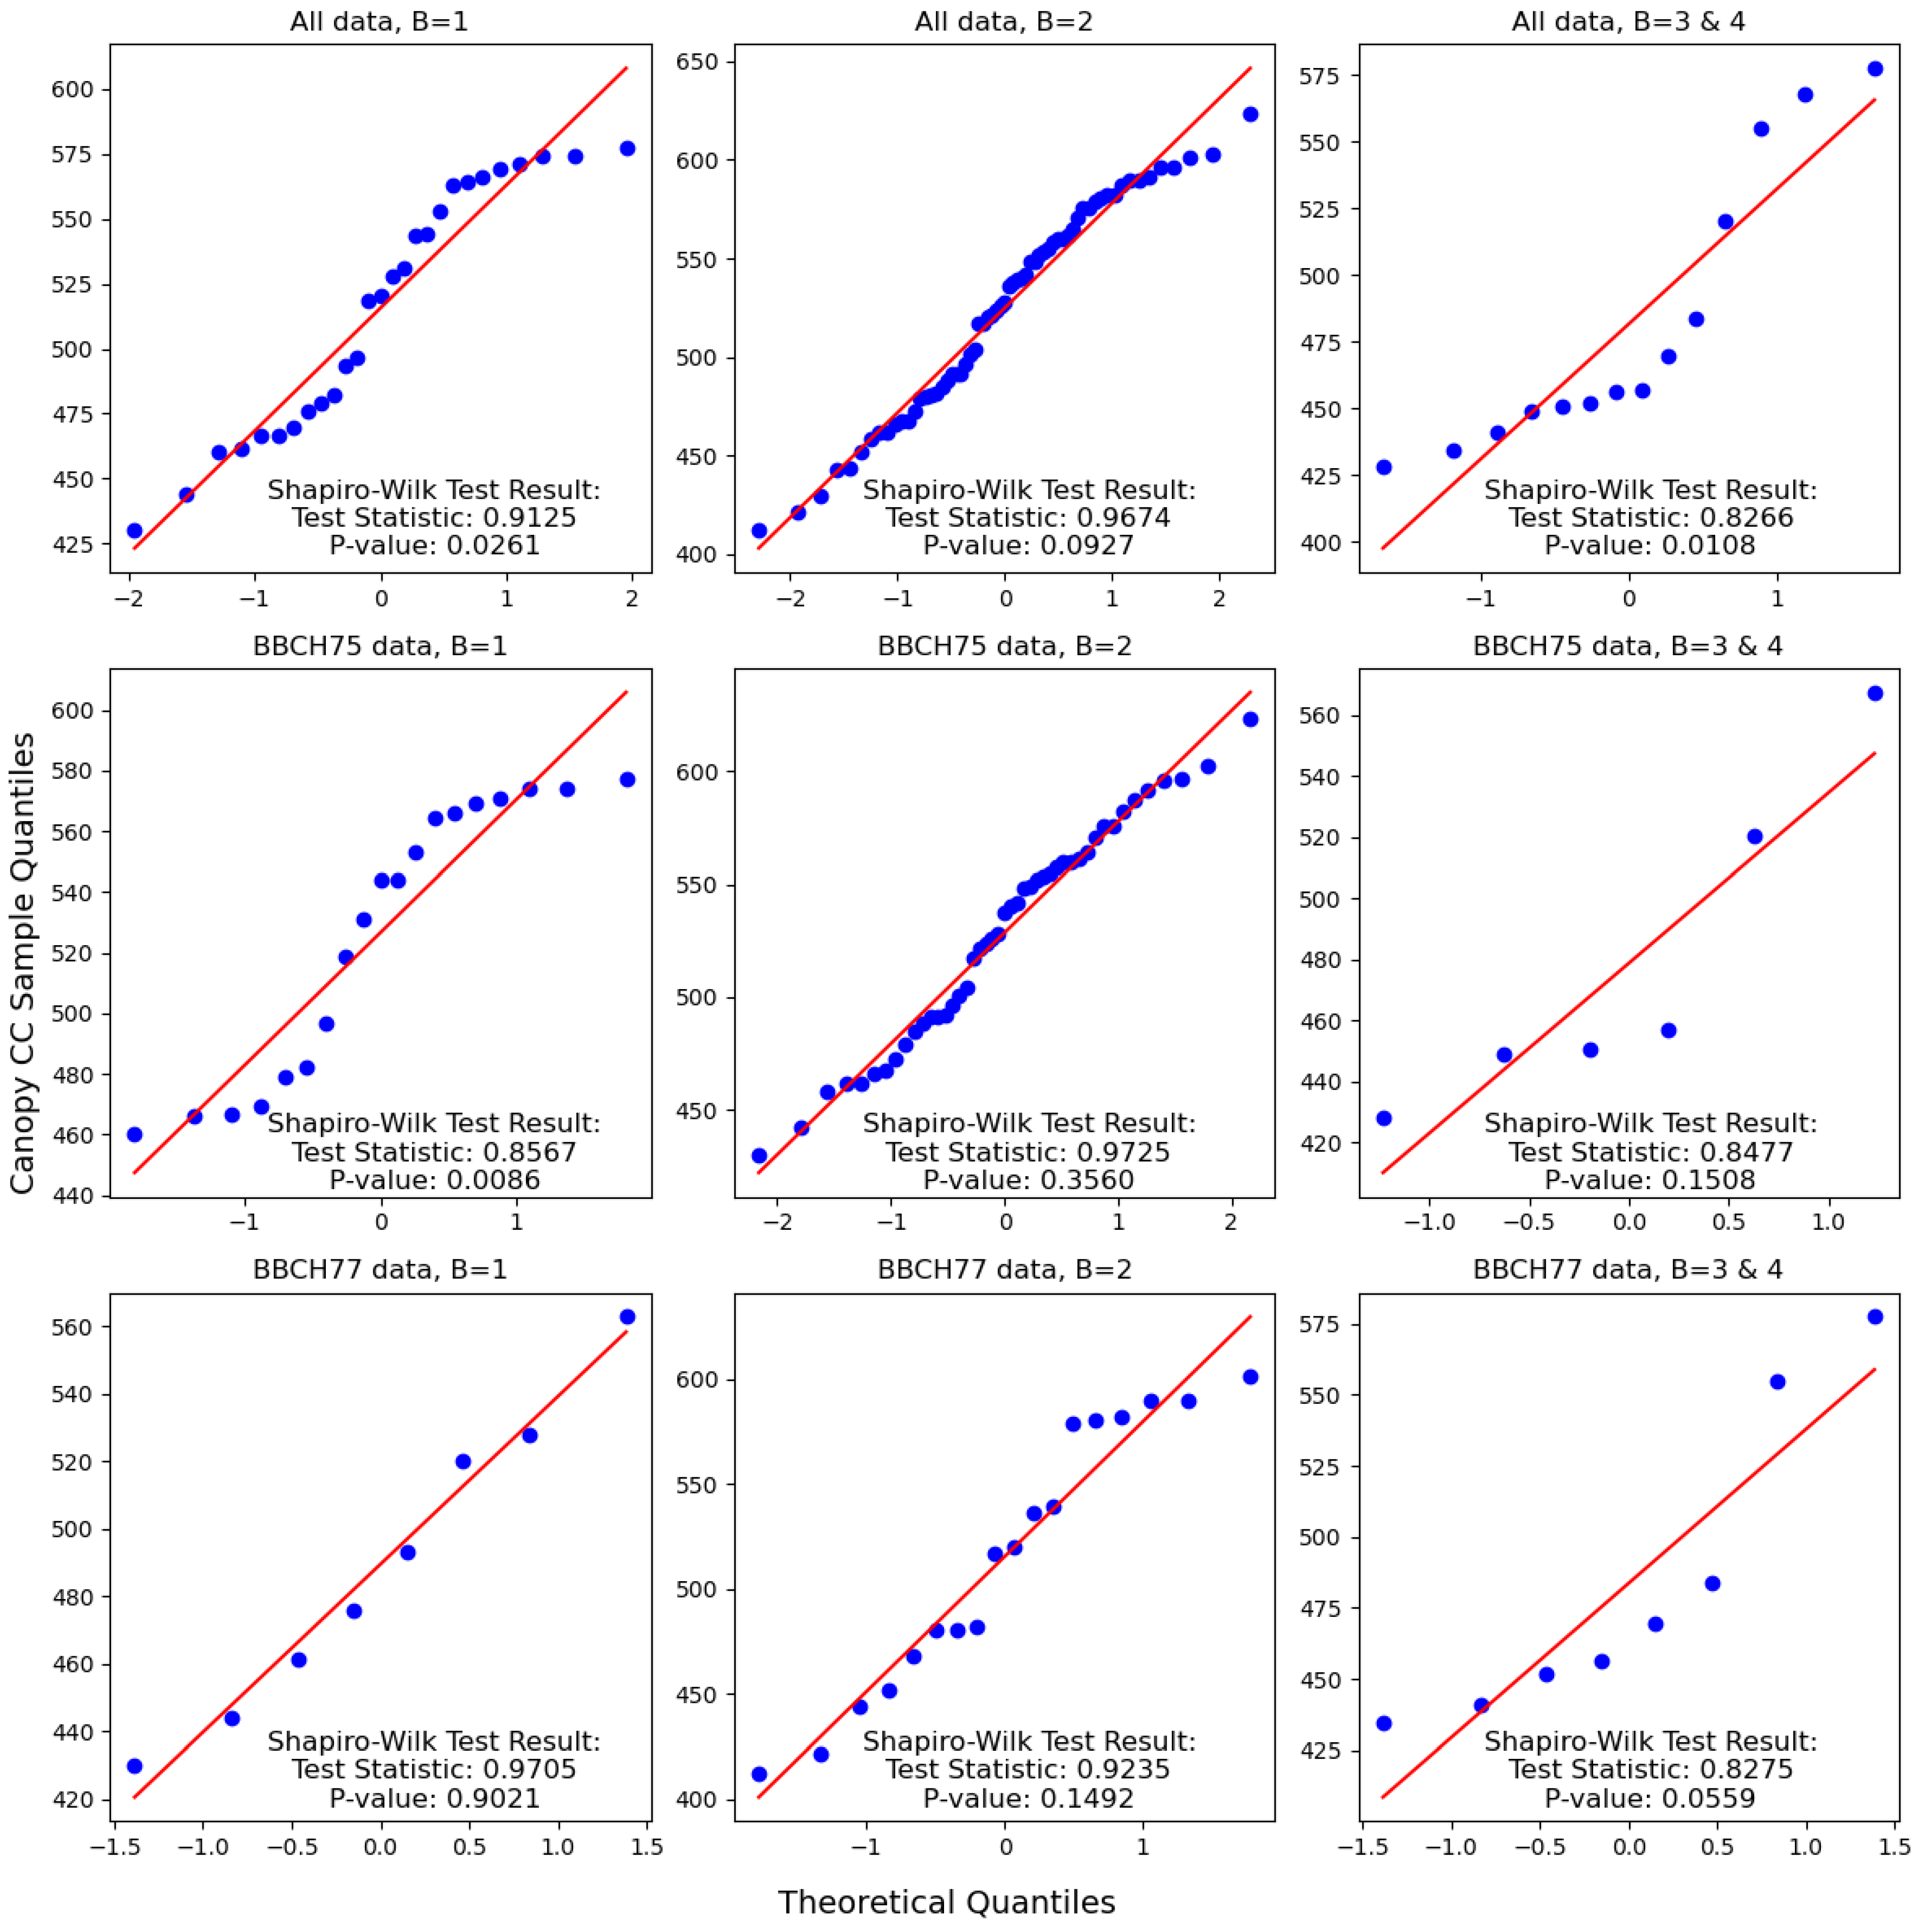
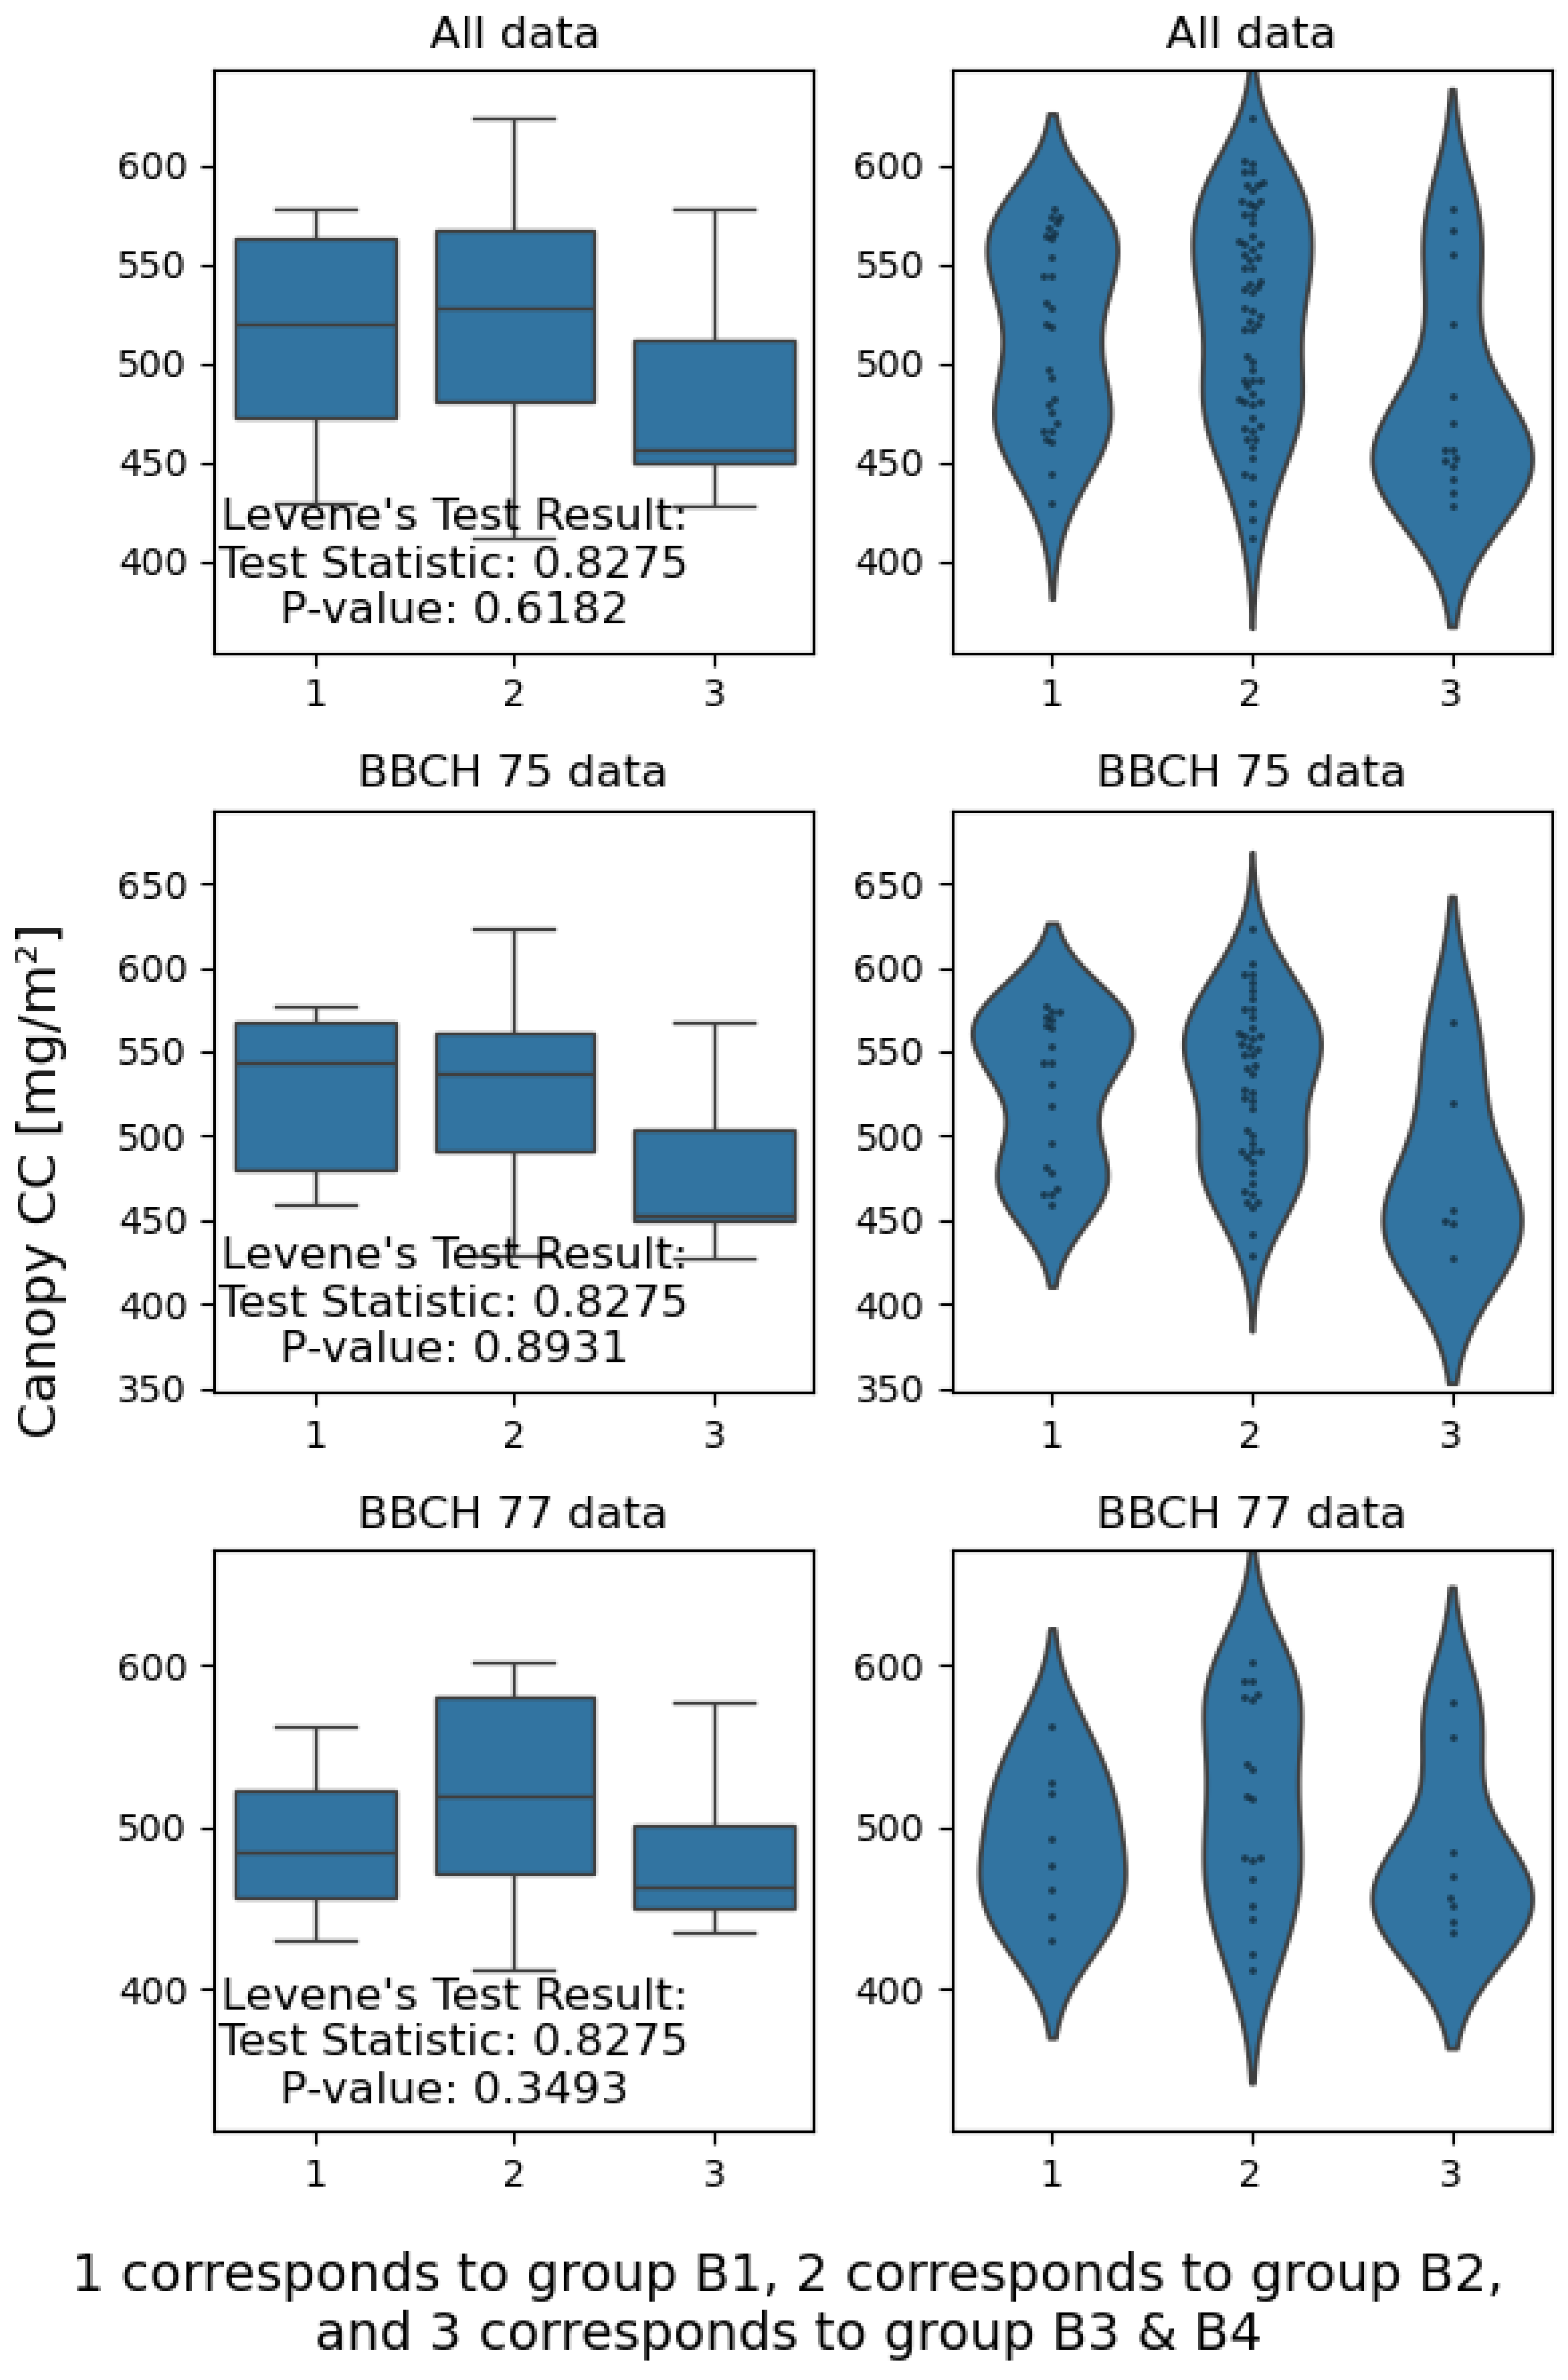
The data were visualized and analyzed for normality and equal variance. The results are depicted in Figure A1, Figure A2, Figure A3 and Figure A4.
We applied the Kruskal–Wallis test to examine whether a statistically significant difference exists in the median chlorophyll content (CC) across distinct disease severity levels. When the null hypothesis (H0) was rejected, we conducted a Conover-Iman post hoc procedure, Table 4. Our findings indicate that at the leaf level, there exists a statistically significant difference in the median chlorophyll content (CC) among distinct disease severity levels only for genotypes in the late group. Specifically, the difference is observed between genotypes in categories B1 and B2 and between B1 and B3_4. However, considering all genotypes, a statistically significant difference in the median chlorophyll content (CC) among distinct disease severity levels is evident at the canopy level. Notably, this difference is observed between categories B2 and B3_4.

3.2. Correlation and Regression Analysis

The results from the correlation analysis at the canopy and leaf level are presented in Table 5.
Table 6 presents a parametric regression analysis with the best correlating VIs from Table 5. Table 7 displays the results from scenario 1, which involves nonparametric models using the 16 selected spectral bands. In Table 8, the results from scenario 2 are presented, wherein nonparametric models are utilized with all available 601 spectral bands (ranging from 400 nm to 1000 nm). As for scenario 3, involving nonparametric models with the nine selected VIs, no satisfactory retrieval results were achieved; hence, no results are displayed.

4. Discussion

With this study, we aimed to evaluate the performance of various regression models and machine learning algorithms to automate the assessment of disease severity in winter durum wheat. Hyperspectral data collected from field spectroscopy phenotyping experiments under natural field conditions were utilized at the canopy and leaf levels. We assessed the severity of rust and leaf spot infestations across 52 test genotypes.

4.1. Effect of Disease Severity and Phenophase on Chlorophyll Content

Our findings revealed that at the leaf level (Table 3 and Table 4), there is a statistically significant difference observed in CC between genotypes in categories B1 and B2, as well as between B1 and B3_4. These results are consistent with previous studies demonstrating that wheat leaf rust accelerates leaf and ear senescence [68], significantly affecting leaf physiological processes and morphology [69,70]. Pathogens such as leaf rust and leaf spot reduce photosynthetic activity in infected leaves by diminishing green leaf area, thereby decreasing chlorophyll content [70].
However, at the canopy level (Table 4), a statistically significant difference is evident in CC when considering all genotypes. Notably, this difference is observed between categories B2 and B3_4. It is worth noting that while CC and disease severity at the canopy level were measured in the flag leaf, rust, and leaf spots typically progress from the lower leaves toward the flag leaf. Therefore, a variety may exhibit higher mean rust severity, but less on the flag leaves when measuring chlorophyll contents [71].

4.2. Spectral Reflectance of Wheat Disease at Different Growth Stages

Analyzing the spectral reflectance of both leaf and canopy samples, as presented in Figure A5, proved challenging due to significant variations in values across different disease levels. Therefore, we opted to average the spectral reflectance data to discern underlying trends, as summarized in Figure 5.
At the leaf level and within the early group (Figure 5a), we observed a decrease in VIS reflectance as their disease level increased, accompanied by a slight rightward shift of the red-edge and a reduction in NIR reflectance. Up to 550 nm in the VIS region, our findings align with those of Devadas et al. (2009) [23], except for the red region, where leaves with higher disease levels exhibit greater reflectance than healthy ones. Furthermore, our NIR region data pattern corresponds to that reported by Ashourloo et al. (2014) [31]. Conversely, within the late disease group at the leaf level (Figure 5b), we noted an increase in VIS reflectance with rising disease levels, a slight leftward shift of the red-edge and an increase in NIR reflectance. While our VIS and red-edge region data coincide with Ashourloo et al. (2014) [31], our NIR region data aligns with Devadas (2009) [23].
At the canopy level within the early group (Figure 5c), increasing disease levels led to increased VIS reflectance, a leftward shift of the red-edge, and an increase in NIR reflectance. Our observations across the VIS, red-edge, and NIR regions mirror those reported by Liu et al. (2023) [72]. However, within the late group at the canopy level (Figure 5d), an increase in disease level resulted in decreased NIR reflectance, consistent with findings by Huang et al. (2022) [35] and Zheng et al. (2019) [25]. Interestingly, differences in disease levels did not significantly impact reflectance in the VIS and red-edge areas.
The spectral signatures of crop leaf and canopy display unique trends influenced not only by the type of disease [14], but also by the stage of phenological development [24]. This multifaceted relationship adds complexity to both model selection and interpretation.
Notably, spectral signatures between the early and late disease groups at both leaf and canopy levels exhibit opposite trends. This discrepancy likely contributed to our inability to develop a single model for all data, necessitating the creation of separate models for the early and late disease groups (refer to Table 7 and Table 8).

4.3. Disease Severity Assessment

Our experiment assessed disease severity at the BBCH 75 and BBCH 77 stages, acknowledging its late occurrence within the cropping season. While ideal for accurate disease evaluation, this timing presents limitations for implementing control measures, as most effective interventions require earlier application. While early rust detection is crucial for farmers, early stage symptoms are often mild and challenging to identify [73]. However, for breeders, the information provided by our study can be valuable for timely field monitoring and identification of relevant genotypes for further analysis.
The genotypes observed at BBCH 75 or BBCH 77 represent crops at distinct phenological growth stages. However, considering environmental factors and agrotechnical practices such as soil cultivation, sowing, fertilization, and pest and disease management, we classify those at BBCH 75 as “early genotypes” and those at BBCH 77 as “late genotypes”. Notably, this classification may align differently from the original categorization of genotypes as early or late. Instead, it reflects their behavior during the studied growing year at the time of measurement. Furthermore, our findings indicate that these two groups exhibit different spectral behaviors concerning disease severity and chlorophyll content (refer to Figure 5 and Table 5).

4.3.1. Leaf Level

Generating representative and accurately labeled training data for disease detection at the leaf scale under controlled laboratory conditions presents a significant challenge [14]. In our case, this limitation stems from the fact that only spectra from the green portions of the leaf exhibiting disease characteristics are measured. At this level, spectral data are collected from the exact location as chlorophyll measurements rather than where the disease is visibly present. Consequently, it indirectly detects changes in a leaf affected by disease.
This is likely why, at the leaf level, leaf CC is primarily retrieved with hyperspectral data. Our correlation analysis tested nine VIs specifically developed for wheat disease detection (refer to Table 1). The VIs with the highest correlation to leaf CC are YROI (Pearson coefficient = −0.73) for the genotypes in the late group, closely followed by LRDSI_1 (Pearson coefficient = −0.72). YROI was developed for both leaf and canopy levels and utilizes three bands in the spectrum’s red, green, and blue regions, whereas LRDSI_1 is designed for the leaf level and employs only two bands in the red and blue regions.
Despite the strong correlation between leaf CC and the selected VIs, no parametric model could retrieve leaf CC accurately (refer to Table 6). However, parametric models utilizing the SIPI formula between the data from bands at 800 nm, 690 nm, and 700 nm achieved relatively good results during cross-validation (R2 = 0.63). Still, they exhibited unsatisfactory results during the test (R2 = 0.42).
The nonparametric models using the nine selected VIs (refer to Table 1) did not yield favorable results during either cross-validation or the test. Consequently, these results are not presented. Like scenario 1 (refer to Table 7), the nonparametric models employing all available spectral bands (refer to Table 8) tended to overfit and performed poorly with the test data.
Our findings (refer to Table 7 and Table 8) confirm that infections by pathogens lead to necrotic or chlorotic lesions, which subsequently diminish the chlorophyll content response in the spectrum’s visible (VIS) and red-edge regions [18,19,32,72,74]. Moreover, our results suggest that the near-infrared (NIR) spectral region also plays a role in this process [35].
In our results, the direct measurement of disease severity, DA, is present in the correlation analysis (refer to Table 5). The highest significant correlation coefficient is 0.51 for the late group and SIPI, indicating the involvement of the blue, red-edge, and NIR bands.

4.3.2. Canopy Level

Generating representative and accurately labeled training data for disease detection at the canopy scale under natural field conditions also poses a significant challenge, albeit different from that encountered at the leaf level, yet equally crucial. The data for disease severity, DA, is collected from several flag leaves and subsequently averaged per plot, similar to the canopy chlorophyll content (CC) measurements. However, the spectral data consists of mixed plant, fungal material, and soil spectra. Additionally, it is influenced by the weather conditions at the time of data acquisition, the complexity of the canopy, and non-uniform backgrounds.
It is noteworthy that for the canopy level, we obtained relatively good results for both canopy CC and canopy DA for each group, early and late, when considered separately (refer to Table 7 and Table 8). However, we could not identify a model that effectively incorporates all available data.
Comparable models were identified for canopy CC (refer to Table 7) in each group, early and late, using scenario 1, which involves parametric functions with 16 selected bands and the SIPI formula. The spectral bands utilized are slightly different for each group and arranged in a different order within the formula. However, the bands are part of the blue and green spectral regions in both cases.
Similarly, comparable models were identified for canopy DA (refer to Table 8) in each group, early and late, using scenario 2, which involves nonparametric algorithms with all available spectral bands. Interestingly, in both cases, the selected bands by the machine learning algorithm are part of the blue, red, red-edge, and NIR spectral regions.

4.4. Limitations and Future Work

4.4.1. Challenges in Disease Data Collection for Hyperspectral Disease Severity Assessment

While visual assessment by plant breeders remains the prevalent method for collecting disease data, it suffers from inherent limitations. The subjectivity associated with individual expertise and training can lead to inconsistent results and hinder the comparability of data collected by different breeders within the same study and across different studies. For example, our disease assessment method shares similarities with the canopy-level assessment used for wheat in the study by Koc et al. (2022) [19], but there are key differences. We focused solely on flag leaves for assessment, whereas Koc et al. (2022) utilized the “whole plot”. Additionally, in our study we employed a different grouping scheme for the percentage of diseased area compared to their disease scale. Relying solely on visual assessment introduces limited objectivity, making it challenging to quantify disease severity accurately.
To address these limitations and improve data quality, exploring objective analysis methods such as sampling and image analysis of diseased leaves offers a more quantifiable and standardized approach than visual assessment. Furthermore, standardizing data collection across different studies is crucial. This could involve establishing consistent definitions for disease assessment or implementing standardized scales for disease severity levels for wheat, similar to those existing for grapevine powdery mildew [75].
By adopting objective and standardized data collection practices, we facilitate data comparison and analysis, ultimately enabling the development of more robust and reliable disease prediction models. These models can then be leveraged for earlier and more accurate disease detection, targeted resource allocation for disease control, and the development of improved disease management strategies.

4.4.2. Chlorophyll Content as a Proxy for Detecting Disease Severity

Chlorophyll content (CC), a crucial indicator of wheat health and productivity, reflects photosynthetic capacity and nitrogen status [36,70]. Multiple factors, including disease infection, genetic variation, nitrogen deficiency, and environmental conditions, can influence CC [25]. In our breeding experiment, all plots were subjected to identical environmental conditions and received the same level of nitrogen fertilizer. Our results showed that leaf CC in the late group displayed a sharp decline as disease severity increased, Table 3, unlike the early group where CC remained stable. Canopy CC, on the other hand, exhibited a slight downward trend across all genotypes with increasing disease severity. A study conducted by Ren et al. (2021) [18] revealed a correlation between leaf disease severity and the distribution of leaf chlorophyll content, suggesting a downward trend as the severity of leaf disease increases. However, we also noted that as the disease advanced, a decrease in chlorophyll content was merely one among several symptoms of yellow rust. Therefore, while monitoring chlorophyll content could partly indicate crop health conditions, it did not directly reflect the disease status of wheat leaves. Hence, it is imperative to understand the precise relationship between wheat diseases and CC thoroughly. This understanding is essential for evaluating whether, and under what conditions, predicting CC could effectively serve as a proxy for determining disease severity.

4.4.3. Phenological Crop Growth Stages on Monitoring Crop Disease

Our investigation focused on two closely related phenological crop growth stages, BBCH 75 and BBCH 77, to determine their significance for disease severity assessment. Our findings revealed the importance of these stages as key characteristics at both the leaf and canopy levels. However, in our case, those growth stages are related to early and late genotypes; refer to Section 4.1 for more explanation.
Phenological crop growth stages were discussed in other studies, where the crop was inoculated at a particular growing stage. Then, the progress of the disease was monitored during the consecutive growing stages. In this case, contrasting results were observed regarding the influence of phenological crop growth stages on monitoring crop disease using remotely sensed derived information. For instance, Huang et al. (2007) [27] found that the growth development stage of the varieties does not affect the discrimination of rust incidence, in contrast to the findings of Heidarian Dehkordi et al. (2021) [21], who reported a strong correlation between cropping season progression and wheat strip rust.
A third case of using the growth stage in disease detection and severity assessment is when the crop is inoculated at different growing stages. In this case, Khan et al. (2021) [28] observed that disease detection during the booting stage outperformed that during the jointing stage, possibly due to differing rates of disease spread at these two growth stages.
In natural field experiments, environmental conditions conducive to disease onset can initiate or accelerate disease development, leading to noticeable alterations in plants’ biophysical and biochemical parameters, consequently affecting spectral responses [76]. However, whether the same disease severity at different phenological growth stages will exhibit the same spectral response is still being determined. Further investigation is needed into the impact of phenological crop growth stages on crop disease.

4.4.4. Texture Information, Short-Wave Infrared Regions, and Application to Hyperspectral Airborne or Space-Borne Imagery

In our study we concentrated on the visible and NIR regions of the spectrum. However, it is important to note that the shortwave infrared (SWIR) region contains valuable information regarding plant water content and cell structure [24], which are influenced by disease. Subsequent investigations could explore the potential of incorporating SWIR features alongside existing NIR and visible features to enhance the accuracy of disease severity assessment. Moreover, research [28,40] has shown that incorporating texture information alongside spectral data enhances the models for disease detection. Furthermore, although our studies relied on ground-based spectroscopy, scaling the methodology to airborne or spaceborne platforms presents significant opportunities. Future research could focus on adapting current disease detection models to analyze hyperspectral data from UAVs or satellites. This advancement would facilitate large-scale, non-invasive disease monitoring across extensive agricultural fields, improving disease management strategies and crop health assessment.

4.4.5. Replicability of the Proposed Approach

Considering the diverse factors that can influence the spectral response of disease severity in wheat, such as wheat variety, weather conditions, and growth stage, it is crucial to evaluate the reproducibility of using canopy and leaf spectroscopy for assessing wheat disease severity.
Addressing the sources of variability in winter durum wheat leaf disease detection with canopy and leaf spectroscopy requires careful consideration and implementation of appropriate mitigation strategies. Firstly, incorporating diverse wheat varieties in the study can help account for varietal differences in symptom expression. By including a range of wheat cultivars known to exhibit varying disease susceptibilities and symptomatology, researchers can obtain a more comprehensive understanding of the spectral response patterns associated with different disease states across diverse genotypes. Secondly, conducting measurements under controlled lighting conditions is crucial for minimizing the influence of weather variability on spectroscopic data. By standardizing lighting conditions during data acquisition, researchers can reduce the impact of fluctuations in sunlight intensity, cloud cover, and shadowing effects, ensuring more consistent and reliable spectral measurements. Additionally, capturing data at multiple growth stages throughout the growing season is essential for capturing temporal variations in disease incidence and plant physiology. By monitoring spectral responses at key phenological stages, researchers can assess how disease severity evolves over time and identify critical stages for disease management interventions. Overall, integrating these mitigation strategies into the experimental design and data analysis process can enhance the robustness and replicability of the spectroscopic approach for winter durum wheat leaf disease detection.
Additionally, expanding the scope of comparison to encompass a wider range of crops would be valuable. This would allow us to assess the generalizability of our findings and determine if the observed relationships between spectral data and disease severity hold true across different plant species. By drawing on results already established in precision agriculture for other crops, we can strengthen the overall understanding and applicability of this approach for disease detection.

5. Conclusions

We investigated the potential of field spectroscopy-derived hyperspectral data, analyzed at both leaf and canopy levels, coupled with machine learning regression, for assessing the disease severity of rust and leaf spots in winter durum wheat. This approach offers a cost-effective and sustainable solution for phenotyping experiments, complementing efforts in developing resistant wheat varieties. To assess disease severity, we conducted a field experiment with 52 winter durum wheat genotypes, grouped into early (medium milk) and late (late milk) based on phenophase, under natural field conditions.
We showed that the spectral signatures between the early and late disease groups at both leaf and canopy levels exhibit opposite trends. This characteristic impacted all our results. We argued for the pertinence of the CC as a proxy for the disease severity assessment and its link to the growth stage, because we found a significant reduction in Leaf CC (>30%) in the late group and Canopy CC (<10%) for both groups.
We were unable to develop a single model for all the data, necessitating the creation of separate models for the early and late disease groups. From the correlation analysis, only two vegetation indices, YROI and LRDSI_1, from the nine tested revealed significant and strong negative correlations (r > 70%) with Leaf CC in the late group. Despite this strong significant correlation, the parametric regression models lacked the necessary accuracy (R2 < 0.5). To address this limitation, we explored parametric functions and nonparametric algorithms utilizing hyperspectral data covering all spectral bands. Those models have improved performance, but it is essential to acknowledge that they still exhibit only moderate accuracy and limited generalizability. The best model that we obtained was for leaf CC retrieval for the late group, achieving an R2 of 0.63 and 0.42 for cross-validation and test datasets, respectively.
Due to the complex interaction of factors like wheat variety, weather conditions, and plant growth stage that affect the spectral response of disease severity, assessing the repeatability of canopy and leaf spectroscopy for wheat disease detection is essential. Additionally, expanding the scope of comparison to encompass a wider range of crops would be valuable. Further multidisciplinary research is crucial, alongside standardized data collection methods, to unlock the full potential of spectral disease detection. This collaborative effort will equip crop breeders with powerful tools for early and targeted interventions, enabling them to quickly identify resistant wheat varieties and promote sustainable and efficient crop management.

Author Contributions

Conceptualization, D.G., L.F. and E.R.; methodology, D.G.; software, D.G.; validation, D.G.; formal analysis, D.G.; investigation, D.G., L.F., E.R., R.D. and S.N.; resources, E.R. and V.B.; data curation, D.G., L.F., R.D. and S.N.; writing—original draft preparation, D.G., E.R. and S.N.; writing—review and editing, D.G., L.F., E.R., R.D., S.N. and V.B.; visualization, D.G., L.F. and R.D.; supervision, E.R. and V.B.; project administration, E.R. and V.B.; funding acquisition, E.R. and V.B. All authors have read and agreed to the published version of the manuscript.

Funding

This research was funded by the Bulgarian Ministry of Education and Science through the National Research Programme “Smart Crop Production” approved by the Decision of the Ministry Council No. 866/26.11.2020 г.

Data Availability Statement

Not publicly available but will be available after the end of the project, end of 2024, from the corresponding author upon reasonable request.

Acknowledgments

The authors thank the Bulgarian Ministry of Education and Science for the support of the National Research Programme “Smart Crop Production” approved by the Decision of the Ministry Council No. 866/26.11.2020 г. This research was also supported by the Action CA22136 PANGEOS (Pan-European Network of Green Deal Agriculture and Forestry Earth Observation Science) funded by COST (European Cooperation in Science and Technology, www.cost.eu, accessed on 1 March 2024). D. Ganeva was partially supported by the Bulgarian Ministry of Education and Science under the National Research Programme “Young Scientists and Postdoctoral Students-2” approved by DCM No. 206/07.04.2022.

Conflicts of Interest

The authors declare no conflicts of interest.

Appendix A

Figure A1. Visualization with Q-Q plot of the data for normality assumptions and results of Shapiro–Wilk test at leaf level.
Remotesensing 16 01762 g0a1
Figure A2. Visualization with boxplot and violin of the data for equal variance assumptions and results of Levene’s test at leaf level.
Remotesensing 16 01762 g0a2
Figure A3. Visualization with Q-Q plot of the data for normality assumptions and results of Shapiro–Wilk test at canopy level.
Remotesensing 16 01762 g0a3
Figure A4. Visualization with boxplot and violin of the data for equal variance assumptions and results of Levene’s test at canopy level.
Remotesensing 16 01762 g0a4
Figure A5. Spectra used for the regression analysis for (a) the leaf early group, (b) the leaf late group, (c) the canopy early group, and (d) the canopy late group.
Remotesensing 16 01762 g0a5

References

  1. Global Durum Wheat Use Trending Upward|World-Grain.Com|11 October 2017 18:22|World Grain. Available online: https://www.world-grain.com/articles/8777-global-durum-wheat-use-trending-upward (accessed on 18 December 2023).
  2. Figueroa, M.; Hammond-Kosack, K.E.; Solomon, P.S. A Review of Wheat Diseases—A Field Perspective. Mol. Plant Pathol. 2018, 19, 1523–1536. [Google Scholar] [CrossRef] [PubMed]
  3. Huerta-Espino, J.; Singh, R.P.; Germán, S.; McCallum, B.D.; Park, R.F.; Chen, W.Q.; Bhardwaj, S.C.; Goyeau, H. Global Status of Wheat Leaf Rust Caused by Puccinia triticina. Euphytica 2011, 179, 143–160. [Google Scholar] [CrossRef]
  4. Rodeva, R.; Stoyanova, Z.; Nedyalkova, S.; Pastirčák, M.; Hudcovicova, M. Vertical Distribution of Foliar Pathogens on Wheat. Agric. Sci. Technol. 2014, 6, 341–345. [Google Scholar]
  5. Rodeva, R. Septoria Diseases on Wheat—Cause Agents, Symptoms, Epidemiology, and Disease Control. Field Crops Stud. 2004, 1, 328–335. [Google Scholar]
  6. Shipton, W.A.; Boyd, W.R.J.; Rosielle, A.A.; Shearer, B.I. The Common Septoria Diseases of Wheat. Bot. Rev. 1971, 37, 231–262. [Google Scholar] [CrossRef]
  7. King, J.E.; Cook, R.J.; Melville, S.C. A Review of Septoria Diseases of Wheat and Barley. Ann. Appl. Biol. 1983, 103, 345–373. [Google Scholar] [CrossRef]
  8. Eyal, Z.; Scharen, A.L.; Prescott, J.M.; van Ginkel, M. The Septoria Diseases of Wheat: Concepts and Methods of Disease Management; CIMMYT: Mexico City, Mexico, 1987; ISBN 978-968-6127-06-5. [Google Scholar]
  9. Cunfer, B.M.; Ueng, P.P. Taxonomy and Identification of Septoria and Stagonospora Species on Small-Grain Cereals. Annu. Rev. Phytopathol. 1999, 37, 267–284. [Google Scholar] [CrossRef] [PubMed]
  10. Todorova, M. First Report of Tan Spot Caused by Pyrenophora tritici-Repentis (Anamorph Drechslera tritici-Repentis) in Bulgaria. Plant Pathol. 2006, 55, 305. [Google Scholar] [CrossRef]
  11. Nedyalkova, S.; Stoyanova, Z.; Georgieva, V.; Rodeva, R. Occurrence and Relative Prevalence of Fungal Pathogens on Durum Wheat. Int. J. Innov. Approaches Agric. Res. 2019, 3, 442–454. [Google Scholar] [CrossRef]
  12. Fernandez, M.R.; Clarke, M.; DePauw, R.M. Comparison of Durum and Common Wheat Cultivars for Reaction to Leaf Spotting Fungi in the Field. Plant Dis. 1996, 80, 793–797. [Google Scholar] [CrossRef]
  13. Gilbert, J.; Woods, S.M.; Tekauz, A. Relationship between Environmental Variables and the Prevalence and Isolation Frequency of Leaf-Spotting Pathogens in Spring Wheat. Can. J. Plant Pathol. 1998, 20, 158–164. [Google Scholar] [CrossRef]
  14. Bohnenkamp, D.; Kuska, M.T.; Mahlein, A.-K.; Behmann, J. Hyperspectral Signal Decomposition and Symptom Detection of Wheat Rust Disease at the Leaf Scale Using Pure Fungal Spore Spectra as Reference. Plant Pathol. 2019, 68, 1188–1195. [Google Scholar] [CrossRef]
  15. Zhang, J.; Wang, N.; Yuan, L.; Chen, F.; Wu, K. Discrimination of Winter Wheat Disease and Insect Stresses Using Continuous Wavelet Features Extracted from Foliar Spectral Measurements. Biosyst. Eng. 2017, 162, 20–29. [Google Scholar] [CrossRef]
  16. Vélez, S.; Barajas, E.; Rubio, J.A.; Pereira-Obaya, D.; Rodríguez-Pérez, J.R. Field-Deployed Spectroscopy from 350 to 2500 Nm: A Promising Technique for Early Identification of Powdery Mildew Disease (Erysiphe necator) in Vineyards. Agronomy 2024, 14, 634. [Google Scholar] [CrossRef]
  17. Prechsl, U.E.; Mejia-Aguilar, A.; Cullinan, C.B. In Vivo Spectroscopy and Machine Learning for the Early Detection and Classification of Different Stresses in Apple Trees. Sci. Rep. 2023, 13, 15857. [Google Scholar] [CrossRef]
  18. Ren, Y.; Huang, W.; Ye, H.; Zhou, X.; Ma, H.; Dong, Y.; Shi, Y.; Geng, Y.; Huang, Y.; Jiao, Q.; et al. Quantitative Identification of Yellow Rust in Winter Wheat with a New Spectral Index: Development and Validation Using Simulated and Experimental Data. Int. J. Appl. Earth Obs. Geoinf. 2021, 102, 102384. [Google Scholar] [CrossRef]
  19. Koc, A.; Odilbekov, F.; Alamrani, M.; Henriksson, T.; Chawade, A. Predicting Yellow Rust in Wheat Breeding Trials by Proximal Phenotyping and Machine Learning. Plant Methods 2022, 18, 30. [Google Scholar] [CrossRef] [PubMed]
  20. Singh, R.N.; Krishnan, P.; Singh, V.K.; Sah, S.; Das, B. Combining Biophysical Parameters with Thermal and RGB Indices Using Machine Learning Models for Predicting Yield in Yellow Rust Affected Wheat Crop. Sci. Rep. 2023, 13, 18814. [Google Scholar] [CrossRef]
  21. Heidarian Dehkordi, R.; El Jarroudi, M.; Kouadio, L.; Meersmans, J.; Beyer, M. Monitoring Wheat Leaf Rust and Stripe Rust in Winter Wheat Using High-Resolution UAV-Based Red-Green-Blue Imagery. Remote Sens. 2020, 12, 3696. [Google Scholar] [CrossRef]
  22. He, R.; Li, H.; Qiao, X.; Jiang, J. Using Wavelet Analysis of Hyperspectral Remote-Sensing Data to Estimate Canopy Chlorophyll Content of Winter Wheat under Stripe Rust Stress. Int. J. Remote Sens. 2018, 39, 4059–4076. [Google Scholar] [CrossRef]
  23. Devadas, R.; Lamb, D.W.; Simpfendorfer, S.; Backhouse, D. Evaluating Ten Spectral Vegetation Indices for Identifying Rust Infection in Individual Wheat Leaves. Precis. Agric. 2009, 10, 459–470. [Google Scholar] [CrossRef]
  24. Wójtowicz, A.; Piekarczyk, J.; Czernecki, B.; Ratajkiewicz, H. A Random Forest Model for the Classification of Wheat and Rye Leaf Rust Symptoms Based on Pure Spectra at Leaf Scale. J. Photochem. Photobiol. B Biol. 2021, 223, 112278. [Google Scholar] [CrossRef] [PubMed]
  25. Zheng, Q.; Huang, W.; Cui, X.; Dong, Y.; Shi, Y.; Ma, H.; Liu, L. Identification of Wheat Yellow Rust Using Optimal Three-Band Spectral Indices in Different Growth Stages. Sensors 2019, 19, 35. [Google Scholar] [CrossRef] [PubMed]
  26. Zhao, J.; Yuan, L.; Luo, J.; Du, S.; Huang, L.; Huang, W. Spectral Differences of Opposite Sides of Stripe Rust Infested Winter Wheat Leaves Using ASD’s Leaf Clip. In Proceedings of the 2012 IEEE International Geoscience and Remote Sensing Symposium, Munich, Germany, 22–27 July 2012; pp. 6585–6588. [Google Scholar]
  27. Huang, W.; Lamb, D.W.; Niu, Z.; Zhang, Y.; Liu, L.; Wang, J. Identification of Yellow Rust in Wheat Using In-Situ Spectral Reflectance Measurements and Airborne Hyperspectral Imaging. Precis. Agric. 2007, 8, 187–197. [Google Scholar] [CrossRef]
  28. Khan, I.H.; Liu, H.; Li, W.; Cao, A.; Wang, X.; Liu, H.; Cheng, T.; Tian, Y.; Zhu, Y.; Cao, W.; et al. Early Detection of Powdery Mildew Disease and Accurate Quantification of Its Severity Using Hyperspectral Images in Wheat. Remote Sens. 2021, 13, 3612. [Google Scholar] [CrossRef]
  29. Wang, H.; Qin, F.; Ruan, L.; Wang, R.; Liu, Q.; Ma, Z.; Li, X.; Cheng, P.; Wang, H. Identification and Severity Determination of Wheat Stripe Rust and Wheat Leaf Rust Based on Hyperspectral Data Acquired Using a Black-Paper-Based Measuring Method. PLoS ONE 2016, 11, e0154648. [Google Scholar] [CrossRef] [PubMed]
  30. Yuan, L.; Huang, Y.; Loraamm, R.W.; Nie, C.; Wang, J.; Zhang, J. Spectral Analysis of Winter Wheat Leaves for Detection and Differentiation of Diseases and Insects. Field Crops Res. 2014, 156, 199–207. [Google Scholar] [CrossRef]
  31. Ashourloo, D.; Mobasheri, M.R.; Huete, A. Developing Two Spectral Disease Indices for Detection of Wheat Leaf Rust (Pucciniatriticina). Remote Sens. 2014, 6, 4723–4740. [Google Scholar] [CrossRef]
  32. Huang, W.; Guan, Q.; Luo, J.; Zhang, J.; Zhao, J.; Liang, D.; Huang, L.; Zhang, D. New Optimized Spectral Indices for Identifying and Monitoring Winter Wheat Diseases. IEEE J. Sel. Top. Appl. Earth Obs. Remote Sens. 2014, 7, 2516–2524. [Google Scholar] [CrossRef]
  33. Bravo, C.; Moshou, D.; West, J.; McCartney, A.; Ramon, H. Early Disease Detection in Wheat Fields Using Spectral Reflectance. Biosyst. Eng. 2003, 84, 137–145. [Google Scholar] [CrossRef]
  34. Zhang, T.; Yang, Z.; Xu, Z.; Li, J. Wheat Yellow Rust Severity Detection by Efficient DF-UNet and UAV Multispectral Imagery. IEEE Sens. J. 2022, 22, 9057–9068. [Google Scholar] [CrossRef]
  35. Huang, L.; Liu, Y.; Huang, W.; Dong, Y.; Ma, H.; Wu, K.; Guo, A. Combining Random Forest and XGBoost Methods in Detecting Early and Mid-Term Winter Wheat Stripe Rust Using Canopy Level Hyperspectral Measurements. Agriculture 2022, 12, 74. [Google Scholar] [CrossRef]
  36. Devadas, R.; Lamb, D.W.; Backhouse, D.; Simpfendorfer, S. Sequential Application of Hyperspectral Indices for Delineation of Stripe Rust Infection and Nitrogen Deficiency in Wheat. Precis. Agric. 2015, 16, 477–491. [Google Scholar] [CrossRef]
  37. Ashourloo, D.; Aghighi, H.; Matkan, A.A.; Mobasheri, M.R.; Rad, A.M. An Investigation into Machine Learning Regression Techniques for the Leaf Rust Disease Detection Using Hyperspectral Measurement. IEEE J. Sel. Top. Appl. Earth Obs. Remote Sens. 2016, 9, 4344–4351. [Google Scholar] [CrossRef]
  38. Zhang, J.-C.; Yuan, L.; Wang, J.; Huang, W.; Chen, L.; Zhang, D. Spectroscopic Leaf Level Detection of Powdery Mildew for Winter Wheat Using Continuous Wavelet Analysis. J. Integr. Agric. 2012, 11, 1474–1484. [Google Scholar] [CrossRef]
  39. Huang, W.; Lu, J.; Ye, H.; Kong, W.; Hugh Mortimer, A.; Shi, Y. Quantitative Identification of Crop Disease and Nitrogen-Water Stress in Winter Wheat Using Continuous Wavelet Analysis. Int. J. Agric. Biol. Eng. 2018, 11, 145–152. [Google Scholar] [CrossRef]
  40. Ma, H.; Huang, W.; Dong, Y.; Liu, L.; Guo, A. Using UAV-Based Hyperspectral Imagery to Detect Winter Wheat Fusarium Head Blight. Remote Sens. 2021, 13, 3024. [Google Scholar] [CrossRef]
  41. Roy, S.; Ray, R.; Dash, S.R.; Giri, M.K. Plant Disease Detection Using Machine Learning Tools with an Overview on Dimensionality Reduction. In Data Analytics in Bioinformatics; John Wiley & Sons, Ltd.: Hoboken, NJ, USA, 2021; pp. 109–144. ISBN 978-1-119-78562-0. [Google Scholar]
  42. Lapajne, J.; Knapič, M.; Žibrat, U. Comparison of Selected Dimensionality Reduction Methods for Detection of Root-Knot Nematode Infestations in Potato Tubers Using Hyperspectral Imaging. Sensors 2022, 22, 367. [Google Scholar] [CrossRef]
  43. Verrelst, J.; Rivera, J.P.; Gitelson, A.; Delegido, J.; Moreno, J.; Camps-Valls, G. Spectral Band Selection for Vegetation Properties Retrieval Using Gaussian Processes Regression. Int. J. Appl. Earth Obs. Geoinf. 2016, 52, 554–567. [Google Scholar] [CrossRef]
  44. IUSS Working Group WRB. World Reference Base for Soil Resources 2014. International Soil Classification System for Naming Soils and Creating Legends for Soil Maps. Update 2015; FAO, Ed.; Food and Agriculture Organization of the United Nations: Rome, Italy, 2015. [Google Scholar]
  45. Meier, U. Growth Stages of Mono and Dicotyledonous Plants. BBCH Monograph, 2nd ed.; Federal Biological Research Centre for Agriculture and Forestry: Bonn, Germany, 2001. [Google Scholar]
  46. CCM-300. Available online: https://www.optisci.com/ccm-300.html (accessed on 1 May 2024).
  47. Lichtenthaler, H.K. [34] Chlorophylls and Carotenoids: Pigments of Photosynthetic Biomembranes. In Methods in Enzymology; Plant Cell Membranes; Academic Press: Cambridge, MA, USA, 1987; Volume 148, pp. 350–382. [Google Scholar]
  48. ASD FieldSpec 4—High Resolution Spectroradiometer|Malvern Panalytical. Available online: https://www.malvernpanalytical.com/en/products/product-range/asd-range/fieldspec-range/fieldspec4-hi-res-high-resolution-spectroradiometer (accessed on 1 May 2024).
  49. Spectralon® Diffuse Reflectance Targets—Durable Reflectance Panels. Available online: https://www.labsphere.com/product/spectralon-reflectance-targets/ (accessed on 27 March 2024).
  50. R: Splice Correction of a Spectral Matrix Acquired with an ASD. Available online: https://search.r-project.org/CRAN/refmans/prospectr/html/spliceCorrection.html (accessed on 1 May 2024).
  51. Elmer, K.; Soffer, R.J.; Arroyo-Mora, J.P.; Kalacska, M. ASDToolkit: A Novel MATLAB Processing Toolbox for ASD Field Spectroscopy Data. Data 2020, 5, 96. [Google Scholar] [CrossRef]
  52. Beal, D.; Eamon, M. Dynamic, Parabolic Linear Transformations of ‘Stepped’Radiometric Data; Analytical Spectral Devices Inc.: Boulder, CO, USA, 1996. [Google Scholar]
  53. Shapiro, S.S.; Wilk, M.B. An Analysis of Variance Test for Normality (Complete Samples). Biometrika 1965, 52, 591–611. [Google Scholar] [CrossRef]
  54. Levene, H. Robust Tests for Equality of Variances. In Contributions to Probability and Statistics: Essays in Honor of Harold Hotelling; Standford Univerdity Press: Redwood City, CA, USA, 1960; pp. 278–292. [Google Scholar]
  55. Kruskal, W.H.; Wallis, W.A. Use of Ranks in One-Criterion Variance Analysis. J. Am. Stat. Assoc. 1952, 47, 583–621. [Google Scholar] [CrossRef]
  56. McKight, P.E.; Najab, J. Kruskal-Wallis Test. In The Corsini Encyclopedia of Psychology; John Wiley & Sons, Ltd.: Hoboken, NJ, USA, 2010; p. 1. ISBN 978-0-470-47921-6. [Google Scholar]
  57. Ostertagová, E.; Ostertag, O.; Kováč, J. Methodology and Application of the Kruskal-Wallis Test. Appl. Mech. Mater. 2014, 611, 115–120. [Google Scholar] [CrossRef]
  58. Gamon, J.A.; Peñuelas, J.; Field, C.B. A Narrow-Waveband Spectral Index That Tracks Diurnal Changes in Photosynthetic Efficiency. Remote Sens. Environ. 1992, 41, 35–44. [Google Scholar] [CrossRef]
  59. Penuelas, J.; Baret, F.; Filella, I. Semi-Empirical Indices to Assess Carotenoids/Chlorophyll a Ratio from Leaf Spectral Reflectance. Photosynthetica 1995, 31, 221–230. [Google Scholar]
  60. Gitelson, A.A.; Merzlyak, M.N.; Chivkunova, O.B. Optical Properties and Nondestructive Estimation of Anthocyanin Content in Plant Leaves. Photochem. Photobiol 2001, 74, 38–45. [Google Scholar] [CrossRef]
  61. Gitelson, A.A.; Zur, Y.; Chivkunova, O.B.; Merzlyak, M.N. Assessing Carotenoid Content in Plant Leaves with Reflectance Spectroscopy. Photochem. Photobiol. 2002, 75, 272–281. [Google Scholar] [CrossRef]
  62. Odilbekov, F.; Armoniené, R.; Henriksson, T.; Chawade, A. Proximal Phenotyping and Machine Learning Methods to Identify Septoria tritici Blotch Disease Symptoms in Wheat. Front. Plant Sci. 2018, 9, 685. [Google Scholar] [CrossRef]
  63. Zarco-Tejada, P.J.; Berjón, A.; López-Lozano, R.; Miller, J.R.; Martín, P.; Cachorro, V.; González, M.R.; de Frutos, A. Assessing Vineyard Condition with Hyperspectral Indices: Leaf and Canopy Reflectance Simulation in a Row-Structured Discontinuous Canopy. Remote Sens. Environ. 2005, 99, 271–287. [Google Scholar] [CrossRef]
  64. Geladi, P.; Kowalski, B.R. Partial Least-Squares Regression: A Tutorial. Anal. Chim. Acta 1986, 185, 1–17. [Google Scholar] [CrossRef]
  65. Suykens, J.A.K.; Vandewalle, J. Least Squares Support Vector Machine Classifiers. Neural Process. Lett. 1999, 9, 293–300. [Google Scholar] [CrossRef]
  66. Rivera, J.P.; Verrelst, J.; Delegido, J.; Veroustraete, F.; Moreno, J. On the Semi-Automatic Retrieval of Biophysical Parameters Based on Spectral Index Optimization. Remote Sens. 2014, 6, 4927–4951. [Google Scholar] [CrossRef]
  67. Verrelst, J.; Rivera, J.P.; Veroustraete, F.; Muñoz-Marí, J.; Clevers, J.G.P.W.; Camps-Valls, G.; Moreno, J. Experimental Sentinel-2 LAI Estimation Using Parametric, Non-Parametric and Physical Retrieval Methods—A Comparison. ISPRS J. Photogramm. Remote Sens. 2015, 108, 260–272. [Google Scholar] [CrossRef]
  68. Spitters, C.J.T.; Van Roermund, H.J.W.; Van Nassau, H.G.M.G.; Schepers, J.; Mesdag, J. Genetic Variation in Partial Resistance to Leaf Rust in Winter Wheat: Disease Progress, Foliage Senescence and Yield Reduction. Neth. J. Plant Pathol. 1990, 96, 3–15. [Google Scholar] [CrossRef]
  69. Shtienberg, D. Effects of Foliar Diseases on Gas Exchange Processes: A Comparative Study. Phytopathology 1992, 82, 760. [Google Scholar] [CrossRef]
  70. Carretero, R.; Bancal, M.O.; Miralles, D.J. Effect of Leaf Rust (Puccinia triticina) on Photosynthesis and Related Processes of Leaves in Wheat Crops Grown at Two Contrasting Sites and with Different Nitrogen Levels. Eur. J. Agron. 2011, 35, 237–246. [Google Scholar] [CrossRef]
  71. Yahya, M.; Saeed, N.A.; Nadeem, S.; Hamed, M.; Saleem, K. Effect of Leaf Rust Disease on Photosynthetic Rate, Chlorophyll Contents and Grain Yield of Wheat. Arch. Phytopathol. Plant Prot. 2020, 53, 425–439. [Google Scholar] [CrossRef]
  72. Liu, Q.; Sun, T.; Wen, X.; Zeng, M.; Chen, J. Detecting the Minimum Limit on Wheat Stripe Rust in the Latent Period Using Proximal Remote Sensing Coupled with Duplex Real-Time PCR and Machine Learning. Plants 2023, 12, 2814. [Google Scholar] [CrossRef] [PubMed]
  73. Blasch, G.; Anberbir, T.; Negash, T.; Tilahun, L.; Belayineh, F.Y.; Alemayehu, Y.; Mamo, G.; Hodson, D.P.; Rodrigues, F.A. The Potential of UAV and Very High-Resolution Satellite Imagery for Yellow and Stem Rust Detection and Phenotyping in Ethiopia. Sci. Rep. 2023, 13, 16768. [Google Scholar] [CrossRef]
  74. Franke, J.; Menz, G.; Oerke, E.-C.; Rascher, U. Comparison of Multi- and Hyperspectral Imaging Data of Leaf Rust Infected Wheat Plants. In Proceedings of the Remote Sensing for Agriculture, Ecosystems, and Hydrology VII, Bruges, Belgium, 19 October 2005; Volume 5976, pp. 349–359. [Google Scholar]
  75. European and Mediterranean Plant Protection Organization. Efficacy Evaluation of Fungicides: Uncinula Necator. EPPO Bulletin 2002, 32, 315–318. [Google Scholar] [CrossRef]
  76. Sankaran, S.; Mishra, A.; Ehsani, R.; Davis, C. A Review of Advanced Techniques for Detecting Plant Diseases. Comput. Electron. Agric. 2010, 72, 1–13. [Google Scholar] [CrossRef]
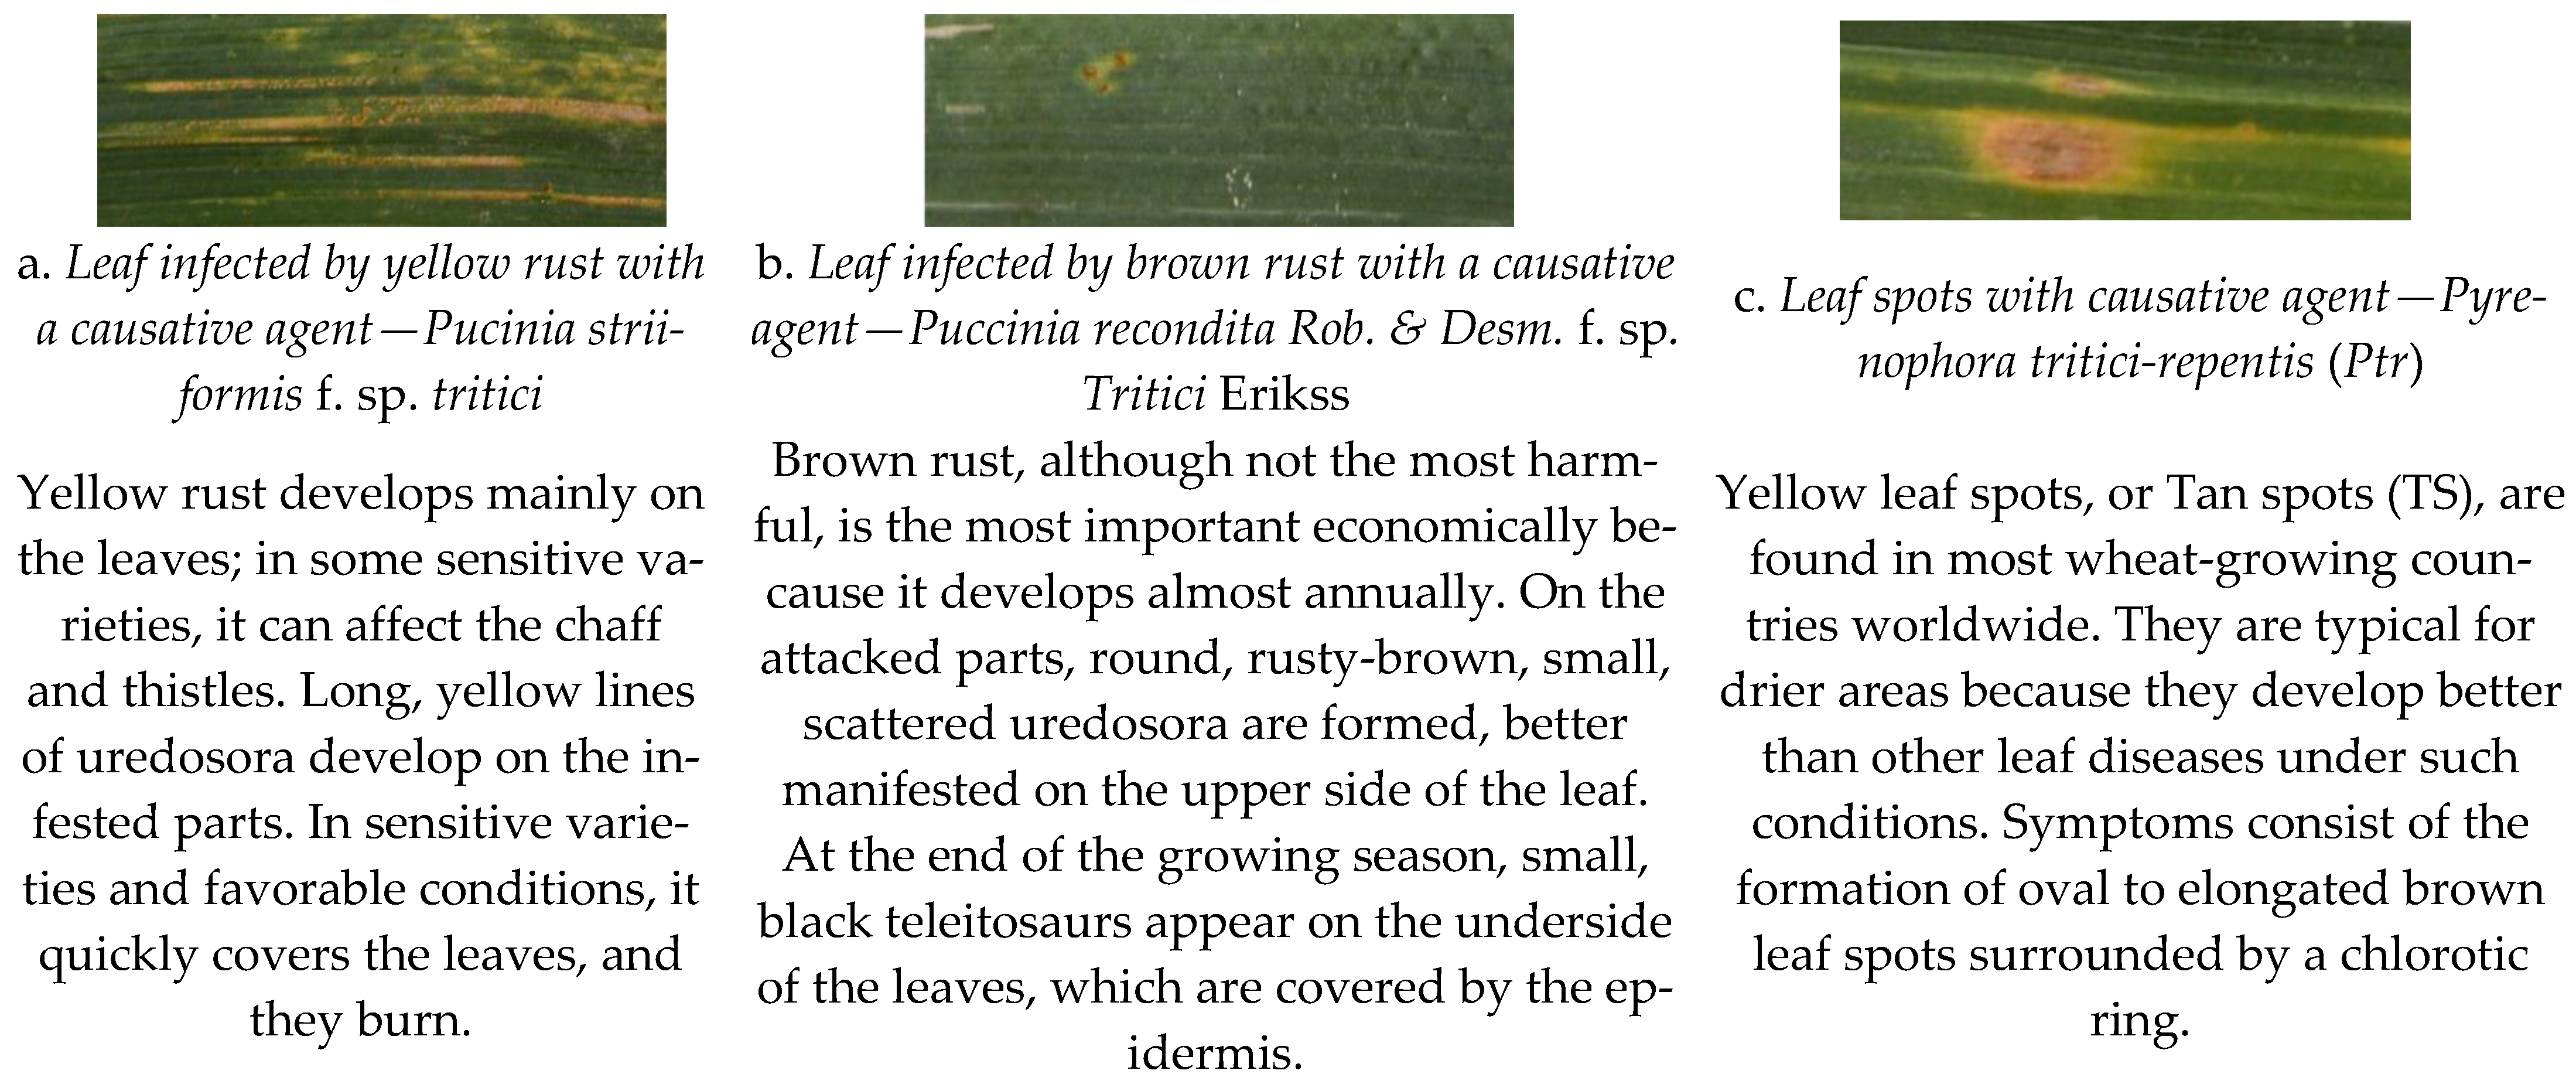
Figure 1. Examples of flag leaf diseases observed in the studied wheat genotypes and brief descriptions of each disease. (a) Yellow rust. (b) Brown rust. (c) Leaf spots [12,13].
Remotesensing 16 01762 g001
Figure 2. Workflow for disease severity assessment in the study. The process involved data acquisition and pre-processing, followed by data analysis and presentation of results. Various scenarios were explored based on the input data and the type of regression, whether parametric or nonparametric. An additional analysis was conducted to investigate the influence of disease and phenophase on chlorophyll content (CC). These steps were carried out independently at both leaf and canopy levels.
Remotesensing 16 01762 g002
Figure 3. Location of the study area. The phenotyping experiment in the Field Crops Institute, Chirpan, South Bulgaria.
Remotesensing 16 01762 g003
Figure 4. Canopy and leaf images of four winter durum wheat genotypes at two growth stages and different disease severity levels (B). Within each genotype, leaves are numbered sequentially from top to bottom at the leaf level.
Remotesensing 16 01762 g004aRemotesensing 16 01762 g004b
Figure 5. Plot of average reflectance spectra per wavelength of (a) the leaf early group with 140 samples, (b) the leaf late group with 68 samples, (c) the canopy early group with 129 samples, and (d) the canopy late group with 65 samples.
Remotesensing 16 01762 g005
Table 1. List of spectral vegetation indices (VI) used in the study to detect and monitor rust and leaf spots on winter wheat crops.
NameFormulaThe Author Who First Introduced the SVISelected Studies Utilizing the Index for Wheat Disease at the Leaf and Canopy Level
Photochemical Reflectance Index (PRI) P R I = ( R _ 570 R _ 531 ) / ( R _ 570 + R _ 531 ) [58]Canopy: [18,19,25,27,35,36,58]
Leaf: [18,23,32]
Structure insensitive pigment index (SIPI) S I P I = ( R _ 800 R _ 445 ) / ( R _ 800 R _ 680 ) [59]Canopy: [18,35]
Leaf: [18,23,32,59]
Yellow rust index (YRI) Y R I = ( R _ 730 R _ 419 ) / ( R _ 730 + R _ 419 ) + 0.5 × R _ 736 [32]Canopy: [32,35]
Anthocyanin Reflectance
Index (ARI)
A R I = 1 / R _ 550 1 / R _ 700 [60]Canopy: [18,22,25,35,36]
Leaf: [18,23,32,60]
Carotenoid Reflectance Index 550 (CRI550) C R I 550 =   1 / R _ 510 1 / R _ 550 [61]Leaf: [24,61]
Leaf rust disease severity index 1 (LRDSI_1) L R D S _ 1 = 6.9 × R _ 605 / R _ 455 1.2 [31]Canopy: [35]
Leaf: [31,62]
Leaf Rust Disease Severity Index 2 (LRDSI_2) L R D S _ 2 = 4.2 × R _ 695 / R _ 455 0.38 [31]Leaf: [31,62]
Yellow Rust Optimal Index (YROI) Y R O I = ( R _ 611 R _ 452 ) / R _ 550   [18]Leaf and Canopy: [18]
Red-Green Pigment Index (RGI) R G I = R _ 690 / R _ 550   [63]Canopy: [19]
Leaf: [63]
Table 2. Number of samples per dataset and number of folds in k-fold cross-validation.
Total Numbers of Samples/Numbers of Samples in Cross-Validation/Number of Samples in Test/K-Fold
BBCH75 & BBCH77BBCH75BBCH77
Canopy level DA194/129/65/10-fold129/86/43/6-fold65/43/22/3-fold
Canopy level CC96/64/32/5-fold65/43/22/3-fold31/21/10/2-fold
Leaf Level DA & CC208/138/70/10-fold140/93/47/7-fold68/46/22/3-fold
Table 3. Results of the classification of genotypes based on BBCH and disease, represented by the parameter B, in relation to CC at leaf and canopy levels. Reduction in CC between different disease severity levels per group and per leaf and canopy level.
GroupEarly Group
Leaf Level
1st Repetition
Late Group
Leaf Level
1st Repetition
Samples at Leaf Level Early Group
Canopy Level
1st and 2nd Repetitions
Late Group
Canopy Level
1st and 2nd Repetitions
Samples at
Canopy Level
BBCH7577 7577
Number of samples140682087034104
B1924013219827
B2442468451863
B3 & B444 86814
Average CC (range)441.36 (243–528)423.49 (167–528) 523.79 (428–623.5)501.79 (412.5–601)
Average DA (range)19 (5–55)22 (5–80) 27 (15–50)33 (15–65)
CC-1 1444.39 (344–528)434.7 (319–528) 526.64 (460–577.25)489.47 (430–562.75)
CC-2 2434.93 (243–509)423.54 (275–515) 528.6 (429.75–623.5)515.29 (412.5–601)
CC-3_4 3442.5 (401–490)302.0 (167–433) 478.71 (428.25–567.5)468.4 (434.5–577.5)
% Reduction in CC-3_4 over CC-10.4330.53 9.104.31
% Reduction in CC-3_4 over CC-2−1.7428.70 9.449.10
1 CC-1: Average and range of CC if B is 1. 2 CC-2: Average and range of CC if B is 2. 3 CC-3_4: Average and range of CC if B is 3 AND B is 4.
Table 4. Kruskal–Wallis test and Conover-Inman post hoc results for statistically significant differences in the median chlorophyll content (CC) across distinct disease severity levels.
Leaf LevelCanopy Level
All DataEarly GroupLate GroupAll DataEarly GroupLate Group
Kruskal–Wallis Statistic4.2080.9290.0668.1675.4262.165
Kruskal–Wallis p-Value0.1220.6290.0490.0170.0660.339
Conover-Iman p-value between B1/B20.8240.419
Conover-Iman p-value between B1/B3_40.0430.081
Conover-Iman p-value between B2/B3_40.0450.012
Table 5. Correlation results, expressed in Pearson correlation coefficient (r), for Chlorophyll content (CC) and disease area (DA) and the VI used to detect and monitor rust and leaf spots on winter wheat crops. In bold are the significant correlations with a coefficient higher than 0.7.
ParameterSVILeaf Level, 1st RepetitionCanopy Level, 1st and 2nd Repetitions
All DataEarly GroupLate GroupAll DataEarly GroupLate Group
CCPRI−0.45 *−0.26 *−0.59 *−0.26 *nsns
SIPI−0.33 *−0.19 *−0.57 *0.2 *0.28 *ns
YRI−0.27 *ns−0.49 *−0.23 *nsns
ARInsnsns0.42 *0.42 *0.45 *
CRI1nsnsnsns−0.28 *ns
LRDSI_1−0.54 *−0.34 *−0.72 *−0.21 *nsns
LRDSI_2−0.49 *−0.29 *−0.68 *0.2 *0.26 *0.38 *
YROI−0.52 *−0.31 *−0.73 *ns0.24 *0.4 *
RGInsnsns0.43 *0.51 *0.5 *
DAPRI0.46 *0.33 *0.51 *nsnsns
SIPI0.33 *0.25 *0.49 *nsnsns
YRInsnsnsnsnsns
ARI0.26 *0.26 *0.31 *nsnsns
CRI1nsnsnsnsnsns
LRDSI_10.39 *0.30 *0.48 *nsnsns
LRDSI_20.38 *0.31 *0.46 *nsnsns
YROI0.39 *0.29 *0.5 *nsnsns
RGI0.19 *0.17 *0.24nsnsns
*: significant at p-value ≤ 0.05; ns: Non significant.
Table 6. Parametric regression results: predicting CC and DA with selected VIs. Only the highest correlated VIs from the correlation analysis are presented.
Level/
Phenophase
Model/
Bands
Parameter Cross-ValidationTest
R2RMSEnRMSE (%)rRMSE (%)NSER2RMSEnRMSE (%)rRMSE (%)NSE
Leaf/
Late group
YROI *, Linear/611, 452, 550Leaf CC0.4055.8315.4613.360.350.4437.1823.538.540.29
Leaf/
Late group
LRDSI_1 *, Polynomial/605, 455Leaf CC0.3660.7816.8414.550.230.4536.2222.928.320.33
*: The VI is calculated with its original bands.
Table 7. Parametric regression results; predicting of CC and DA with scenario 1. Only the best-performing models, those with cross-validation or test R2 equal to or higher than 0.5, are listed.
Level/
Phenophase
Model/
Bands
Parameter Cross-ValidationTest
R2RMSEnRMSE (%)rRMSE (%)NSER2RMSEnRMSE (%)rRMSE (%)NSE
Leaf/
Late group
SIPI, Linear
/800, 690, 700
Leaf CC0.6342.2011.6310.100.630.4238.3224.258.800.25
Canopy/Late groupSIPI, Polynomial/445, 550, 531Canopy CC0.6134.5018.306.840.600.3753.2731.7110.450.25
Canopy/Early groupSIPI, Polynomial
/570, 445, 455
Canopy CC0.4831.5919.536.040.480.5042.7721.908.040.47
Table 8. Nonparametric regression results: predicting CC and DA with scenario 2. Only the best-performing models are listed, namely, those with cross-validation or validation R2 equal to or higher than 0.5.
PhenophaseModel/
Number of Bands
Parameter Cross-ValidationTest
R2RMSEnRMSE (%)rRMSE (%)NSER2RMSEnRMSE (%)rRMSE (%)NSE
Leaf/
Late group
KRR/6 1Leaf CC0.5448.2513.3711.550.510.3351.4932.5911.83−0.35
Canopy/Late groupKRR/30 2Canopy DA0.519.3618.7328.860.500.3612.4724.9434.720.36
Canopy/
Early group
KRR/28 3Canopy DA0.537.1720.4825.580.500.358.6524.7232.780.21
1: The band wavelengths are 439, 711, 712, 714, 715, and 975. 2: The band wavelengths are 400–402, 405, 406, 458, 459, 481–488, 606, 702, 703, 711–713, 733–735, 935, 939–942, and 950. 3: The band wavelengths are 400, 401, 403, 405, 434, 630, 705, 708, 712, 724, 729, 730, 735, 736, 759, 760, 762, 763, 765, 773, 777, 778, 863, 878, 943, 946, and 958.
Disclaimer/Publisher’s Note: The statements, opinions and data contained in all publications are solely those of the individual author(s) and contributor(s) and not of MDPI and/or the editor(s). MDPI and/or the editor(s) disclaim responsibility for any injury to people or property resulting from any ideas, methods, instructions or products referred to in the content.