Article

Initial Study of Adaptive Threshold Cycle Slip Detection on BDS/GPS Kinematic Precise Point Positioning during Geomagnetic Storms

1
College of Geodesy and Geomatics, Shandong University of Science and Technology, Qingdao 266590, China
2
China Academy of Space Technology, Xi’an 710100, China
3
GNSS Research Center, Wuhan University, No. 129 Luoyu Road, Wuhan 430079, China
4
Beijing BDstar Navigation Co., Ltd., Beijing 100080, China
5
School of Geography and Information Engineering, China University of Geosciences, Wuhan 430074, China
6
School of Geomatics Science and Technology, Nanjing Tech University, Nanjing 211816, China
*
Author to whom correspondence should be addressed.
Remote Sens. 2024, 16(10), 1726; https://doi.org/10.3390/rs16101726
Submission received: 8 February 2024 / Revised: 28 April 2024 / Accepted: 9 May 2024 / Published: 13 May 2024
(This article belongs to the Special Issue Latest Developments and Solutions Integrating GNSS and Remote Sensing)

Abstract

:
Global navigation satellite system (GNSS) provides users with all-weather, continuous, high-precision positioning, navigation, and timing (PNT) services. In the operation and use of GNSS, the influence of the space environment is a factor that must be considered. For example, during geomagnetic storms, a series of changes in the Earth’s magnetosphere, ionosphere, and upper atmosphere affect GNSS’s positioning performance. To investigate the positioning performance of global satellite navigation systems during geomagnetic storms, this study selected three geomagnetic storm events that occurred from September to December 2023. Utilizing the global positioning system (GPS)/Beidou navigation satellite system (BDS) dual-system, kinematic precise point positioning (PPP) experiments were conducted, and the raw observational data from 100 stations worldwide was analyzed. The experimental results show that the positioning accuracy of some stations in high-latitude areas decreases significantly when using the conventional Geometry Free (GF) cycle-slip detection threshold during geomagnetic storms, which means that the GF is no longer applicable to high-precision positioning services. Meanwhile, there is no significant change in the satellite signal strengths received at the stations during the period of the decrease in positioning accuracy. Analyzing the cycle-slip rates for stations where abnormal accuracy occurred, it was observed that stations experiencing a significant decline in positioning accuracy exhibited serious cycle-slip misjudgments. To improve the kinematic PPP accuracy during magnetic storms, this paper proposes an adaptive threshold for cycle-slip detection and designs five experimental strategies. After using the GF adaptive threshold, the station positioning accuracy improved significantly. It achieved the accuracy level of the quiet period, while the cycle-slip incidence reached the average level. During magnetic storms, the ionosphere changes rapidly, and the use of the traditional GF constant threshold will cause serious cycle-slip misjudgments, which makes the dynamic accuracy in high latitude areas and some mid-latitude areas uncommon, while the use of the GF adaptive threshold can alleviate this phenomenon and improve the positioning accuracy in the high-latitude regions and some of the affected mid-latitude areas during the magnetic storms.

1. Introduction

GNSS mainly utilizes operating satellites to continuously broadcast radio signals of specific frequencies to users at any location on the Earth’s surface and in near-Earth space to provide them with all-weather, continuous-time, and high-precision positioning, navigation, and timing services (PNT) [1,2]. The spatial environment is indispensable to GNSS positioning accuracy [3,4,5,6,7].
The ionosphere, as an essential part of the solar-terrestrial space environment, is the ionized region of the Earth’s high-altitude atmosphere, which is mainly distributed within a range of 60 to 1000 km above the ground and contains a large number of charged ions and free electrons [8]. Studies have shown that anomalous disturbances in the ionosphere can significantly impact the performance of satellite navigation and positioning system services [7,9,10,11,12]. The ejection of coronal material and intense short-term solar activities such as solar flares can impact the Earth’s magnetosphere, ionosphere, and middle to upper atmosphere, leading to geomagnetic storm events [13,14,15]. During magnetic storms, the Joule heating effect generated by particles settling at high latitudes causes the expansion of neutral gases, and damaging storms occur in the ionosphere at high latitudes; at the same time, due to the equatorward wind field, the detrimental storms in the ionosphere caused by changes in the neutral gases in the thermosphere will be extended to the mid to low latitudes. Positive storms will easily be triggered in the ionosphere at mid to low latitudes under the combined effect of the electric, wind, and geomagnetic fields [16,17,18,19,20,21,22,23,24].
The year 2023 is in the fourth year of the 25th solar cycle upturn, gradually approaching the peak year, with a significant increase in the level of solar activity, frequent outbursts of solar flares and coronal mass ejections, and a substantial increase in the number of geomagnetic solid storm events. Its enhanced solar winds and complex interactions of the magnetosphere–ionosphere–thermosphere system cause geomagnetic storms [25], which significantly impact the Earth’s near Earth space environment and thus indirectly affect the positioning performance of satellite navigation systems [26,27,28]. Wielgoze [29] found that the success rate of ambiguity resolution in network real-time kinematic (RTK) transient during magnetic storms decreased from 94% to 31%. Jacobsen [30,31] found that network RTK positioning errors during magnetic storms increase exponentially with the rate of change of ionospheric electron content and that the positioning performance of the PPP technique is severely affected during magnetic storms. Alcay and Poniatowski [32,33] studied several geomagnetic storm events. They found that the error in dynamic precision single-point localization during the storms increased significantly relative to the quiet periods, and the more violent the fluctuations in the total electron content of the electron layer, the greater the loss of precision. Magnetic storm events affect the positioning accuracy of satellite navigation systems and the orbiting accuracy of low-orbit satellites to a certain extent [34,35,36]. If the magnetic storm event level is significant, the satellite signals may even be interrupted [12,33,37]. To minimize the impact of the severe space weather environment on GNSS positioning performance during unexpected solar activity events. We use adaptive thresholding when performing cycle-slip detection to improve PPP positioning accuracy during geomagnetic storms.
In PPP data preprocessing, cycle-slip detection and repair are vital issues to achieve high-precision positioning and fast parameter convergence [38,39,40,41]. There are various cycle-slip detection methods regarding non-differential combinatorial observables, including the high-order difference method, polynomial fitting method, Kalman filtering method, Melbourne Wubeena (MW) combinatorial observables method, geometric phase-free method, etc. [42,43,44]. Different methods have their advantages, disadvantages, and scope of application. For example, the TurboEdit method has the advantage of single-station detection. It is not affected by the delay in the troposphere of the clock difference. It is easily affected by pseudo-ranging noise and the delay in the high ionosphere, and it is only applicable to the detection of larger cycle slips [39,45]. Among them, the geometry-free phase combination method is affected by the deviation of the ionospheric system and is prone to cycle-slip misjudgments under the conditions of sizeable ionospheric perturbation and a low sampling rate [35,46,47]. The MW combination method is affected by pseudorange noise, cannot detect two cycle slips at the same frequency, and is unsuitable for detecting small cycle slips [48,49].
There have been many studies of cycle-slip detection and repair during magnetic storms, but none of them consider the effect of data sampling and satellite elevation angle on the threshold setting for cycle-slip detection. Luo proposed to establish the geometry-free (GF) cycle-slip threshold model based on the ionospheric disturbance index rate of the total electron content index to reduce the false detection rate of cycle slip in GNSS precise point positioning (PPP) during strong storm periods [50]. Li proposed a cycle-slip repair method for BDS dual-frequency phases to overcome the adverse disturbances of severe ionospheric variations and large pseudo-range errors on cycle-slip repair [35]. Cai developed a new approach for cycle-slip detection and repair under high ionospheric activity using undifferenced dual-frequency GPS carrier phase observations. A forward and backward-moving window averaging algorithm and a second-order, time-difference phase ionospheric residual algorithm are integrated to jointly detect and repair cycle slips [44]. The adaptive threshold model incorporates the relationship between data sampling rate and ionospheric variations. Better positioning accuracy can also be achieved by using the adaptive threshold model for cycle-slip detection during magnetic storm events. Most existing studies on cycle-slip detection have yet to consider the effect on actual positioning accuracy. References are mainly based on adding cycle slips to the data artificially and then conducting experiments to get the cycle-slip detection success rate. This paper selects three magnetic storm events from September to December 2023 to study cycle-slip detection in conjunction with actual positioning accuracy. The effect of GF cycle-slip detection on positioning accuracy during magnetic storms with strong ionospheric disturbances is explored with PPP positioning accuracy from 100 globally distributed stations. The three selected magnetic storm events have all reached the geomagnetic storm level (Kp = 7), which is more typical and representative of the data. This paper is divided into six chapters. Section 2 introduces conventional cycle-slip detection methods and existing GF combination models and designs five adaptive thresholding schemes; Section 3 provides a detailed analysis of space weather indicators during the 5 November 2023, magnetic storm event as an example; Section 4 describes the distribution of the 100 global stations selected for this paper and the data processing strategy used; Section 5 conducts experiments using constant GF threshold and adaptive threshold, respectively, and analyzes the experimental results; Section 6 concludes with the experiments.

2. Theory and Methodology

2.1. TurboEdit Cycle-Slip Detection Methods

In GNSS data processing, the TurboEdit cycle-slip detection method is widely used because of its high success rate compared to other methods and its good cycle-slip detection for zero-differencing data [35,50]. In practice, the TurboEdit approach combines MW-combined observations and GF-combined observations for cycle-slip detection [51,52].
The MW combination method is geometrically independent and is realized based on the wide-lane combination of carrier-phase observations minus the narrow-lane combination of pseudo-range observations. The wide-lane ambiguity of the combination observations is mainly affected by the random noise and the construction of the MW combination observations is analyzed in the following [53,54]:
Let f 1 and f 2 be the frequencies, φ 1 and φ 2 be the carrier phase observations; P 1 and P 2 be the pseudo-distance observations, we can obtain its phase observation wide-lane combination φ M W 12 and pseudo-range observation narrow-lane combination P M W 12 respectively denoted as:
φ M W 12 = φ 1 φ 2
P M W 12 = f 1 P 1 + f 2 P 2 f 1 + f 2
From the principle of combining observations, its wide-lane frequency f M W 12 and λ W L wide-lane wavelength can be expressed as:
f M W 12 = f 1 f 2
λ W L = c f 1 f 2
Based on the combination of φ M W 12 and P M W 12 construction, the observation L M W can be expressed as:
L M W = λ W L N W L = f 1 λ 1 φ 1 f 2 λ 2 φ 2 f 1 f 2 f 1 P 1 + f 2 P 2 f 1 + f 2
The ambiguity N W L of the MW combination observations can be expressed as:
N W L = φ 1 φ 2 f 1 P 1 + f 2 P 2 λ W L f 1 + f 2
Based on the nature and characteristics of the MW combination of observations, the combination eliminates the effects of errors in the ionosphere, troposphere, receiver and satellite clock differences, and station satellite geometry; it is affected only by observation noise and multipath effects; it has a longer wavelength and lower measurement noise. The calculation of this combination of observations contains only the initial ambiguity parameter for wide lanes. Therefore, detecting and repairing wide-channel cycle slips, rejecting roughness, and determining the initial ambiguity of wide channels can be accomplished well using the MW combination. However, there is a detection blind zone when this method performs cycle-slip detection, and when there is an equal proportion of cycle slips on the two frequency signals being detected, the cycle-slip detection amount Δ N W L does not change, failing to perform cycle-slip detection at this time correctly.
To solve the problem of MW-combined observations being unable to detect cycle slips of equal size at two frequencies, phase GF combined observations are used as the cycle-slip detection quantity. The construction of the GF combination of observations is analyzed.
When hardware delay, multipath error, satellite, and receiver identification are ignored, the original carrier phase observation equation is expressed as:
ϕ i = λ i φ i = ρ + λ i N i + T I i + ε i
The carrier phase observation equations at frequencies f 1 and f 2 are denoted, respectively:
ϕ 1 = ρ + λ 1 N 1 + T I 1 + ε 1
ϕ 2 = ρ + λ 2 N 2 + T I 2 + ε 2
From the correlation law between ionospheric delay and frequency:
I 2 = f 1 2 f 2 2 I 1
Subtracting the above equations for the two carrier-phase observations and eliminating the effects of tropospheric delays, etc., leaves only a linear combination of ambiguities, wavelengths, ionospheric delays, and stochastic errors that can be expressed as:
ϕ G F = f 1 2 f 2 2 1 I 1 + λ 1 N 1 λ 2 N 2 + ε G F
As can be seen from the expression for the GF combined observables, the GF combined observables are also detectable for two cycle slips of equal size and frequency.

2.2. GF Adaptive Thresholding Model

In real-time cycle-slip detection, the neighboring epoch difference method is generally used. There is generally no standardized setting for the cycle-slip thresholds for practical applications. In contrast, the detection thresholds for MW and GF are usually set to 1–2 cycles and 5–15 cm to detect minor cycle slips [2]. The GF cycle-slip detection threshold is set to 0.05 m by default in the open-source software RTKLIB (2.4.2) used in this paper. In cases where ionospheric variations are insignificant, excellent cycle-slip accuracy can be achieved using a combination of GF detections, usually more than half cycle. More minor cycle slips can also be detected when the threshold is set to 0.05 m. However, when the ionosphere is actively changing or the sampling interval is extensive, using this threshold for cycle-slip detection is ineffective. It is more stringent and is prone to misjudgment of cycle slips [3].
To solve the cycle-slip misjudgment phenomenon generated by using a constant GF threshold when the ionosphere is actively changing or when the sampling interval is large, it is necessary to find a GF threshold that has applicability under various conditions. Specific methods are used to establish adaptive thresholds. For GPS and BDS satellites, two existing adaptive thresholds for GF combinations synthesize satellite altitude angles and data sampling intervals.
Modeling the GF adaptive cycle-slip detection threshold for GPS satellites [55]:
U = k × n i
Five different schemes are designed in this paper, where n is an empirical threshold that considers the sampling interval R. k is the satellite altitude angle weighting factor, calculated using the below formula. Where e denotes the current epoch satellite altitude angle, E is a dynamic critical altitude angle selected according to the actual situation, generally determined as 15° in the static environment and 30° in the dynamic environment; this paper takes the value of 30° for the experiment.
k = 1 , e E sin ( E ) / sin ( e ) , e < E
Modeling the GF adaptive cycle-slip detection threshold for BDS satellites [56]:
U = j × n i
where j is a weighting factor set according to the BDS satellite orbit type and altitude angle, k is equivalent to k in Equation (13) when the satellite type is MEO/IGSO.
j = 5 , G E O k , M E O / I G S O
To screen out the adaptive thresholds with the best cycle-slip detection performance under magnetic storm conditions, this paper designs five empirical thresholds n for the considered sampling interval R(s), as is shown in Table 1 below. The data sampling interval has been considered in most cases, with the majority of raw data sampling intervals being 30 s. The raw observation data sampling interval selected in this paper is also 30 s. Some less commonly used data sampling intervals have not been considered, and the established thresholds have limitations.

3. Analysis of Weather Indicators

This paper selects three magnetic storm events occurring on 19 September, 5 November, and 1 December 2023. The 19 September magnetic storm event reached geomagnetic storm levels for three hours from 3:00 to 11:00, and for the rest of the day from 15:00 on the 18th to 3:00 on the 19th, it reached moderate magnetic storm levels for three hours and trimmed magnetic storm levels for six hours. The 5 November magnetic storm event occurred from 09:00 to 00:00 on 6 November, with three hours at geomagnetic storm levels, nine hours at moderate storm levels, and three hours at trim storm levels. The 1 December magnetic storm event occurred from 09:00 to 00:00 on 2 December, with three hours at the geomagnetic storm level, three hours at the moderate magnetic storm level, and nine hours at the trim magnetic storm level.
The magnetic storm event of 5 November was selected as an example for a detailed analysis of the process of geomagnetic storm occurrence, and the space weather indicators used were the Bz component of the interplanetary magnetic field (IMF), the Dst index, the Kp index, and the solar wind velocity [56]. To better visualize the changes in various weather indicators during the magnetic storm, the geomagnetic data from 15 November to 16 November were selected as the quiet period for comparison. The variation of the above metrics during a magnetic storm is demonstrated in Figure 1. Magnetic storm events are usually categorized into three phases: Initial phase, main phase, and recovery phase regarding the change in the Dst index [57,58]. The 5 November magnetic storm event began around 8:00 p.m. when the Dst index was trending up, the IMF Bz was trending down, and the solar wind speeds spiked into the initial phase. Then, the Dst index rises to a peak, the solar wind speed exceeds 500 km/s, and the Kp index rises to enter the primary phase. As the main-phase phase develops, all indicators differ significantly from the quiet phase. IMF Bz dropped and then rose to a peak and recovered twice; solar wind speed stayed at 500 km/s fluctuation; Dst index showed a decreasing trend and reached a minimum of 160 nT; Kp index went 7, the level of a geomagnetic storm. After 0:00 h on 6 November, the Kp index declined, and the Dst index increased to enter the recovery phase. The recovery phase lasts longer, usually 2–3 days, during which the geomagnetic field is still disturbed. Still, the general trend is weakening, and all indicators are beginning to move closer to the quiet period.
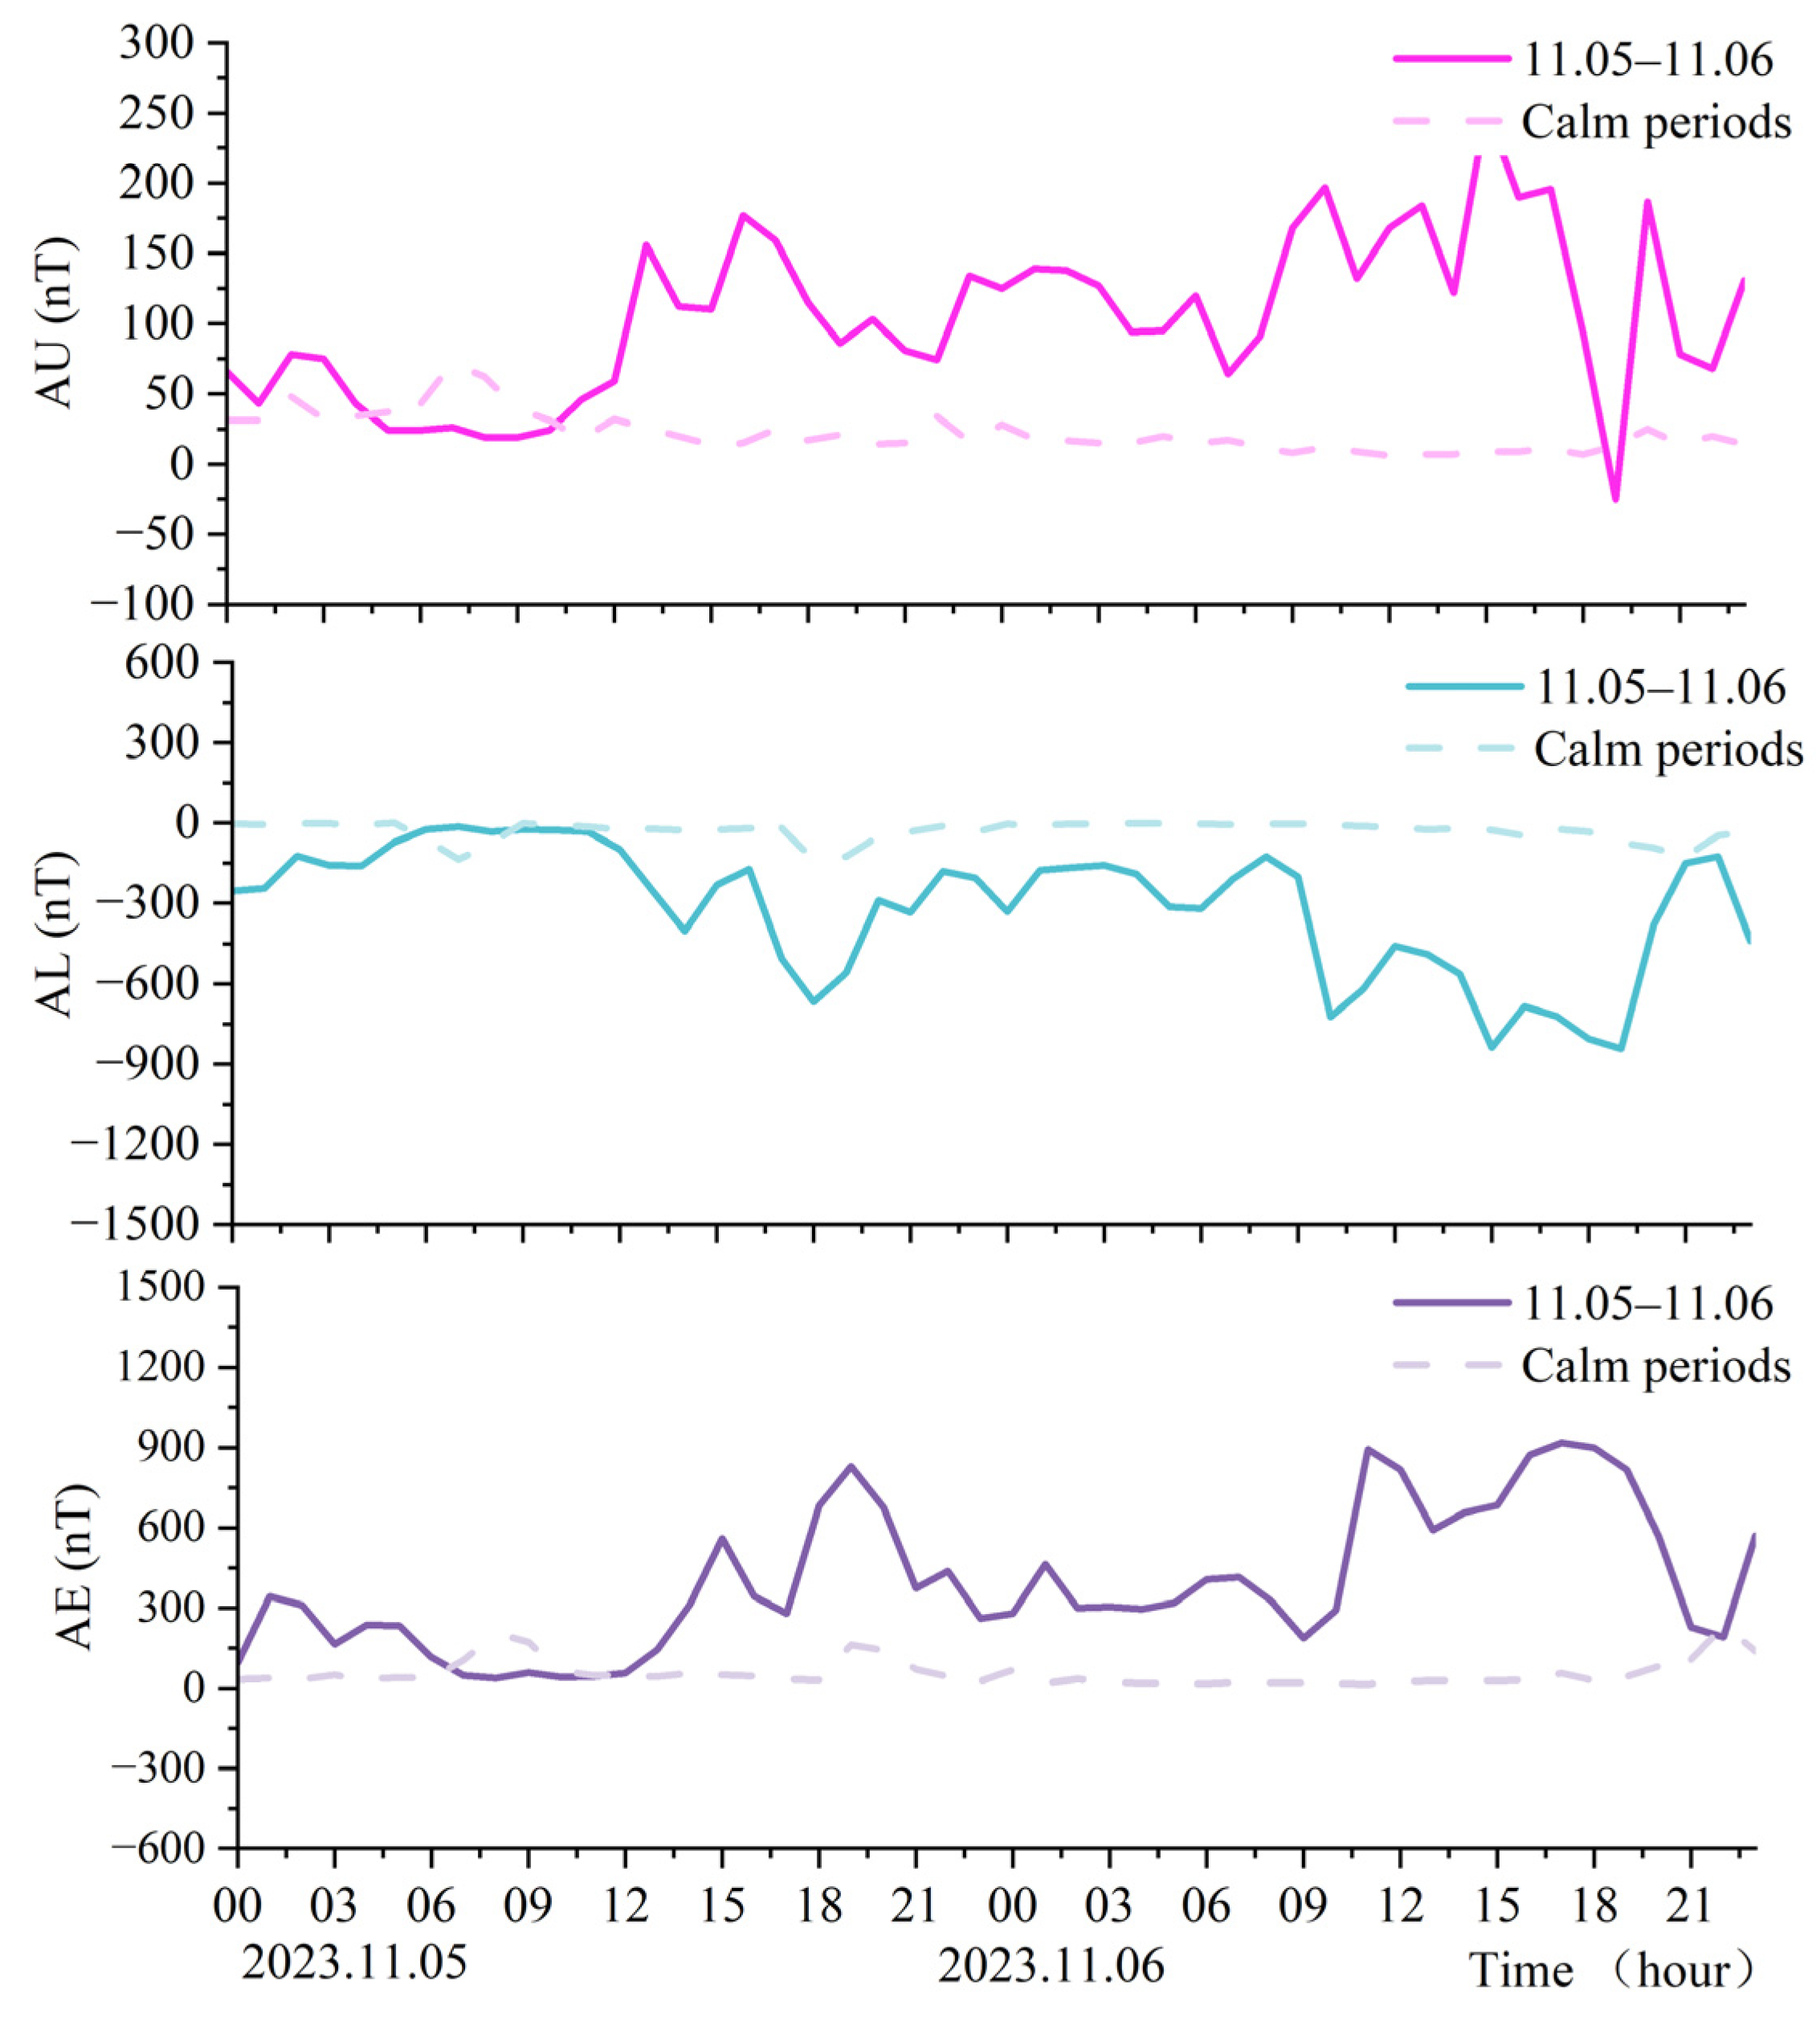
The geomagnetic parameters corresponding to 11.5 are plotted in Figure 2, and images of the quiet period are plotted for comparison. As can be seen from the graph, at the beginning of the storm, the various data were in the normal range, close to the calm period. As the main phase progressed, the AU and AL indices appeared to differ markedly, with a maximum difference of up to 800 nT; the AE index rose sharply, approaching a maximum of 1000 nT. Changes in these data indicate a large injection of energy into the ionosphere, with the effects of the storm causing the ionosphere to become more active.

4. Data Processing Strategy

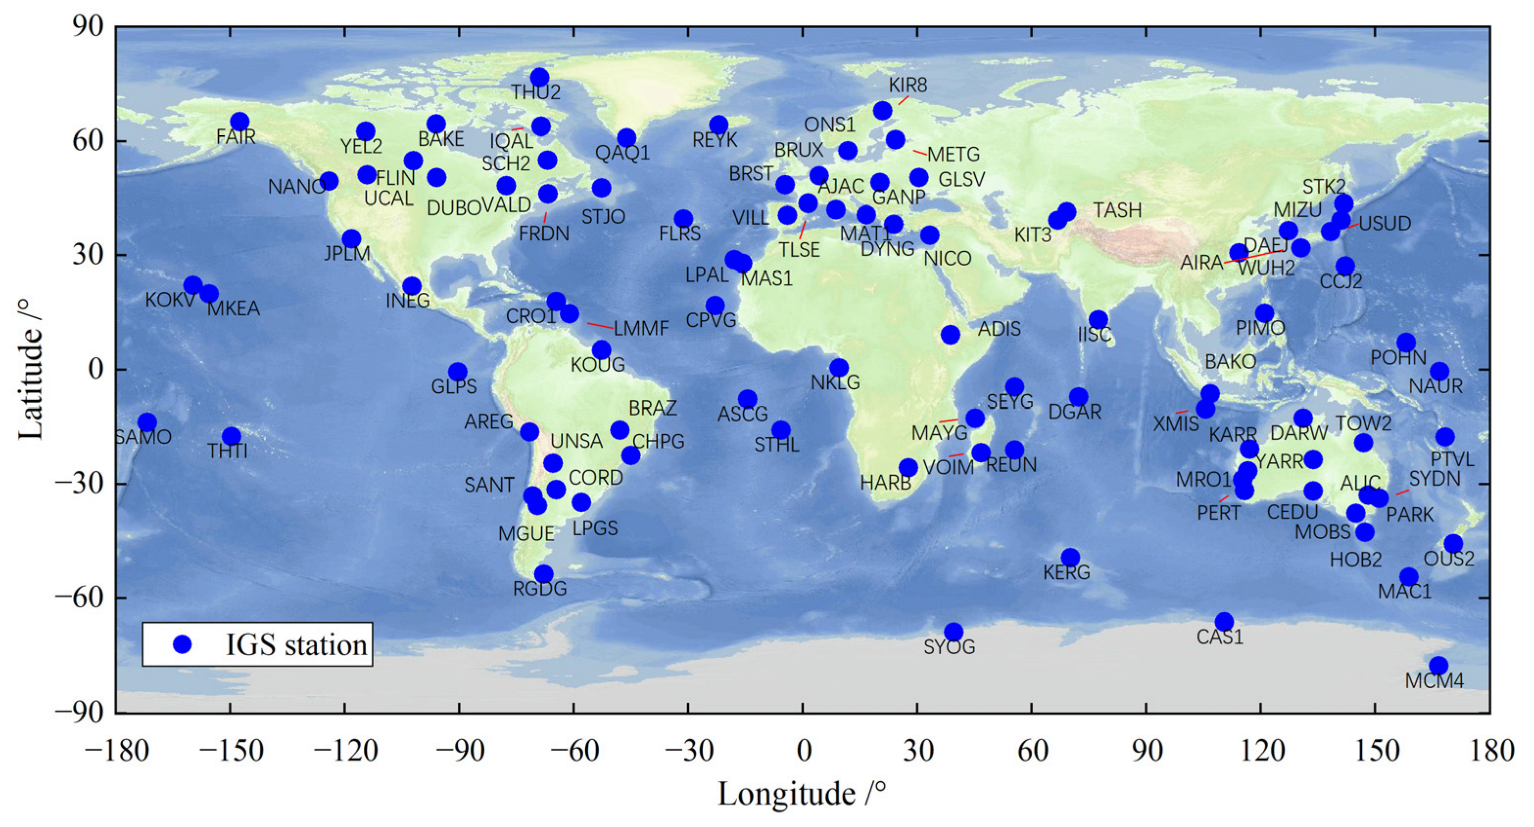
This paper uses the open-source software RTKLIB(2.4.2) for experiments. To increase the number of observation satellites and improve the quality of raw observation data, the observation data from 100 Multi-GNSS Experiment (MGEX) stations worldwide during the three magnetic storms on 19 September, 5 November, and 1 December were continuously processed using the GPS + BDS dual system. Figure 3 illustrates the distribution of these 100 stations across the global region. To facilitate the statistical processing of the positioning accuracy result data, 0–30° as the low latitude, 30–60° as the high latitude, and 60–90° as the high latitude. South and north latitudes are distinguished.
The three magnetic storm events selected for this paper all lasted multiple days. For these three magnetic storm events, the analysis focuses on the dynamic PPP positioning accuracy during the magnetic storm’s initial and main phase phases. It ensures that the positioning accuracy is initialized before the magnetic storm occurs to avoid the impact of the initialization on the positioning accuracy results. Precise orbits and clock differentials were processed using products provided by WUM, with five adaptive thresholding strategies and the conventional constant GF threshold for cycle-slip detection for data processing. Table 2 demonstrates the other data processing strategies, and the five adaptive thresholding schemes used are consistent except for the different cycle-slip thresholds.

5. Analysis of Experimental Results

5.1. Constant Threshold Results

Using the dynamic PPP processing strategy above, the data of each epoch are solved to obtain the station’s X, Y, and Z coordinates in the WGS84 coordinate system. Using the SINEX weekly solution data provided by International GNSS Service (IGS) as the actual values for station coordinates, convert the station coordinates to the E, N, and U directions and calculate the 3D root mean square (RMS). The average RMS of the stations in each latitude range during the experimental period is averaged to obtain the average positioning accuracy in each latitude region during the magnetic storm. The calculation formulas are as shown in Equations (16)–(18), where j denotes the epoch, n represents the number of stations in the latitude range, R M S T denotes the average RMS of each station in the experimental period, and R M S S denotes the average RMS of all stations in each latitude range.
R M S j = E j 2 + N j 2 + U j 2
R M S T = 1 j R M S j j
R M S S = 1 n R M S T n
Positioning results from 100 stations worldwide during three magnetic storm events were analyzed, and data from about ten days after the storm events were taken as a quiet period for a control experiment. The average three positioning results of the stations, divided by latitude, are shown in Table 3. The regions where the average positioning accuracy exceeds 0.5 m are underscored. The table shows that the positioning accuracy at high latitudes during the three magnetic storm events was lower than during the quiet period, and apparent accuracy anomalies occurred.
In the latitude 90–60° (N) region, the localization errors of the three magnetic storm events exceeded 0.5 m, with the localization error exceeding 1 m in the 12.01 event, which is well beyond the error range of precision single-point positions. In the 60–90° (S) range, the positioning accuracy is around 0.3 m, which is also much higher than the average positioning accuracy of the stations in the region during the quiet period. Positioning accuracy in the middle and low latitudes mainly stayed the same relative to the quiet period, and only two magnetic storm events, 11.05 and 12.01, showed a slight decrease in positioning accuracy at some stations.
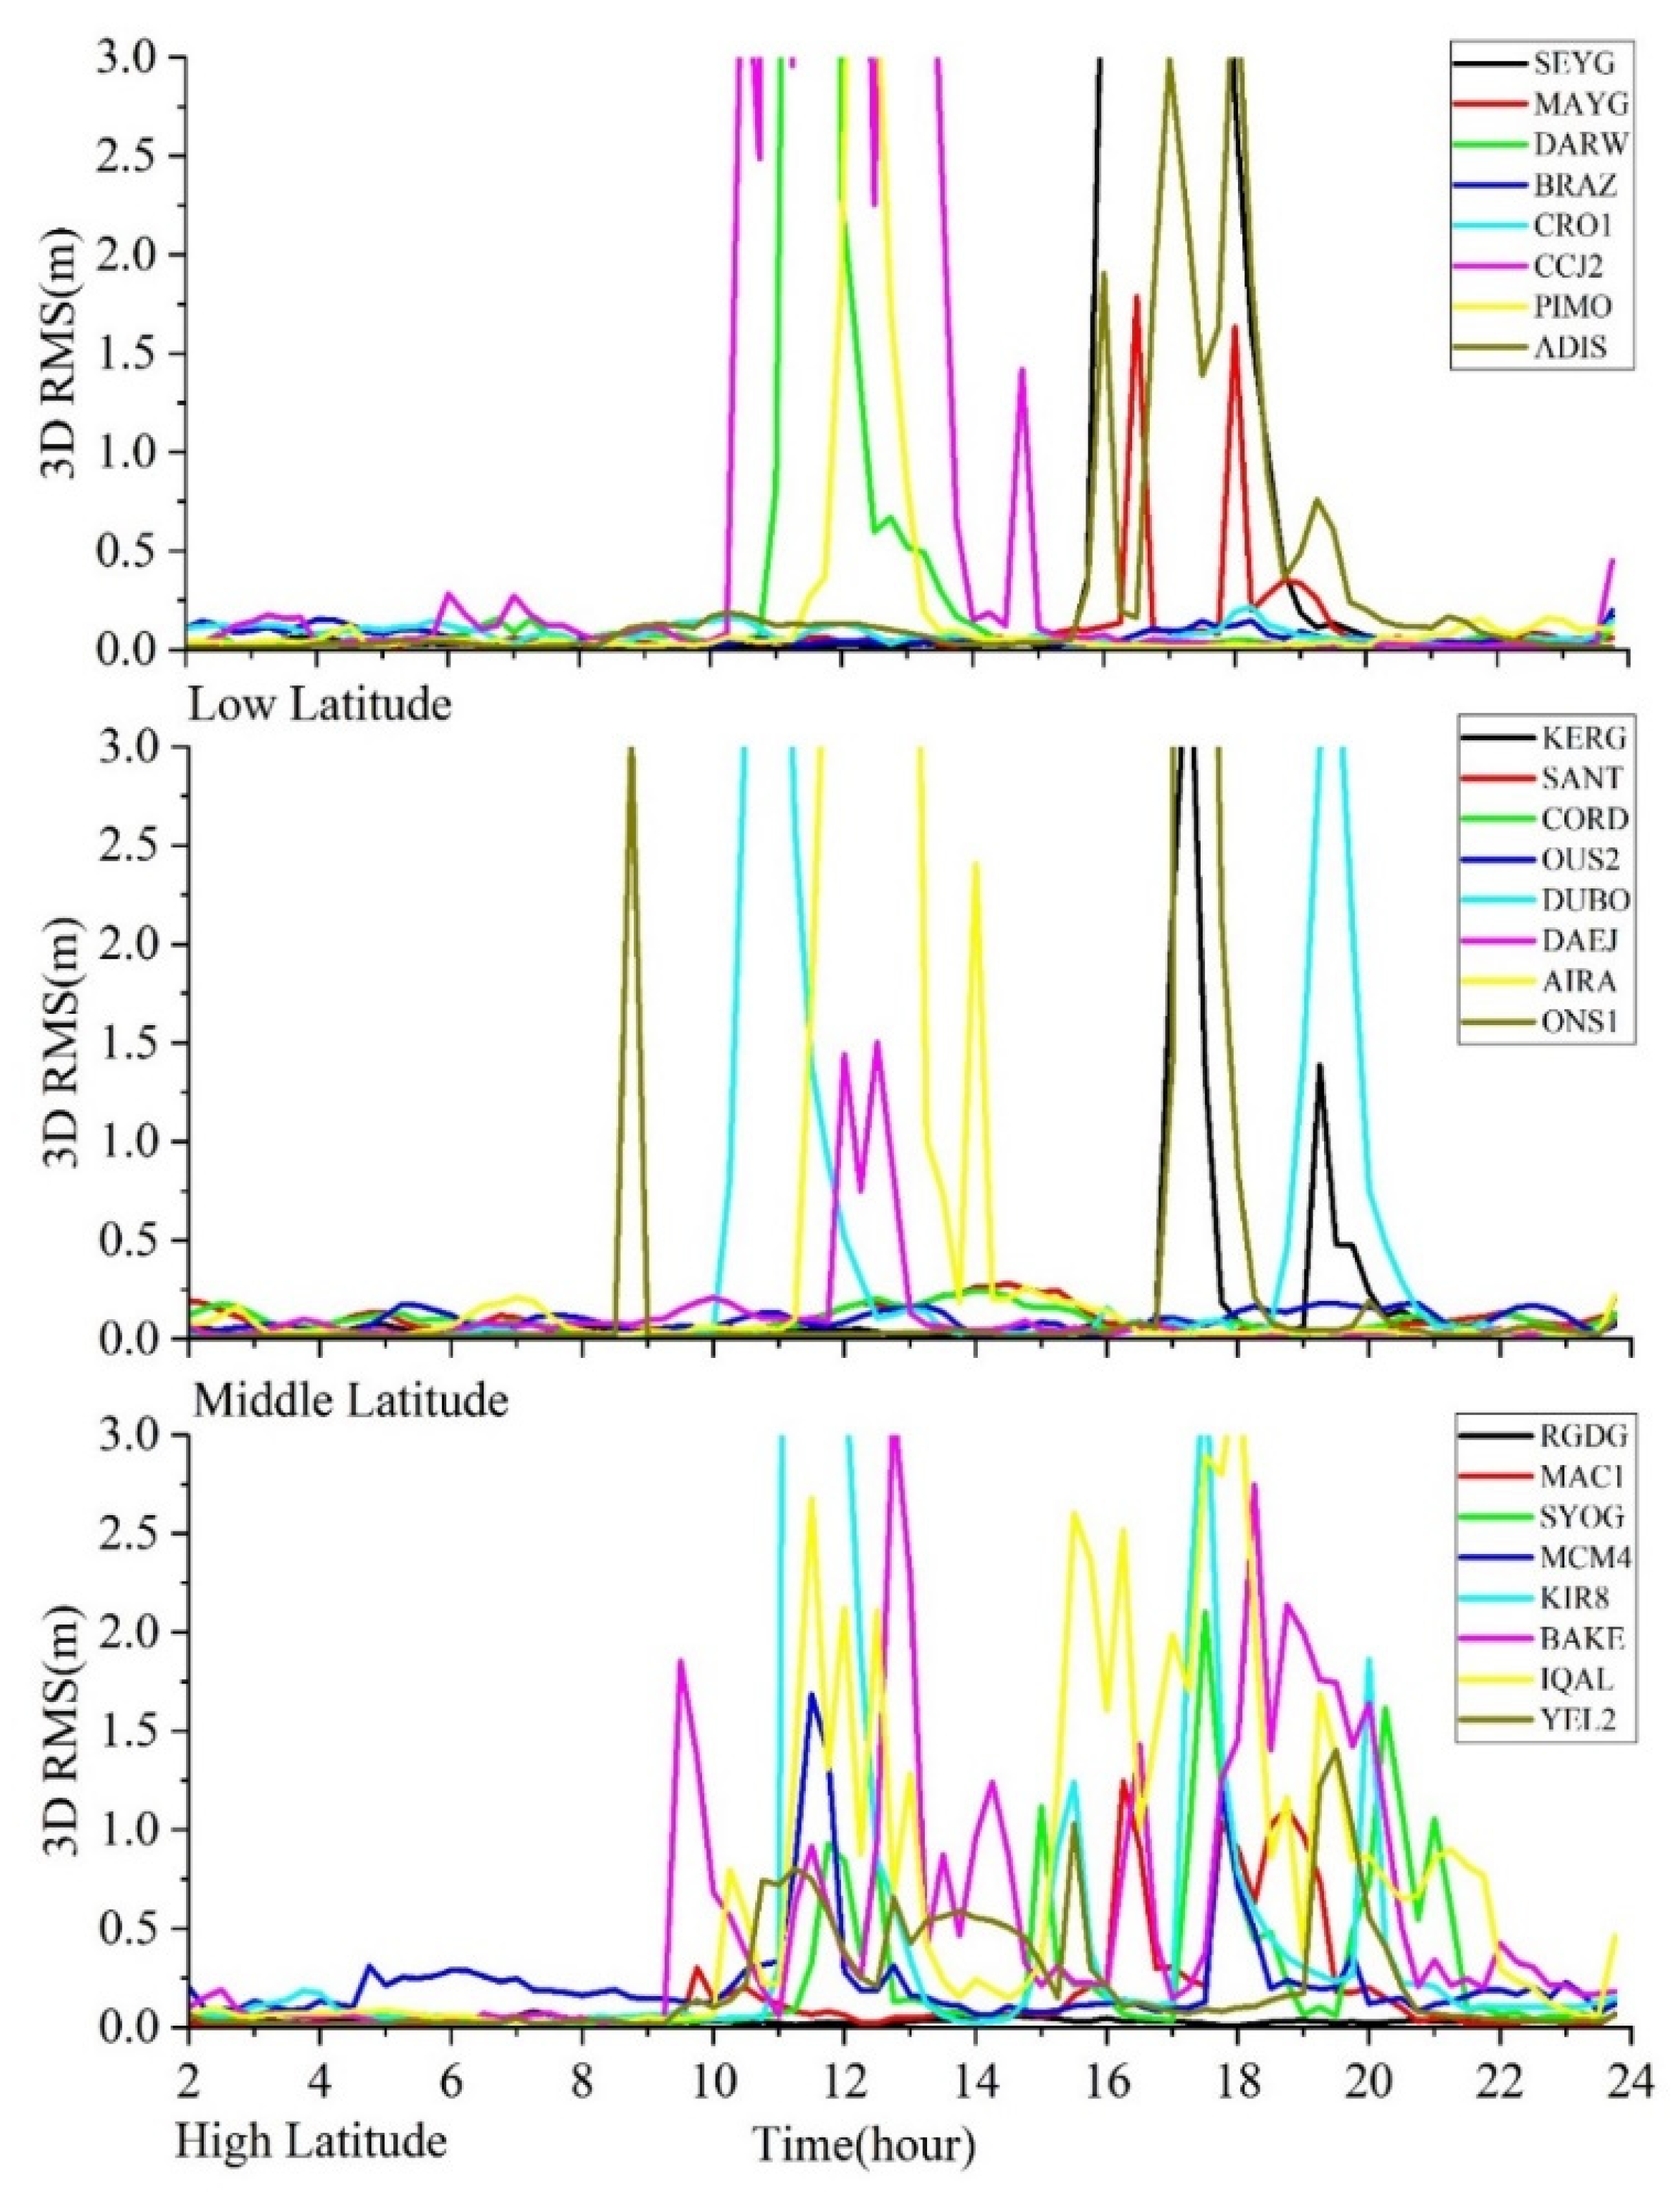
Each station is affected at different times and degrees during a magnetic storm. To show in detail the changes in the positioning accuracy of the stations during a magnetic storm, the 11.05 magnetic storm event is selected for specific analysis. With 15 min as the interval, segmentally calculate each station’s RMS values of positioning errors during the magnetic storm event period. Divided by high latitude, middle latitude, and low latitude, the stations with large fluctuations in positioning errors are selected, and their positioning results are plotted in Figure 4. As can be seen from Figure 4, before the beginning of the initial phase (8:00 on 11.5), the positioning accuracy of each station is high, and none of the 3DRMS exceeds 0.25 m. After entering the initial phase, some stations began to show anomalies in positioning accuracy, with the RMS of BAKE and ONS1 stations exceeding 1 m in high and mid-latitude areas. After the magnetic storm entered the main phase (12:00 on 11.5), more stations began to show varying degrees of positional accuracy anomalies. As can be seen from the figure, the frequency of accuracy anomalies at stations in high latitudes is significantly greater than in the middle and low latitudes. As the main phase progresses into the recovery phase, the station positioning accuracy at low latitudes has recovered to the level before the start of the magnetic storm, and the RMS at mid and high latitudes is also gradually recovering. In Figure 4, the RMS of some stations in the low-latitude region exceeds 1 m. In addition to the effect of geomagnetic storm events on the ionosphere, as the sun moves towards the zenith, the photoionization caused by solar radiation also gradually increases, making the ionosphere particularly active in the early and late afternoon, a phenomenon known as the “noontime bite-out”. This phenomenon also causes misjudgment of cycle slips, which reduces the positioning accuracy of stations near the equator in low-latitude regions.
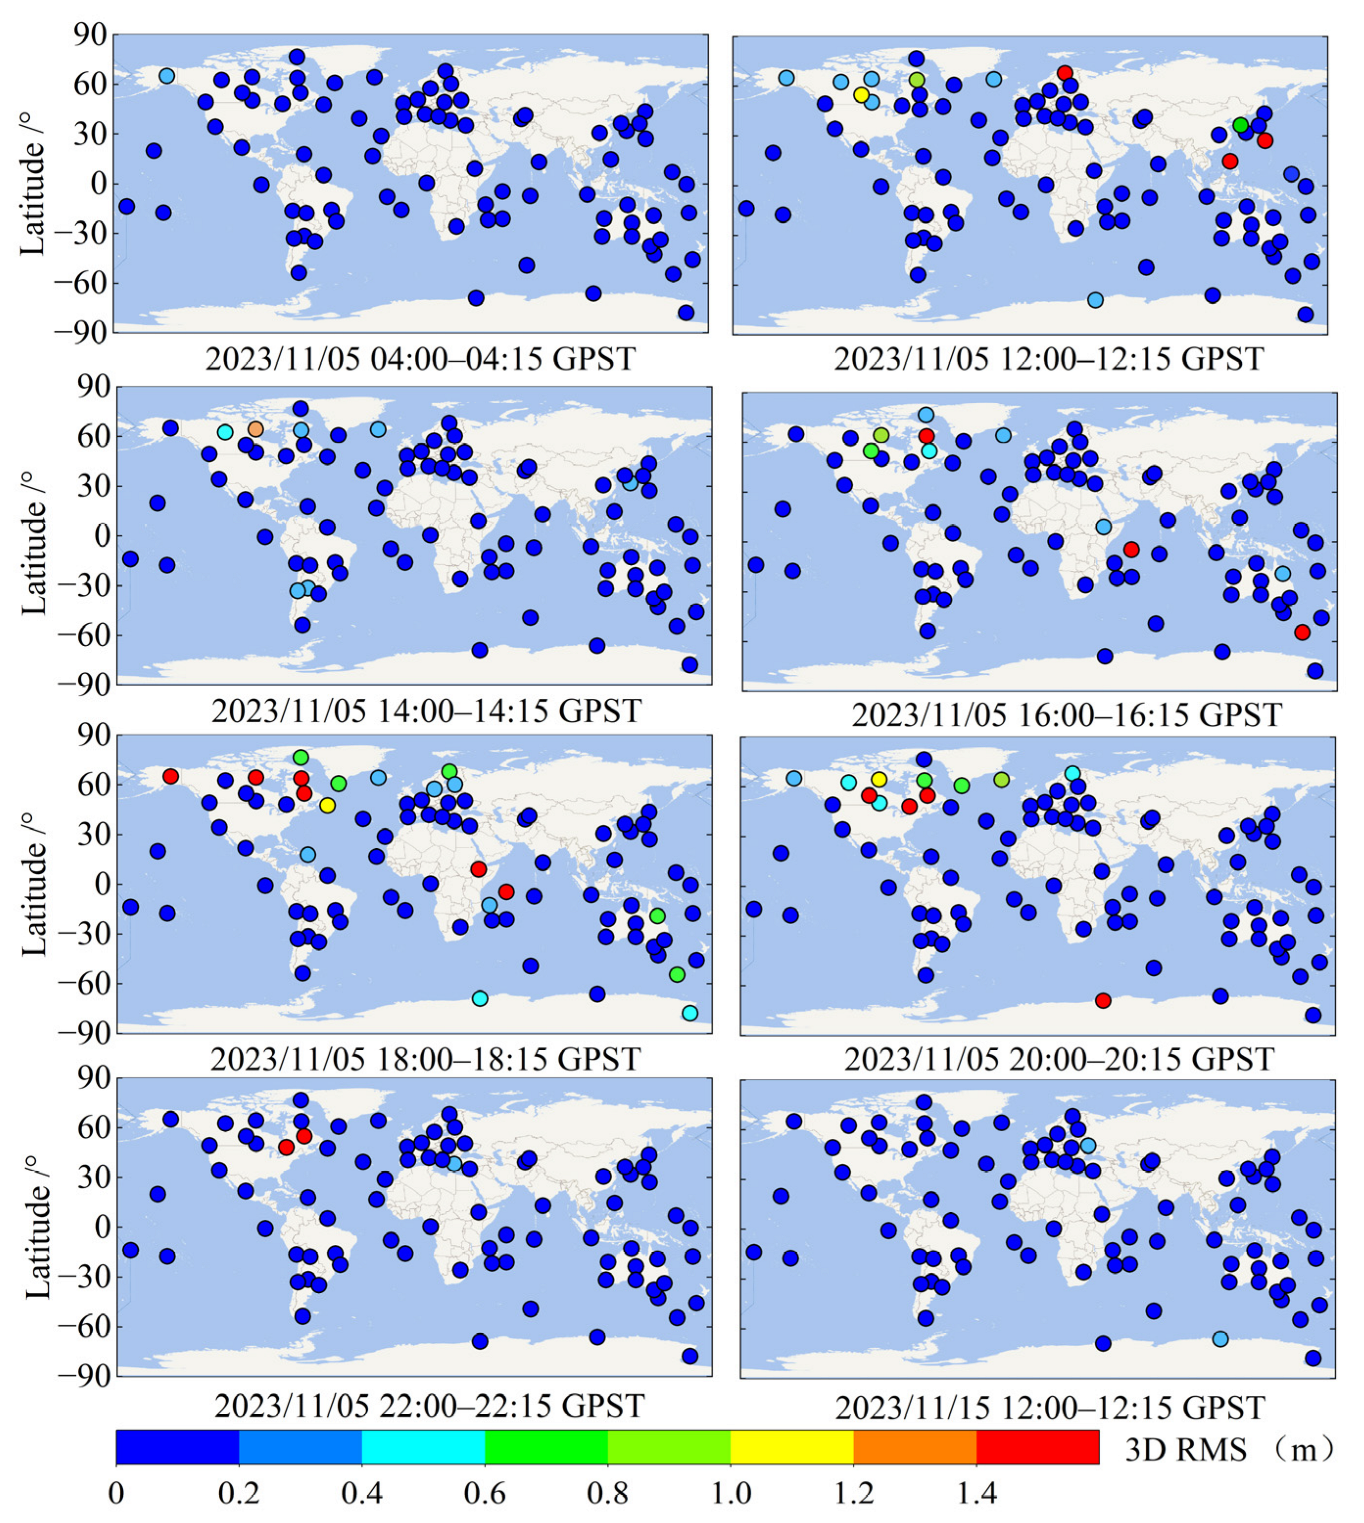
From the Table 3, it can be seen that during the 11.5-day magnetic storm, some stations had multiple positioning accuracy anomalies from 8:00–22:00, and the segmented RMS statistics during these periods are plotted in Figure 5. The vertical axis in Figure 5 indicates latitude, and the dots indicate the stations filled with different colors corresponding to different positioning error intervals. The images of the quiet period are also plotted as a comparison, in which the RMS of the stations in the quiet period is within the standard error range, only two stations are in the range of 0.2–0.4 m, and the rest of the stations are less than 0.2 m. Analyze images from the period of the magnetic storm. It can be seen that there are several stations with a positioning error RMS greater than 1 m during the study period, and most of these stations are located in high latitudes. Because the Earth’s magnetic field makes high-energy particles during magnetic storms enter into the middle and upper atmospheres along the magnetic lines of force of the poles under the action of the electromagnetic force, and the high-latitude areas are firstly affected by the magnetic storms. Therefore, this leads to the fact that the stations in high-latitude regions are more frequent in terms of the positioning accuracy anomalies and are more prone to the occurrence of the accuracy anomalies.
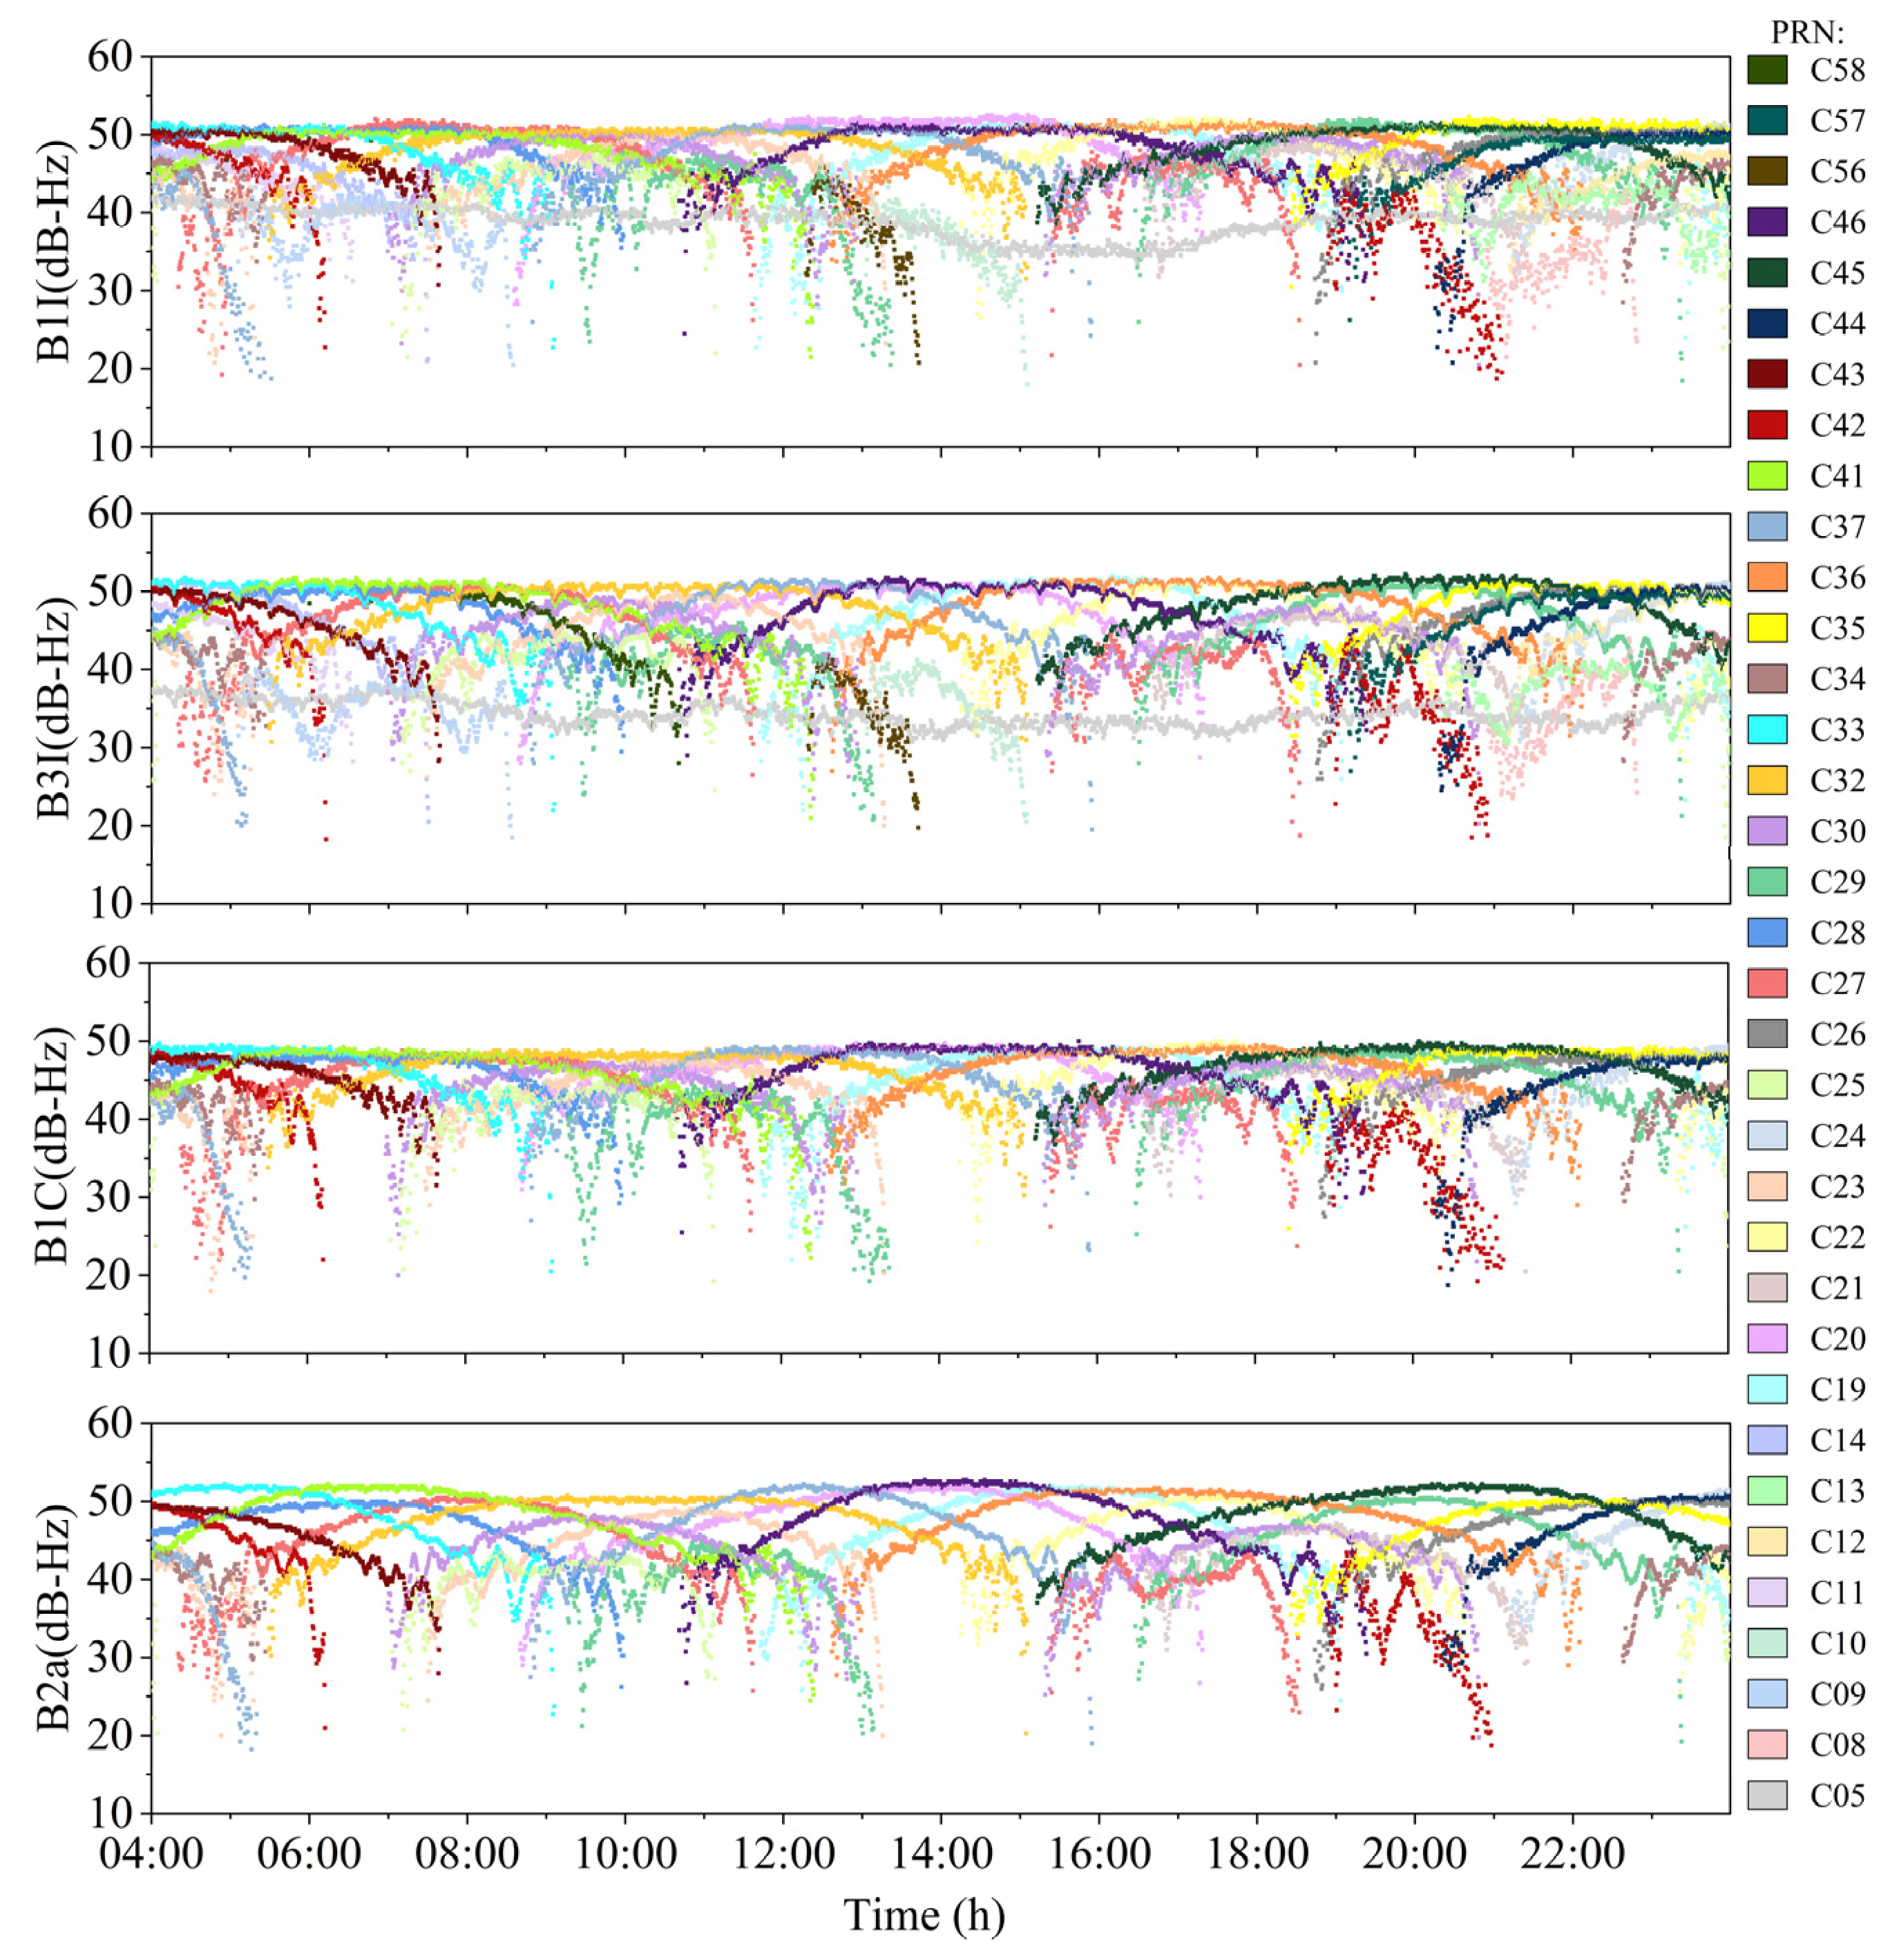
The carrier-to-noise ratio measures the strength of the signal and indirectly reflects the positioning accuracy of the station. To study the effect of magnetic storm events on the strength of satellite signals received at the station, the MAC1 station was selected to analyze the time series of the carrier-to-noise ratio of its received signals. The carrier-to-noise ratio time series of the L1, L2, and L5 frequency points of the GPS at the MAC1 station, and the B1I, B3I, B1C, and B2a frequency points of the BDS system are plotted in Figure 6 and Figure 7. In the figure, the left side of the vertical axis is the value of the carrier-to-noise ratio, the horizontal axis is the time axis, and the colored curves are the carrier-to-noise ratio time series curves of different satellites. As can be seen from the figure, the carrier-to-noise ratio time series curve is relatively smooth. During the period of the magnetic storm, there are individual satellites at the L2 frequency point of the GPS with signal carrier noise faults; the reason is that the corresponding satellites implemented the power enhancement operation during part of the period, which improved the signal carrier noise ratio, and resumed the average operating power after the end of the power enhancement, which caused fluctuations of the carrier noise ratio time series curve. Other than that, the satellite signals at the rest of the frequency points do not show any degradation of the carrier-to-noise ratio, and the curve is relatively smooth. By analyzing the carrier-to-noise ratio time series curve, it can be seen that the main reason for the abnormal positioning accuracy of the station is not the fluctuation of signal strength.
Four stations from those exhibiting accuracy anomalies were selected for further analysis. The positioning errors in the E, N, and U directions and the ratio of the number of satellites that undergo a cycle slip to the total number of satellites during positioning, the cycle-slip rate, are plotted in Figure 8 for each epoch. It can be seen that four stations, PIMO, BAKE, MAC1, and IQAL, have abnormally high cycle-slip rates in some periods, with individual cycle-slip rates exceeding 90%. While the cycle-slip rate increases, the errors in the E, N, and U directions also increase. According to the principle analysis of precision single-point positioning, in the process of determining the satellite ambiguity parameter, the filter will reset the ambiguity parameter of the corresponding satellite when it detects the occurrence of the cycle slip to avoid the impact on the positioning accuracy due to the false estimation of the ambiguity degree; however, if there are too many cases of misjudgment of the cycle slip, it will lead to the resetting of the ambiguity parameter of the excessive ambiguity parameter at the same time, which will result in abnormal positioning accuracy. In addition to some extreme weather events, under normal circumstances, the ionosphere changes slowly and does not show large fluctuations; however, during magnetic storms, due to a large number of high-energy particles in the Earth’s atmosphere, the ionosphere in the ionosphere, such as ionospheric storms and other perturbations. The difference in ionospheric delays between neighboring epochs increases, resulting in a corresponding increase in the observed value of the GF phase combination. The use of conventional GF thresholds will occur at this time of the cycle-slip misjudgment, the inappropriate cycle-slip threshold setting leads to excessive cycle-slip misjudgments, which makes almost all the satellite ambiguity parameters involved in the computation reset at the same time. Leading to the degradation of station positioning accuracy.

5.2. Adaptive Threshold Results

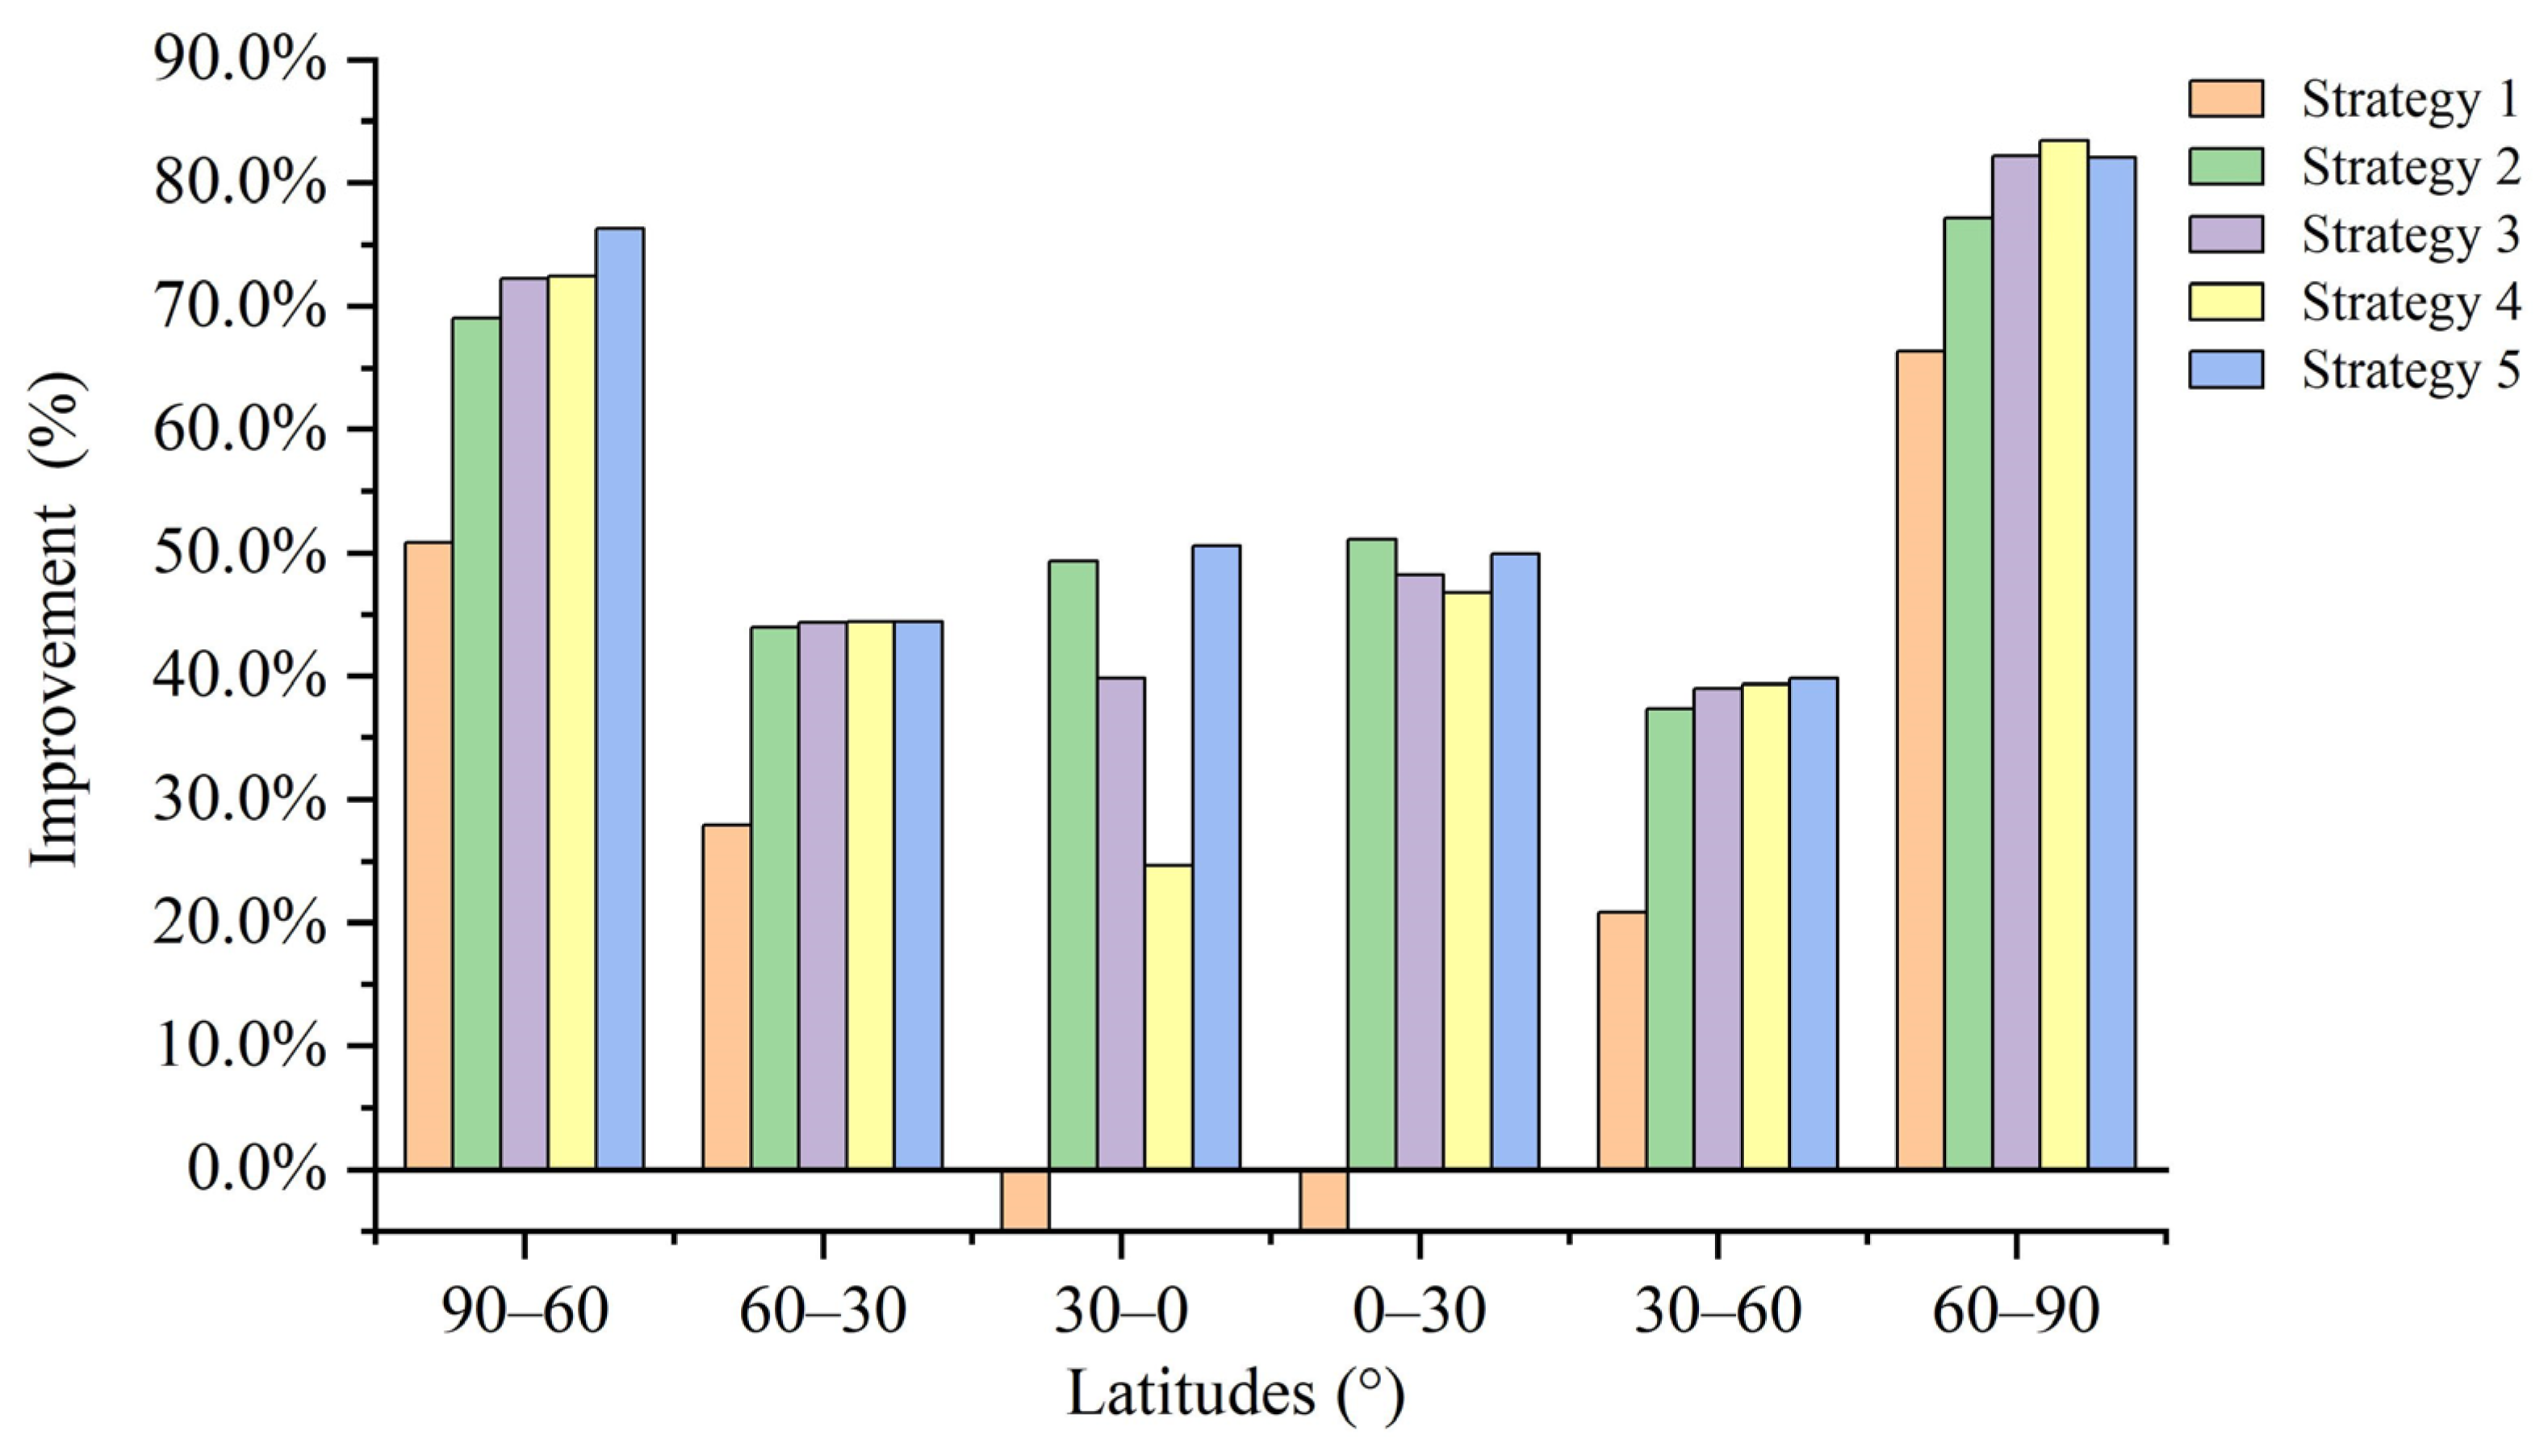
To solve the problem of many cycle-slip misjudgments during the magnetic storm leading to abnormal positioning accuracy at the station, the data during the 5 November magnetic storm were reprocessed using the five adaptive thresholding schemes in Section 2.2, respectively. Calculate the average positioning accuracy of the stations in the corresponding latitude range, calculate the proportion of improvement in positioning accuracy of the self-adaptive threshold scheme relative to the constant threshold, and plot it in Figure 9. The positioning accuracy improvement ratio is calculated as (constant threshold positioning accuracy—adaptive threshold positioning accuracy)/constant threshold positioning accuracy. In Figure 9, the best overall improvement in positioning accuracy is achieved when using Strategy 5 for cycle-slip detection. The effect of improving the positioning accuracy in the high latitude area is evident, with the improvement ratio close to 80%, and the positioning accuracy in the middle and low latitude areas has also been improved to different degrees.
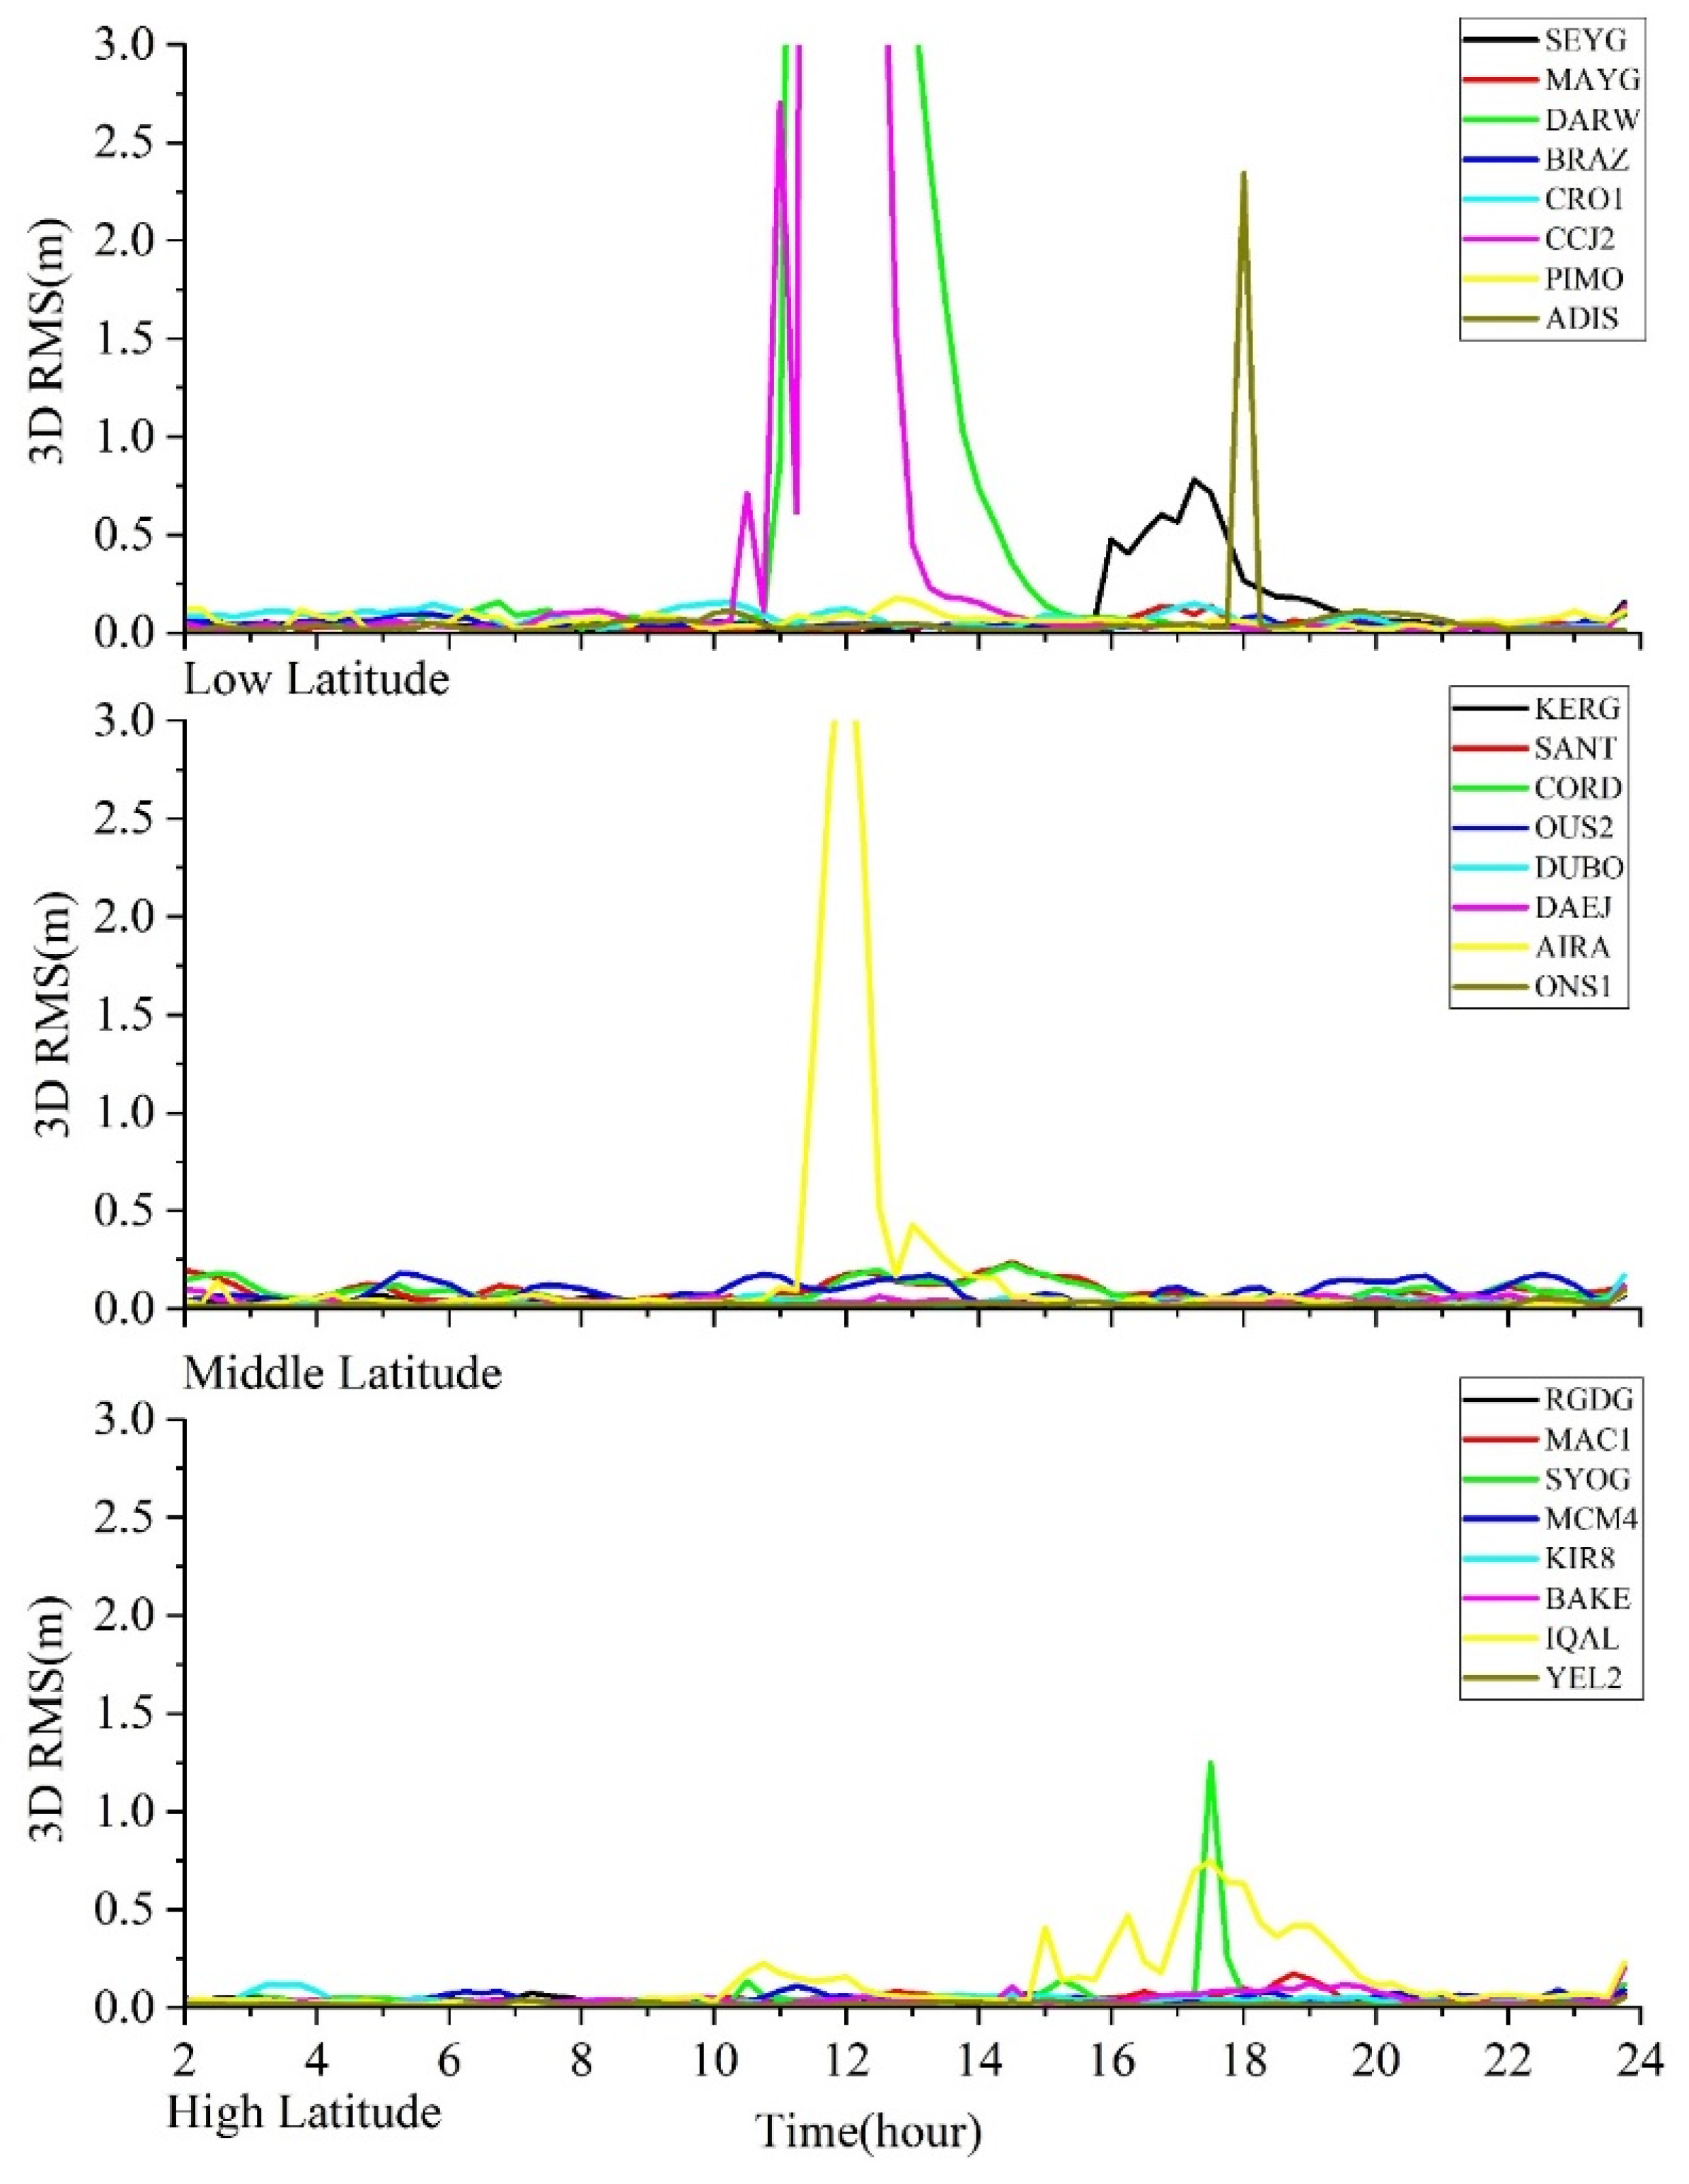
After reprocessing the data using adaptive thresholding strategy 5 for the stations selected in Figure 3, the segmented RMS results are plotted in Figure 10. From the figure, it can be seen that after using the GF adaptive threshold for data processing, the positioning accuracy of the stations in the high-latitude region has been significantly improved; the positioning accuracy of most of the stations has reached the same level for quite some time, and only one station, SYOG, has an RMS of more than 1 m. The improvement of positioning accuracy in the mid-latitude region is also more apparent, with only the ONS1 station showing anomalous accuracy, with the maximum RMS exceeding 3 m. In comparison, the RMS of the rest of the stations does not exceed 0.2 m. The positioning accuracy in the low latitude region relative to constant GF thresholds has also improved significantly, with some stations reaching the same level of quite period.
The 3D positioning accuracy of all stations reprocessed using GF adaptive thresholding is plotted in Figure 11, with periods consistent with Figure 5. As can be seen from the figure, except for very few stations with 3D positioning accuracy more significant than 1 m, the positioning accuracy of the vast majority of stations has been significantly improved. The improvement was most pronounced at the high-latitude stations. For the stations that still showed accuracy anomalies in the time slots of 12:00–12:15, 18:00–18:15, 20:00–20:15, and 22:00–22:15, it was hypothesized that missed cycle slips might cause them. In general, the use of GF adaptive thresholds significantly improves the localization accuracy of the stations during magnetic storms relative to the results of experiments below the use of constant GF thresholds.
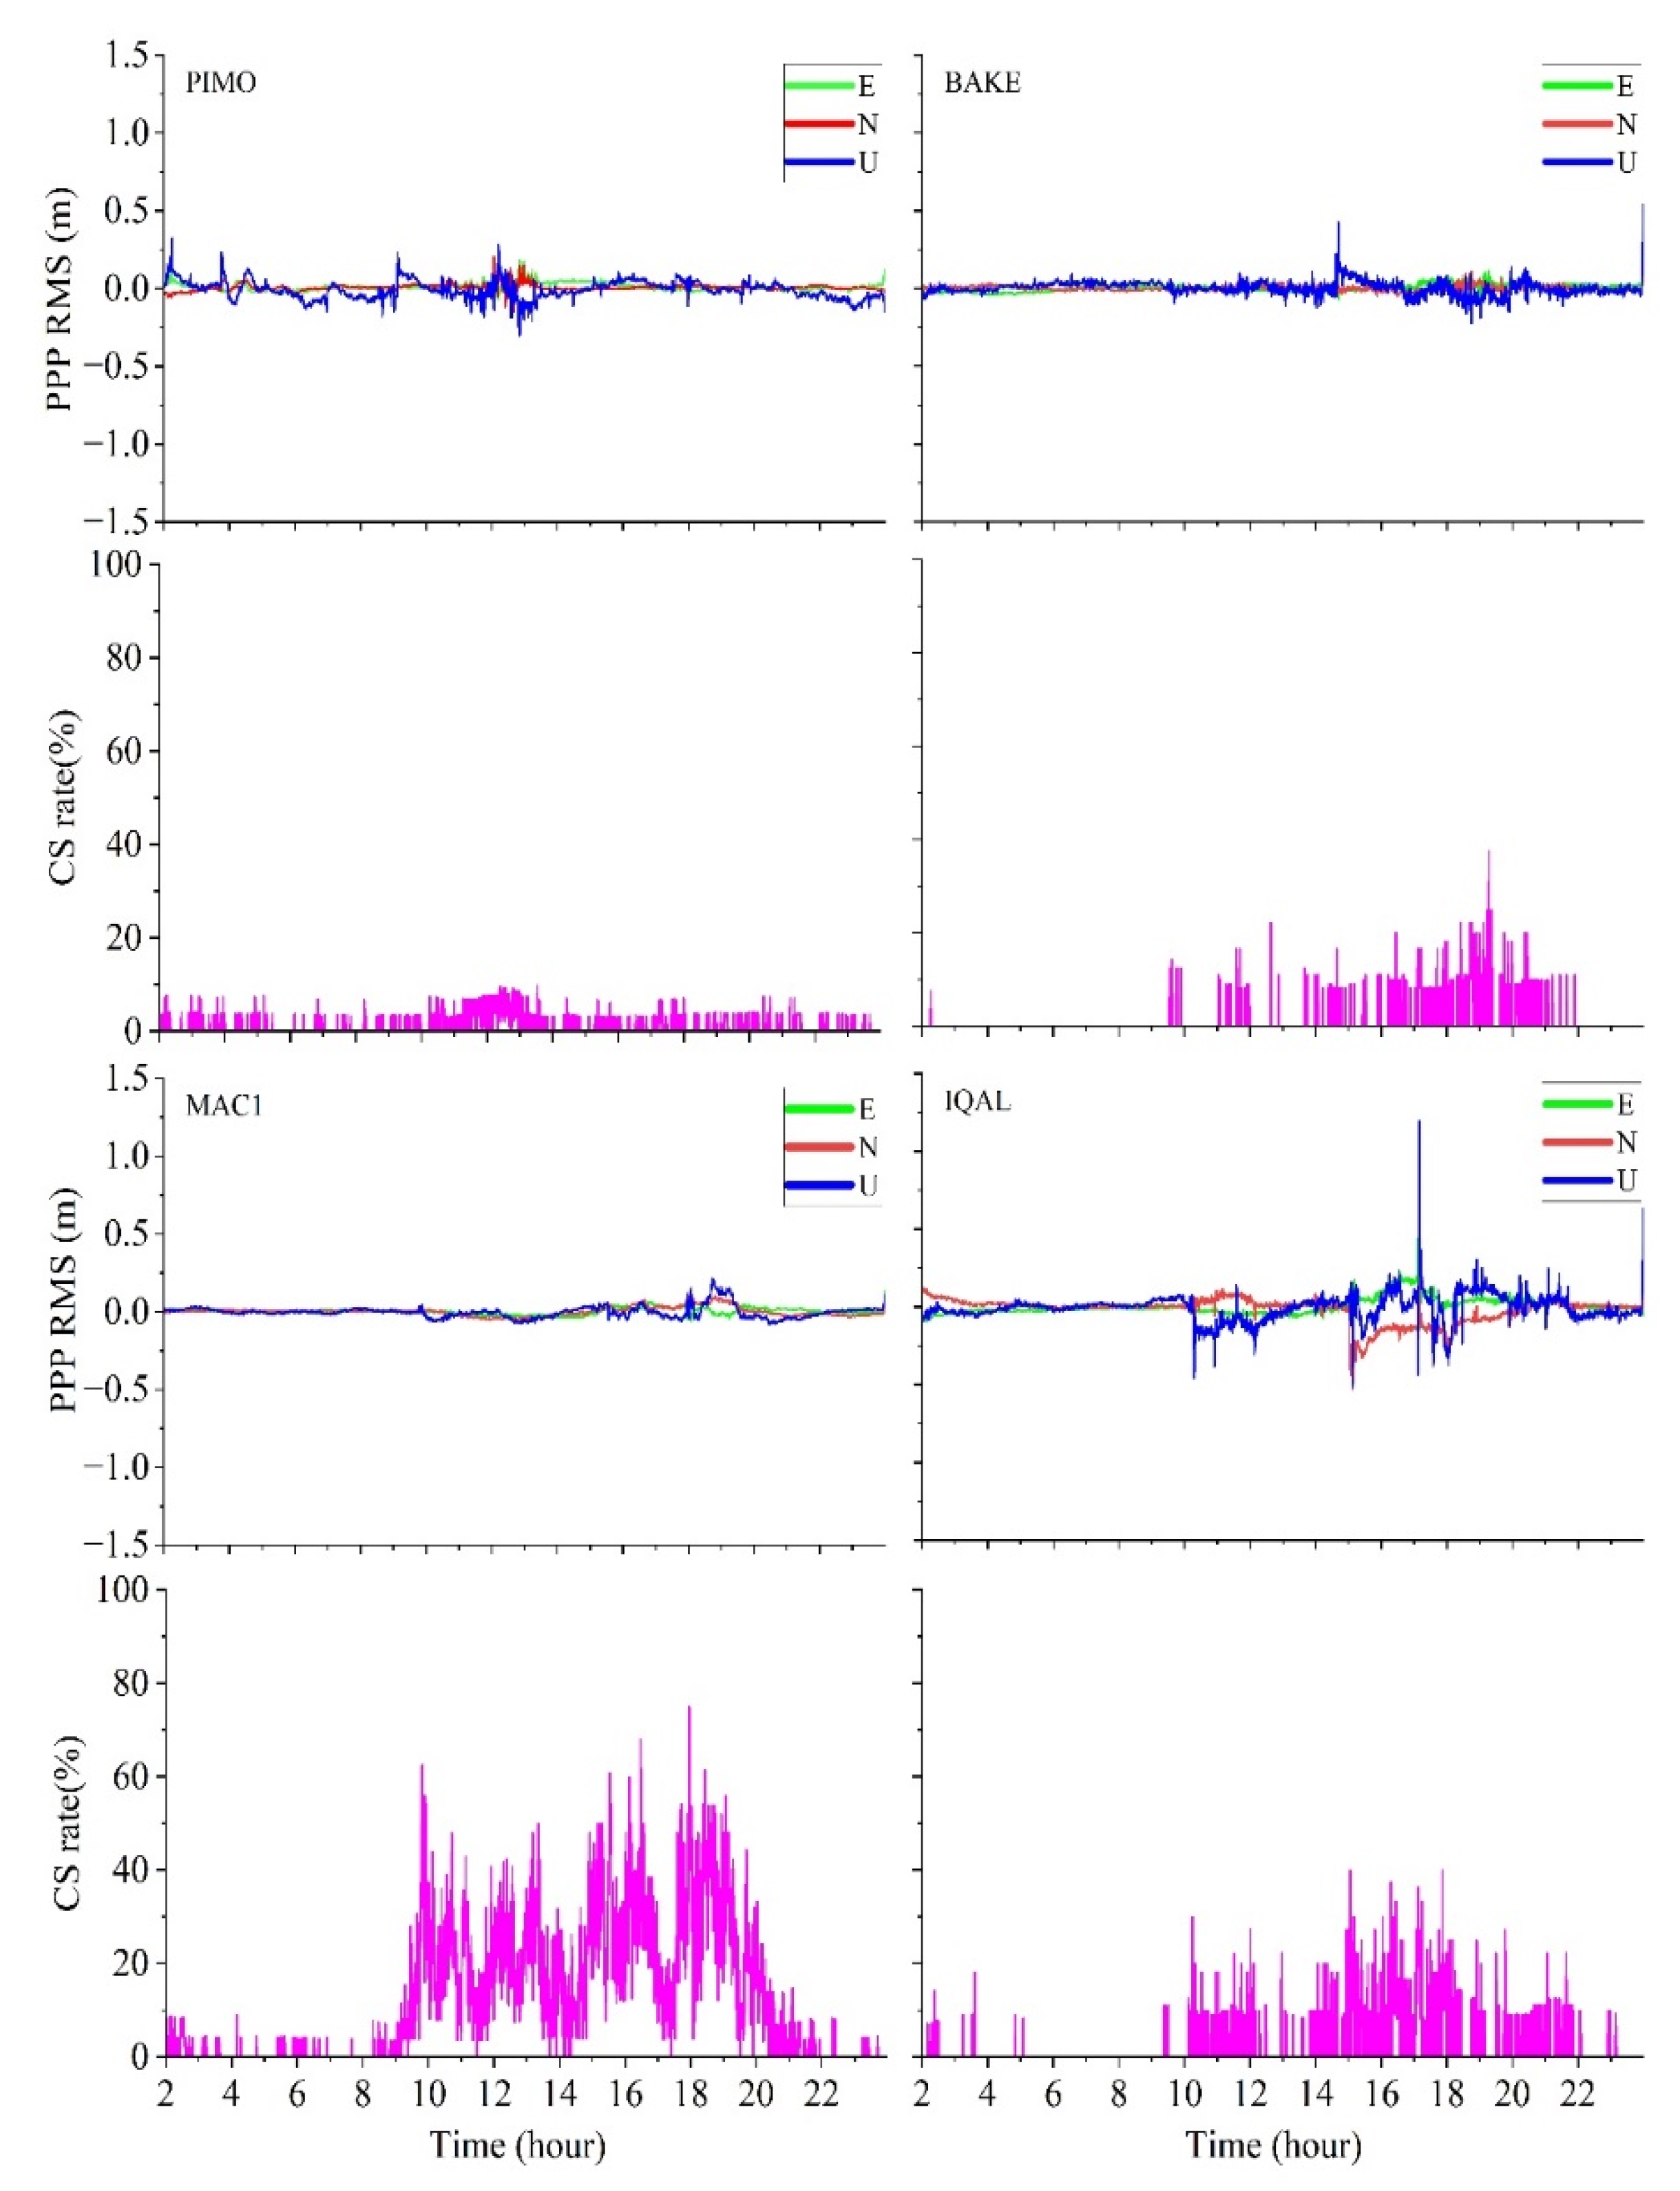
To further analyze the occurrence of cycle slips at the stations when using the GF adaptive threshold, the occurrence of cycle slips and the localization errors in the E, N, and U directions for the four stations selected in Figure 8 above are plotted in Figure 12. The figure shows that the stations PIMO, BAKE, and IQAL cycle-slip incidences have been significantly improved; the localization error in the E, N, and U directions have also been greatly enhanced relative to constant GF thresholds. For three stations, PIMO, BAKE, and MAC1, abnormal jumps in positioning error have entirely disappeared. Only one epoch of the IQAL station showed a positioning error of more than 1 m. On the whole, the use of GF adaptive thresholding for cycle-slip detection significantly reduces the station’s cycle slip rate during magnetic storms, and the time series image of the cycle-slip incidence is smoother; thus, the positioning accuracy of the station during magnetic storms is significantly improved.
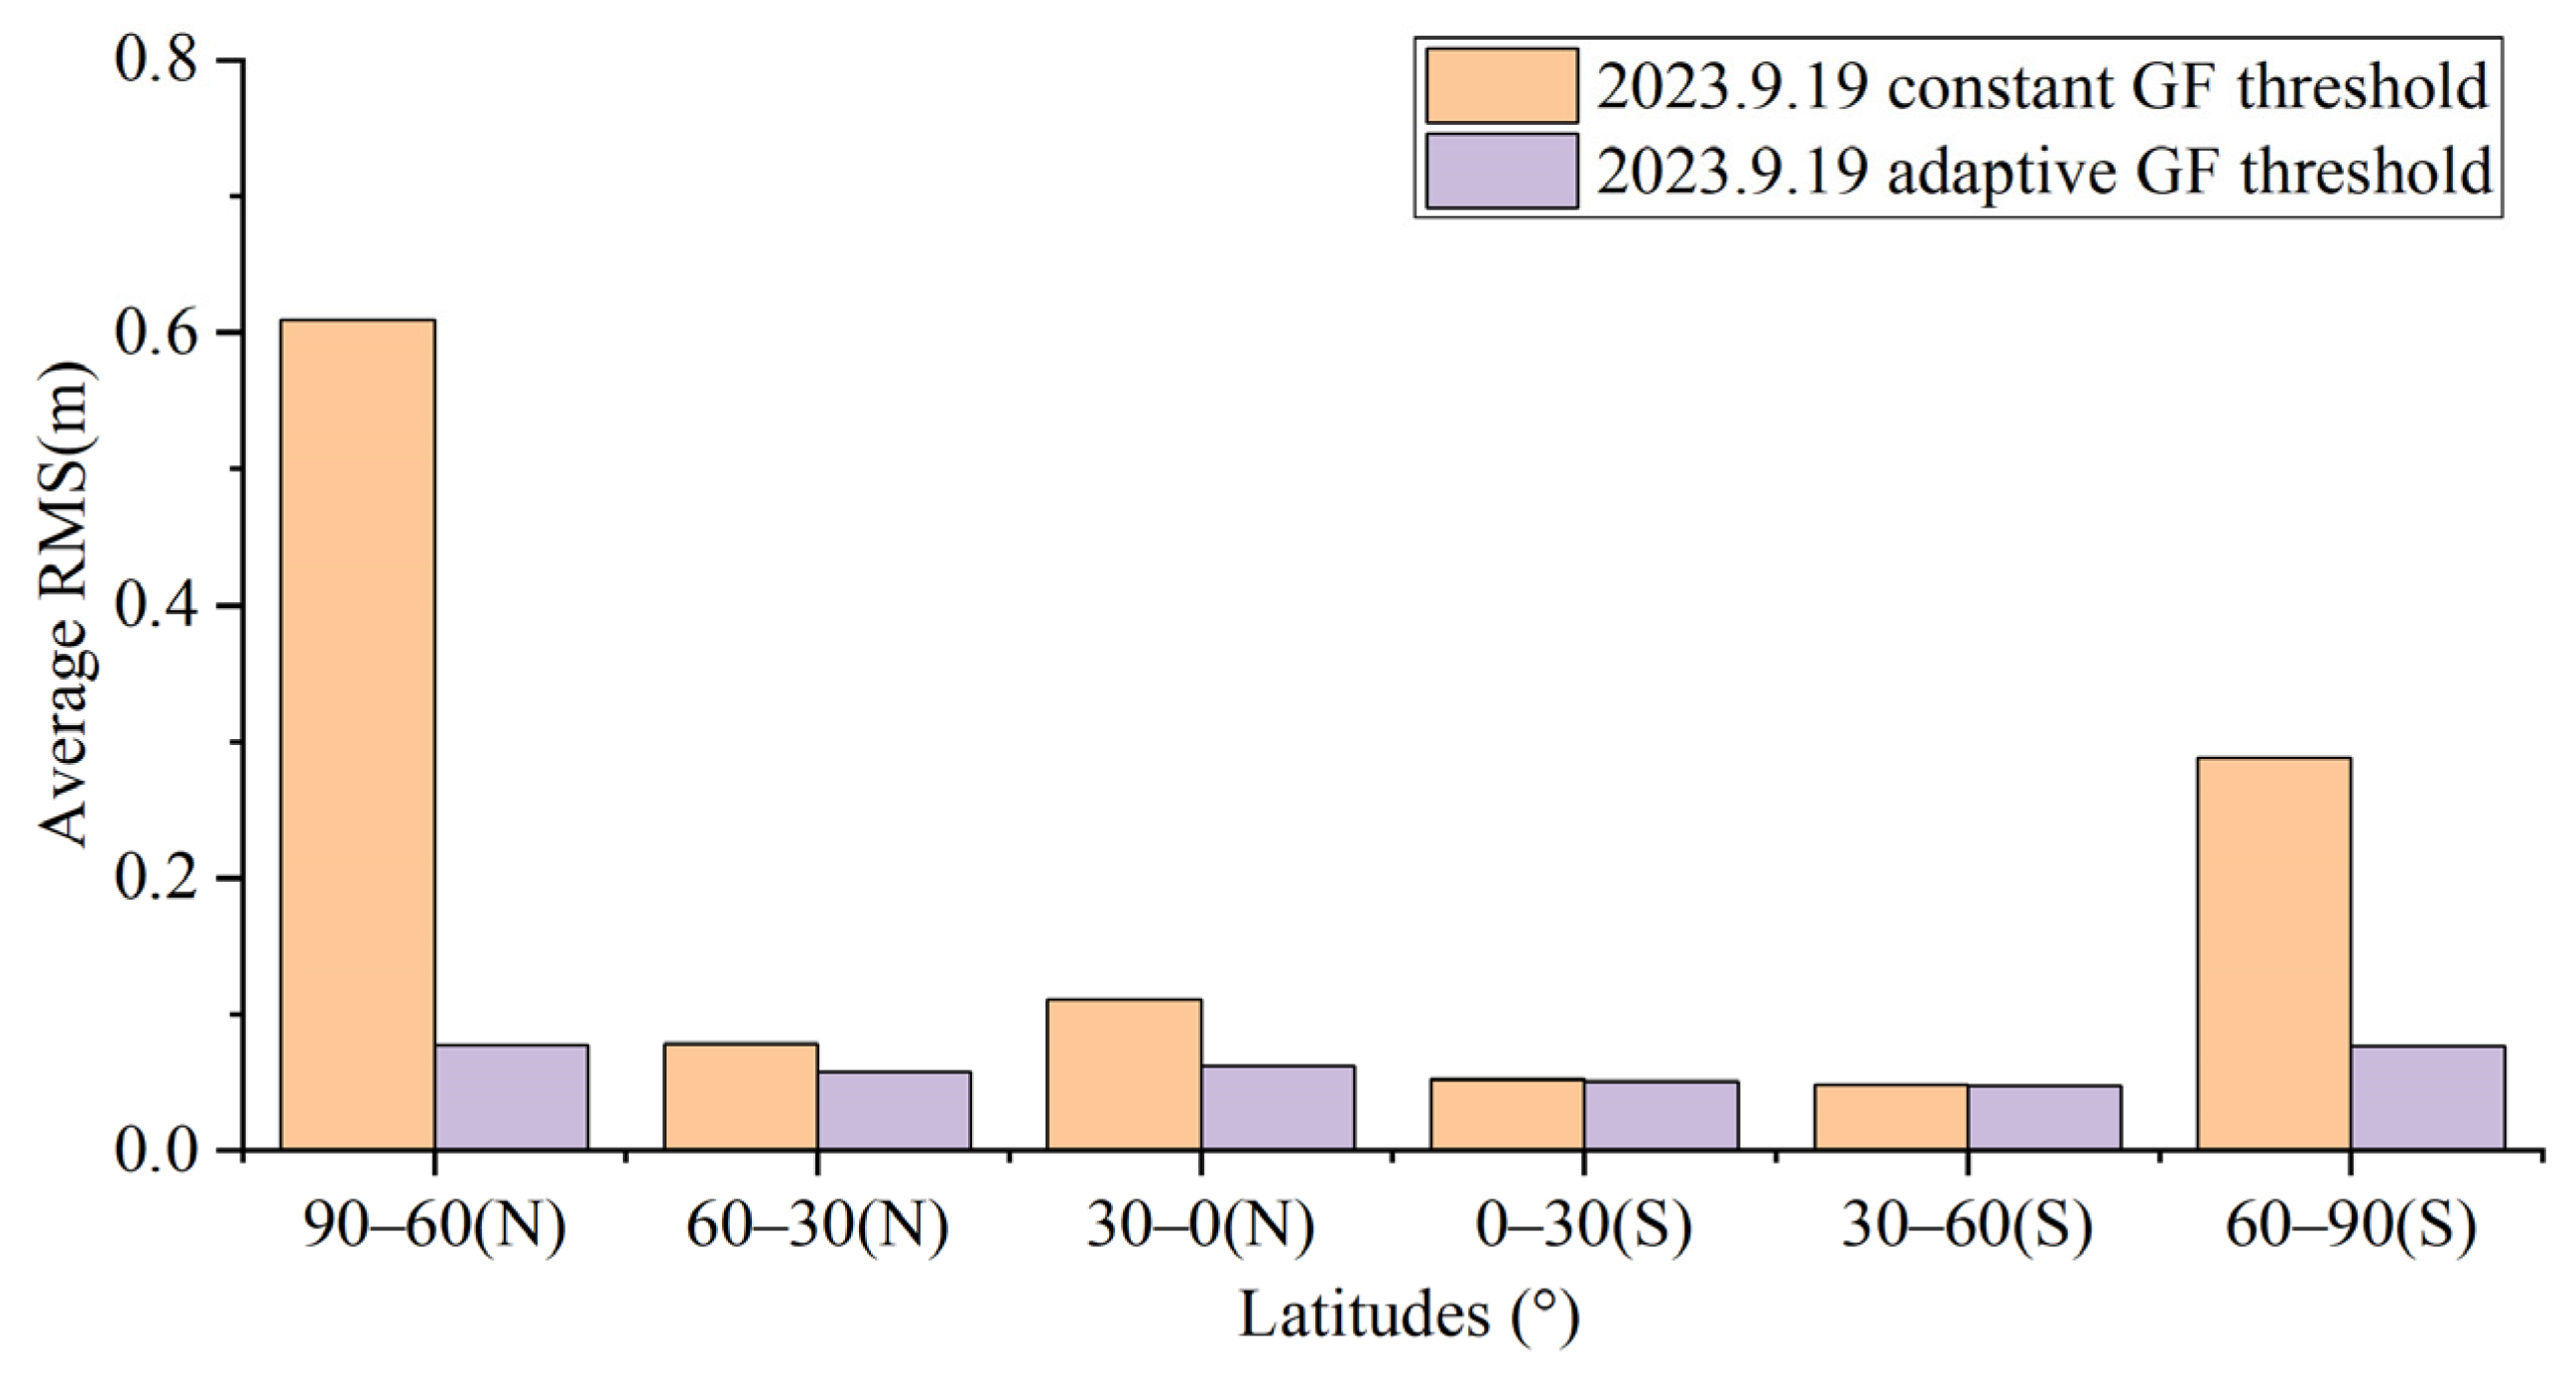
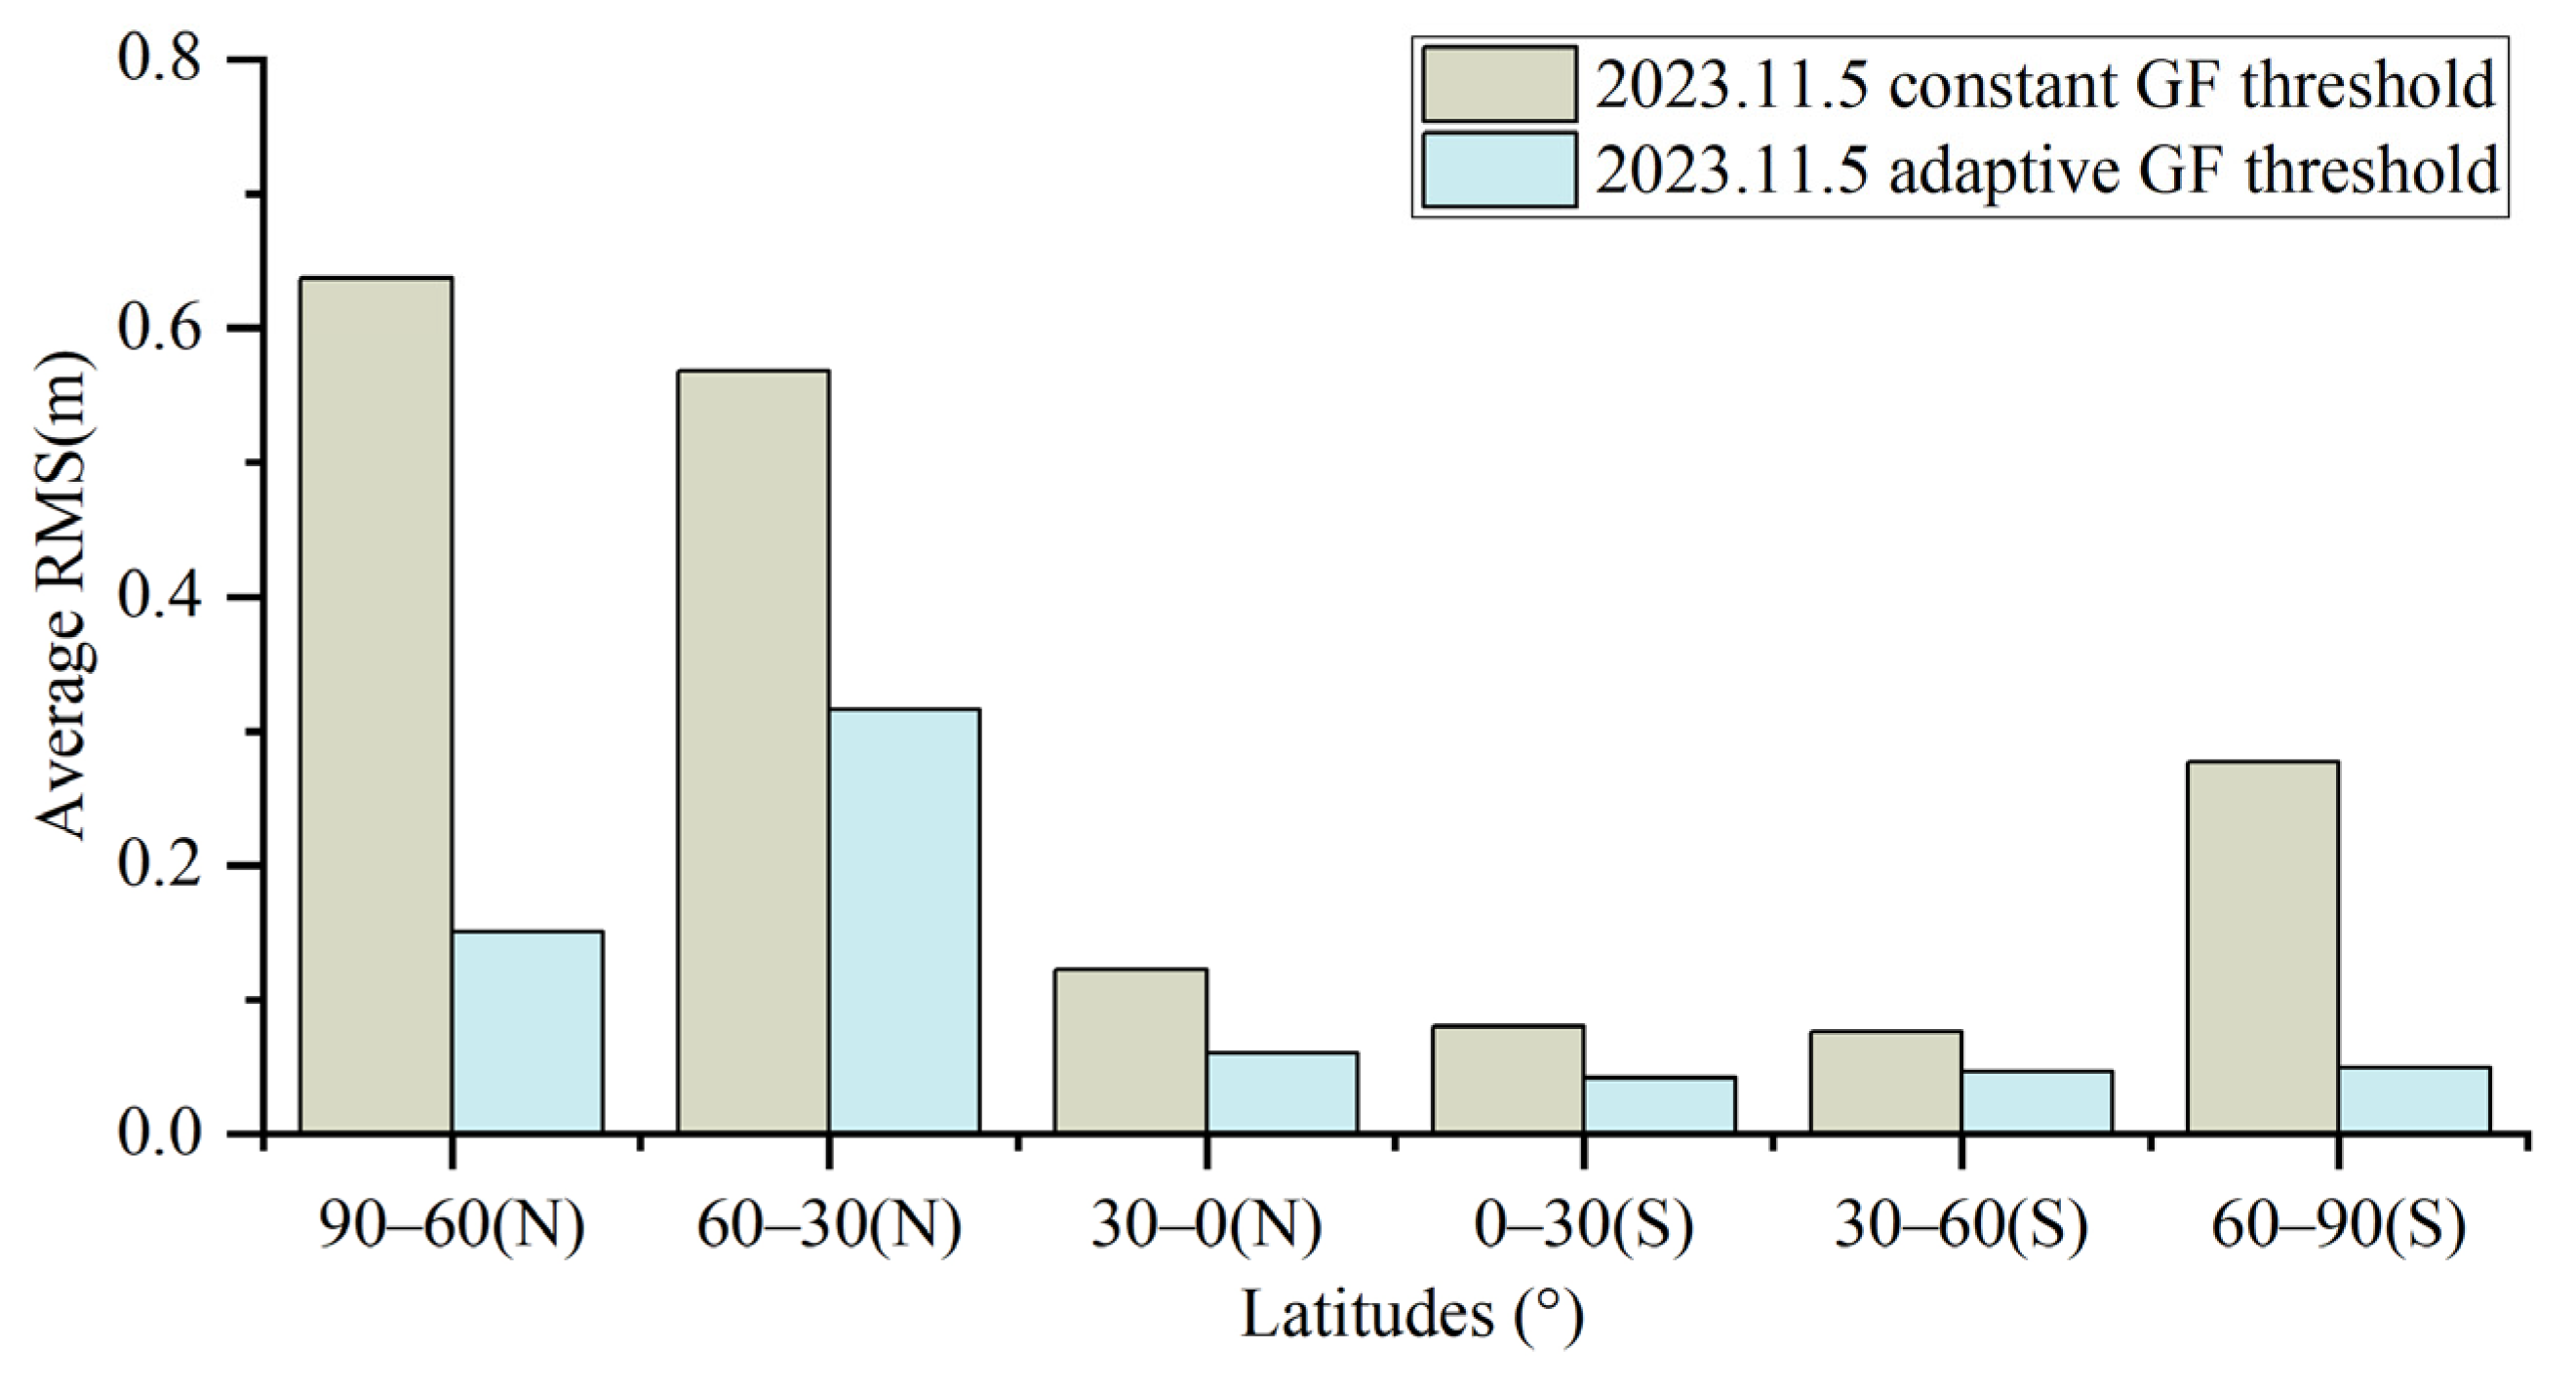
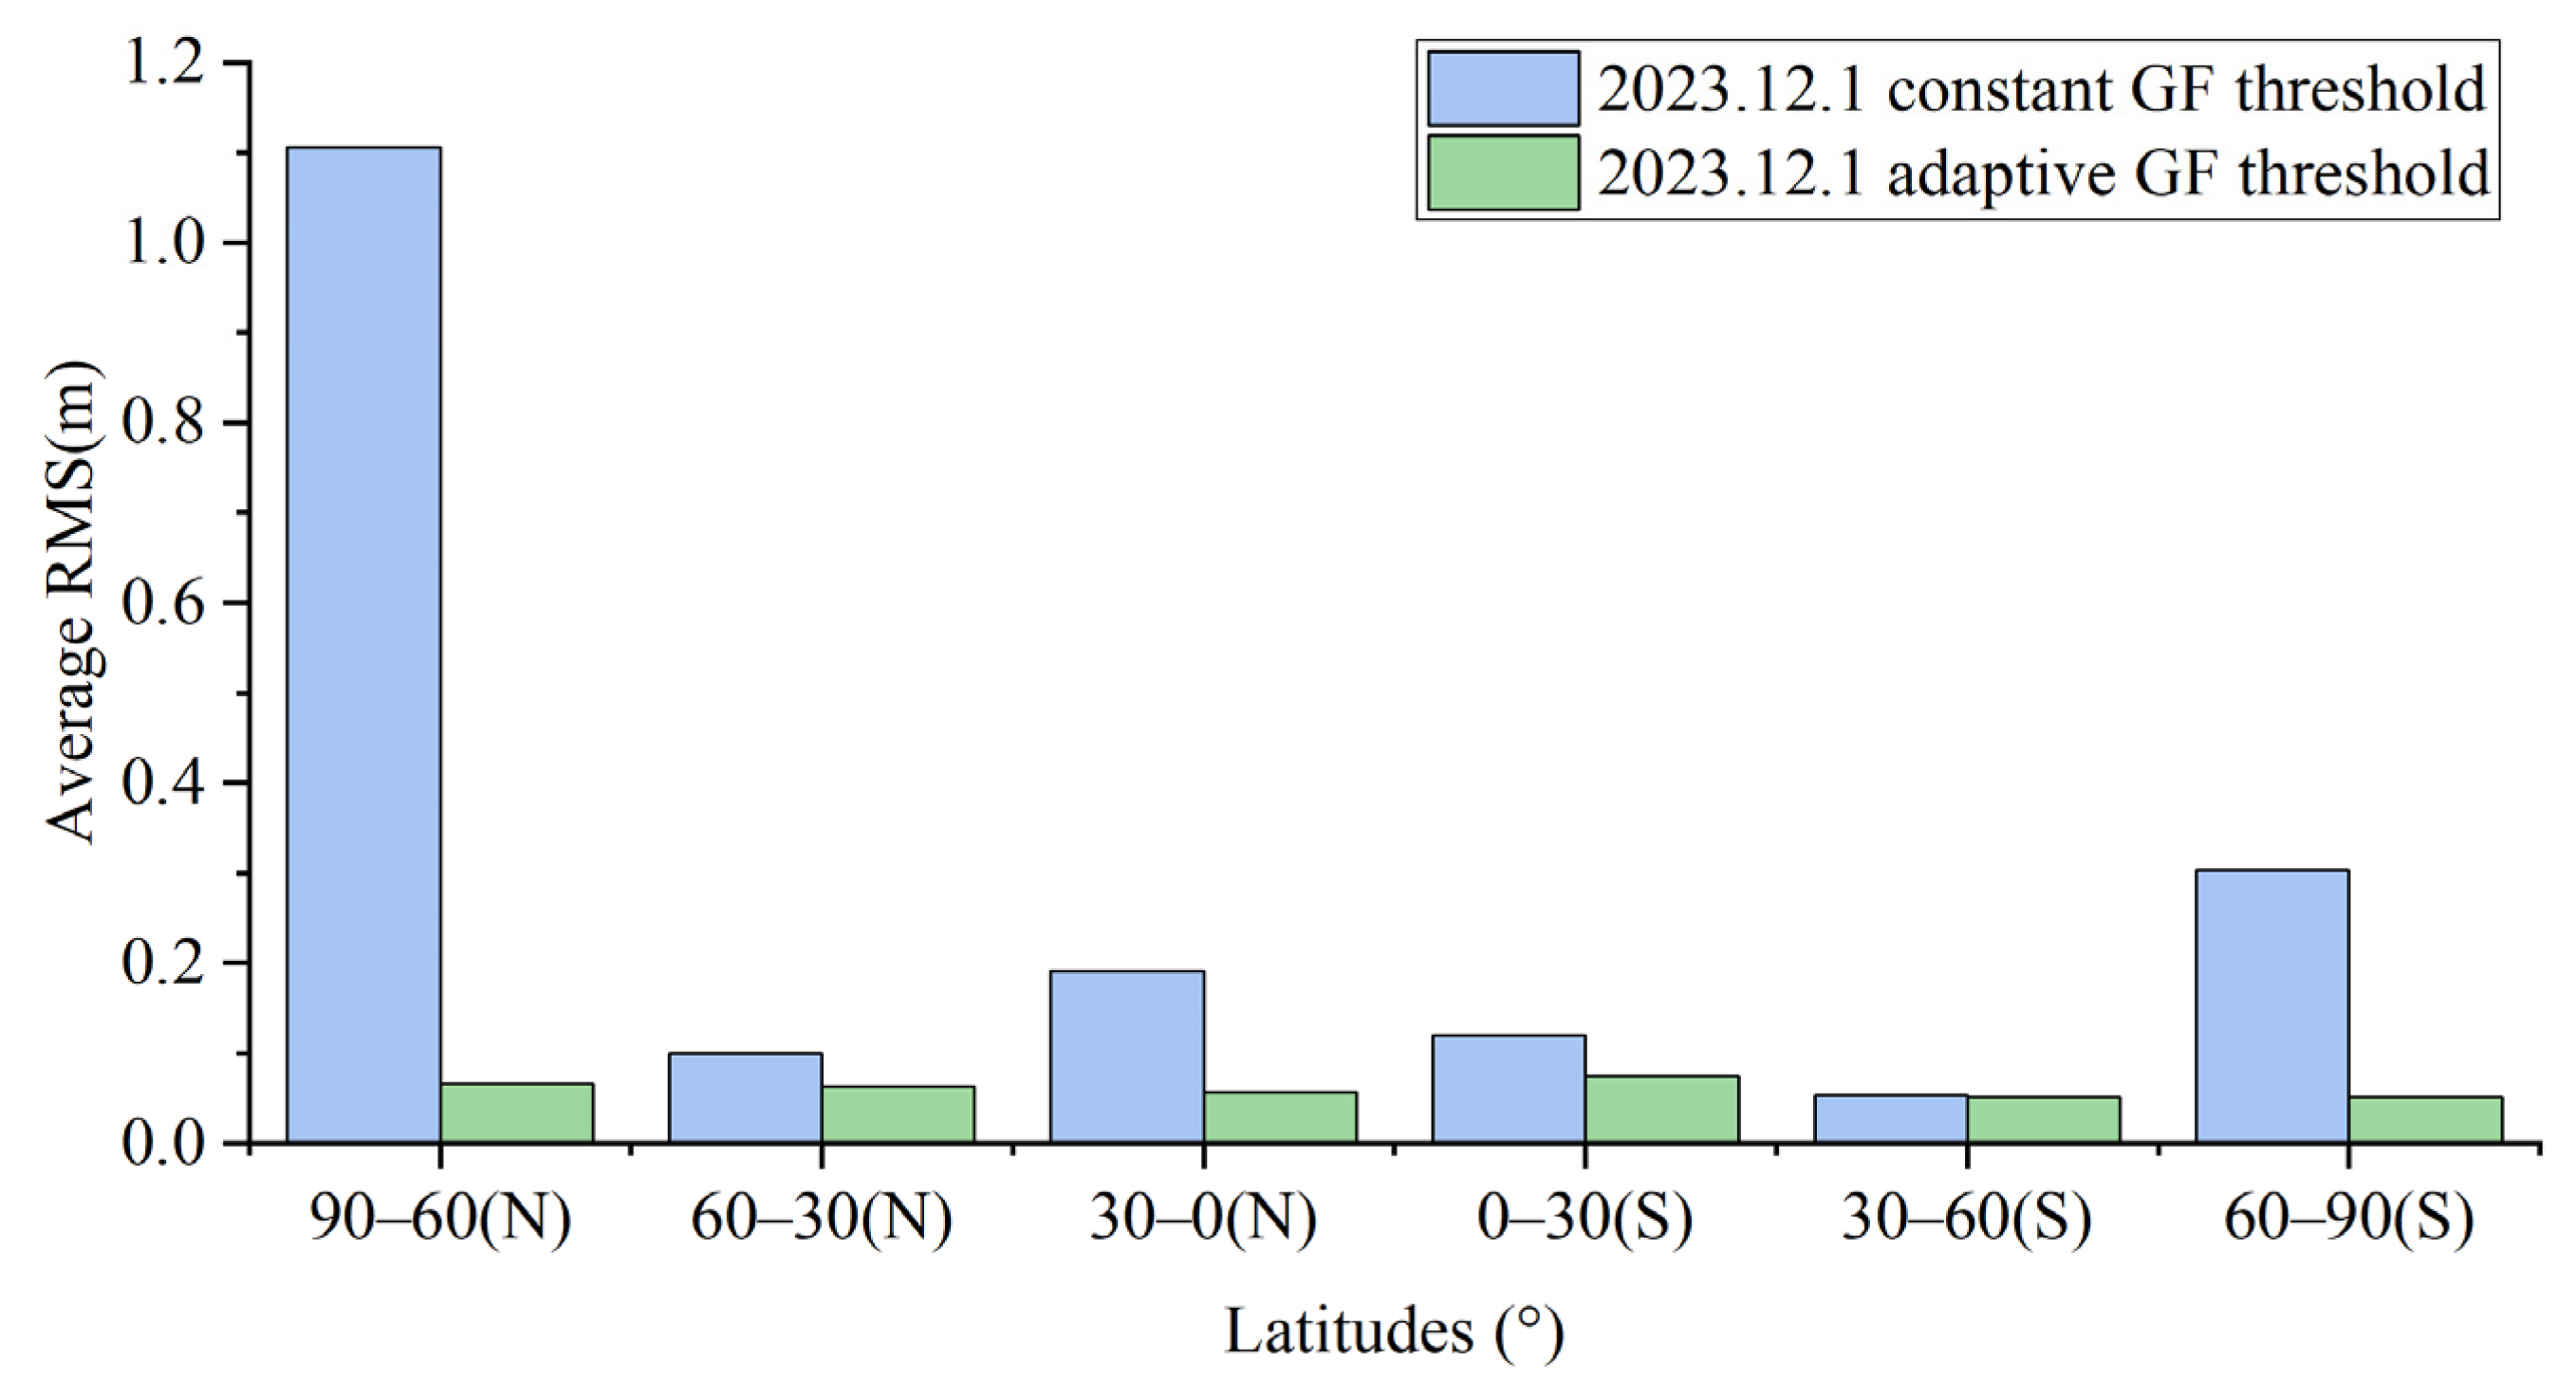
The data from the two magnetic storm events of 9.19 and 12.1 were reprocessed using the GF adaptive thresholding strategy 5 above; in conjunction with the magnetic storm event of 11.5, the processed station-averaged 3D localization errors by latitude are plotted in Figure 13, Figure 14 and Figure 15 It can be observed that, during the three magnetic storm events, adaptive thresholds have significantly reduced the positioning errors of stations in high-latitude regions. Using constant GF thresholds, the highest average RMS in the high latitudes of the three magnetic storm events exceeded 0.6 and 1 m. In the magnetic storm event 11.5, the 60–30° (N) mid-latitude region is also greatly affected, with the average RMS exceeding 0.5 m; the positioning performance is no longer suitable for high-precision positioning services. The localization accuracy is significantly improved by using GF adaptive thresholding. None of the most strongly affected high-latitude stations had an average RMS greater than 0.1 m, and the average RMS of stations in the 60–30° (N) region of the 11.5 Magnetic Storm event was also reduced. Because the impact during magnetic storms is small in the middle and low latitudes and mainly affects the high latitudes, the average RMS enhancement effect of using GF adaptive thresholding stations is more evident for the high latitudes; there is also a specific enhancement effect for the less affected middle latitudes; and there is no noticeable enhancement for the unaffected low-latitude areas.

6. Conclusions

In this paper, three magnetic storm events on 19 September, 5 November, and 1 December 2023, are selected for data processing using GF phase observations. To study the effect of the setting of the cycle-slip detection threshold on the PPP positioning accuracy of the combined global GPS and BDS system. Comparative experimental analyses of the 5 November magnetic storm event using conventional cycle-slip detection threshold constants and five adaptive threshold models, respectively, yielded the following conclusions:
  • During magnetic storms with active ionospheric variations, apparent accuracy anomalies were observed in some periods at stations located in high-latitude regions when the constant GF threshold was used for data processing; the positioning accuracy at this time was no longer applicable to high-precision positioning. Analysis of the station carrier-to-noise ratio time series shows that the satellite signal carrier-to-noise ratio does not decrease significantly when the accuracy anomaly occurs, and the curve is smooth. The main reason for the occurrence of positioning accuracy anomalies at the stations is not a decrease in satellite signal strength.
  • When using the GF constant threshold for cycle-slip detection, stations located at high latitudes have abnormally high cycle-slip rates of up to 90 percent; at the same time, the positioning errors in the three directions of the station, E, N, and U, increase during the period when the cycle-slip rate is high. Strong ionospheric conditions can lead to drastic changes in GF phase observations for real-time cycle-slip detection. At this point, the use of a general constant GF threshold can produce a large number of cycle-slip misjudgments. The cycle inappropriate slip threshold setting leads to excessive cycle-slip misjudgments, which makes almost all the satellite ambiguity parameters involved in the computation reset at the same time. Leading to the degradation of station positioning accuracy
  • Dynamic PPP experiments use five adaptive threshold models for data during the 5 November magnetic storm event. The experimental results show that after the data processing using the adaptive threshold of strategy 5, the cycle-slip rates of the above stations with abnormally high cycle-slip rates basically return to normal, and the positioning accuracies also reach the same level of quite period, which is all less than 0.5 m. Adaptive thresholds significantly reduce cycle-slip misjudgments relative to conventional constant thresholds, thus restoring localization accuracy to an average level.
  • Dynamic PPP experiments were conducted on 100 stations in the global region using the constant GF threshold and the strategy 5 adaptive threshold, respectively. The regions were divided by latitude, and the average three-dimensional positioning accuracy of the stations in each latitude region was calculated. The results show that the use of GF adaptive threshold has significantly improved the positioning accuracy of the stations in high-latitude areas, with a maximum enhancement ratio of up to 80%; the middle latitude areas, which are less affected, have also been improved to some extent, and there is no significant change for the low latitudes. The adaptive threshold model integrates the relationship between data sampling rate and ionospheric variations, and using the adaptive threshold model in magnetic storm events has better localization accuracy relative to the constant threshold model.
  • In the future, we hope to add parameters such as the ionospheric disturbance index to the adaptive threshold model to improve the service performance of GNSS during magnetic storms.

Author Contributions

X.S. and J.Z.; data curation, J.Z., Z.L. (Zhanshu Li) and X.C.; formal analysis, Q.L., Z.L. (Zhanshu Li), H.M. and X.C.; funding acquisition, X.S.; investigation, Q.Z. and J.C.; methodology, Q.Z., Z.L. (Zhimin Liu) and G.W.; project administration, Z.L. (Zhimin Liu); resources, Z.L. (Zhimin Liu) and X.C.; software, Q.L. and J.C.; supervision, G.W. and J.C.; validation, J.Z., Q.Z. and Z.L. (Zhimin Liu); writing—original draft, X.S. and J.Z.; writing—review and editing, G.W. and H.M. All authors have read and agreed to the published version of the manuscript.

Funding

This work was sponsored by the National Natural Science Foundation of China (Grant No. 42304036); Shandong Provincial Natural Science Foundation, China (Grant number ZR2023MD054, ZR2021QD131); Key Laboratory of Geomatics and Digital Technology of Shandong Province.

Data Availability Statement

The GNSS raw observation data and GPS/BDS broadcast ephemeris data were available at ftp://igs.gnsswhu.cn/pub/gps/data/daily/2023. Precision clock and Precision ephemeris files available for download at ftp://igs.gnsswhu.cn/pub/whu/MGEX. The MGEX observations available for download at ftp://igs.gnsswhu.cn/pub/gps/products.

Acknowledgments

The space weather indicators and geomagnetic storm event information used in this paper were obtained from NASA Goddard Space Flight Center (USA), World Data Center for Geomagnetism (Japan), and the Space Environment Prediction Center (SEPC) in China. The MGEX observations and the precision orbit and precision clock products are from the IGS organization.

Conflicts of Interest

Author Quan Zhou was employed by the company China Academy of Space Technology. Author Zhanshu Li was employed by the company Beijing BDstar Navigation Co., Ltd. The remaining authors declare that the research was conducted in the absence of any commercial or financial relationships that could be construed as a potential conflict of interest.

References

  1. Ning, J.; Yao, Y.; Zhang, X. Overview of the development of global navigation satellite system. J. Geogr. Cartogr. 2022, 5, 90–97. [Google Scholar] [CrossRef]
  2. Yang, Y.; Mao, Y.; Sun, B. Basic performance and future developments of BeiDou global navigation satellite system. Satell. Navig. 2020, 1, 1. [Google Scholar] [CrossRef]
  3. Yasyukevich, Y.V.; Yasyukevich, A.S.; Astafyeva, E.I. How modernized and strengthened GPS signals enhance the system performance during solar radio bursts. GPS Solut. 2021, 25, 46. [Google Scholar] [CrossRef]
  4. Coster, A.; Komjathy, A. Space Weather and the Global Positioning System. Space Weather 2008, 6, S06D04. [Google Scholar] [CrossRef]
  5. Yuan, Y.; Huo, X.; Zhang, B. Research Progress of Precise Models and Correction for GNSS Ionospheric Delay in China over Recent Years. Cehui Xuebao/Acta Geod. Et Cartogr. Sin. 2017, 46, 1364–1378. [Google Scholar] [CrossRef]
  6. Liu, T.; Yu, Z.; Ding, Z.; Nie, W.; Xu, G. Observation of Ionospheric Gravity Waves Introduced by Thunderstorms in Low Latitudes China by GNSS. Remote Sens. 2021, 13, 4131. [Google Scholar] [CrossRef]
  7. Li, Q.; Su, X.; Xie, X.; Tao, C.; Cui, J.; Chen, H.; Liu, Z. Accuracy Analysis of Error Compensation in the Ionospheric Model of BDS Broadcasting Based on ABC-BP Neural Network. In Proceedings of the China Satellite Navigation Conference (CSNC 2022) Proceedings, Beijing, China, 22–25 May 2022; pp. 54–63. [Google Scholar]
  8. Richmond, A.D. Ionosphere. In Encyclopedia of Geomagnetism and Paleomagnetism; Gubbins, D., Herrero-Bervera, E., Eds.; Springer: Dordrecht, The Netherlands, 2007; pp. 452–454. [Google Scholar]
  9. Afraimovich, E.L.; Astafyeva, E.I.; Demyanov, V.V.; Edemskiy, I.K.; Gavrilyuk, N.S.; Ishin, A.B.; Kosogorov, E.A.; Leonovich, L.A.; Lesyuta, O.S.; Palamartchouk, K.S.; et al. A review of GPS/GLONASS studies of the ionospheric response to natural and anthropogenic processes and phenomena. J. Space Weather Space Clim. 2013, 3, A27. [Google Scholar] [CrossRef]
  10. Astafyeva, E.; Yasyukevich, Y.; Maksikov, A.; Zhivetiev, I. Geomagnetic storms, super-storms, and their impacts on GPS-based navigation systems. Space Weather. 2014, 12, 508–525. [Google Scholar] [CrossRef]
  11. Fang, T.-W.; Kubaryk, A.; Goldstein, D.; Li, Z.; Fuller-Rowell, T.; Millward, G.; Singer, H.J.; Steenburgh, R.; Westerman, S.; Babcock, E. Space Weather Environment During the SpaceX Starlink Satellite Loss in February 2022. Space Weather. 2022, 20, e2022SW003193. [Google Scholar] [CrossRef]
  12. Balodis, J.; Normand, M.; Varna, I. Extreme Solar Events’ Impact on GPS Positioning Results. Remote Sens. 2021, 13, 3624. [Google Scholar] [CrossRef]
  13. Afraimovich, E.L.; Demyanov, V.V.; Smolkov, G.Y. The total failures of GPS functioning caused by the powerful solar radio burst on December 13, 2006. Earth Planets Space 2009, 61, 637–641. [Google Scholar] [CrossRef]
  14. Gonzalez, W.D.; Joselyn, J.A.; Kamide, Y.; Kroehl, H.W.; Rostoker, G.; Tsurutani, B.T.; Vasyliunas, V.M. What is a geomagnetic storm? J. Geophys. Res. Space Phys. 1994, 99, 5771–5792. [Google Scholar] [CrossRef]
  15. Wang, Y.; Yuan, Y.; Li, M.; Zhang, T.; Geng, H.; Wang, G.; Wen, G. Effects of Strong Geomagnetic Storms on the Ionosphere and Degradation of Precise Point Positioning Accuracy during the 25th Solar Cycle Rising Phase: A Case Study. Remote Sens. 2023, 15, 5512. [Google Scholar] [CrossRef]
  16. Matsoukas, D.A.; Papagiannis, M.D.; Aarons, J.; Klobuchar, J.A. Correlation of solar radio bursts and sudden increases of the total electron content (SITEC) of the ionosphere. J. Atmos. Terr. Phys. 1972, 34, 1275–1283. [Google Scholar] [CrossRef]
  17. Fuller-Rowell, T.J.; Codrescu, M.V.; Moffett, R.J.; Quegan, S. Response of the thermosphere and ionosphere to geomagnetic storms. J. Geophys. Res. Space Phys. 1994, 99, 3893–3914. [Google Scholar] [CrossRef]
  18. Jin, S.; Jin, R.; Kutoglu, H. Positive and negative ionospheric responses to the March 2015 geomagnetic storm from BDS observations. J. Geod. 2017, 91, 613–626. [Google Scholar] [CrossRef]
  19. Blagoveshchenskii, D.V. Effect of geomagnetic storms (substorms) on the ionosphere: 1. A review. Geomagn. Aeron. 2013, 53, 275–290. [Google Scholar] [CrossRef]
  20. Nava, B.; Rodríguez-Zuluaga, J.; Alazo-Cuartas, K.; Kashcheyev, A.; Migoya-Orué, Y.; Radicella, S.M.; Amory-Mazaudier, C.; Fleury, R. Middle- and low-latitude ionosphere response to 2015 St. Patrick’s Day geomagnetic storm. J. Geophys. Res. Space Phys. 2016, 121, 3421–3438. [Google Scholar] [CrossRef]
  21. Şentürk, E. Investigation of global ionospheric response of the severe geomagnetic storm on June 22-23, 2015 by GNSS-based TEC observations. Astrophys. Space Sci. 2020, 365, 110. [Google Scholar] [CrossRef]
  22. Mansilla, G.A. Behavior of the Total Electron Content over the Arctic and Antarctic sectors during several intense geomagnetic storms. Geod. Geodyn. 2019, 10, 26–36. [Google Scholar] [CrossRef]
  23. Gao, Q.; Liu, L.-B.; Zhao, B.-Q.; Wan, W.-X.; Zhang, M.-L.; Ning, B.-Q. Statistical Study of the Storm Effects in Middle and Low Latitude Ionosphere in the East-Asian Sector. Chin. J. Geophys. 2008, 51, 435–443. [Google Scholar] [CrossRef]
  24. Wu, J.-S.; Xu, L. Statistical study of the ionospheric storms over 5 latitude zones in the European sector. Chin. J. Geophys. 2015, 58, 349–361. [Google Scholar] [CrossRef]
  25. Liu, L.; Zou, S.; Yao, Y.; Aa, E. Multi-scale ionosphere responses to the May 2017 magnetic storm over the Asian sector. GPS Solut. 2019, 24, 26. [Google Scholar] [CrossRef]
  26. Afraimovich, E.L.; Demyanov, V.V.; Kondakova, T.N. Degradation of GPS performance in geomagnetically disturbed conditions. GPS Solut. 2003, 7, 109–119. [Google Scholar] [CrossRef]
  27. Skone, S.H. The impact of magnetic storms on GPS receiver performance. J. Geod. 2001, 75, 457–468. [Google Scholar] [CrossRef]
  28. Luo, X.; Gu, S.; Lou, Y.; Xiong, C.; Chen, B.; Jin, X. Assessing the Performance of GPS Precise Point Positioning Under Different Geomagnetic Storm Conditions during Solar Cycle 24. Sensors 2018, 18, 1784. [Google Scholar] [CrossRef]
  29. Wielgosz, P.; Kashani, I.; Grejner-Brzezinska, D. Analysis of long-range network RTK during a severe ionospheric storm. J. Geod. 2005, 79, 524–531. [Google Scholar] [CrossRef]
  30. Jacobsen, K.S.; Schäfer, S. Observed effects of a geomagnetic storm on an RTK positioning network at high latitudes. J. Space Weather Space Clim. 2012, 2, A13. [Google Scholar] [CrossRef]
  31. Jacobsen, K.S.; Andalsvik, Y.L. Overview of the 2015 St. Patrick’s day storm and its consequences for RTK and PPP positioning in Norway. J. Space Weather Space Clim. 2016, 6, A9. [Google Scholar] [CrossRef]
  32. Poniatowski, M.; Nykiel, G. Degradation of Kinematic PPP of GNSS Stations in Central Europe Caused by Medium-Scale Traveling Ionospheric Disturbances During the St. Patrick’s Day 2015 Geomagnetic Storm. Remote Sens. 2020, 12, 3582. [Google Scholar] [CrossRef]
  33. Alcay, S. Ionospheric response to extreme events and its effects on precise point positioning. Indian J. Phys. 2022, 96, 3721–3734. [Google Scholar] [CrossRef]
  34. Zakharenkova, I.; Cherniak, I. Effects of storm-induced equatorial plasma bubbles on GPS-based kinematic positioning at equatorial and middle latitudes during the September 7–8, 2017, geomagnetic storm. GPS Solut. 2021, 25, 132. [Google Scholar] [CrossRef]
  35. Li, D.; Dang, Y.; Yuan, Y.; Mi, J. A New Cycle-Slip Repair Method for Dual-Frequency BDS against the Disturbances of Severe Ionospheric Variations and Pseudoranges with Large Errors. Remote Sens. 2021, 13, 1037. [Google Scholar] [CrossRef]
  36. Wei, H.; Li, J.; Zhang, S.; Xu, X. Cycle Slip Detection and Repair for Dual-Frequency LEO Satellite GPS Carrier Phase Observations with Orbit Dynamic Model Information. Remote Sens. 2019, 11, 1273. [Google Scholar] [CrossRef]
  37. Zhang, S.; He, L.; Wu, L. Statistical Study of Loss of GPS Signals Caused by Severe and Great Geomagnetic Storms. J. Geophys. Res. Space Phys. 2020, 125, e2019JA027749. [Google Scholar] [CrossRef]
  38. Li, B.; Liu, T.; Nie, L.; Qin, Y. Single-frequency GNSS cycle slip estimation with positional polynomial constraint. J. Geod. 2019, 93, 1781–1803. [Google Scholar] [CrossRef]
  39. Liu, Z. A new automated cycle slip detection and repair method for a single dual-frequency GPS receiver. J. Geod. 2011, 85, 171–183. [Google Scholar] [CrossRef]
  40. Liu, N.; Zhang, Q.; Zhang, S.; Wu, X. Algorithm for Real-Time Cycle Slip Detection and Repair for Low Elevation GPS Undifferenced Data in Different Environments. Remote Sens. 2021, 13, 2078. [Google Scholar] [CrossRef]
  41. Li, D.; Dang, Y.; Yuan, Y.; Mi, J. Improved Cycle Slip Repair with GPS Triple-Frequency Measurements by Minifying the Influences of Ionospheric Variation and Pseudorange Errors. Remote Sens. 2021, 13, 556. [Google Scholar] [CrossRef]
  42. Feng, W.; Zhao, Y.; Zhou, L.; Huang, D.; Hassan, A. Fast cycle slip determination for high-rate multi-GNSS RTK using modified geometry-free phase combination. GPS Solut. 2020, 24, 42. [Google Scholar] [CrossRef]
  43. Liu, Z. A new approach for cycle slip detection and fix using single GPS receiver’s single satellite dual frequency data containing arbitrarily large pseudorange errors. J. Glob. Position. Syst. 2018, 16, 5. [Google Scholar] [CrossRef]
  44. Cai, C.; Liu, Z.; Xia, P.; Dai, W. Cycle slip detection and repair for undifferenced GPS observations under high ionospheric activity. GPS Solut. 2013, 17, 247–260. [Google Scholar] [CrossRef]
  45. Zhao, D.; Hancock, C.M.; Roberts, G.W.; Jin, S. Cycle Slip Detection during High Ionospheric Activities Based on Combined Triple-Frequency GNSS Signals. Remote Sens. 2019, 11, 250. [Google Scholar] [CrossRef]
  46. Chen, L.; Zhang, L. Cycle-Slip Processing Under High Ionospheric Activity Using GPS Triple-Frequency Data. In Proceedings of the China Satellite Navigation Conference (CSNC) 2016 Proceedings, Changsha, China, 18–20 May 2016; Volume III; pp. 411–423. [Google Scholar]
  47. Nie, W.; Rovira-Garcia, A.; Li, M.; Fang, Z.; Wang, Y.; Zheng, D.; Xu, T. The Mechanism for GNSS-Based Kinematic Positioning Degradation at High-Latitudes under the March 2015 Great Storm. Space Weather 2022, 20, e2022SW003132. [Google Scholar] [CrossRef]
  48. Miao, Y.; Sun, Z.W.; Wu, S.N. Error Analysis and Cycle-Slip Detection Research on Satellite-Borne GPS Observation. J. Aerosp. Eng. 2011, 24, 95–101. [Google Scholar] [CrossRef]
  49. Li, K.; Ban, H.; Jiao, Y.; Lv, S. A Cycle Slip Detection and Repair Method Using BDS Triple-Frequency Optimization Combination with Wavelet Denoising. Int. J. Aerosp. Eng. 2022, 2022, 5110875. [Google Scholar] [CrossRef]
  50. Luo, X.; Du, J.; Lou, Y.; Gu, S.; Yue, X.; Liu, J.; Chen, B. A Method to Mitigate the Effects of Strong Geomagnetic Storm on GNSS Precise Point Positioning. Space Weather 2022, 20, e2021SW002908. [Google Scholar] [CrossRef]
  51. Zhang, W.; Wang, J. A real-time cycle slip repair method using the multi-epoch geometry-based model. GPS Solut. 2021, 25, 60. [Google Scholar] [CrossRef]
  52. Blewitt, G. An Automatic Editing Algorithm for GPS data. Geophys. Res. Lett. 1990, 17, 199–202. [Google Scholar] [CrossRef]
  53. Li, Z.; Li, M.; Shi, C.; Chen, L.; Deng, C.; Song, W.; Liu, R.; Zhang, P. A New Fuzzy-Cluster-Based Cycle-Slip Detection Method for GPS Single-Frequency Observation. Remote Sens. 2019, 11, 2896. [Google Scholar] [CrossRef]
  54. Wübbena, G. Software developments for geodetic positioning with GPS using TI 4100 code and carrier measurements. In Proceedings of the First International Symposium on Precise Positioning with the Global Positioning System, Rockville, MD, USA, 15–19 April 1985; US Department of Commerce: Rockville, MD, USA, 1985; Volume 19, pp. 403–412. [Google Scholar]
  55. Zhang, X.; Zeng, Q.; He, J.; Kang, C. Improving TurboEdit Real-time Cycle Slip Detection by the Construction of Threshold Model. Geomat. Inf. Sci. Wuhan Univ. 2017, 42, 285–292. [Google Scholar] [CrossRef]
  56. Ding, Z.; He, K.; Liu, D.; Li, M.; Zong, Y. BDS Cycle Slip Detection Method Based on Adaptive Threshold Model GF Combination. J. Geod. Geodyn. 2022, 42, 734–739. [Google Scholar] [CrossRef]
  57. Zakharov, V.I.; Chernyshov, A.A.; Miloch, W.; Jin, Y. Influence of the Ionosphere on the Parameters of the GPS Navigation Signals during a Geomagnetic Substorm. Geomagn. Aeron. 2020, 60, 754–767. [Google Scholar] [CrossRef]
  58. Kunches, J.M.; Klobuchar, J.A. Eye on the Ionosphere: Tracking Geomagnetic Storms. GPS Solut. 2002, 5, 94–95. [Google Scholar] [CrossRef]
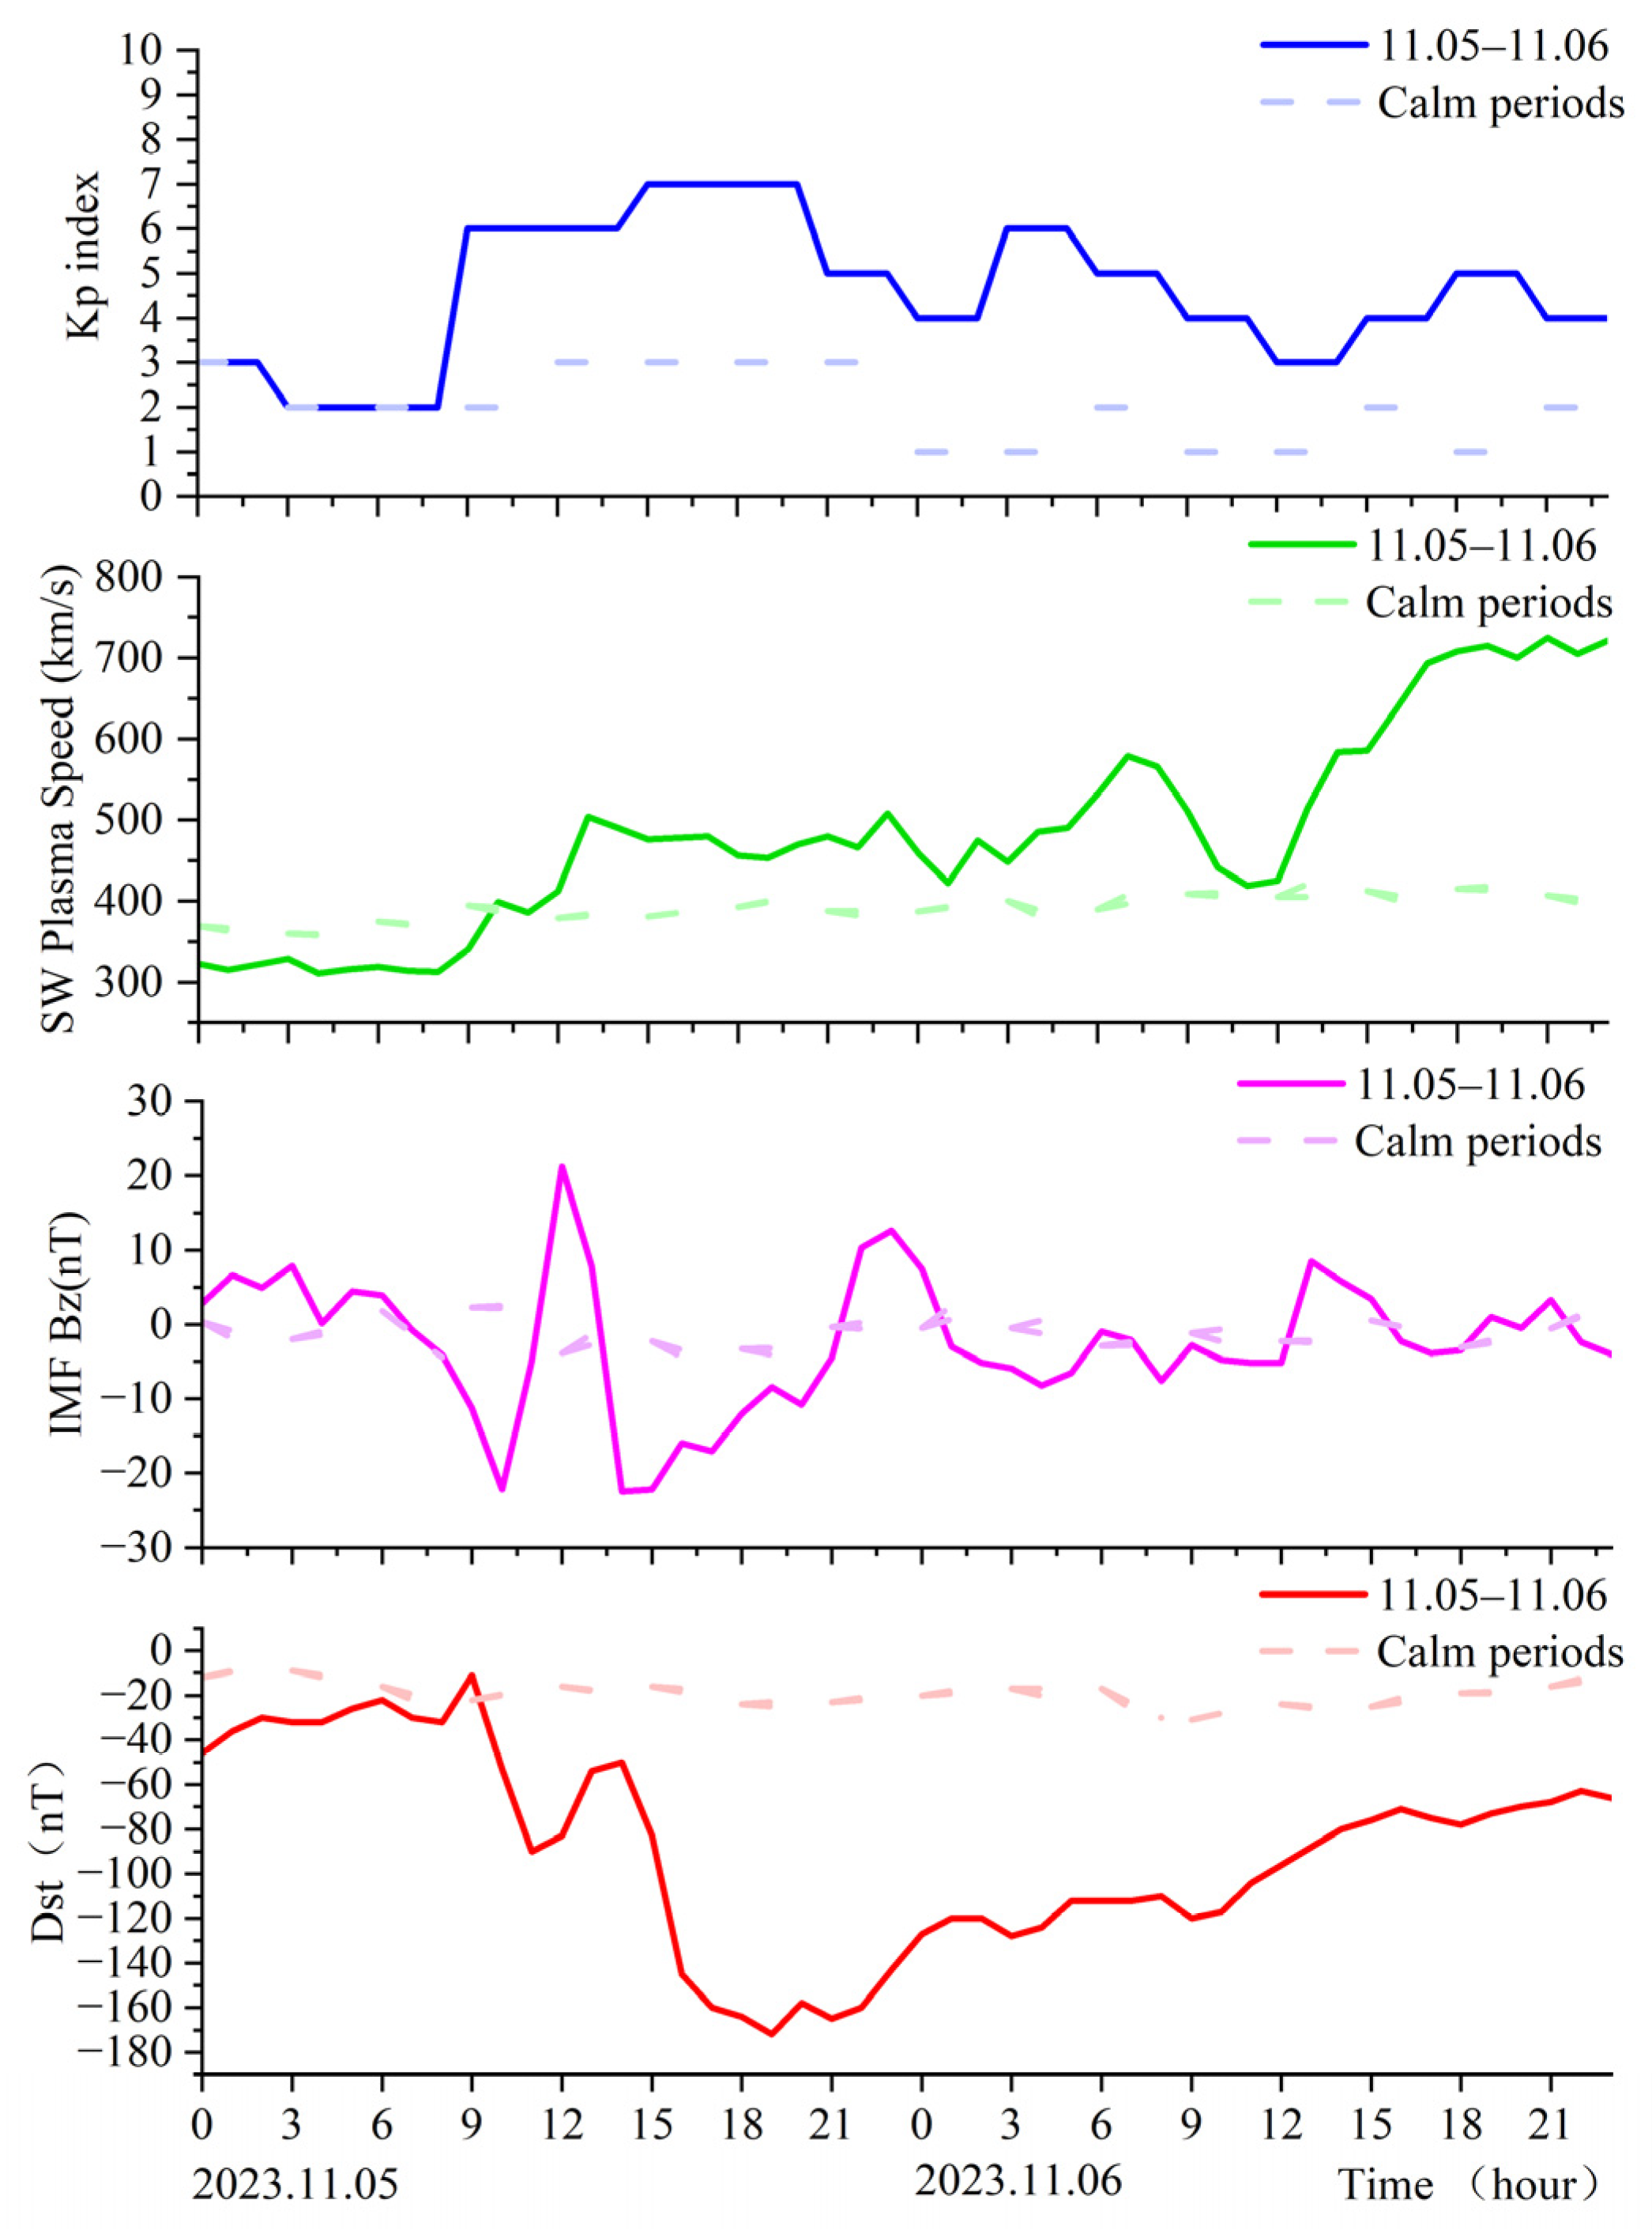
Figure 1. Variations of magnetic storm conditions from 5–6 November 2023.
Remotesensing 16 01726 g001
Figure 2. Variations of geomagnetic parameters from 5–6 November 2023.
Remotesensing 16 01726 g002
Figure 3. Global distribution of 100 MGEX stations.
Remotesensing 16 01726 g003
Figure 4. Segmented 3D localization error RMS for some stations using the constant GF threshold.
Remotesensing 16 01726 g004
Figure 5. 3DRMS using the constant GF threshold for part of the period during the 5 November 2023 magnetic storm.
Remotesensing 16 01726 g005
Figure 6. Timing diagram of the carrier-to-noise ratio of the GPS system at MAC1 station.
Remotesensing 16 01726 g006
Figure 7. Timing diagram of the carrier-to-noise ratio of the BDS system at MAC1 station.
Remotesensing 16 01726 g007
Figure 8. Positioning error time series and the cycle jump rate of 4 stations such as PIMO when using the constant GF threshold.
Remotesensing 16 01726 g008
Figure 9. Percentage of improvement in localization accuracy of 5 adaptive thresholding schemes relative to constant thresholding.
Remotesensing 16 01726 g009
Figure 10. Segmented 3D localization error RMS for selected stations using the GF adaptive threshold.
Remotesensing 16 01726 g010
Figure 11. 3DRMS using the adaptive GF threshold during part of the 5 November 2023, magnetic storm.
Remotesensing 16 01726 g011
Figure 12. Positioning error time series and the cycle jump rate of 6 stations such as PIMO when using an adaptive GF threshold.
Remotesensing 16 01726 g012
Figure 13. 19 September 2023 Comparison of RMS for magnetic storm events using different thresholds.
Remotesensing 16 01726 g013
Figure 14. 5 November 2023 Comparison of RMS for magnetic storm events using different thresholds.
Remotesensing 16 01726 g014
Figure 15. 1 December 2023 Comparison of RMS for magnetic storm events using different thresholds.
Remotesensing 16 01726 g015
Table 1. Five empirical thresholds that take into account the sampling interval R.
Strategies n i (m)
Strategy 1 n 1 n 1 = 0.03 + 0.001 × R , G P S 0.0092 + 0.0011 × R , B D S
Strategy 2 n 2 n 2 = 0.03 + 0.002 × R , G P S 0.0092 + 0.0021 × R , B D S
Strategy 3 n 3 n 3 = 0.03 + 0.003 × R , G P S 0.0092 + 0.0031 × R , B D S
Strategy 4 n 4 n 4 = 0.03 + 0.004 × R , G P S 0.0092 + 0.0051 × R , B D S
Strategy 5 n 5 n 5 = 0.03 + 0.006 × R , G P S 0.0092 + 0.0071 × R , B D S
Table 2. Dynamic PPP data processing strategies.
TypesStrategies
Receiver coordinatesWhite noise
Receiver clock biasWhite noise
Cycle-slip detectionMW + GF
Observation typesDual-frequency ionospheric-free
Observation weightingElevation angle weighting
Solution modeKinematic
Sampling interval30 s
Parameter estimation methodsExpanded Kalman filter
Cutoff elevation angle
Antenna phase center offsetigs14.atx
Tropospheric wet delayRoam randomly
AmbiguityFloating-point solution
Precision orbit/clock biasWHU
Table 3. Average three-dimensional positioning accuracy of stations by latitude for three magnetic storm events.
DataPositioning Accuracy during Magnetic Storms (m)Positioning Accuracy during Quiet Period (m)
Latitude 9.1911.0512.0110.0211.1512.10
90–60°(N)0.6090.6371.1060.0530.3500.089
60–30°(N)0.0790.5680.1000.0510.0710.069
30–0°(N)0.1110.1220.1900.2160.0680.053
0–30°(S)0.0520.0800.1190.0780.0430.071
30–60°(S)0.0480.0760.0530.0530.0560.085
60–90°(S)0.2890.2770.3030.0870.2730.088
Disclaimer/Publisher’s Note: The statements, opinions and data contained in all publications are solely those of the individual author(s) and contributor(s) and not of MDPI and/or the editor(s). MDPI and/or the editor(s) disclaim responsibility for any injury to people or property resulting from any ideas, methods, instructions or products referred to in the content.