1. Introduction
Annually, thousands of people worldwide lose their lives due to damages caused by natural disasters [
1,
2,
3]. Countries spend millions of dollars on rebuilding infrastructures and compensating for the associated damages. Accordingly, providing accurate building damage assessment maps, with the location, number, and severity of damages, is critical for emergency responders and relevant organizations to manage their resources appropriately [
4].
Remote sensing images are capable of providing overviews from large regions of the affected area for faster building damage assessment. Remote sensing data, i.e., satellite images, drone/aerial imagery, or Synthetic Aperture Radar (SAR) data, have proven their applicability in providing useful information for disaster management. Although SAR sensors propose all-weather data availability [
5,
6], or drone imagery obtains higher spatial resolutions [
7,
8], satellite optical images are more cost-effective with respect to the coverage area. They can be obtained in near-real-time thanks to the numerous satellites and constellations in orbit, and thus, are one of the best choices to rely on during disaster conditions [
9]. In summary, key attributes of optical satellite images are their wide area coverage, rapid revisits, simple interpretation, and fast deployment [
9].
According to the temporal usage of satellite images for building damage assessment, the current literature can be divided into two categories: (1) techniques that only use post-disaster images and (2) techniques that are based on both pre- and post-disaster images. For the first group, which relies on post-disaster images, the task of damage assessment is mainly considered to be a semantic segmentation problem [
10,
11,
12,
13]. However, without using pre-disaster images, post-disaster images are not appropriate sources for precise extraction of building footprints [
14]. Additionally, researchers require auxiliary information, such as pre-disaster building masks obtained from external resources, e.g., municipality databases or OpenStreetMap, to enhance their results [
15,
16]. On the other hand, having both pre- and post-disaster satellite images from the affected region will help locate the buildings and assess their damaged parts.
It is worth mentioning that the problem of building damage assessment using both pre- and post-disaster satellite images is inherently very similar to a change detection problem. In both scenarios, pre- and post-disaster images are compared with each other to find changes [
17,
18]. The main difference, making damage assessment a more complicated problem, is that in change detection, only changed objects (e.g., buildings) are detected, and everything else is ignored. In contrast, both changed (damaged) and unchanged (not-damaged) buildings should be found in the building damage assessment. Another difference is the requirement to classify different damage categories, which implies a multi-class change detection problem [
14,
19].
From another point of view, according to the utilized processing techniques, building damage assessment has been addressed by (1) visual interpretation of images, (2) machine learning-based methods relying on hand-crafted features, and (3) deep learning techniques. Traditionally, satellite images were visually interpreted by researchers and experts to obtain estimations of the amount of damage over the affected area [
20]. Even with large groups of experts and interpreters, visual investigation of remote sensing images for building damage assessment is not a time- and cost-efficient procedure. Therefore, automatic techniques were introduced to process remote sensing images for building extraction and damage assessment. Based on the human experience obtained from visual interpretations, machine learning techniques with very few trainable parameters, which relied on hand-crafted features, such as textural, spectral, and spatial features, were developed [
21,
22,
23,
24]. In addition to the amount of time and experience required for feature extraction, manually extracted features were not generalizable to other geographical regions, and in most cases, they were valid for specific conditions [
25].
Recently, deep learning models, primarily based on Convolutional Neural Networks (CNNs), have shown great success in various computer vision tasks such as classification or semantic segmentation [
26,
27,
28]. These models are well-suited for such applications due to their ability to automatically learn hierarchical representations of low- to high-level features from raw images. Many studies leveraged deep learning methods to tackle the task of building damage assessment and achieved noteworthy developments [
15,
29,
30,
31]. For instance, Abdi et al. [
32] classified building patches into four levels of damage by employing CNNs on post-hurricane Unmanned Aerial Vehicle (UAV) images. Likewise, Zhang et al. [
33] used bi-temporal images acquired before and after disasters to develop an end-to-end procedure for solving a semantic segmentation problem with the aim of building damage assessment.
Using pre- and post-disaster images is an approved way for building damage assessment. The key question is how to exploit the required information from these images to ensure efficient performance. Inspired by the Siamese-network concepts introduced by Zhan et al. and Daudt et al. in [
17,
18], two-branch CNN architectures were used in building damage assessment using bi-temporal satellite images. Moreover, researchers utilized various types of feature fusion schemes to address this problem. For instance, Duarte et al. [
30] conducted experiments on multiple feature concatenation strategies for building façade damage detection. In another study, Mei et al. [
34] developed a dual-temporal aggregation module to capture global change patterns and performed a difference-aware fusion technique to assess building damages. Based on the powerful properties of attention-mechanism-enabled networks, which focus on more important regions of the images [
35], Shen et al. [
36] introduced a cross-directional attention module to explore the spatial and channel-wise correlations between pre- and post-disaster images.
Based on the literature, our proposed method was motivated by the two-branch CNN architecture for pre- and post-disaster feature fusion. The basic foundation of our model relied on the well-known UNet model [
37], widely used for segmentation tasks, which is an encoder-decoder-based network with skip-connections between the encoder and decoder paths for further enhancement of spatial features. Our introduced network utilized a two-stage framework, where in the first stage, a single UNet was used for building footprint localization, and in the second stage, localization features were used to guide the two-branch damage assessment network. The guidance borrowed from the first stage helped the second stage network learn more efficiently. Standard CNNs are designed to have convolutional kernels (i.e., receptive fields) of the same size. In contrast, changing the size of receptive fields, such as using atrous convolutions, has shown promising results in segmentation problems [
38]. Moreover, letting the network decide which size of the receptive field to use is a superior solution [
39]. Thus, we proposed a dynamic selection mechanism for our UNets, which allowed the network to adjust the receptive fields adaptively based on the weights obtained from the input information. By leveraging the proposed selective kernel module (SKM) in our UNets, the network was able to enhance the extracted features from pre- and post-disaster satellite images and focus on more important channels.
We implemented our experiments on the xBD dataset [
40], which is the largest dataset for building damage assessment at this time. Our experiments showed that the proposed strategy for building damage assessment yielded higher accuracies and outperformed other state-of-the-art models. Furthermore, in order to evaluate the transferability, generalization power, and robustness of our method, we utilized another set of data acquired from Bam city, Iran, during the 2003 earthquake. The main contributions of our study can be summarized as follows:
We proposed a two-stage UNet-based architecture for building localization and damage classification from pre- and post-disaster satellite images, and the performance of different backbones within our UNets was evaluated.
In order to improve the capability of our network to extract suitable features and enhance the performance of the above-mentioned two-stage framework, we introduced an SKM that adaptively adjusts the kernel sizes through our network’s feature extraction process. Adaptive receptive field selection within the SKM, in three steps of Split, Fuse, and Select, enhanced the quality of the extracted features.
To further regularize the learning process of our model and cope with the challenge of limited samples in different classes, heavy data augmentation, including CutOut [
41], was applied to the xBD images.
Moreover, to investigate the transferability power of our model, we used another set of data from a completely different region with different types of buildings to assess building damage after an earthquake.
Finally, we investigated the correlations between image acquisition attributes (e.g., Sun elevation, satellite-looking angle, and GSD) and the performance of the proposed model in both localizations and damage assessment stages per disaster type in detail.
The remainder of this paper is organized as follows. Related studies are first discussed in the “Related Works” section. Then, we introduce the datasets that we used for our model development in the “Datasets and Preparations” section. In “Methodology”, we introduce our proposed model architecture along with the evaluation metrics. “Experiments and results” provide the implementation details of our experiments and comprehensive results and comparisons that we assessed during our experiments. Finally, “Discussion” and “Conclusion” conclude the paper.
2. Related Works
This section discusses the methods that recently were used for building damage assessment using remote sensing satellite images. Due to the high impact of natural disasters on human lives, it has always been a hot topic to study various techniques to cope with the damages that occur to cities. Many researchers from two decades ago have started to use satellite images for the purpose of building damage assessment [
6,
20,
42]. In the meantime, researchers have developed more sophisticated methods based on machine learning techniques to automate the assessment process [
9,
25,
43]. As an example, Putri et al. [
25] tried to generate building damage assessment maps using textural and spectral features extracted from pre- and post-disaster Sentinel-1 and Sentinel-2 images. They fed the features into a Random Forest classifier for classification. Alatas et al. [
44] compared different morphological profiles with Haralick’s texture features to detect damaged buildings using a k-Nearest Neighbor classifier. Likewise, Janalipour et al. [
45] utilized an ANFIS-based decision-making system powered by geometrical features and bi-temporal satellite images combined with building vector maps to detect damaged buildings in the Bam earthquake.
Recently, deep learning techniques have been widely studied to provide more general solutions for the task of building damage assessment [
19,
36]. The ability of deep learning models to provide high-dimensional representations of images has enabled them to solve more sophisticated challenges. For instance, Zheng et al. utilized a deep object-based semantic change detection method to evaluate damages to buildings that occurred due to natural and man-made disasters [
19]. In [
46], Wu et al. proposed a variety of attention UNets to localize and classify building damages. By detecting changes in super-pixels, Qing et al. [
14] proposed a CNN-based network for damage assessment using UAV images. Moreover, in [
12], Deng et al. proposed a two-stage UNet supplemented with the Squeeze and Excitation (SE) module to improve the damage assessment results.
According to the usage of only post-disaster images [
11,
32,
47] or the pair of pre- and post-disaster images [
12,
34,
36], various methodologies have been proposed for building damage assessment. In [
29], Duarte et al. proposed various fusion strategies for building damage assessment from post-disaster satellite, aerial, or UAV images using CNNs. In [
15], Tilon et al. proposed an unsupervised method for building damage assessment. However, without any guidance from pre-disaster images or possible external sources of building footprint maps such as OpenStreetMap [
15], post-disaster images cannot provide precise building boundaries [
14]. In this regard, in 2013, Dong et al. [
9] showed that most of the studies tend to use pairs of pre- and post-disaster images to be able to locate the damaged building and evaluate the damage by detecting meaningful changes. Accordingly, Khodaverdizahraee et al. [
48] extracted building properties such as shape, geometry, shadow, texture, and color from pre- and post-disaster imagery and fed them into machine learning algorithms for improved building damage assessment. Likewise, Xu et al. [
49] compared different pre- and post-disaster feature fusion scenarios in CNN models for the Haiti earthquake.
From the architecture’s point of view in deep learning methodologies, various architectures from the computer vision community have been proposed for building damage assessment. Inspired by atrous spatial pyramid pooling networks, with dilated convolutions, Gupta et al. [
50] proposed a network (RescueNet) with multiple segmentation heads for simultaneous building detection and damage classification. Valentijn et al. [
51] studied the effective parameters of damage assessment predictions by using simple, fully connected CNNs. Compared with other architectures, UNets, with encoder-decoder paths that were improved by adding skip-connections to aggregate low-level and high-level features, have been widely used for the task of building damage assessment [
12,
36,
46].
In order to improve the performance of baseline semantic segmentation architectures, researchers have used various strategies and extensions in their networks. For instance, Bai et al. [
52] used a lightweight approach based on knowledge distillation to reduce the dependence on computing resources and increase the speed of damage assessment in emergency situations. In contrast, in order to achieve more accurate results with fewer labels, Qiao et al. [
53] implemented a weakly supervised technique that could improve the quality of activation maps and boost model performance. Attention techniques [
34,
53], which try to emphasize important regions of the images, have been widely used in computer vision tasks. Mei et al. [
34] used a difference-aware attention strategy to predict more accurate localization and classification results after disasters. For a superior combination of features in spatial and channel directions, Shen et al. [
36] proposed BDANet with a cross-directional attention mechanism and obtained enhanced damage assessment maps. Attention-based mechanisms have shown promising results in both computer vision and building damage assessment.
From the development point of view, appropriate and carefully annotated datasets play a major role in deep learning models. Deep learning models are data-hungry, and the issue is exacerbated by the complexity of the problem [
54]. Building damage assessment is a complicated problem and, thus, requires large amounts of ground truth data for model development. Preparing annotated remote sensing images for such tasks is time-consuming and requires huge manual work. Although the number of benchmark datasets is growing in the remote sensing community, high-quality datasets that are suitable for building damage classification are still rare [
55]. The xBD dataset [
56] has played a game-changing role in building damage assessment during the past five years. However, it still has some challenges, such as highly biased classes towards no-damage buildings. Furthermore, complexities of minor-damage and major-damage classes, besides similarities between minor-damage and no-damage classes, lead to moderate misclassification [
57]. Preprocessing techniques such as data augmentation have been widely utilized to increase the size of data and robustness of the model [
58]. They can also act like regularization techniques that feed models with more challenging scenarios [
58,
59]. Advanced augmentation methods, such as the Cutout, randomly mask out square regions of input images to improve the feature representation ability of the model [
41].
Currently, most of the deep learning architectures for building damage assessment follow the concepts from change detection problems. The main framework seems to be the two-stage model with separate localization and classification streams. Moreover, obtaining accurate results for challenging classes is still an open problem. A two-stage UNet-based network is proposed and enhanced with SKM to improve feature representations and deal with previous limitations. Accordingly, augmentation techniques were applied to cope with the problem of imbalanced datasets to alleviate the complexities of damage classification.
3. Datasets and Preparations
Training and validation of a deep semantic segmentation model requires large amounts of accurately annotated ground truth images. Usually, in the case of natural disasters, which often occur suddenly, appropriate ground truth information is unavailable after the disaster, at least for a few weeks, and preparing a dataset immediately after the disaster is time-consuming. However, benchmark datasets, which are prepared before disaster situations, can be helpful in both developing algorithms and comparing the results with previous studies. We used two datasets in this study. The xBD benchmark dataset was used as the first one to develop, train, analyze, and evaluate the proposed deep learning model and compare it with other state-of-the-art models. The second one was the Bam city earthquake dataset, which was utilized to study the transferability of the proposed model. In both cases, pre- and post-disaster images were co-registered and preprocessed by data providers.
3.1. xBD Dataset
xBD [
40,
56] is the largest optical satellite imagery benchmark dataset for building segmentation and damage assessment in the remote sensing community [
55]. The xBD dataset offers very high-resolution images (1.2 m to 2.4 m) acquired before and after different natural disasters, such as earthquakes, wildfires, tsunamis, and floods. As one of the largest datasets in remote sensing, it includes 22,068 RGB images (11,034 pairs) with a size of 1024 × 1024 × 3 pixels acquired from different high-resolution optical satellites, e.g., Worldview-2 or GeoEye, in various off-nadir (5° to 40°) and sun elevation (30° to 80°) angles, causing the dataset to be more complicated in terms of spatial resolution or shadow length. xBD contains 850,736 building polygons with different areas and in multiple locations around the world, in various types of textures such as low/high density urban or rural regions. The georeferencing information and damage class of each building, along with the disaster type and sensor parameters, are included in a metadata file for each image. Gupta et al. [
40] provided the images in four groups: Train, Test, Holdout, and Tier3. The first three groups were specifically considered to be used for training, testing, and validation purposes, respectively, while the fourth group was released later and was designed to be merged with the Train set to increase the diversity of the dataset. Using the same set of images of a benchmark dataset for specific steps allows researchers to be able to fairly compare their methods.
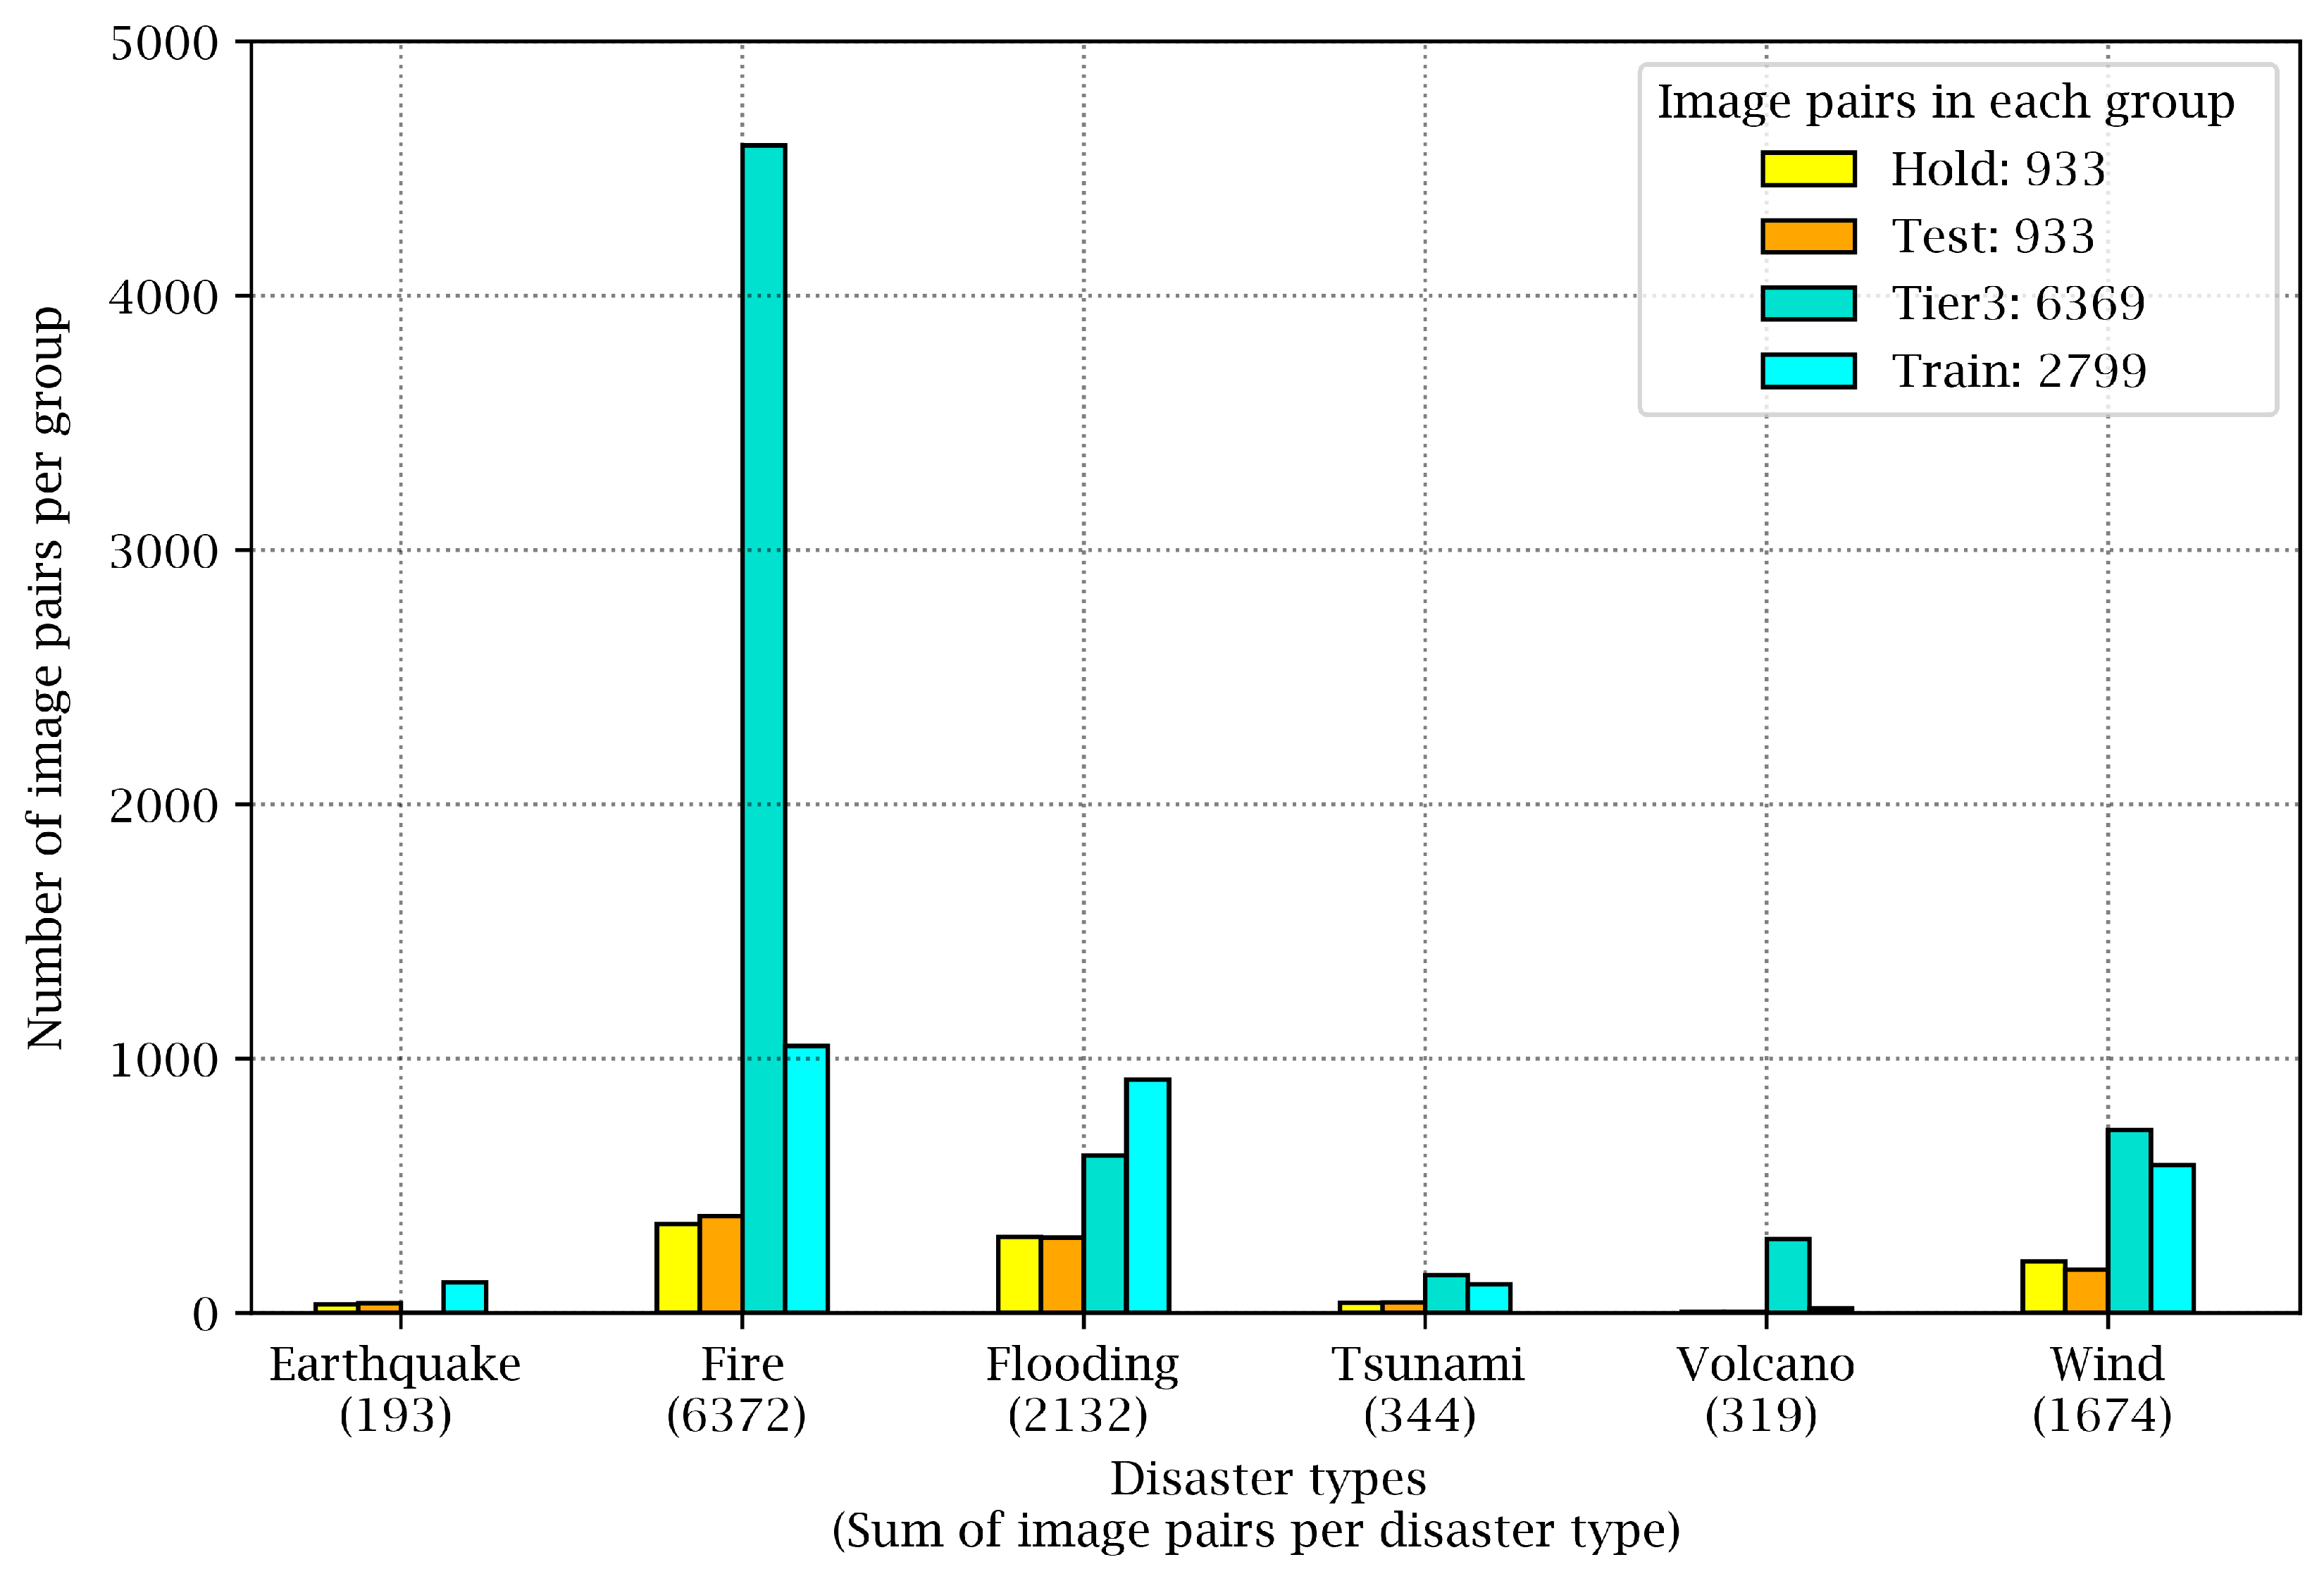
Figure 1 shows how the image pairs are distributed in these four groups. For instance, images from wildfire events can be found mainly in the Tier3 group. Furthermore,
Figure 1 reveals that although the xBD dataset covers six types of disasters, it is highly unbalanced, such that fires, floods, and wind events have many more samples in the dataset compared to volcanic eruptions, tsunamis, or earthquakes.
xBD is a dataset with four classes of building damage, which are (1) no-damage, (2) minor-damage, (3) major-damage, and (4) destroyed; but it is biased towards no-damage buildings, such that the number of no-damage buildings is approximately five times the number of other classes.
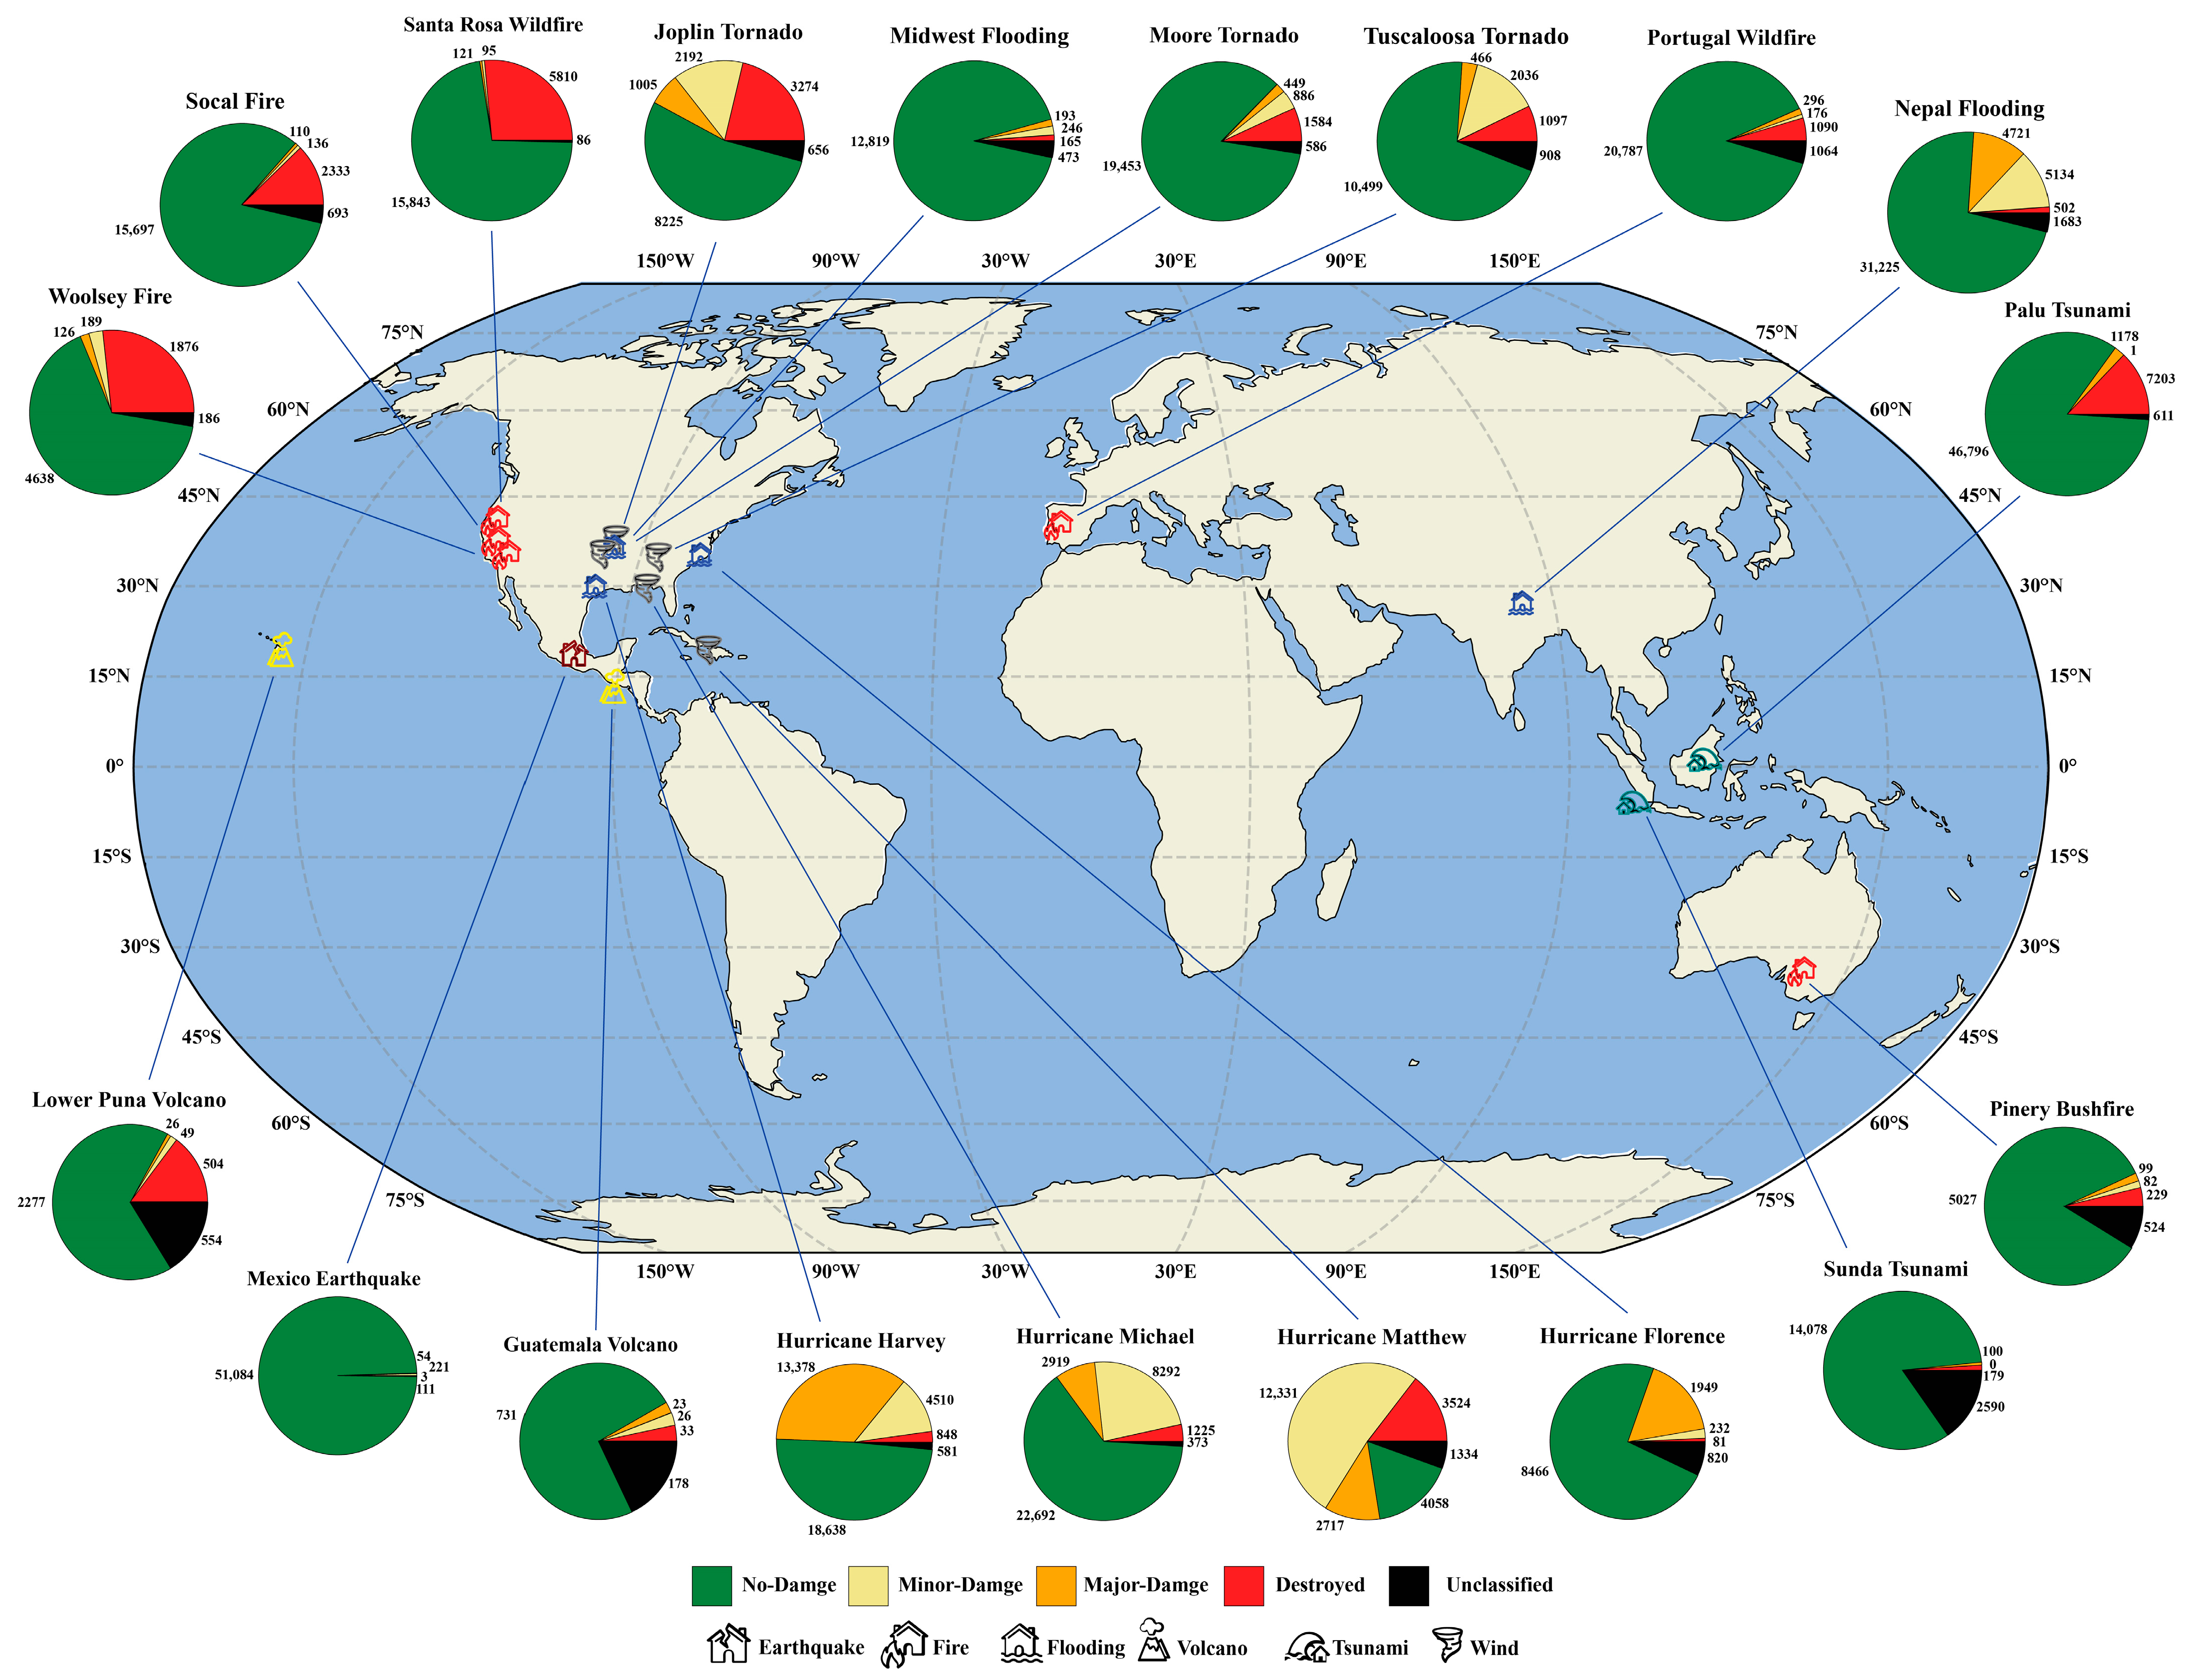
Figure 2 visualizes the geographical distribution and type of disasters present in xBD and their corresponding number of buildings in each category of damage. It is obvious that most of the pie charts are dominated by green, i.e., the no-damage class, and other classes are in the minority. Even more, there are some disasters, such as the Mexico earthquake, where almost all of the buildings are in the no-damage category; only 3 out of 51,500 buildings are categorized as destroyed. On the other hand, from the geographical distribution point of view, most of the xBD’s disaster events are located across the United States, and only a few events are in other countries, such as Nepal, Australia, Indonesia, and Portugal.
3.2. Bam Dataset
On 26 December 2003, at 5:26 a.m. local time, a 6.5 magnitude earthquake, with its epicenter very close to the city and to the Earth’s surface, hit Bam, Kerman, Iran. Approximately 27,000 deaths were recorded, 30,000 people were injured, and 75,000 people were left homeless. In terms of human loss, the quake was the worst in Iranian history [
60,
61]. About three months before the disaster, on September 30th, Quickbird acquired an image from Bam with an off-nadir angle of 10 degrees. The post-disaster image was acquired eight days after the earthquake, on 3 January 2004, with an off-nadir angle of 24 degrees. The spatial resolution of the images was 2.4 m, which was then increased to 0.6 m through a pan-sharpening step. Building damages were mainly concentrated in the eastern parts of the city [
42], while the western section of the city was covered mainly by vegetation and fewer buildings. Buildings were mostly built with mud bricks, and the overall arrangement of buildings in Bam was regular with low-rise, flat-roof buildings, and there was no separation between most of the houses. Pre- and post-disaster satellite images of Bam city were used to verify the robustness and transferability of the proposed model in this study.
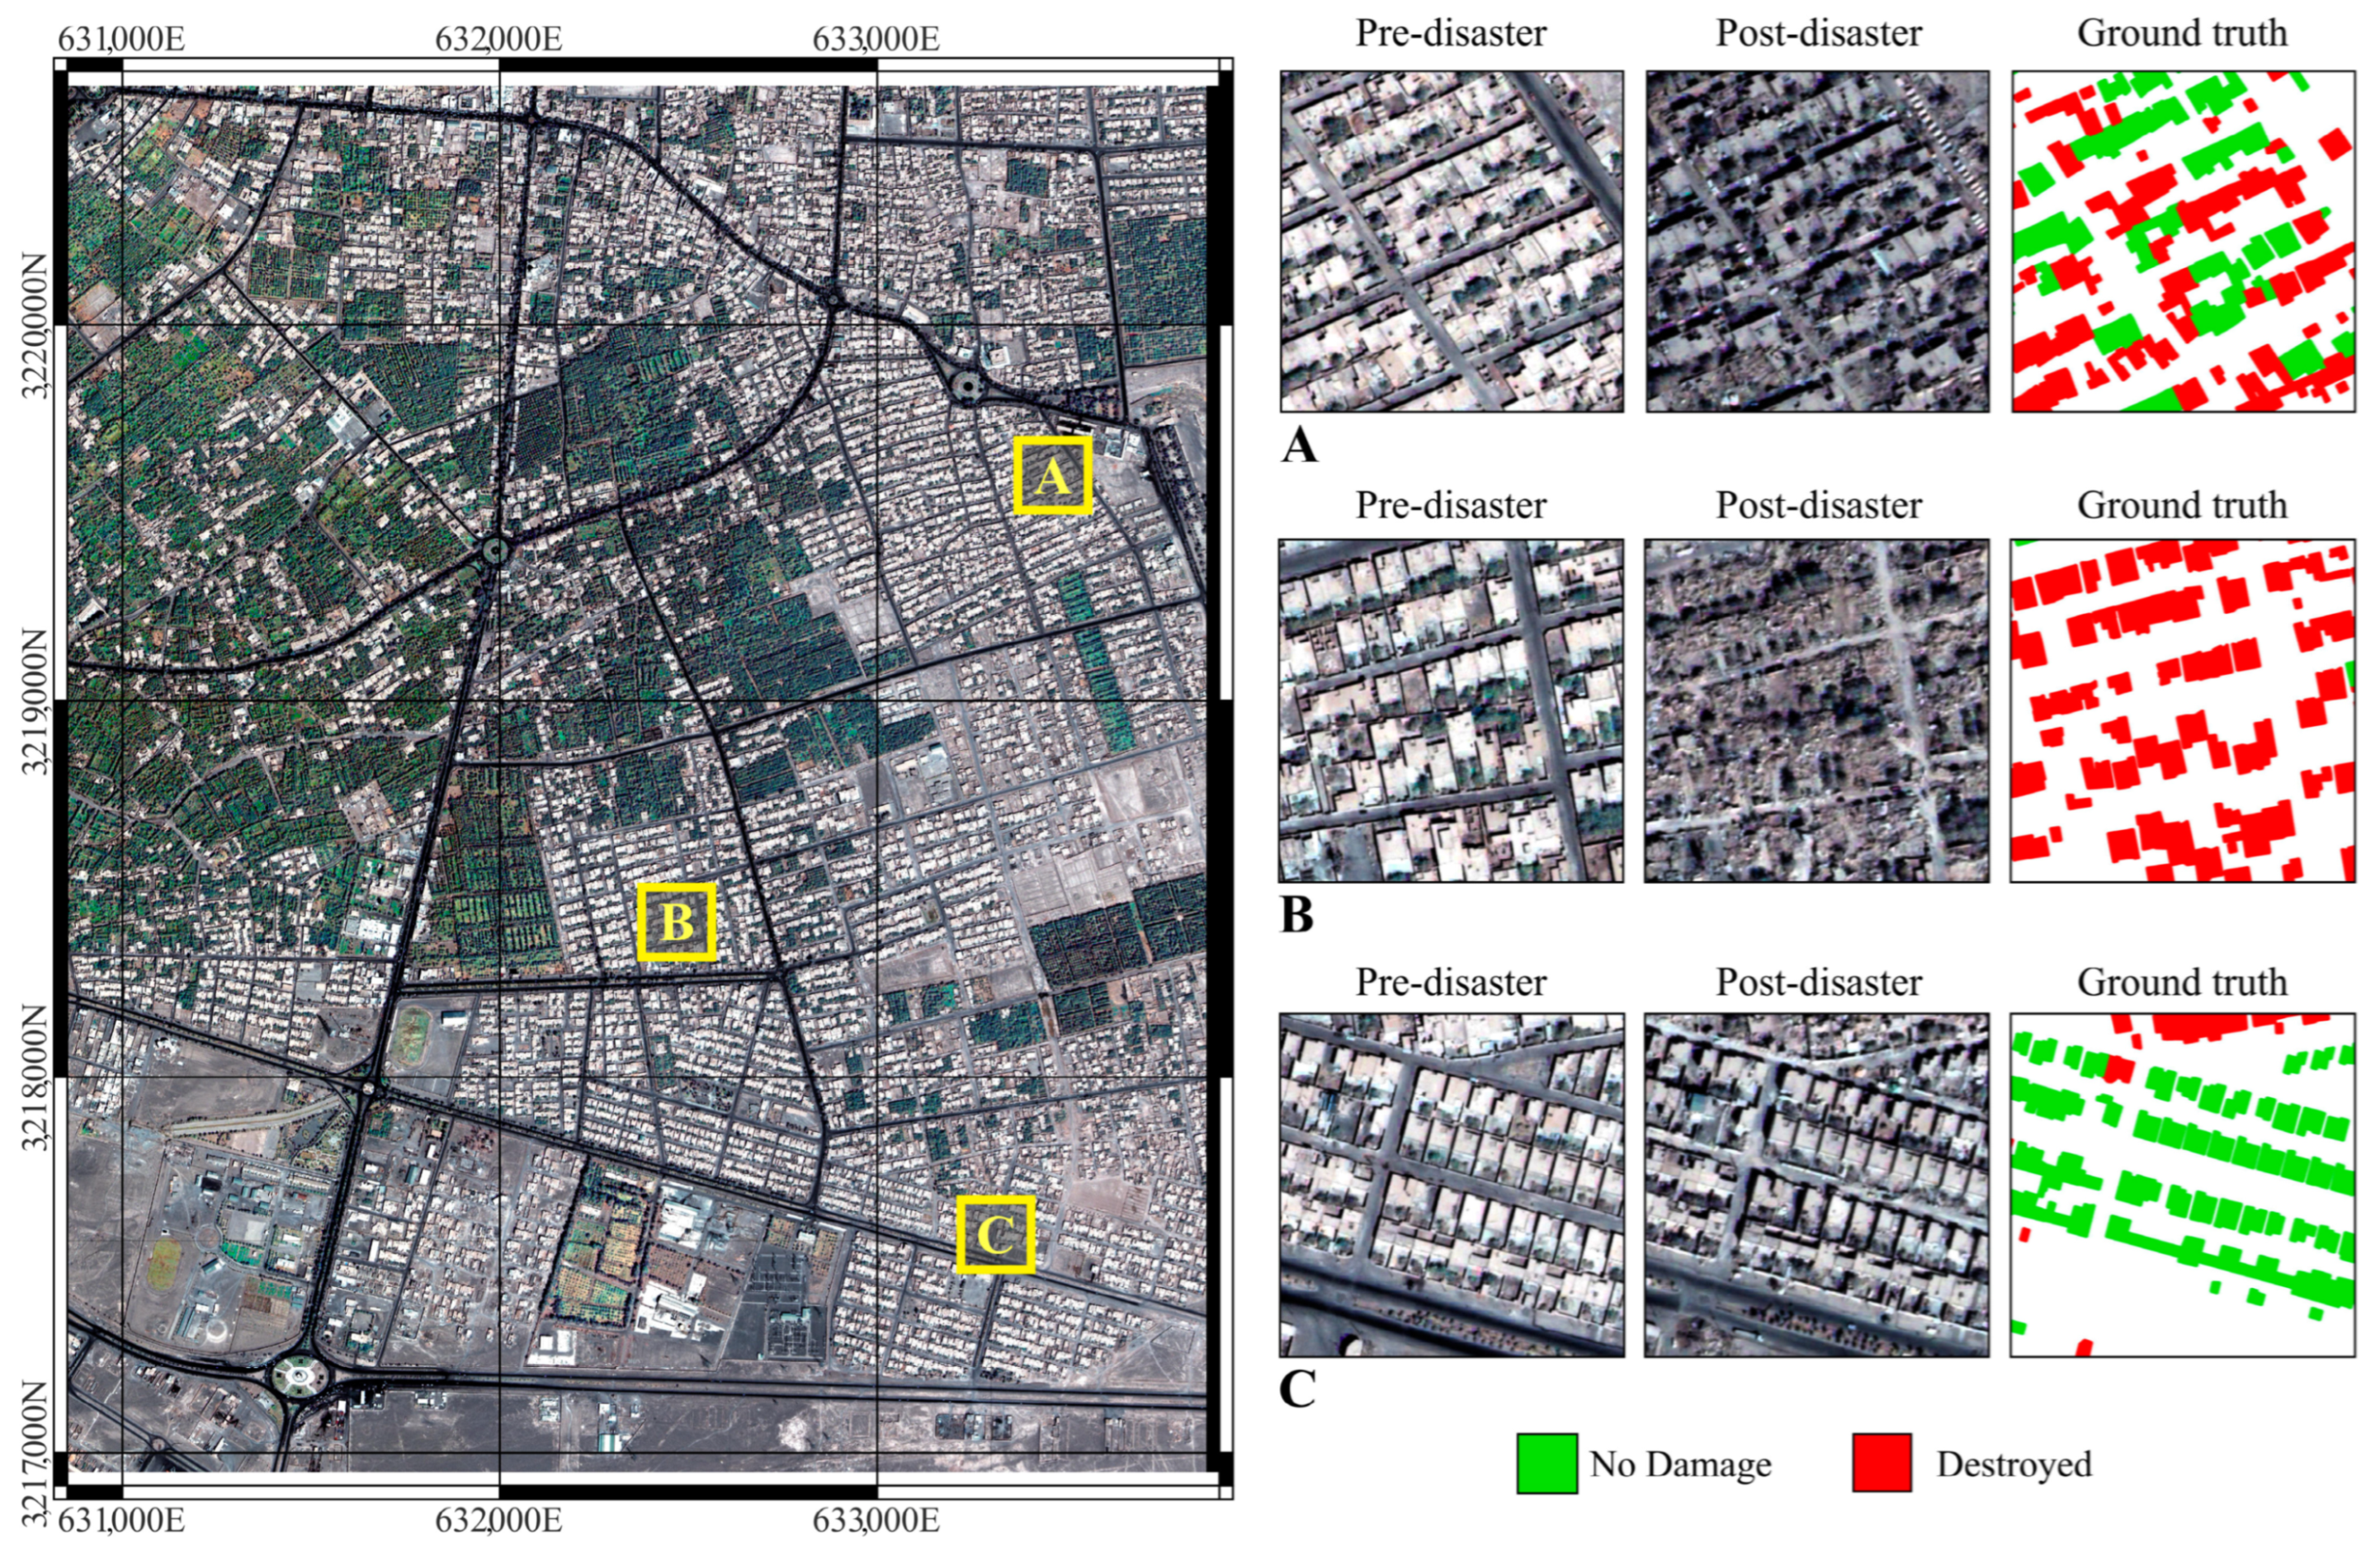
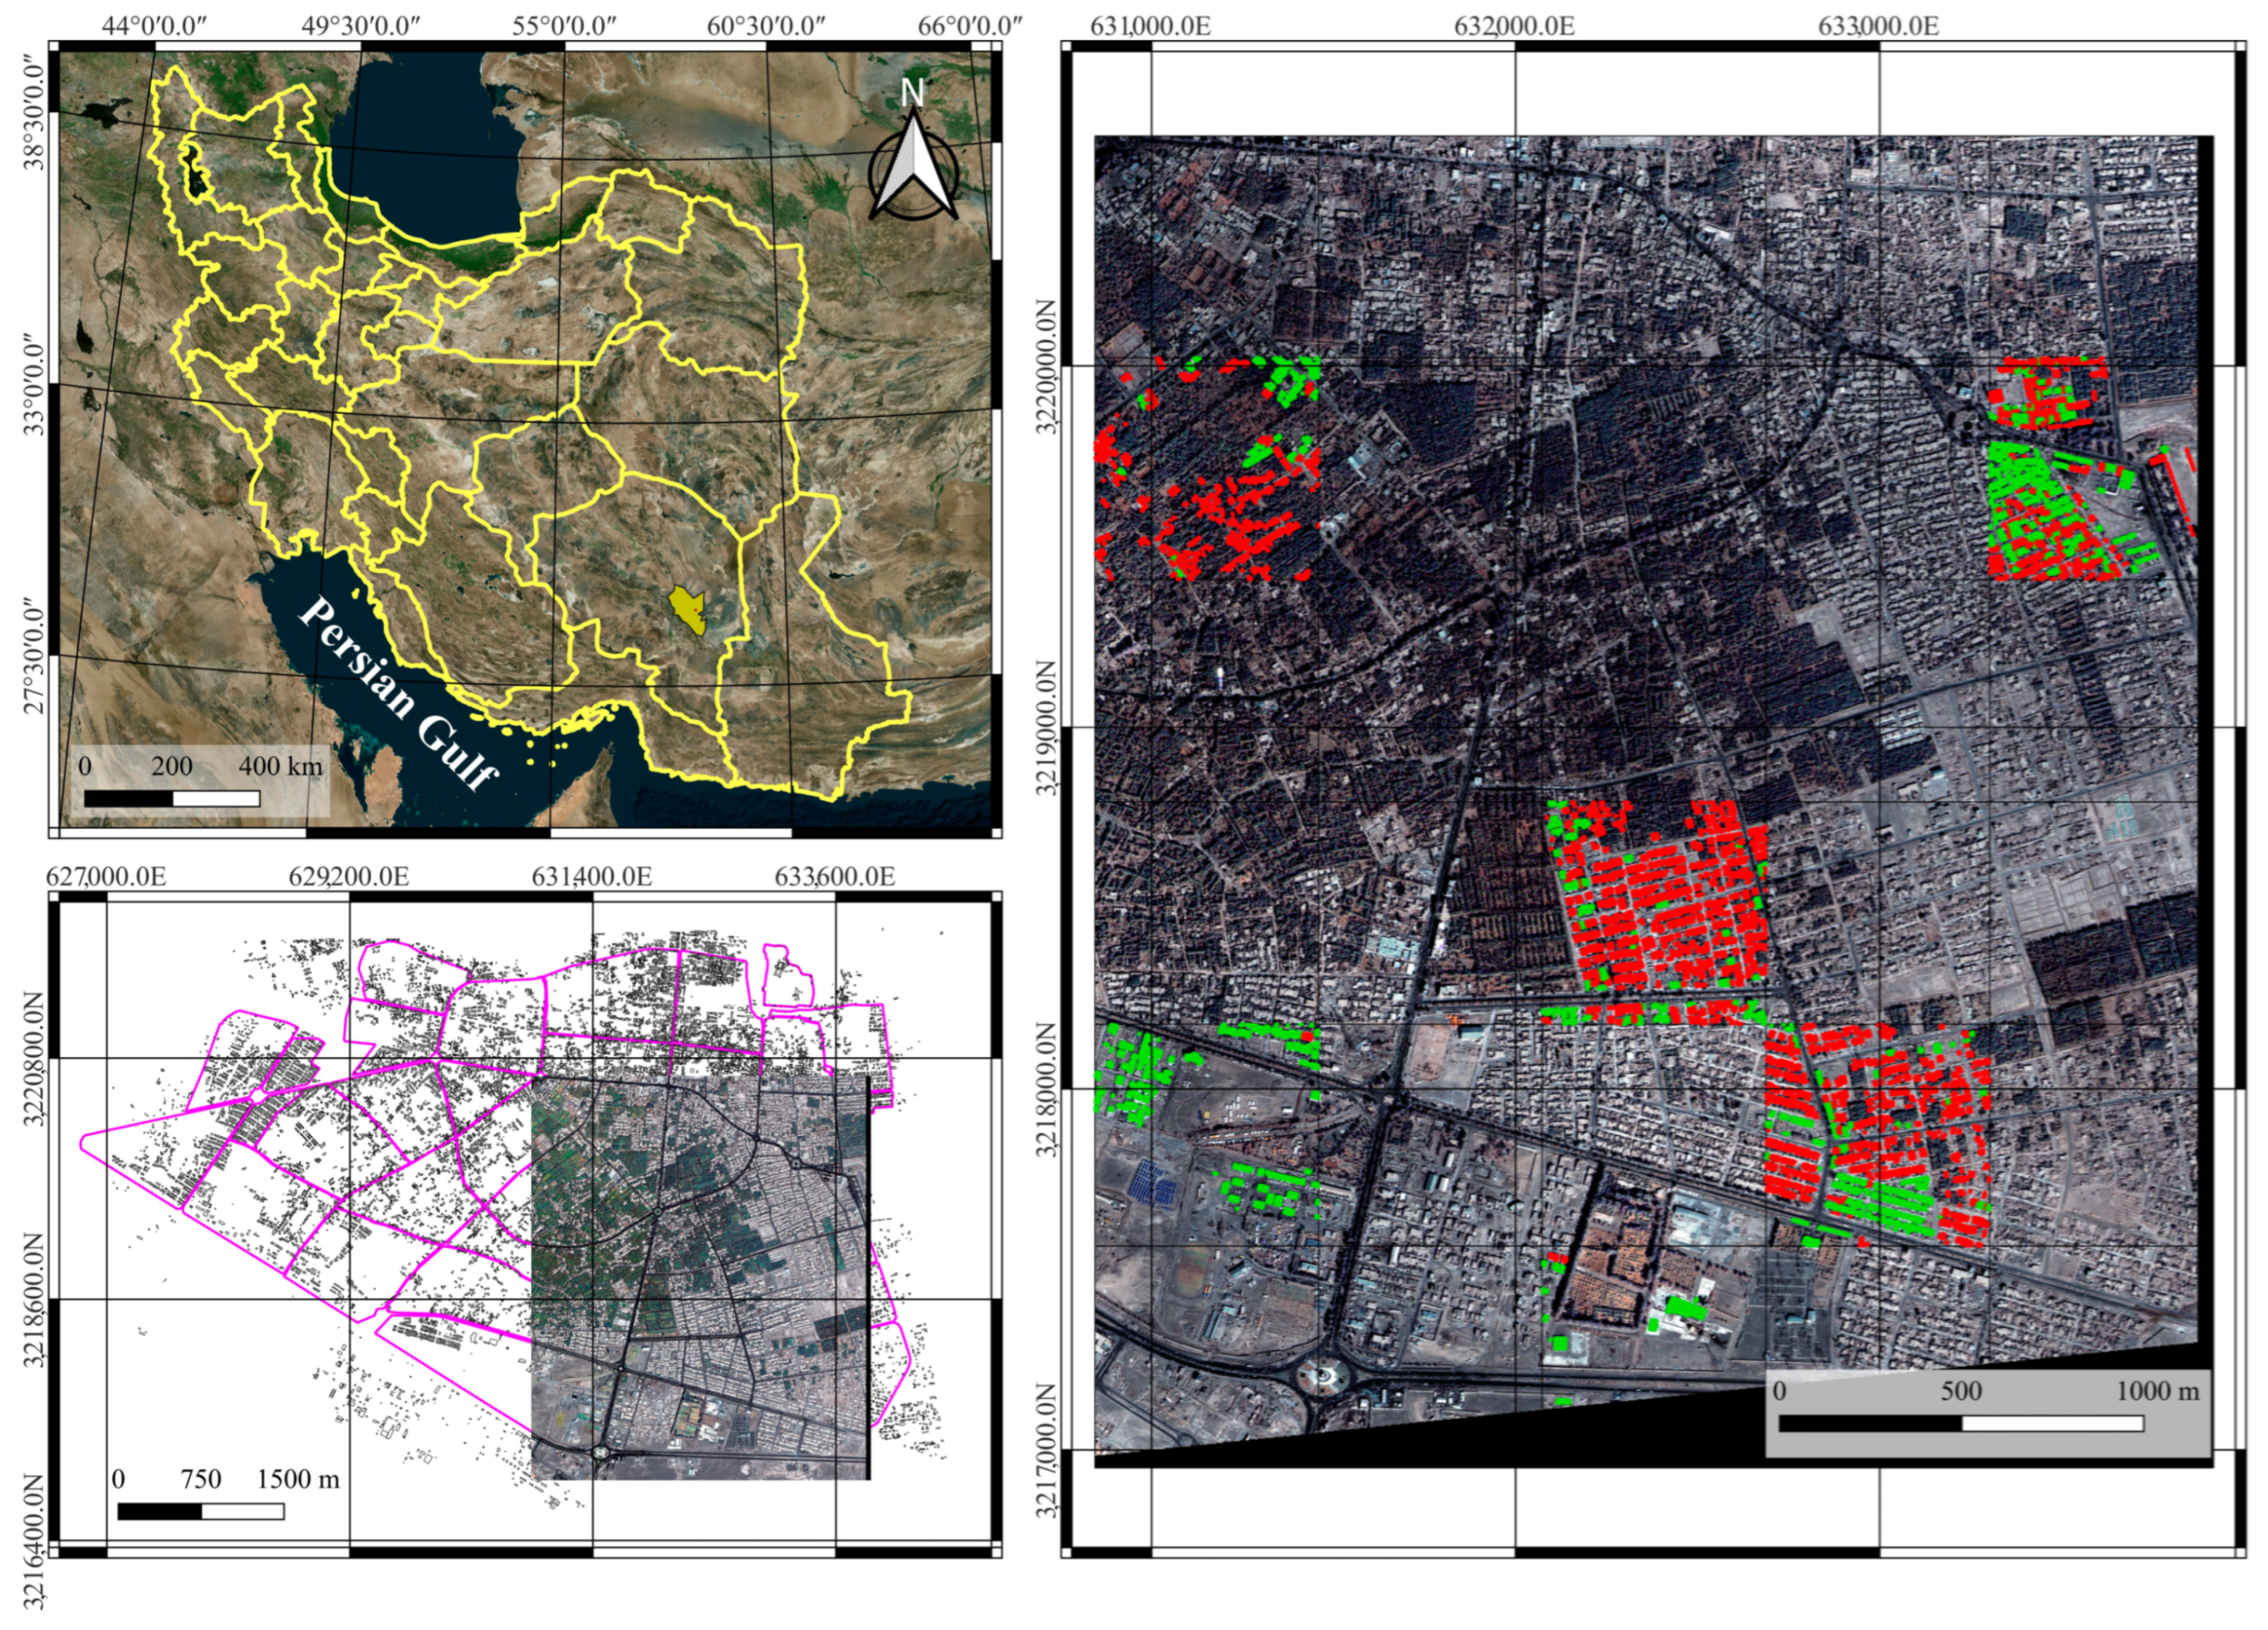
Figure 3 shows the geographical location of Bam in Kerman, Iran, and the municipality regions along with our study area.
In total, 22,318 building polygons existed in the city boundary, while our study area, which was captured from the densest portion of the city, contained 10,360 buildings. High-quality ground truth annotations were generated with the help of experts who visually interpreted high-resolution pre- and post-disaster images of Bam. Even in high-resolution images, it was difficult to understand the details of the damages from close-nadir-looking satellite images [
29,
47]. Therefore, based on the previous studies [
48,
62,
63,
64,
65], and since the visual interpretation of pre- and post-disaster images was complicated for multi-class labeling, we only considered two classes of damage for further steps. Additionally, the building vector map was employed to locate the buildings and decrease human error during interpretation. After careful labeling, 4997 and 2299 buildings were classified as no-damage and destroyed, respectively. The other 3064 buildings were left unclassified. Since the pre- and post-disaster images were acquired with different viewing angles and at different times of the year, resulting in different vegetation cover and unequal lighting conditions (different building shadow lengths and brightness) over the region, the manual labeling of the buildings was a complicated task. Furthermore, no other ground truth information except the building vector map was available for the study area.
Figure 4 shows the satellite image acquired before the earthquake and three zoomed regions with their pre-/post-disaster images, along with ground truth data.
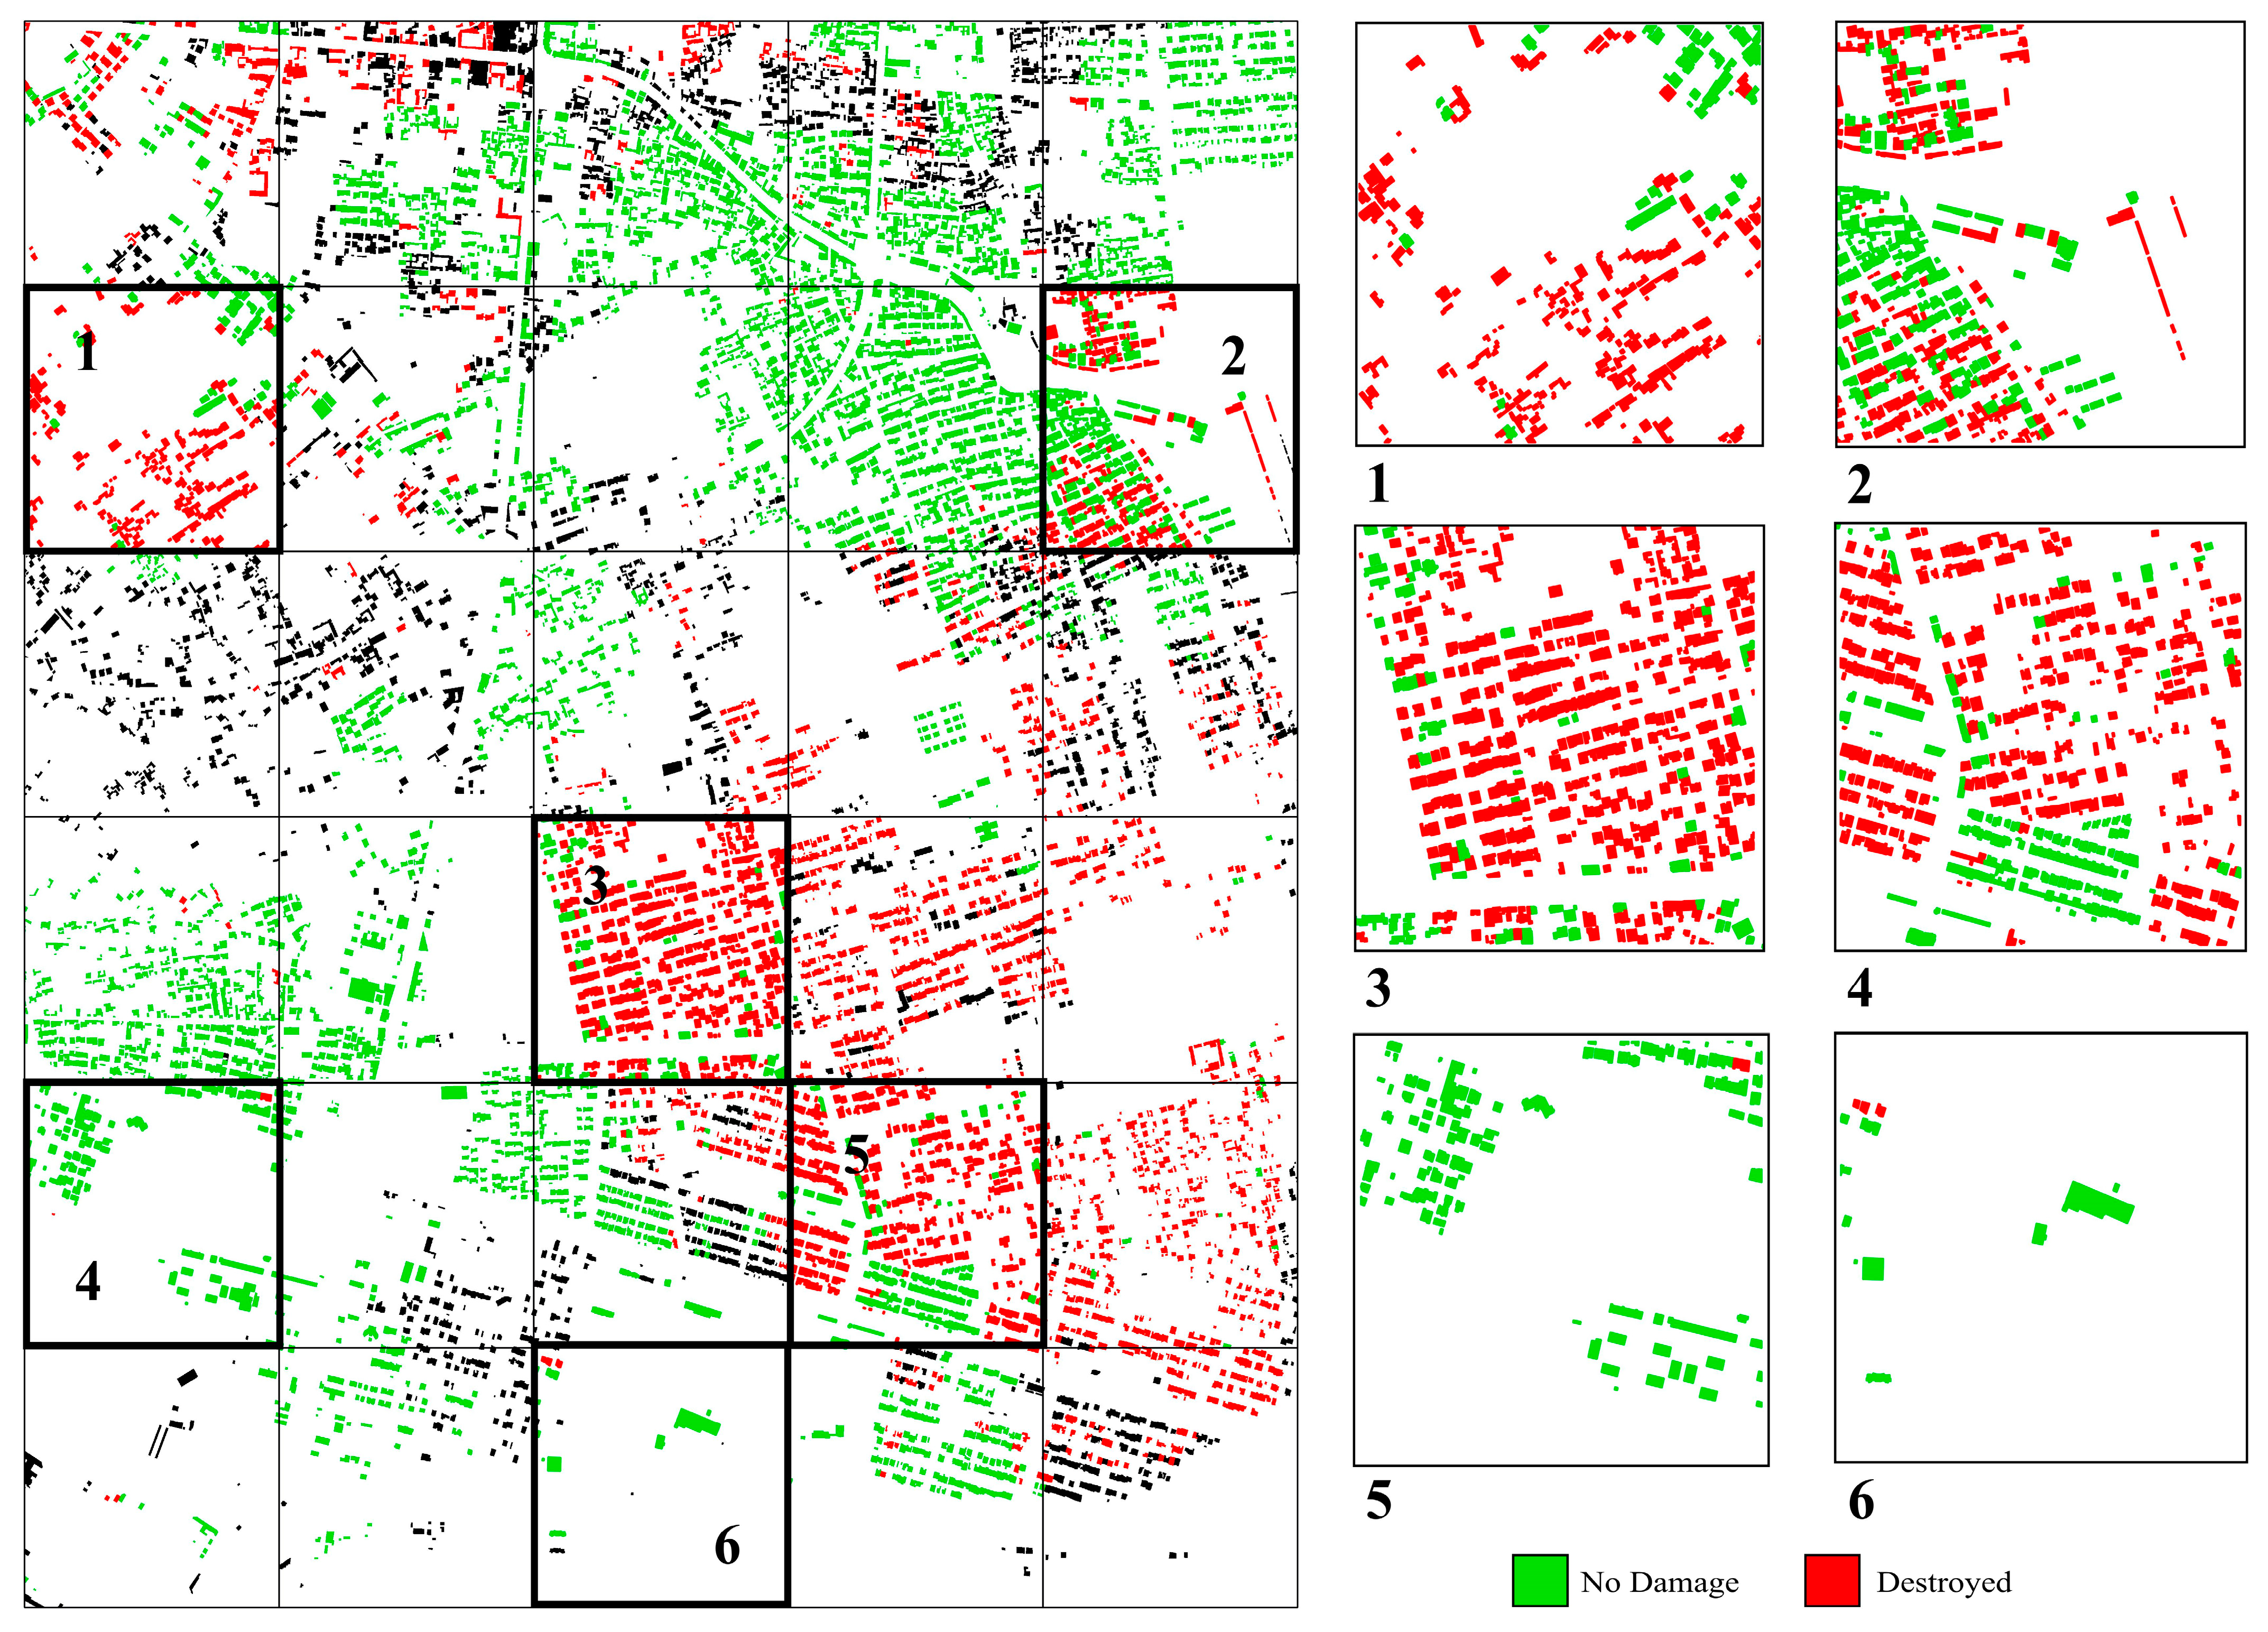
We tiled the satellite image of Bam into 36 patches of 1024 × 1024 × 3 pixels to be similar to the xBD dataset. In the ground truth generation procedure, the highest precision and effort were put into annotating buildings reliably and with suitable distribution over the entire study area.
Figure 5 shows the distribution of labeled buildings and the corresponding zoom plots of 6 sample regions. As can be seen, most of the damaged buildings are in the eastern part of the city. Labeled buildings show three colors: red, green, and black. Red and green are considered to be damaged and no-damage, respectively, and black are unlabeled buildings.
3.3. Dataset Preparation
The semantic segmentation of damaged buildings from satellite images is a complicated task due to the unbalanced nature of the xBD dataset. Most of the image area is considered to be background pixels, and only a small portion is covered by buildings. From the total area covered by building regions, the majority of the buildings are categorized as no-damage class, and only a small portion of buildings are assigned to other categories of damage classes. Moreover, cloud occlusions, sun elevation and illumination changes, and different satellite viewing angles make the assessment process more challenging. Thus, in order to boost the performance of the models, add more regularizations to the model, and reduce the risk of overfitting, researchers usually utilize a data augmentation step in every round of the training procedure [
58]. Augmentation tries to expand the size of the training dataset or increase its diversity by applying simple and random mathematical, geometrical, or image processing operations on the images. The randomly augmented images could be stored on the disk drive or could be used on the fly during the training procedure. We implemented the second way, in which some probabilities were defined, and the images were augmented based on those probabilities, while they were inserted into the model. The implemented augmentations consisted of random cropping (
p = 1, which means that this augmentation was applied on all of the images), horizontal and vertical flipping (
p = 0.5, i.e., only half of the images, 50%, were treated by this operation), rotations (
p = 0.5) and transposes (
p = 0.5), brightness and contrast manipulations (
p = 0.2), and blurring operations (
p = 0.7). Furthermore, in order to apply more regularization to the models, an image Cutout technique (
p = 0.6) was added, which randomly masked out square regions from the input images to improve the robustness and overall performance of the network [
41].
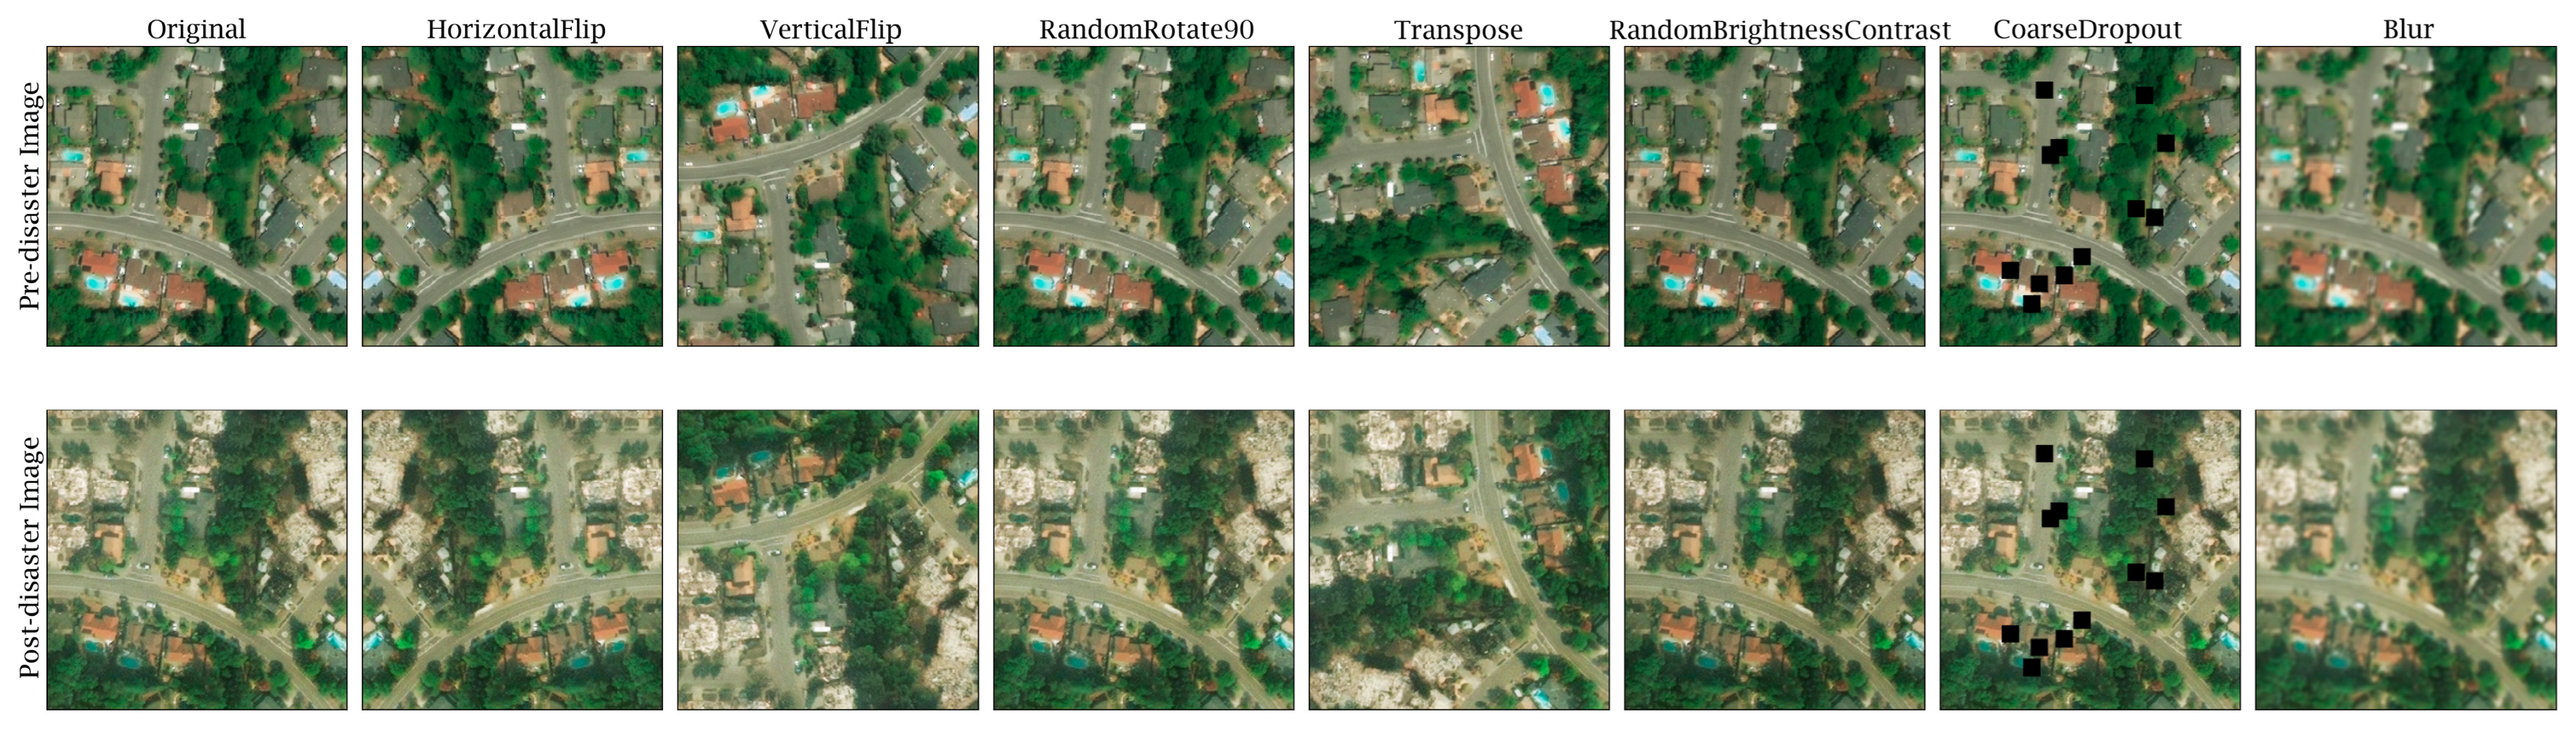
Figure 6 visualizes these operations performed on a single sample image. On the left, the original input image is shown, and the outputs of the augmentation process are illustrated in other columns.
It is worth mentioning that our augmentation process did not produce new images to be stored on the disk drive. In particular, every time an image was fed into the network, a random number was generated, and if the random number was within the limits of the specific thresholds, the augmentations were applied; otherwise, the image would be fed into the network without any changes. This augmentation technique was performed randomly, and thus, the dataset imbalance was not taken into account.
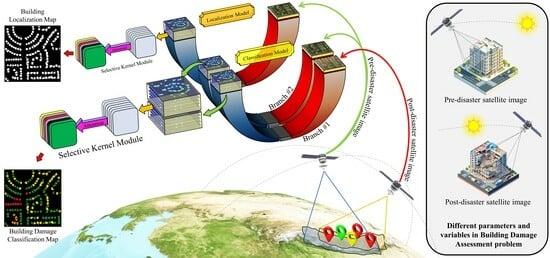
4. Methodology
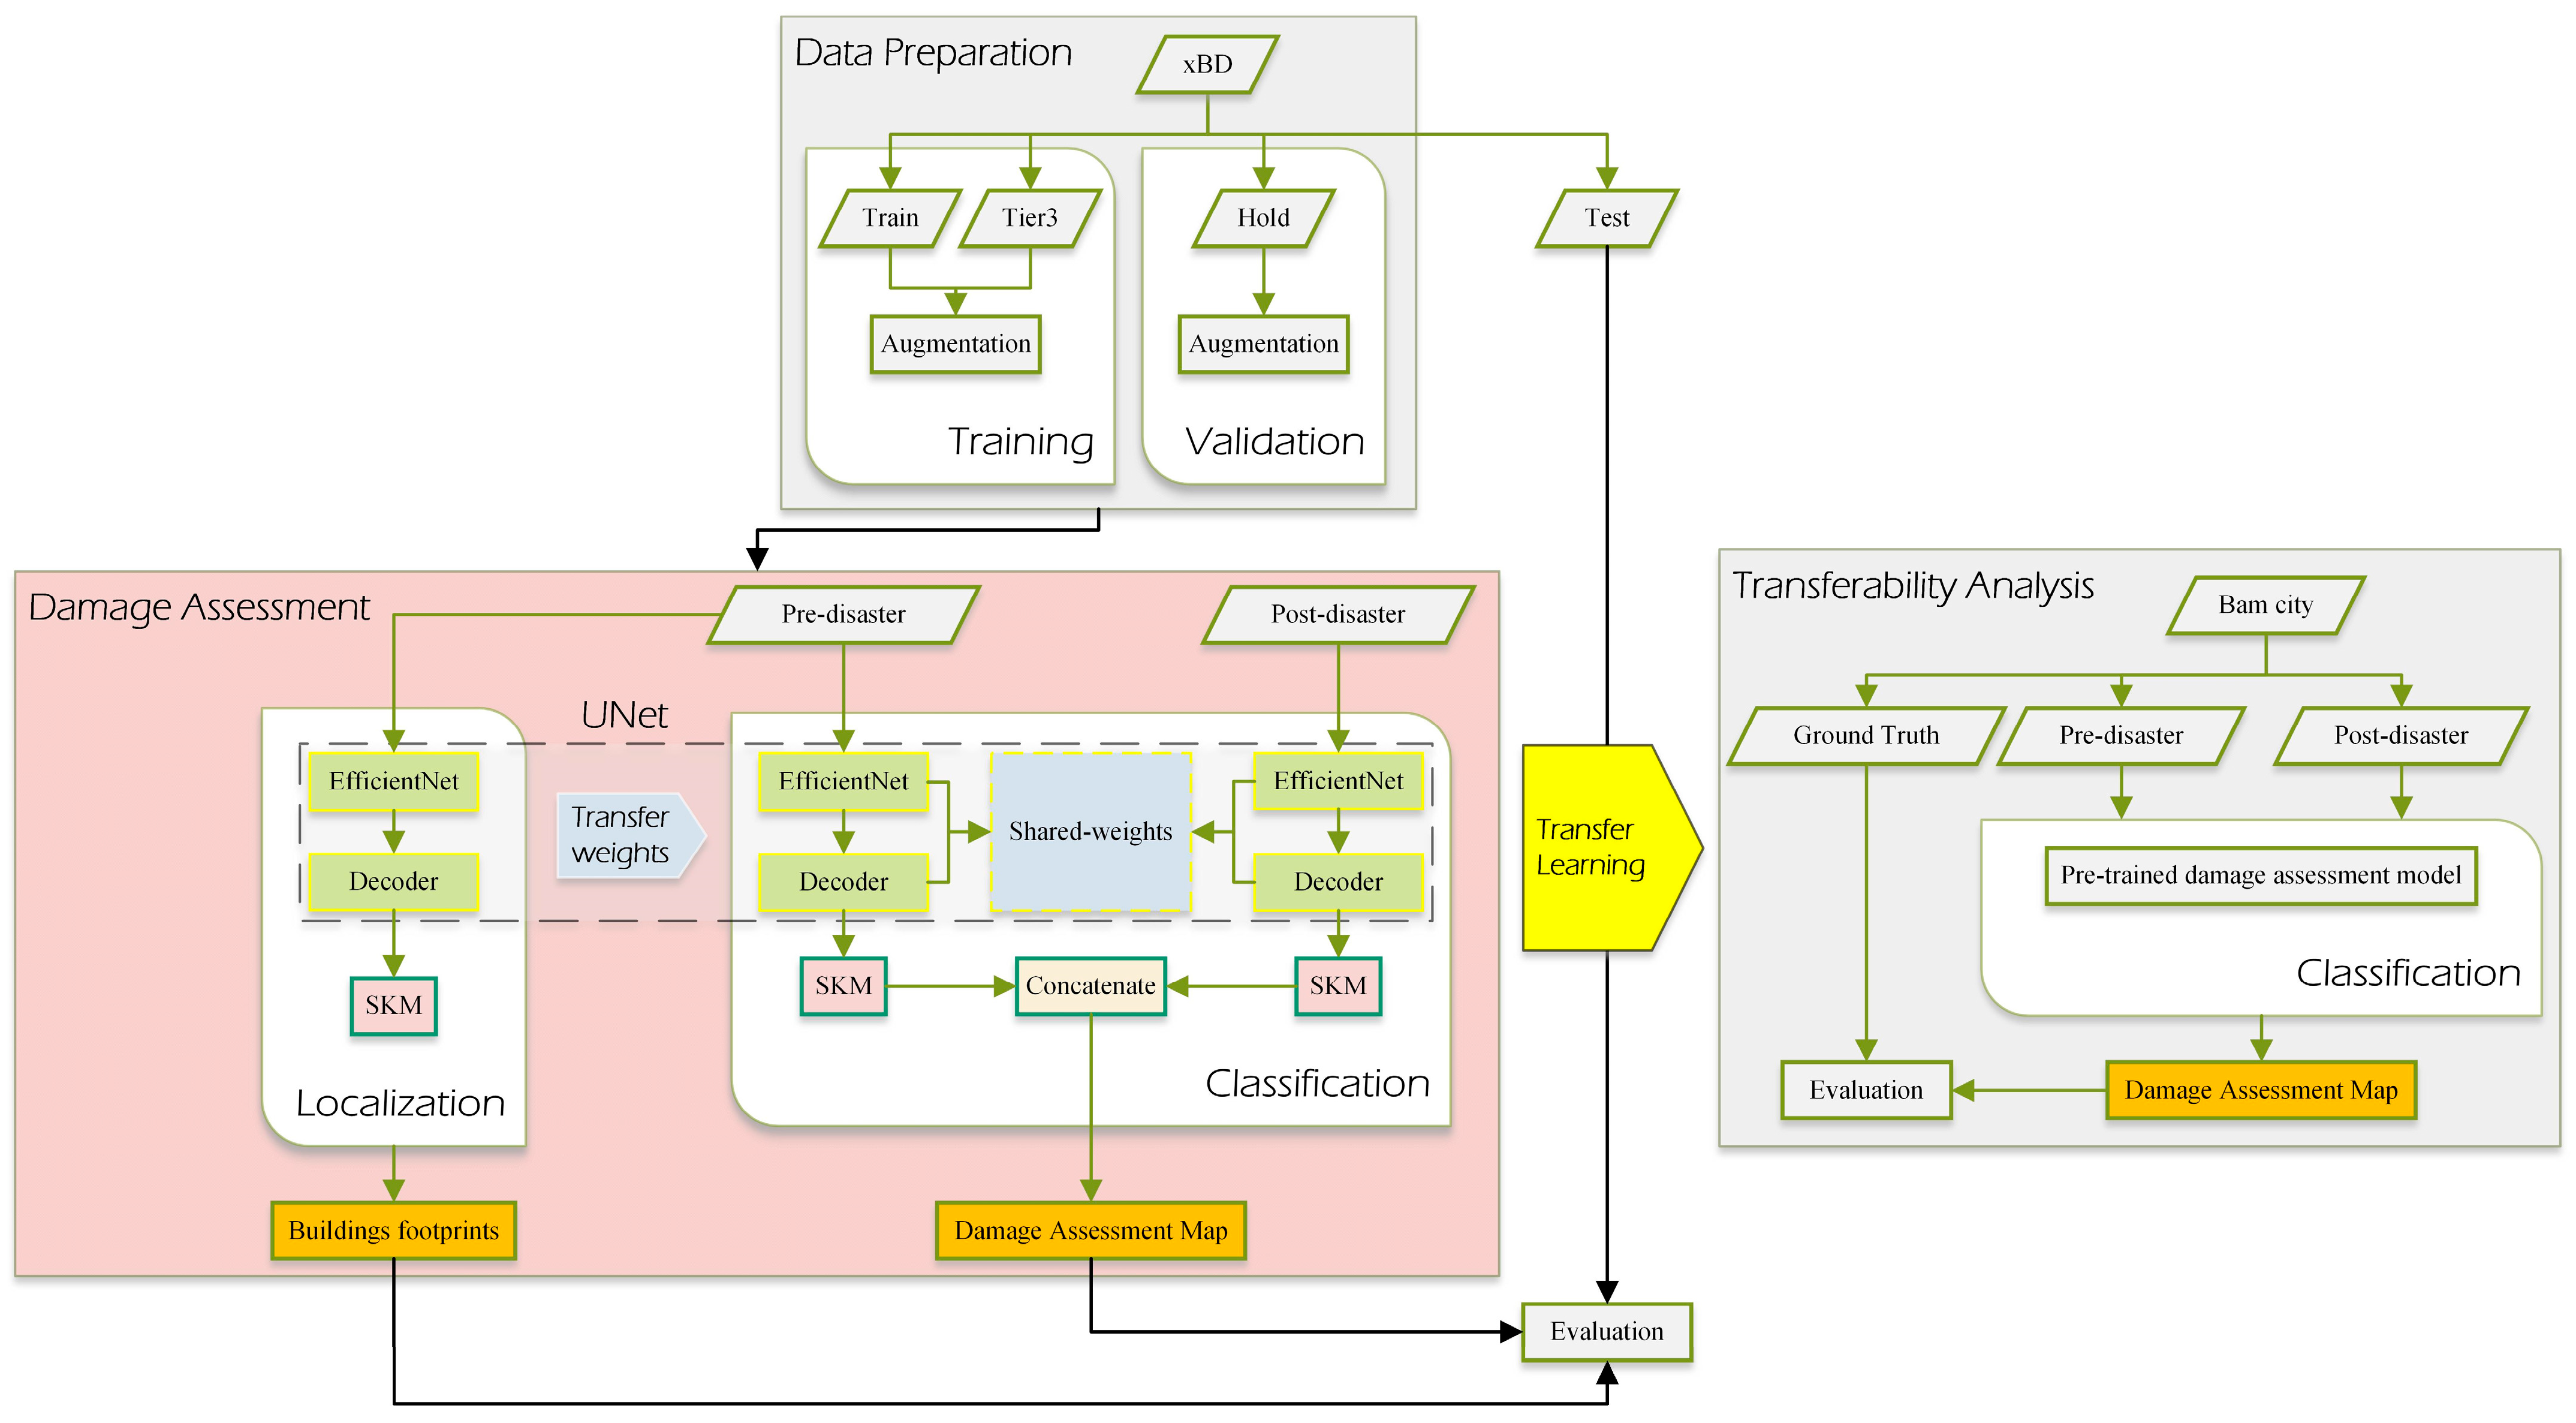
Figure 7 illustrates the overall and complete workflow of our study. It consists of multiple sections which are summarized as:
Data Preparation: In the first part of the process, the Train, Tier3, and Hold groups of the xBD dataset which were used for training and validation steps, respectively, were augmented. The Test group was directly used for validation without any augmentation.
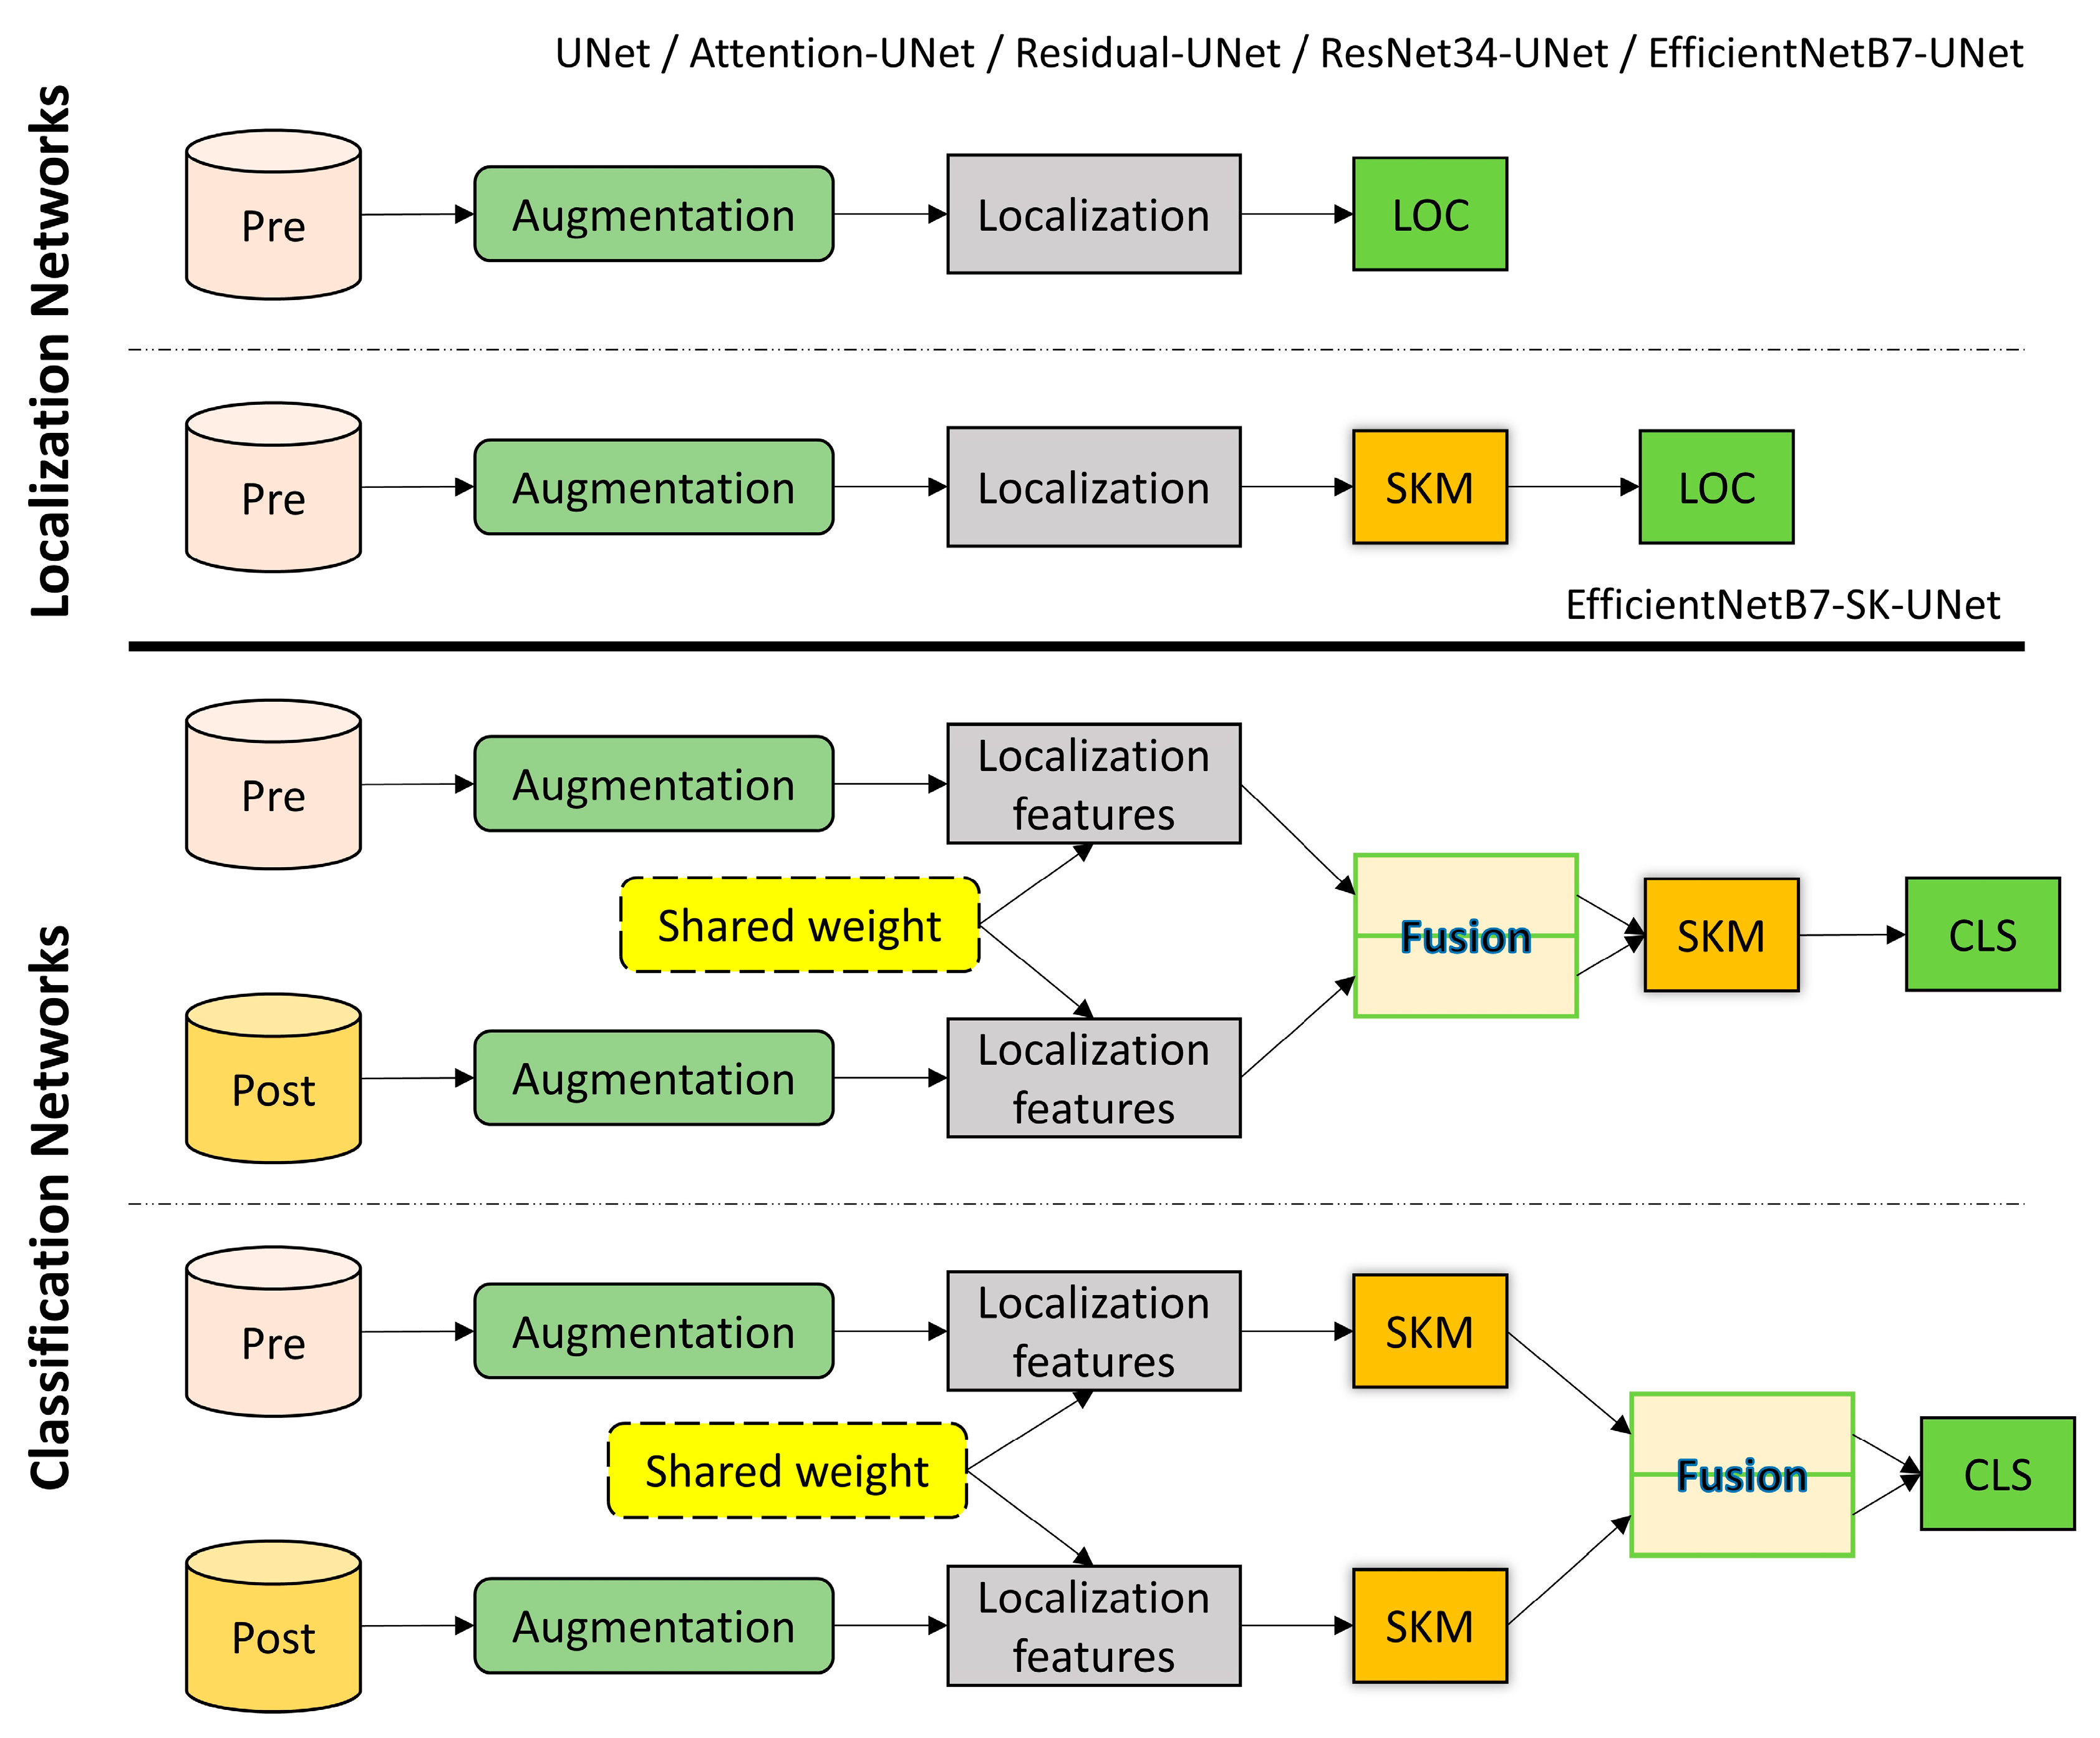
Damage Assessment: The second part included two sub-sections, the Localization and Classification models. UNet was used as the base architecture in both models. The weights of the trained Localization model were transferred to the Classification models. The outputs of this section were used for evaluating the performance of our proposed model.
Transferability Analysis: In order to further study the generalization power and robustness of our proposed models, the trained models were used on another new dataset, i.e., Bam city, and the damage assessment maps were compared with the corresponding ground truth.
Figure 8 and
Figure 9 present the overall architecture of the proposed deep learning models. Our methodology for overcoming the building damage assessment task consisted of two major stages: (1) building segmentation in the first stage (Localization) and (2) per building damage assessment in the second stage (Classification or Damage Assessment). In both stages, the UNet model was the main architecture that handled the segmentation task. For the building localization stage, a single branch UNet, supplemented with only the pre-disaster images, was utilized to produce building segmentation masks (see
Figure 8). After building footprint localization, pre- and post-disaster images were fed into parallel UNets of a dual-branch model in the second stage, as illustrated in
Figure 9. The extracted deep features from both branches were concatenated with each other to enter the segmentation head of the model, which handled the final multi-class segmentation task. In order to further improve the capabilities of the networks and enhance their performance, various strategies have been implemented. For the first time, we introduced the Selective Kernel Module (SKM) into UNet architecture for the task of localization and classification of building damages after natural disasters. The SKM introduced an adaptive receptive field learning procedure, which improved the quality of extracted features. The details of the proposed framework and components are described in the following sub-sections.
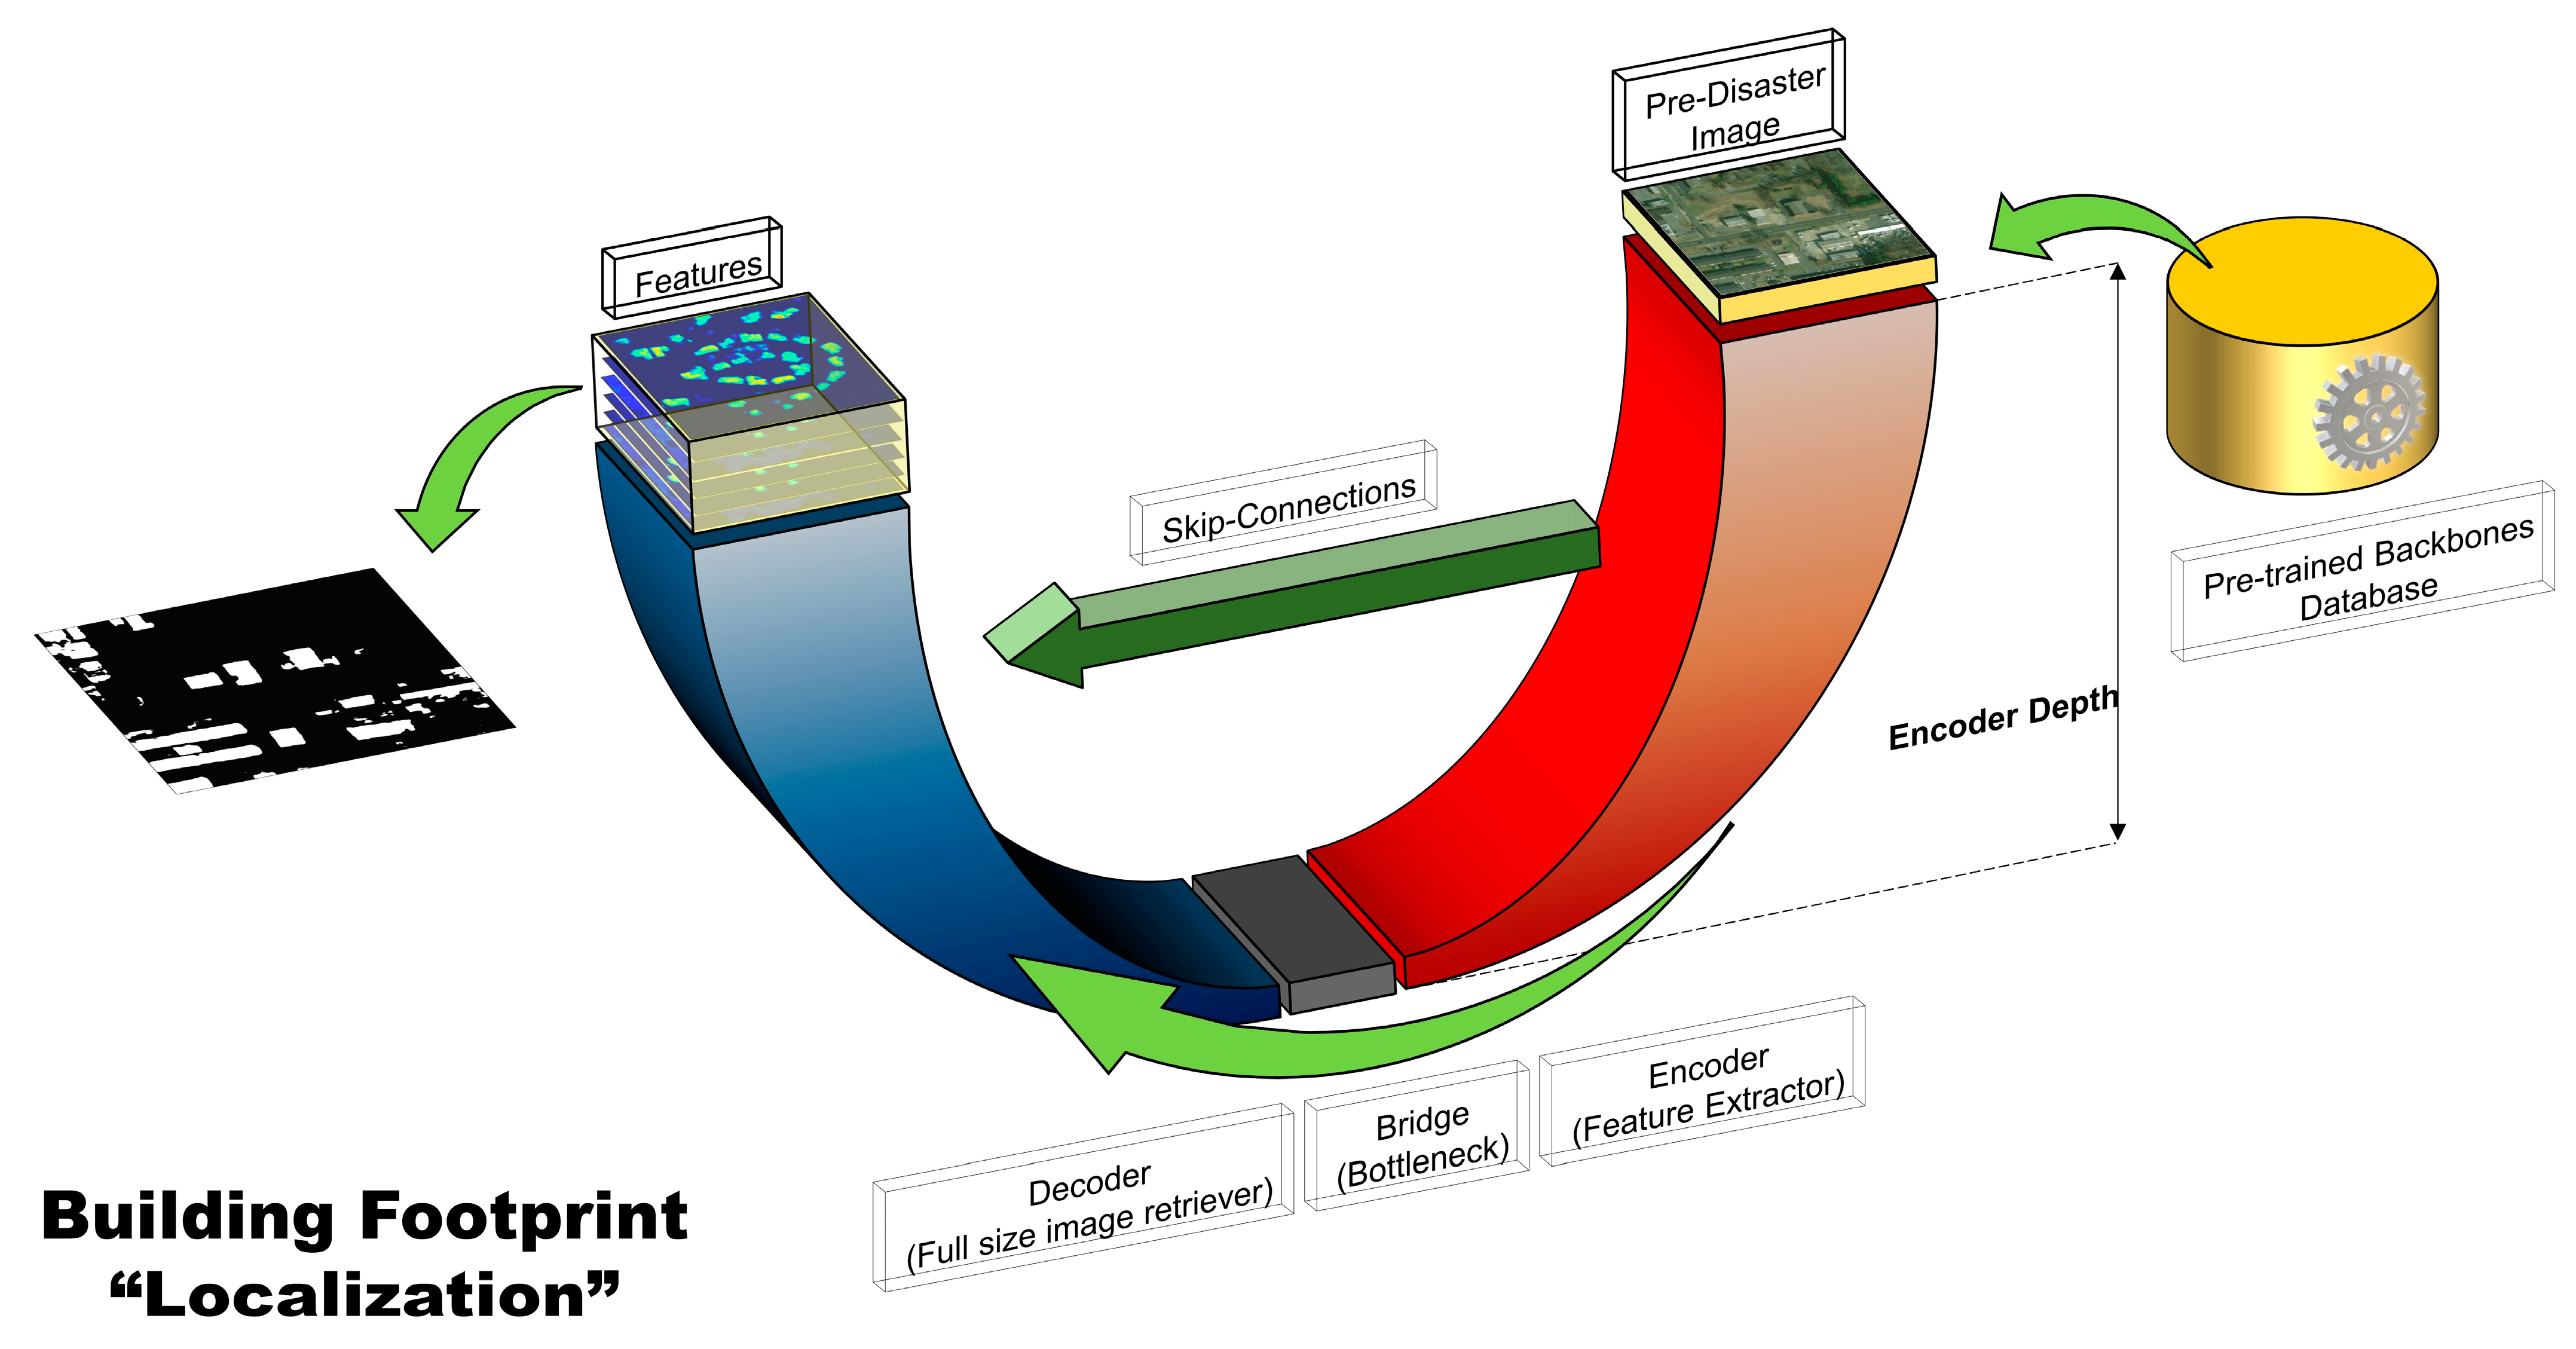
4.1. Localization Model
The first step in a building damage assessment procedure is to locate building objects. Buildings affected by disasters on post-disaster images can have an adverse impact on the performance of the localization network and may introduce errors in the localization results; thus, only pre-disaster images were utilized in the first stage to locate building footprints. The proposed segmentation network used in this stage was based on a UNet encoder-decoder architecture. Among various deep learning architectures, UNets [
37], with a down-sampling step for feature extraction, up-sampling structure to retrieve the input image resolution, and concatenating high- and low-level features with each other through skip connections, have shown great performance in semantic segmentation tasks. UNet architecture is a fully convolutional encoder-decoder network, enhanced with skip connections that connect features from the encoder block to their corresponding layers in the decoder block and enhance gradient flow. Skip connections help the network recover the original pixel resolution of the input image and share the information learned by the encoder with the decoder. Shallow features, which are concatenated with deep features from the decoder path, help reduce spatial information loss through the backpropagation step. The output of a UNet in this stage is a pixel-level map showing the locations of objects.
Figure 8 illustrates a schematic view of a UNet model with different parts of the network highlighted. We can name the six main components of a UNet model as (1) the input image, (2) the encoder or feature extractor path, (3) the bridge or the bottleneck of the network, (4) the decoder or the expanding path, (5) the extracted deep features, and (6) the skip connections between encoder and decoder paths. By changing the parameters, such as the number of convolutional layers, increasing and decreasing the number of filters in convolutions, or adding and removing different modules to the network, researchers create variations of UNets that suit their desired applications.
In the encoder part, the input image is convolved and pooled in successive convolutional blocks (involving 2D convolutions, batch normalizations, and rectified-linear unit activations) and becomes smaller in terms of spatial resolution but richer in terms of deep features. With the network becoming deeper, the deep feature space becomes larger, and the spatial resolution decreases. The decoder or expansion path expands the high-level, low-resolution feature maps into higher-resolution maps by successive transposed convolutions, which learn to up-sample the layers by a 2× factor. In order to keep the details of input images and target objects, such as detailed borders and small objects, along with precise localization, skip connections are utilized to pass information from the encoder to the decoder path. The output of the localization step is a binary segmentation map, which indicates the target building locations extracted from the input pre-disaster satellite images.
Pretrained backbones are usually used as a simple transfer learning strategy to enhance the performance of the encoder part in Convolutional Neural Networks [
66,
67,
68]. Backbones are small to large models with various architectures, which are usually trained on a similar classification task (usually ImageNet classification), and one of their main goals is to boost the learning process in new complicated architectures. Pre-trained backbones often carry optimized weights and can improve the network learning trend during training. We utilized different backbones in our implementations to study their role in both the localization and classification tasks. As can be seen on the right side of
Figure 8, the pre-trained backbone features were replaced by the encoder component of our UNet.
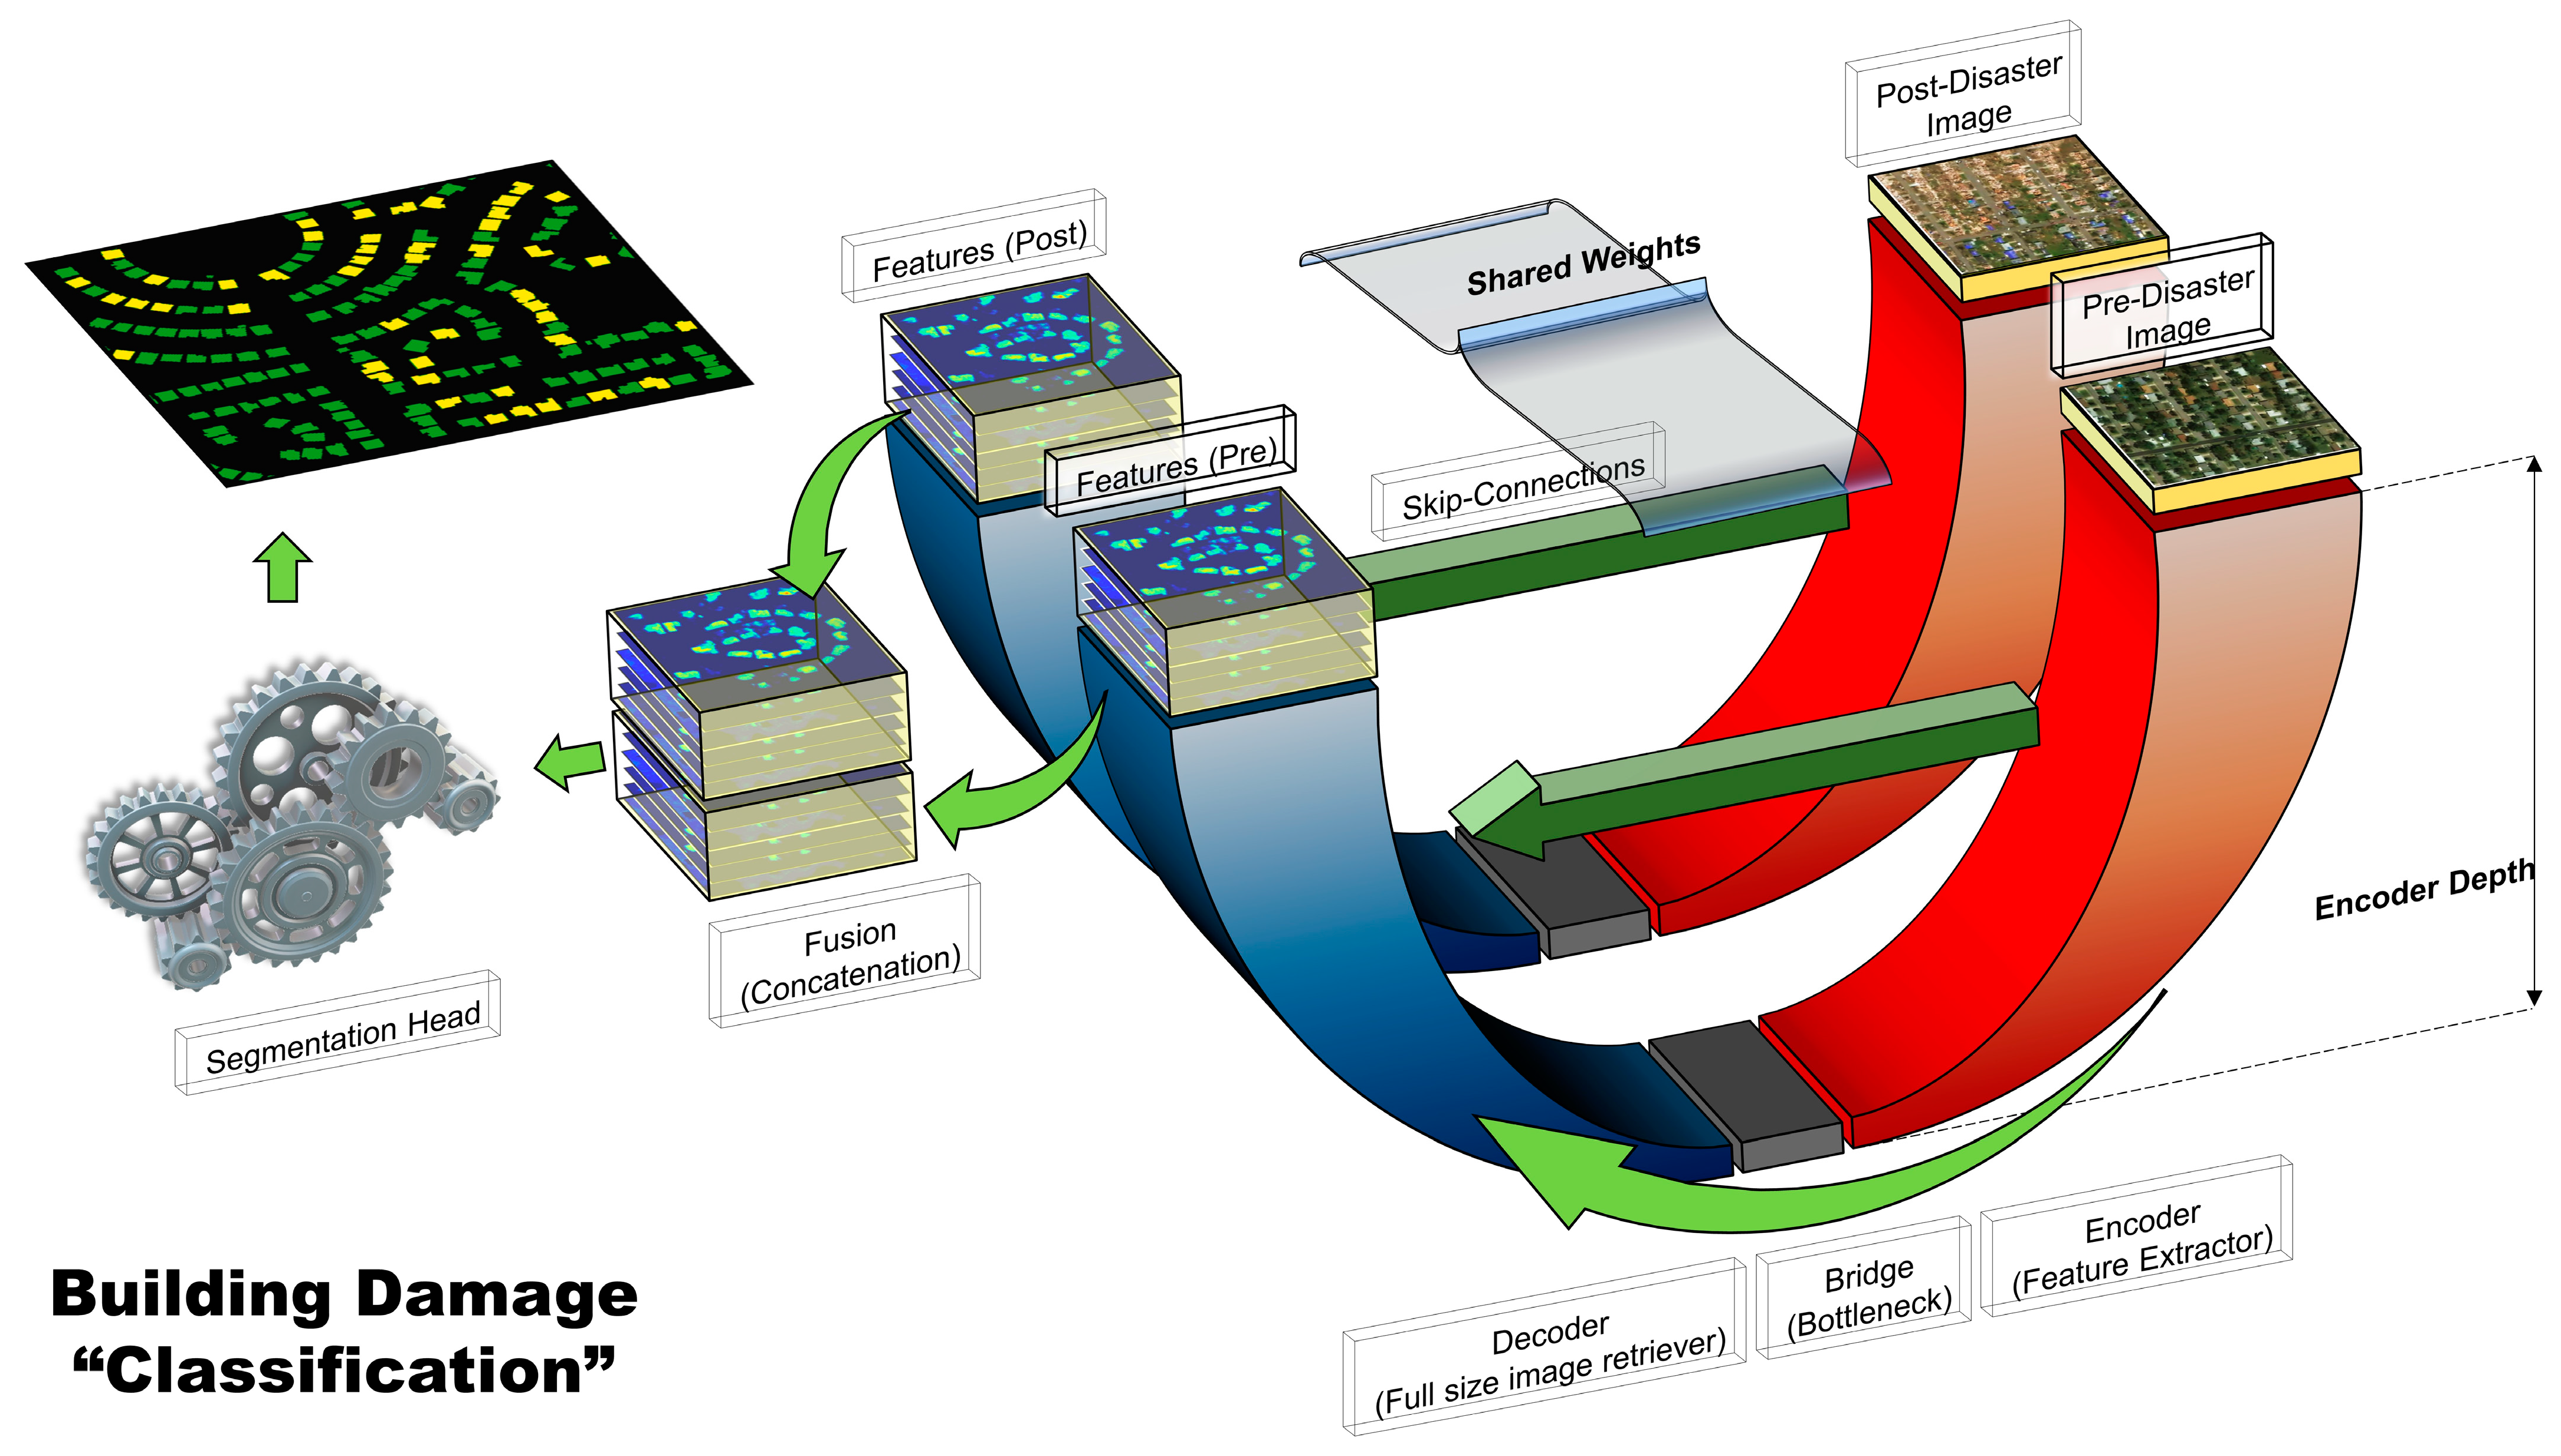
4.2. Damage Classification Model
The next step was to assess building damage levels using the proposed dual-branch UNet architecture. Both pre- and post-disaster images were fed into the dual-branch network, which was conceptualized based on the well-known Siamese-based networks [
18] that perform semantic change detection or building damage assessment [
36,
46,
57]. The backbone network that was used in this step was the already trained building localization UNet mentioned in the previous section. Having the weights to be shared between both branches in the initialization step, the trained network helped the dual-branch model to obtain more reliable deep features from both pre- and post-disaster images and converge faster. Deep features were then concatenated into a larger feature map which was then entered into a segmentation head containing convolutional and batch-normalization layers.
Figure 9 illustrates the schematic diagram of such a dual-branch Siamese-UNet with similar weights. The proposed two-stage, dual-branch framework is capable of considering the spatial and temporal attributes of pre- and post-disaster images at the same time and, consequently, improves the building segmentation and damage assessment results.
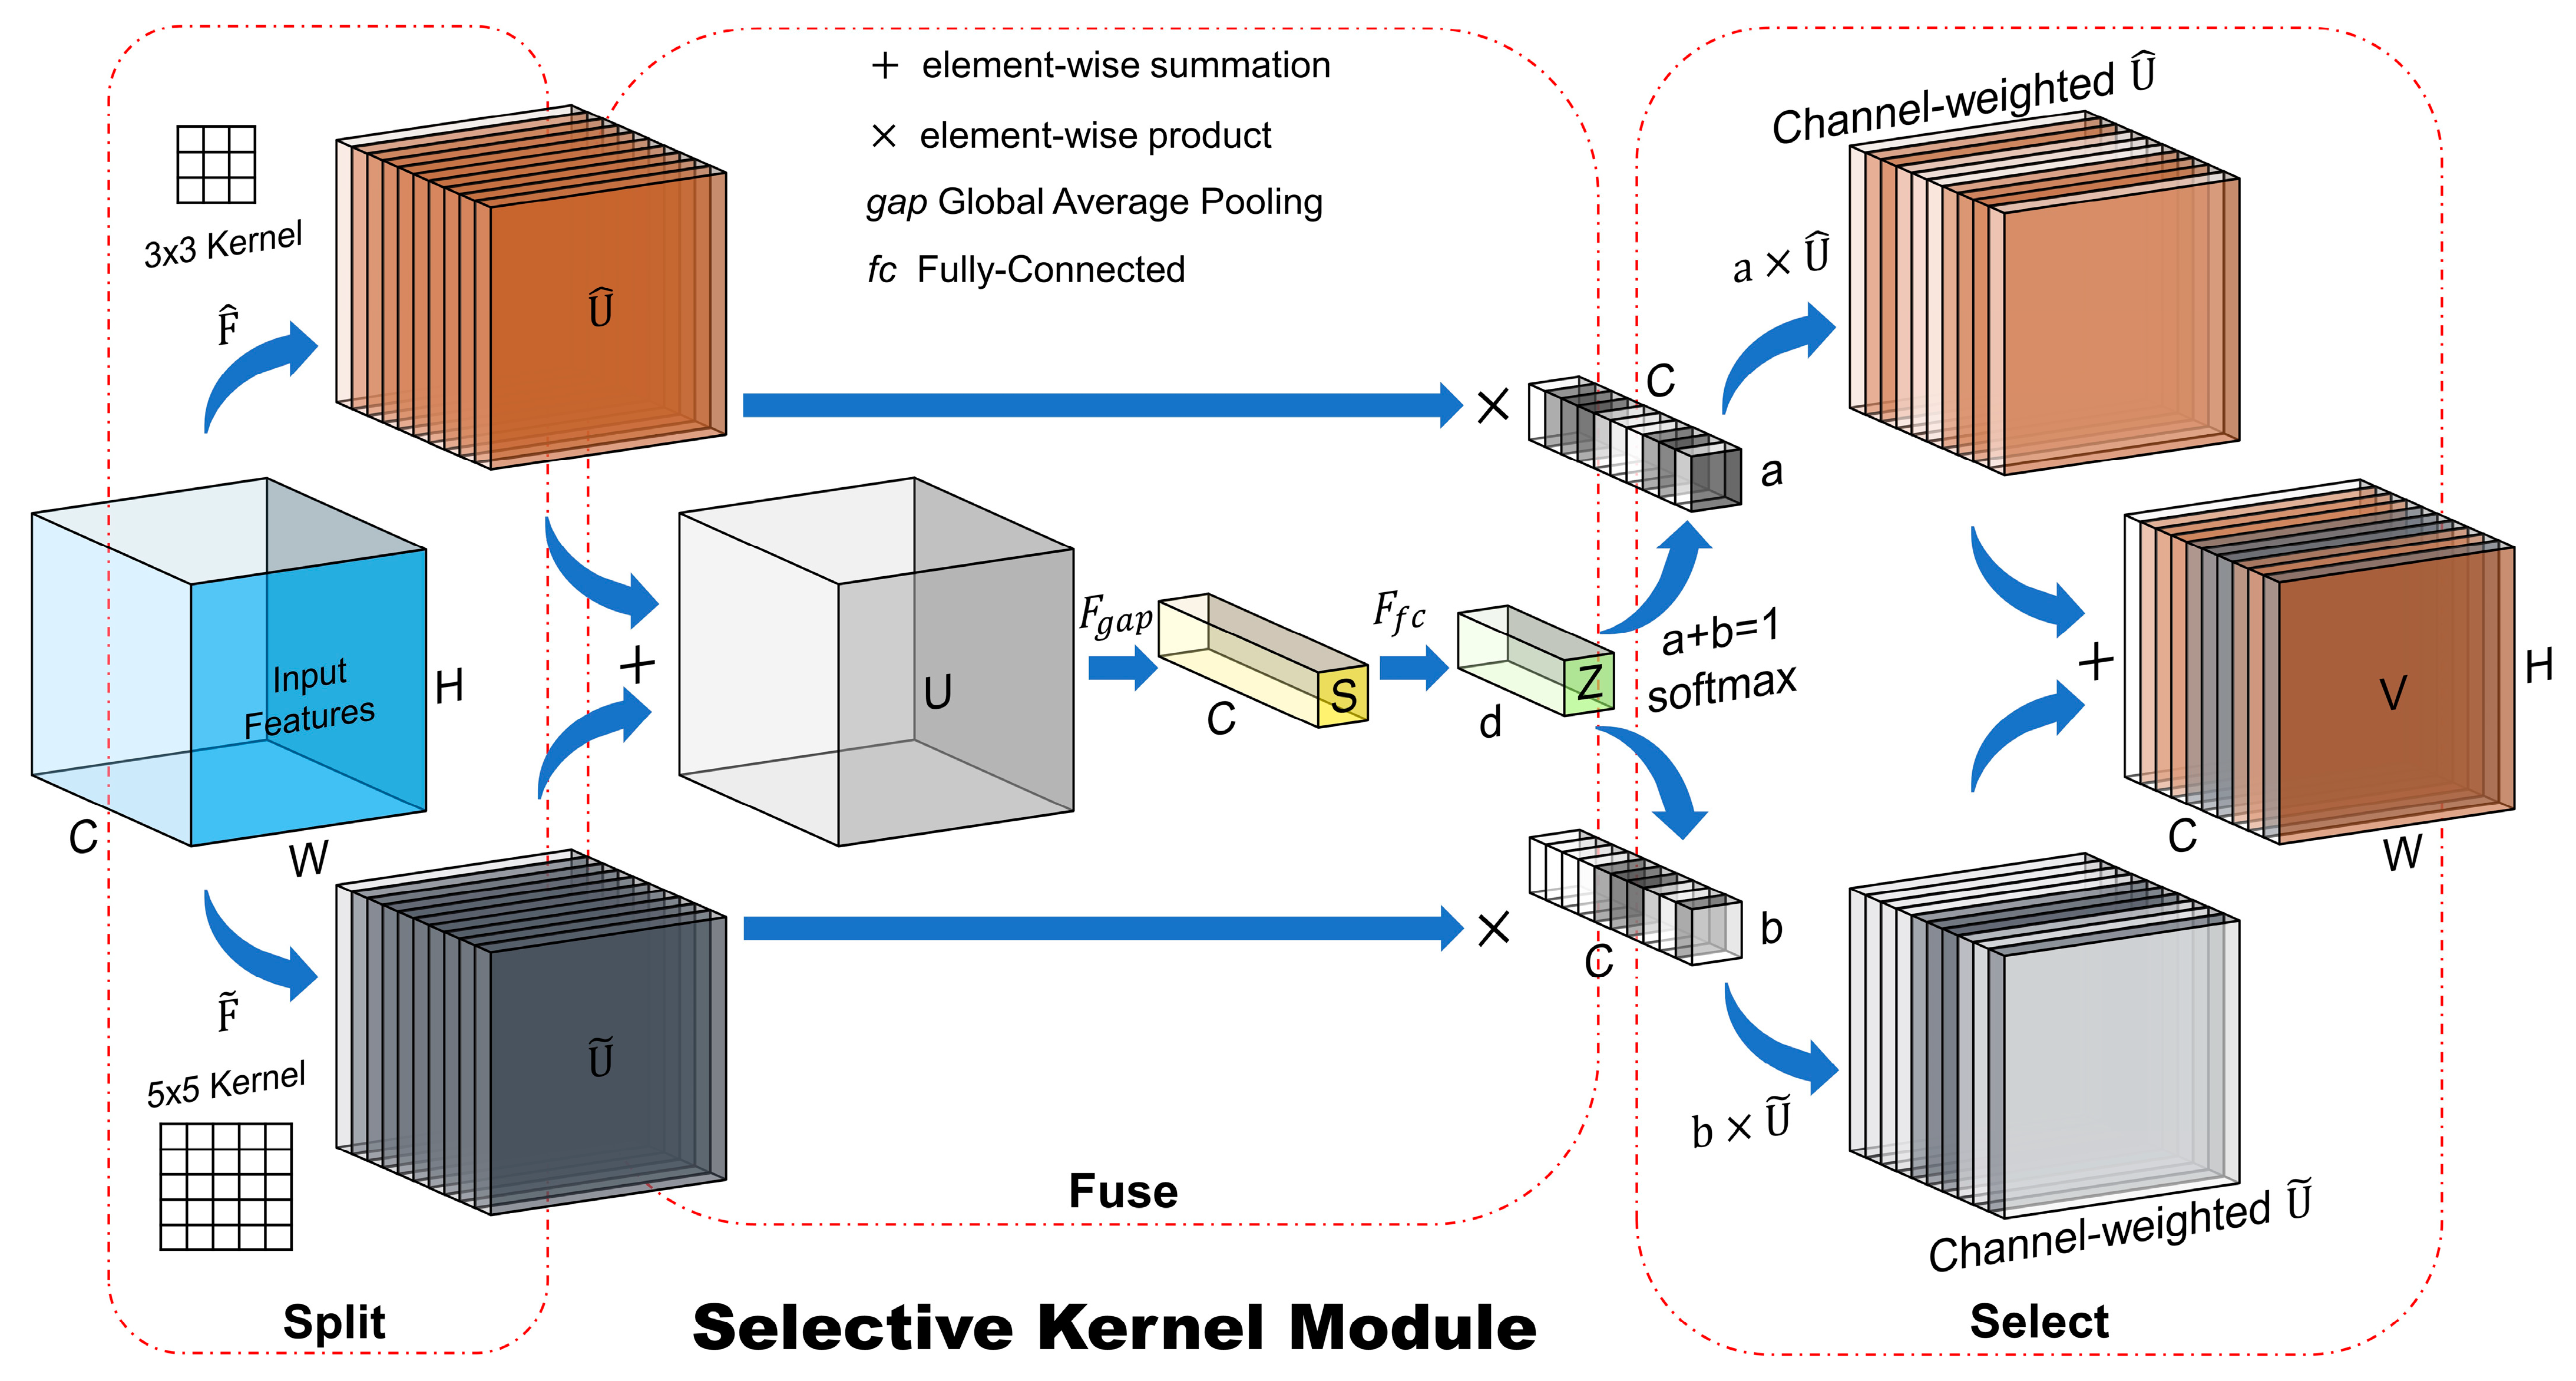
4.3. Selective Kernel Module (SKM)
In the localization and classification stages, UNet models extracted semantic contextual information through many convolutional layers, which resulted in predicting the location and damage classes of buildings. However, the receptive fields of the artificial neurons (convolution kernels) in layers were designed to have the same size. Here, we presented an approach to aggregate information from different kernel sizes to obtain semantic features from more adaptive receptive fields. The SKM based on the SKNets proposed by Li et al. [
39] is a three-stage module that acts to pay more attention to more important features through the information extraction steps from adaptive receptive fields. The three stages are (1) Split, (2) Fuse, and (3) Select, as illustrated in
Figure 10, where a two-branch case with two possible receptive fields is shown.
After entering the , on the Split part, different kernels with different sizes (e.g., , and ) are applied to features within multiple branches to obtain and . The Fuse operator combines the information from multiple branches by an element-wise summation to obtain . Then, the global information is embedded via a global average pooling () operation applied to , where a reduction of dimensionality is performed by feeding into a fully-connected layer () to obtain the compact feature map , that enables precise and adaptive selection of features. Weight vectors are calculated using a Softmax function to obtain a global representation of the importance of features. Finally, the Select operator aggregates features from multiple branches based on the weights obtained from the Fuse operator to obtain the guided information through an element-wise product. The result is a weighted feature map , with the same size as the input features but weighted based on the activations with multiple kernel sizes.
4.4. Evaluation Metrics
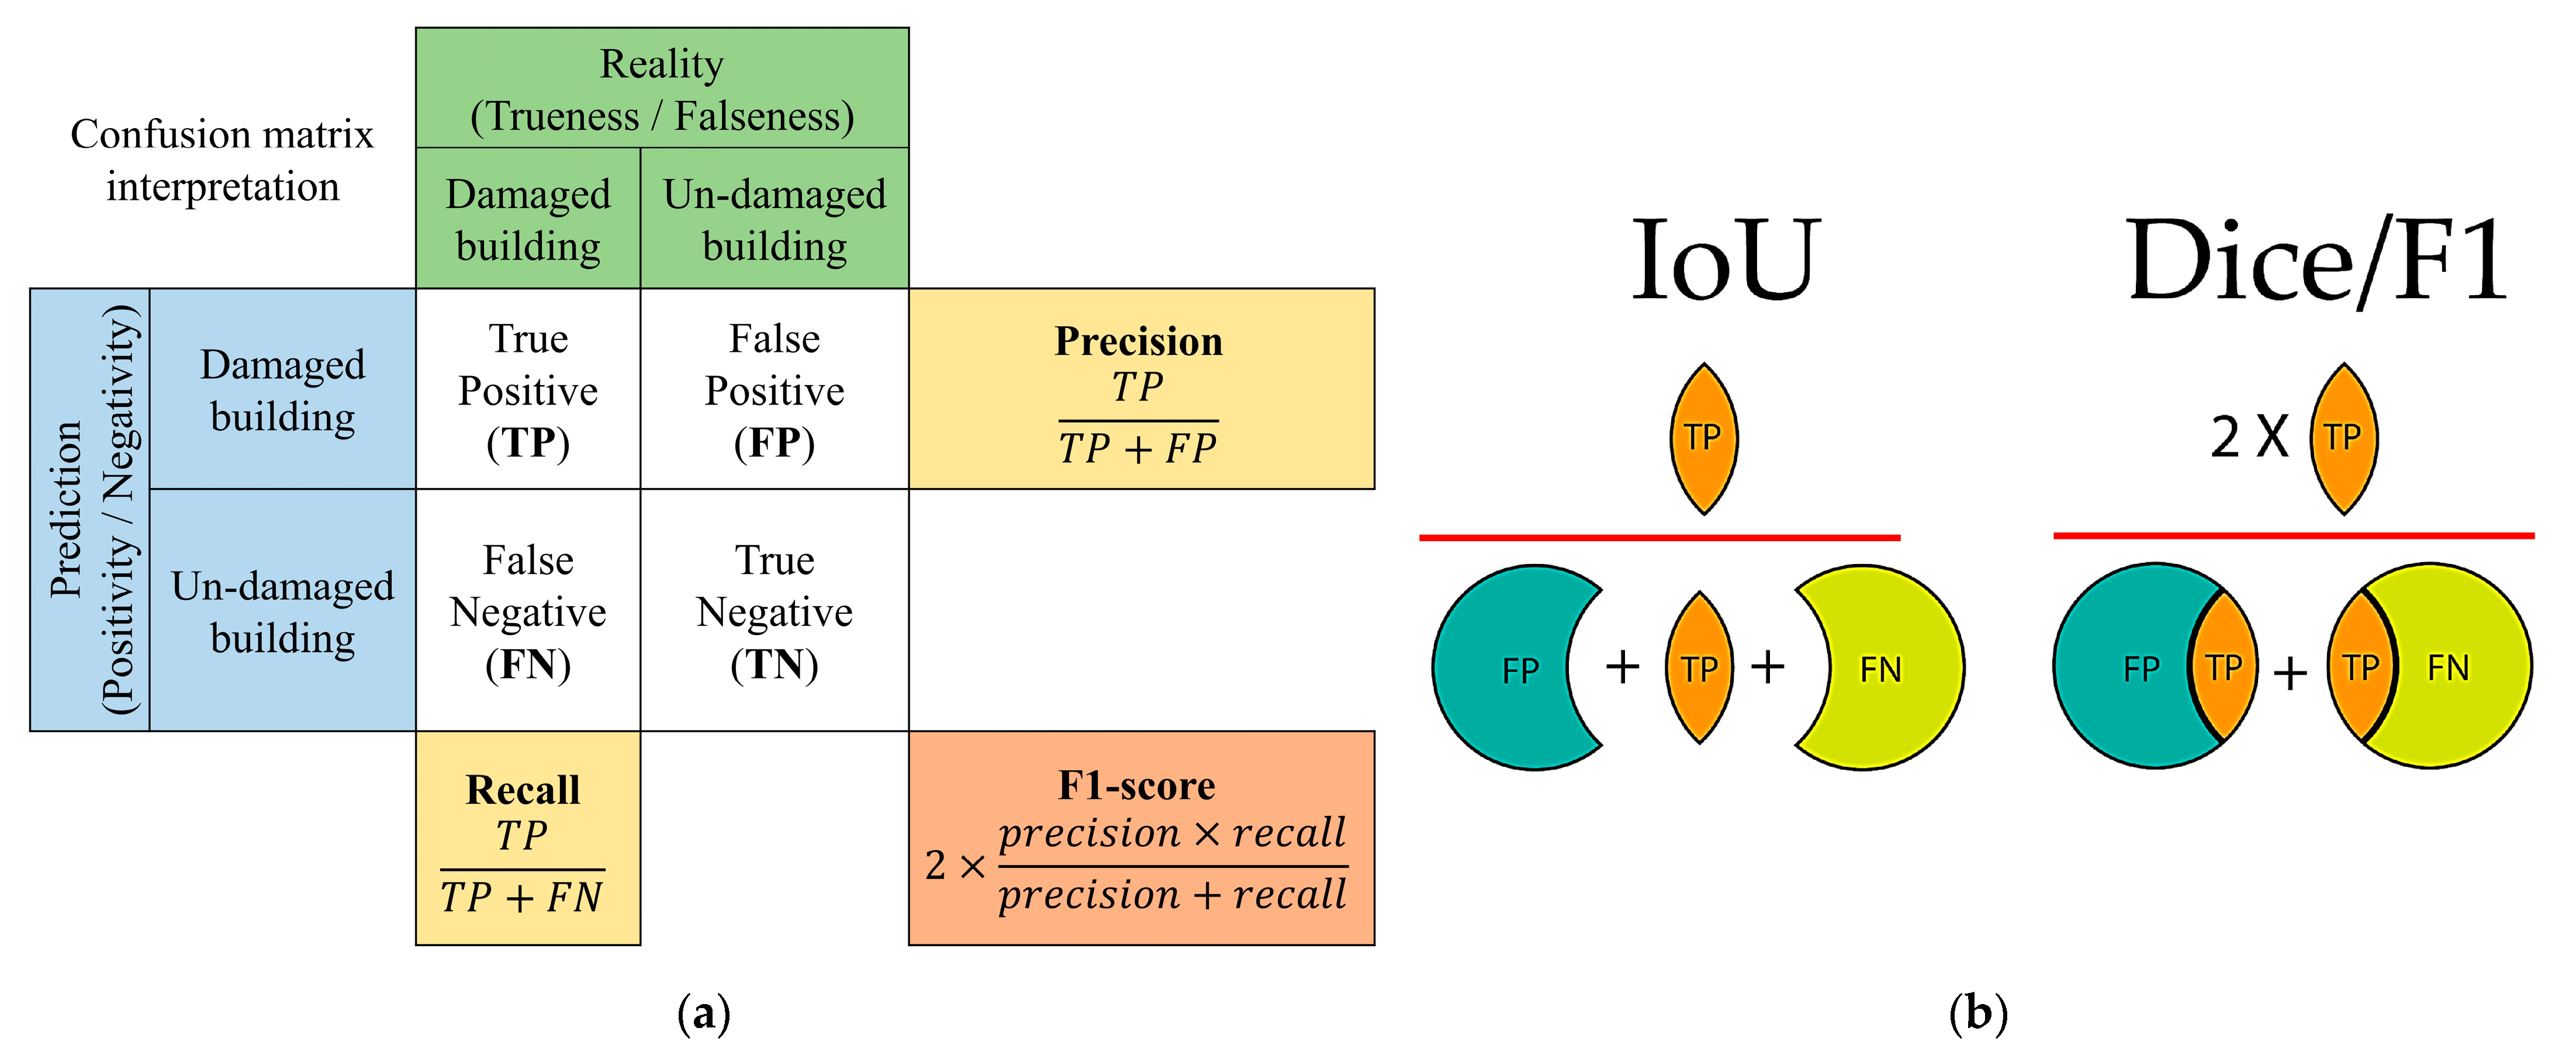
One key step in assessing the quality and reliability of a model is to evaluate its performance using appropriate evaluation metrics. Accordingly, the ground truth annotated buildings were used for comparison and statistical accuracy assessment of our proposed method. For this purpose, true building classes in reality, which indicate trueness or falseness, were compared to predictions of the model in the structure of a confusion matrix.
Figure 11 simplifies the understanding of how a confusion matrix can be interpreted in a binary classification scenario. True positive (TP), false positive (FP), true negative (TN), and false negative (FN) values were extracted from the confusion matrix by looking at their exact definitions. After defining the basic parameters, according to the confusion matrix, four other dependent metrics, i.e., precision, recall, F1-score (i.e., Dice coefficient), and Intersection-over-Union (IoU, i.e., Jaccard index), could be defined by Equations (1)–(4) [
69]:
Precision is the ratio of correctly classified buildings to the total number of samples that were assigned to the building class, as in the localization stage. Recall is the ratio between the number of correctly classified buildings and the total number of buildings that really exist. Higher precision relates to a lower false positive rate, i.e., lower false alarms, and higher recall is related to lower false negative rates, i.e., lower algorithm misses. It should be noted that in the building damage assessment stage, a four-class problem (i.e., damaged, no-damaged, minor damaged, major damaged) was considered for performance evaluation. In localization and classification problems, higher values for both of these metrics are desired. For this reason, the F1-score, the harmonic mean between precision and recall, is defined to understand the overall performance of a model with one measure. The other metric that is capable of estimating the performance of a model is Overall Accuracy, defined as the number of all correctly classified buildings divided by the number of all existing buildings in the scene. Finally, in order to enhance the assessment procedure, the generated building damage assessment maps were visually evaluated by comparing the results with pre- and post-disaster satellite images.
5. Experiments and Results
In this section, we provide the details of implementations, such as different parameters and the configuration set-ups during the experiments. After that, the results of the experiments with the proposed method, along with the comparisons made with state-of-the-art networks, are demonstrated. Finally, we showed the robustness and transferability of the proposed method by applying it to another dataset from an entirely different geographical region.
5.1. Implementation Details
The models (i.e., in the first and second stages) were trained using Adam optimizer [
70] with a learning rate starting at 0.0001, which was incrementally reduced by a factor of 0.1 when the models reached a plateau in learning. The localization models were trained with a batch size of 10 pre-disaster images, randomly cropped into patches of 256 × 256 × 3 pixels, while the damage assessment models were trained with a batch size of 5 pairs of pre- and post-disaster images, randomly cropped into patches of 256 × 256 × 3 pixels. The localization and damage assessment networks were trained for 70 and 30 epochs, respectively. The selection of the number of epochs was based on the observations from the literature, which used more epochs for the localization stage and less for the classification stage, and several try-and-error attempts to find the most suitable numbers. Moreover, we configured them in such a way as to avoid overfitting in the models.
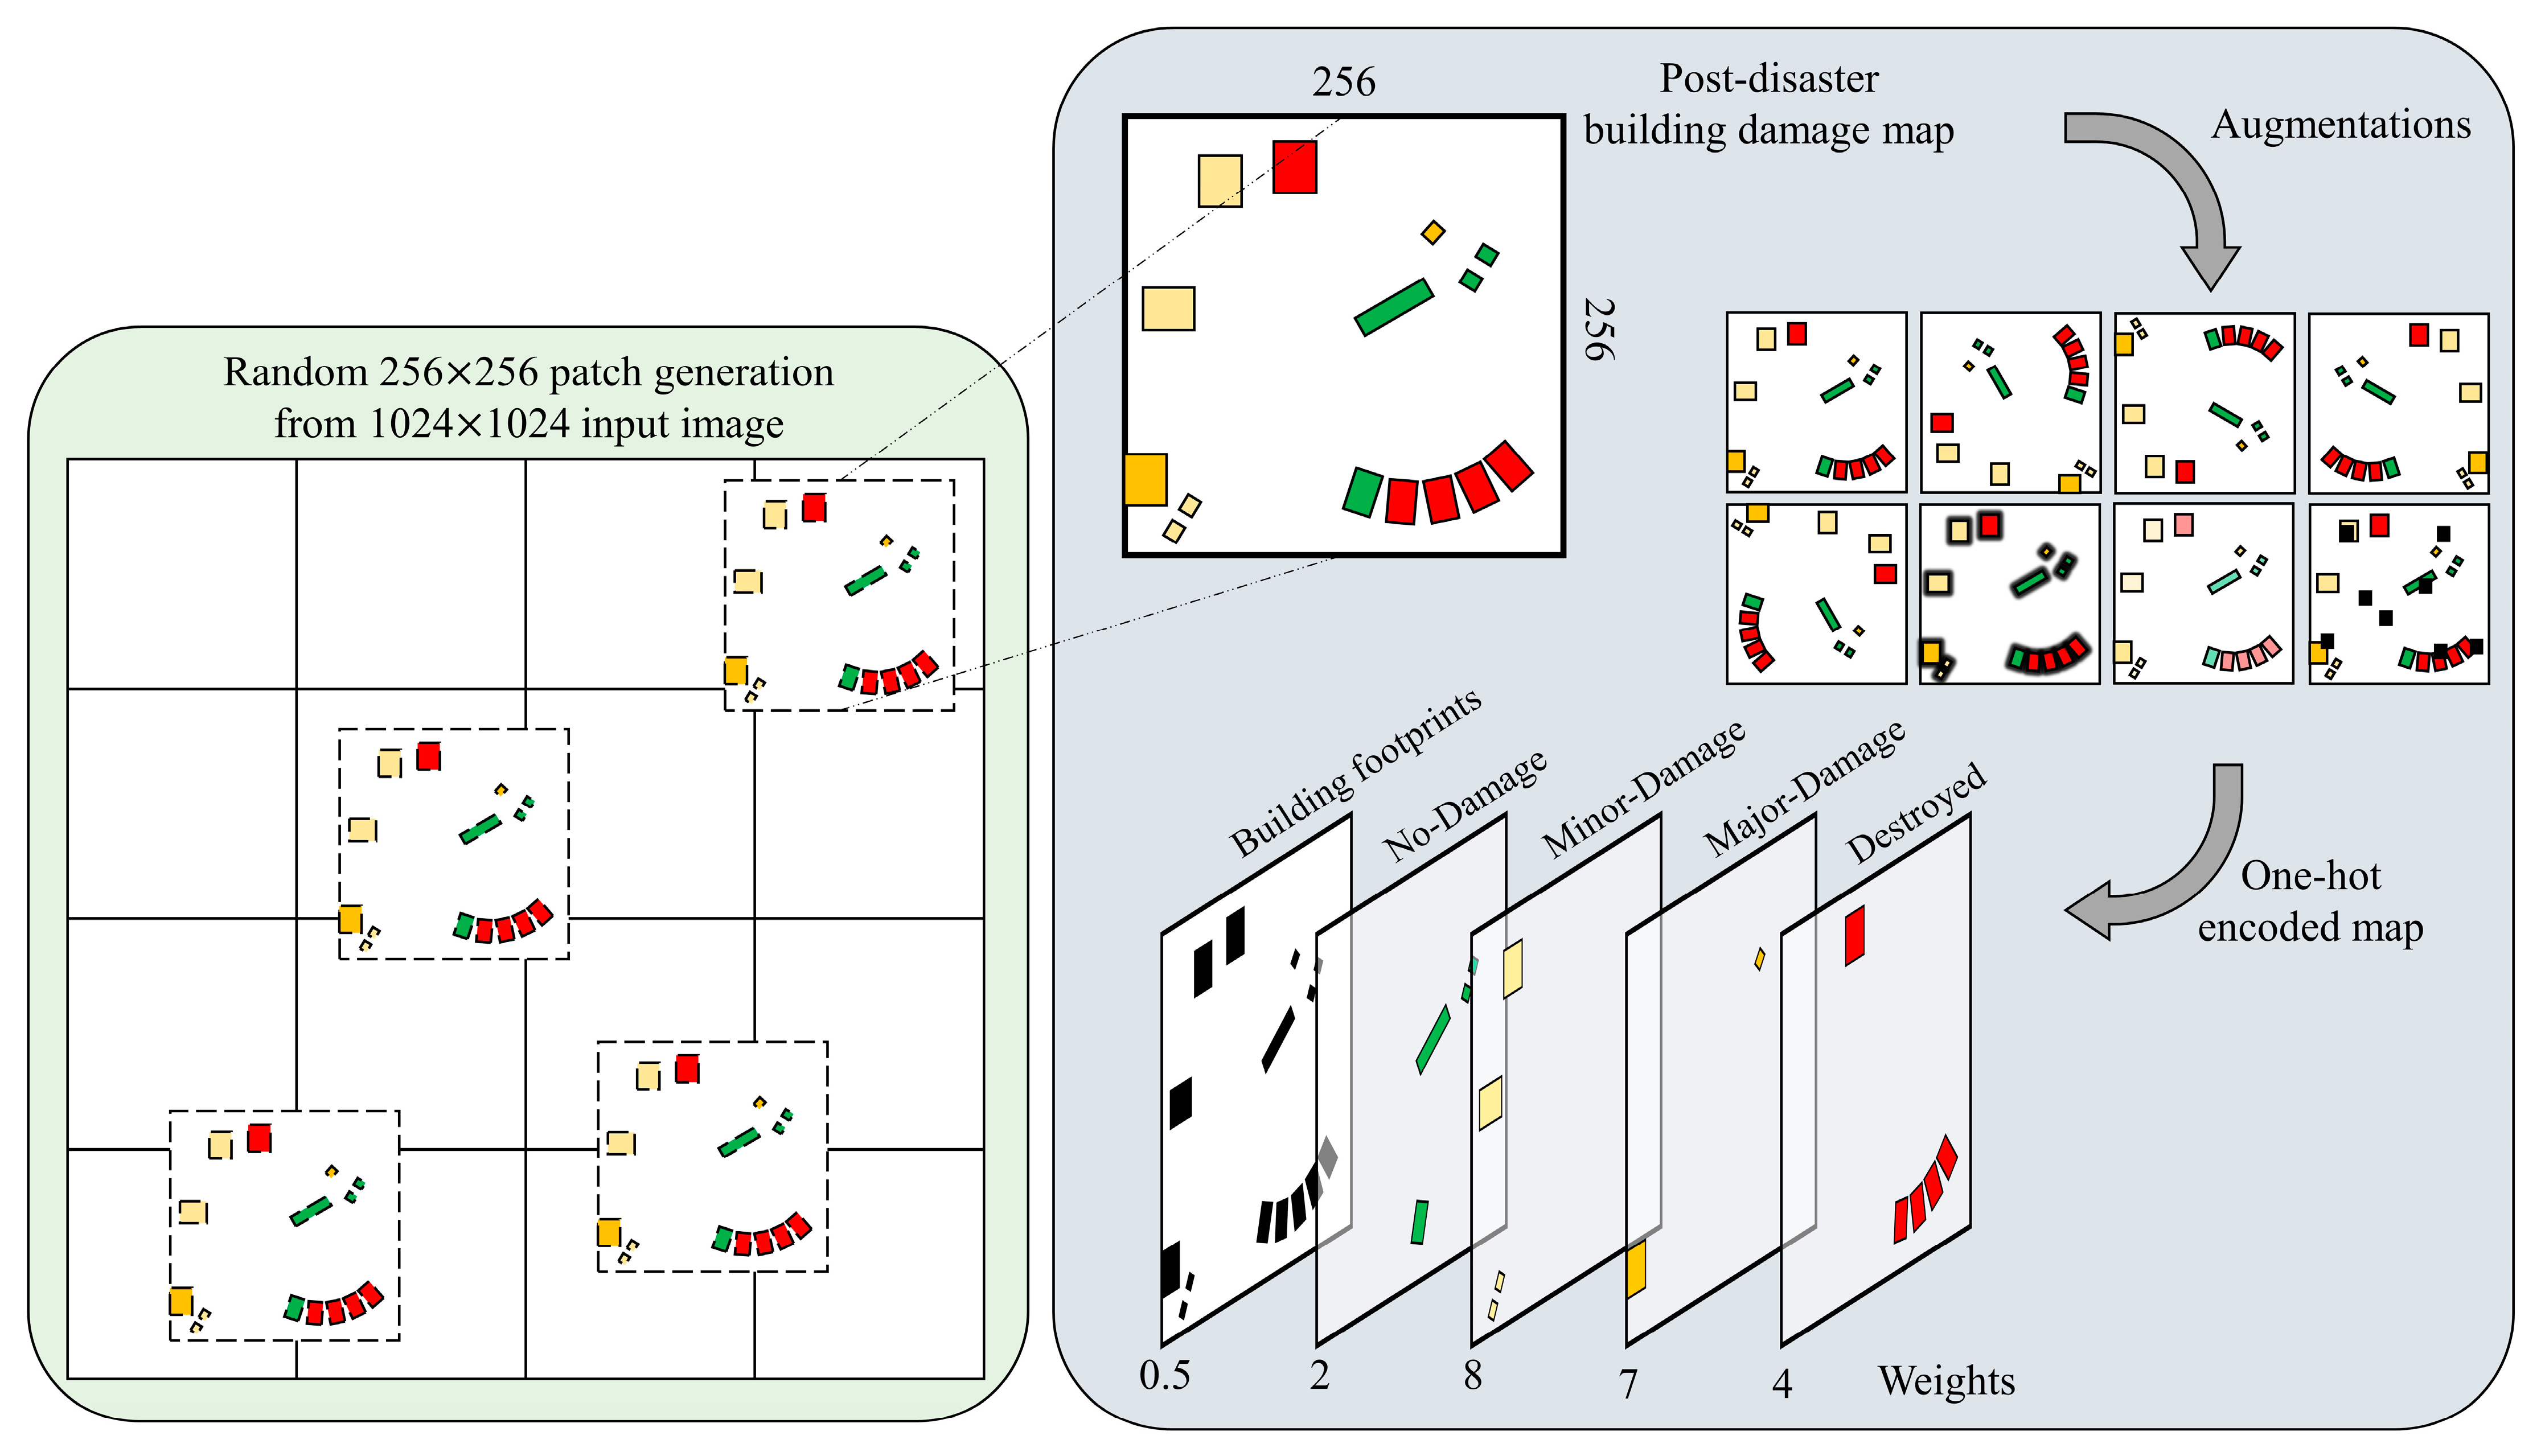
It is worth mentioning that the ground truth masks for the localization task were 256 × 256 × 1 pixels, while for the damage assessment stage, we used one-hot encoded masks. One-hot encoded masks contain pixels of each class in a separate channel. Thus, the masks of the second stage had 256 × 256 × 5 shapes, where the last four were for the four damage classes, and the first channel was selected to contain building localization masks (see
Figure 12).
Figure 12 illustrates the above-mentioned preparations in a schematic diagram. On the left, the random 256 × 256 cropping procedure is shown. In particular, in each iteration during the training phase, one random 256 × 256 patch is extracted from the 1024 × 1024 input image. This step is highly important in increasing the generalization power of the model, as it decreases the chance of the model to see one similar patch in every iteration. On the right side, a schematic illustration of the augmentation process and the one-hot encoded classes, along with their corresponding weights, are shown.
A combination of Focal loss (
) [
71], Dice loss (
) [
72], and Cross Entropy loss functions were utilized in the localization model training stage [
73]. Focal loss function addresses data imbalance, while Dice loss tries to fit the prediction masks with ground truth building masks by maximizing their overlaps. Moreover, for the multi-class semantic segmentation model training, Binary Cross Entropy was replaced with a Weighted Categorical Cross Entropy loss function (
) which takes into account data imbalance by applying different weights to classes. The weights were proportional to the number of samples in each damage category [
73]. Equation (5) clarifies the utilized loss function. Finally, on the last layer of the model, a Sigmoid activation function was used.
where
refers to reference pixels and
is the predicted pixels for class
.
After training the localization networks, they were used as weight initializers for the second stage. The weights of localization networks were initially shared between the dual Siamese paths of the damage classification network and were incrementally updated with a low learning rate during backpropagation. In order to avoid overfitting and to be able to perform training, validation, and testing steps in a reasonable and efficient time, after trying different settings, we kept the number of epochs equal to 70 and 30 for the localization and classification stages, respectively. The localization UNet as a base network required more epochs for better convergence, while its weights can be further used in the classification stage, and the dual-UNets can be trained in fewer epochs. On the other hand, different model configurations may converge at different rates, but having a fixed number of epochs for all the considered models makes the comparison fair. In fact, the model that can achieve a superior performance in a fixed number of epochs can be considered a better model. Furthermore, data augmentation was applied to both stages for regularization purposes to make the models robust to variations and noise. Train and Tier3 images (2799 + 6369 pairs) were used simultaneously for training, while Holdout (933 pairs) and Test (933 pairs) groups were kept for validation and testing, respectively. All the experiments were performed on an NVIDIA GeForce RTX 2080 Ti GPU, and the codes were implemented in Tensorflow and Keras packages. Model training in each epoch took approximately 400–650 s for the smallest to the largest models, while the inference time for each 1024 × 1024 × 3 image was less than 1 s.
5.2. Results Analysis
To further study the performance of our proposed method and verify its effectiveness, we employed several state-of-the-art benchmark methods to compare results on the xBD dataset. Six state-of-the-art UNet-based segmentation networks were considered to assess the performance of the proposed localization method (see
Figure 13 and
Table 1). For damage assessment method evaluation, the two-stage framework was kept unchanged, but four UNet-based architectures were used to compare the results.
Figure 13 shows the fundamental structures of networks that we used for comparisons. The predefined evaluation metrics were used for statistical assessments, and the localization and classification maps were further visually investigated to better understand the performances.
5.2.1. Localization Models
First of all, the basic UNet introduced in [
37] was used as the starting point. After that, the Attention-Unet [
35] which was powered by attention gates on Unet skip-connections, was used. Attention-Unet is powerful at focusing on more important spatial structures of varying shapes and sizes. For the third model, a Residual-Unet [
74] was utilized. Although the number of parameters of the Residual-UNet model was almost the same as those of the basic UNet, its performance was improved with the help of residual blocks added to both encoder and decoder paths. Shortcut connections added in each layer of Residual-UNet improved gradient flow through the network [
75,
76]. In addition, we tried to empower our networks with pre-trained backbones. Accordingly, for the next model, we replaced the encoder path of the Base-UNet with a pre-trained ResNet34 backbone. Deep features extracted by pre-trained backbones could be beneficial in faster learning and convergence of the network. In the same way, in order to evaluate the performance of more powerful backbones, we selected one of the most accurate pre-trained backbones, the EfficientNetB7 [
77], and replaced it with ResNet34. EfficientNetB7 utilizes convolutional blocks that contain Squeeze-and-Excitation modules in their heart, resulting in a competing performance for extracting fine-grained structures. Finally, the best-performing model, EfficientNetB7-UNet in our case, was selected, and the Selective-Kernel Module was added to its endpoint. The addition of the SKM could improve the feature extraction process by applying adaptive receptive field learning to the network.
Table 1 presents the details of the six models and their corresponding number of parameters. The overall architectures of these models are also visualized in
Figure 13.
Table 1.
The six models that were used for comparison in the first stage of our methodology; the building localization.
Table 1.
The six models that were used for comparison in the first stage of our methodology; the building localization.
| | Localization Models | Extensions | Number of Parameters | References |
|---|
| 1 | Base-UNet | - Fully convolutional encoder-decoder, with skip-connections | 15.6 M (trainable) | Ronneberger et al., 2015
[37] |
| 2 | Attention-UNet | - Attention-gates added to skip-connections | 15.8 M (trainable) | Wu et al., 2021, Oktay et al., 2018
[35,46] |
| 3 | Residual-UNet | - Residual blocks added to each layer | 15.6 M (trainable) | Khankeshizadeh et al., 2022, Zhang et al., 2018
[74,78] |
| 4 | ResNet34-UNet | - ResNet34 pre-trained weights on ImageNet were used as the backbone | 3 M (trainable) + 21 M (non-trainable) | He et al., 2016
[75] |
| 5 | EfficientNetB7-UNet | - EfficientNetB7 pre-trained weights on ImageNet were used as the backbone | 11 M (trainable) + 63 M (non-trainable) | Baheti et al., 2020, Tan et al., 2019 [66,77] |
| 6 | EfficientNetB7-SKM-UNet | - EfficientNetB7 pre-trained weights on ImageNet were used as the backbone
- Selective Kernel Module added to the decoder for adaptive receptive field learning | 11 M (trainable) + 63 M (non-trainable)
~5 K from SKM | Proposed method
[39,66] |
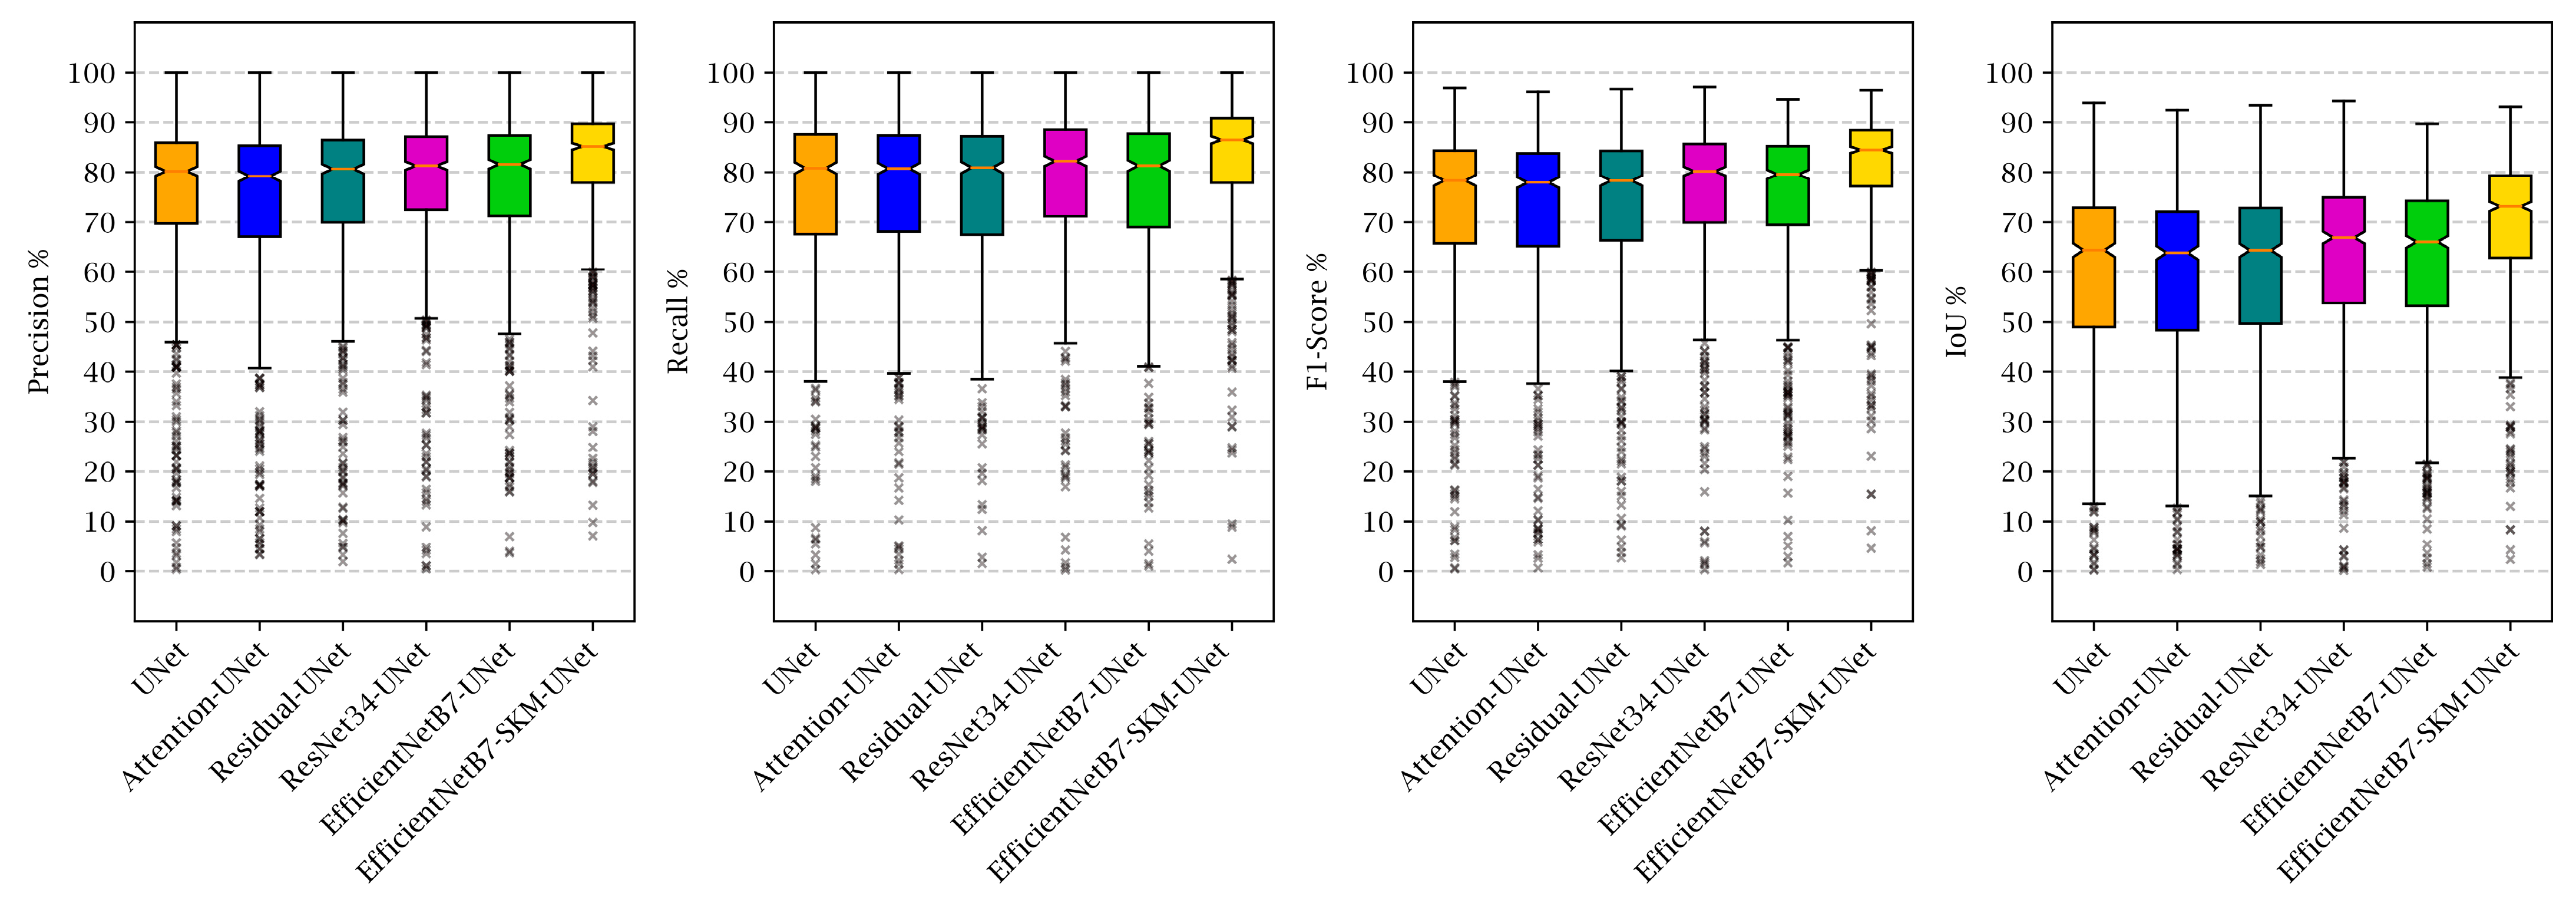
The xBD benchmark dataset was used in all experiments in a similar way to provide a fair comparison between networks. After training the localization networks for 70 epochs, binary segmentation maps were produced for the Test set, and the evaluation metrics, i.e., precision, recall, F1-score, and IoU, were calculated for all the images. Subsequently, box plots, which indicate the minimum, maximum, and median values, along with the lower and upper quantiles of each metric, were generated.
Figure 14 illustrates the box plots of each model, separated by evaluation metrics. In order to generate this plot, all the models mentioned in
Table 1 were tested on the same set of images. For all the images, TP, FP, TN, and FNs were obtained based on their building localization results, and then evaluation metrics were obtained. Focusing on boxplots over all the metrics shows that the performance of the first three models (i.e., Base-UNet, Attention-UNet, and Residual-UNet), which did not utilize pre-trained backbones was approximately the same, with a weaker performance for the Attention-UNet. Interestingly, although the EfficientNetB7-UNet introduced approximately 4× more parameters than the ResNet34-UNet model, they both performed nearly the same. On the other hand, inserting the SKM at the endpoint of the fifth model, generating the EfficientNetB7-SK-UNet model, obviously improved its performance by about 5% in precision, 7% in recall, 6% in F1-score, and 7% in IoU. The efficiency of SKM is highlighted by the fact that it only introduced about 5 thousand new parameters to the total number of trainable parameters of the network. Additionally, boxplots indicate that the model, which was empowered by SKM, had fewer outliers, and its box is more compact, showing that the standard deviation of metrics’ values had decreased, which is another indicator of improved performance and accuracy.
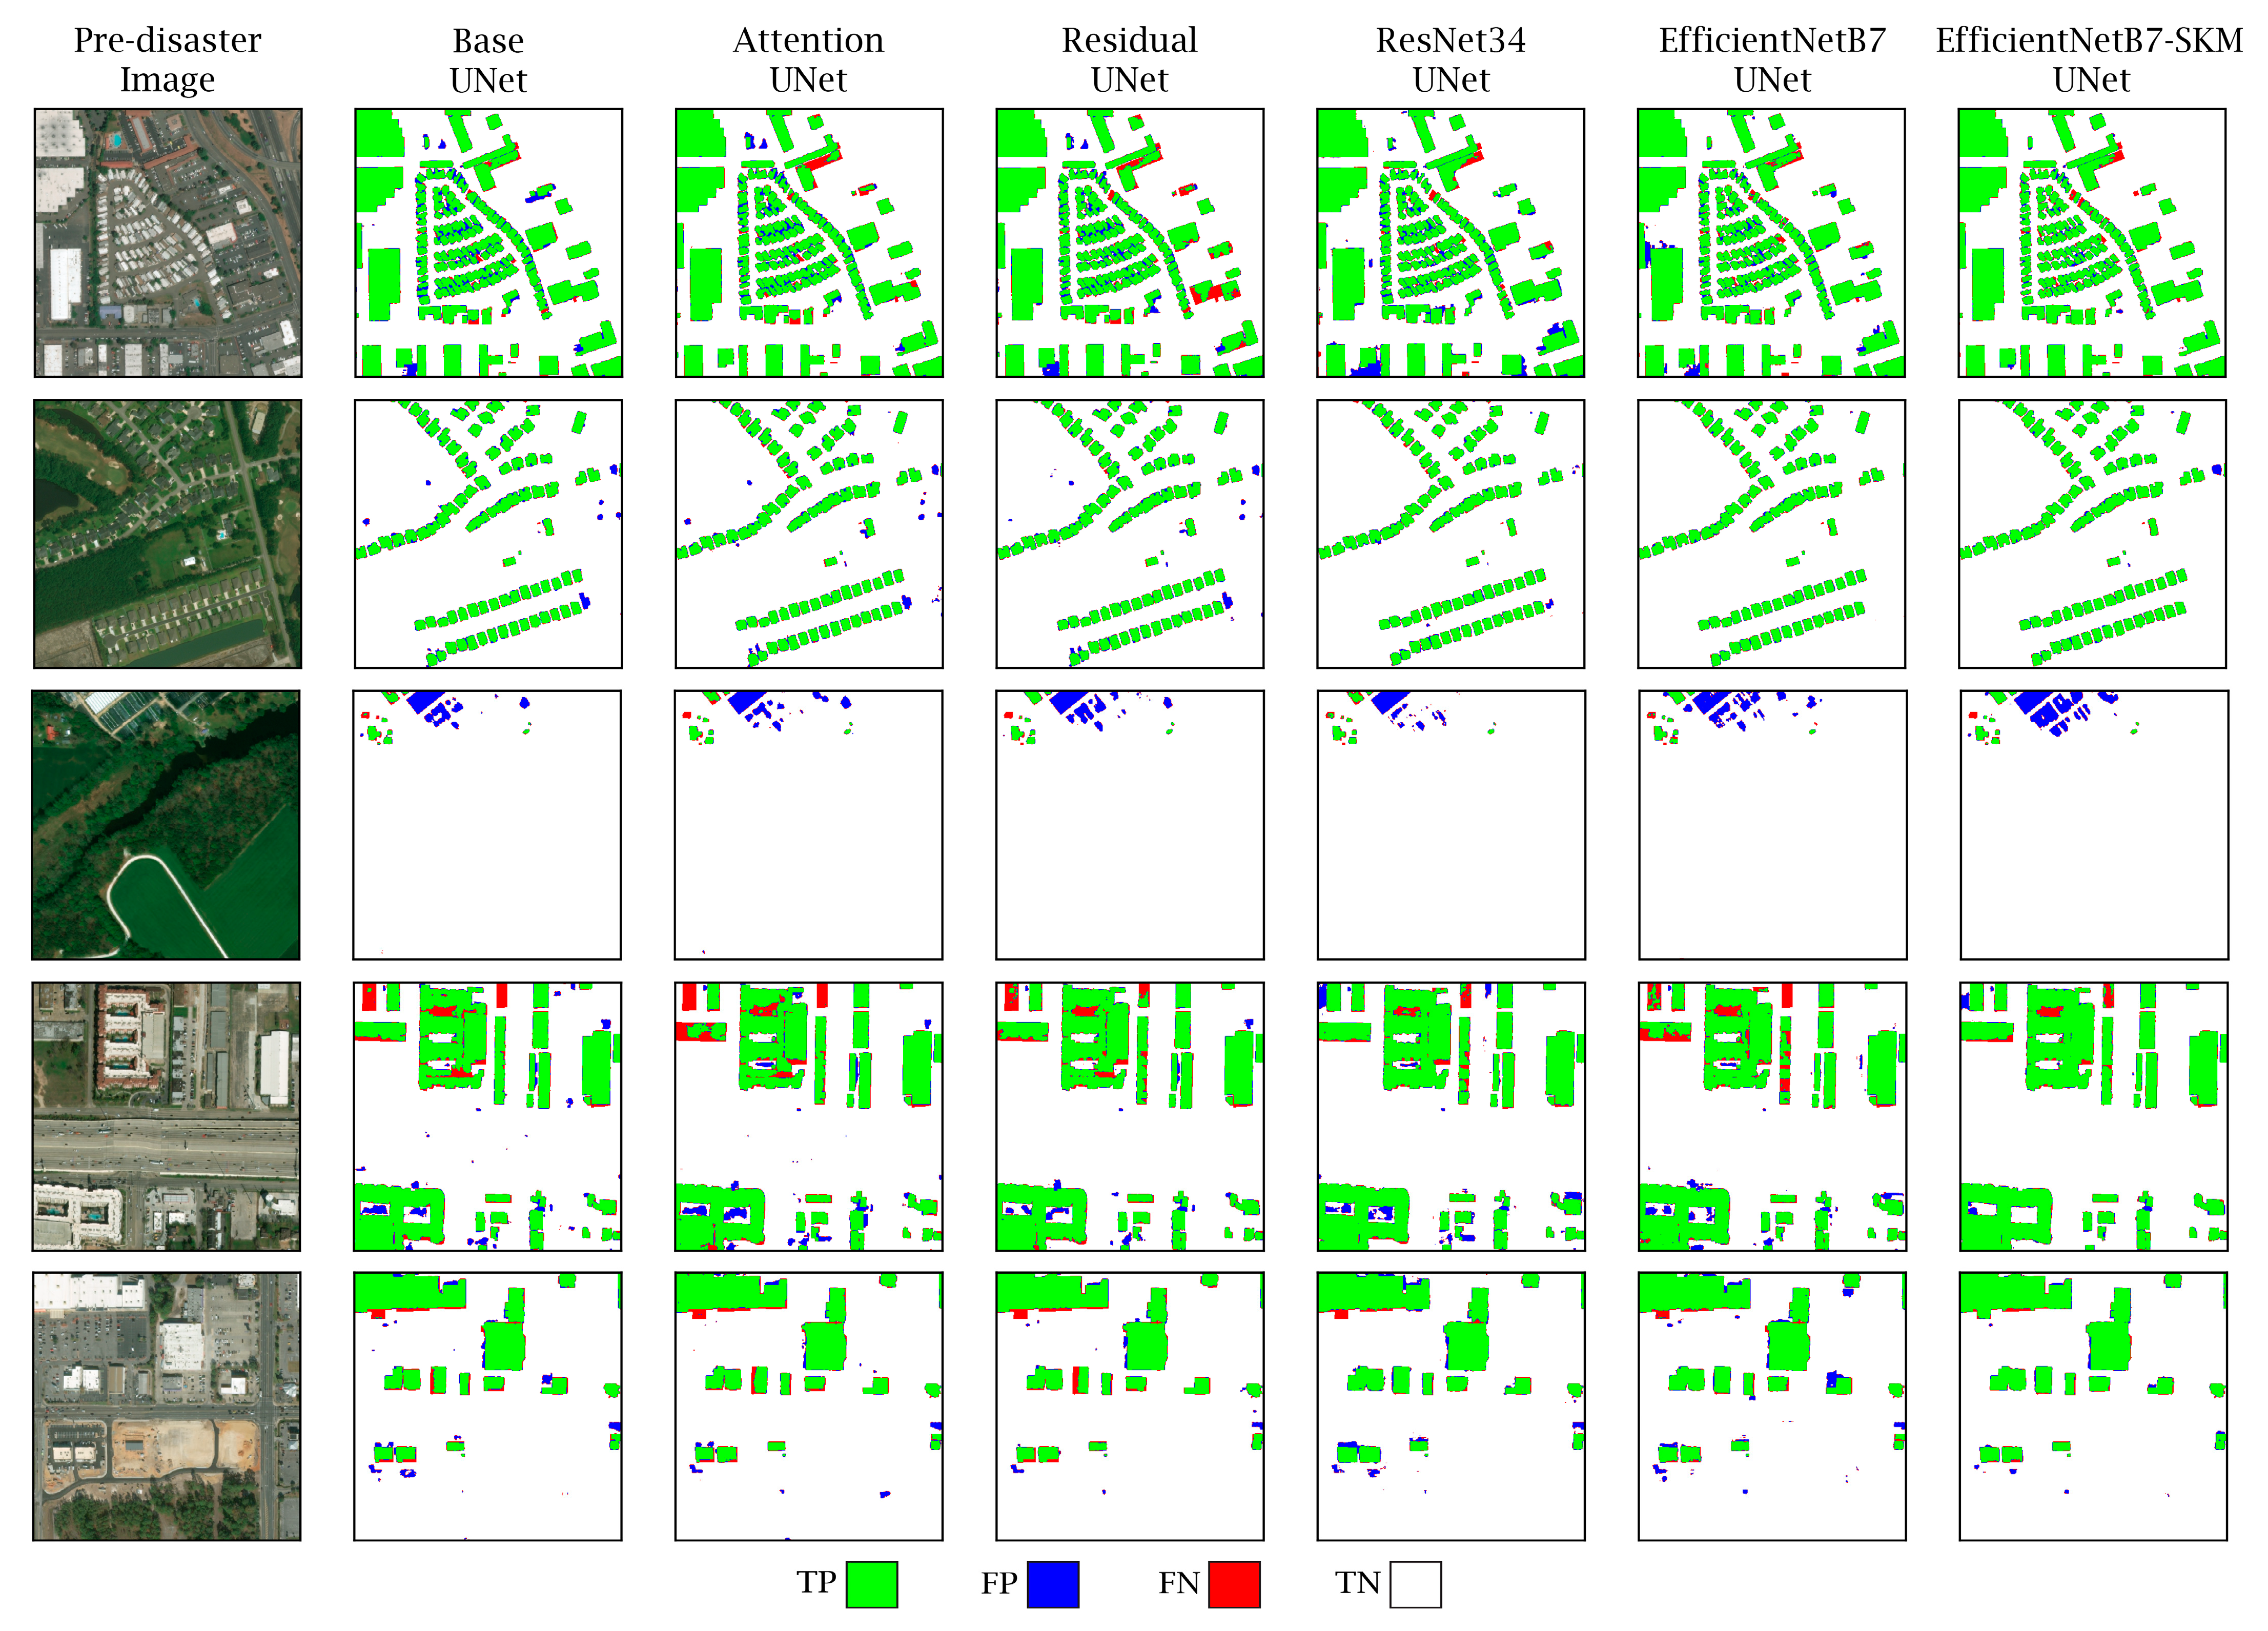
Figure 15 presents several samples of the localization stage from the considered models for visual investigations. In this figure, pre-disaster images and the localization predictions from the six models are illustrated and compared with the corresponding ground truth labels. For a better understanding of the models’ performances, we visualized the four variables that define evaluation metrics with four colors: green for TP, blue for FP, red for FN, and white for TN. These variables were obtained by comparing the results of each localization output with the ground truth of the corresponding image. Wherever the model predicted the buildings correctly, as in the ground truth, it was considered TP and colored green. Everywhere that should not be assigned to the building class and was predicted correctly in the localization stage was considered TN and colored white. Red and blue were associated with pixels that the localization models were predicting incorrectly. Blue represents pixels that were not buildings but were incorrectly detected as buildings and red pixels refer to the reverse case. It can be seen that EfficientNetB7-SKM-UNet introduced the least number of FPs and FNs. Results provided in
Figure 15 show that the proposed model provides more accurate predictions with fewer FP and FN pixels. This indicates a superior performance compared to other models in the localization task, which is the first step towards obtaining more accurate building damage assessment maps.
5.2.2. Damage Assessment Models
Four models were selected to compare the damage assessment results in the second stage and ensure the applicability of the proposed method. We selected the Siamese-Base-UNet as a common model (vanilla model) in the damage assessment stage and also expanded it with an SKM. Moreover, in order to further understand the impact of adding the SKM to the networks, SKM was added to the segmentation head of the EfficientNetB7-UNet building damage assessment model.
Table 2 summarizes all the models that were compared in the damage assessment stage of our study.
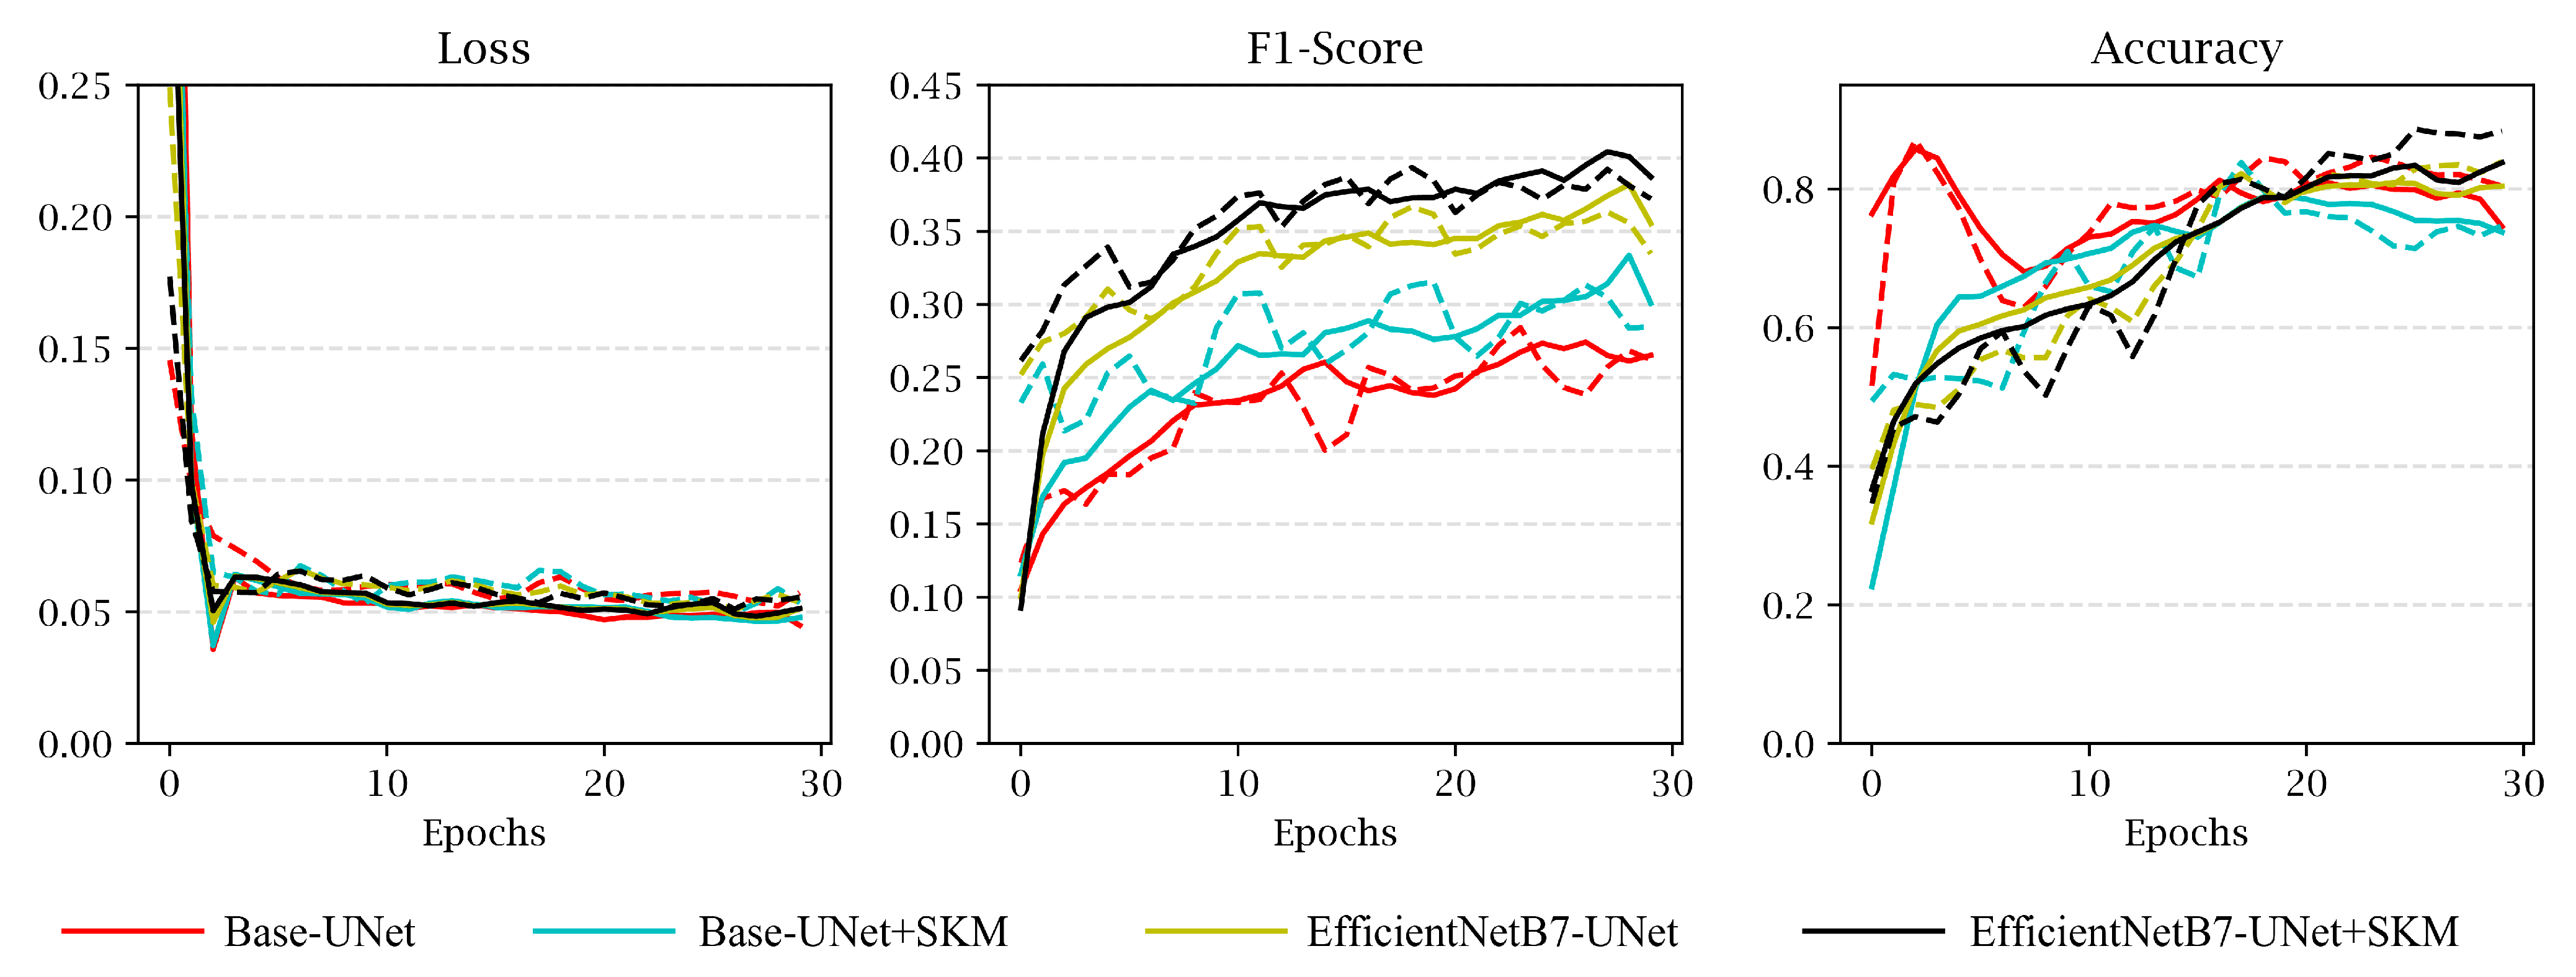
We trained damage assessment models for 30 epochs on the xBD dataset and produced damage classification maps. F1-score and overall accuracy were observed during the training process and recorded as the evaluation metrics of the damage assessment stage.
Figure 16 shows the mentioned metrics for the four models. Training and validation loss values, shown in
Figure 16, represent that the learning procedure was almost steady for all models. Furthermore, F1-score and Accuracy values demonstrate that the proposed model with SKM on each localization branch, the EfficientNetB7-SKM-UNet (black line), outperformed other damage assessment models in both F1-score and accuracy. The proposed model performance was improved by at least 5% in the overall F1-score using richer features obtained through the SKM.
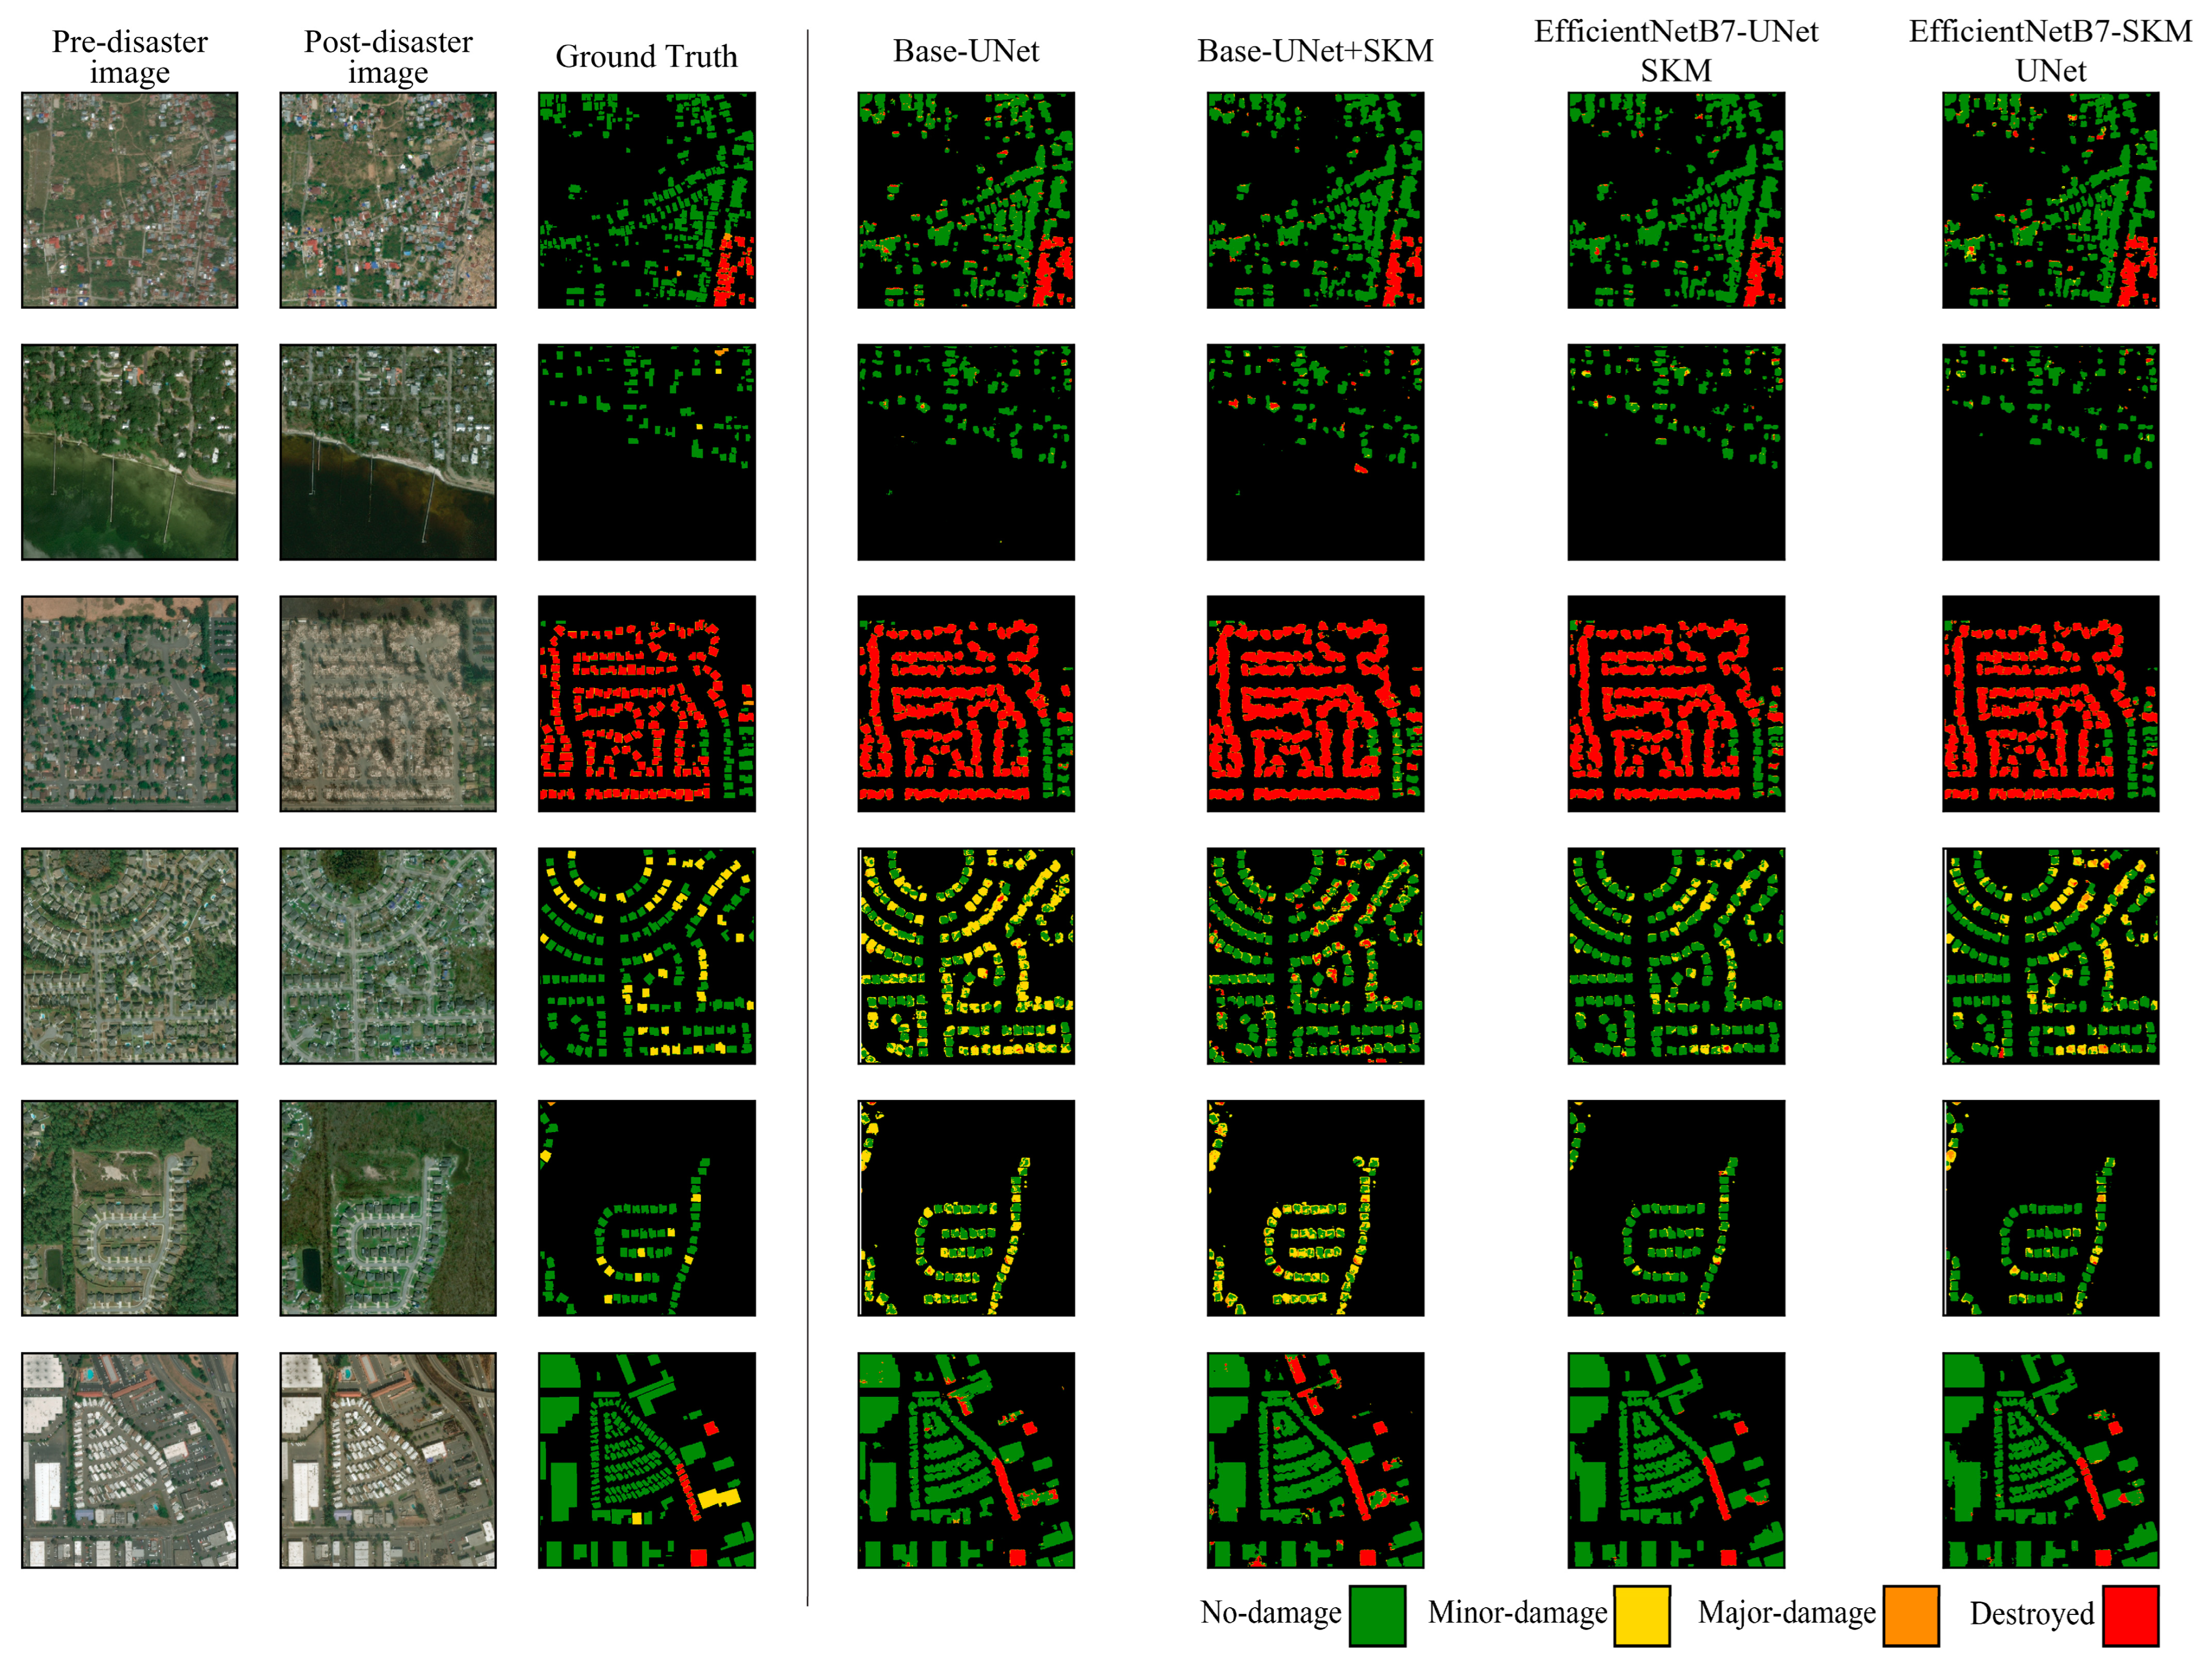
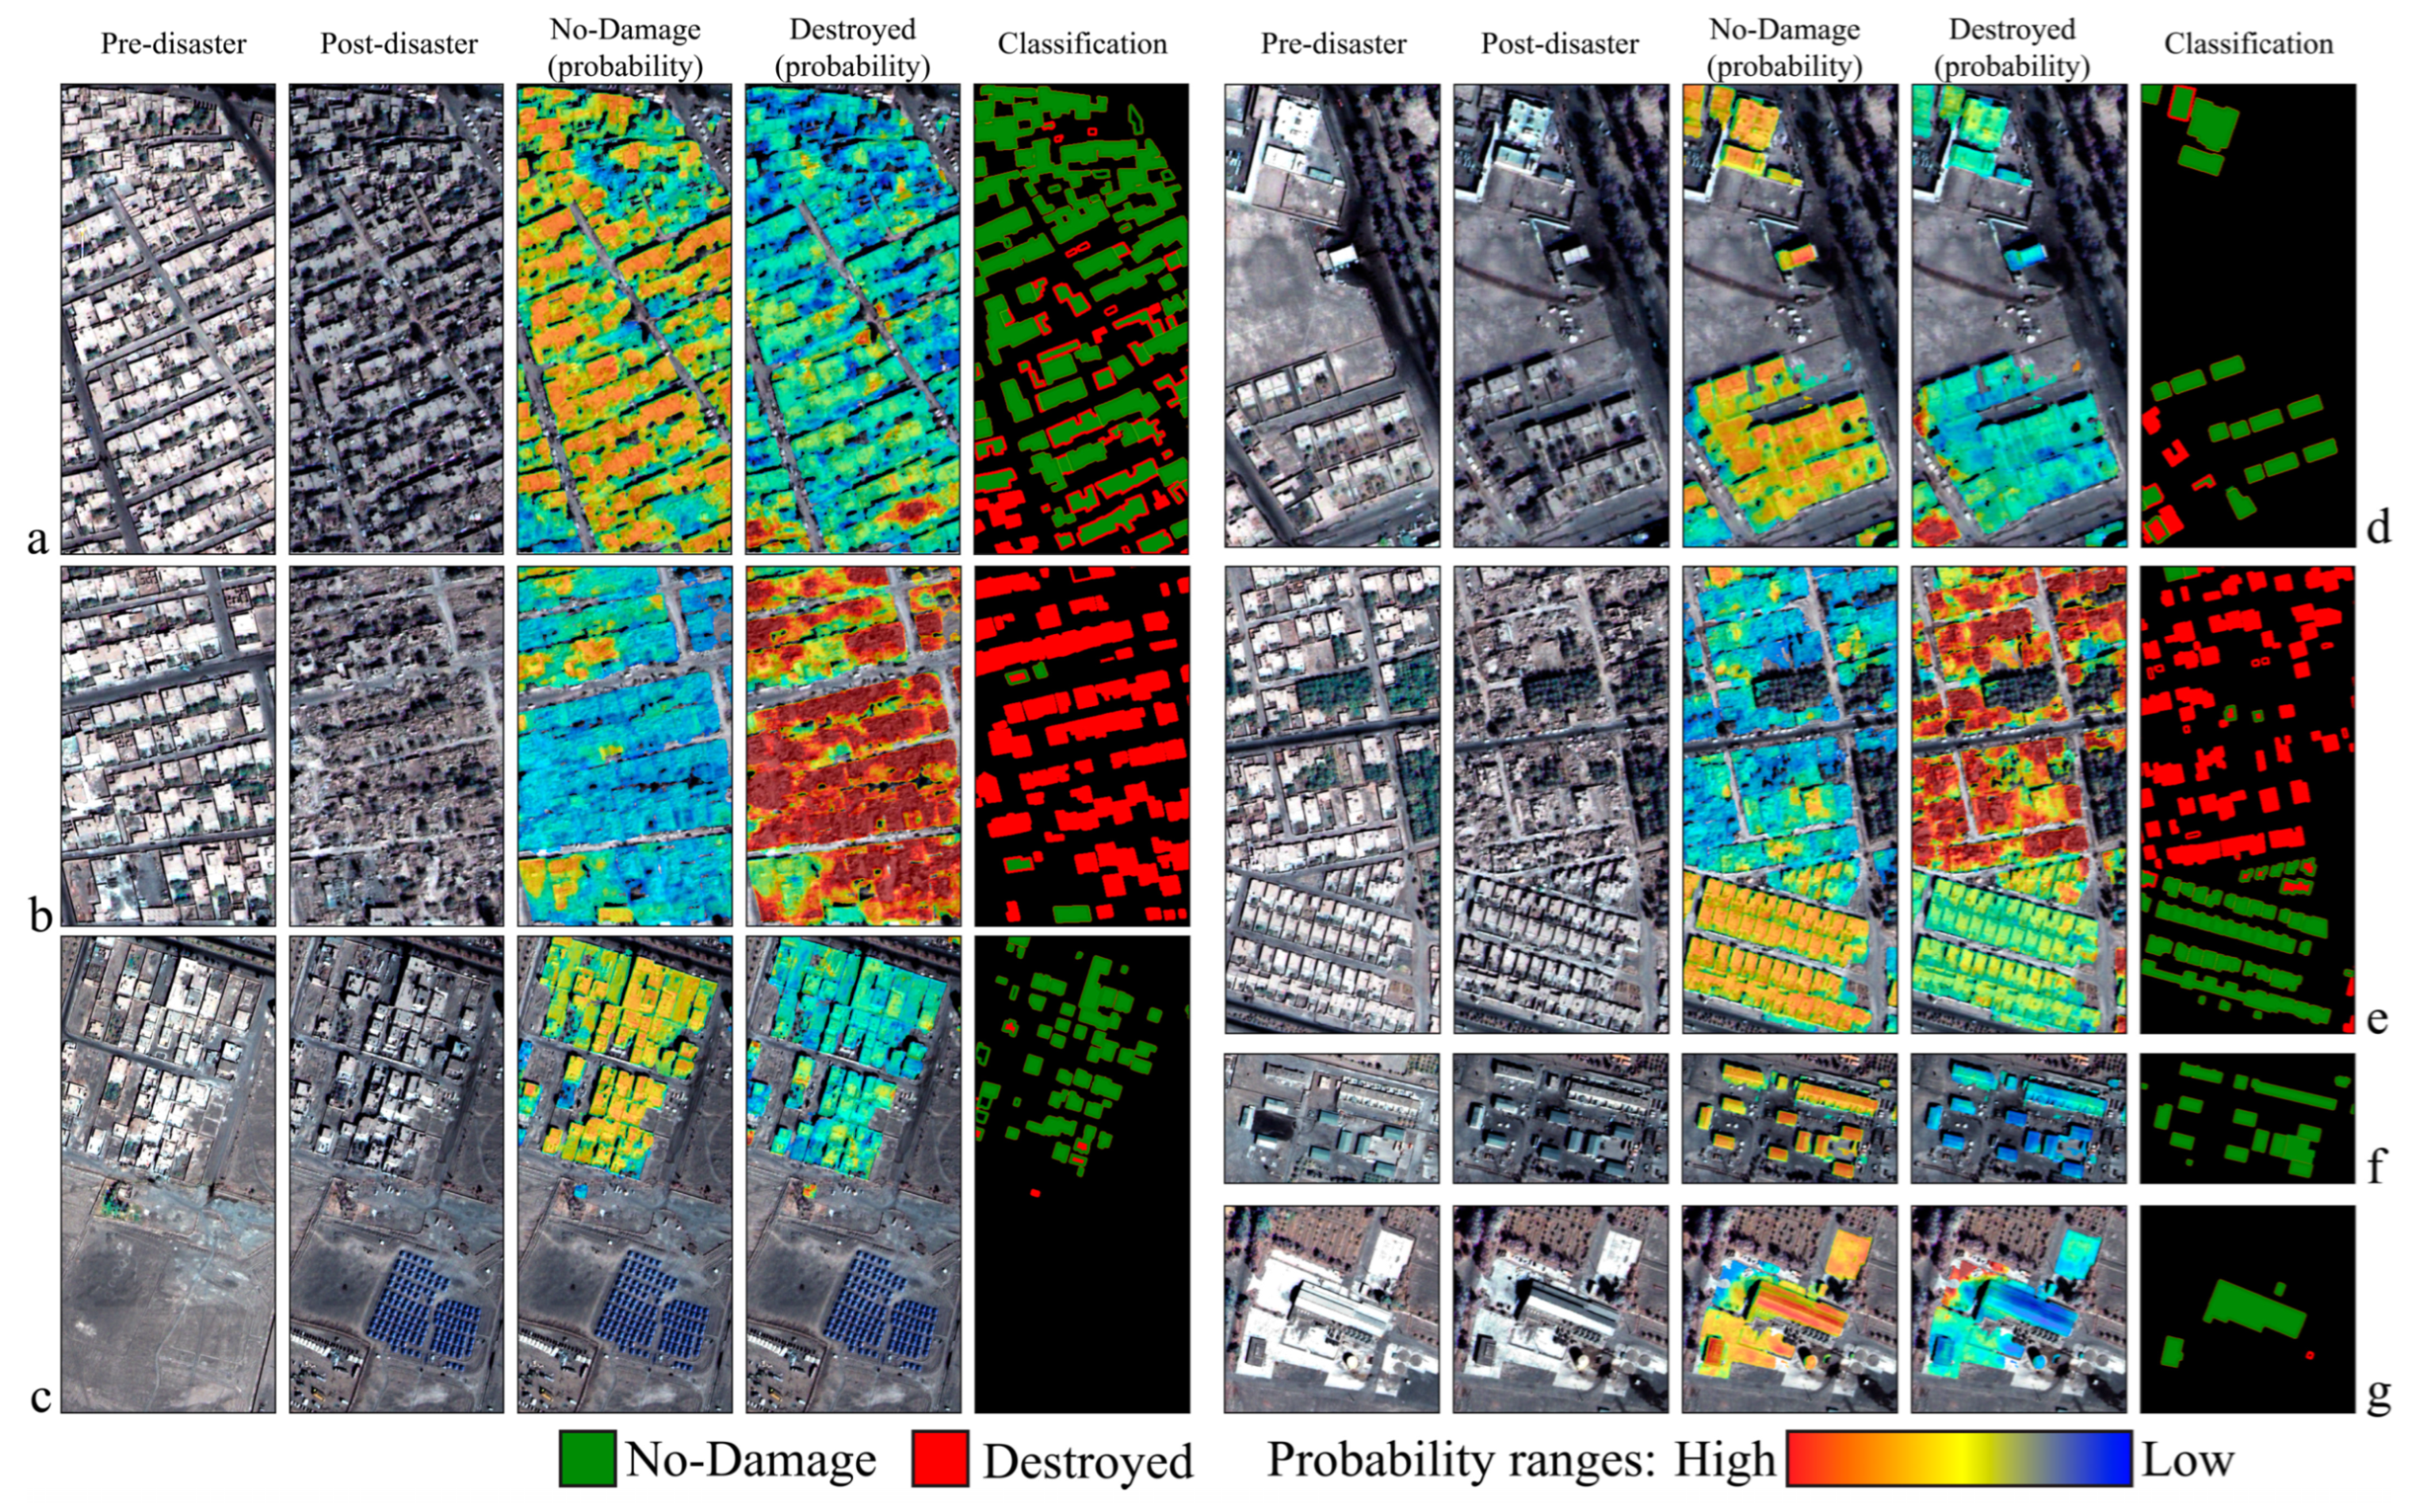
The qualitative comparisons are also displayed in
Figure 17, where the damage assessment model outputs for six sample images from the Test set are compared with their corresponding ground truth images. Visual investigation of the results indicated a higher localization and classification performance for the proposed models with EfficientNetB7-UNet architecture. The EfficientNetB7-UNet model with SKM added at the end of each branch had the best building damage assessment performance and outperformed other models. All models could predict destroyed and intact buildings with higher precision, while minor- and major-damaged buildings were the most challenging classes.
5.3. Transferability Analysis
Given the emergency disaster context, accessing real-time and appropriate annotated images from the current disaster events to train or fine-tune deep learning models is not always possible. Eventually, accurate annotation of images, even with a team of experts, is time-consuming and cannot be performed within a short time just after the disaster. In such conditions, a pre-trained model that is already trained on images from past disasters could be capable of generalizing to the images of the new disaster [
79] with no or less training effort. Here, the difficulty and complexity of the generalization problem lie in the variations between either of the datasets (i.e., images of the current disaster and those of previous disasters). Major sources of such variations could be the change of geographical region (e.g., differences in textures and urban structure) or acquisition attributes (e.g., differences in Sun elevation angle, satellite-looking angle, and acquisition time), which can result in different types of images compared to those that the predefined model was trained on.
To further study the robustness, generalization power, and transferability of our proposed method, we used another set of data, i.e., Bam, Iran earthquake images, which were not included in the xBD dataset. The results of applying our proposed model to the Bam city dataset are presented in this section. Differences between the Bam earthquake dataset and xBD are threefold:
Their acquisition conditions, i.e., time, geographical region, and satellites, are completely different. The xBD images were mostly acquired with Worldview-2 and -3 satellites from 2018 to 2021, while the Bam images were captured by Quickbird in 2003. Moreover, no instance of disaster events from Middle-Eastern countries exists in the xBD dataset.
Building types in Bam differ from those in xBD, with most of them being low-rise and compact, which were built in a dense tree-covered region;
There are almost no instances of earthquake-damaged buildings in the xBD dataset, except for only three damaged buildings in the Mexico earthquake, (see
Figure 2), meaning that our models were completely trained on natural disasters other than earthquakes.
Several previous studies concentrated on the binary distinction of building damages. Moreover, binary classification often satisfies the requirements of operational cases in emergency situations [
51]. On the other hand, it is essential to note that visual assessment of building damages and assigning damage categories on a 4-level scale from only satellite images is an uncertain and complex task. Minor- and major-damage classes are difficult to assess. Only those buildings with some destruction on their rooftops or damages distinguishable from surrounding debris can be confidently classified. Thus, we used a limited number of classes for the Bam scenario. Accordingly, minor- and major-damage predictions from classifiers were ignored, and a binary classification map was generated for the study area, including only no-damage and destroyed classes. Based on the pre-disaster images, almost all of the buildings were identified correctly in the localization stage, except for a limited number of false positive predictions due to the shape of buildings or the overlap of trees. For the task of damage assessment, based on the pre- and post-disaster satellite images, damage classes were identified precisely. The overall accuracy was 84%, and F1-score values for no-damage and destroyed classes were 80% and 87%, respectively, showing promising results for transferring damage assessment learning from previous disaster events to a new and unseen dataset.
Figure 18 demonstrates a combination of localization and damage assessment results on seven sample regions of Bam city, along with their probability maps derived from the proposed model. These maps show the probability of each pixel belonging to one of the two classes of destroyed or no-damage. Precise damage assessment results are visible for different regions. In order to enhance the classification results, we utilized the provided building mask to refine the final classification output. The refined binary damage assessment map is visualized in the last column. Each building is colorized red or green to show the destroyed or no-damage classes, respectively. Moreover, building borders are similarly colorized and overlaid to show the ground truth information for each building. Some features were identified in the Bam images that could negatively affect the predictions, including (1) yard walls of properties have guided the localization algorithm to think of yards as building regions and incorrectly assign building pixels to them, (2) dense and tall trees on some part of the study area, intensified varying illumination angles, have made difficult conditions for identifying the correct class for some pixels, and (3) using white materials in furnishing yards have mistaken the algorithm to think of them as buildings. However, the results demonstrated the applicability and robustness of the method over the unseen dataset of the Bam earthquake.
6. Discussion
This paper focused on designing and enhancing a two-stage UNet-based building damage assessment network to achieve accurate and precise building localization and damage classification, which led to at least a 5% increase in the evaluation metrics. Pretrained backbone feature extractors were utilized to extract deep representations from pre- and post-disaster satellite images. Simultaneously, the SKM, conceptualized from the idea of adaptive receptive fields, was introduced into the UNet architecture to enhance the performance of the model. Fair comparisons, in either of the localization and damage assessment stages, were made between the proposed model and state-of-the-art UNet-based architectures. Experimental analysis showed that the proposed framework outperformed existing CNN-based methods, proving its effectiveness. In the first stage, as illustrated in
Figure 14, the localization results obtained from the proposed model outperformed other models in terms of all the evaluation metrics. The proposed model resulted in fewer false positive (false alarms) and fewer false negative pixels. In addition to large buildings, which are simpler for identification, sparse and smaller buildings in non-urban regions or compact buildings in dense urban regions were also correctly located.
The second stage, which was conceptualized based on change detection approaches, used a Siamese-based two-branch UNet architecture. The SKM was also utilized in this stage to improve damage classification results. Training and validation metrics, along with visual investigations, demonstrated the superior performance of the proposed model with respect to other methods. It was observed that although the models successfully identified damaged portions of buildings, they were not accurate in assigning them to the relevant classes. This mostly happened in buildings with minor- or major-damages classes where some part of the building is usually damaged. This finding highlights a limitation of the current models in handling complex damage prediction tasks and suggests areas for future research and development.
It should be noted that the classification of all four damage categories was difficult, leading to misclassifications in minor- and major-damage classes compared to no-damage or destroyed classes, which were mostly classified correctly. This behavior can be attributed to several reasons. Firstly, there was a significant imbalance in the number of samples between damage categories. Secondly, other sources of uncertainty and complexity in the dataset, such as relying solely on satellite images, could have contributed to the misclassification issue. It is worth mentioning that even with high-quality images, evaluation of damage categories for buildings using only satellite images is a complicated task, as the assessment is limited to the building’s roof, while some categories of damage in natural disasters affect walls and building floors. The addition of extra degradation parameters such as cloud coverage, varying viewing angles, as well as changes in sun elevation angle increase the level of difficulty in the damage classification procedure. In this regard, for a better understanding of these sources of uncertainty,
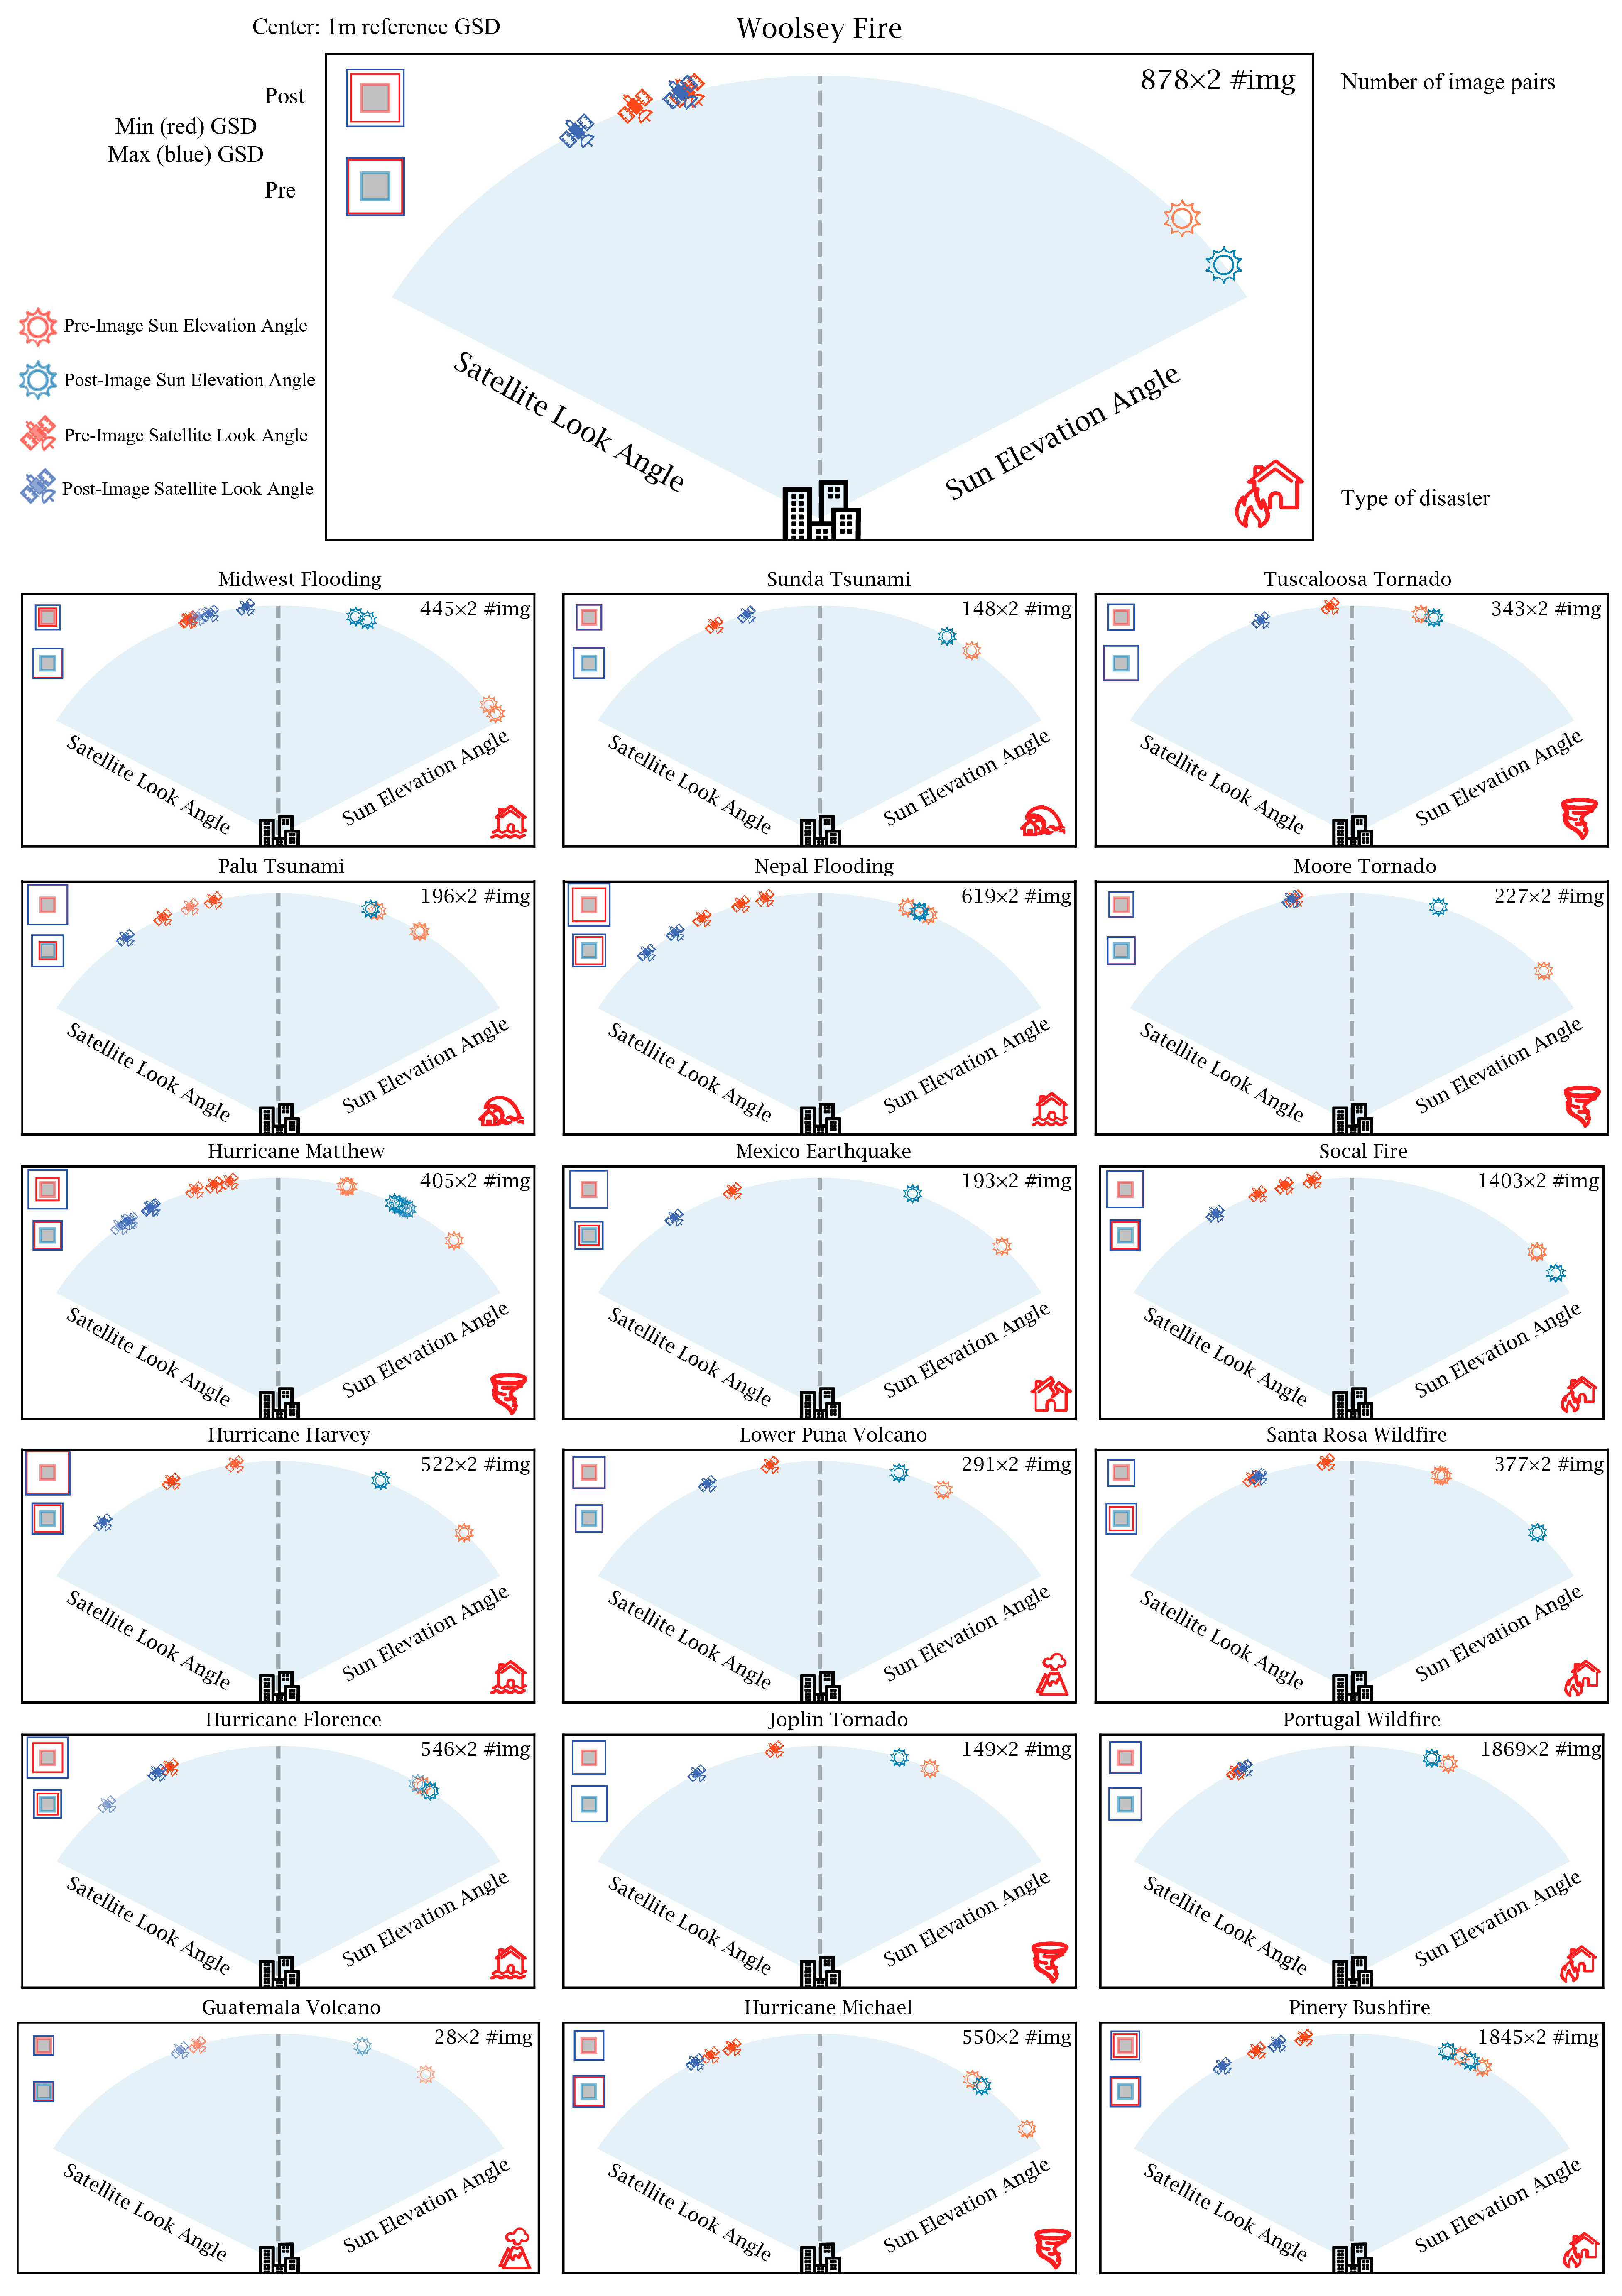
Figure 19 visualizes the image acquisition conditions in pre- and post-disaster images for all 19 disaster events in the xBD dataset. This has been conducted by schematically demonstrating the sun and satellite positions, as well as the variations in spatial resolution, before and after each disaster. For each disaster event, the number of image pairs (top right), type of disaster (bottom right), and pre-/post-disaster sun and satellite angles are visualized in each box. Focusing on satellite look angles before disasters (the blue satellites) reveals that most of the images were taken from near-nadir angles, which results in sharper images, while in post-disaster conditions (red satellites), images were mostly taken during emergency situations that satellite tracks were not necessarily crossing the region of interest and look angles tend to be higher. Another aspect of image attributes in the xBD dataset is the time gap between pre- and post-disaster image acquisitions, which results in different sun elevation angles (the red and blue Sun symbols). This will result in dissimilar shadow lengths and directions, which could affect the inference procedure. Moreover, in order to show that ground sampling distance (GSD) was not consistent across images in xBD, two scales are visualized on the top left corner of each box. A 1 m
2 GSD is in the middle, and the larger squares relatively show how much the actual GSDs in each imaging scenario vary concerning the reference scale. The closer the boxes are to the reference central box, the less variation exists in the imagery resolutions. Furthermore, different box sizes in pre- and post-disaster cases explain the complexity of GSD variations in the xBD dataset. This scale simplifies the understanding of different resolutions in pre- and post-disaster situations.
For the first time,
Figure 19 provides a detailed representation of the xBD dataset, revealing various associate imbalance attributes, including different Sun elevations, off-nadir-looking angles, and dissimilar GSDs in pre- and post-disaster images. One of the key contributions of this study was that we investigated the correlations between these attributes and the performance of our proposed model in detail. Accordingly, multiple experiments were designed to analyze how each parameter could affect the performance of our proposed model in either the localization or classification stages. To address this investigation, we identified three parameters of (1) Sun elevation angle, (2) GSD, and (3) satellite off-nadir looking angle, as the influencing parameters on the localization stage performance. Similarly, three relative parameters between pre- and post-disaster images, including (1) differences in Sun elevation angle, (2) differences in GSDs, and (3) differences in off-nadir angle, along with the disaster types, shaped the structure of four influencing parameters on the classification results. In order to be able to conduct these experiments, we should have chosen some thresholds for each of the influencing parameters to create a comparison basis and assess the performance of the model. In this regard, we investigated the distribution of each variable by studying its histogram.
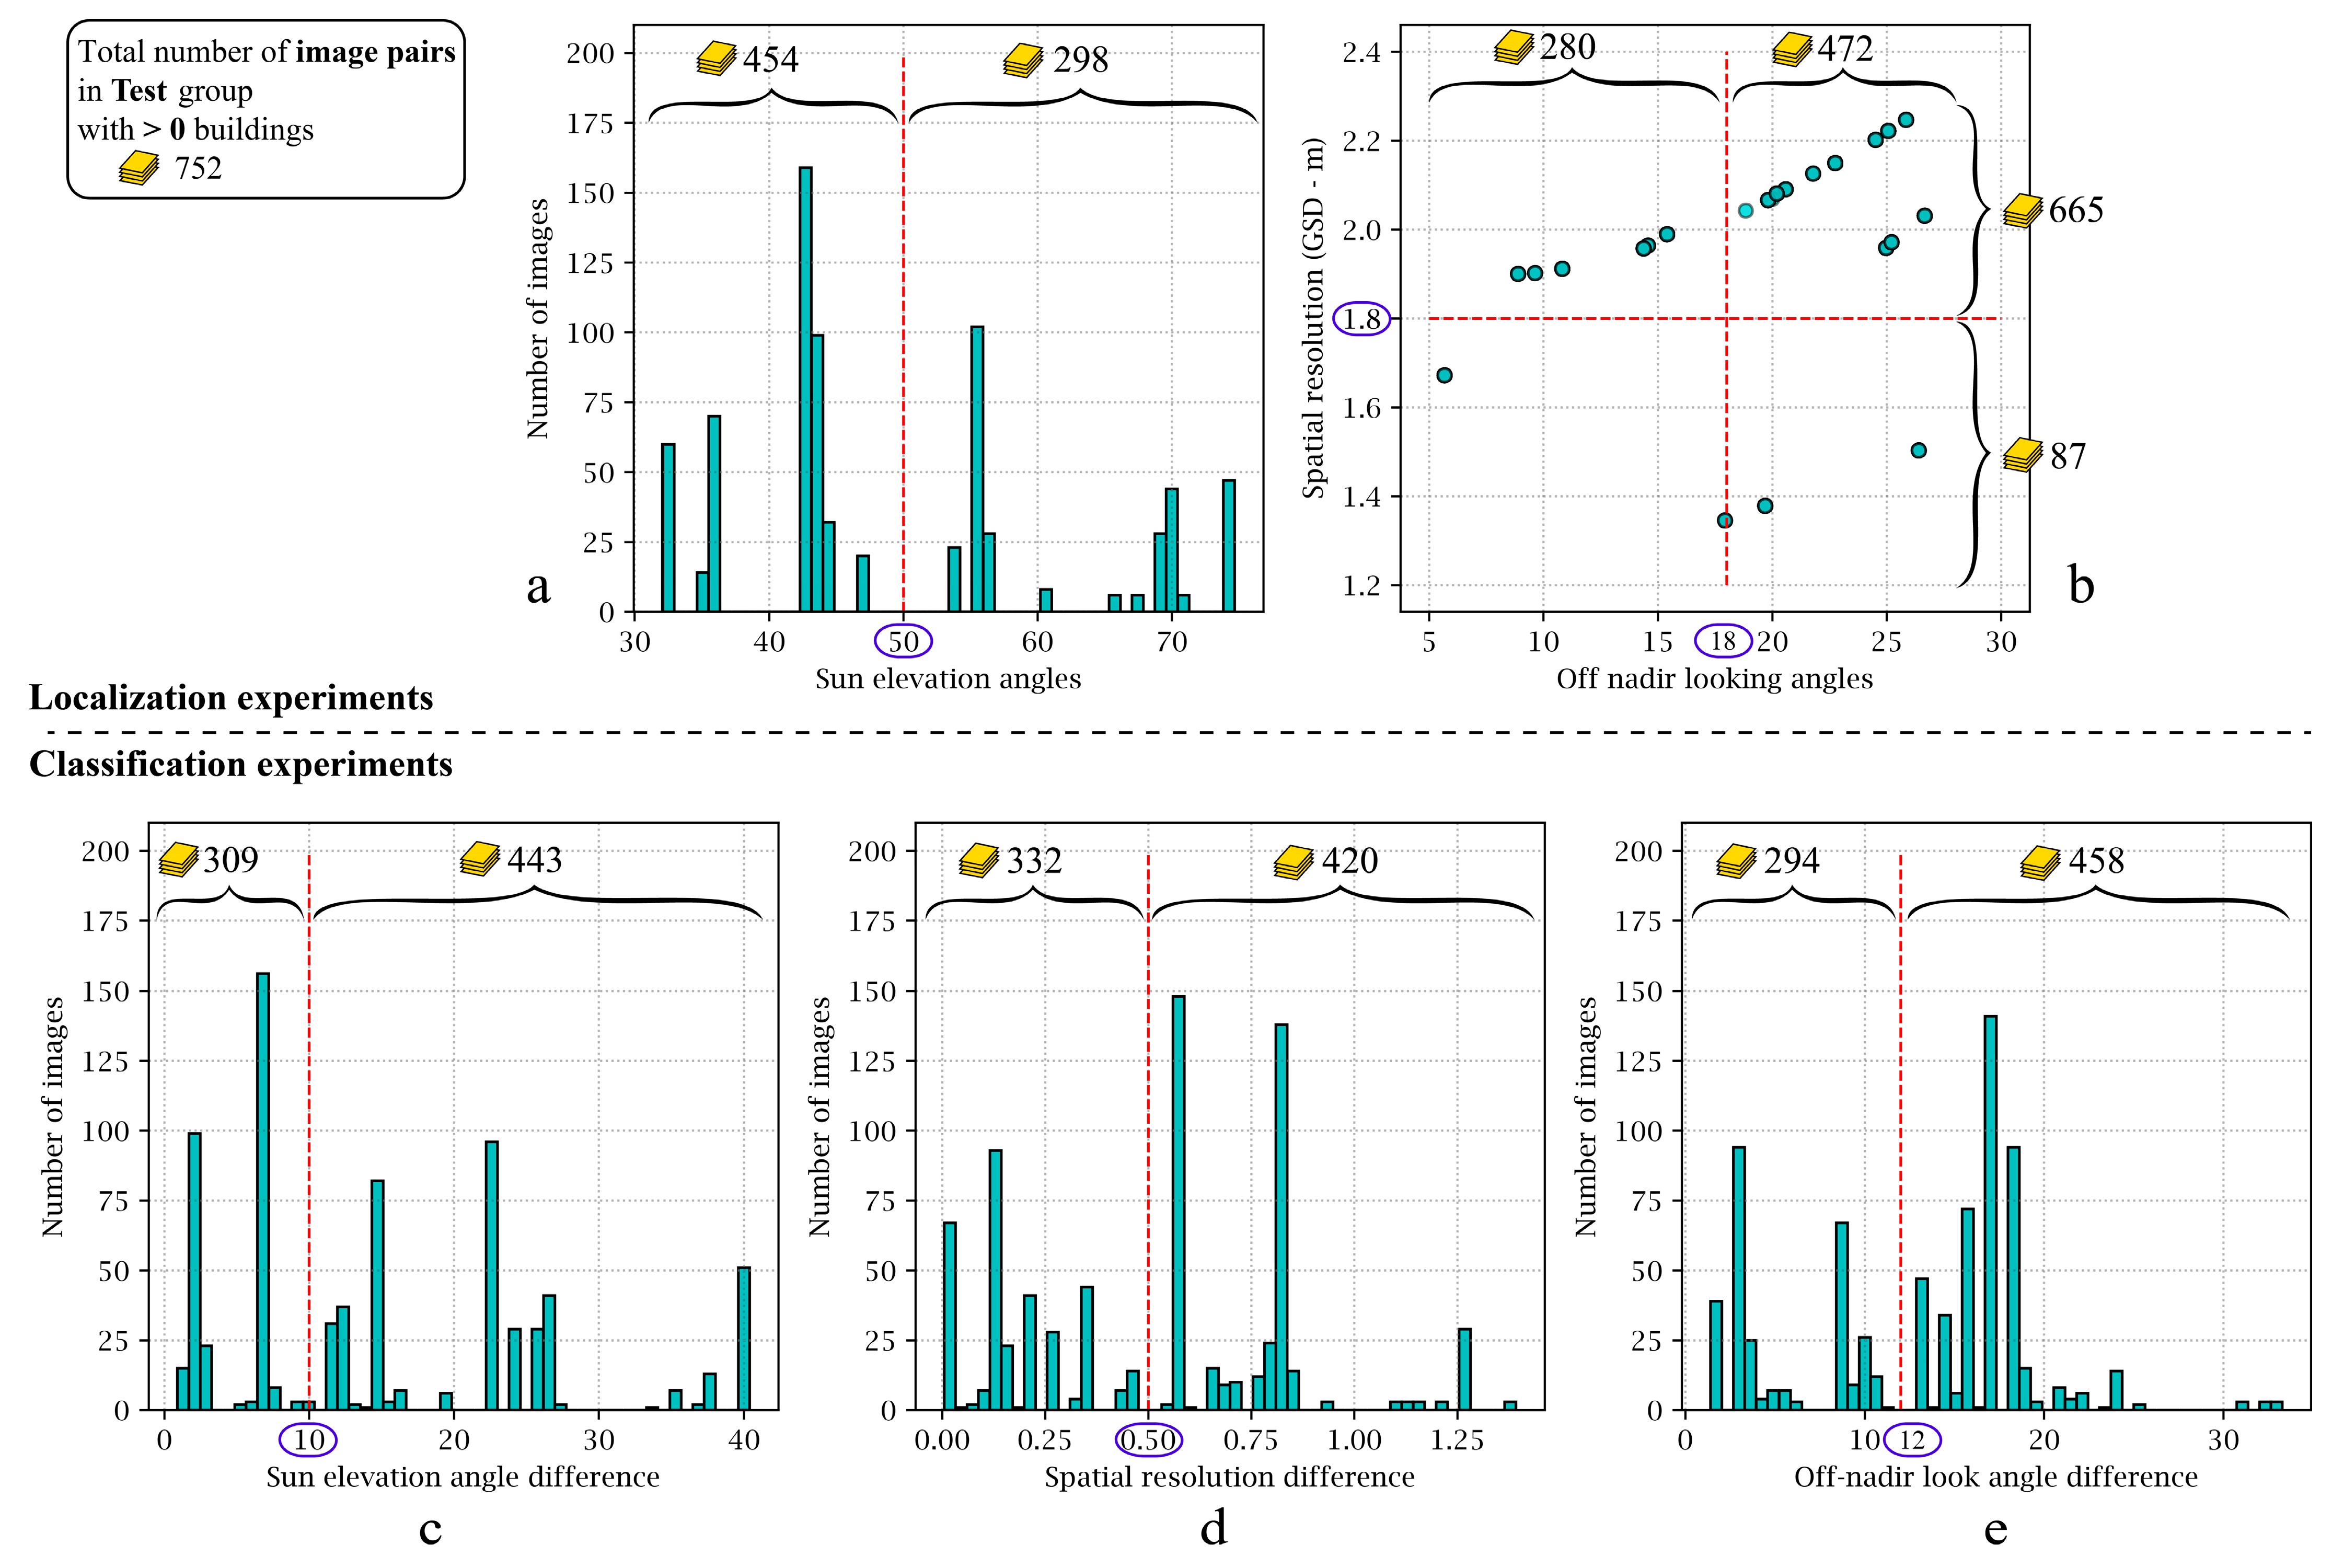
Figure 20 illustrates the histogram of the above-mentioned variables. Since image resolution and off-nadir-looking angle have a physical relationship with each other, a bi-variable scatter plot was generated for further investigations. With the aim of comparing the localization and classification results, we chose thresholds that make distinctive separations between the variables’ values. For instance, we decided on 50° as the separation value for the pre-disaster Sun elevation angles, making an approximate 10° separation between the two groups so that their comparison would be more reasonable and meaningful. Moreover, on top of each graph, the number of images that fall within the threshold limits is illustrated. We only employed Test set images with more than one building for these experiments, which resulted in 752 image pairs. It is important to recognize that the varying number of images in each experiment was a factor beyond our control. Therefore, it is important to understand this limitation and its impact on the analysis and results; thus, it should be considered when interpreting the findings.
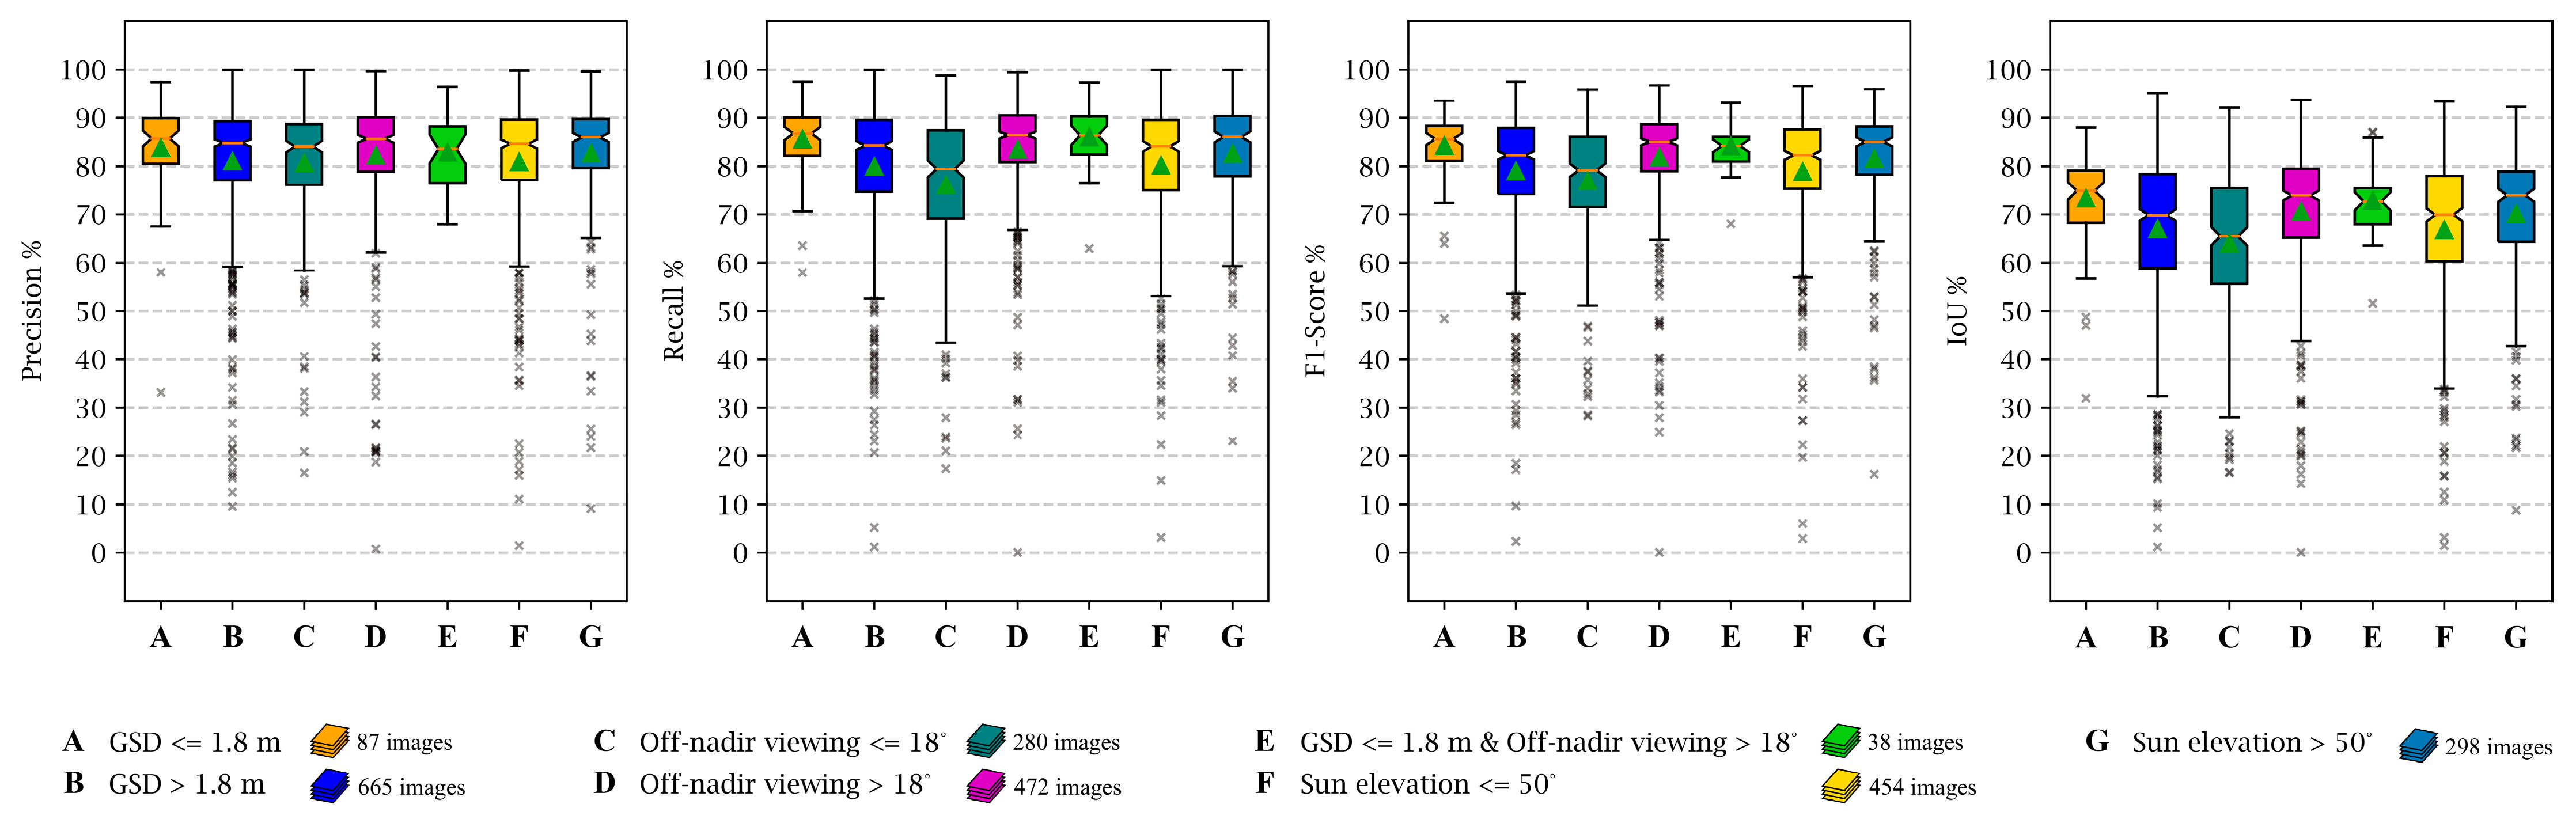
We exclusively utilized the pre-disaster images to analyze the effect of parameters on the localization stage performance. The effect of parameters on the quality of localization results was studied in seven different configurations which are illustrated in
Figure 21. The results illustrated that experiment A (images with 1.2 m < GSDs ≤ 1.8) achieved the best performance. This highlights the importance of using high-resolution images for building footprint localization. Conversely, the worst performance was obtained when utilizing close-to-nadir images (images with off-nadir angle ≤ 18°) in experiment C. The large difference between values obtained from experiments C and D suggests that compared to nadir images, oblique satellite images could generate more accurate building masks. Experiments F and G, with a subtle difference in their performance, show that shorter shadows (images with Sun elevation > 50°) obtain better masks.
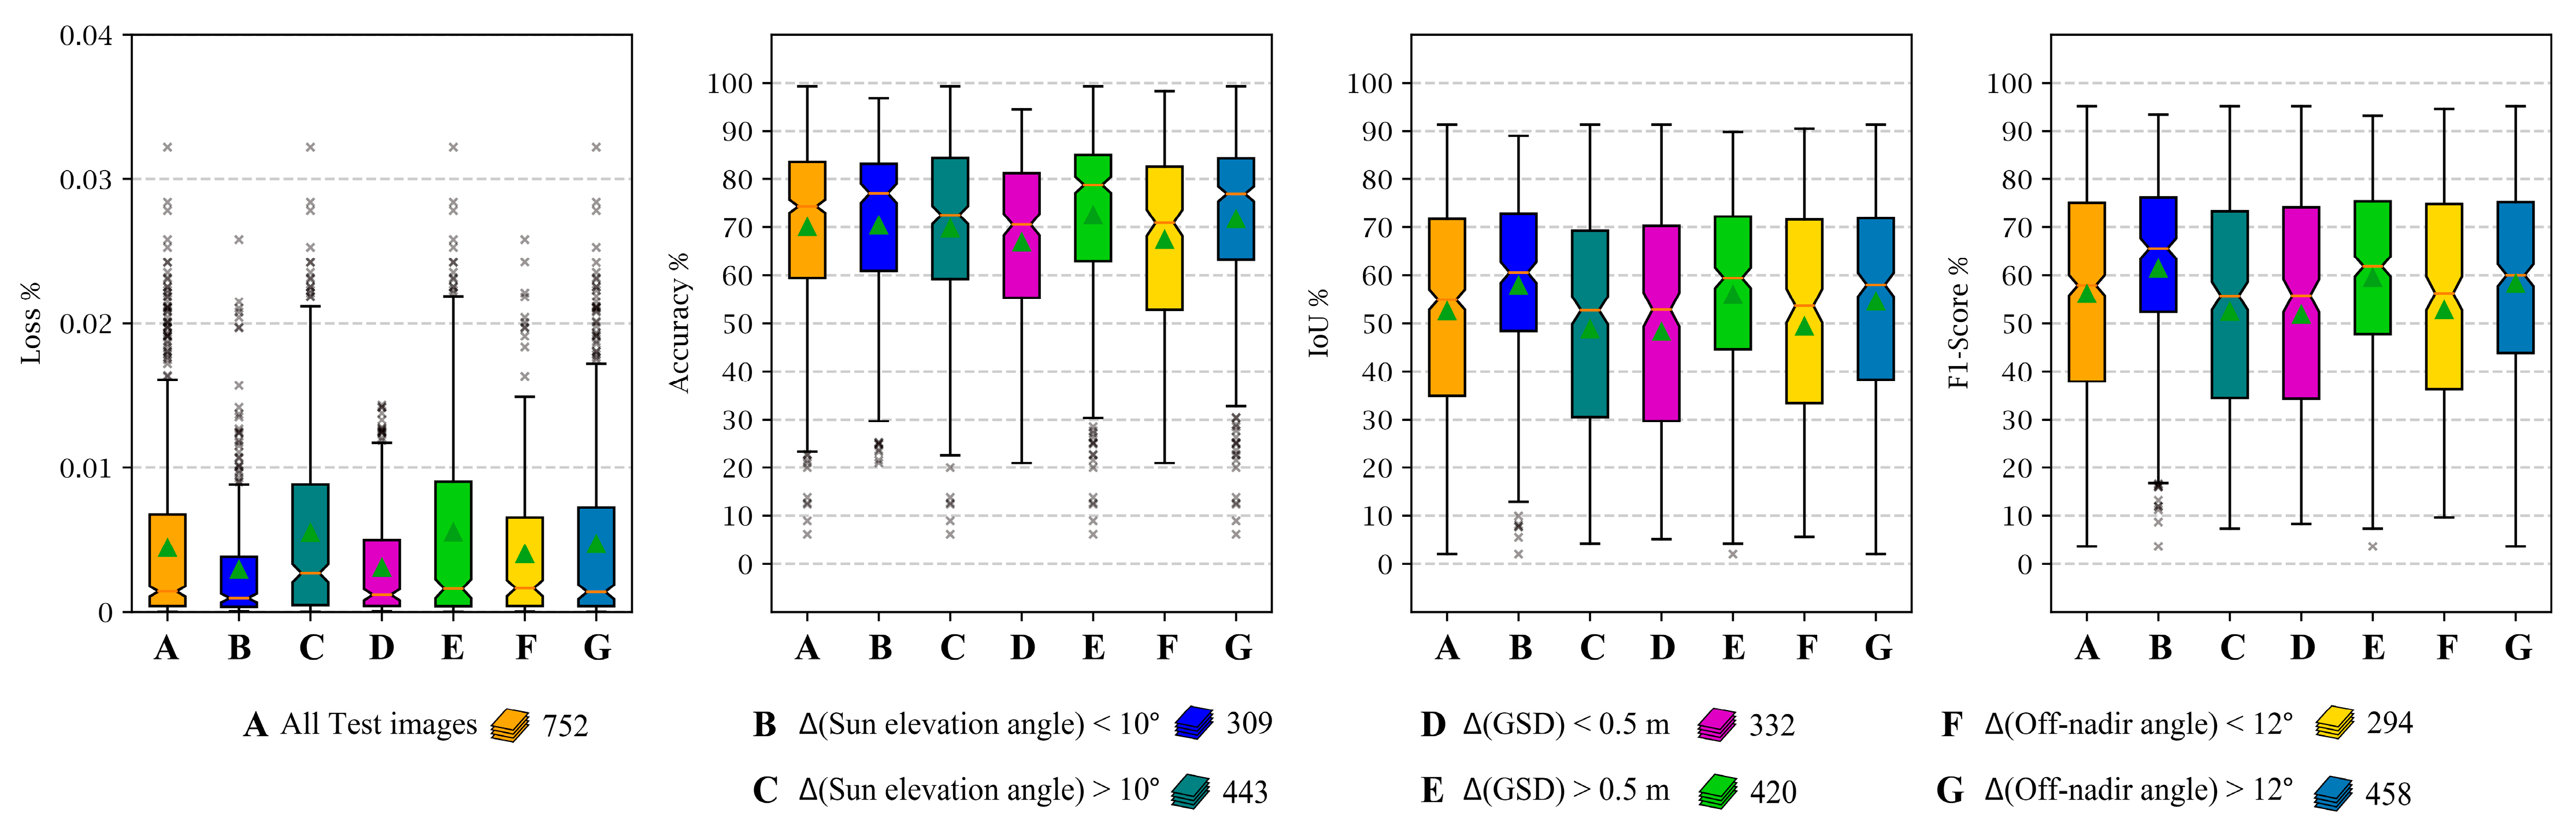
In order to study the effect of relative parameters on the classification stage performance, we should have used both the pre- and post-disaster images. In these experiments, we investigated the relative relation between pre- and post-disaster satellite images, such as the differences in Sun elevation angle, differences in GSD, or differences in off-nadir angles.
Figure 22 illustrates the evaluation metrics computed from each experiment. Although the results have shown approximately the same performance in all configurations, satellite images with more similar Sun elevation angles could result in higher accuracy.
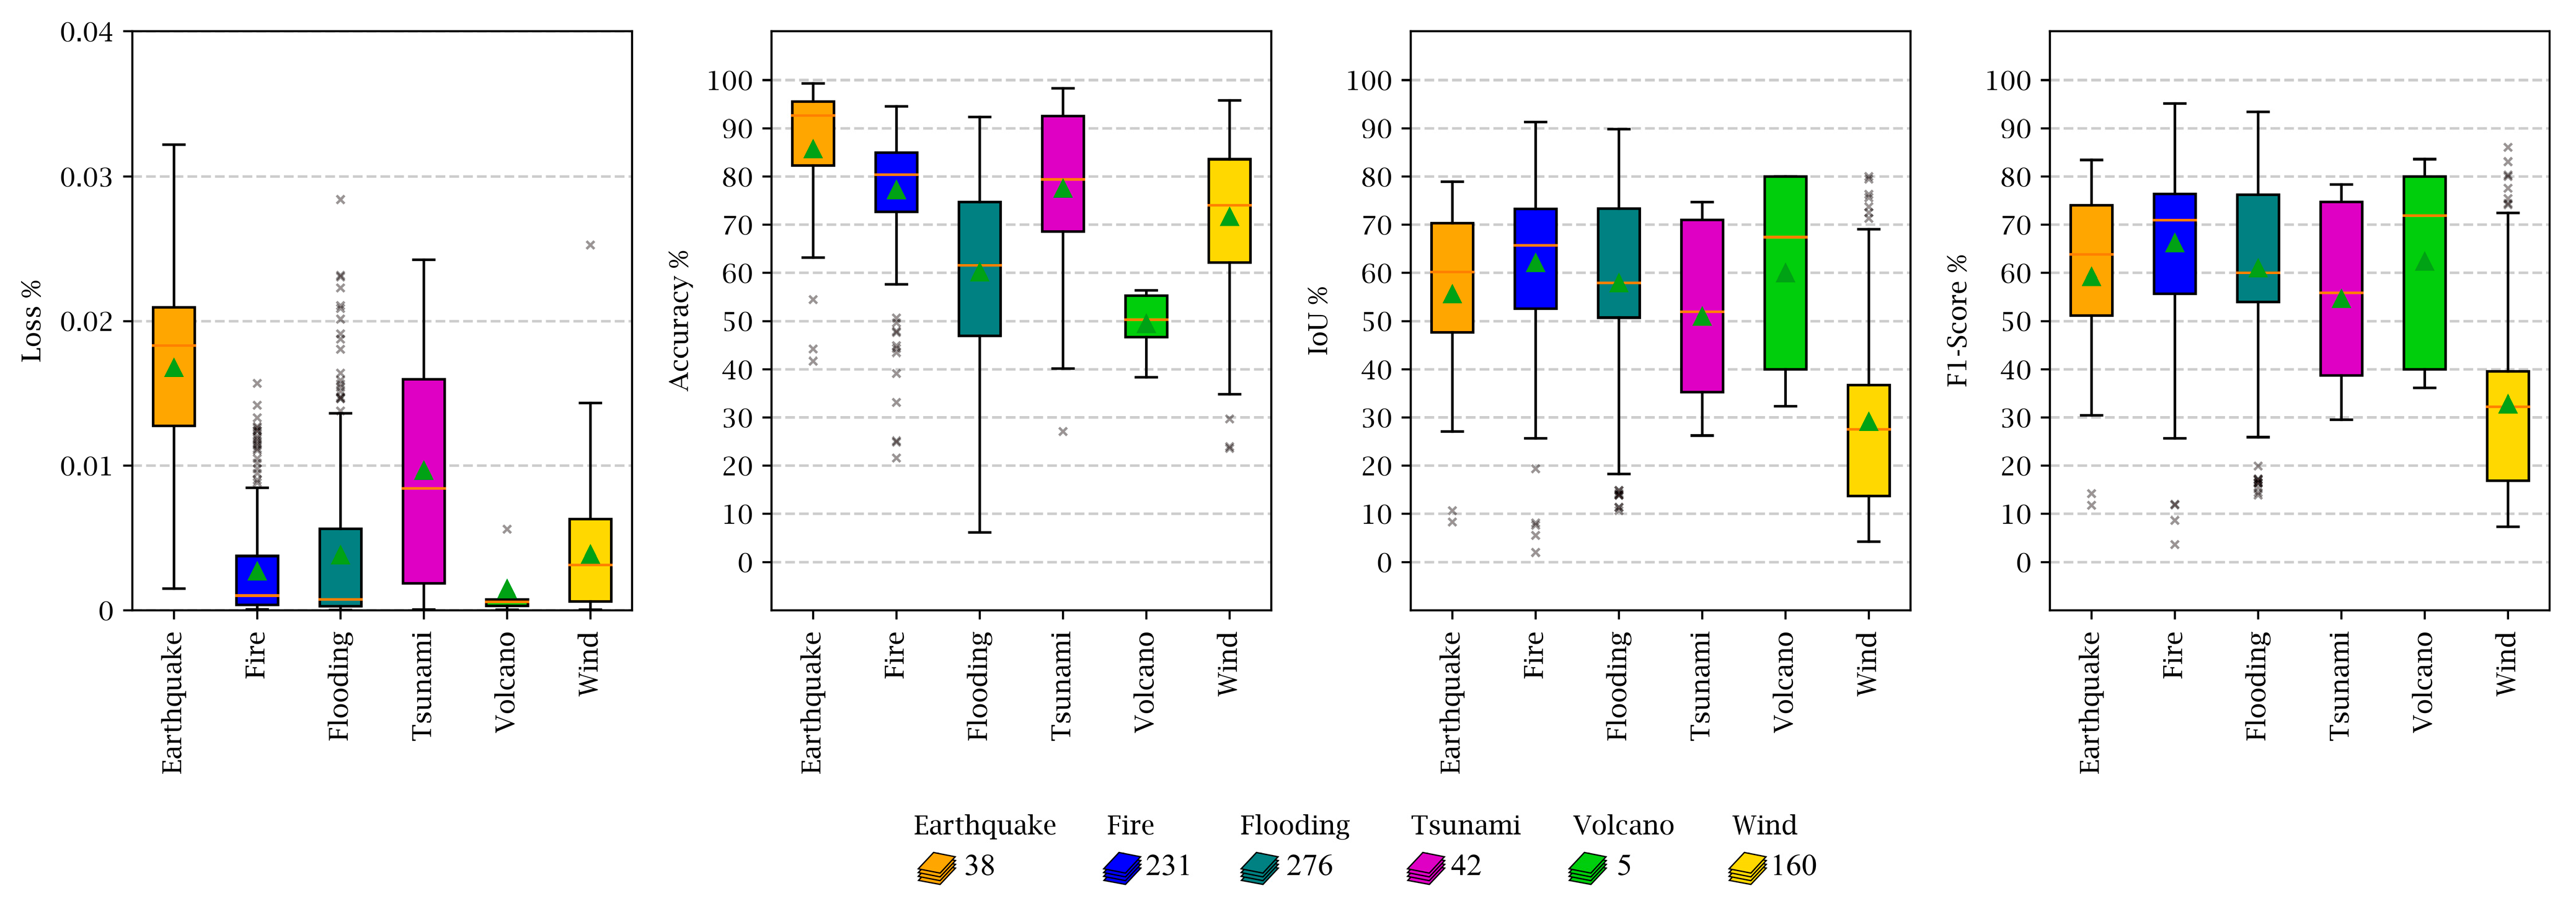
Finally, we investigated the model’s performance based on individual natural disaster types. Accordingly, images from different events such as fires, earthquakes, volcanic eruptions, tsunamis, or winds were separately fed into the model, and the evaluation metrics were calculated (see
Figure 23). Fire-related images obtained the best performance when considering all the evaluation metrics simultaneously. One reason for this achievement is that damaged buildings in fire-related images are mostly destroyed, and their damage assessment was performed more confidently. Volcanic eruption events had the least number of images (only five images), and their evaluation was not statistically reliable. Wind events had experienced the worst performance in damage assessment and classification. One reason for this behavior could be the types of damage that occur to buildings after typhoons and tornados, which are different from other disasters.
According to our experiments, several key factors can critically affect the performance of deep learning semantic segmentation networks for building damage assessment. Either the data imbalance towards specific classes or specific disaster types, such as the case in the xBD dataset, can decrease the training performance. Although the architecture and depth of deep networks are important parameters, other hyperparameters such as loss function, activations, or attention modules play major roles in model performance. In contrast to the superior performance of our proposed EfficientNetB7-SK-UNet in experiments, our model still faces some limitations. One of the shortcomings of our methodology is its weakness in classifying minor- and major-damaged buildings. This can be further improved by training on a more diverse dataset that contains more instances of these complicated classes. Another one is that pancake collapses of multistory buildings or façade damages cannot be assessed from satellite images [
29,
30]. Damage assessment based on satellite images is limited to near-nadir observations, and most of the time, only rooftop damages can be detected. Similarly, although the xBD dataset is currently the largest dataset for building damage assessment, the imbalance of classes and disaster types, as well as complexities in the pre- and post-disaster image acquisition conditions, makes it a challenging dataset to support general solutions. Therefore, huge efforts are still required to generate high-quality annotated datasets for building damage assessment. Multi-modal datasets that leverage the synergistic potential of multiple sensors, such as SAR or LiDAR, along with high-resolution optical satellite images or oblique UAV imagery, should be generated. Such datasets can provide more comprehensive and accurate information for damage assessment and disaster response, significantly contributing to damage assessment operations and the development of the scientific community. Finally, training deep neural networks, especially the semantic segmentation models, usually takes up to several hours and requires large numbers of annotated data. This is not suitable for real-world disaster situations where fast decision-making is critical. Developing more robust and lightweight models will help in tackling these limitations.
Urban planning and infrastructure monitoring are important applications of remote sensing technologies and satellite imagery. In this regard, utilizing satellite imagery as a valuable source for monitoring urban changes can help plan for future developments. Accordingly, the dual-branch UNet architecture, which proved its applicability in semantic segmentation, can be used in further developments for building footprint localization and change detection applications using bi-temporal satellite images. Developing useful and automated applications for handling various real-world problems, such as those mentioned above, requires robust, efficient, and scalable algorithms that can be used with less training effort. Accordingly, appropriate hardware, i.e., more powerful computing resources, empowered with lighter networks that can train faster while achieving the same performance as heavy models, are the future of artificial intelligence applications.


