Article

Comparison of Differences in Actual Cropland Evapotranspiration under Two Irrigation Methods Using Satellite-Based Model

1
State Key Laboratory of Efficient Utilization of Agricultural Water Resources, Beijing 100083, China
2
National Field Scientific Observation and Research Station on Efficient Water Use of Oasis Agriculture, Wuwei 733009, China
3
Center for Agricultural Water Research in China, China Agricultural University, Beijing 100083, China
4
Research and Extension Center for Irrigation and Agroclimatology (CITRA) and Research Program on Adaptation of Agriculture to Climate Change (A2C2), Faculty of Agricultural Sciences, University of Talca, Talca 3460000, Chile
*
Author to whom correspondence should be addressed.
Remote Sens. 2024, 16(1), 175; https://doi.org/10.3390/rs16010175
Submission received: 22 November 2023 / Revised: 26 December 2023 / Accepted: 28 December 2023 / Published: 31 December 2023
(This article belongs to the Section Remote Sensing in Agriculture and Vegetation)

Abstract

:
Remote sensing technology is widely used to obtain evapotranspiration (ETa), but whether it can distinguish the differences in farmland energy balance components and ETa under different irrigation methods has not been studied. We used Landsat 8 data as the primary dataset to drive the METRIC model and inverted the surface parameters and ETa of the Shiyang River Basin from 2014 to 2018. After improving the METRIC model using Ta obtained by the regression method instead of interpolation to calculate the net radiation flux (Rn), R2 was improved from 0.45 to 0.53, and the RMSE was reduced from 61 W/m2 to 51 W/m2. The ETa estimation results on satellite overpass days performed well, with R2 equal to 0.93 and RMSE equal to 0.48 mm when compared with the Eddy covariance method (EC) observations. Subsequently, the different growth stages and daily average ETa estimates of maize were compared with three observations (water balance, WB; Bowen ratio and energy balance method, BREB; and EC). The daily estimates of ETa correlate well with the observations of BREB (R2BI = 0.82, R2DI = 0.92; RMSEBI = 0.46 mm/day, RMSEDI = 0.32 mm/day) and EC (R2BI = 0.85, R2DI = 0.92; RMSEBI = 0.45 mm/day, RMSEDI = 0.34 mm/day), and the estimation for drip irrigation was found to be better than for border irrigation. The total accuracy of the ETa estimation on the five-year overpass day of maize farmland reached R2 = 0.93 and RMSE = 0.48 mm. With sufficient remote sensing data, the 4-year average ETa of maize was 31 mm lower for DI than for BI, and the mean value of ETa obtained from the three observation methods was 40 mm. The METRIC model can be used to distinguish ETa differences between the two irrigation methods in maize farmlands.

1. Introduction

Evapotranspiration (ET) is the largest outgoing energy flux associated with the water cycle on Earth and is critical for understanding hydrological and ecological processes and the causes of global energy imbalances [1,2]. Farmland is one of the main issues in regional research on climate change and sustainable development and is a hot topic of international concern [3,4]. Water cycle intensification due to climate change can drive dry regions and cause more frequent extreme events, negatively impacting global agricultural production [5,6,7,8]. Northwest China is dry and water deficient. Therefore, water consumption for crop growth is mainly dependent on irrigation supply [9]. Ninety percent of agricultural water consumption is used for irrigation [10], almost all of which enters the atmosphere for evapotranspiration [11,12]. Therefore, it is necessary to map the actual evapotranspiration quantitatively (ETa) from cropland on a regional scale to understand the distribution and characteristics of agricultural water consumption in arid areas.
The assessment of ETa is influenced by land cover type, soil moisture, and meteorological conditions [13]. Traditional observation methods of farmland ETa, such as water balance, micrometeorological methods, and plant physiology methods, provide methods to obtain point-scale ETa on a uniform surface. However, the extrapolation of point-scale data to larger spatial scales involves biases that are difficult to correct due to the natural dynamics and regional heterogeneity of environmental and surface conditions [2,14,15,16]. In agricultural and irrigation applications, the crop coefficient method is often used to narrow the range of ETa to crop evapotranspiration (ETc) [17]. ETc is usually obtained by multiplying the reference evapotranspiration (ETr) by a dimensionless attenuation coefficient known as the crop coefficient (Kc). The ETr estimation models in the literature can be broadly categorized into (1) full physical models based on the principles of mass and energy conservation, (2) semi-physical models considering the principles of mass and energy conservation, and (3) empirical relational and machine learning black-box-based models [18,19]. ETr is often calculated from meteorological data using the FAO-56 Penman–Monteith (PM) modeling approach recommended by the Food and Agriculture Organization of the United Nations (FAO) [20]. Kc can be determined based on the crop type and stage of growth and is subject to variations caused by different environmental conditions [21,22]. However, it is unclear whether the actual crop type and growth conditions are consistent with those represented by idealized Kc values in arid regions. In addition, the application of the Kc method over large areas can be limited by its inability to determine the growth stages of multiple crops [23,24]. With the rise of intelligent algorithms and remote sensing technology, which has large-capacity and large-scale data collection characteristics, high spatial and temporal resolution Earth observation data can be calculated to map the spatiotemporal changes in ETa [22,24,25].
Evapotranspiration can be estimated using two or more consecutive satellite images that provide the spatial distribution of the required factors, regardless of soil conditions, crops, and farm management [26]. Remote sensing evapotranspiration models can be classified into two categories, single-source and dual-source, depending on the residual energy balance theory for the soil–plant–atmosphere interface [27,28]. The single-source model treats soil and crop vegetation as a whole, whereas the dual-source model separates soil and vegetation based on vegetation indices [29]. Both types of models generally estimate the latent heat flux (LE) from the residual term of each image pixel, which is obtained using net surface radiation (Rn) minus soil heat flux (G) and sensible heat flux (H) [25,30]. When the auxiliary data are sparse, the single-source model can provide higher accuracy than the dual-source model because it requires less parameter input [28,29].
Allen et al. [31] proposed mapping evapotranspiration at a high resolution with an internalized calibration (METRIC) model based on the Surface Energy Balance Algorithm for Land (SEBAL) model [32]. The METRIC model has several advantages and improvements over other single-source models.(1) This model redefines the rules for estimating H under extremely cold and hot conditions by introducing ETr as a ground reference. (2) The model considers elevation, convection, and wind speed and also improves the application of the model in areas with large terrain fluctuations and the extension method of instantaneous ET [33,34,35]. (3) In the METRIC model, the linear relationship between the near-surface temperature gradient (dT) and surface temperature (Ts) was calibrated using the inverse model under an extreme condition (CIMEC) process and theoretically defined extreme hydrological conditions (cold, hot), eliminating the need to map H with air temperature (Ta) within the modeling domain. Furthermore, the CIMEC process excludes potential biases related to surface energy balance components (SEBCs), radiometric corrections, and model assumptions [33]. (4) Initially, the METRIC model was designed for Landsat satellite imagery to maximize the accuracy of evapotranspiration estimates [28]. (5) Globally, this model has been successfully implemented in multiple irrigated agricultural areas and is considered effective for providing spatially distributed ET [36]. Current research has focused on the development of ETa estimation tools that use simpler platforms to improve the range of model use and estimation accuracy [37].
Ensuring high-quality and sustainable development of agricultural water use is necessary to solve the main problem of water use in the Shiyang River Basin in the arid area of northwest China. Maize is a widely distributed crop that adapts to the local climate. Border irrigation (BI) is still widely used as a traditional irrigation method in corn farmlands in northwest China. Compared with drip irrigation (DI), BI results in high soil evaporation and lower irrigation water use efficiency [38]. With the development and promotion of water-saving technology, many studies have compared the impacts of the two irrigation methods. Previous studies have proved that DI can accelerate the growth of maize and reduce water consumption [39]. The accuracy of remote sensing technology for obtaining ETa has been verified in many cases. However, can remote sensing technology detect ETa differences caused by different irrigation methods in maize croplands?
Therefore, the METRIC model was coded on the Google Earth Engine (GEE) platform to estimate various surface parameters using Landsat 8 images as the primary data source in this study. After the accuracy of the instantaneous surface energy fluxes was verified, the SEBCs of maize farmlands under BI and DI were compared. In addition, the accuracy of the ETa estimation at the satellite overpass days and at each growth stage obtained from the METRIC model was verified. Finally, the ability of remote sensing to discriminate differences in ETa in maize farmlands under different irrigation methods was assessed. This study provides a basis for determining whether satellite remote sensing can be utilized to accurately monitor farmland in the future.

2. Materials and Methods

2.1. Study Area

The Shiyang River basin is located in the arid region of northwest China, with a coordinate range of 101°40′–104°20′E and 36°30′–39°30′N, an area of 41,600 km2, and an altitude of 1244–5220 m (Figure 1). The landscape is a complex mountain–oasis–desert ecosystem, of which approximately 10% is oasis farmland. The basin has a temperate, arid continental climate with abundant light and heat resources, an annual sunshine time of 3028 h, and a frost-free period of more than 150 days, which is suitable for the growth of commercial crops [40]. However, the average annual precipitation is less than 200 mm, the evaporation of the pan is 2000 mm, and the average depth of groundwater is 25 m. Because the water demand for local crops is much higher than precipitation, farmlands must be irrigated with surface water and groundwater as the main water source.

2.2. Remote Sensing, Auxiliary Data, and Data Processing

The Landsat 8 satellite is equipped with two sensors: OLI and TIRS. The OLI land image includes nine bands, including a 15 m panchromatic band. The other bands have a spatial resolution of 30 m and an imaging width of 185 km. The resolution of the two thermal infrared bands of the TIRS is 100 m, which helps to distinguish and calculate the surface and atmospheric temperature. This study used four Landsat 8 images covering the entire study area, numbered 131/033, 131/034, and 132/033, 132/034 (Figure 1). Unfortunately, there are only five meteorological stations in and around the study area that can provide relevant data.
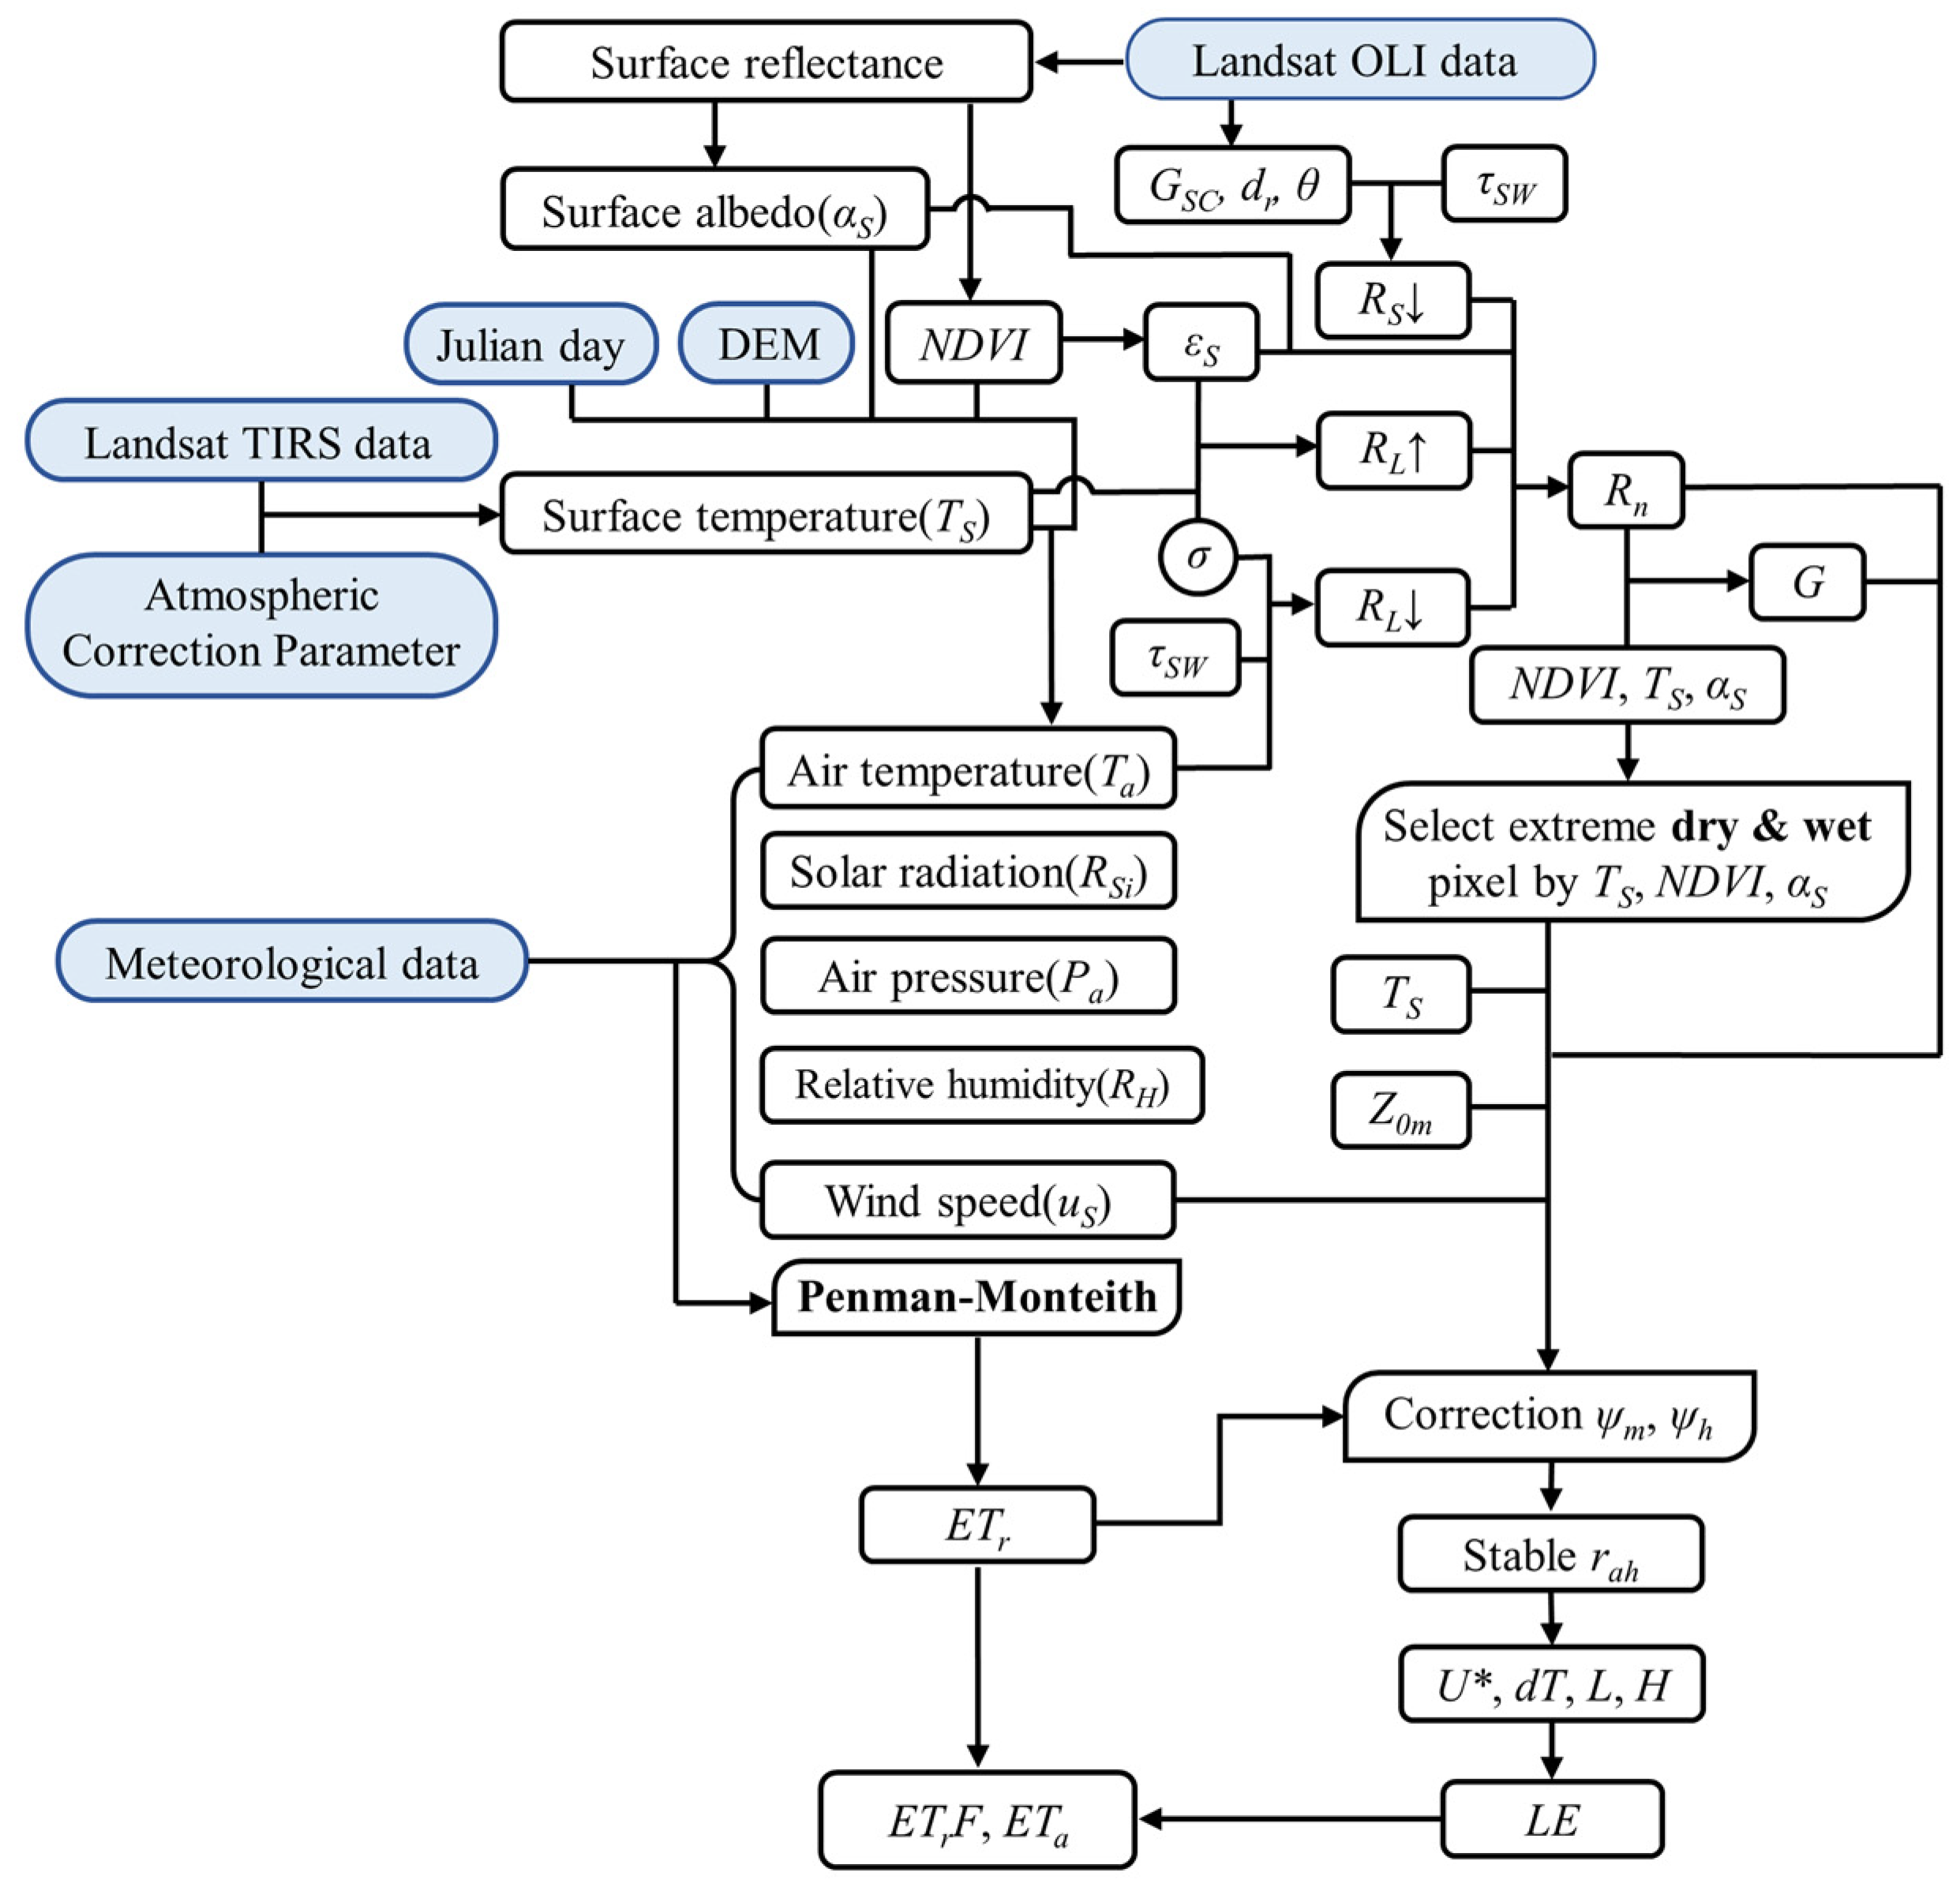
Google Earth Engine (GEE) (https://earthengine.google.com/ (accessed on 25 December 2023)), a cloud computing-based geospatial processing platform, uses Google’s computing infrastructure for rapid analysis [41]. Almost all built-in algorithms of the platform use pixel-by-pixel computing, which can efficiently process and mine remote sensing data globally. This study used the online JavaScript API of the GEE platform to invoke and analyze Landsat 8 raw and surface reflectance product (SR) datasets from public catalogs and Landsat 8 images courtesy of the U.S. Geological Survey. Images with less than 30% clouds from 2014 to 2018 were efficiently selected, cloud removed, stitched, cropped, subjected to parameter inversion, and interpolated for meteorological data. The METRIC model was encoded and processed on the platform, and the model process is illustrated in Figure 2. The model only outputs the ET inversion results, significantly improving computational efficiency.

2.3. In Situ Dataset

Observations of ETa and energy fluxes were obtained from seed maize fields in and near the National Field Scientific Observation and Research Station on Efficient Water Use of Oasis Agriculture in Wuwei, Gansu Province. The maize farmlands used for the observations were not fixed because of local adjustments in field production. These locations are shown in Figure 1. In 2014–2018, the flux/ETa locations of the BI observation areas were at Site I, Site I, Site III, Site IV, and Site V, respectively, and the flux/ETa locations of the DI observation area were at Site II, Site IV, Site I, Site I, and Site I, respectively (see Table 1 for field information) [38].
In this study, the eddy covariance (EC), Bowen ratio energy balance (BREB), and soil water balance (WB) methods were used to systematically compare and observe the components of water–heat fluxes in seed maize fields under mulched border irrigation and drip irrigation under membrane over the whole growth stage, respectively.
The EC system mainly consists of a three-dimensional sonic anemometer/thermometer (model CSAT3, Campbell Scientific, Inc., Logan, UT, USA), a Krypton hygrometer (model KH20)/an open path gas analyzer (model EC150, Campbell Scientific, Inc., USA), a temperature and humidity sensor (model HMP45C/HMP155A, Vaisala, Vantaa, Finland), an infrared radiometer (model SI-111, Campbell Scientific, Inc., USA), a net radiometer (model NR-LITE/CNR4, Kipp & Zonen, Delft, the Netherlands), two soil heat flux plates (model HFP01, Hukseflux, the Netherlands), and a date logger (model CR1000/CR3000/CR5000, Campbell Scientific, Inc., USA) [39,42]. The installation height was 4 m above ground level in 2014 and 2016–2018 and 3.5 m above ground level in 2015. The net radiometer and surface temperature sensors were installed at the same height as the three-dimensional sonic anemometer/thermometer. Two soil heat flux plates were buried 5cm below the surface of the mulched soil and the bare ground between the mulches, respectively. All sensors were located in the BI and DI observation areas and were connected to a data logger, and the system sampled at a frequency of 10 Hz and output energy flux data every 30 min. The systems are all installed in the middle of a flat and open observing area, which meets the requirements of the EC system for wind and wave areas [43].
The Bowen ratio energy balance method is based on the energy balance equation and the diffusion theory of near-surface gradients to estimate LE and H [44]. BREB measurements require two temperature and relative humidity probes (model HMP155A, Vaisala, Vantaa, Finland) at different heights to monitor the gradient of temperature and humidity. There are also probes that can be shared with the EC system, such as a radiometer and soil heat flux panels.
In addition, soil moisture probes (model CS616, Campbell Scientific, Inc., USA) were installed at 20 cm, 40 cm, 60 cm, 80 cm, and 100 cm below the soil surface to monitor soil moisture changes, which can be used in WB methods.
The collected EC flux data were processed using Eddy Pro 4.0 software, and then the quality of the EC data was assessed. Data that were unreliable and out of experimental range were removed. Linear interpolation was used to fill in data gaps when fewer than four consecutive observations were missing, and MDV (mean daily variation) was used when five or more observations were missing. For the BERB flux data, the data were corrected using the directivity judgment method and the rejective region method [45]. The method for filling data gaps was the same as that used for EC flux data [39].
The EC technique is recognized as the standard micrometeorological method for measuring ET because of its high measurement accuracy and sampling frequency. This technique can accurately obtain ET information over a wide range of scales [23,46] and has become the primary method of the International Flux Observation Network (FLUXNET) [47]. The instantaneous flux data of the EC system in 2014–2015 were utilized to validate the remote sensing data retrieval of the satellite transit time.

3. Surface Parameters Determination

When satellite remote sensing data are acquired for ETa, the energy information of the soil, vegetation, and atmosphere, as well as other characteristic parameters, must first be obtained through image processing techniques [48].

3.1. Surface Parameters

This study used datasets (atmosphere and surface reflectance products) in the GEE platform to invert the surface temperature of the study area based on the atmospheric correction method. The radiative transfer equation of the thermal infrared radiance value L λ received by the satellite sensor is expressed as follows [49]:
L λ = ε B T s + 1 ε L τ + L
where L λ is the spectral radiance value at the top of the atmosphere at the band λ (W·m−2·μm−1·sr−1), ε is the surface-specific emissivity, B T s is the blackbody thermal emissivity brightness (W·m−2·μm−1·sr−1), L is the downward radiance of the atmosphere after reflection on the ground (W·m−2·μm−1·sr−1), τ is the atmospheric thermal infrared band transmittance, and L is the upward radiance of the atmosphere (W·m−2·μm−1·sr−1).
Thermal infrared radiance values were provided by the 10th band of the Landsat 8 image, and the formula for calculating B T s is:
B T s = L λ L 1 ε τ L τ ε
T s = K 2 ln K 1 B T s + 1
where T s is the surface temperature (°C), K 1 = 774.89   W·m−2·μm−1·sr−1, K 2 = 1321.08 K.
For areas with a sparse and uneven distribution of meteorological stations, the extended results of interpolating the Ta data of meteorological stations on a regional scale are affected by the heterogeneity of the surface [50]. Meanwhile, the atmospheric radiation value caused by Ta cannot be obtained directly from satellite images due to its complex proportion and low total amount. Using the surface parameters obtained from remote sensing inversion to establish a regression relationship with meteorological station data, regional Ta data were obtained. The regression algorithm for calculating Ta was established by Liu et al. [51]:
T a = b 0 + b 1 T s + b 2 α + b 3 N D V I + b 4 A + b 5 x 7 + b 6 x 8
where T a is the near-surface air temperature, T s is the surface temperature, α is the surface albedo, NDVI is the normalized difference vegetation index, A is the altitude, x 7 = J 200 2 is the independent variable, and J is the Julian day. T s and J are independent variables and have a strong correlation. Therefore, x 8 = x 7 × T s is used as the interaction term to match the model, and b 0 b 6 are undetermined coefficients.
For latent heat estimation, the meteorological data and physiological characteristics of the vegetation structure (vegetation index and vegetation coverage) are indispensable for describing the atmospheric boundary layer. Point-scale wind speeds from five surface meteorological stations (http://data.cma.cn/ (accessed on 25 December 2023)) in and around the basin were interpolated and expanded using inverse distance weighting (IDW).
Surface reflectance (α) is the ratio of reflected solar radiation to incident solar radiation in the short-wave spectrum (0.2–3.2 μm) [33]. Flood [52] compared the surface albedo calculated by Landsat 8 OLI and Landsat 7 ETM+. The surface albedo results calculated by these two sensors were highly consistent. Therefore, after application comparison, the parameters given by Liang [53] for Landsat 7 were used:
α = 0.356 b 2 + 0.130 b 4 + 0.373 b 5 + 0.085 b 6 + 0.072 b 7 0.0018
where α is the broadband surface reflectance; b 2 , b 4 , b 5 , b 6 , and b 7 are the surface reflectance of subscripted bands, respectively.

3.2. METRIC Model

Based on the surface energy balance principle (Equation (6)), the METRIC model obtains the latent heat flux (LE) after determining the other three instantaneous energy components and converts it into instantaneous ETa. Based on the available Landsat 8 images, the METRIC model was used to estimate the ETa in the Shiyang River Basin.
λ E T i n s t = L E = R n G + H
R n = 1 α R S R L + ε s R L
R S = G S C × d r × τ s w × c o s θ
R L = ε × T S 4 × σ
R L = 1.08 × l n τ s w 0.265 × T a 4 × σ
τ s w = 0.75 + 2 × 10 5 × z
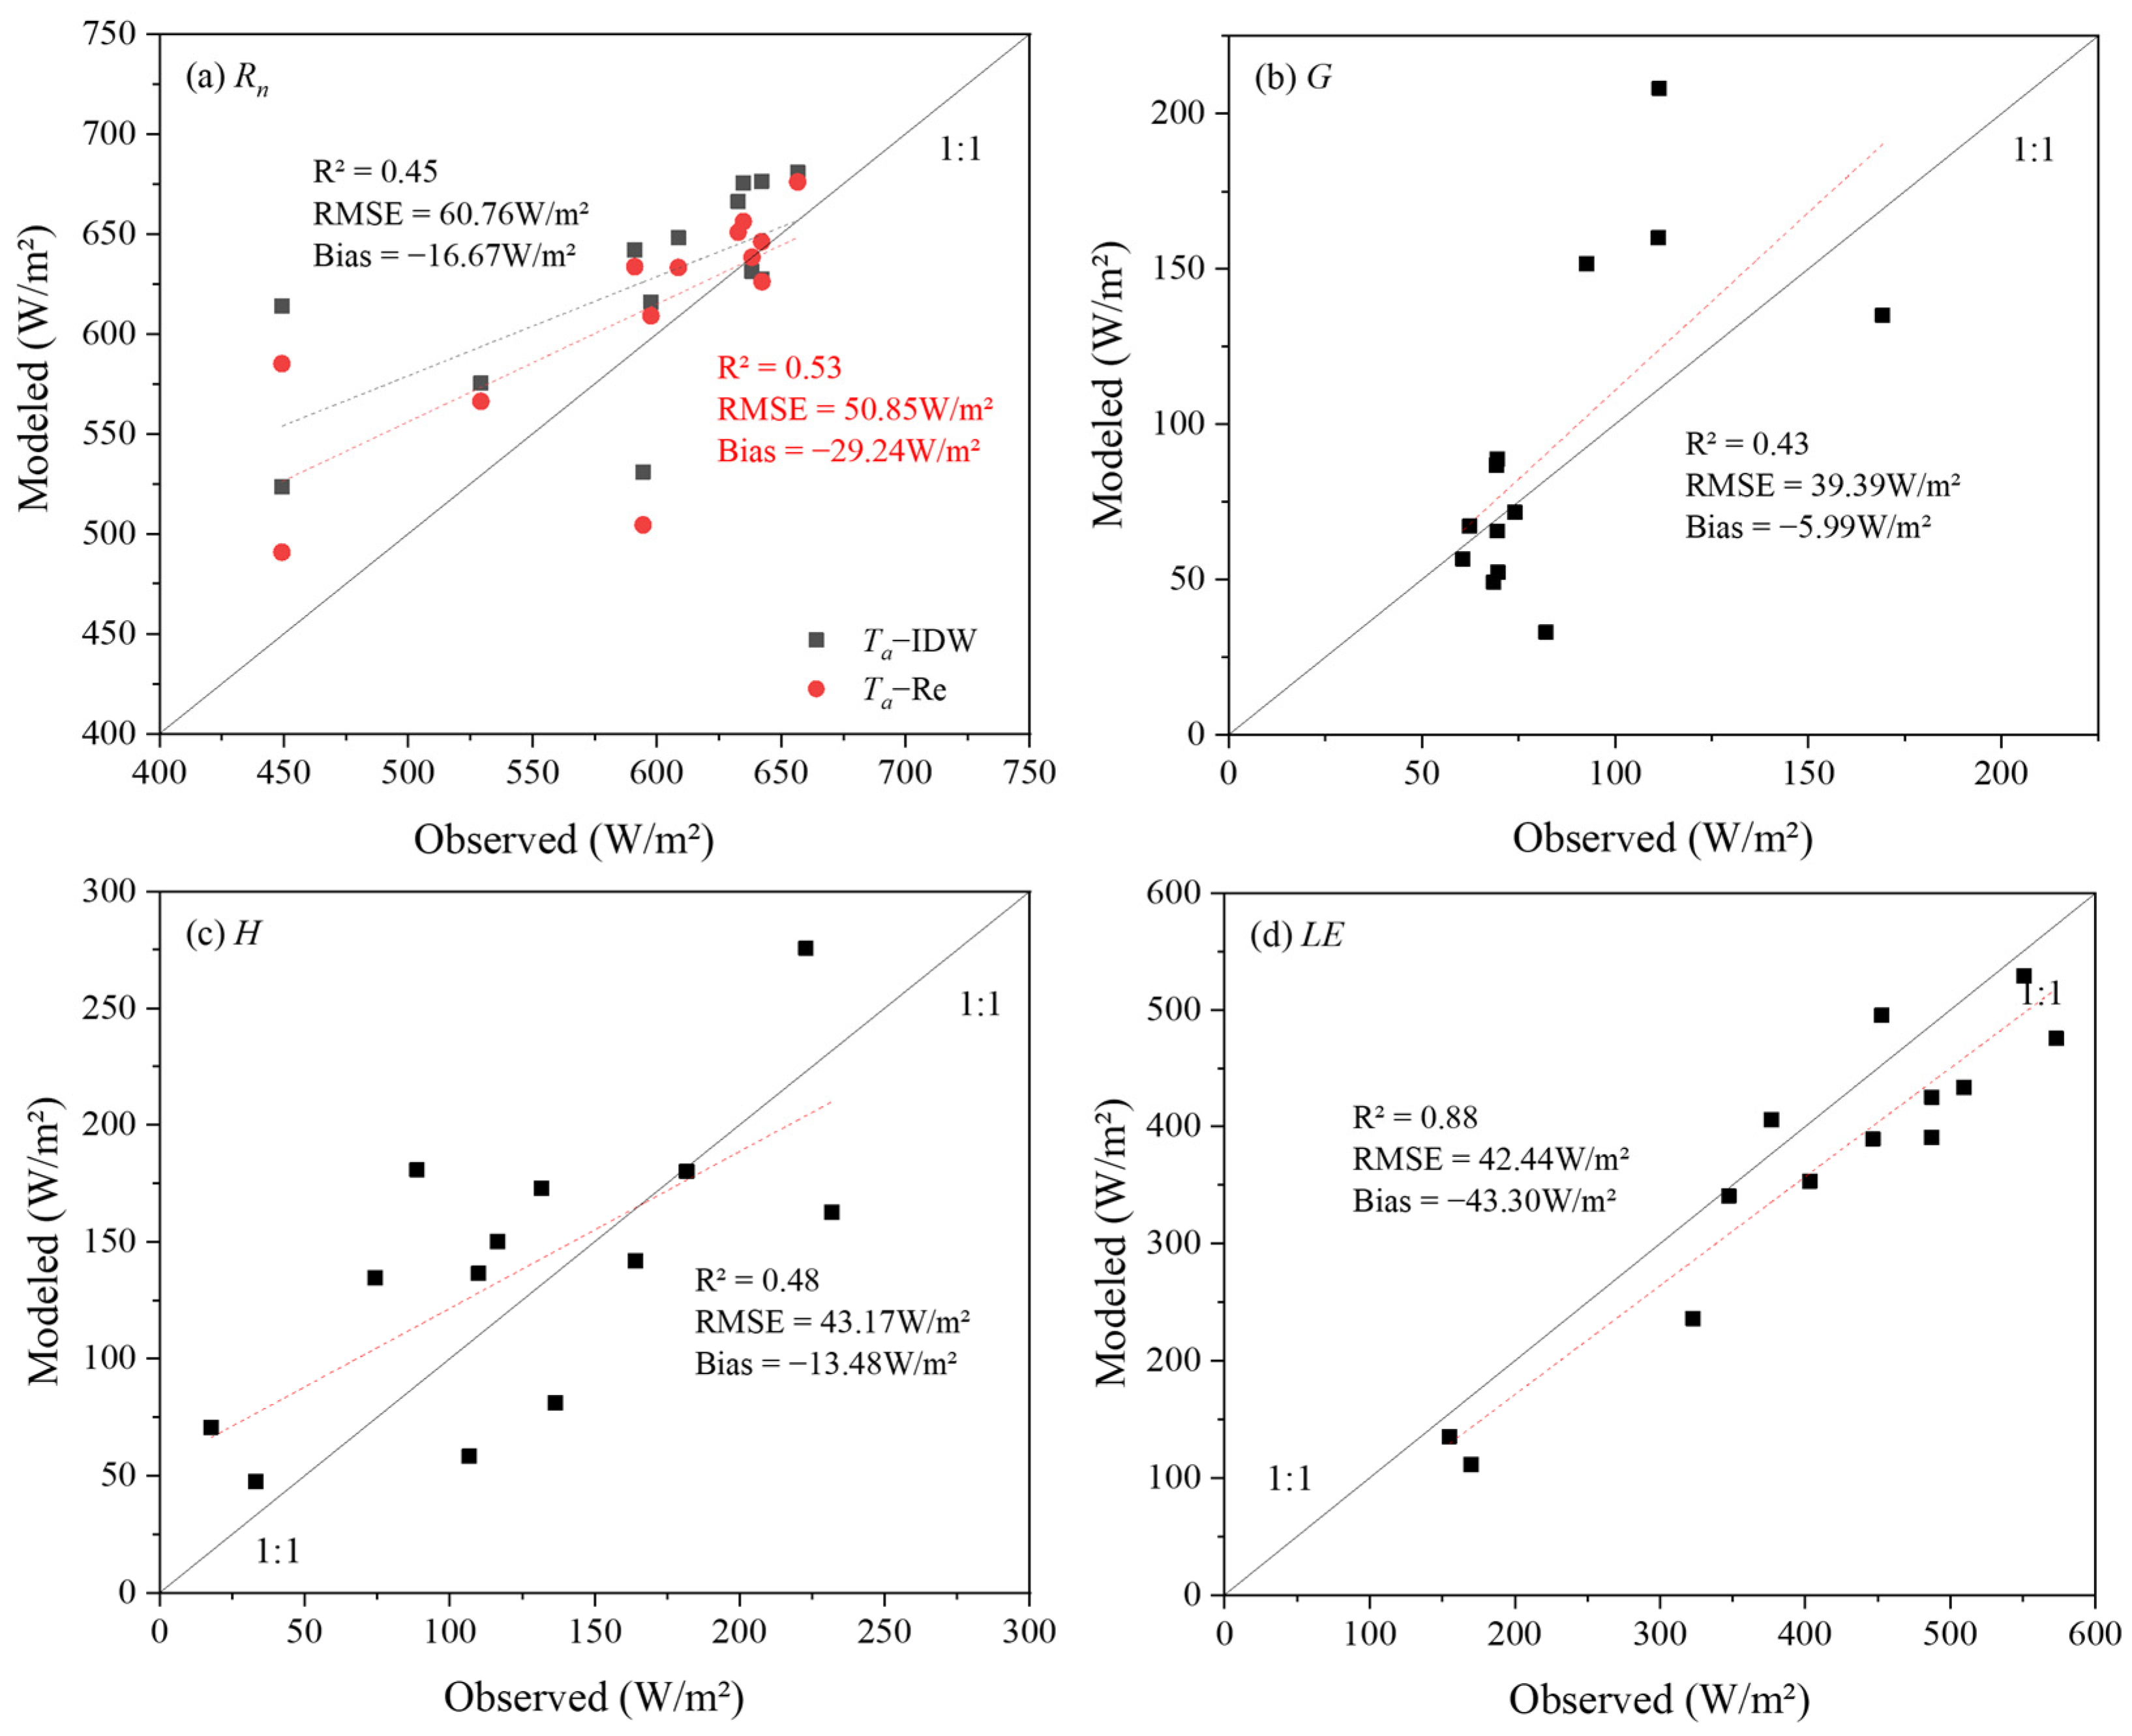
To represent relatively homogeneous atmospheric conditions within a region, the METRIC model assumes that the Ta of the calculated region is consistent with the T s of the cold spots [54]. However, the study area is an alpine alpine–desert–oasis ecosystem, with large differences in vegetation types and a high proportion of desert areas. In particular, T s varies considerably across land cover types when the ground surface is dry [55]. Therefore, the assumptions of the METRIC model for calculating R L do not apply to this region. Further comparison of the differences in Rn estimation accuracy between the two methods of estimating T a is required. According to the calculation formula above for Rn, the Ta obtained in two distinct ways is substituted into the Rn calculation. The results were verified using instantaneous flux observation data corresponding to satellite overpass days in 2014–2015 (the overpass time of Landsat 8 was local from 11:43 to 11:49 a.m.).
Soil heat flux (G) refers to the energy stored in soil and vegetation. G was used to estimate the available energy (RnG), which can be divided into H and LE [28]. We have tried to avoid introducing more parameters from empirical formulas while better representing complex surface conditions and vegetation changes [32]. In this study, the estimation method proposed by Bastiaanssen [56] was used to obtain G :
G = T s 273.15 α ( 0.0038 α + 0.0074 α 2 ) ( 1 0.98 N D V I 4 ) R n
Sensible heat flux ( H ) was estimated from the aerodynamic function:
H = ρ a i r C p d T r a h
There are two unknown variables (dT and rah) in Equation (13), making it challenging to obtain H. Therefore, the algorithm needs to determine the two extreme pixels (hot and cold pixels) and then compute dT and rah by a trial-and-error method during the iteration process. There are many studies describing the computation of H, which will not be repeated here [31,33]. The process is shown in Figure 2, where the selection of hot and cold pixels is crucial for the estimation of H.
The METRIC model assumes that the hot pixels are dry, hot, and bare soil without vegetation, so L E h o t = 0.05 × λ × E T r _ h o u r l y , H h o t = R n _ h o t G h o t L E h o t . In contrast, the cold pixels are saturated with vegetation and have excellent water supply conditions, so L E c o l d = 1.05 × λ × E T r _ h o u r l y , H c o l d = R n _ c o l d G c o l d L E c o l d [33].
When selecting extreme pixels, it is necessary to refer to the NDVI, α, and Ts simultaneously. The pixels with NDVI less than 0.1 and the hottest 20% of T s were regarded as hot pixels. “Ideal candidate cold pixels” recommend α in the range of 0.18–0.25, with low T s and NDVI in the range greater than 0.8. Generally, after the cold pixels meet the α range, the first 5% larger NDVI is selected, and the pixels with the lowest 20% T s were determined as the cold pixels. If there are no suitable pixels, the α range can be adjusted by ± 0.02 [34].
Through the latent heat of the water vaporization parameter, instantaneous surface evapotranspiration (EToverpass) was obtained. Then, we calculated the reference evapotranspiration fraction (ETrF) combined with the instantaneous reference evapotranspiration (ETr). The instantaneous reference evapotranspiration (ETrhourly) was calculated with reference to the sinusoidal variation curve of evapotranspiration in sunny days by Equation (16). It is assumed that the ETrF does not change within a day, and the mean value of the satellite overpass days is the same as the value of the satellite overpass time.
E T o v e r p a s s = 3600 × L E λ
λ = ( 2.501 0.00236 × T s 273 ) × 10 6
E T r h o u r l y = E T r d a i l y × π × sin π t N 2 2 N 2
E T r F = E T o v e r p a s s E T r h o u r l y
E T d a i l y = E T r F × E T r d a i l y
In regions with different seasons, ideal vegetation conditions are not always available or provide cold pixels. Therefore, in the non-growing period when no well-growing crops completely cover the ground, the selection range of the cold pixels must be adjusted appropriately. When the NDVI of cold pixels is lower than 0.75, the ETrFCold can be adjusted to less than 1.05 [54,57]. Normally, hot pixels lack water for evaporation, but ETrFHot can be adjusted to be greater than 0.05 if rainfall results in soil evaporation residuals [34]. The transport of water vapor and H on Earth’s land surface is strongly influenced by aerodynamic processes, including wind speed, turbulence, and buoyancy, but all of these are difficult to determine for satellites. In addition, surface albedo, Rn, and G cannot be quantified with complete precision. Therefore, despite the best efforts to estimate each parameter accurately, some bias can still occur. The introduction of ETr calibration in the METRIC model helps to compensate for this bias by introducing a bias correction in the H calculation. Ultimately, the inherent bias in the Rn, G, and H subcomponents was eliminated by subtracting the bias in H.
Landsat 8 provides optical remote sensing data and is susceptible to cloudy weather with long overpass revisit times. Therefore, the METRIC model, which assumes a constant ETrF, is used to estimate ETa for dates near the satellite overpass date [29]. We used the cubic B-spline method to simulate the ETrF profile of maize during growth. Many researchers have used the cubic B-spline method to determine numerical schemes for solving boundary value problems because of their flexibility and reliability in finding an approximate solution at any occasion in the domain [58]. The ETtotal formula for the corresponding crop growth period is as follows:
E T t o t a l = i = 1 n E T d a i l y i
Appendix A lists the meanings and units of the parameters used in Equations (6)–(19).

3.3. Coding and Validation of the METRIC Model

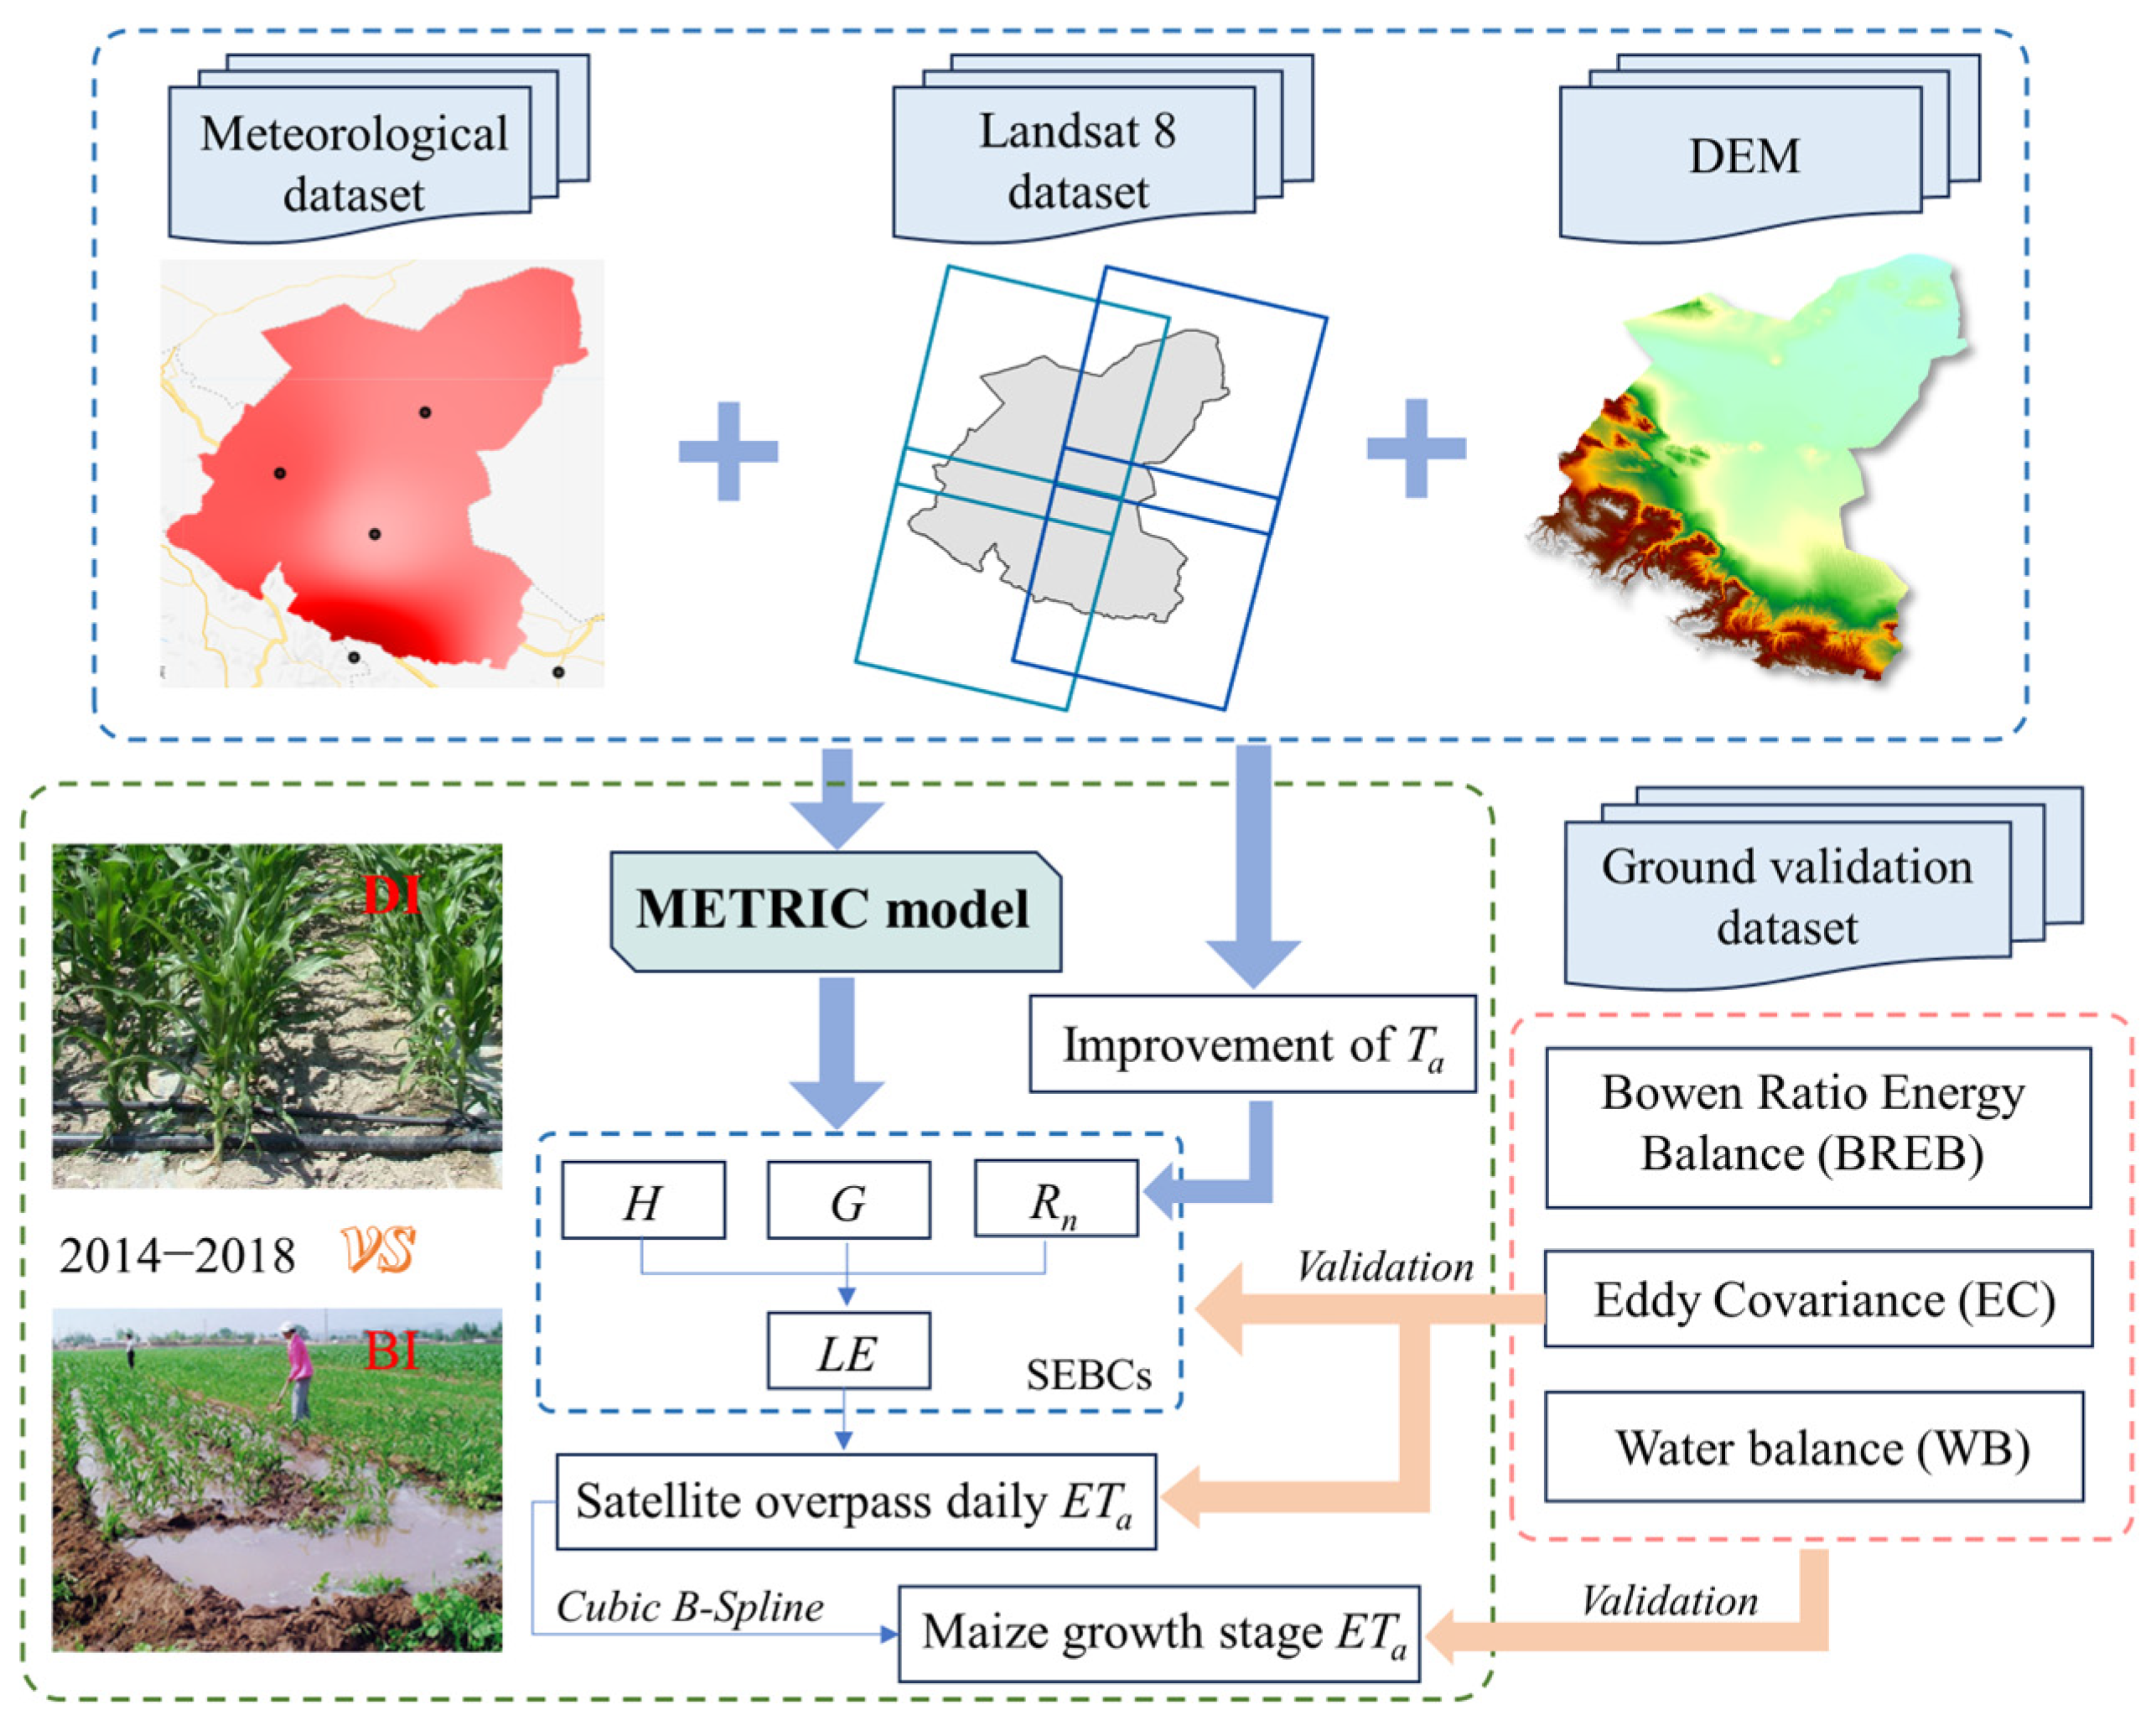
We applied JAVA programming to the METRIC model shown in Figure 2, which can directly use the remote sensing dataset and the powerful pixel-by-pixel computing capability provided by the GEE platform. The main processes include image filtering, stitching, clipping, surface temperature, and other parameter operations. The operation process has two points that require special attention: (1) after restricting the conditions of NDVI, Ts, and α in the study area, the code selects the eligible areas autonomously and then subsequently makes manual judgments and selections; (2) the momentum transport stabilizing factors (ψm) and the heat transport stabilizing factors (ψh) are introduced, and the air density (ρair) and aerodynamic resistance (rah) are operated for several iterations to obtain stable H values. The technical route to indicate the overall flow of the study is shown in Figure 3.
The energy balance components and the ETa of the model output were validated against the corresponding observations. The EBC was validated using instantaneous data, and the ETa was validated using daily and growth stage observations. The coefficient of determination (R2), root mean square error (RMSE), and bias were used to understand the agreement between the model estimates and in situ datasets.
R 2 = i = 1 N y i O ¯ 2 i = 1 N O i O ¯ 2
RMSE = 1 N i = 1 N y i O i 2 1 2
Bias = 1 N i = 1 N O i y i
where N is the number of dates (days), y i is the estimation of EBC or ETa at the ith day using the METRIC model, O i is the measured value of the corresponding day, and O ¯ is the average value of the measured values.

4. Results and Discussion

4.1. Inversion Accuracy of Energy Fluxes

The average Ta data obtained using the regression model (described in Section 3.1 Surface parameters) were more conducive to calculating the instantaneous Rn (Figure 4a) compared with Ta from meteorological data. Although the overall estimated results were higher than the observed value, the R2 increased from 0.45 to 0.53, the RMSE decreased from 60.76 to 50.85 W/m2, and the bias increased from −29.24 to −16.66 W/m2. This improvement can be attributed to the fact that the data interpolated from the weather station are much higher than the actual Ta data of the farmland, and the temperature data obtained by the regression model are more in line with the practical situation.
The verification results of G were similar to those of the Rn verification. The estimated G showed that the R2 was only 0.43, but its RMSE value was 39.39 W/m², and the bias was −5.99 W/m² (Figure 4b). High G values indicate that the soil absorbs more heat when the surface energy fluctuates significantly and is prone to error. The surface temperatures of different land cover types are quite different when the ground surface is in a spanking dry state, affecting the dT and H estimations of each pixel.
The instantaneous LE was derived as the residual term of the energy balance equation (Equation (6)). Most of the points in the scatter plot (Figure 4d) after validation were close to the 1:1 line, and the estimated values were slightly lower than the observed values; the R2, RMSE, and bias were 0.88, 42.44 W/m2, and 43.30 W/m2, respectively. Furthermore, LE was less affected by the errors of the other fluxes, and its estimation accuracy was superior to that of all other flux components. These results are related to the kernel of the METRIC model, which utilizes internal self-calibration (inverse modeling at extreme conditions, CIMEC) to remove the effects of biases associated with surface reflectance, temperature, and estimations of G and H [54,55]. Oliveira et al. [59] used the METRIC model to estimate the surface energy balance components for three landscapes (sugarcane, woody savanna, and stricto-sensu savanna) in the Brazilian Cerrado, where the LE estimation accuracy for sugarcane was the best (RMSE = 21.43W/m2, R2 = 0.94) and the LE estimation accuracy was the lowest for woody savanna (RMSE = 56.38W/m2, R2 = 0.93). Carrasco-Benavides et al. [60] estimated H and LE in vineyards with RMSE in the range of 35–48 W/m2 using METRIC models at the time of satellite overpass. Ortega-salazar et al. [55] estimated H and LE in olive groves below the observed values (RMSEs of 46 and 45 W/m2, respectively), obtaining similar results to those of this study. Feng et al. [61] used an optimized two-source energy balance (TSEB) model to estimate LE for maize farmland in the Heihe River Basin, with an RMSE = 85 W/m2. Ge et al. [62] used the SEBS model to estimate the energy balance components of alpine and subalpine meadow on the northern Tibetan Plateau (RMSEH = 68.2 W/m2 and RMSELE = 54.9 W/m2).
Proper selection of hot and cold pixels can correctly partition the available energy (RnG) into H and LE, which will improve the accuracy of LE. Therefore, the performance of the METRIC model in the final LE estimation indicates the applicability of extreme point selection conditions in the study area. The Landsat 8 satellite has a long revisit, and the ground-based flux observations were made only during the maize growth period. Just in case two years of verifiable flux data were not sufficient, we used five years of model-derived flux data to compare with measured leaf area index (LAI) to further analyze the reliability of the METRIC model.
The flux data of H and LE under the two irrigation methods from 2014 to 2018 were compared and analyzed concerning the trends and differences in the measured LAI data (Figure 5). In standard years (except for 2017), maize under the DI method grew better than BI, with LAIDI > LAIBI in the early and middle stages of the growth process, while there were more cases of higher values of LEDI. In 2017, maize under the DI treatment was more affected by the rust disaster and did not grow as well as in standard years, so LEBI > LEDI on most dates. Although LEBI > LEDI on July 22 and 7 August 2016, the difference was not large, both were less than 6%, and the HBI > HDI of the two dates was similar to that in other years. After 21 July 2018, the maize LAI of DI was still greater than that of BI, but the LAI of DI had an obvious downward trend and aging was rapid, so the value of LE was small. The comparison concluded that LE was correlated with LAI in maize farmland (Figure 6), which is a convergent saturation process, and the R2 of the quadratic fitted curve for LE-LAI was higher under DI (R2DM = 0.89, R2BM = 0.77). This is similar to other biophysical variables being related to LAI due mainly to the attenuation and absorption exponential process of radiation as the layers of vegetation increase [63]. The overall difference in H under the different irrigation methods was pronounced, and HBI > HDI was more frequent (71.4%), except in 2017. Therefore, the H was lower in the maize farmland under the DI treatment at the midday moment on a clear day when satellite data were available. The above demonstrates that the allocation of Rn to seed maize farmland under the DI method is biased towards LE, leading to higher ETa on transit days, which would promote maize growth.

4.2. Satellite Overpass Daily ETa Validation

With a reasonable selection of hot and cold pixels, the correct division of H and LE improves the accuracy of the LE. Validation of the flux data showed that the surface parameters and selection of extreme points in the model were applied to the study area. Furthermore, we estimated ETa during the growth period of the maize seed. Observation data obtained from EC systems at four different locations and years were used to validate the ETa obtained from remote sensing data for different crops and irrigation methods from 2014 to 2018.
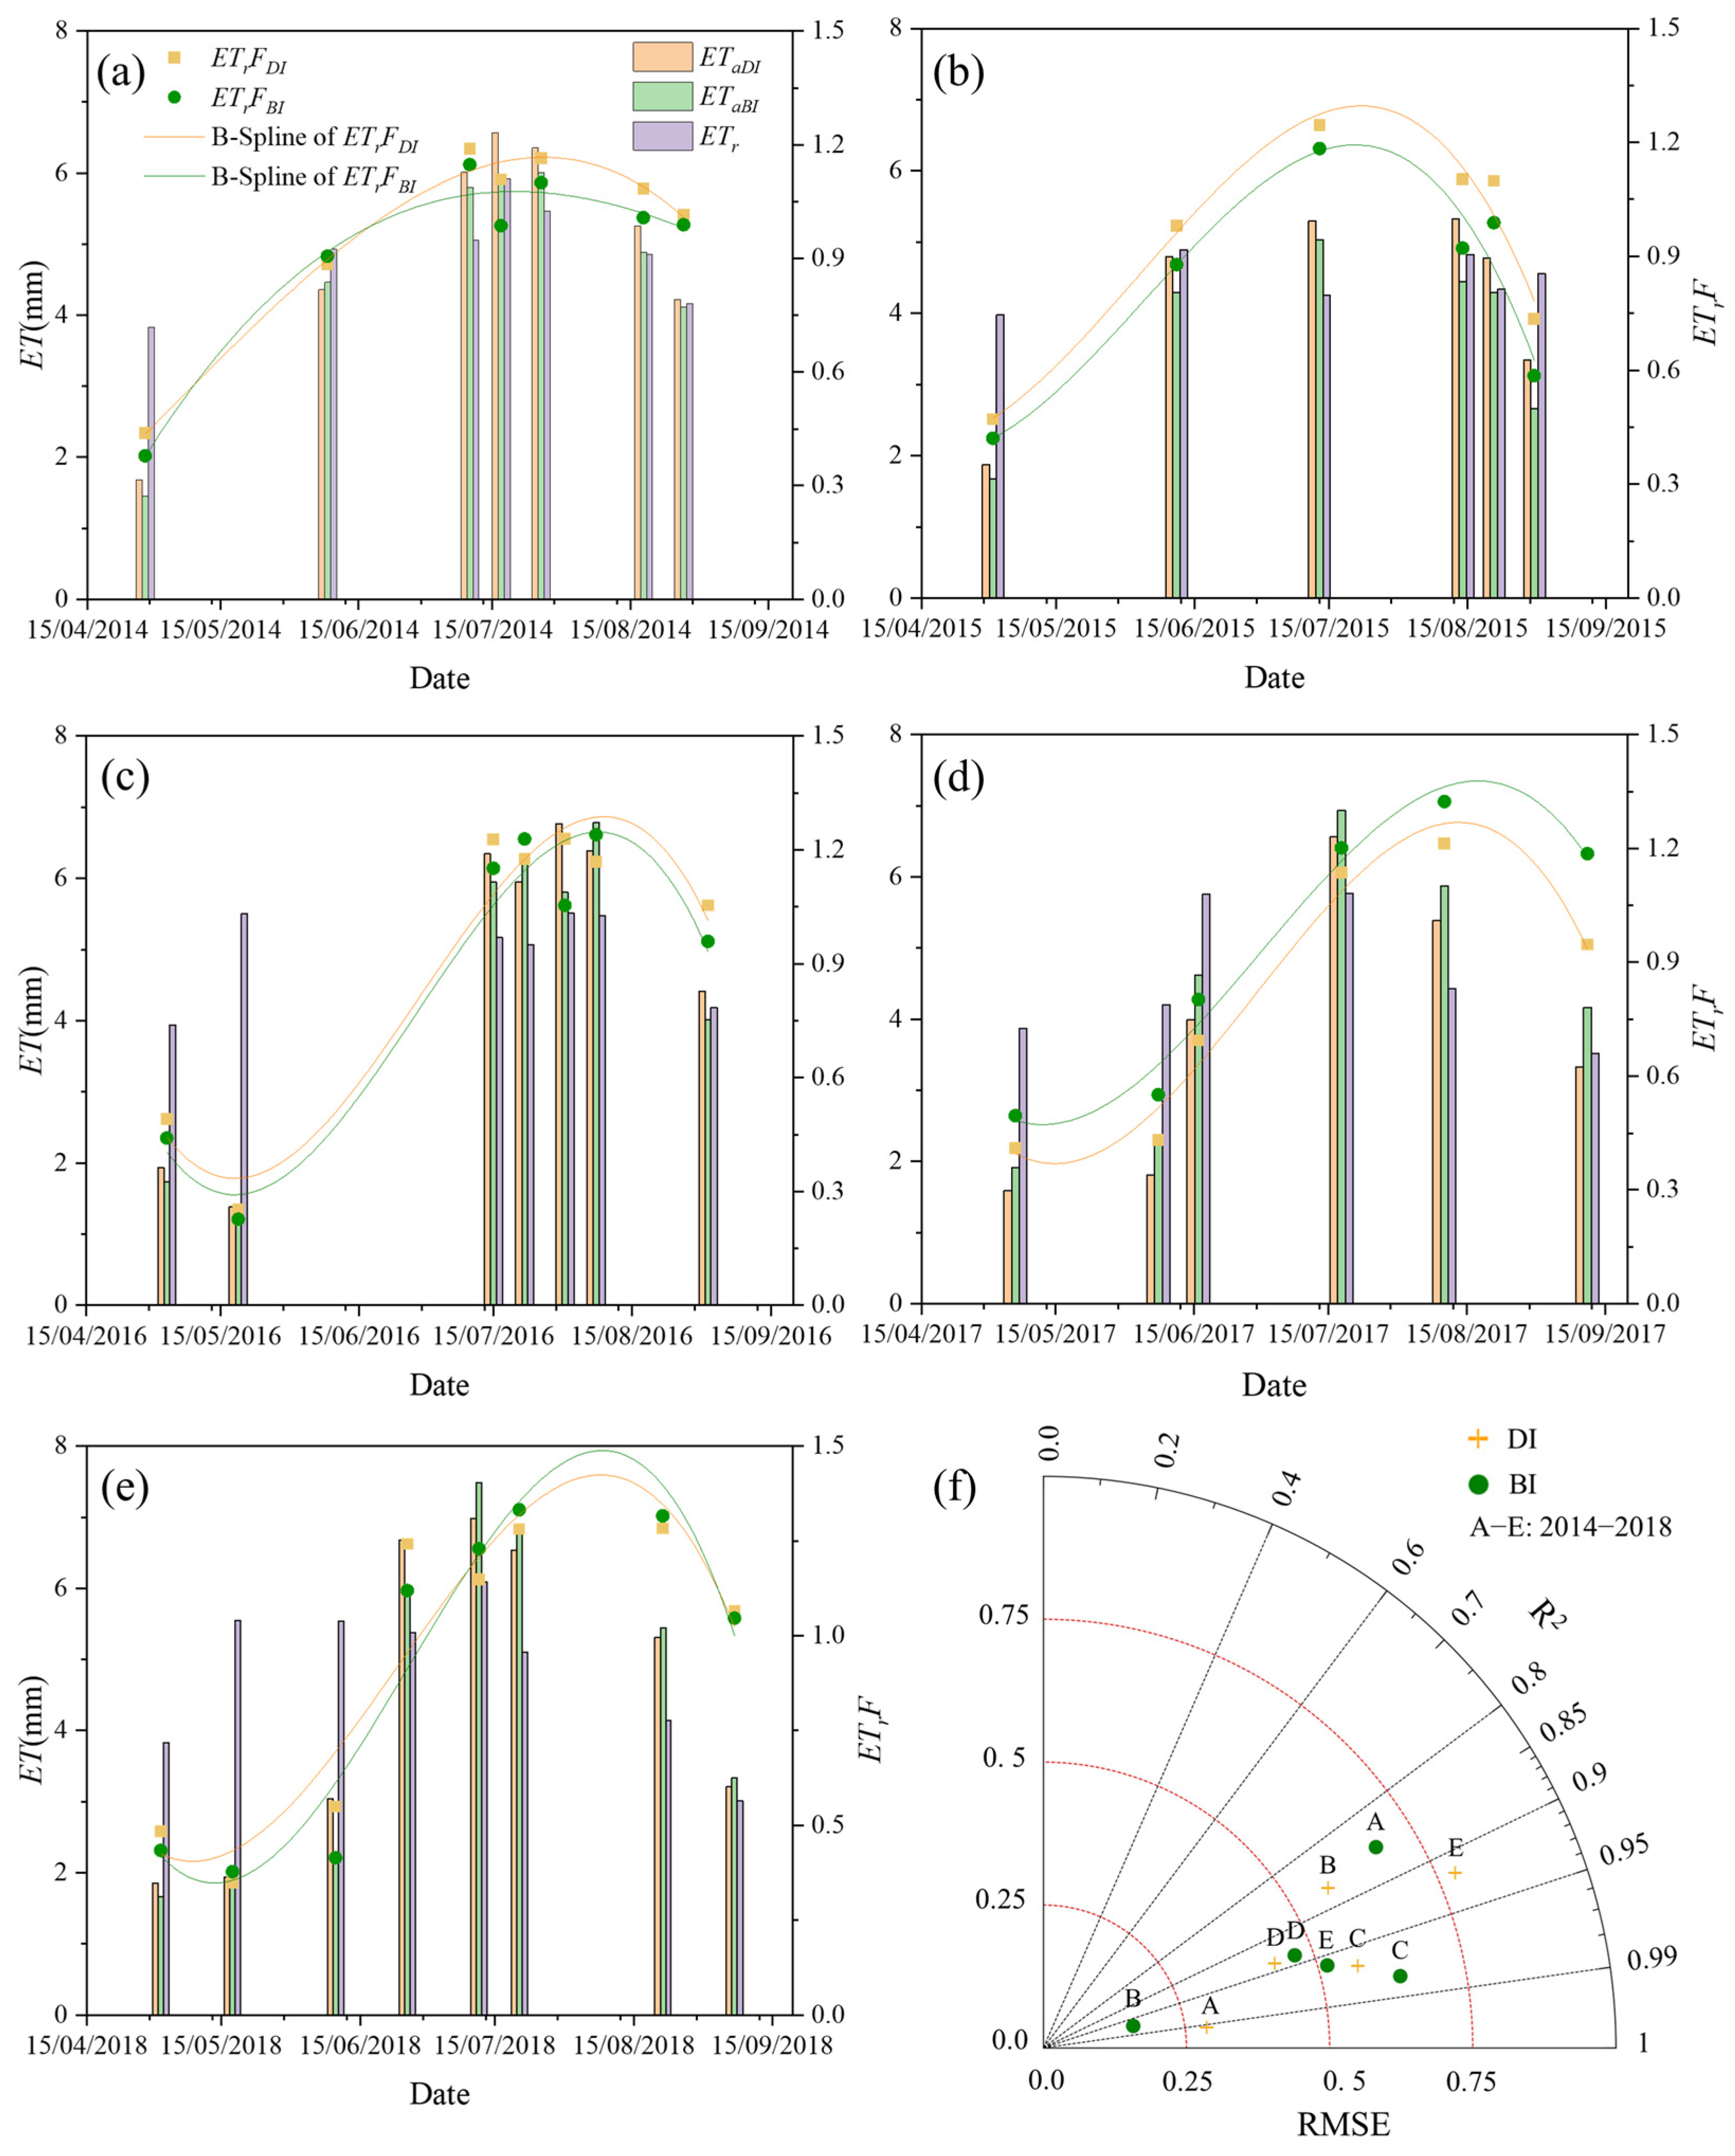
The instantaneous LE values were converted to the moment ETa of overpass and then extended to the daily value. This step is essentially an extension of the reference evapotranspiration ratio, assuming that ETrF remains constant on the day of the satellite overpass. For comparison, we extracted the estimated values of ETa under different irrigation methods for seed maize production and plotted them against with E T r (Figure 7a–e). As the maize grew, ETa, ETr, and their ratio ETrF changed, showing an increasing and then decreasing trend. At the early stage of maize growth, ETa under both irrigation methods is much lower than ETr, with ETrF < 1.0. With the arrival of the peak growth stage in July and August, ETa is larger than ETr, with ETrF > 1.0. Before the end of the reproductive period, the difference between ETa and ETr values was smaller.
The METRIC model had the highest goodness of fit for the estimation of ETa under the DI treatment in 2014, with R2 = 0.99; however, in the same year, the BI treatment had the lowest R2, with R2 = 0.85, whereas the estimation with the smallest value of bias was that of the BI in 2015, with RMSE = 0.16 mm/day, and that of the DI in 2018 had the largest bias value, with RMSE = 0.78 mm/day (Figure 7f). Overall, the accuracy of the daily ETa of maize obtained from the estimation was high.
This study required long-term baseline observations of large areas of agricultural land, which were used to fully validate the low-temporal-resolution Landsat remote sensing images. Therefore, we used five years of measured data to validate the accuracy of the remote sensing model in estimating ETa in agricultural fields. The results of some studies are similar to those we found, suggesting that the METRIC model performs well in farmland evapotranspiration inversion. For example, Nisa et al. [37] used three models based on Landsat 7 data to estimate daily ETa from fennel/maize/ryegrass clover cropland rotations in a Mediterranean context in southern Italy and found that the SEBS and METRIC models performed well (R2 = 0.59, RMSE = 0.71 mm/day; R2 = 0.65, RMSE = 1.13 mm/day). Kamyab et al. [64] used the SEBAL and METRIC models to map ETa on maize farmland in Iran, and the results showed a higher correlation and smaller RMSE for METRIC estimates than for SEBAL estimates (R2 = 0.885, 0.793; RMSE = 0.711 mm/day, 1.046 mm/day). Xue et al. [65] estimated daily ETa for maize using three remote sensing evapotranspiration models, METRIC, pySEBAL, and SEBS, and found that all of them overestimated ETa, among which SEBS performed better (R2 = 0.74, RMSE = 1.0 mm/day) than pySEBAL (R2 = 0.72, RMSE = 1.08 mm/day) and METRIC (R2 = 0.78, RMSE = 1.2 mm/day). Reyes-gonz et al. [66] used the METRIC model to estimate ETa for a commercial maize farmland and compared it to field measurements, with a high coefficient of determination (R2 = 0.89) and low RMSE (0.71 = mm/day). Comparisons of METRIC and EC ETa at the four sites of eastern Washington State for five crops (winter wheat, spring garbanzo, spring canola, spring barley, and spring pea) by khan et al. [67] showed reasonable agreement, with an RMSE of 0.4 mm/d on satellite overpass days. Ortega-Salazar et al. [55] used the METRIC model to invert evapotranspiration in drip-irrigated olive orchards, and their RMSE for daily ETa was 0.42 mm/day.
The acquisition of daily ETa data is limited to sunny days with satellite overpasses, and such data are insufficient for a complete representation of the process during the entire growth period. Therefore, the cubic B-spline method was needed to extend the ETrF available during the maize reproductive period to the entire reproductive period. The interpolation results reveal that the ETrF curves for most years in Figure 7a–e are consistent with previous maize-related monitoring studies [68]. Unfortunately, the disadvantage of a small amount of image data is that it is difficult to overcome because of the single source of remote sensing image data. The lack of high-quality remote sensing images with few clouds in May 2014 and 2015 is more critical in the growth stage, leading to the ETrF interpolation curve pattern of the corresponding years being less consistent with other images.
However, remote sensing data were still effective in qualitatively describing the ETa trends of maize in most years. Ground measurements of LAI (Figure 5) indicated that maize under the DI treatment reached peak growth earlier than that of BI. As it was not possible to measure the LAI of maize during the initial growth stage, it was deduced from the maize growth that LAIDI was greater than LAIBI until May. Figure 6 shows that LE had a positive correlation with LAI, and that a high LAI value caused a higher LE value, which in turn affected the value of ETa. Therefore, except for 2017, the ETrF under the DI treatment was always higher than that under the BI treatment in the initial stage of maize growth in other years. The ETrF curve also reflects the disease infestation of corn under DI in 2017, which is in clear contrast to other years when the ETa of DI was higher than that of BI.
Previous studies have concluded that drip irrigation saves water and improves water use efficiency, primarily by reducing soil evaporation, compared to other irrigation methods. Traditional irrigation methods such as border irrigation may lead to high soil evaporation rather than crop transpiration, resulting in high evapotranspiration, which masks the potential water stress of the crop throughout the growth cycle [69,70]. However, asynchrony in the timing of the two irrigation operations in the study would increase soil evaporation from the farmland at different time periods, resulting in ETa from the farmland that can sometimes be inconsistent with maize growth. In addition, as maize grows, the crop has almost 100% leaf cover and no bare soil, narrowing the differences in ETa between the two irrigation methods. Both irrigation methods followed the local production pattern, and irrigation scheduling was optimal. Consequently, it is difficult to distinguish between the two irrigation methods using only the daily ETa obtained from satellite remote sensing data. There was also an uncertain relationship between the two ETrF curves after interpolation. Based on the available data or curves, it is not possible to intuitively determine which irrigation method consumes more water. Therefore, it is necessary to extend the ETa of the two maize farmlands over the entire growth stages and continue to explore the differences in the ETa of seed maize under the two irrigation methods.
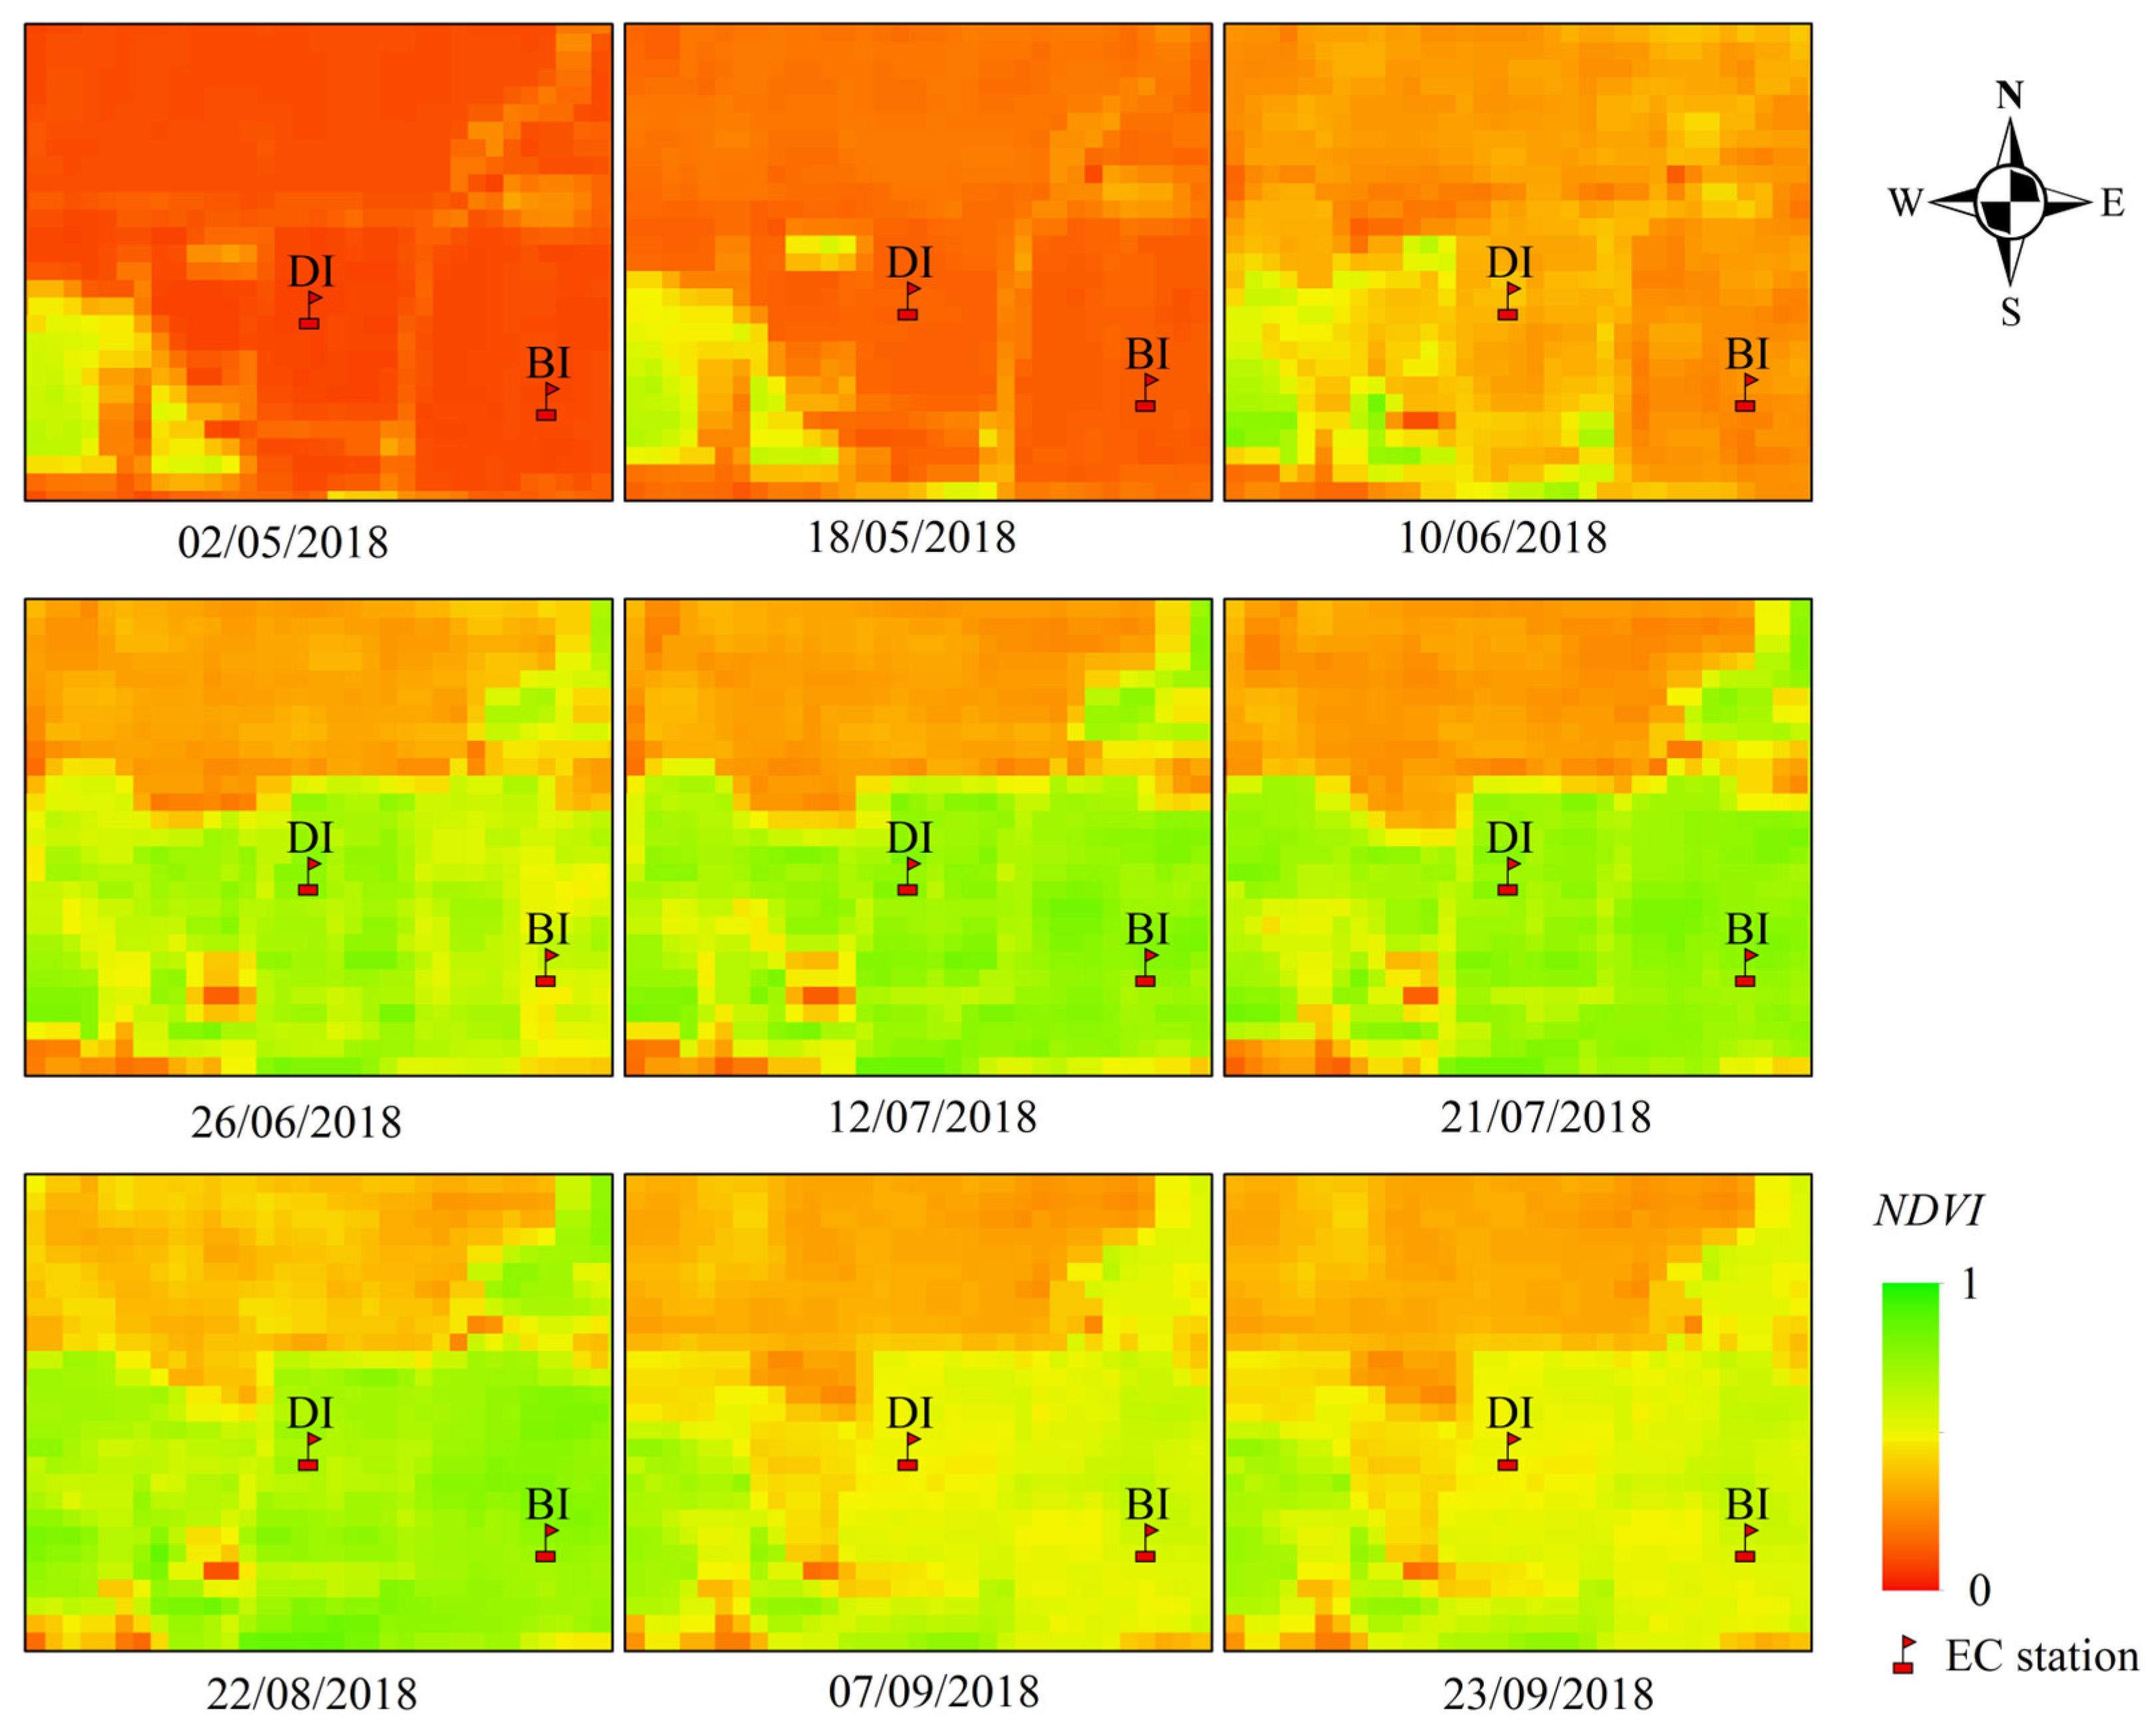
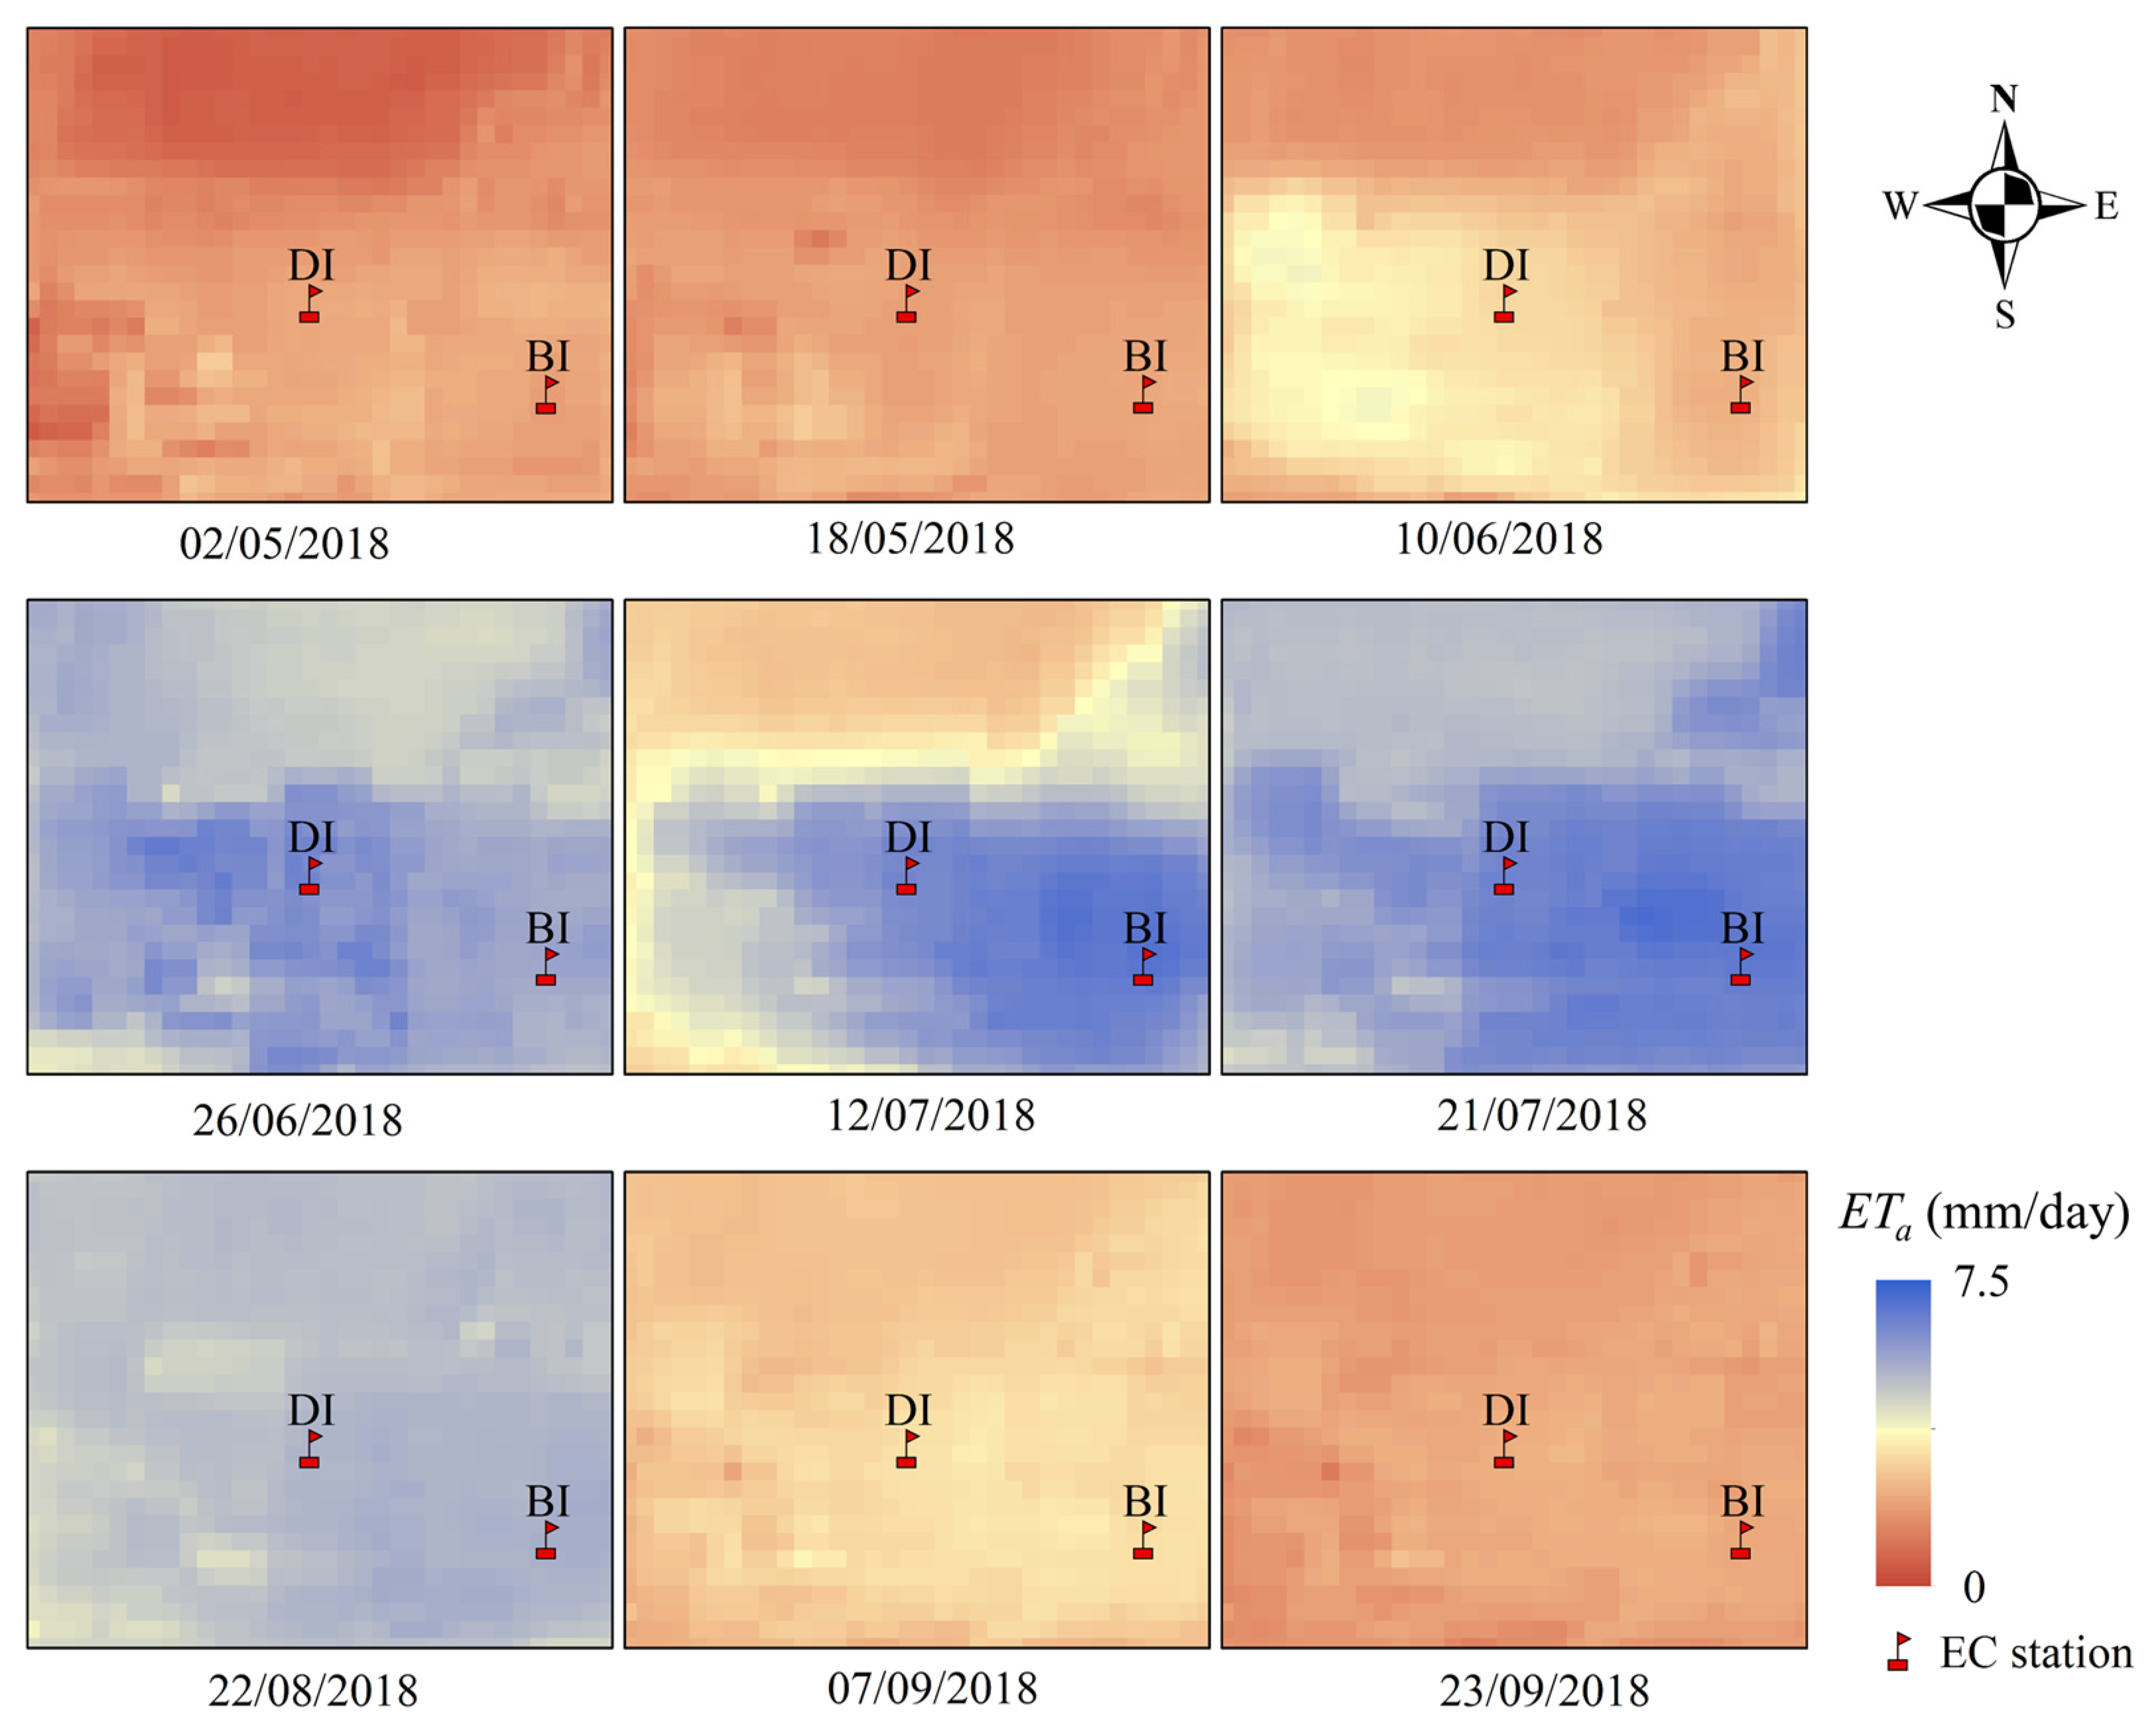
The trend In ETa over time was distinct for maize, with clear boundaries between the different farmlands. Combined with the vegetation distribution in Figure 8, there were no ETa anomalies in the farmlands of the same crop (Figure 9), confirming the suitability of the spatial distribution of ETa obtained from the estimation. At the beginning of maize growth (May), the ETa for maize croplands was below 3 mm/day under both irrigation methods. When maize was rapidly growing, such as on 10 and 26 June (NDVIDM = 0.39, 0.76, NDVIBM = 0.28, 0.64, respectively, shown Figure 8), combined with the NDVI of the crop growth process, the growth of seed maize under DI was better than under BI. Therefore, the ETa of DI during the fast growth stage of maize was higher than that of BI. In the middle and late stages of maize growth (July 12 and 21 and August 22), as shown in Figure 7, the ETa of BI was slightly higher than that of DI (ETDI = 6.99, 6.54, and 5.31 mm; ETBI = 7.49, 6.80, and 5.45 mm). The inspection of vegetation in the two fields (NDVIDI = 0.75, 0.71, and 0.68; NDVIBI = 0.80, 0.77, and 0.76) showed that the growth of BI maize was better than that of DI maize. Combined with previous studies, DI accelerated maize growth and shortened the entire experimental period [38,39]. Therefore, it is reasonable that DI maize enters the decline stage earlier, and its ETa is lower than that for BI maize.

4.3. Differences in the Growth Stage and Irrigation Methods of ETa

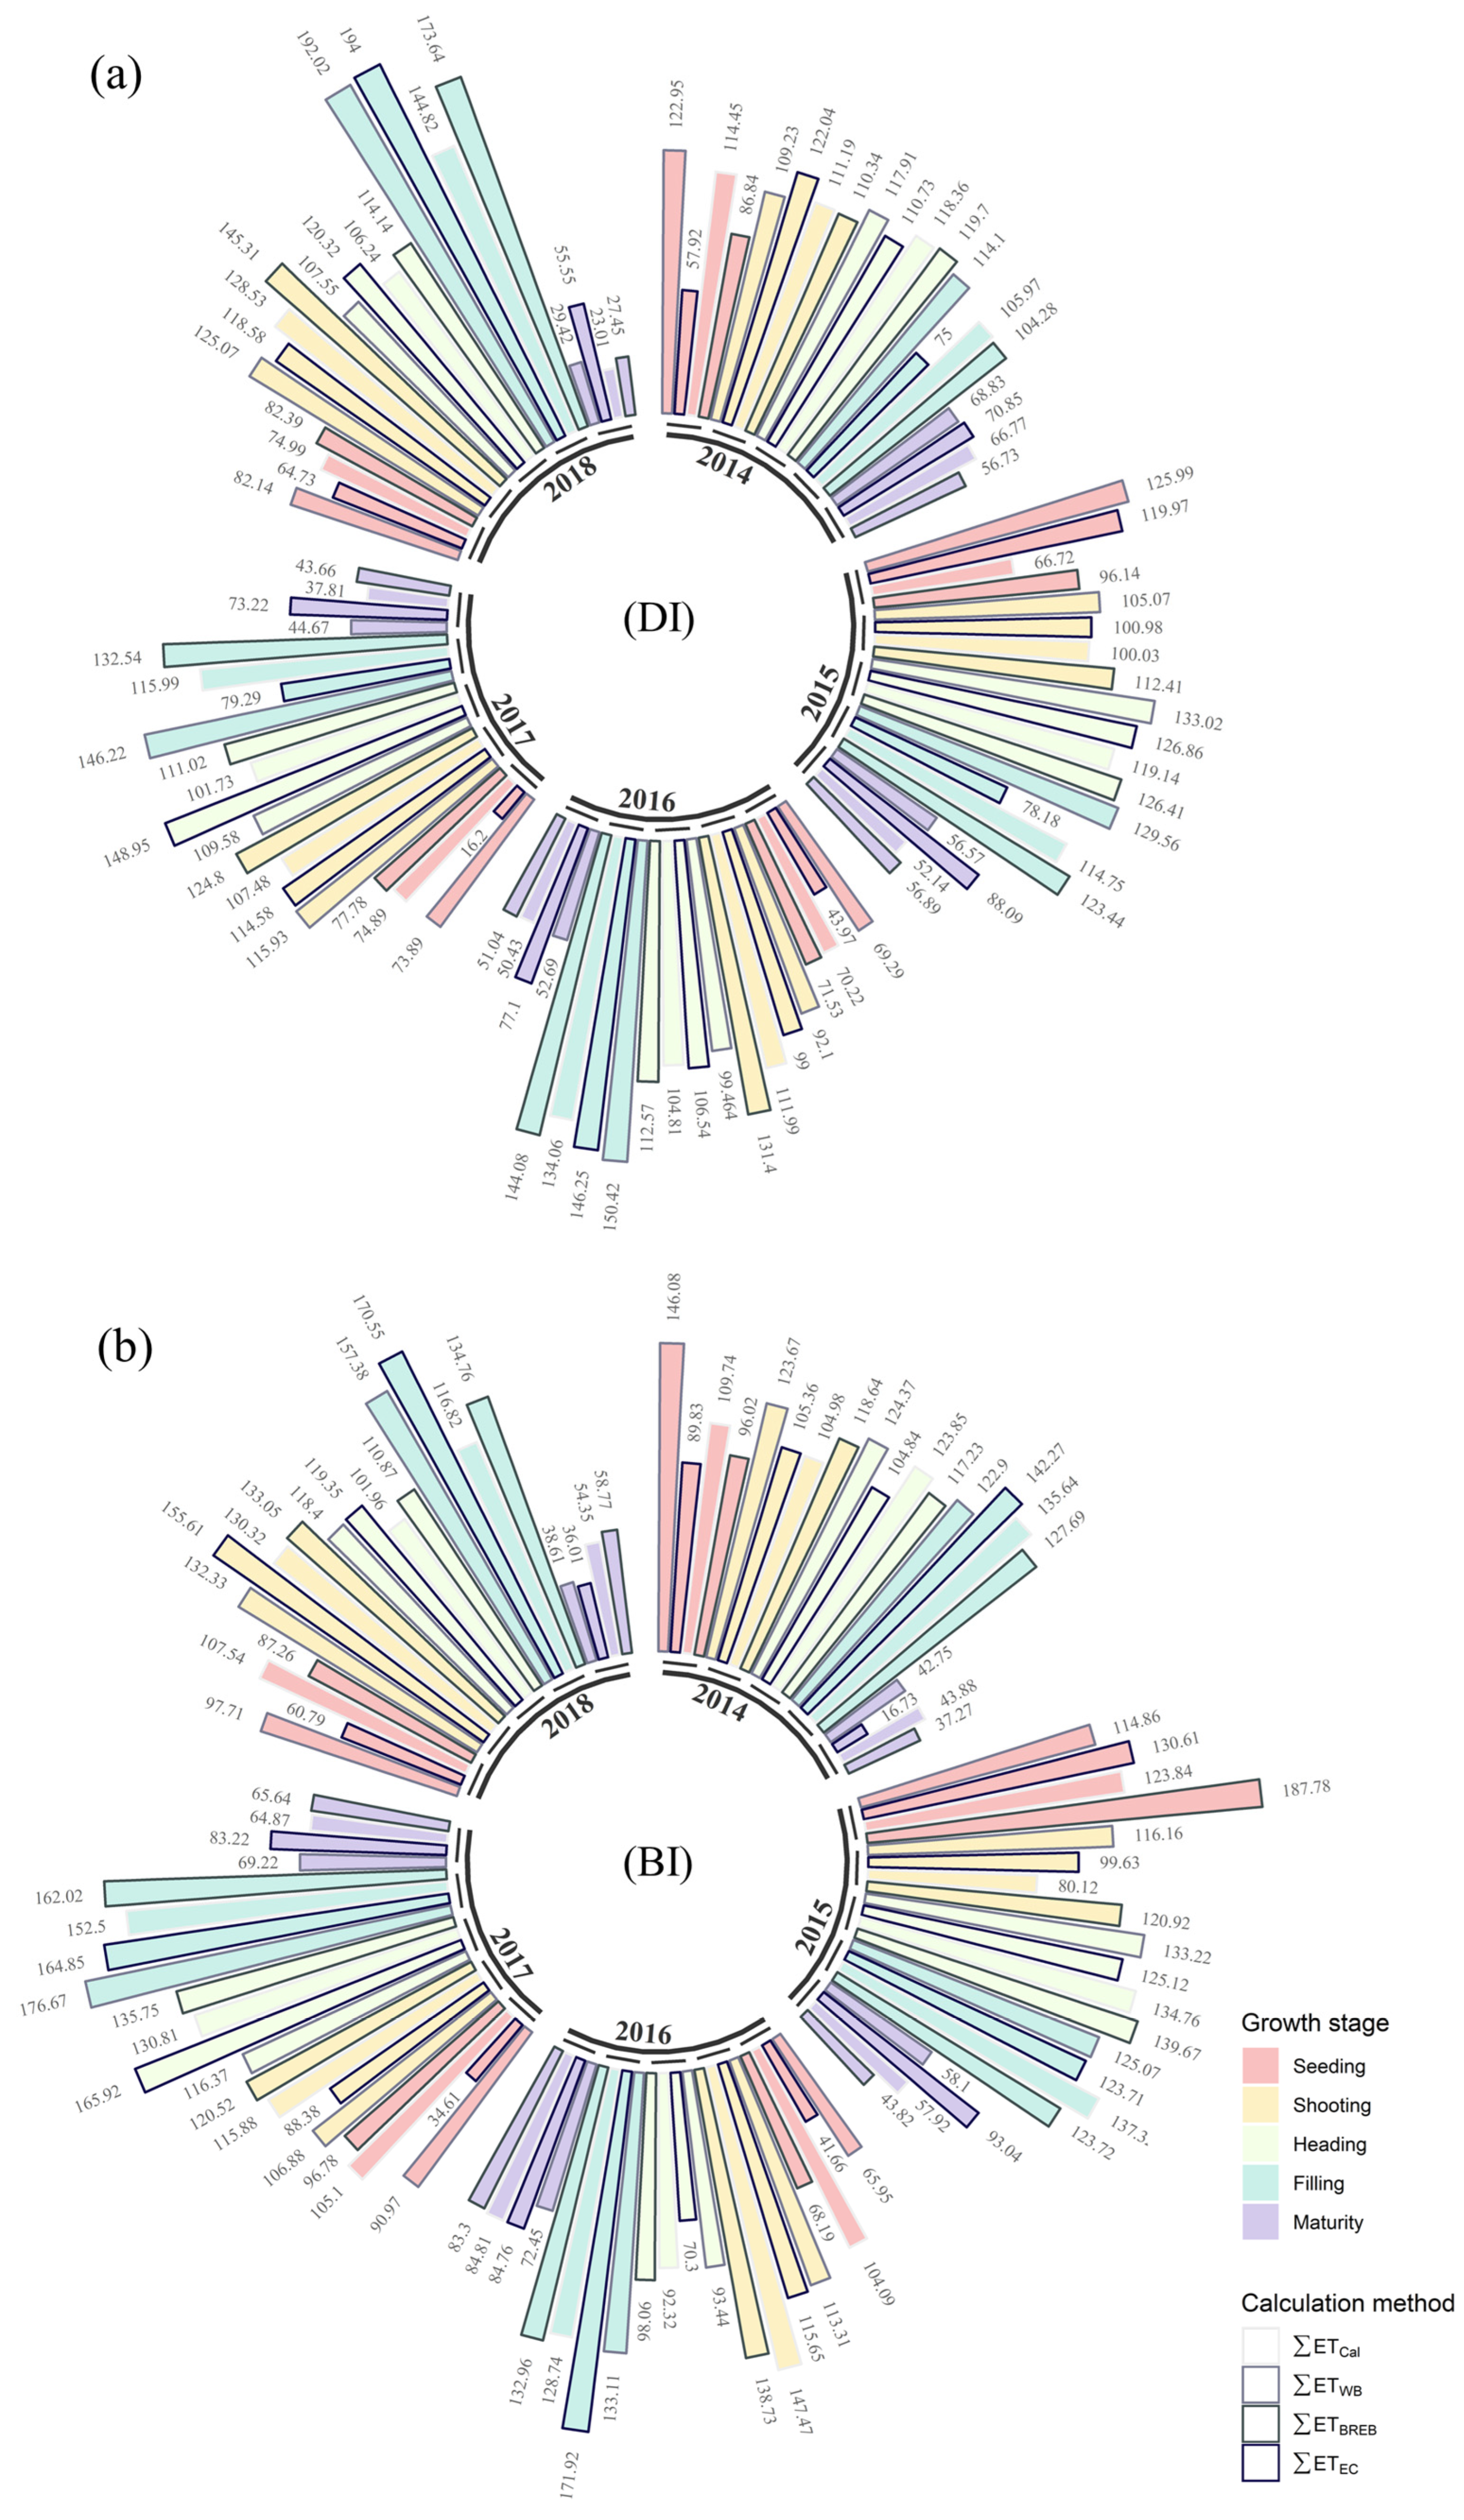
Figure 10 shows a comparison of the ETa estimated by the METRIC model for each growth stage with the ETa obtained from the other observations. After the expansion of daily ETa using the Cubic B-Spline method, the sum of each growth stage was determined and compared with three observations (water balance, Bowen ratio, and EC system, with light-to-dark border colors). For this petal map, the more uniform the petal lengths of the same color, the higher the consistency of the four methods of obtaining ETa, and the better the accuracy of the estimates. In the same year, ETa fluctuated with changes in growth stages. Using the extended model on the time scale with EC observations as validation values, the ETa estimates for the different growth stages of maize were accurate, with the worst Bias occurring during the shooting (yellow bars) period (BiasBI = 15.37 mm, BiasDI = 7.90 mm). Maize growth during the shooting stage is very fast and cannot be accurately represented when there are few satellite remote sensing images. Due to the limited amount of data provided by remote sensing images, estimates can only be obtained based on the overall trend of rapidly growing maize. This shortcoming can be compensated for by increasing the temporal resolution of remote sensing data using methods such as data fusion. The time scale expansion for ETa is only quantitatively represented and cannot demonstrate the spatial variability at times other than satellite overpass days. Therefore, further in-depth studies are needed to analyze the spatial variability of ETa at different growth stages and its relationship with precipitation.
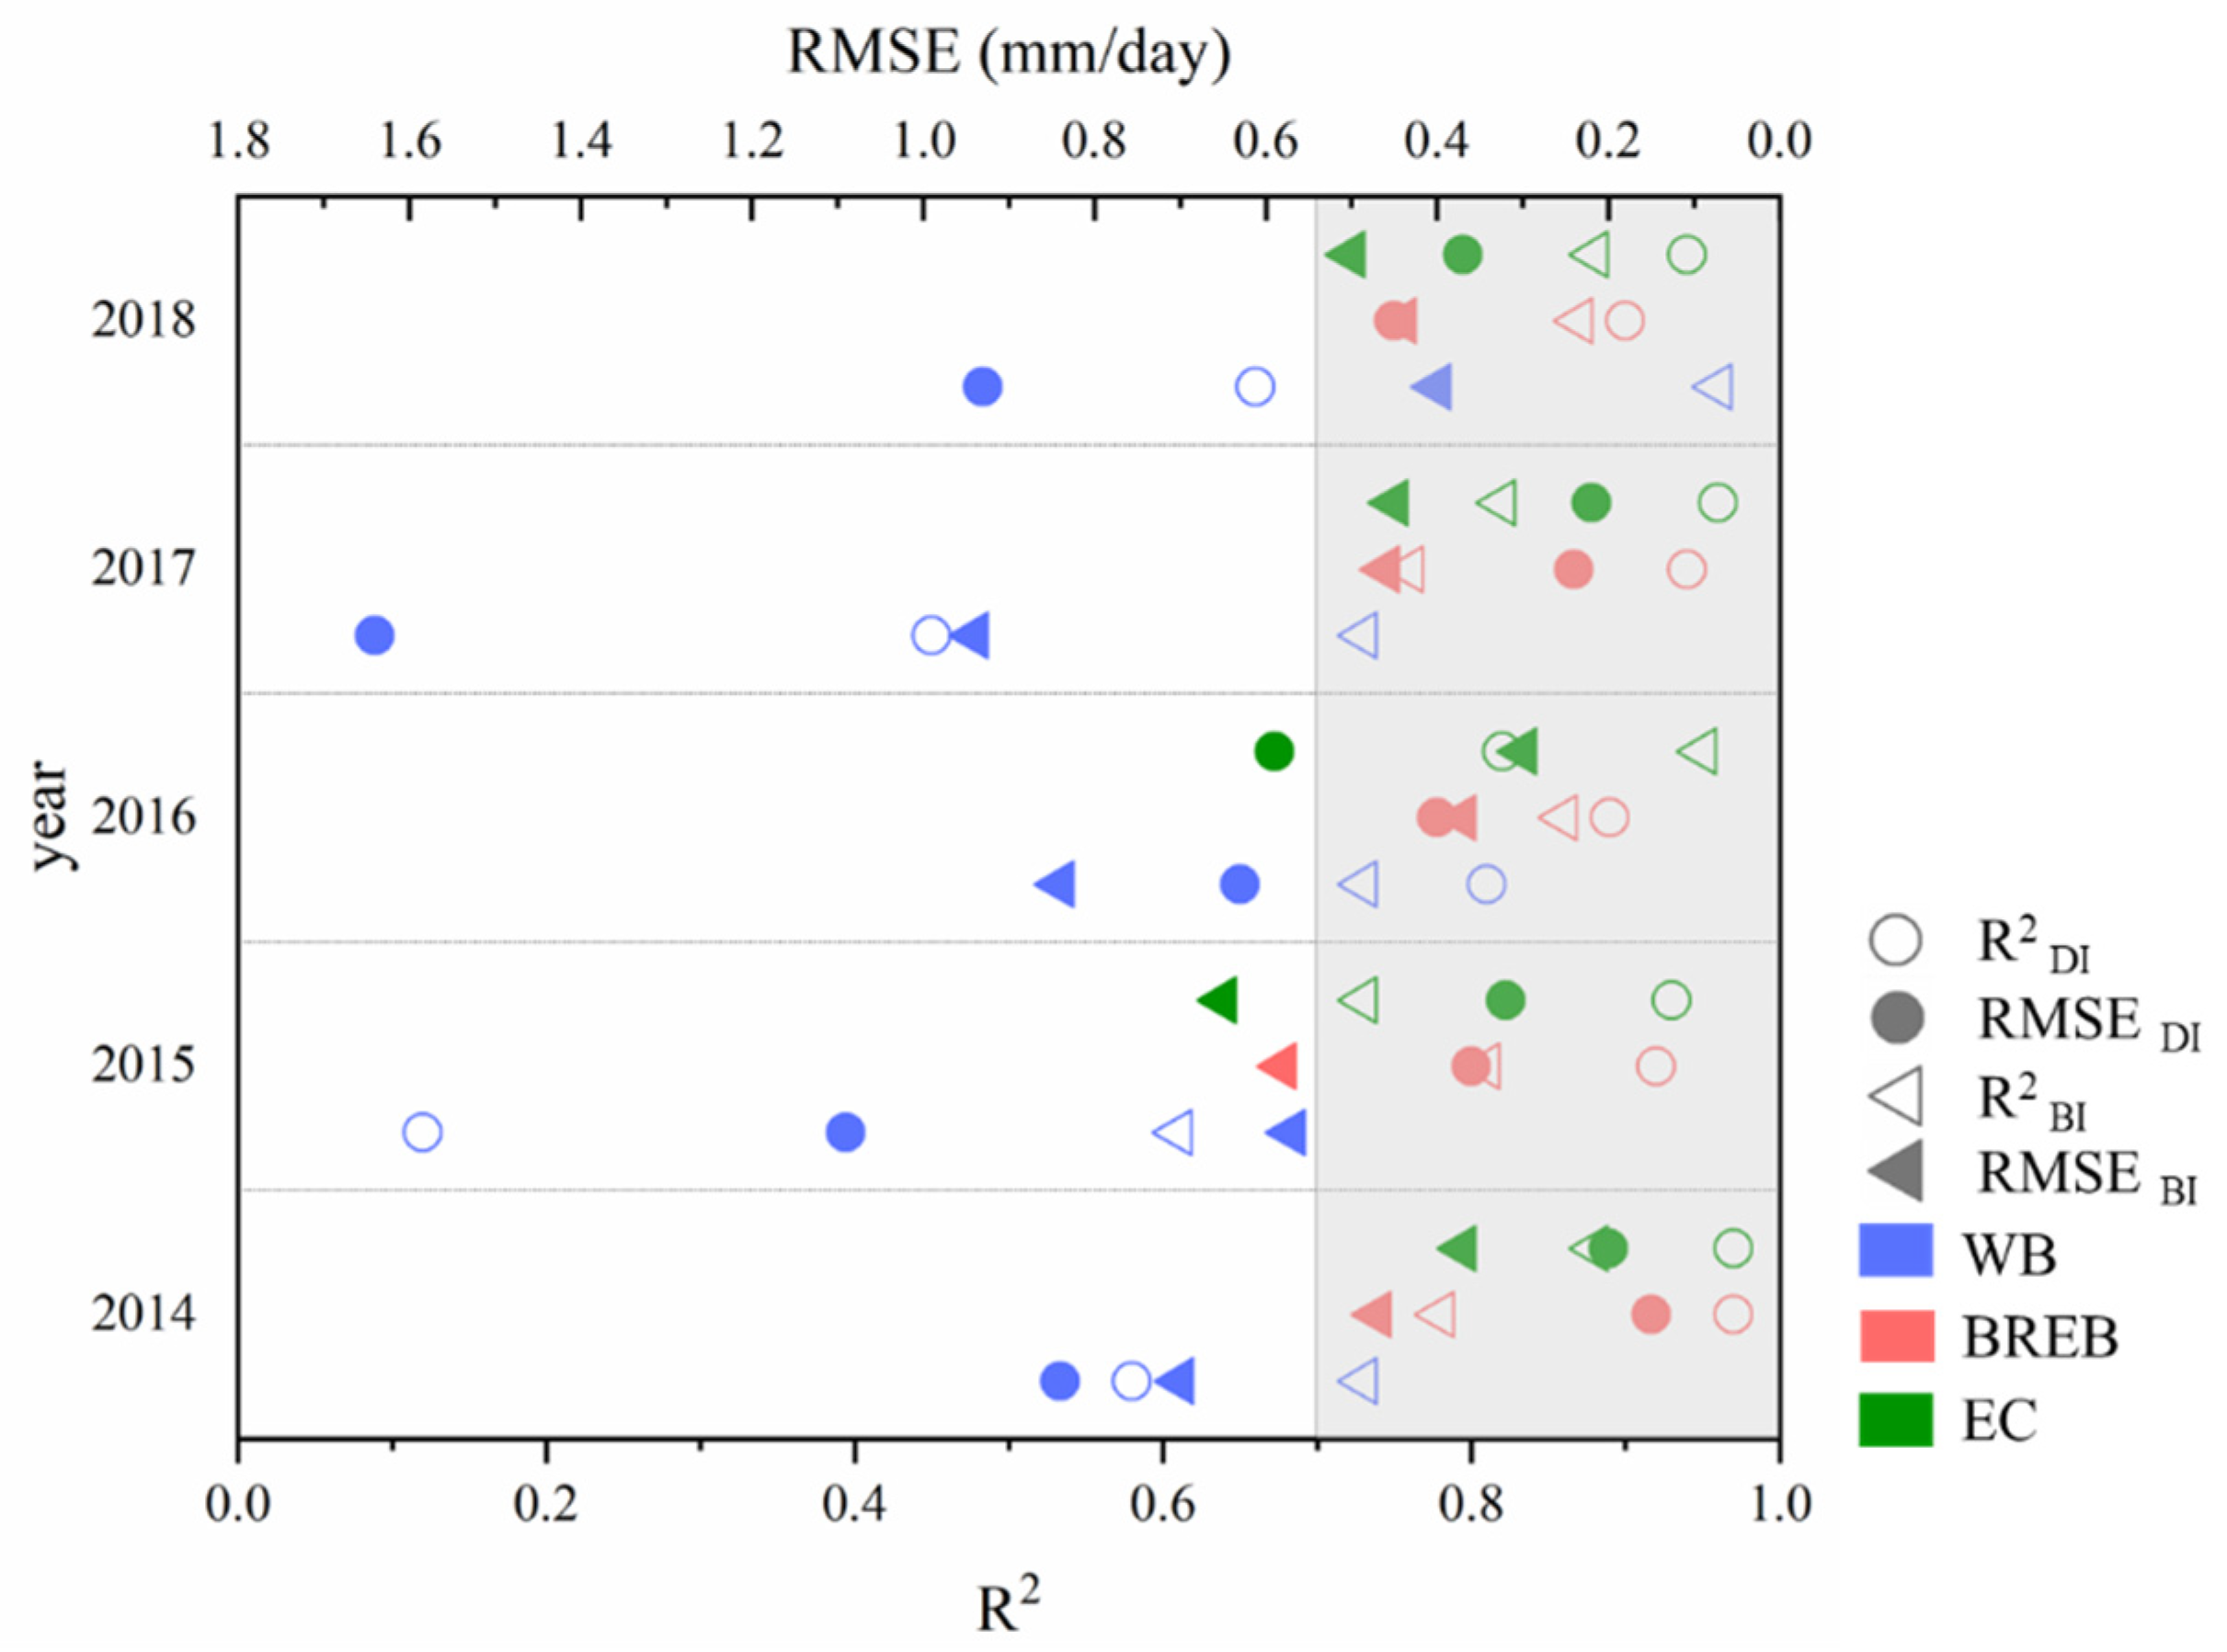
The average daily ETa was calculated based on the number of days and time scale extensions in each growth stage, and then the calculated ETa was compared with the three observations. The indicators (R2 and RMSE) between the estimated and measured ETa showed high accuracy for most cases (Figure 11). However, the difference between the ETa average obtained from remote sensing estimates and the WB data was extensive and performed poorly in most years. The ETa obtained from the WB method at the seeding stage was much lower than that obtained from the other observation data, as seen from the ETa distribution at each growth stage in Figure 10b for 2017. The soil moisture content at seedling and maturity is low, but the measurement errors are high. Figure 11 shows the average daily ETa at each growth stage for validation, amplifying the impact of ETa at the seedling stage, which accounted for a smaller proportion of the total period. Using the BREB and EC observations for validation, the errors in the remote sensing estimates were small, with R2 (red and green hollow symbols) greater than 0.7 and RMSE (red and green solid symbols) less than 0.6 mm/day for both irrigation methods over five years.
The results of the model for estimating water consumption in maize fields were highly accurate. Therefore, we expected to discriminate field differences between the two irrigation methods (drip vs. border). However, on satellite overpass days, ETa was related to the change in surface soil water content caused by irrigation, and the difference in daily ETa between the two irrigation methods could not be distinguished. The whole crop season ETa was calculated, and the differences in the total ETa under the two irrigation methods are shown in Figure 12. The timing of the satellite overpass was irregular for the entire maize growing period, owing to clouds. Therefore, this failed to reflect the effect on ETa when BI soil evaporation was higher. Combined with the trend of the curves in Figure 7b, it was found that the ETa of BI obtained after interpolating the satellite overpass time in 2015 was always smaller than the ETa of DI in that year. The ETa of BI maize cropland in other years was higher than DI maize cropland, which was consistent with the observed data. The differences in ETa under the two irrigation methods obtained using the three methods observed in 2018 were inconsistent, but their mean values were consistent with the model estimates (ΣETBI > ΣETDI). It is clear from the above that the remote sensing evapotranspiration model is a reliable method for estimating ETa when image conditions permit it. For example, Semmens et al. [71] used a multi-sensor satellite data fusion approach combined with a two-source energy balance (TSEB)-based ET algorithm (Atmosphere–Land Exchange Inverse (ALEXI)) in Sacramento and San Joaquin counties, California, USA, to produce estimates of daily ETa that were consistent with ground-based flux measurements for two neighboring Pinot Noir vineyards of different ages (with relative mean absolute errors in the order of 19–23% and an RMSE of about 1 mm/d).

5. Summary and Conclusions

Previous studies have focused only on the accuracy of the METRIC model to estimate SEBCs or ETa for one or a few crops in a specific region. However, the reliability of the METRIC model was verified, and a new direction for its application should be explored. Therefore, in this study, we hope to use a remote sensing evapotranspiration model to obtain the regional ETa and further understand whether it can be used to distinguish the differences in evapotranspiration among different irrigation methods.
This study used Ta obtained from a regression model to estimate Rn, which improved its accuracy. The estimation accuracy of LE from the METRIC model showed good performance (R2 and RMSE were 0.88 and 42.44 W/m2, respectively), which verified the applicability of the model in Northwest China. Good results were also obtained in estimating the SEBCs and ETa from farmland at different timescales. The total accuracy of the ETa estimation on the five-year overpass day of maize farmland reached R2 = 0.93 and RMSE = 0.48 mm. When the anomaly was removed in 2015, the 4-year average ETa of maize was 31 mm lower for DI than for BI, with the mean value of the three observations being 40 mm. The model has a high discriminative ability for maize under different irrigation methods, expanding the application scope of the satellite remote sensing evapotranspiration model.
The maize observation sites in this study were similar to most local farmlands and were managed with high water and fertilizer. The METRIC model was shown to have the ability to distinguish ETa differences between different irrigation methods and is a powerful tool for the large-scale demonstration of the changes in and impacts of water-saving irrigation on conventional irrigation. We also believe that a higher precision ETa dataset for maize fields is reliable support for the further monitoring of crop growth and yield. Although the current limitations of the spatial and temporal resolution of satellite remote sensing data do not allow for the monitoring of changes in irrigation within plots, total water use calculations over the maize growth cycle show good results, which is very beneficial for regional water managers to plan and schedule agricultural water use. This is a good starting point and evidence for the application of satellite remote sensing technology to distinguish regional-scale farmland management measures and is expected to be applied to high-precision farmland management with the support of remote sensing data quality and quantity.

Author Contributions

Conceptualization, Y.L.; methodology, Y.L. and S.O.-F.; software, Y.L.; validation, Y.F, Y.H. and Y.L.; formal analysis, Y.L. and S.W.; investigation, W.Y.; resources, S.L.; data curation, S.L. and Y.L.; writing—original draft preparation, Y.L.; writing—review and editing, Y.L., Y.F., Y.H. and S.W.; visualization, Y.L. and W.Y.; supervision, W.Y., F.T. and S.W.; project administration, S.O.-F. and S.W.; funding acquisition, S.O.-F. and S.W. All authors have read and agreed to the published version of the manuscript.

Funding

This research was funded by the International and regional cooperation and exchange projects of the National Natural Science Foundation of China (51961125205), the National Key R&D Program of China (2022YFD1900401), and the Chilean government through National Agency for Research and Development (ANID)/PCI (NSFC190013).

Data Availability Statement

The data sources used in this study are greatly appreciated. Landsat 8 satellite remote sensing and digital elevation model (DEM) data were provided by the Google Earth Engine (GEE) platform (https://earthengine.google.com/ (accessed on 25 December 2023)). Meteorological data were obtained from the National Meteorological Information Center (http://data.cma.cn/ (accessed on 25 December 2023)). Ground observation data were provided by the National Field Scientific Observation and Research Station on Efficient Water Use of Oasis Agriculture in Wuwei of Gansu Province. This study is available on request from the corresponding author.

Conflicts of Interest

The authors declare no conflicts of interest.

Appendix A

Table A1. Definition of variables in the METRIC model.
SymbolDefinitionUnit/Constant
C p Air heat constant 1004   J / kg / K
E T d a i l y i Evapotranspiration value on the i daymm
E T d a i l y Ratio of actual to reference evapotranspirationmm
E T i n s t Instantaneous evapotranspirationmm/h
E T o v e r p a s s Instantaneous evapotranspiration at overpass time from satelliteMm/h
E T r F Ratio of actual to reference evapotranspiration/
E T r _ h o u r l y Instantaneous reference evapotranspirationmm
E T t o t a l Total water consumption during the growing periodmm
G S C Solar constant1367 W/m2
R L Outgoing long-wave radiationW/m2
R L Incoming long-wave incidenceW/m2
R S Surface incident short-wave radiationW/m2
R n Net radiation fluxW/m2
T s Surface temperatureK
T a Near-surface air temperatureK
d r Relative Earth–Sun distance/
r a h Aerodynamic resistances/m
ε s Surface emissivity/
ρ a i r Air density1.293 kg/m3
G Soil and water flux heatW/m2
H Sensible heat fluxW/m2
L E Latent heat fluxW/m2
N Time interval between sunrise and sunseth
d T Temperature difference between the height Z1 of the ground and the reference height Z2 of 2 mk
U*Friction velocitym/s
i Number of days in the growing period/
t Satellite overpass time/
z Local altitudem
θ Solar incident anglerad
λ Latent heat of water vaporizationJ/kg
σ Stefan–Boltzman constant 5.67 × 10 8   W / m 2 / K 4

References

  1. Su, Z. The Surface Energy Balance System (SEBS) for Estimation of Turbulent Heat Fluxes. Hydrol. Earth Syst. Sci. 2002, 6, 85–99. [Google Scholar] [CrossRef]
  2. Byun, K.; Liaqat, U.W.; Choi, M. Dual-Model Approaches for Evapotranspiration Analyses over Homo- and Heterogeneous Land Surface Conditions. Agric. For. Meteorol. 2014, 197, 169–187. [Google Scholar] [CrossRef]
  3. Sauer, T.J.; Hatfield, J.L.; Prueger, J.H.; Norman, J.M. Surface Energy Balance of a Corn Residue-Covered Field. Agric. For. Meteorol. 1998, 89, 155–168. [Google Scholar] [CrossRef]
  4. Wang, X.; Huo, Z.; Shukla, M.K.; Wang, X.; Guo, P.; Xu, X. Energy Fl Uxes and Evapotranspiration over Irrigated Maize Fi Eld in an Arid Area with Shallow Groundwater. Agric. Water Manag. 2020, 228, 105922. [Google Scholar] [CrossRef]
  5. Bi, W.; Weng, B.; Yan, D.; Wang, M.; Wang, H.; Wang, J.; Yan, H. Effects of Drought-Flood Abrupt Alternation on Phosphorus in Summer Maize Farmland Systems. Geoderma 2020, 363, 114147. [Google Scholar] [CrossRef]
  6. He, L.; Bao, J.; Daccache, A.; Wang, S.; Guo, P. Optimize the Spatial Distribution of Crop Water Consumption Based on a Cellular Automata Model: A Case Study of the Middle Heihe River Basin, China. Sci. Total Environ. 2020, 720, 137569. [Google Scholar] [CrossRef]
  7. Turral, H.; Burke, J.; Faures, J.M.; Faures, J.M. Climate Change, Water and Food Security; Food and Agriculture Organization of the United Nations: Rome, Italy, 2011; p. 204. [Google Scholar]
  8. WWAP (United Nations World Water Assessment Programme)/UN-Water. The United Nations World Water Development Report 2018: Nature-Based Solutions for Water; UN-Water: Geneva, Switzerland, 2018; ISBN 9789231002649. Available online: https://www.unwater.org/publications/world-water-development-report-2018 (accessed on 25 December 2023).
  9. Kang, S.; Hao, X.; Du, T.; Tong, L.; Su, X.; Lu, H.; Li, X.; Huo, Z.; Li, S.; Ding, R. Improving Agricultural Water Productivity to Ensure Food Security in China under Changing Environment: From Research to Practice. Agric. Water Manag. 2017, 179, 5–17. [Google Scholar] [CrossRef]
  10. Huang, Y.; Li, Y.P.; Chen, X.; Ma, Y.G. Optimization of the Irrigation Water Resources for Agricultural Sustainability in Tarim River Basin, China. Agric. Water Manag. 2012, 107, 74–85. [Google Scholar] [CrossRef]
  11. Vörösmarty, C.J.; Federer, C.A.; Schloss, A.L. Potential Evaporation Functions Compared on US Watersheds: Possible Implications for Global-Scale Water Balance and Terrestrial Ecosystem Modeling. J. Hydrol. 1998, 207, 147–169. [Google Scholar] [CrossRef]
  12. Kite, G. Using a Basin-Scale Hydrological Model to Estimate Crop Transpiration and Soil Evaporation. J. Hydrol. 2000, 229, 59–69. [Google Scholar] [CrossRef]
  13. Senay, G.B.; Budde, M.E.; Verdin, J.P. Enhancing the Simplified Surface Energy Balance (SSEB) Approach for Estimating Landscape ET: Validation with the METRIC Model. Agric. Water Manag. 2011, 98, 606–618. [Google Scholar] [CrossRef]
  14. De C. Teixeira, A.H.; Bastiaanssen, W.G.M.; Ahmad, M.D.; Bos, M.G. Reviewing SEBAL Input Parameters for Assessing Evapotranspiration and Water Productivity for the Low-Middle São Francisco River Basin, Brazil. Part A: Calibration and Validation. Agric. For. Meteorol. 2009, 149, 462–476. [Google Scholar] [CrossRef]
  15. Wetzel Seemann, S.; Li, J.; Gumley, L.E.; Strabala, K.I.; Menzel, W.P. Operational Retrieval of Atmospheric Temperature, Moisture, and Ozone from MODIS Infrared Radiances. Appl. Weather Satell. 2003, 4895, 168. [Google Scholar] [CrossRef]
  16. Zamani Losgedaragh, S.; Rahimzadegan, M. Evaluation of SEBS, SEBAL, and METRIC Models in Estimation of the Evaporation from the Freshwater Lakes (Case Study: Amirkabir Dam, Iran). J. Hydrol. 2018, 561, 523–531. [Google Scholar] [CrossRef]
  17. Xiang, K.; Li, Y.; Horton, R.; Feng, H. Similarity and Difference of Potential Evapotranspiration and Reference Crop Evapotranspiration—A Review. Agric. Water Manag. 2020, 232, 106043. [Google Scholar] [CrossRef]
  18. Douglas, E.M.; Jacobs, J.M.; Sumner, D.M.; Ray, R.L. A Comparison of Models for Estimating Potential Evapotranspiration for Florida Land Cover Types. J. Hydrol. 2009, 373, 366–376. [Google Scholar] [CrossRef]
  19. Srivastava, A.; Sahoo, B.; Raghuwanshi, N.S.; Singh, R. Evaluation of Variable-Infiltration Capacity Model and MODIS-Terra Satellite-Derived Grid-Scale Evapotranspiration Estimates in a River Basin with Tropical Monsoon-Type Climatology. J. Irrig. Drain. Eng. 2017, 143, 04017028. [Google Scholar] [CrossRef]
  20. Adamala, S.; Raghuwanshi, N.S.; Mishra, A.; Tiwari, M.K. Evapotranspiration Modeling Using Second-Order Neural Networks. J. Hydrol. Eng. 2014, 19, 1131–1140. [Google Scholar] [CrossRef]
  21. Peng, L.; Li, Y.; Feng, H. The Best Alternative for Estimating Reference Crop Evapotranspiration in Different Sub-Regions of Mainland China. Sci. Rep. 2017, 7, 5458. [Google Scholar] [CrossRef]
  22. Mokhtari, A.; Noory, H.; Pourshakouri, F.; Haghighatmehr, P.; Afrasiabian, Y.; Razavi, M.; Fereydooni, F.; Sadeghi Naeni, A. Calculating Potential Evapotranspiration and Single Crop Coefficient Based on Energy Balance Equation Using Landsat 8 and Sentinel-2. ISPRS J. Photogramm. Remote Sens. 2019, 154, 231–245. [Google Scholar] [CrossRef]
  23. Alberto, M.C.R.; Quilty, J.R.; Buresh, R.J.; Wassmann, R.; Haidar, S.; Correa, T.Q.; Sandro, J.M. Actual Evapotranspiration and Dual Crop Coefficients for Dry-Seeded Rice and Hybrid Maize Grown with Overhead Sprinkler Irrigation. Agric. Water Manag. 2014, 136, 1–12. [Google Scholar] [CrossRef]
  24. Garrido-Rubio, J.; Calera, A.; Arellano, I.; Belmonte, M.; Fraile, L.; Ortega, T.; Bravo, R.; González-Piqueras, J. Evaluation of Remote Sensing-Based Irrigation Water Accounting at River Basin District Management Scale. Remote Sens. 2020, 12, 3187. [Google Scholar] [CrossRef]
  25. Paço, T.A.; Pôças, I.; Cunha, M.; Silvestre, J.C.; Santos, F.L.; Paredes, P.; Pereira, L.S. Evapotranspiration and Crop Coefficients for a Super Intensive Olive Orchard. An Application of SIMDualKc and METRIC Models Using Ground and Satellite Observations. J. Hydrol. 2014, 519, 2067–2080. [Google Scholar] [CrossRef]
  26. Bastiaanssen, W.G.M.; Noordman, E.J.M.; Pelgrum, H.; Davids, G.; Thoreson, B.P.; Allen, R.G. SEBAL Model with Remotely Sensed Data to Improve Water-Resources Management under Actual Field Conditions. J. Irrig. Drain. Eng. 2005, 131, 85–93. [Google Scholar] [CrossRef]
  27. Paul, G.; Gowda, P.H.; Vara Prasad, P.V.; Howell, T.A.; Aiken, R.M.; Neale, C.M.U. Investigating the Influence of Roughness Length for Heat Transport (Zoh) on the Performance of SEBAL in Semi-Arid Irrigated and Dryland Agricultural Systems. J. Hydrol. 2014, 509, 231–244. [Google Scholar] [CrossRef]
  28. Liaqat, U.W.; Choi, M. Surface Energy Fluxes in the Northeast Asia Ecosystem: SEBS and METRIC Models Using Landsat Satellite Images. Agric. For. Meteorol. 2015, 214–215, 60–79. [Google Scholar] [CrossRef]
  29. French, A.N.; Hunsaker, D.J.; Thorp, K.R. Remote Sensing of Environment Remote Sensing of Evapotranspiration over Cotton Using the TSEB and METRIC Energy Balance Models. Remote Sens. Environ. 2015, 158, 281–294. [Google Scholar] [CrossRef]
  30. Elnmer, A.; Khadr, M.; Kanae, S.; Tawfik, A. Mapping Daily and Seasonally Evapotranspiration Using Remote Sensing Techniques over the Nile Delta. Agric. Water Manag. 2019, 213, 682–692. [Google Scholar] [CrossRef]
  31. Allen, R.G.; Tasumi, M.; Morse, A.; Trezza, R.; Wright, J.L.; Bastiaanssen, W.; Kramber, W.; Lorite, I.; Robison, C.W. Satellite-Based Energy Balance for Mapping Evapotranspiration with Internalized Calibration (METRIC)—Applications. J. Irrig. Drain. Eng. 2007, 133, 395–406. [Google Scholar] [CrossRef]
  32. Bastiaanssen, W.G.M.; Menenti, M.; Feddes, R.A.; Holtslag, A.A.M. A Remote Sensing Surface Energy Balance Algorithm for Land (SEBAL). 1. Formulation. J. Hydrol. 1998, 212–213, 198–212. [Google Scholar] [CrossRef]
  33. Allen, R.; Irmak, A.; Trezza, R.; Hendrickx, J.M.H.; Bastiaanssen, W.; Kjaersgaard, J. Satellite-Based ET Estimation in Agriculture Using SEBAL and METRIC. Hydrol. Process. 2011, 25, 4011–4027. [Google Scholar] [CrossRef]
  34. Allen, R.G.; Burnett, B.; Kramber, W.; Huntington, J.; Kjaersgaard, J.; Kilic, A.; Kelly, C.; Trezza, R. Automated Calibration of the METRIC-Landsat Evapotranspiration Process. J. Am. Water Resour. Assoc. 2013, 49, 563–576. [Google Scholar] [CrossRef]
  35. Trezza, R.; Allen, R.G.; Tasumi, M. Estimation of Actual Evapotranspiration along the Middle Rio Grande of New Mexico Using MODIS and Landsat Imagery with the METRIC Model. Remote Sens. 2013, 5, 5397–5423. [Google Scholar] [CrossRef]
  36. Choi, M.; Kustas, W.P.; Anderson, M.C.; Allen, R.G.; Li, F.; Kjaersgaard, J.H. An Intercomparison of Three Remote Sensing-Based Surface Energy Balance Algorithms over a Corn and Soybean Production Region (Iowa, U.S.) during SMACEX. Agric. For. Meteorol. 2009, 149, 2082–2097. [Google Scholar] [CrossRef]
  37. Nisa, Z.; Khan, M.S.; Govind, A.; Marchetti, M.; Lasserre, B.; Magliulo, E.; Manco, A. Evaluation of SEBS, METRIC-EEFlux, and QWaterModel Actual Evapotranspiration for a Mediterranean Cropping System in Southern Italy. Agronomy 2021, 11, 345. [Google Scholar] [CrossRef]
  38. Wang, Y.; Li, S.; Qin, S.; Guo, H.; Yang, D.; Lam, H.M. How Can Drip Irrigation Save Water and Reduce Evapotranspiration Compared to Border Irrigation in Arid Regions in Northwest China. Agric. Water Manag. 2020, 239, 106256. [Google Scholar] [CrossRef]
  39. Qin, S.; Li, S.; Kang, S.; Du, T.; Tong, L.; Ding, R. Can the Drip Irrigation under Film Mulch Reduce Crop Evapotranspiration and Save Water under the Sufficient Irrigation Condition? Agric. Water Manag. 2016, 177, 128–137. [Google Scholar] [CrossRef]
  40. Gao, L.; Kang, S.; Bai, X.; Li, S.; Niu, J.; Ding, R. Water-Carbon Relationships and Variations from the Canopy to Ecosystem Scale in a Sparse Vineyard in the Northwest China. J. Hydrol. 2021, 600, 126469. [Google Scholar] [CrossRef]
  41. Becker, W.R.; Ló, T.B.; Johann, J.A.; Mercante, E. Statistical Features for Land Use and Land Cover Classification in Google Earth Engine. Remote Sens. Appl. Soc. Environ. 2021, 21, 100459. [Google Scholar] [CrossRef]
  42. Li, S.; Zhang, L.; Kang, S.; Tong, L.; Du, T.; Hao, X.; Zhao, P. Comparison of Several Surface Resistance Models for Estimating Crop Evapotranspiration over the Entire Growing Season in Arid Regions. Agric. For. Meteorol. 2015, 208, 1–15. [Google Scholar] [CrossRef]
  43. Li, S.; Kang, S.; Zhang, L.; Zhang, J. On the Attribution of Changing Crop Evapotranspiration in Arid Regions Using Four Methods. J. Hydrol. 2018, 563, 576–585. [Google Scholar] [CrossRef]
  44. Bowen, I.S. The Ratio of Heat Losses by Conduction and by Evaporation from Any Water Surface. Phys. Rev. 1926, 27, 779–787. [Google Scholar] [CrossRef]
  45. Perez, P.J.; Castellvi, F.; Ibañez, M.; Rosell, J.I. Assessment of Reliability of Bowen Ratio Method for Partitioning Fluxes. Agric. For. Meteorol. 1999, 97, 141–150. [Google Scholar] [CrossRef]
  46. Baldocchi, D.D. Assessing the Eddy Covariance Technique for Evaluating Carbon Dioxide Exchange Rates of Ecosystems: Past, Present and Future. Glob. Chang. Biol. 2003, 9, 479–492. [Google Scholar] [CrossRef]
  47. Shuttleworth, W.J. Putting the “vap” into Evaporation. Hydrol. Earth Syst. Sci. 2007, 11, 210–244. [Google Scholar] [CrossRef]
  48. Li, Z.L.; Tang, R.; Wan, Z.; Bi, Y.; Zhou, C.; Tang, B.; Yan, G.; Zhang, X. A Review of Current Methodologies for Regional Evapotranspiration Estimation from Remotely Sensed Data. Sensors 2009, 9, 3801–3853. [Google Scholar] [CrossRef]
  49. Windahl, E.; de Beurs, K. An Intercomparison of Landsat Land Surface Temperature Retrieval Methods under Variable Atmospheric Conditions Using in Situ Skin Temperature. Int. J. Appl. Earth Obs. Geoinf. 2016, 51, 11–27. [Google Scholar] [CrossRef]
  50. Chen, F.; Liu, Y.; Liu, Q.; Qin, F. A Statistical Method Based on Remote Sensing for the Estimation of Air Temperature in China. Int. J. Climatol. 2015, 35, 2131–2143. [Google Scholar] [CrossRef]
  51. Liu, Y.; Ortega-Farías, S.; Tian, F.; Wang, S.; Li, S. Estimation of Surface and Near-Surface Air Temperatures in Arid Northwest China Using Landsat Satellite Images. Front. Environ. Sci. 2021, 9, 609. [Google Scholar] [CrossRef]
  52. Flood, N. Continuity of Reflectance Data between Landsat-7 ETM+ and Landsat-8 OLI, for Both Top-of-Atmosphere and Surface Reflectance: A Study in the Australian Landscape. Remote Sens. 2014, 6, 7952–7970. [Google Scholar] [CrossRef]
  53. Liang, S. Narrowband to Broadband Conversions of Land Surface Albedo I. Remote Sens. Environ. 2001, 76, 213–238. [Google Scholar] [CrossRef]
  54. Allen, R.G.; Tasumi, M.; Trezza, R. Satellite-Based Energy Balance for Mapping Evapotranspiration with Internalized Calibration (METRIC)—Model. J. Irrig. Drain. Eng. 2007, 133, 380–394. [Google Scholar] [CrossRef]
  55. Ortega-Salazar, S.; Ortega-Farías, S.; Kilic, A.; Allen, R. Performance of the METRIC Model for Mapping Energy Balance Components and Actual Evapotranspiration over a Superintensive Drip-Irrigated Olive Orchard. Agric. Water Manag. 2021, 251, 106861. [Google Scholar] [CrossRef]
  56. Bastiaanssen, W.G.M. SEBAL-Based Sensible and Latent Heat Fluxes in the Irrigated Gediz Basin, Turkey. J. Hydrol. 2000, 229, 87–100. [Google Scholar] [CrossRef]
  57. Numata, I.; Khand, K.; Kjaersgaard, J.; Cochrane, M.A.; Silva, S.S. Evaluation of Landsat-Based Metric Modeling to Provide High-Spatial Resolution Evapotranspiration Estimates for Amazonian Forests. Remote Sens. 2017, 9, 46. [Google Scholar] [CrossRef]
  58. Tayebi, S.; Momani, S.; Abu, O. The Cubic B-Spline Interpolation Method for Numerical Point Solutions of Conformable Boundary Value Problems. Alex. Eng. J. 2022, 61, 1519–1528. [Google Scholar] [CrossRef]
  59. Oliveira, B.S.; Moraes, E.C.; Carrasco-Benavides, M.; Bertani, G.; Mataveli, G.A.V. Improved Albedo Estimates Implemented in the METRIC Model for Modeling Energy Balance Fluxes and Evapotranspiration over Agricultural and Natural Areas in the Brazilian Cerrado. Remote Sens. 2018, 10, 1181. [Google Scholar] [CrossRef]
  60. Carrasco-Benavides, M.; Ortega-Farías, S.; Lagos, L.O.; Kleissl, J.; Morales-Salinas, L.; Kilic, A. Parameterization of the Satellite-Based Model (METRIC) for the Estimation of Instantaneous Surface Energy Balance Components over a Drip-Irrigated Vineyard. Remote Sens. 2014, 6, 11342–11371. [Google Scholar] [CrossRef]
  61. Feng, J.; Wang, W.; Che, T.; Xu, F. Performance of the Improved Two-Source Energy Balance Model for Estimating Evapotranspiration over the Heterogeneous Surface. Agric. Water Manag. 2023, 278, 108159. [Google Scholar] [CrossRef]
  62. Ge, N.; Zhong, L.; Ma, Y.; Cheng, M.; Wang, X.; Zou, M.; Huang, Z. Estimation of Land Surface Heat Fluxes Based on Landsat 7 ETM+ Data and Field Measurements over the Northern Tibetan Plateau. Remote Sens. 2019, 11, 2899. [Google Scholar] [CrossRef]
  63. Mutanga, O.; Skidmore, A.K. Narrow Band Vegetation Indices Overcome the Saturation Problem in Biomass Estimation. Int. J. Remote Sens. 2004, 25, 3999–4014. [Google Scholar] [CrossRef]
  64. Kamyab, A.D.; Mokhtari, S.; Jafarinia, R. A Comparative Study in Quantification of Maize Evapotranspiration for Iranian Maize Farm Using SEBAL and METRIC-1 EEFLux Algorithms. Acta Geophys. 2022, 70, 319–332. [Google Scholar] [CrossRef]
  65. Xue, J.; Bali, K.M.; Light, S.; Hessels, T.; Kisekka, I. Evaluation of Remote Sensing-Based Evapotranspiration Models against Surface Renewal in Almonds, Tomatoes and Maize. Agric. Water Manag. 2020, 238, 106228. [Google Scholar] [CrossRef]
  66. Reyes-González, A.; Kjaersgaard, J.; Trooien, T.; Reta-Sánchez, D.G.; Sánchez-Duarte, J.I.; Preciado-Rangel, P.; Fortis-Hernández, M. Comparison of Leaf Area Index, Surface Temperature, and Actual Evapotranspiration Estimated Using the METRIC Model and In Situ Measurements. Sensors 2019, 19, 1857. [Google Scholar] [CrossRef] [PubMed]
  67. Khan, A.; Stöckle, C.O.; Nelson, R.L.; Peters, T.; Adam, J.C.; Lamb, B.; Chi, J.; Waldo, S. Estimating Biomass and Yield Using Metric Evapotranspiration and Simple Growth Algorithms. Agron. J. 2019, 111, 536–544. [Google Scholar] [CrossRef]
  68. Zhang, B.; Liu, Y.; Xu, D.; Zhao, N.; Lei, B.; Rosa, R.D.; Paredes, P.; Paço, T.A.; Pereira, L.S. The Dual Crop Coefficient Approach to Estimate and Partitioning Evapotranspiration of the Winter Wheat-Summer Maize Crop Sequence in North China Plain. Irrig. Sci. 2013, 31, 1303–1316. [Google Scholar] [CrossRef]
  69. Zhang, T.; Zou, Y.; Kisekka, I.; Biswas, A.; Cai, H. Comparison of Different Irrigation Methods to Synergistically Improve Maize’s Yield, Water Productivity and Economic Benefits in an Arid Irrigation Area. Agric. Water Manag. 2021, 243, 106497. [Google Scholar] [CrossRef]
  70. Sandhu, O.S.; Gupta, R.K.; Thind, H.S.; Jat, M.L.; Sidhu, H.S. Yadvinder-Singh Drip Irrigation and Nitrogen Management for Improving Crop Yields, Nitrogen Use Efficiency and Water Productivity of Maize-Wheat System on Permanent Beds in North-West India. Agric. Water Manag. 2019, 219, 19–26. [Google Scholar] [CrossRef]
  71. Semmens, K.A.; Anderson, M.C.; Kustas, W.P.; Gao, F.; Alfieri, J.G.; McKee, L.; Prueger, J.H.; Hain, C.R.; Cammalleri, C.; Yang, Y.; et al. Monitoring Daily Evapotranspiration over Two California Vineyards Using Landsat 8 in a Multi-Sensor Data Fusion Approach. Remote Sens. Environ. 2016, 185, 155–170. [Google Scholar] [CrossRef]
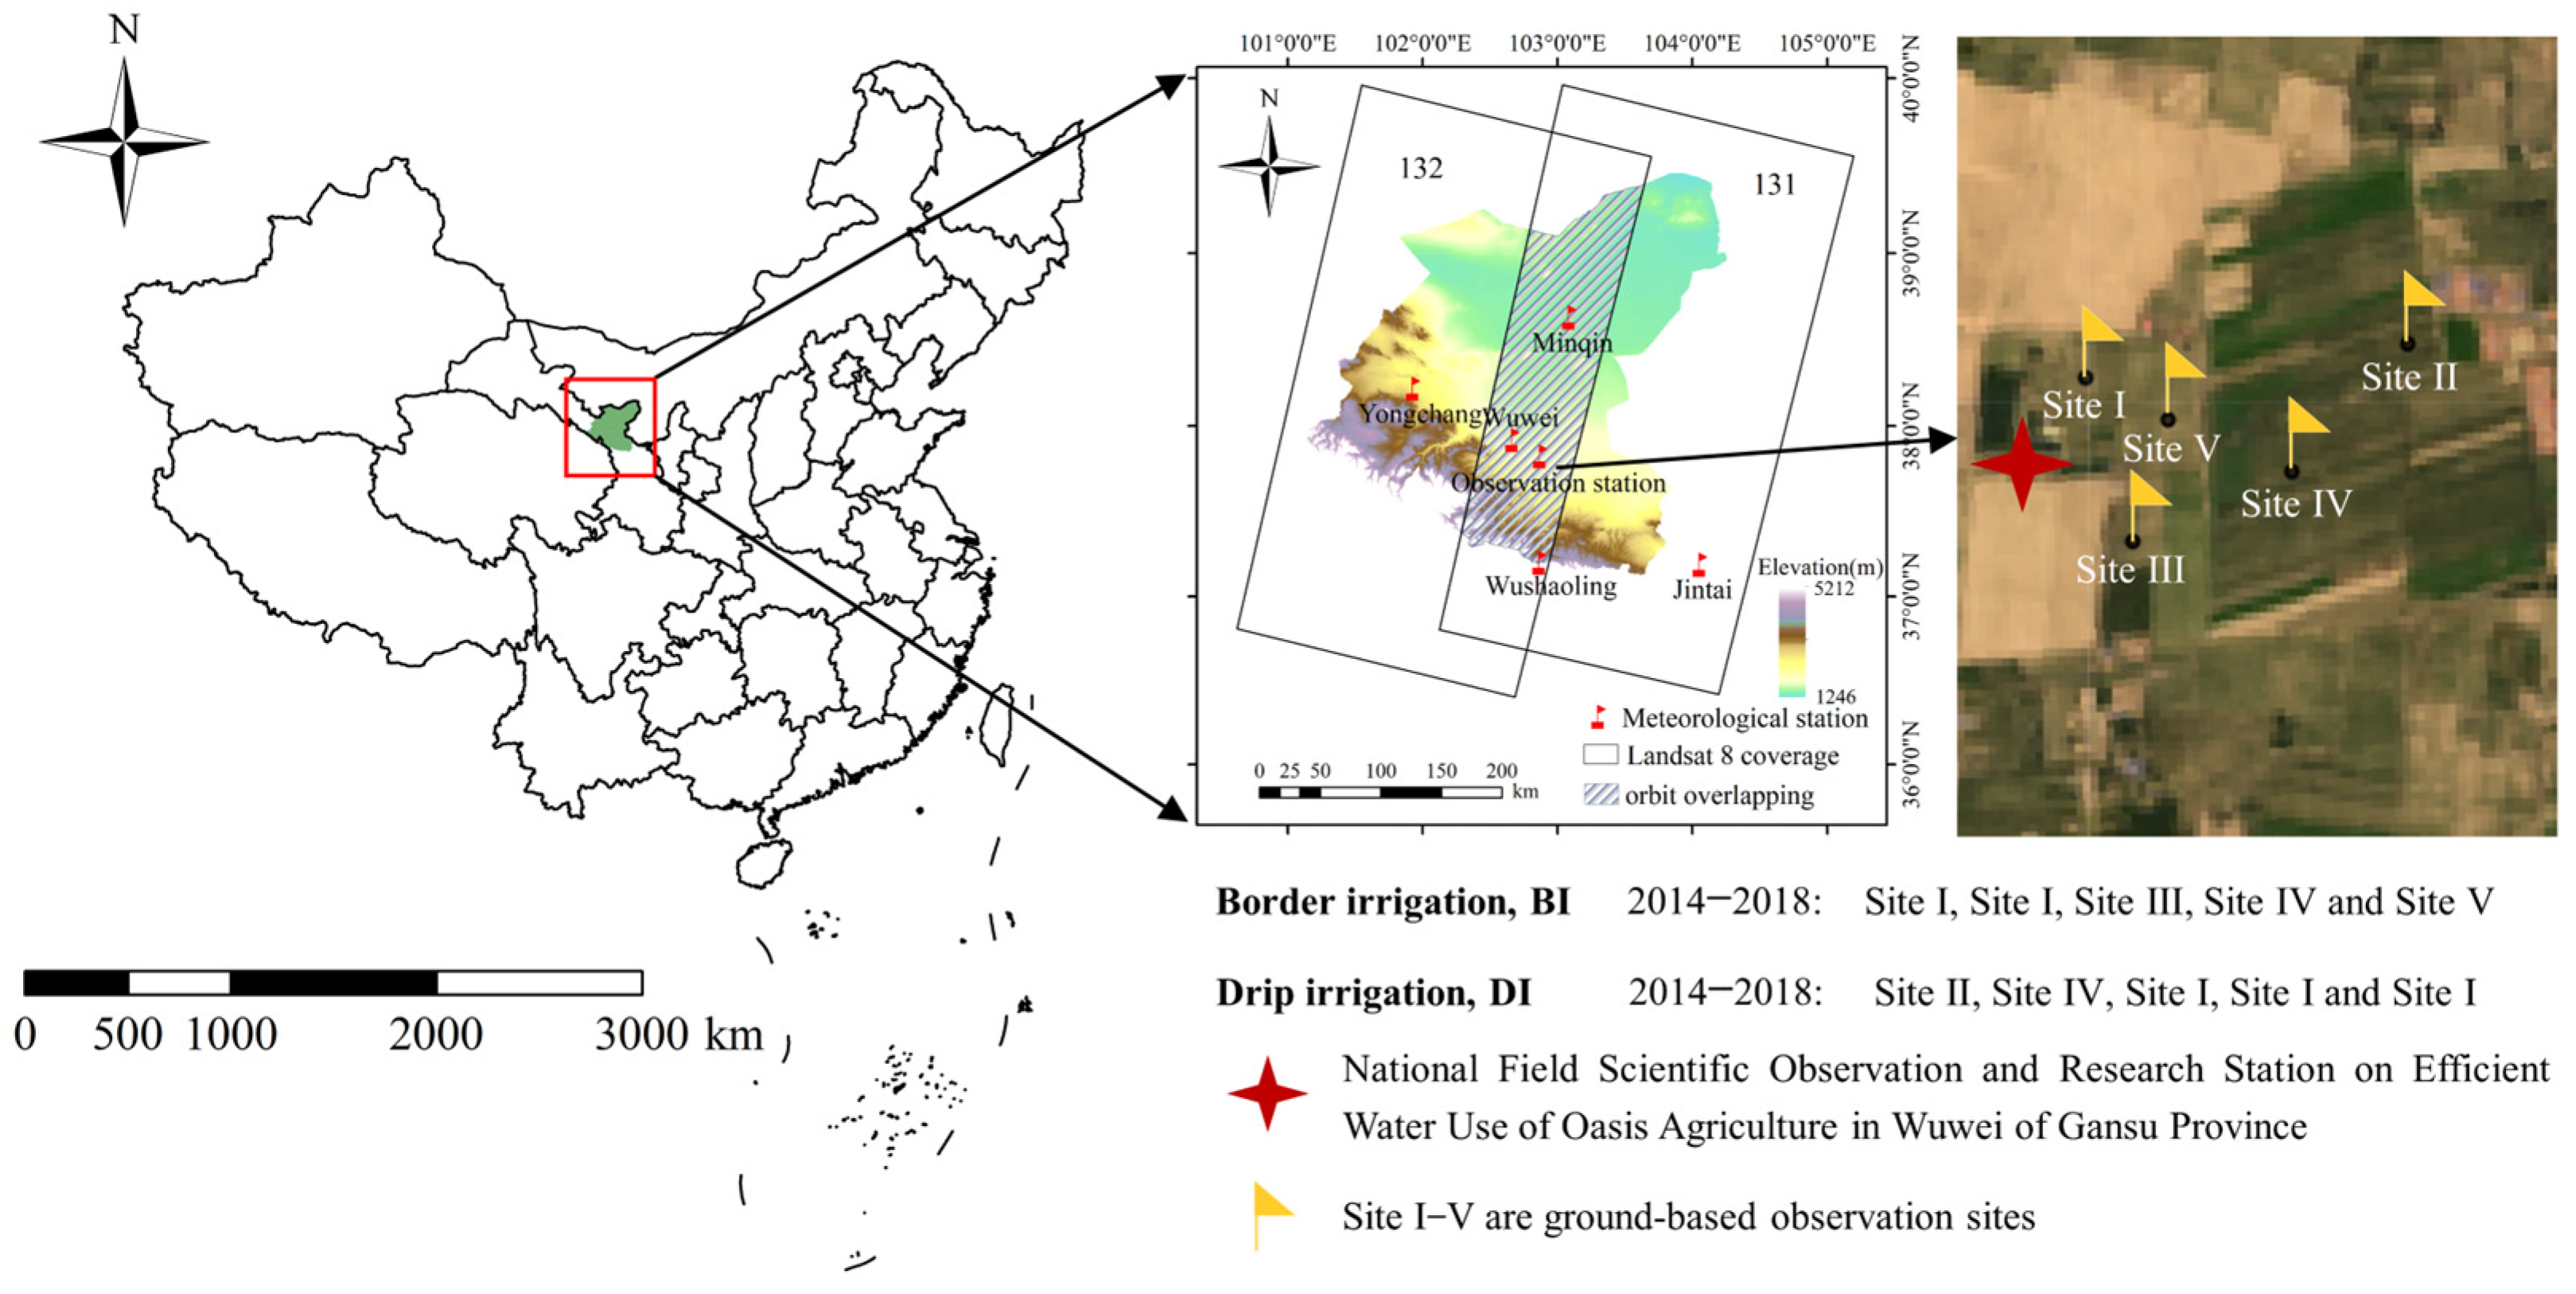
Figure 1. Overview of the study area and description of the observation sites.
Remotesensing 16 00175 g001
Figure 2. Flowchart of the METRIC model.
Remotesensing 16 00175 g002
Figure 3. Flow chart of the research.
Remotesensing 16 00175 g003
Figure 4. Plot of flux component results from METRIC model estimation against EC observations. (a) net surface radiation (Rn), (b) soil heat flux (G), (c) sensible heat flux (H), and (d) latent heat flux (LE). R2 is the coefficient of determination. RMSE is the root mean square error (W/m2).
Remotesensing 16 00175 g004
Figure 5. Sensible heat flux (H), latent heat flux (LE), and measured leaf area index (LAI) estimates of maize under two irrigation methods at Landsat 8 overpass days from 2014 to 2018. DI is the drip irrigation method. BI is the border irrigation method.
Remotesensing 16 00175 g005
Figure 6. Plot of LE results from METRIC model estimation against LAI observations from 2014 to 2018. DI is the drip irrigation method. BI is the border irrigation method.
Remotesensing 16 00175 g006
Figure 7. Estimations of ETa, ETrF, and time-expanded curves (ae) with accuracy performance (f) for maize under two irrigation methods at Landsat 8 overpass days, 2014–2018. ETa (mm/day) and ETr (mm/day) are daily actual and reference evapotranspiration, respectively. ETrF is the reference evapotranspiration fraction. DI is the drip irrigation method. BI is the border irrigation method. R2 is is the coefficient of determination. RMSE is the root mean square error (mm/day).
Remotesensing 16 00175 g007
Figure 8. Spatial and temporal variability of NDVI on satellite overpass days at three observation sites in 2018. NDVI is the normalized difference vegetation index. DI is the drip irrigation method. BI is the border irrigation method. EC is the eddy covariance method.
Remotesensing 16 00175 g008
Figure 9. Spatial and temporal variation of the daily satellite overpass ETa in the three observation sites in 2018. ETa (mm/day) is the actual daily evapotranspiration. DI is the drip irrigation method. BI is the border irrigation method. EC is the eddy covariance method.
Remotesensing 16 00175 g009
Figure 10. Histogram of estimated ETa versus three observations for the five growth stages of maize (2014–2018) under DI (a) and BI (b). DI is the drip irrigation method. BI is the border irrigation method. ΣET is the actual evapotranspiration in each stage of growth of maize. Cal, WB, BREB, and EC (calculation using remote sensing model, water balance, Bowen ratio and energy balance method, and eddy covariance method) are the methods of actual evapotranspiration.
Remotesensing 16 00175 g010
Figure 11. Accuracy of the estimated daily average evapotranspiration using remote sensing models under two irrigation methods in different years compared to three observation methods. R2 is the coefficient of determination. RMSE is the root mean square error (mm/day); DI is the drip irrigation method. BI is the border irrigation method. WB, BREB, and EC (water balance, Bowen ratio and energy balance method, and eddy covariance method) are the methods of ETa observation.
Remotesensing 16 00175 g011
Figure 12. Differences in actual total evapotranspiration of maize during the growing season under the two irrigation methods. DI is the drip irrigation method. BI is the border irrigation method; ΣET (mm) is the actual evapotranspiration of the growing period of maize. Cal, WB, BREB, and EC (calculation using a remote sensing model, water balance, Bowen ratio and energy balance method, and eddy covariance method) are the methods used to obtain actual evapotranspiration.
Remotesensing 16 00175 g012
Table 1. Different field management information, surface energy flux observation locations, and the number of remote sensing images.
CropIrrigation MethodYearsSiteAreaGrowth Period DaysNumber of Remote Sensing ImagesObservation Method
seed maizeborder irrigation under mulch field2014I400 m × 200 m1498Water balance method; Bowen ratio and energy balance method; Eddy covariance method
2015I1556
2016III500 m × 250 m1547
2017IV1476
2018V1598
drip irrigation under mulch
field
2014II2000 m × 1000 m1348
2015IV500 m × 250 m1326
2016I400 m × 200 m1447
2017I1425
2018I1468
Disclaimer/Publisher’s Note: The statements, opinions and data contained in all publications are solely those of the individual author(s) and contributor(s) and not of MDPI and/or the editor(s). MDPI and/or the editor(s) disclaim responsibility for any injury to people or property resulting from any ideas, methods, instructions or products referred to in the content.