Article

LPGAN: A LBP-Based Proportional Input Generative Adversarial Network for Image Fusion

College of Intelligence Science and Technology, National University of Defense Technology, Changsha 410073, China
*
Author to whom correspondence should be addressed.
Remote Sens. 2023, 15(9), 2440; https://doi.org/10.3390/rs15092440
Submission received: 3 April 2023 / Revised: 29 April 2023 / Accepted: 2 May 2023 / Published: 6 May 2023

Abstract

:
Image fusion is the process of combining multiple input images from single or multiple imaging modalities into a fused image, which is expected to be more informative for human or machine perception as compared to any of the input images. In this paper, we propose a novel method based on deep learning for fusing infrared images and visible images, named the local binary pattern (LBP)-based proportional input generative adversarial network (LPGAN). In the image fusion task, the preservation of structural similarity and image gradient information is contradictory, and it is difficult for both to achieve good performance at the same time. To solve this problem, we innovatively introduce LBP into GANs, enabling the network to have stronger texture feature extraction and utilization capabilities, as well as anti-interference capabilities. In the feature extraction stage, we introduce a pseudo-Siamese network for the generator to extract the detailed features and the contrast features. At the same time, considering the characteristic distribution of different modal images, we propose a 1:4 scale input mode. Extensive experiments on the publicly available TNO dataset and CVC14 dataset show that the proposed method achieves the state-of-the-art performance. We also test the universality of LPGAN by fusing RGB and infrared images on the RoadScene dataset and medical images. In addition, LPGAN is applied to multi-spectral remote sensing image fusion. Both qualitative and quantitative experiments demonstrate that our LPGAN can not only achieve good structural similarity, but also retain richly detailed information.

1. Introduction

Image fusion aims to merge or combine images captured with different sensors or camera settings to generate a greater quality composite images [1]. It is crucial for many applications in image processing [2,3,4], computer vision [5,6], remote sensing [7,8], and medical image analysis [9].
In the image processing field, visible images and infrared images are generated by sensors with different sensitivities to light in different wavelength bands. The images of different bands contain different information. Each kind of image can only focus on a given operating range and environmental condition, and it is difficult to receive all the necessary information for object detection or scene classification [10]. Due to the strong complementarity between them, it is a feasible way to improve visual understanding by fusing them. The fused image can combine the characteristics of different modal images to generate an image with rich details and significant contrast, an example is shown in Figure 1. Therefore, for the full exploitation of multi-modal data, advanced image fusion has been developed rapidly in the last few years.
The key to multi-modal image fusion is effective image information extraction and appropriate fusion principles [11]. Traditional research has focused on multi-scale transform-based methods [12,13], sparse representation-based methods [14,15], subspace-based methods [16], saliency-based methods [17,18], hybrid methods [19,20], and other fusion methods [21,22,23]. However, the performance improvement of manually designed feature extraction and fusion rules is limited.
With the widespread application of deep learning, deep learning-based fusion methods have achieved rapid progress, showing advantages over conventional methods and leading to state-of-the-art results [24,25]. Although these algorithms have achieved positive results under most conditions, there are still some shortcomings that need to be improved:
  • The extraction of source image feature information is incomplete. Most image fusion algorithms cannot achieve good structural similarity while retaining richly detailed features at the same time due to the incomplete extraction of feature information [26]. Specifically, when the algorithm performs better on SSIM and PSNR metrics, its performance on SD, AG, and SF metrics will be worse, such as DenseFuse [27]; the reverse is also true, such as in the cases of FusionGAN [28] and DDcGAN [29].
  • The mission objectives and network structure do not match. The same network is employed to extract features while ignoring the feature distribution characteristics of different modal images, resulting in the loss of meaningful information. Infrared images and visible images have different imaging characteristics and mechanisms, and using the same feature extraction network cannot fully extract the features of different modal images, such as DenseFuse and U2Fusion [30].
  • Improper loss function leads to missing features. In the previous methods, only the gradient is used as a loss to supervise the extraction of detailed features, while neglecting the extraction of lower level texture features in the source images. This makes it difficult for the network to fully utilize the feature information in the source images during the fusion process, such as FusionGAN and DDcGAN.
To overcome the above challenges, a completely deep learning-based image fusion method, the local binary patterns (LBP)-based proportional input generative adversarial network (LPGAN), is proposed. Firstly, we innovatively introduce LBP into the network and design a special loss function based on LBP [31]. LBP can accurately describe the local texture features of an image, improving the network’s ability to extract low-level features from the source image, effectively balancing structural similarity and detail features. Moreover, due to its strong robustness to light, the introduction of LBP enables the network to have strong anti-interference capabilities. Secondly, we introduce a pseudo-Siamese network for the generator, which, due to its unique design with the same structure and different parameters, not only enables the network to extract different feature information from two modal images, but also avoids the problem of extracting features from different domains. It is worth mentioning that the improved generator inputs infrared and visible images at different ratios. In some works [32,33], the source image is concatenated in a 1:2 ratio as the input of the network, but we found through experiments that a ratio of 1:4 can enhance the network’s feature extraction ability and achieve better experimental results. Extensive experiments on the publicly available TNO dataset and CVC14 dataset [34] show that the proposed method achieves the state-of-the-art performance. We also test the universality of LPGAN through the fusion of RGB and infrared images on the RoadScene dataset [30] and the Harvard medical dataset. Finally, the proposed method can also be applied to multi-spectral remote sensing image fusion, and the expansion experiment reveals the advantages of our LPGAN compared to other methods.
The contributions of our work are as three-fold:
(1)
We introduce LBP into the network for the first time and design a new loss for the generator, which enables the model to make full use of different types of features in a balanced way and reduce image distortion.
(2)
We design a pseudo-Siamese network to extract feature information from source images. It fully considers the differences in the imaging mechanism and image features of the different source images, encouraging the generator to preserve more features in source images.
(3)
We propose a high-performance image fusion method (LPGAN), achieving the state-of-the-art on the TNO dataset and CVC14 dataset.
We organized the remainder of this paper as follows. We first briefly review some work related to our method in Section 2. Then, we provide the overall framework, network architecture, and loss function of the proposed LPGAN in Section 3. In Section 4, we show and analyze the experimental results of the proposed method and the competitors. In Section 5, we provide a discussion about our method. Finally, we make a conclusion of this paper in Section 6.

2. Related Work

Image fusion tasks can be divided into five types, infrared-visible image fusion [35], multi-focus image fusion, multi-exposure image fusion, remote sensing image fusion, and medical image fusion. In this section, we briefly introduce several existing deep learning-based image fusion methods and some basic theories of cGAN and LBP.

2.1. Deep Learning-Based Image Fusion

Many deep learning-based image fusion methods have been proposed in the last five years and have achieved promising performances. In some methods, the framework of deep learning is combined with traditional methods to solve image fusion tasks. Representatively, Liu et al. [36] proposed a fusion method based on convolutional sparse representation (CSR). The method employs CSR to extract multi-layer features and uses the features to reconstruct the image. Later, they proposed a convolutional neural network (CNN)-based method for multi-focus image fusion tasks [37]. They use image patches containing different features as input to train the network and obtain a decision map, and then directly use the map to guide the image fusion. Deep learning is also used by some algorithms to diversify the extraction of image features. In [38], a model based on the multi-layer fusion strategy of the VGG-19 model was proposed. The method decomposes the source image into two parts; one part contains the low-frequency information of the image and the other part contains the high-frequency information with detailed features. This strategy can retain the deep features of the detailed information. In addition, to make the generated images more realistic, PSGAN [39] handles the remote sensing image fusion task by using a GAN to fit the distribution of high-resolution multi-spectral images; however, it still requires manually constructing the ground-truth to train the model.
The above methods only apply the deep learning framework in some parts of the fusion process. In other methods, the entire image fusion process uses a deep learning framework. For instance, Prabhakar et al. [40] proposed an unsupervised model for multi-exposure image fusion named DeepFuse in 2017. The model consists of an encoder, a fusion layer, and a decoder. The parameter sharing strategy is adopted to ensure that the feature types extracted from the source images are the same, which facilitates subsequent fusion operations and reduces the parameters of the model. Based on DeepFuse, Li et al. [27] improved the method by applying dense blocks and proposed a new image fusion method called DenseFuse. They utilize no-reference metrics as the loss function to train the network and achieve high-quality performance. Since image fusion tasks usually lack ground-truth and are generative tasks, Ma et al. [28] proposed a GAN-based method to fuse infrared and visual images. The network uses a generator to fuse images and a discriminator to distinguish the generated image from the visible image, achieving a state-of-the-art performance; however, it is easy to lose infrared image information. To avoid the above problem, Ma et al. [29] used dual discriminators to encourage the generator, and the method achieved a better performance. Analogously, Ma et al. [41] applied a dual-discriminator architecture in remote sensing image fusion and proposed an unsupervised method based on GAN, termed PanGAN. The method establishes adversarial games to preserve the rich spectral information of multi-spectral images and the spatial information of panchromatic images. By considering the different characteristics of different image fusion tasks, Xu et al. [30] performed continual learning to solve multiple fusion tasks for the first time and proposed a unified unsupervised image fusion network named U2Fusion, which could be applied to a variety of image fusion tasks, including multi-modal, multi-exposure, and multi-focus cases.
However, the above-mentioned works still have three drawbacks:
  • Due to the lack of ground-truth, the existing methods usually supervise the work of the model by adopting no-reference metrics as the loss function. However, only the gradient is used as the loss to supervise the extraction of the detailed features, and the texture information is always ignored.
  • They ignore the information distribution of the source images, i.e., the visible image has more detailed information and the infrared image has more contrast information.
  • These methods all use only one network to extract features from infrared images and visible images, ignoring the difference in imaging mechanisms between these two kinds of images.
To address these problems, a new content loss function is designed using LBP to effectively utilize the texture information of the source images, which also improves the anti-interference ability of our method. Then, according to the distribution characteristics of the feature information of the source images, we concatenate the source images in fixed proportions in the feature extraction stage. Finally, considering the characteristics of infrared image and visible image, we design a pseudo-Siamese network to extract detailed features and contrast features, respectively.

2.2. Generative Adversarial Networks

GAN is a framework for unsupervised distribution estimation via an adversarial process, proposed by Goodfellow [42] in 2014. The GAN simultaneously trains two models, a generative model G that captures the data distribution and a discriminative model D that estimates the probability that a sample comes from the training data rather than G. The GAN establishes an adversarial game between a discriminator and a generator, the generator tries to continuously generate new samples to fool the discriminator, and the discriminator aims to judge whether a sample is real or fake. Finally, the discriminator can no longer distinguish the generated sample. Assuming that the real data obey the specific distribution  P d a t a , the generator is dedicated to estimating the distribution of real data and producing the fake distribution  P G  that approaches the real distribution  P d a t a . D and G play the following two-player minimax game with value function  V ( G , D ) :
min G max D V G A N G , D = E x P d a t a log D x + E x P G log 1 D x .
E  is the average operation. Due to the adversarial relationship, the generator and the discriminator promote each other in continuous iterative training, and the capabilities of the two are continuously improved. The sample distribution generated by the generator approaches the distribution of the real data. When the similarity between the two is high enough, the discriminator cannot distinguish between the real data and the fake data, and the training of the generator is successful.
GANs can be extended to a cGAN if we add some extra information that could be any kind of auxiliary information as a part of the input. We can perform conditioning by feeding the extra information as an additional input layer, and this model is defined as a cGAN [43]. The formulation between G and D of cGAN is as follows:
min G max D V G A N G , D = E x P d a t a log D x y + E x P G log 1 D x y .
Standard GANs consist of a single generator and only one discriminator. In order to generate higher quality samples in fewer iterations, Durugkar et al. [44] proposed the Generative Multi-Adversarial Network (GMAN), a framework that extends GANs to multiple discriminators. Inspired by GMAN, the structure of multi-adversarial network is applied for dealing with different tasks, such as PS2MAN [45], FakeGAN [46], etc. PS2MAN considered the photo-sketch synthesis task as an image-to-image translation problem and explored the multi-adversarial network (MAN) to generate high-quality realistic images. Novelly, FakeGAN first adopted GAN for a text classification task. The network provided the generator with two discriminators, which avoided the mod collapse issue and provided the network with high stability. One discriminator is trained to guide the generator to produce samples similar to deceptive views, and the other one aims to distinguish deceptive views from data.
Image fusion is a generating task that integrates two images of different characteristics. GAN is a network suitable for unsupervised generative tasks. Therefore, we adopt GAN as the framework of our method. To preserve detailed information and contrast information of two source images completely, we employ dual discriminators to improve the quality of our fusion results.

2.3. Local Binary Patterns

LBP is an operator used to describe the local texture features of images, which is gray-scale invariant and can be easily calculated by comparing the center value with its  3 × 3  neighbors [31]. Although the original LBP can effectively extract the texture features of the image and has strong robustness to illumination, it cannot cope with the scaling and rotation of the image. To address this problem, Ojala et al. [47], in 2002, proposed an improved LBP with scale invariance and rotation invariance. The improved LBP compares the center pixel with pixels on a fixed radius, which changes as the image is scaled, thus achieving scale invariance of LBP features. At the same time, the minimum value of the encoded binary number is taken to achieve the rotation invariance of the LBP feature. LBP is used in many fields of machine learning. In [48], Zhao et al. applied it to recognize the dynamic textures and extend their approach to deal with specific dynamic events, such as facial expression recognition. Maturana et al. [49] also proposed a LBP-based face recognition algorithm. LBP has also been applied in the field of gender recognition and was once the most effective method in this field. Tapia et al. [50] extracted the iris features of human eyes through the effective texture feature extraction capability of LBP, and perform gender recognition based on the extracted features, achieving the state-of-the-art performance of gender recognition at that time.
Although LBP was widely used in the past, it has rarely been mentioned in recent years. Since image fusion has high requirements on the detailed features and structural similarity of the fused image, the existing algorithms cannot achieve the above two points simultaneously. We believe that LBP can help the network to extract lower-level detailed features while keeping the fused image with a high structural similarity to the source images. Because the source images for image fusion are highly registered, there is no need to consider the rotation and scaling of the image, so we use the original LBP to extract the texture features of the source images.

3. Proposed Method

In this section, we introduce the proposed LPGAN in detail. Firstly, we describe the overall framework of LPGAN, and then we provide the network architectures of the generator and the discriminators. Finally, the loss function is designed.

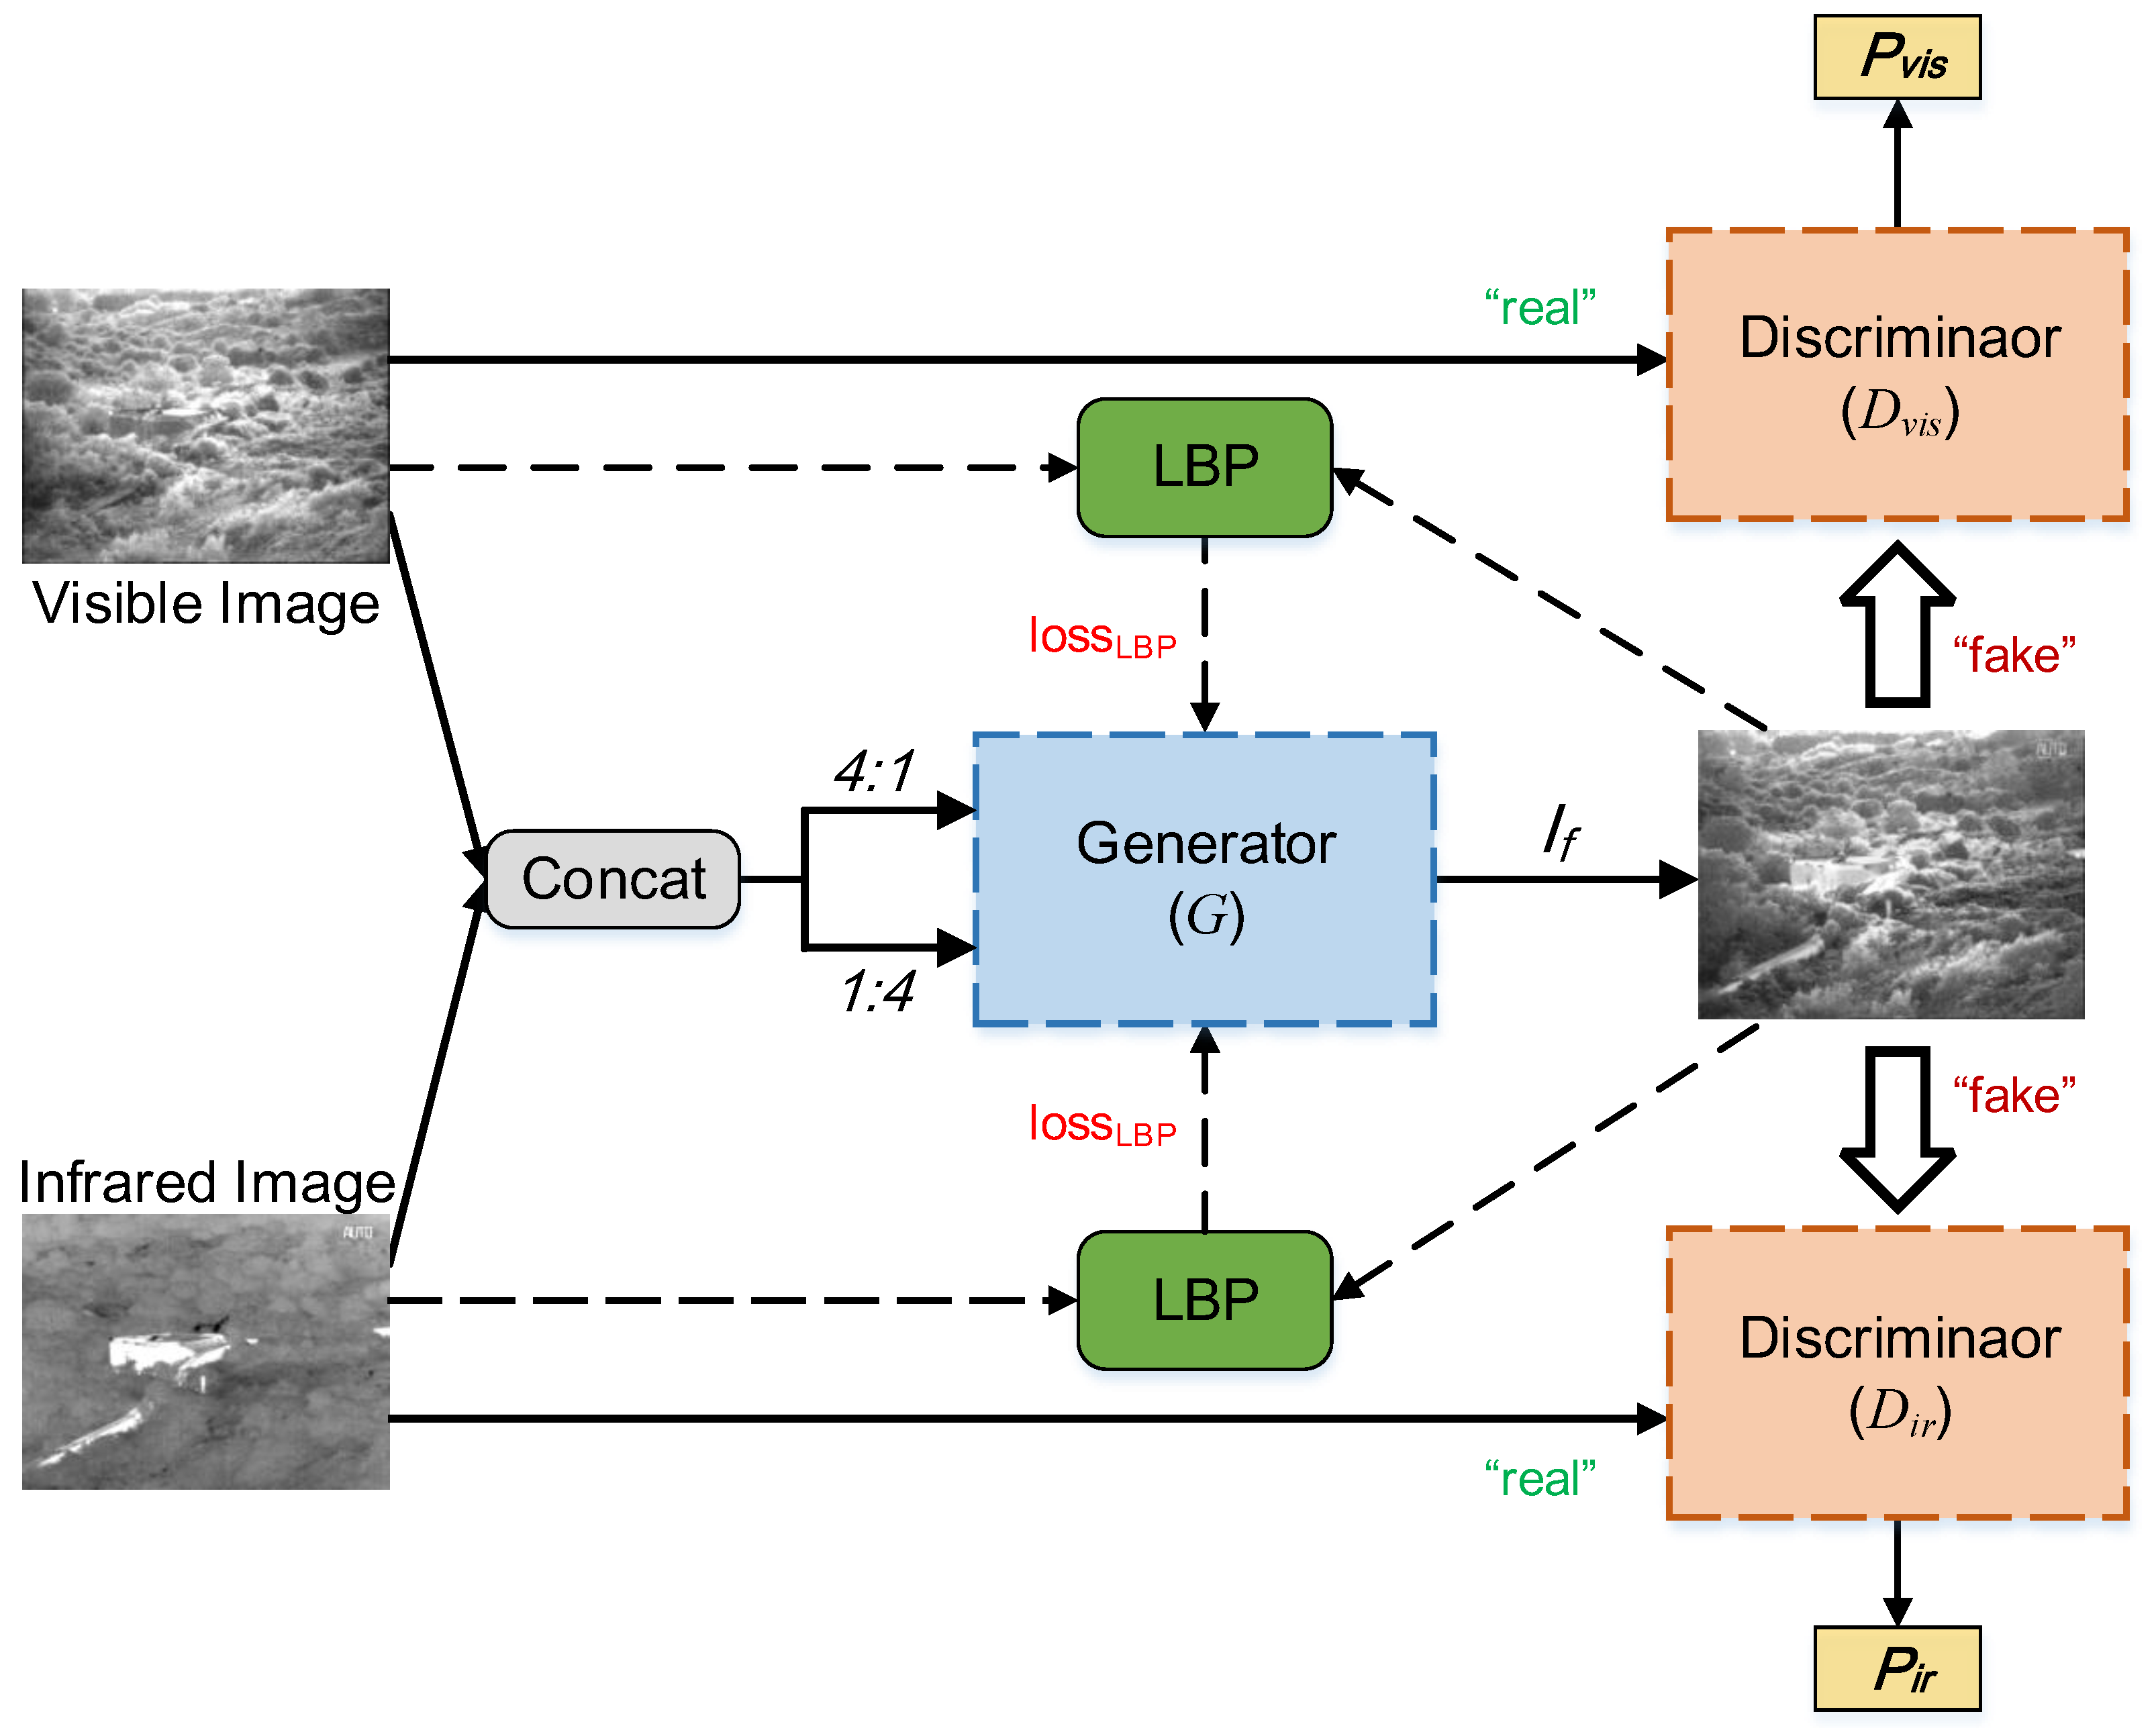
3.1. Overall Framework

The overall framework of the proposed LPGAN is sketched in Figure 2. It is a dual-discriminator cGAN. Visible images have richly detailed information that is saved through gradient and texture, and infrared images save significant contrast information through pixel intensity. The goal of the infrared-visible image fusion task is to generate a new image with richly detailed information and significant contrast information, which is essentially an unsupervised generation task. GANs have significant advantages in dealing with such problems, but it is easy to fall into the trap of a single mode in the training process. Therefore, in order to improve the stability of training, this paper uses the network structure of cGAN to constrain it. Given a visible image  I v i s  and an infrared image  I i r , the goal of GAN applied to image fusion is to train a generator G to produce a fused image  I f , and then  I f  is realistic enough to fool the discriminator. Due to the different feature distributions between infrared and visible images, using a single discriminator structure cannot accurately determine the probability that the image belongs to real visible and infrared images. Therefore, we adopted a dual discriminator structure to indirectly improve the performance of the generator by improving the performance of the discriminator.
As mentioned in the introduction, infrared images and visible images have different imaging characteristics and feature distributions, and using the same network cannot fully extract the features of different modal images. However, if a completely different network is used, it cannot guarantee that the extracted features belong to the same domain, which affects the fusion between subsequent features. Therefore, we design a pseudo-Siamese network with the same structure but no parameter sharing to extract features from two source images. Considering that visible images still have some contrast information, infrared images also have some detailed information, we design different input ratios for different encoders to concatenate the visible image  I v i s  and infrared image  I i r  in the channel dimension. Specifically, the ratio of the detailed feature extraction path and the contrast feature extraction path is set to 4:1 ( I v i s : I i r ) and 1:4 ( I v i s : I i r ), respectively. Then, the concatenated images are fed into the generator G, and the output of G is a fused image  I f . After that, LBP distributions of source images and  I f  are calculated and the loss of LBP used to supervise G to extract texture features is obtained. Simultaneously, we design two adversarial discriminators,  D v i s  and  D i r D v i s  and  D i r  generate scalars based on the input image to distinguish the generated image and real data.  D v i s  is trained to generate the probability that the image is a real visible image, while  D i r  is trained to estimate the probability of the image belonging to the real infrared images.

3.2. Network Architecture

3.2.1. Generator Architecture

The generator consists of a feature extraction network and a feature reconstruction network, as shown in Figure 3. The feature extraction network takes the form of a pseudo-Siamese network, which is divided into gradient path and intensity path for information extraction. The process of feature reconstruction is performed in a decoder, and the output is the fused image, which has the same resolution as the source images.
In the feature extraction stage, we propose a pseudo-Siamese network with two encoders. Inspired by DenseNet [51], to mitigate the vanish of gradient, remedy feature loss and reuse previously computed features, both encoders are densely connected and have the same network structure, but the parameters of them are different. In each path of feature extraction, the encoder consists of four convolutional layers. The  3 × 3  convolutional kernel is adopted in each layer, and all strides are set to 1 with a batch normalization (BN) and a ReLU activation function to speed up the convergence and avoid gradient sparsity [52]. To fully extract the information, we concatenate four visible images and one infrared image as input in the gradient path, as well as four infrared images and one visible image as input in the intensity path. After that, the outputs of the two paths are concatenated in the channel dimension. The final fusion result is generated by a decoder. The decoder is a four-layer CNN, and the parameter settings of each layer are shown in the bottom right sub-figure of Figure 3.

3.2.2. Discriminator Architecture

The architecture of discriminator  D v i s  and discriminator  D i r  adopt the same structure. The discriminator is a simple four-layer convolution neural network, which is shown in Figure 4. In the first three layers, the  3 × 3  filter is adopted in each convolution layer, and the stride is set to 2. BN and ReLU activation function are followed in each convolution layer. In the last layer, the full connection and the tanh activation function are employed to generate the probability of the input image belonging to the real data.

3.3. Loss Function

We adopt two types of loss, loss  L G , and loss  L D , to guide the parameter optimization of G and D.

3.3.1. Loss Function of Generator

The loss function of G consists of two parts, i.e., the content loss  L c o n  and the adversarial loss  L a d v ,
L G = μ L c o n + L a d v ,
where  L G  is the total loss and  μ  is a parameter to strike a balance between  L c o n  and  L a d v . As the thermal radiation and texture details are mainly characterized by pixel intensities and gradient variation [21], we design four loss functions to guide G to preserve the gradient and texture information contained in the visible image and contrast information of the infrared image and reduce image distortion. We employ the L1 norm to constrain the fused image to retain similar gradient variation with the visible image. The calculation of gradient loss is as follows,
L g r a d i e n t = I f I v i s 1 ,
where ∇ is the unification of the horizontal and vertical gradients of the image. It is calculated as
= I ( i + 1 , j ) I ( i 1 , j ) 2 + I ( i , j + 1 ) I ( i , j 1 ) 2 ,
where  I ( i , j )  represents the pixel value of the image at  ( i , j ) . Contrast information is mainly saved by the pixel intensities of the image. Therefore, the Frobenius norm is applied to encourage the fused image to exhibit pixel intensities similar to those of the infrared image, and the contrast loss is calculated as
L i n t e n s i t y = 1 W H I f I i r F 2 ,
where W and H are the width and height of the image.
To prevent image distortion, we use a structural similarity loss  L S S I M  to constrain the fusion of the generator. The loss  L S S I M  is obtained by the equation
L S S I M = 1 2 ( 1 S S I M ( I f , I v i s ) ) + ( 1 S S I M ( I f , I i r ) )
where  S S I M ( · )  reflects the structural similarity of two images [53]. Visible images have richly detailed and texture information, which greatly improves the efficiency of tasks, such as target detection. In the previous algorithms, only the gradient is used as a loss to supervise the extraction of texture features. In this paper, we innovatively introduce LBP into the loss function to improve the extraction of texture features.
The formulation of  L L B P  is shown as follows,
L L B P = 1 L ( L B P ( I f ) L B P ( I v i s ) 1 ) ,
where  L B P ( · )  represents the operation of calculating the LBP features of the image, and L is the feature vector length of  L B P ( · ) . The calculation of  L B P ( · )  is defined as follows,
L B P ( I ) = c o n c a t l b p ( c e l l 1 ) , , l b p ( c e l l 36 ) ,
where  c e l l i  is a  21 × 21  image patch, and there are 16 cells in image I, as shown in Figure 5 l b p ( c e l l i )  aims to calculate the LBP feature of  c e l l i . To obtain  l b p ( c e l l i ) , we first calculate the LBP value of each pixel in  c e l l i  according to the method proposed in [31]. After calculating the LBP value of each pixel, a 256-dimensional vector is used to represent the LBP feature of the cell, which is the final result of  l b p ( · ) . As shown in Figure 5, the result of  L B P ( · )  is the concatenation of  l b p ( c e l l i ) , ( i = 1 , , 16 ) , and L in Equation (9) is 4096 here.
To summarize, the proposed  L c o n  consists of four parts as shown in Equation (10)
L c o n = α L g r a d i e n t + β L i n t e n s i t y + γ L S S I M + λ L L B P ,
where  α β γ , and  λ  are parameters used to control the trade-off between four terms.
The adversarial loss  L a d v  in Equation (3) denotes the sum of two adversarial losses between the generator G and two discriminators, which can be formulated as
L a d v = E log 1 D v i s I f + E log 1 D i r I f ,
where  I f  denotes the fused image,  D v i s I f  denotes the probability that  I f  belongs to the real visible image, and  D i r I f  denotes the probability that  I f  is an infrared image.

3.3.2. Loss Function of Discriminators

The visible and infrared images contain rich texture details and contrast information. We establish an adversarial game between a generator and two discriminators for the result of the generator to match more with the distribution of the real data. Formally, the loss functions of discriminators are defined as follows:
L D v i s = E log D v i s I v i s + E log 1 D v i s I f ,
L D i r = E log D i r I i r + E log 1 D i r I f .

4. Experiments

In this section, we evaluate our method on many famous publicly available datasets. First, we provide the detailed experimental configurations. Then, we compare the results of our methods with four state-of-the-art methods, FusionGAN [28], DenseFuse [27], DDcGAN [29], and U2Fusion [30] on the TNO dataset and the CVC14 dataset. We also verify the improvement of the network performance by LBP and 1:4 ratio input through ablation experiment. Third, we test the universality of LPGAN by fusing RGB and infrared images on the RoadScene dataset and the Harvard medical dataset. Finally, we apply our method to multi-spectral remote sensing images and compare it with the above four algorithms.

4.1. Implementation

4.1.1. Dataset

The TNO dataset is the most commonly used infrared and visible image dataset. It contains multi-spectral images of different scenarios registered with different multi-band camera systems [54].
The CVC14 dataset is committed to promoting the development of autonomous driving technologies [55,56]. It consists of two sets of sequences, the day set and night set. The day set includes 8821 images, the night set includes 9589 images, and all images have a  640 × 471  resolution.
The RoadScene dataset is a new image fusion dataset that has 221 infrared and visible image pairs. The images of the dataset are all collected from naturalistic driving videos, including roads, pedestrians, vehicles, and other road scenes.
The Harvard medical dataset collects medical images of human head features, consisting of 127 pairs of  256 × 256  resolution PET and MRI image pairs. We selected five pairs of image pairs to test our LPGAN.
The multi-spectral remote sensing images used in this paper are recorded under the USA Airborne Multisensor Pod System (AMPS) program and include a large number of industrial, urban and natural scenes from a number of geographical locations captured by two hyper-spectral airborne scanners [57].
In the training stage, we adopt the overlapping cropping strategy to expand the dataset. In total, 36 infrared and visible image pairs of TNO are cropped into 22,912 patch pairs with  84 × 84  pixels. The  84 × 84  visible and infrared image patches are used as source images to train the generator G and as labels to encourage the discriminators. For testing, we select 14, 26, 5, 5, and 29 image pairs from the TNO, CVC14, RoadScene, Harvard medical datasets, and multi-spectral images, respectively.

4.1.2. Training Details

As mentioned in Section 3, parameters  μ α β γ , and  λ  are used to control the balance of loss functions. All parameters are determined by a large number of experiments. We set  μ = 0.6 α = 0.2 β = 0.03 γ = 500 , and  λ = 0.5 . The initial learning rate and decay rate are set to 0.0002 and 0.75 to train the model, and RMSprop and SGD are adopted as the optimizers of the generator and discriminators, respectively. All experiments are conducted on a desktop with 2.30 GHz Intel Xeon CPU E5-2697 v4, NVIDIA Titan Xp, and 12 GB memory.

4.1.3. Metrics

An image fusion qualitative assessment mainly starts from the human visual system and judges the fusion effect according to the task goal. The goal of infrared-visible image fusion is to preserve the detailed and texture features of visible images and the contrast features of infrared images as much as possible. Conversely, quantitative evaluation comprehensively reflects the effect of image fusion through a variety of evaluation metrics.
In this paper, we select eight metrics to use to evaluate our LPGAN and four other state-of-the-art methods. The metrics are standard deviation (SD) [58], average gradient (AG) [59], spatial frequency (SF) [58], mutual information (MI) [60], entropy (EN) [61], peak signal-to-noise ratio (PSNR), structural similarity index measure (SSIM) [62], and visual information fidelity (VIF) [63].SD reflects the distribution of pixel values and contrast information. The larger the SD is, the higher the contrast and the better the visual effect. AG quantifies the gradient information of an image and reflects the amount of image details and textures. The larger AG is, the more detailed information the image contains and the better the fusion effect. SF is a gradient-based metric that can measure the gradient distribution effectively and reveal the details and texture of an image. The larger SF is, the richer edges and texture details are preserved. MI is a quality index that measures the amount of information that is transferred from source images to the fused image [60]. A larger MI represents more information that is transferred from source images to the fused image, which means better fusion performance. EN is a metric to measure the amount of information contained in the image, and the larger the EN value is, the more informative. PSNR is a metric reflecting the distortion and anti-interference ability by the ratio of peak value power and noise power [29]. A large PSNR indicates that little distortion occurred and there is a strong anti-interference ability. SSIM is used to measure the structural similarity between two images and consists of three components, loss of correlation, loss of luminance, and contrast distortion. The product of the three components is the assessment result of the fused image [11]. We calculate the average SSIM between the fused image and two source images as the final result. A larger value of SSIM indicates that more structural information is maintained. VIF is consistent with the human visual system and is applied to measure information fidelity. The larger VIF is, the better the visual effect and the less distortion there is between the fused image and source images.

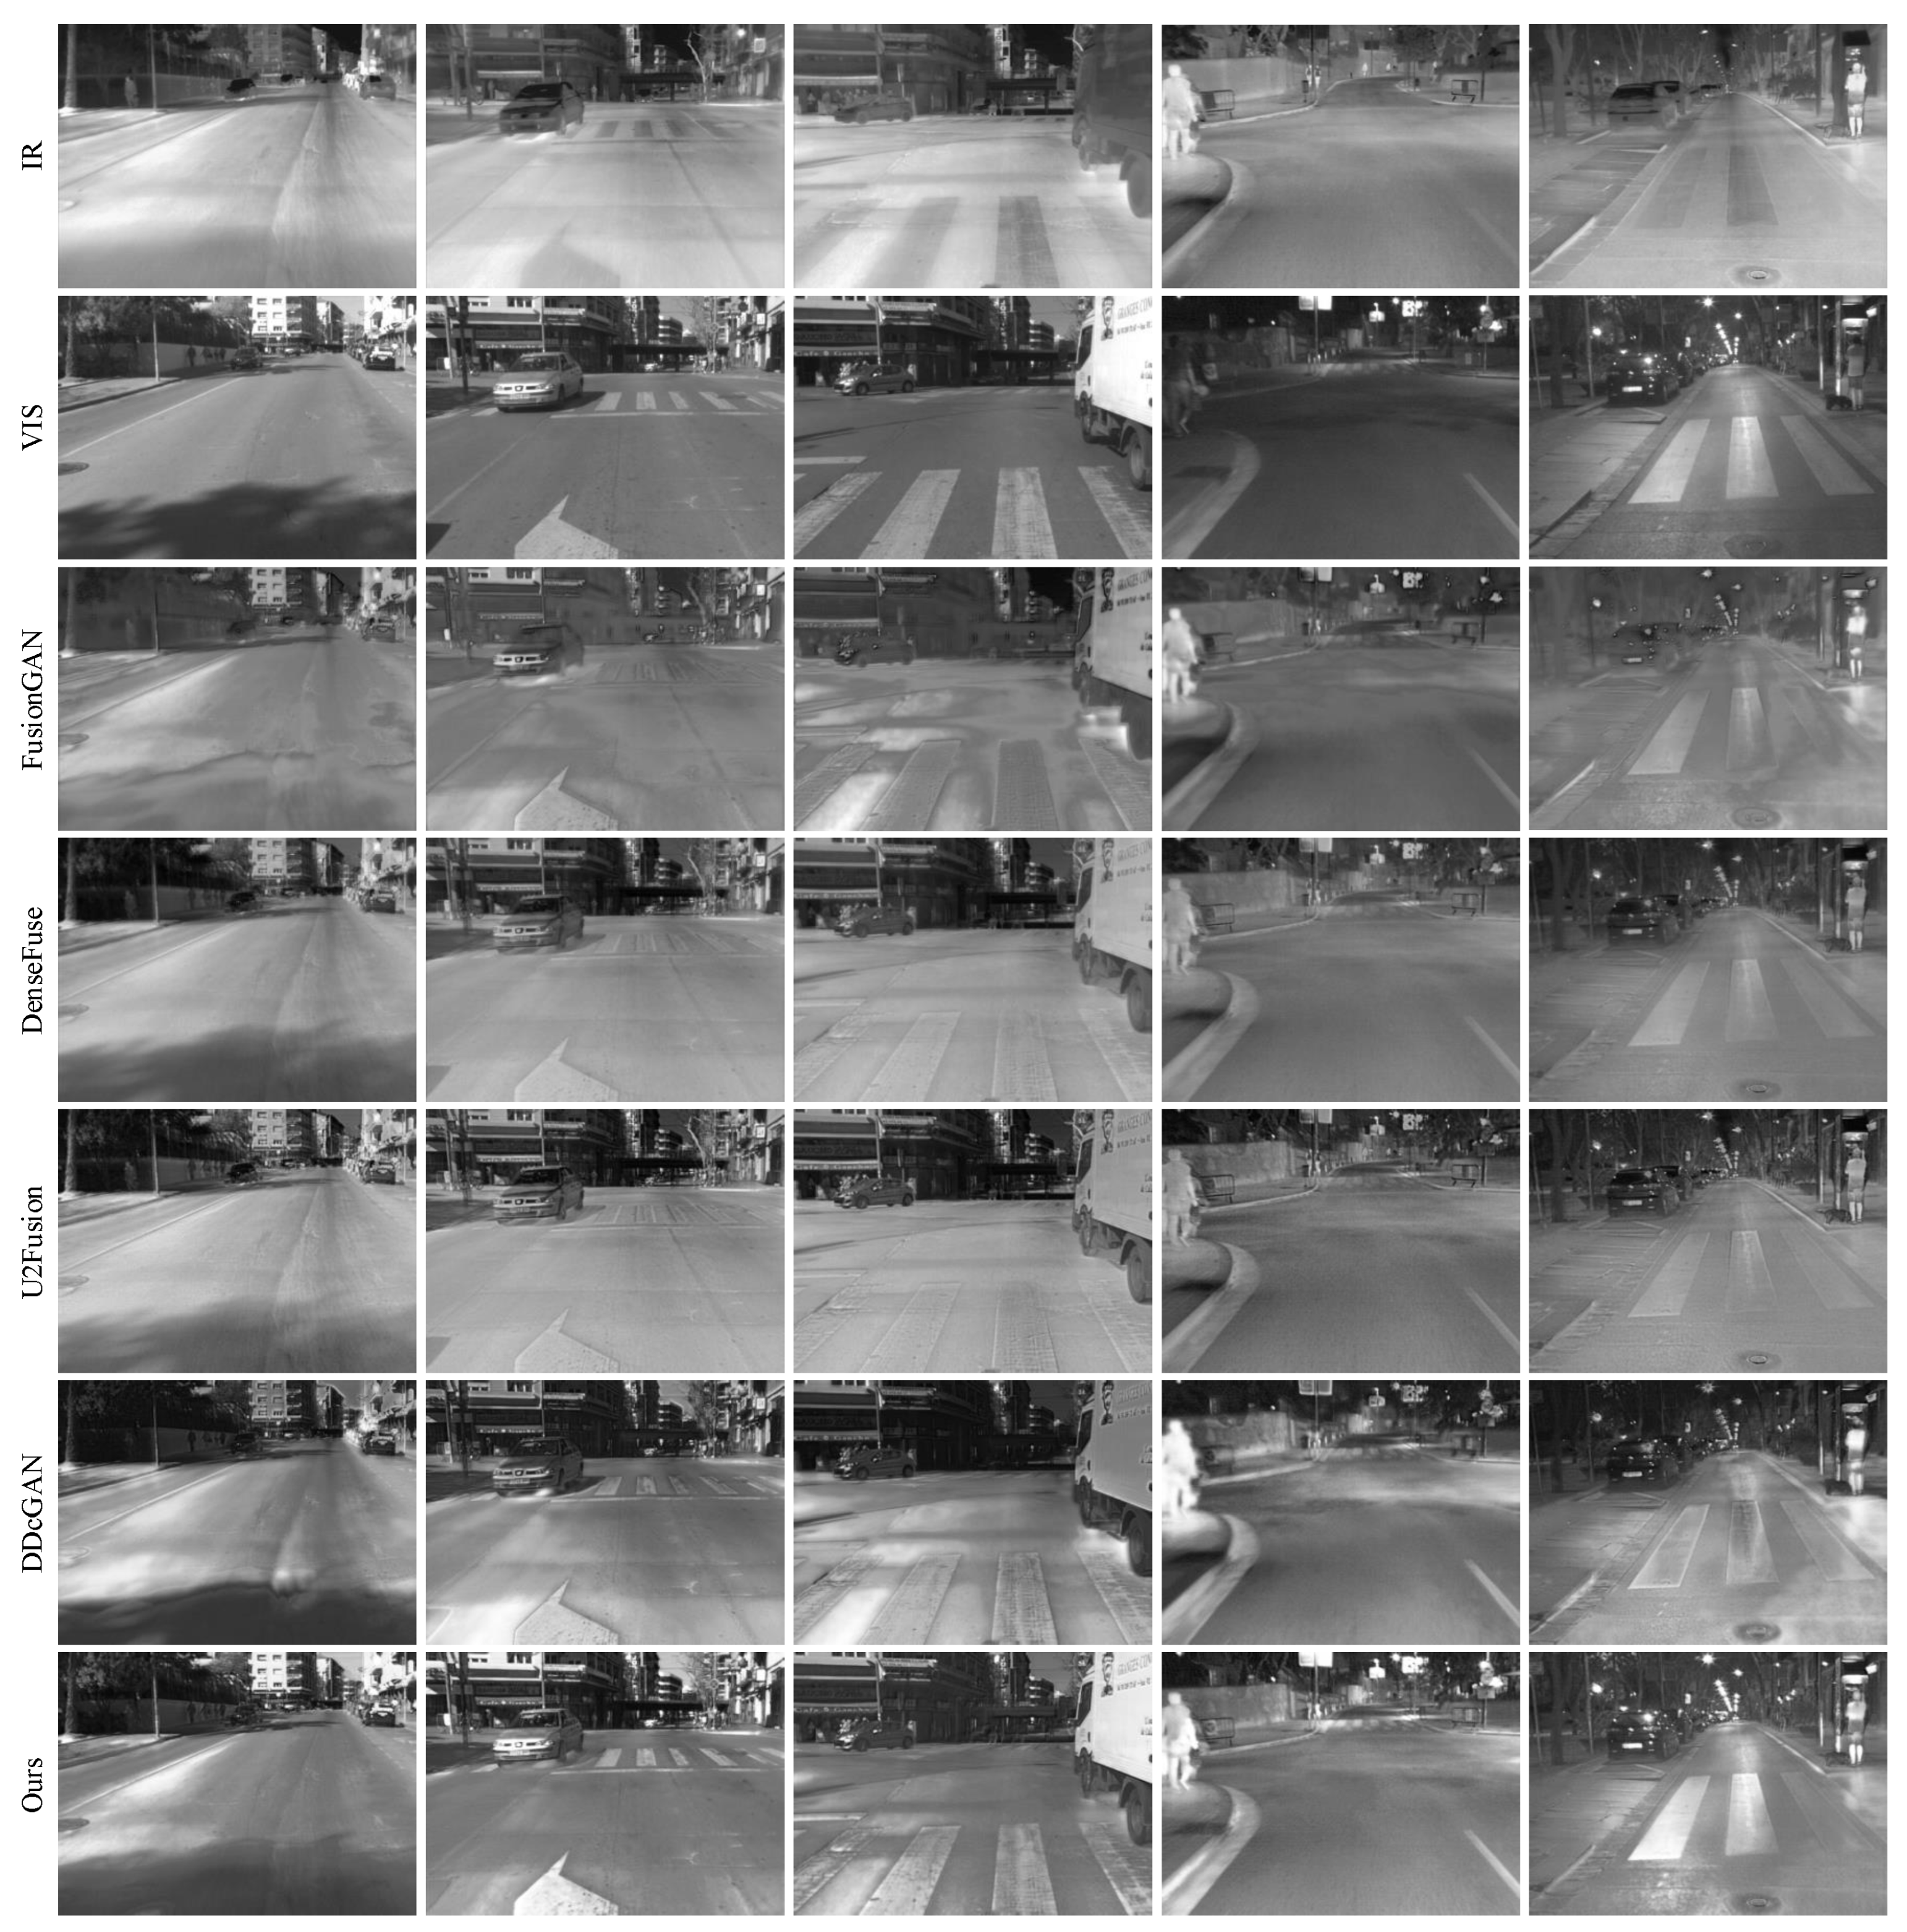
4.2. Results on the TNO Dataset

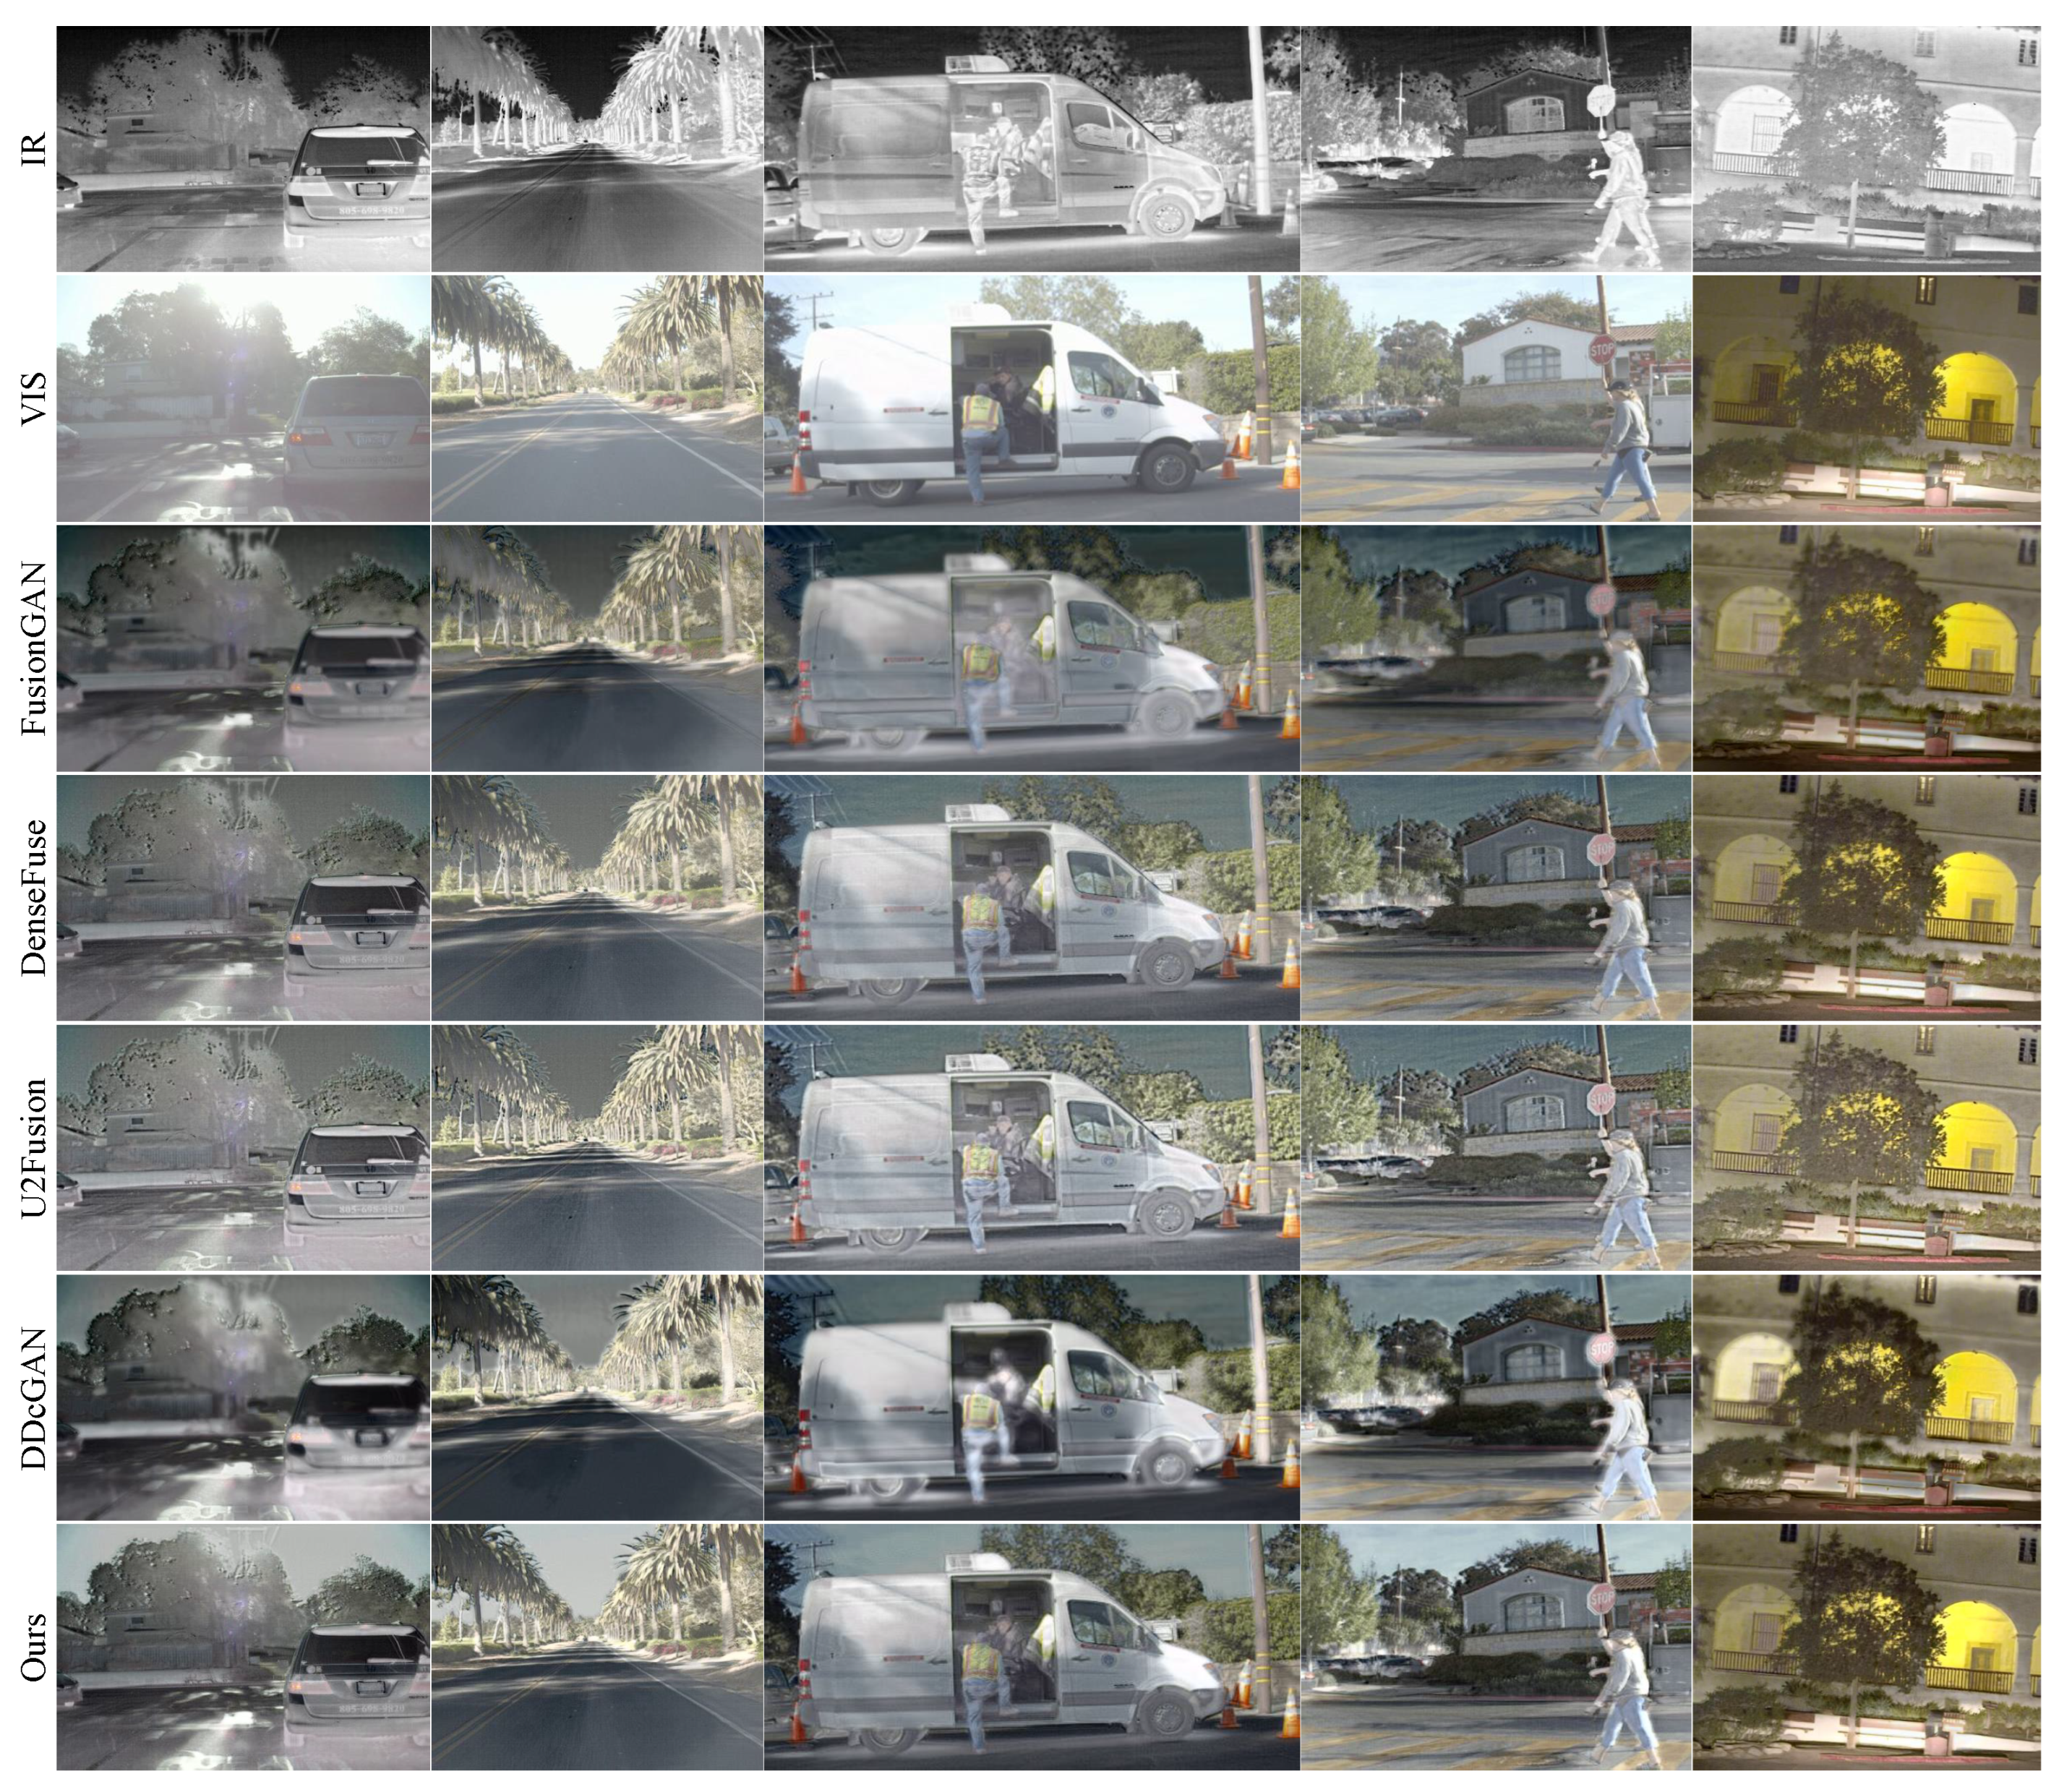
4.2.1. Qualitative Comparison

We provide six image pairs to report some intuitive results on the fusion performance, as shown in the Figure 6. Compared with other methods, our LPGAN has three advantages. First, the proposed method maintains the high-contrast characteristics of infrared images, as shown in the third and fourth examples, which proves to be effective for automatic target detection and location. Taking the third result as an example, only our LPGAN and FusionGAN can clearly distinguish the front and top of the pipeline and clearly see the edges of it. However, other methods rely too much on the information of visible image, resulting in the loss of local thermal information in the infrared image. Second, our LPGAN can preserve rich texture details of visible images, which is beneficial for accurate target recognition. As shown in the first example, since LPGAN introduces LBP into the algorithm, it significantly improves the ability of extracting details and texture features. Therefore, only LPGAN’s results can distinguish between ground details and texture features. Finally, our results all have rich pixel intensity distribution, which means that our results are more consistent with human visual system. Taking the second set of experimental results as an example, only the LPGAN fusion image can clearly show the details of the chimney, the contours of the characters, and the thermal information in the infrared image.

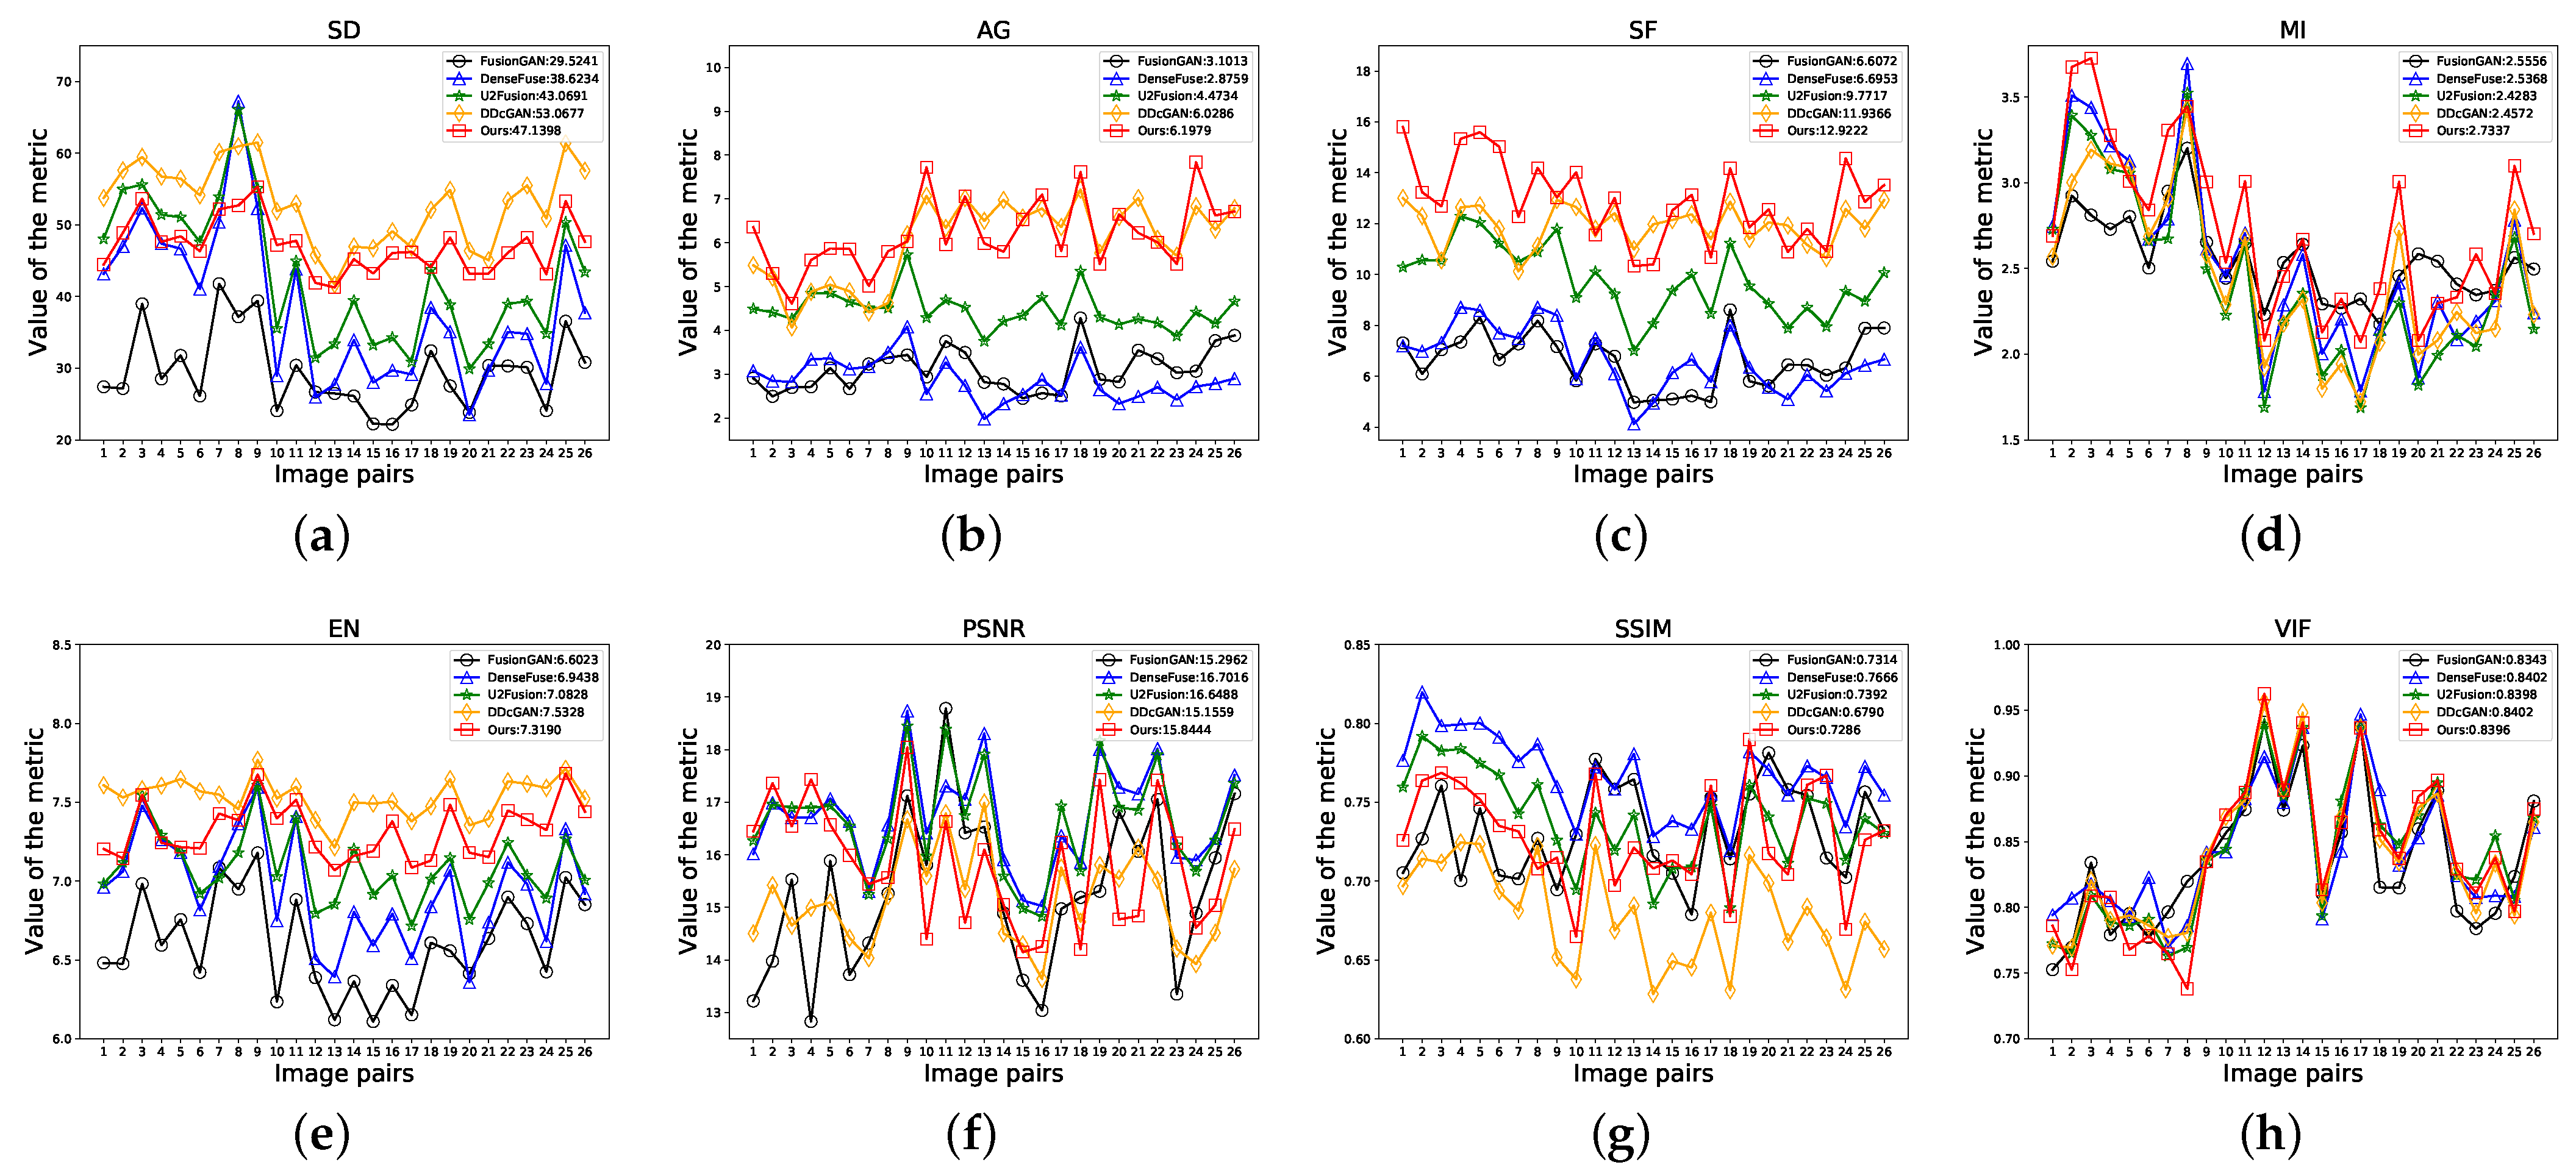
4.2.2. Quantitative Comparison

Figure 7 shows the results of all of the examined methods on 14 test image pairs of the TNO dataset. Our LPGAN can generate the largest average values on SD, AG, SF, and MI and the second largest values on EN, as shown in Figure 7a–e. In particular, our LPGAN achieves the best values of SD, SF, MI, and EN on 6, 6, 7, and 6 image pairs, respectively. For PSNR, SSIM, and VIF, our method ranks third, but the gaps with the top-ranked methods are very small, as shown in Figure 7f–h. These results demonstrate that our method is able to preserve the best edges and texture details and contains the highest contrast information. Our results also contain rich information. The value on EN is only less than DDcGAN, but our performance on MI is better, meaning that DDcGAN has more false information than our method. In addition, our method can reduce noise interference very well and has a strong correlation with the source images. Finally, although DenseFuse and U2Fusion have larger values of SSIM, our method achieves a better balance between feature information and the visual effect. From Figure 7h, it can be seen that the results of our method have a good visual effect.

4.3. Results on the CVC14 Dataset

To evaluate the effectiveness of the proposed method, we conduct experiments on the CVC14 dataset. In total, 26 image pairs are selected from different scenes for evaluation.

4.3.1. Qualitative Comparison

We perform a qualitative comparison on five typical image pairs, as shown in the first two rows of Figure 8, to demonstrate the characteristics of our method. The different light and dark changes in the results indicate that only DDcGAN and our LPGAN have high-contrast information. For example, in the first and second images, the pixel intensity distributions of the cars, buildings, roads, and people in the results of these two methods are abundant, but the results of other methods are not as obvious. Nevertheless, our results preserve more light information, as shown in the last group of results, meaning that LPGAN can extract more features from the source images. In terms of detail information preservation and visual effects, DDcGAN has more artifacts in the image due to the pursuit of high contrast, while the results of DenseFuse and U2Fusion have poor image visual effects due to less contrast. In contrast, our method can retain rich edges and texture details, while avoiding blurring and recognition difficulties due to darker colors, as shown in the third group.

4.3.2. Quantitative Comparison

As shown in Figure 9, 26 test image pairs of the CVC14 dataset are selected to further display quantitative comparisons of our LPGAN and the other examined methods. Our LPGAN still achieves the largest mean values on AG, SF, and MI, as shown in Figure 9b–d. In particular, our LPGAN achieves the largest values of SF, AG, and MI on 21, 15, and 15 image pairs. On SF and MI, our results are 8.3% and 7.0% higher than the second place, respectively. For the metric SD and EN, our LPGAN can also achieve comparable results and only follows behind DDcGAN, as shown in Figure 9a,e. However, the lower values of MI and PSNR indicate that there is more noise and fake information in the DDcGAN results. For PSNR, SSIM, and VIF, all algorithms performed very well, with small gaps, as shown in Figure 9f–h. The results demonstrate that LPGAN can not only extract richly detailed information from visible images but also retain important contrast information from infrared images.

4.4. Ablation Study

Because images of different modalities have different information distributions, we adopt a 1:4 ratio input to improve the ability of network feature extraction. At the same time, in order to ensure that the fused images have rich details and high structural similarity, we introduce LBP into the loss function to guide the optimization of the network. In order to evaluate the effect of a 1:4 ratio input and LBP, we train six models with exactly the same parameter settings on the TNO dataset according to the ratio of the input and whether LBP is used. In Figure 10, we give out a set of experimental results to show the differences between the six models.

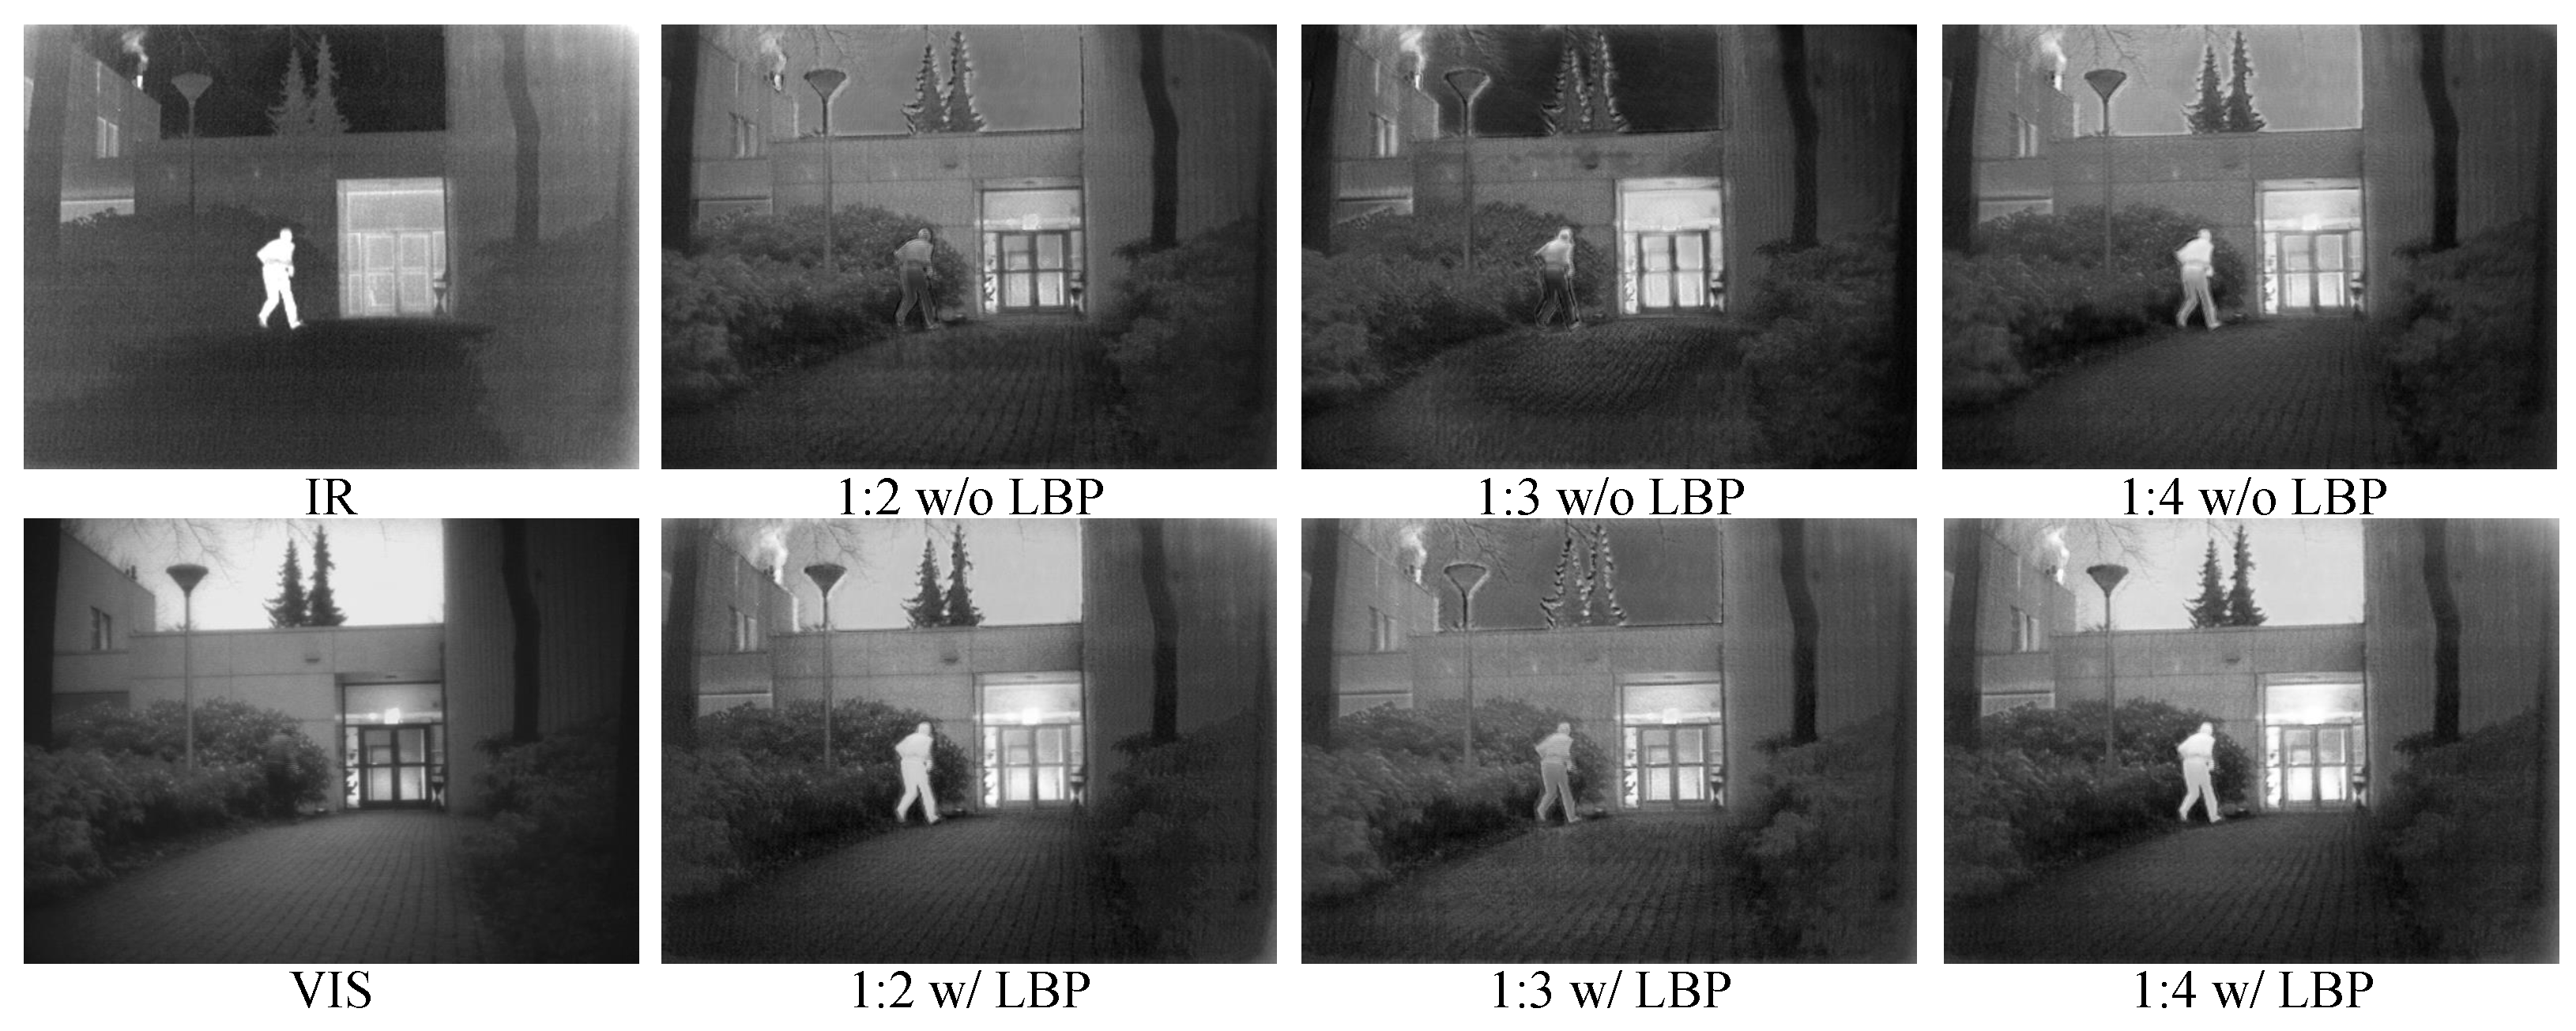
4.4.1. The Effect of LBP

We use an ablative comparison by removing the LBP. As shown in Figure 10, given the same ratio of inputs, the fusion results of LPGAN trained with  L L B P  contain more detailed information and are more in line with human-visible systems. In the second row of the figure, the images generated by LPGAN trained with  L L B P  obviously have sharper outlines, and there is more detailed background information. In addition, without using  L L B P , the results have less contrast and more distortion. Through Table 1, we can find that after adding LBP, the performance of all models are improved in almost all evaluation metrics, especially in SD, AG, and SF. This shows that after adding LBP, the ability of the model to extract detailed features are indeed enhanced.

4.4.2. The Effect of Proportional Input

The proportional input method can enhance the ability of the network to extract the feature information of different modal images, which is conducive to the effect of fusion. We explore its effectiveness of different ratios of input by setting the ratio as 1:2, 1:3, and 1:4. Since the models using LBP have better performance, we compare the models using LBP. As shown in Table 1, the last model (1:4 w/LBP) reaches the best in three of the eight evaluation metrics, and three reaches the second best value. The other two also have a small gap with the top value, especially in the key metrics such as SD, MI, and SSIM, which are better than the first model (1:2 w/LBP) and the second model (1:3 w/LBP). The second model (1:3 w/LBP) achieves the best in the four evaluation metrics, but its performance in MI and SSIM is poor, indicating that its output results contain more false information, and, as shown in Figure 10, the model with 1:4 scale has better visual effect compared with the other two, so we finally choose 1:4 as the input ratio of the network.

4.5. Additional Results for RGB Images and Infrared Images

Apart from gray-scale image fusion, LPGAN can also be used in RGB-infrared image fusion task. As shown in Figure 11, we first convert the RGB image into the YCbCr color space. Then, we use the proposed LPGAN to fuse the luminance channel of the RGB image and infrared image. This is because the structural information is usually saved in the luminance channel. After that, the fused image is combined with chroma (Cb and Cr) channels and then converted into the RGB color space. In Figure 12, we select five sets of experimental results to show the effect of LPGAN. It can be seen from the results that LPGAN can fully extract feature information from infrared images and visible images and fuse them well. Taking the first image as an example, the license plate number in the visible light image is very fuzzy, but the model accurately fuses the two based on the feature information in the infrared image. Only DenseFusion, U2Fusion, and the output results of our method can clearly see the license plate number of the vehicle. However, in the second group of experimental results, only the fusion result of our method can better preserve the color of the sky in the visible image, and only the result of our method can judge that it is daytime.

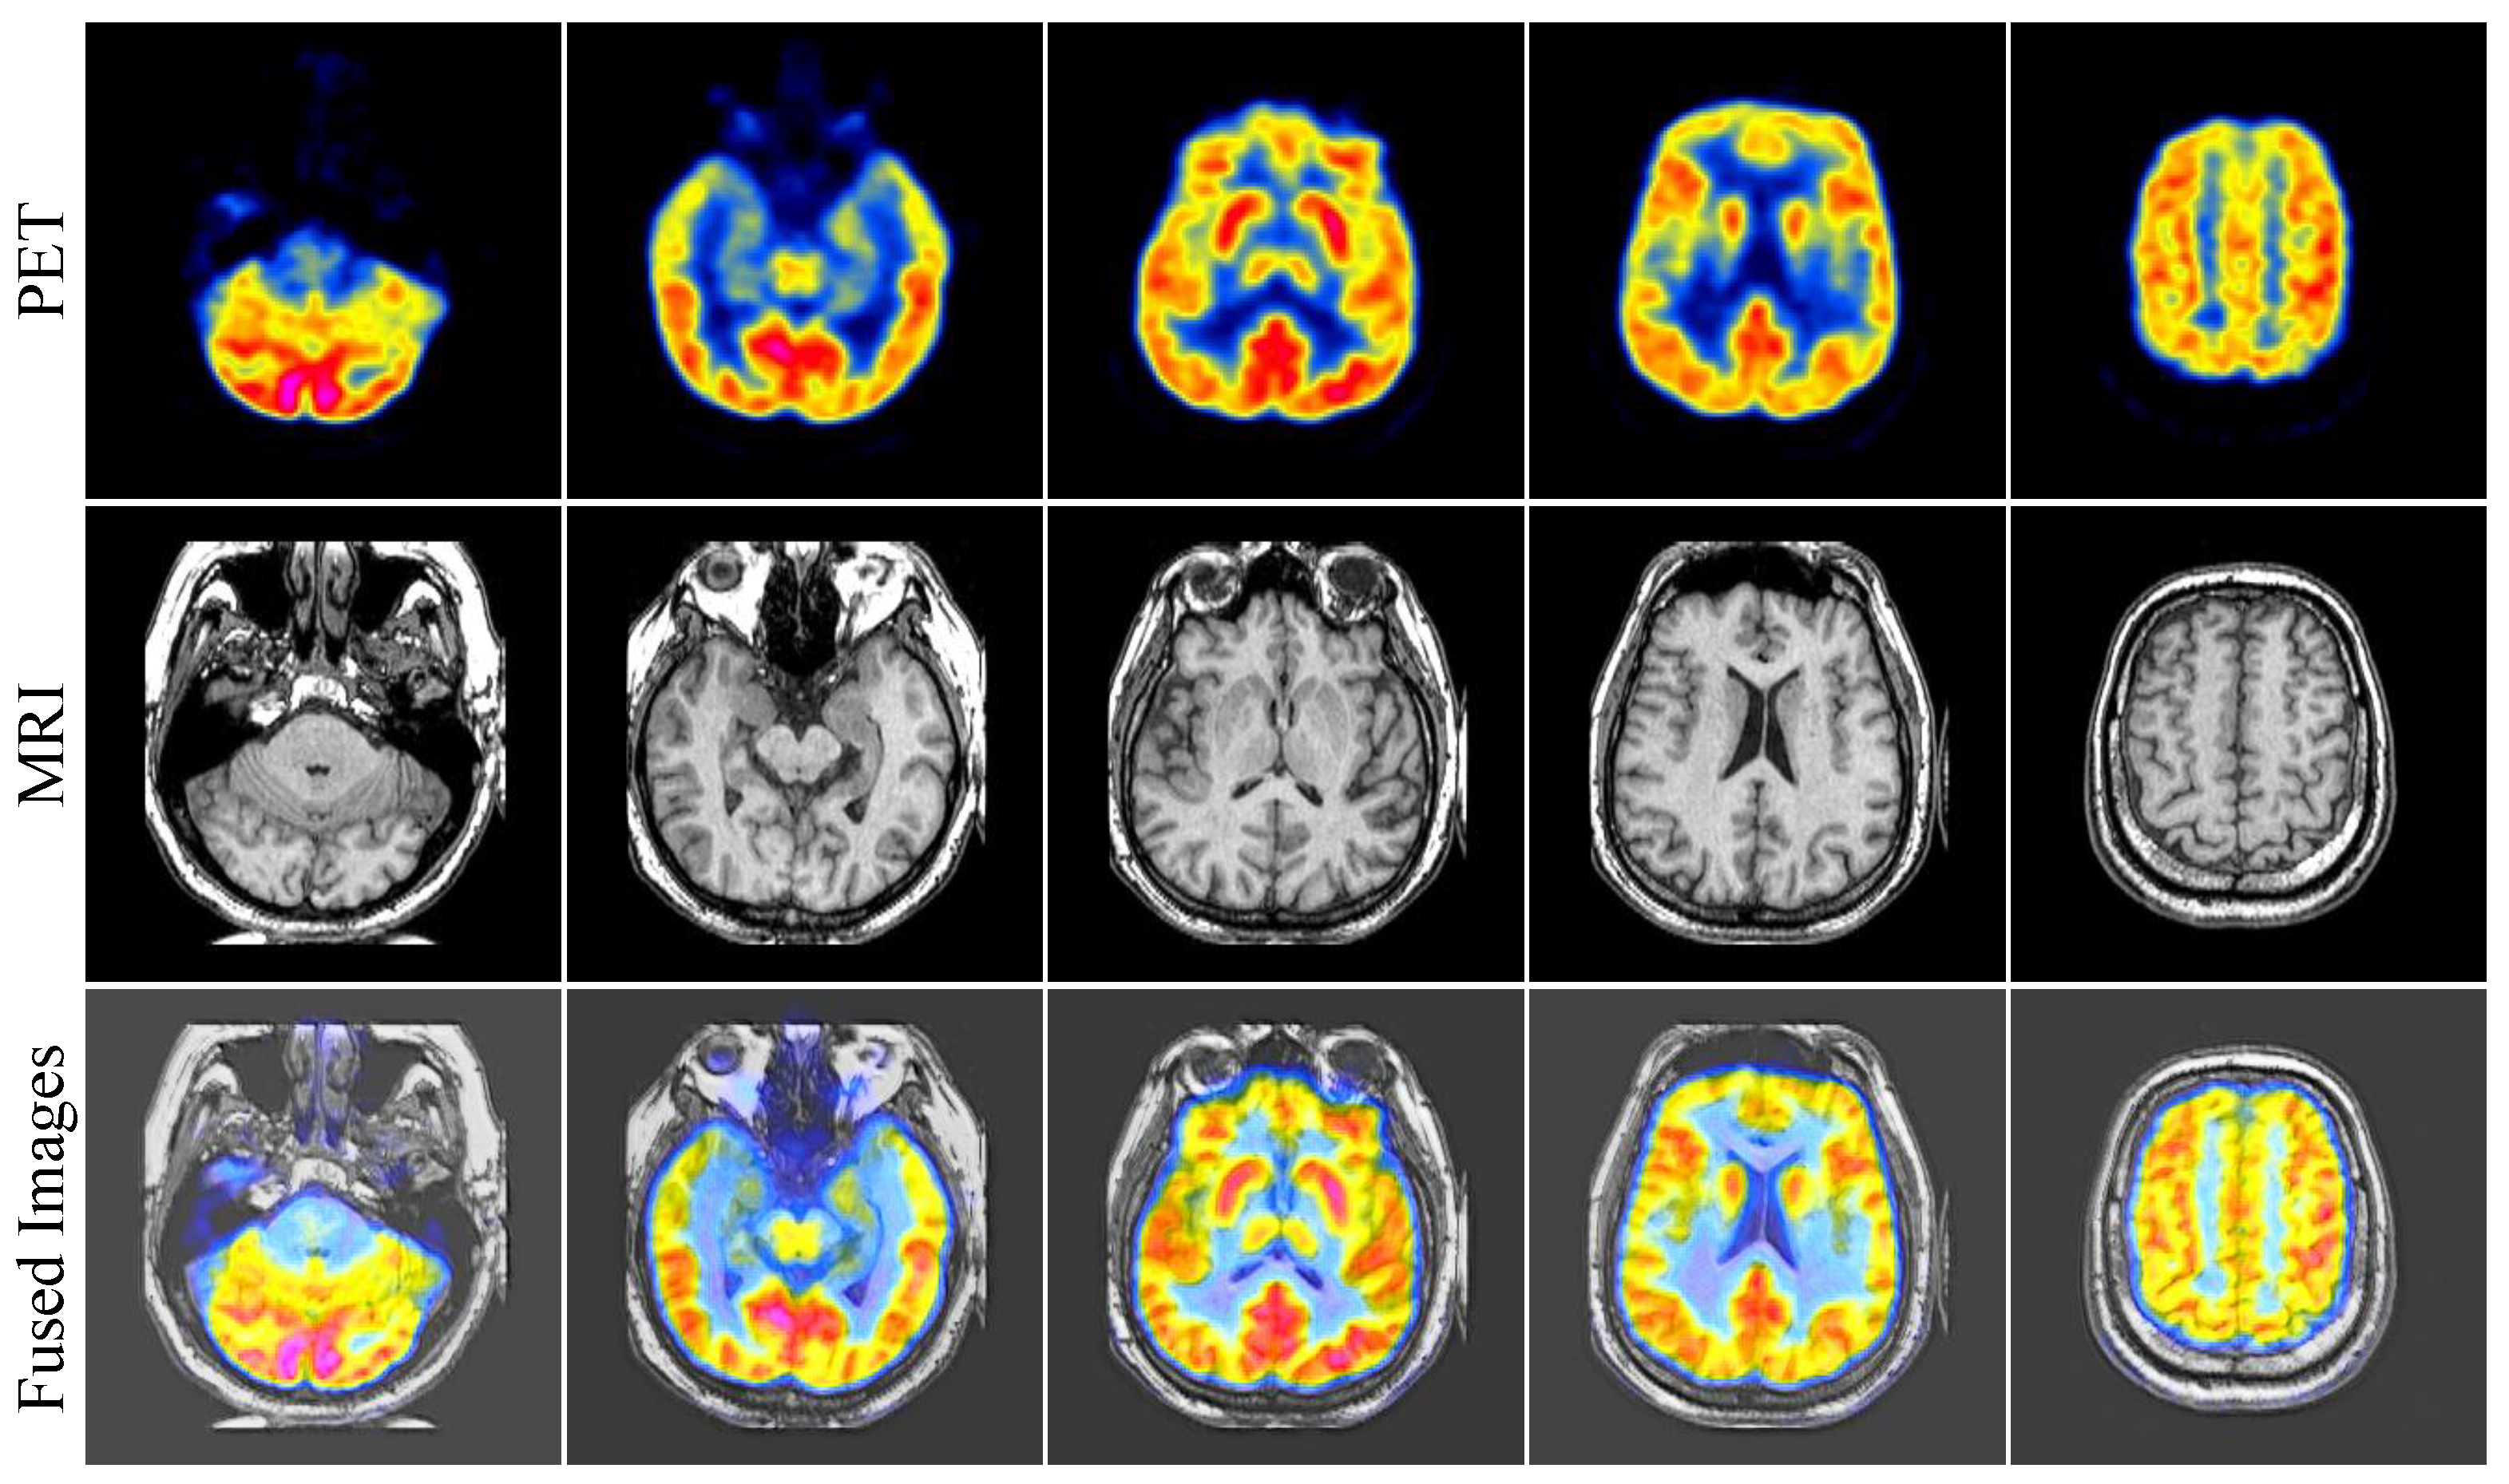
4.6. Additional Results for PET Images and MRI Images

Positron emission computed tomography (PET) images can accurately detect dense tissues, such as human bones, but their ability to detect soft tissue structures is insufficient. Magnetic resonance imaging (MRI) images can clearly describe the soft tissues of the human body, with a lot of texture details. The fused image can retain the features of both images, which is conducive to accurate image interpretation. Therefore, in this section, we explore the application of LPGAN in medical image fusion. The fusion method is the same as the previous section and will not be repeated here. In Figure 13, we select five sets of experimental results to show the effect of LPGAN. From the experimental results, it can be seen that although LPGAN is a specially designed algorithm for infrared and visible image fusion, the principle of medical image fusion is similar to that of infrared and visible image fusion, so LPGAN can also be well applied to medical image fusion. Moreover, due to the powerful ability of the LPGAN network to extract detailed features, it reflects almost all the detailed information in MRI images in the fused image. However, due to the lack of a special network structure design for medical image fusion in LPGAN, its retention of color information in PET images is slightly insufficient, and the overall fused image shows white deviation. However, more information can still be obtained from the fused image than from a single modal image.

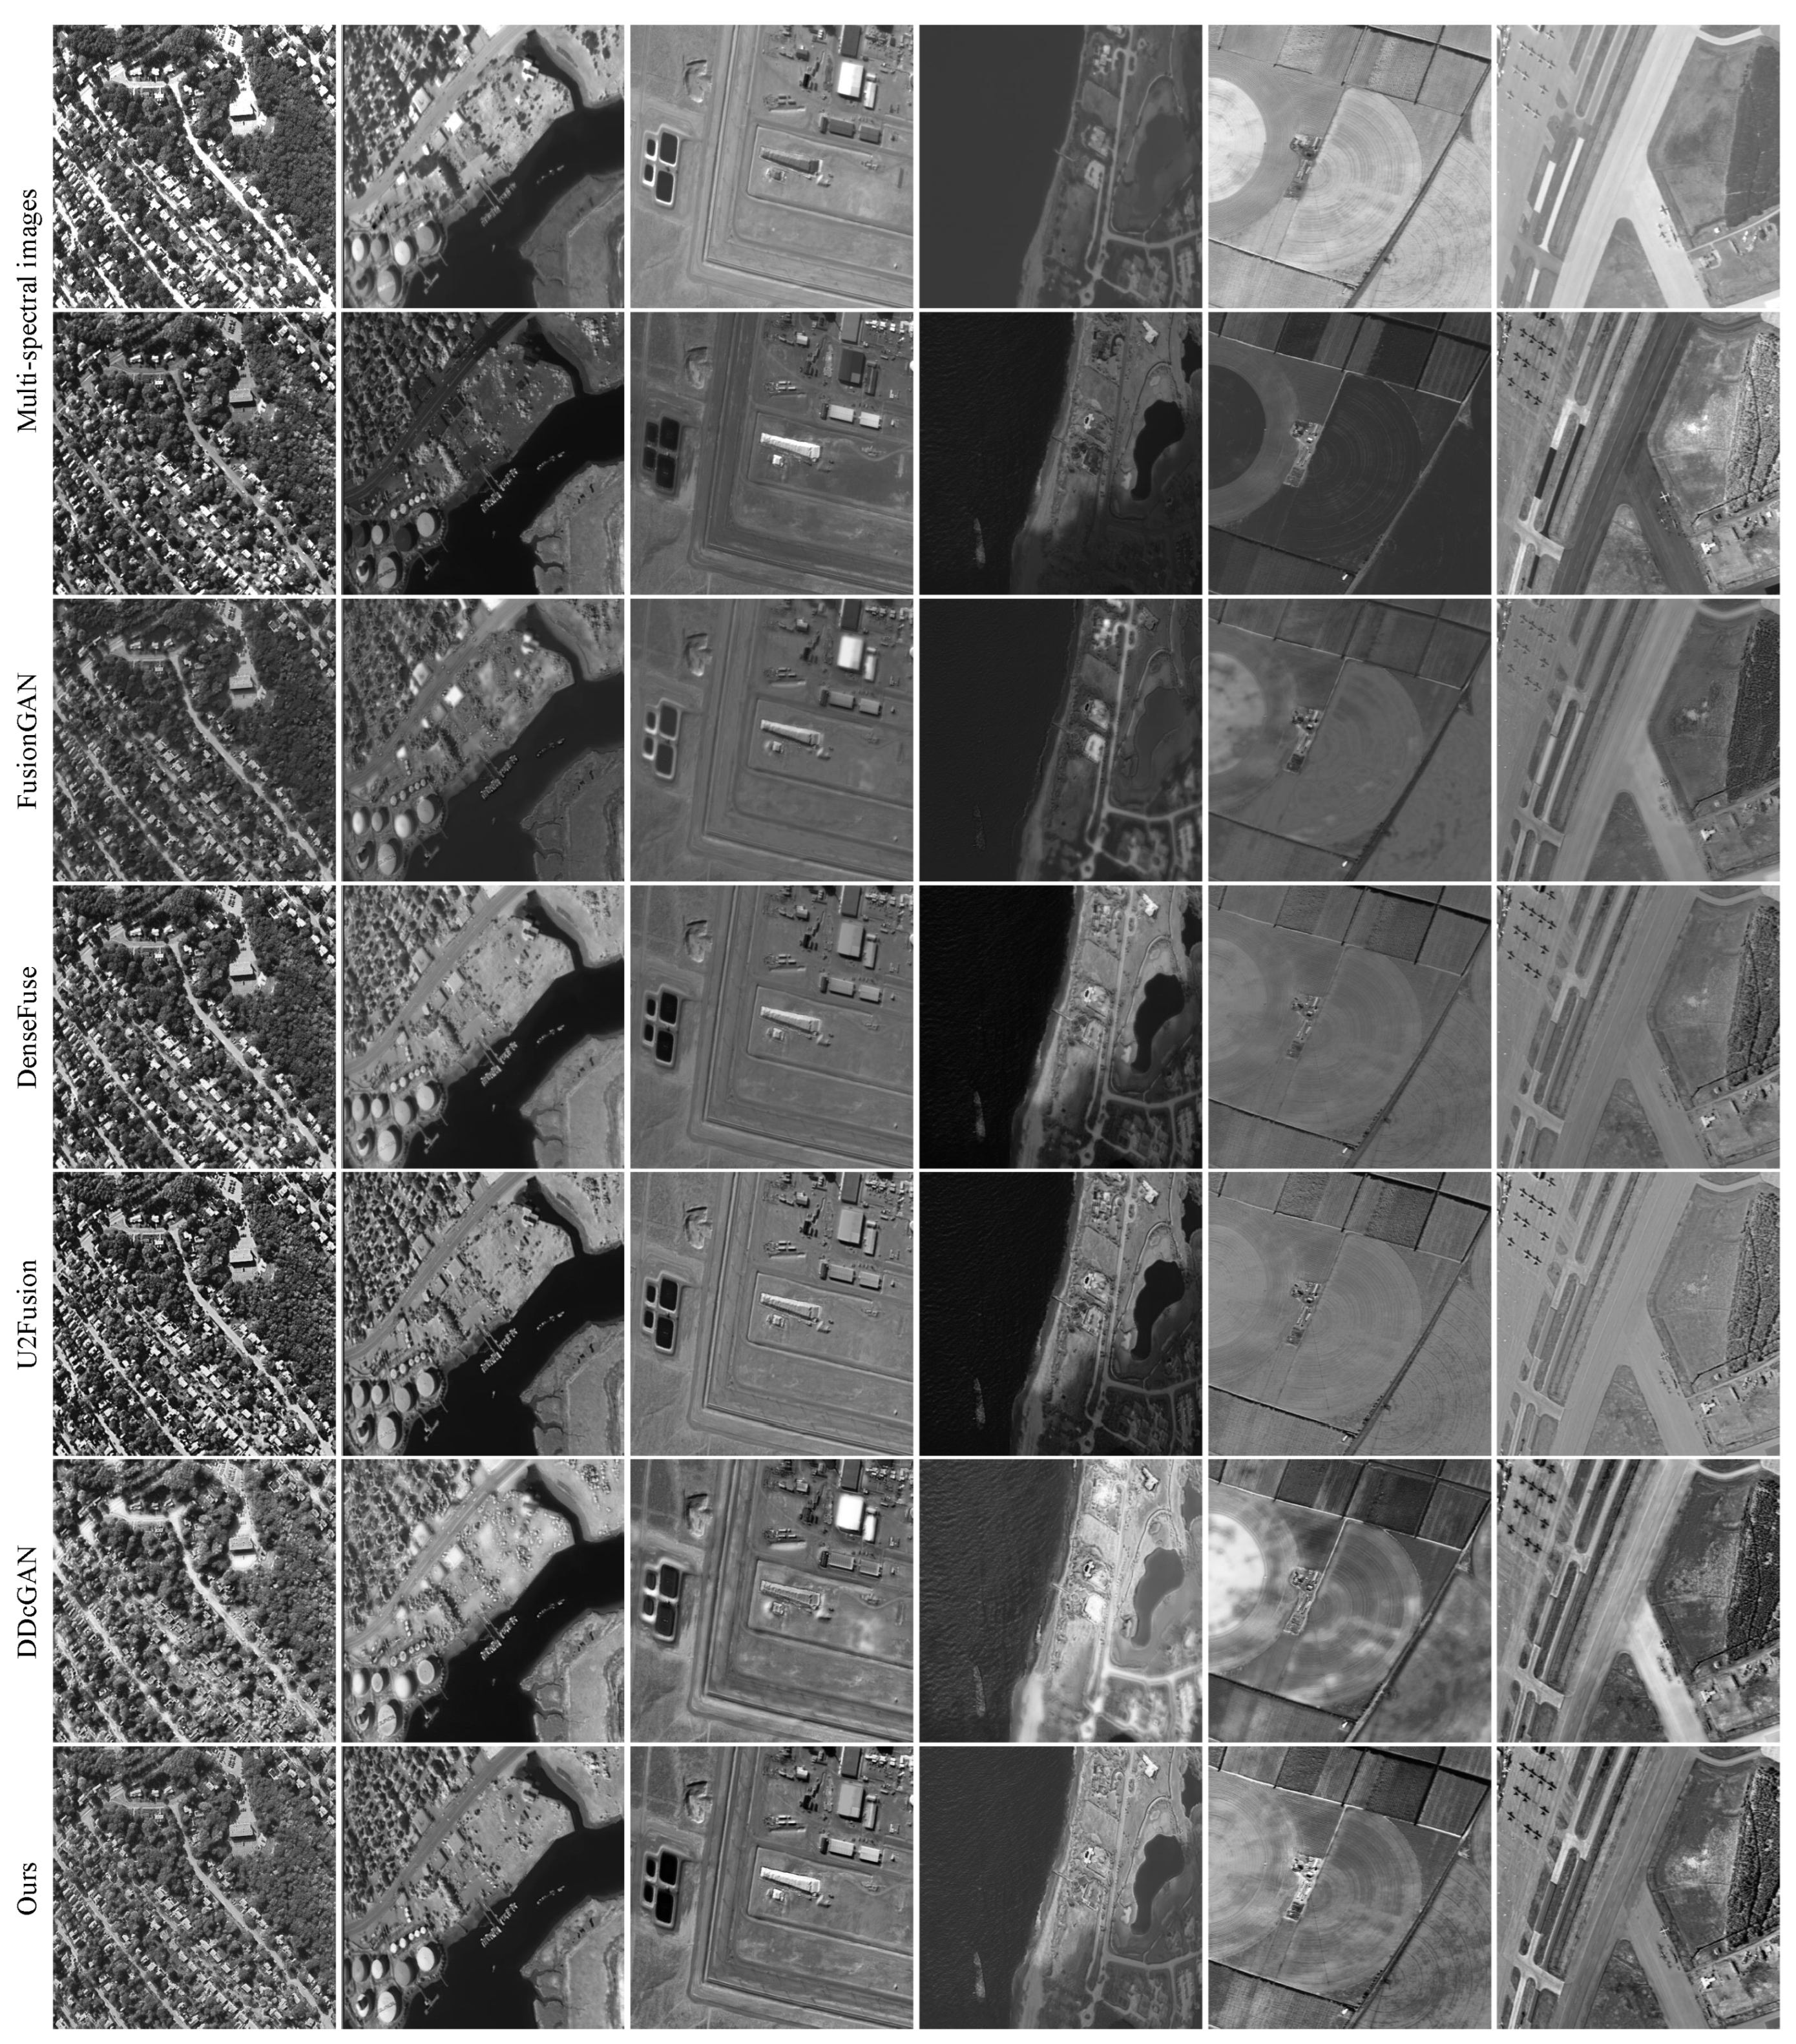
4.7. Multi-Spectral Image Fusion Expansion Experiment

In this work, we apply our method to multi-spectral remote sensing image fusion and compare it with four state-of-the-art fusion algorithms.
We report six typical image pairs, as seen in Figure 14. The first two rows are multi-spectral images of two different bands, and both images are taken from the same scene and have the same resolution. The images in the first row have the same high contrast characteristics as the infrared images, and the images in the second row have the same feature of richly detailed information as the visible images. Thus, we follow the idea of infrared and visible image fusion to fuse these two remote sensing images.
Detailed features are the most important information in remote sensing images. DenseFuse, U2Fusion, and our LPGAN can preserve it well, but our method performs better. In the third and fifth groups of results, only LPGAN exhibits subtle changes in ground details without producing artifacts, which is very important in small target-detection tasks. In addition, it is obvious that only DDcGAN and our method can achieve a high contrast. For example, in the last set of results, DDcGAN and our method can clearly distinguish roads from background information, while for the other three methods it is more difficult. However, DDcGAN produces many artifacts in the process of image fusion, as shown in the fourth and fifth experimental results. In contrast, the results of our method all have clear images, no distortion or artifacts and are very consistent with the human visual system.
To evaluate the capability of LPGAN more objectively, we also conduct a quantitative assessment. In total, 29 pairs of images are selected for testing and 8 performance metrics are performed. For the characteristics of remote sensing images, we replace VIF with the correlation coefficient (CC) [64]. The  C C  expresses the degree to which the source image and fused image are related, and Pearson’s correlation is mostly used to measure the above-mentioned correlation [65]. Table 2 shows the results of the quantitative comparisons. Our LPGAN achieves the best performances on AG and SF and achieves the second largest values in other metrics except PSNR. For PSNR, our method also shows comparable result and generates the third largest average value. DenseFuse is slightly better than our method in terms of SSIM, MI, and  C C , but there is a large gap with our method in terms of SD, AG, and SF, which indicates that DenseFuse is not sufficient for detailed retention. U2Fusion and our method have a small gap in all metrics, but it only achieves better result than ours on PSNR. The largest values of EN and SD are achieved by DDcGAN, and LPGAN all ranks second. However, low values on SSIM, MI, and  C C  indicate that there is considerable fake information in the results of DDcGAN, and DDcGAN cannot retain structural information from source images well.

5. Discussion

In this section, we discuss a key issue of image fusion and the effectiveness of our solution. We also introduce the limitations of our method and our future work.
For different characteristics and needs, many evaluation metrics for image fusion have been proposed. An excellent image fusion algorithm must not only have high-quality visual effects but also achieve good results on these metrics. During our experiments, we found that good visual effects conflict with some metrics, such as SD, SF, and AG. Specifically, an algorithm with a high SSIM index generally has better visual effects, but its performance on SD, SF, and AG will be poor, such as for FusionGAN, DenseFuse, and U2Fusion. The reverse is also the same, such as for DDcGAN. Our LPGAN successfully avoids this problem. It not only performs well on SD, SF, and AG, but also performs well on SSIM. We use DDcGAN as an example to analyze the causes of the previous problem. In the process of image fusion, too much emphasis is placed on gradient intensity changes, and the gradient direction and the texture features of the source image are ignored, leading to poor visual effects. Based on this idea, we creatively introduce LBP into the loss function, and, in order to preserve the spatial information of the image, we converted the calculated LBP into 4096 dimensional vector, which enabled us to better avoid the above problems. Firstly, since LBP can accurately describe local texture features in an image, the introduction of LBP significantly improves the model’s ability to extract low-level features from the source images. Secondly, depending on the LBP’s ability to improve the model’s detail features, this paper slightly increases the weight of the loss part of structural similarity when designing the coefficients of the loss function, thus obtaining a greater improvement in structural similarity at the expense of less detailed features. In the experimental comparison, LPGAN can still achieve the best performance in SD, AG, and SF indicators while ensuring good structural similarity, indicating that LPGAN’s ability to extract detailed features is still the strongest. As shown in the results of the ablation experiment, the introduction of LBP can improve LPGAN in almost all aspects and successfully solve the above-mentioned key problem.
Although LPGAN can achieve good performance on infrared-visible image fusion and multi-spectral image fusion tasks, avoiding the above problem, its visual effects and performance on SSIM still need to be improved. In the future, we will try to consider image fusion from the perspective of decision-making and focus on the use of an attention mechanism to enable the network to perform fusion operations based on the information distribution of the source images. This is because in actual image fusion tasks, one source image is often of low quality. Therefore, we hope to adjust the fusion parameters adaptively by introducing an attention mechanism. Furthermore, we plan to apply our method in other image fusion tasks, such as multi-focus image fusion and multi-exposure image fusion.

6. Conclusions

In this paper, we propose a novel GAN-based visible-infrared image fusion method, termed as LPGAN. It is an unsupervised end-to-end model. We adopt a cGAN as the framework and employ two discriminators, avoiding the mod collapse issue and providing the network with high stability. Simultaneously, considering the differences of imaging mechanisms and characteristics between visible images and infrared images, a pseudo-Siamese network is used for a generator to extract the detailed features and contrast features. We also set a 1:4 ratio input method according to the characteristics of different modal images to further improve the feature extraction capability of the network. In response to the existing problem, we innovatively introduce LBP into the loss function, which greatly improves the texture description ability and anti-interference ability of LPGAN. Compared with other four state-of-the-art methods on the publicly available TNO dataset, CVC14 dataset, ROADScene dataset, and Harvard medical dataset, our method can achieve advanced performance both qualitatively and quantitatively. The experiment on a multi-spectral image fusion task also demonstrates that our LPGAN can achieve state-of-the-art performance.

Author Contributions

The first two authors have equally contributed to the work. Conceptualization, Y.Z.; methodology, D.Y. and Y.Z.; software, D.Y.; validation, W.X. and P.S.; formal analysis, Y.Z., P.S. and D.Y.; investigation, Y.Z., P.S., W.X. and D.Z.; resources, Y.Z.; writing—original draft preparation, D.Y.; writing—review and editing, Y.Z., W.X. and P.S.; visualization, P.S. and D.Z.; supervision, Y.Z. and W.X.; project administration, Y.Z.; funding acquisition, Y.Z. All authors have read and agreed to the published version of the manuscript.

Funding

This work was supported in part by the National Natural Science Foundation of China under Grant 62273353.

Institutional Review Board Statement

Not applicable.

Informed Consent Statement

Not applicable.

Data Availability Statement

The data presented in this study are available on request from the corresponding author. The data are not publicly available due to their large size.

Conflicts of Interest

The authors declare no conflict of interest.

References

  1. Li, S.; Kang, X.; Fang, L.; Hu, J.; Yin, H. Pixel-level image fusion: A survey of the state of the art. Inf. Fusion 2017, 33, 100–112. [Google Scholar] [CrossRef]
  2. Li, S.; Kang, X.; Hu, J. Image fusion with guided filtering. IEEE Trans. Image Process. 2013, 22, 2864–2875. [Google Scholar] [PubMed]
  3. Yang, J.; Zhao, Y.; Chan, J.C.W. Hyperspectral and Multispectral Image Fusion via Deep Two-Branches Convolutional Neural Network. Remote Sens. 2018, 10, 800. [Google Scholar] [CrossRef]
  4. Sun, K.; Tian, Y. DBFNet: A Dual-Branch Fusion Network for Underwater Image Enhancement. Remote Sens. 2023, 15, 1195. [Google Scholar] [CrossRef]
  5. Eslami, M.; Mohammadzadeh, A. Developing a Spectral-Based Strategy for Urban Object Detection From Airborne Hyperspectral TIR and Visible Data. IEEE J. Sel. Top. Appl. Earth Obs. Remote Sens. 2016, 9, 1808–1816. [Google Scholar] [CrossRef]
  6. Wang, J.; Li, L.; Liu, Y.; Hu, J.; Xiao, X.; Liu, B. AI-TFNet: Active Inference Transfer Convolutional Fusion Network for Hyperspectral Image Classification. Remote Sens. 2023, 15, 1292. [Google Scholar] [CrossRef]
  7. Wang, Z.; Ziou, D.; Armenakis, C.; Li, D.; Li, Q. A comparative analysis of image fusion methods. IEEE Trans. Geosci. Remote Sens. 2005, 43, 1391–1402. [Google Scholar] [CrossRef]
  8. Fu, X.; Jia, S.; Xu, M.; Zhou, J.; Li, Q. Fusion of Hyperspectral and Multispectral Images Accounting for Localized Inter-image Changes. IEEE Trans. Geosci. Remote Sens. 2021, 60, 5517218. [Google Scholar] [CrossRef]
  9. James, A.P.; Dasarathy, B.V. Medical image fusion: A survey of the state of the art. Inf. Fusion 2014, 19, 4–19. [Google Scholar] [CrossRef]
  10. Ghassemian, H. A review of remote sensing image fusion methods. Inf. Fusion 2016, 32, 75–89. [Google Scholar] [CrossRef]
  11. Ma, J.; Ma, Y.; Li, C. Infrared and visible image fusion methods and applications: A survey. Inf. Fusion 2019, 45, 153–178. [Google Scholar] [CrossRef]
  12. Hu, H.M.; Wu, J.; Li, B.; Guo, Q.; Zheng, J. An adaptive fusion algorithm for visible and infrared videos based on entropy and the cumulative distribution of gray levels. IEEE Trans. Multimed. 2017, 19, 2706–2719. [Google Scholar] [CrossRef]
  13. He, K.; Zhou, D.; Zhang, X.; Nie, R.; Wang, Q.; Jin, X. Infrared and visible image fusion based on target extraction in the nonsubsampled contourlet transform domain. J. Appl. Remote. Sens. 2017, 11, 015011. [Google Scholar] [CrossRef]
  14. Bin, Y.; Chao, Y.; Guoyu, H. Efficient image fusion with approximate sparse representation. Int. J. Wavelets Multiresolut. Inf. Process. 2016, 14, 1650024. [Google Scholar] [CrossRef]
  15. Zhang, Q.; Liu, Y.; Blum, R.S.; Han, J.; Tao, D. Sparse representation based multi-sensor image fusion for multi-focus and multi-modality images: A review. Inf. Fusion 2018, 40, 57–75. [Google Scholar] [CrossRef]
  16. Naidu, V. Hybrid DDCT-PCA based multi sensor image fusion. J. Opt. 2014, 43, 48–61. [Google Scholar] [CrossRef]
  17. Ma, J.; Zhou, Z.; Wang, B.; Zong, H. Infrared and visible image fusion based on visual saliency map and weighted least square optimization. Infrared Phys. Technol. 2017, 82, 8–17. [Google Scholar] [CrossRef]
  18. Yang, Y.; Zhang, Y.; Huang, S.; Zuo, Y.; Sun, J. Infrared and visible image fusion using visual saliency sparse representation and detail injection model. IEEE Trans. Instrum. Meas. 2020, 70, 1–15. [Google Scholar] [CrossRef]
  19. Yin, M.; Duan, P.; Liu, W.; Liang, X. A novel infrared and visible image fusion algorithm based on shift-invariant dual-tree complex shearlet transform and sparse representation. Neurocomputing 2017, 226, 182–191. [Google Scholar] [CrossRef]
  20. Fu, D.; Chen, B.; Wang, J.; Zhu, X.; Hilker, T. An Improved Image Fusion Approach Based on Enhanced Spatial and Temporal the Adaptive Reflectance Fusion Model. Remote Sens. 2013, 5, 6346–6360. [Google Scholar] [CrossRef]
  21. Ma, J.; Chen, C.; Li, C.; Huang, J. Infrared and visible image fusion via gradient transfer and total variation minimization. Inf. Fusion 2016, 31, 100–109. [Google Scholar] [CrossRef]
  22. Ma, Y.; Chen, J.; Chen, C.; Fan, F.; Ma, J. Infrared and visible image fusion using total variation model. Neurocomputing 2016, 202, 12–19. [Google Scholar] [CrossRef]
  23. Xiang, T.; Yan, L.; Gao, R. A fusion algorithm for infrared and visible images based on adaptive dual-channel unit-linking PCNN in NSCT domain. Infrared Phys. Technol. 2015, 69, 53–61. [Google Scholar] [CrossRef]
  24. Liu, Y.; Chen, X.; Wang, Z.; Wang, Z.J.; Ward, R.K.; Wang, X. Deep learning for pixel-level image fusion: Recent advances and future prospects. Inf. Fusion 2018, 42, 158–173. [Google Scholar] [CrossRef]
  25. Xu, F.; Liu, J.; Song, Y.; Sun, H.; Wang, X. Multi-Exposure Image Fusion Techniques: A Comprehensive Review. Remote Sens. 2022, 14, 771. [Google Scholar] [CrossRef]
  26. Yang, D.; Zheng, Y.; Xu, W.; Sun, P.; Zhu, D. A Generative Adversarial Network for Image Fusion via Preserving Texture Information. In International Conference on Guidance, Navigation and Control; Springer: Berlin/Heidelberg, Germany, 2022. [Google Scholar]
  27. Li, H.; Wu, X.J. DenseFuse: A fusion approach to infrared and visible images. IEEE Trans. Image Process. 2018, 28, 2614–2623. [Google Scholar] [CrossRef] [PubMed]
  28. Ma, J.; Yu, W.; Liang, P.; Li, C.; Jiang, J. FusionGAN: A generative adversarial network for infrared and visible image fusion. Inf. Fusion 2019, 48, 11–26. [Google Scholar] [CrossRef]
  29. Ma, J.; Xu, H.; Jiang, J.; Mei, X.; Zhang, X.P. DDcGAN: A dual-discriminator conditional generative adversarial network for multi-resolution image fusion. IEEE Trans. Image Process. 2020, 29, 4980–4995. [Google Scholar] [CrossRef]
  30. Xu, H.; Ma, J.; Jiang, J.; Guo, X.; Ling, H. U2Fusion: A unified unsupervised image fusion network. IEEE Trans. Pattern Anal. Mach. Intell. 2020, 44, 502–518. [Google Scholar] [CrossRef]
  31. Ojala, T.; Pietikainen, M.; Harwood, D. Performance evaluation of texture measures with classification based on Kullback discrimination of distributions. In Proceedings of the 12th International Conference on Pattern Recognition, Jerusalem, Israel, 9–13 October 1994; Volume 1, pp. 582–585. [Google Scholar] [CrossRef]
  32. Zhang, H.; Xu, H.; Xiao, Y.; Guo, X.; Ma, J. Rethinking the Image Fusion: A Fast Unified Image Fusion Network based on Proportional Maintenance of Gradient and Intensity. In Proceedings of the AAAI Conference on Artificial Intelligence, New York, NY, USA, 7–12 February 2020; Volume 34, pp. 12797–12804. [Google Scholar] [CrossRef]
  33. Ma, J.; Zhang, H.; Shao, Z.; Liang, P.; Xu, H. GANMcC: A Generative Adversarial Network With Multiclassification Constraints for Infrared and Visible Image Fusion. IEEE Trans. Instrum. Meas. 2020, 70, 5005014. [Google Scholar] [CrossRef]
  34. González, A.; Fang, Z.; Socarras, Y.; Serrat, J.; Vázquez, D.; Xu, J.; López, A.M. Pedestrian detection at day/night time with visible and FIR cameras: A comparison. Sensors 2016, 16, 820. [Google Scholar] [CrossRef] [PubMed]
  35. Ma, J.; Liang, P.; Yu, W.; Chen, C.; Guo, X.; Wu, J.; Jiang, J. Infrared and visible image fusion via detail preserving adversarial learning. Inf. Fusion 2020, 54, 85–98. [Google Scholar] [CrossRef]
  36. Liu, Y.; Chen, X.; Ward, R.K.; Wang, Z.J. Image fusion with convolutional sparse representation. IEEE Signal Process. Lett. 2016, 23, 1882–1886. [Google Scholar] [CrossRef]
  37. Liu, Y.; Chen, X.; Peng, H.; Wang, Z. Multi-focus image fusion with a deep convolutional neural network. Inf. Fusion 2017, 36, 191–207. [Google Scholar] [CrossRef]
  38. Li, H.; Wu, X.J.; Kittler, J. Infrared and visible image fusion using a deep learning framework. In Proceedings of the 2018 24th International Conference on Pattern Recognition (ICPR), Beijing, China, 20–24 August 2018; pp. 2705–2710. [Google Scholar]
  39. Liu, Q.; Zhou, H.; Xu, Q.; Liu, X.; Wang, Y. PSGAN: A generative adversarial network for remote sensing image pan-sharpening. IEEE Trans. Geosci. Remote Sens. 2020, 59, 10227–10242. [Google Scholar] [CrossRef]
  40. Ram Prabhakar, K.; Sai Srikar, V.; Venkatesh Babu, R. Deepfuse: A deep unsupervised approach for exposure fusion with extreme exposure image pairs. In Proceedings of the IEEE International Conference on Computer Vision, Venice, Italy, 22–29 October 2017; pp. 4714–4722. [Google Scholar]
  41. Ma, J.; Yu, W.; Chen, C.; Liang, P.; Guo, X.; Jiang, J. Pan-GAN: An unsupervised pan-sharpening method for remote sensing image fusion. Inf. Fusion 2020, 62, 110–120. [Google Scholar] [CrossRef]
  42. Goodfellow, I.; Pouget-Abadie, J.; Mirza, M.; Xu, B.; Warde-Farley, D.; Ozair, S.; Courville, A.; Bengio, Y. Generative adversarial nets. Adv. Neural Inf. Process. Syst. 2014, 27. Available online: https://proceedings.neurips.cc/paper_files/paper/2014/file/5ca3e9b122f61f8f06494c97b1afccf3-Paper.pdf (accessed on 10 March 2023).
  43. Mirza, M.; Osindero, S. Conditional generative adversarial nets. arXiv 2014, arXiv:1411.1784. [Google Scholar]
  44. Durugkar, I.; Gemp, I.; Mahadevan, S. Generative Multi-Adversarial Networks. arXiv 2016, arXiv:1611.01673. [Google Scholar]
  45. Wang, L.; Sindagi, V.; Patel, V. High-quality facial photo-sketch synthesis using multi-adversarial networks. In Proceedings of the 13th IEEE International Conference on Automatic Face and Gesture Recognition (FG 2018), Xi’an, China, 15–19 May 2018; pp. 83–90. [Google Scholar]
  46. Aghakhani, H.; Machiry, A.; Nilizadeh, S.; Kruegel, C.; Vigna, G. Detecting deceptive reviews using generative adversarial networks. In Proceedings of the 2018 IEEE Security and Privacy Workshops (SPW), San Francisco, CA, USA, 24–24 May 2018; pp. 89–95. [Google Scholar]
  47. Ojala, T.; Pietikäinen, M.; Mäenpää, T. Multiresolution Gray-Scale and Rotation Invariant Texture Classification with Local Binary Patterns. IEEE Trans. Pattern Anal. Mach. Intell. 2002, 24, 971–987. [Google Scholar] [CrossRef]
  48. Zhao, G.; Pietikainen, M. Dynamic Texture Recognition Using Local Binary Patterns with an Application to Facial Expressions. IEEE Trans. Pattern Anal. Mach. Intell. 2007, 29, 915–928. [Google Scholar] [CrossRef] [PubMed]
  49. Maturana, D.; Mery, D.; Soto, Á. Face Recognition with Local Binary Patterns, Spatial Pyramid Histograms and Naive Bayes Nearest Neighbor Classification. In Proceedings of the 2009 International Conference of the Chilean Computer Science Society, Santiago, Chile, 10–12 November 2009; pp. 125–132. [Google Scholar]
  50. Tapia, J.E.; Perez, C.A.; Bowyer, K.W. Gender Classification from Iris Images Using Fusion of Uniform Local Binary Patterns. In Proceedings of the Computer Vision—ECCV 2014 Workshops, Zurich, Switzerland, 6–7 and 12 September 2014; pp. 751–763. [Google Scholar]
  51. Huang, G.; Liu, Z.; Van Der Maaten, L.; Weinberger, K.Q. Densely connected convolutional networks. In Proceedings of the IEEE Conference on Computer Vision and Pattern Recognition, Honolulu, HI, USA, 21–26 July 2017; pp. 4700–4708. [Google Scholar]
  52. Krizhevsky, A.; Sutskever, I.; Hinton, G.E. Imagenet classification with deep convolutional neural networks. Adv. Neural Inf. Process. Syst. 2012, 25, 1097–1105. [Google Scholar] [CrossRef]
  53. Wang, Z.; Bovik, A.C.; Sheikh, H.R.; Simoncelli, E.P. Image quality assessment: From error visibility to structural similarity. IEEE Trans. Image Process. 2004, 13, 600–612. [Google Scholar] [CrossRef]
  54. Li, G.; Lin, Y.; Qu, X. An infrared and visible image fusion method based on multi-scale transformation and norm optimization. Inf. Fusion 2021, 71, 109–129. [Google Scholar] [CrossRef]
  55. Li, G.; Yang, Y.; Zhang, T.; Qu, X.; Cao, D.; Cheng, B.; Li, K. Risk assessment based collision avoidance decision-making for autonomous vehicles in multi-scenarios. Transp. Res. Part Emerg. Technol. 2021, 122, 102820. [Google Scholar] [CrossRef]
  56. Li, G.; Li, S.E.; Cheng, B.; Green, P. Estimation of driving style in naturalistic highway traffic using maneuver transition probabilities. Transp. Res. Part Emerg. Technol. 2017, 74, 113–125. [Google Scholar] [CrossRef]
  57. AMPS Programme. September 1998. Available online: http://info.amps.gov:2080 (accessed on 10 March 2023).
  58. Eskicioglu, A.M.; Fisher, P.S. Image quality measures and their performance. IEEE Trans. Commun. 1995, 43, 2959–2965. [Google Scholar] [CrossRef]
  59. Cui, G.; Feng, H.; Xu, Z.; Li, Q.; Chen, Y. Detail preserved fusion of visible and infrared images using regional saliency extraction and multi-scale image decomposition. Opt. Commun. 2015, 341, 199–209. [Google Scholar] [CrossRef]
  60. Qu, G.; Zhang, D.; Yan, P. Information measure for performance of image fusion. Electron. Lett. 2002, 38, 313–315. [Google Scholar] [CrossRef]
  61. Roberts, J.W.; Van Aardt, J.A.; Ahmed, F.B. Assessment of image fusion procedures using entropy, image quality, and multispectral classification. J. Appl. Remote Sens. 2008, 2, 023522. [Google Scholar]
  62. Wang, Z.; Bovik, A.C. A universal image quality index. IEEE Signal Process. Lett. 2002, 9, 81–84. [Google Scholar] [CrossRef]
  63. Han, Y.; Cai, Y.; Cao, Y.; Xu, X. A new image fusion performance metric based on visual information fidelity. Inf. Fusion 2013, 14, 127–135. [Google Scholar] [CrossRef]
  64. Du, Q.; Xu, H.; Ma, Y.; Huang, J.; Fan, F. Fusing infrared and visible images of different resolutions via total variation model. Sensors 2018, 18, 3827. [Google Scholar] [CrossRef] [PubMed]
  65. Tian, X.; Zhang, M.; Yang, C.; Ma, J. Fusionndvi: A computational fusion approach for high-resolution normalized difference vegetation index. IEEE Trans. Geosci. Remote Sens. 2020, 59, 5258–5271. [Google Scholar] [CrossRef]
Figure 1. An example of image fusion.
Remotesensing 15 02440 g001
Figure 2. Overall fusion framework of our LPGAN.
Remotesensing 15 02440 g002
Figure 3. Network architecture of the generator.
Remotesensing 15 02440 g003
Figure 4. Network architecture of the discriminator.
Remotesensing 15 02440 g004
Figure 5. The calculation process of the LBP distribution of the image. The image is divided into 16 cells, and the LBP distribution is calculated for each cell separately; in total, 16 256-dimensional vectors are obtained. Finally, all of the vectors are concatenated to obtain a 4096-dimensional vector, which is the LBP distribution of the entire image.
Remotesensing 15 02440 g005
Figure 6. Qualitative results on the TNO dataset. From top to bottom: infrared image, visible image, fusion results of FusionGAN, DenseFuse, U2Fusion, DDcGAN, and our LPGAN.
Remotesensing 15 02440 g006
Figure 7. Quantitative comparison with four state-of-the-art methods on the TNO dataset. The values of SD, AG, SF, MI, EN, PSNR, SSIM and VIF for different methods on each test image pairs are shown in (ah), respectively. The means of every metric for different methods are shown in the legends.
Remotesensing 15 02440 g007
Figure 8. Qualitative results on the CVC14 dataset. From top to bottom: infrared image, visible image, fusion results of FusionGAN, DenseFuse, U2Fusion, DDcGAN, and our LPGAN.
Remotesensing 15 02440 g008
Figure 9. Quantitative comparison with four state-of-the-art methods on the CVC14 dataset. The values of SD, AG, SF, MI, EN, PSNR, SSIM and VIF for different methods on each test image pairs are shown in (ah), respectively. The means of each metric for different methods are shown in the legends.
Remotesensing 15 02440 g009
Figure 10. Ablation experiment on TNO dataset. From left to right: source images and fusion results of LPGAN with different settings.
Remotesensing 15 02440 g010
Figure 11. The fusion framework for RGB-infrared image fusion.
Remotesensing 15 02440 g011
Figure 12. Fused results on the 5 image pairs in the RoadScene dataset. From top to bottom, the infrared images, the RGB images and the fused images.
Remotesensing 15 02440 g012
Figure 13. Fused results on the 5 image pairs of different (from left to right, #46, #63, #78, #85, and #104) transaxial sections of the brain-hemispheric.
Remotesensing 15 02440 g013
Figure 14. Fusion results of 6 pairs of multi-spectral remote sensing images. From top to bottom, two kinds of remote sensing images, fusion results of FusionGAN, DenseFuse, U2Fusion, DDcGAN, and our LPGAN.
Remotesensing 15 02440 g014
Table 1. Ablation experiment results on The TNO dataset (Red: optimal, Blue: suboptimal).
AlgorithmsSDAGSFMIENPSNRSSIMVIF
1:2 w/o LBP34.69167.243413.04211.69907.047714.42410.62870.8831
1:2 w/ LBP47.81067.713614.11302.10667.388514.08950.61670.8744
1:3 w/o LBP36.54147.755113.92801.72767.085013.80400.55780.8758
1:3 w/ LBP37.15278.423715.28631.71297.147514.44470.61340.8834
1:4 w/o LBP44.67107.505913.71691.94757.345714.43030.60350.8785
1:4 w/ LBP48.63497.774514.34832.25917.429214.14200.62130.8777
Table 2. Evaluation of fusion results of multi-spectral remote sensing images (Red: optimal, Blue: suboptimal).
AlgorithmsSDAGSFENMIPSNRSSIMCC
FusionGAN30.20325.369711.03686.47122.256215.34580.62510.6553
DenseFuse40.34498.228116.56896.85152.589316.38080.68990.7651
U2Fusion43.342310.760321.30306.96932.339316.55550.66640.7496
DDcGAN52.183110.818121.06037.46022.189014.20050.58870.6688
Ours43.358911.463622.60957.17012.449815.82290.67410.7499
Disclaimer/Publisher’s Note: The statements, opinions and data contained in all publications are solely those of the individual author(s) and contributor(s) and not of MDPI and/or the editor(s). MDPI and/or the editor(s) disclaim responsibility for any injury to people or property resulting from any ideas, methods, instructions or products referred to in the content.

