Article

Analyzing Long-Term High-Rise Building Areas Changes Using Deep Learning and Multisource Satellite Images

1
School of Mapping and Land Information Engineering, Henan Polytechnic University, Jiaozuo 454000, China
2
Aerospace Information Research Institute, Chinese Academy of Sciences, No. 9 Deng Zhuang South Road, Beijing 100094, China
3
University of Chinese Academy of Sciences, No. 19(A) Yuquan Road, Shijingshan District, Beijing 100049, China
*
Author to whom correspondence should be addressed.
Remote Sens. 2023, 15(9), 2427; https://doi.org/10.3390/rs15092427
Submission received: 27 March 2023 / Revised: 23 April 2023 / Accepted: 28 April 2023 / Published: 5 May 2023

Abstract

:
High-rise building areas (HRBs) provide significant social and environmental services and play a crucial role in modern urbanization. The large-scale and long-term spatial distribution of HRBs is of great interest to many fields, such as urban planning and local climate analysis. While previous studies have confirmed the value of Sentinel-2 images in extracting HRBs and their changes, current work is limited to relatively local areas and short-term analysis. One reason is due to the fact that the earliest Sentinel-2 image can only date back to 2015. To address this research gap, this paper proposes an efficient procedure to intelligently extract HRBs and their changes from multitemporal Landsat-7 and Sentinel-2 images, using a specifically designed fully convolutional network. To validate the proposed method, we selected four typical cities in China, namely, Beijing, Shanghai, Guangzhou, and Zhengzhou, as study areas. We utilized Landsat-7 images acquired in 2000 and 2010, along with Sentinel-2 images acquired in 2020, as experimental data. We extracted and analyzed three periods of HRBs and their changes in the four cities, along with urban rail terminal data and gross domestic product (GDP) data in the same period. The results show that the proposed method can efficiently extract HRBs and their changes in the four cities over the past 20 years, with an overall accuracy of more than 90%. HRBs changes are primarily driven by urban planning policies and geographical factors. There is a strong positive correlation between the increase in HRBs and the increase in rail terminals, both in terms of quantity and spatial distribution. Additionally, there is a positive correlation between HRBs increase and GDP increase in terms of quantity, but the trend varies in different cities due to their diverse developing modes. Overall, the results indicate that the proposed method can be a potential operational tool to extract large-scale and long-term HRBs and their changes in China.

1. Introduction

In the first 20 years of the 21st century, China experienced a rapid urbanization process, and the nationwide urbanization rate increased from 36.2% to 63.9%. One symbol of urbanization is the widespread emergence of high-rise commercial centers, high-end hotels, modern residential areas, etc. These typical artificial facilities all belong to HRBs, which have been formally defined as spatially connected building zones with a single building height close to each other and an average height greater than 25 m [1]. HRBs provide important social and environmental services in modern urbanization [2,3,4]. By extending the use of three-dimensional space, HRBs improve the utilization of urban land resources, and help to optimize the urban landscape [5]; HRBs can also change the roughness and energy balance of the ground surface and then affect the local climate of cities, which is closely related to the urban heat island effect [6,7]. HRBs often lead to high concentrations of people, meaning that people are more vulnerable to disasters such as earthquakes and infectious diseases [8,9]. Therefore, the large-scale and long-term spatial distribution of HRBs is of great interest to many fields such as urban planning, ecological environment assessment, and disaster protection.
HRBs are less studied than other typical urban land covers such as impervious surfaces, vegetation, and water bodies [10,11], mainly due to the complexity of the morphological structure and spectral characteristics of HRBs. On the one hand, the functional similarity of HRBs does not mean that their geometrical and physical structures are consistent, and the appearance of HRBs in different regions is influenced by function, landscape, resources, and even culture [12,13]. On the other hand, the complex three-dimensional structure of HRBs makes their image features vary with the light conditions and imaging geometry. Technically, three kinds of methods can be exploited to extract HRBs on a large scale. These are the satellite LiDAR-based method [14], the satellite photogrammetry-based method [15], and the single satellite image-based method [1]. Among them, the satellite LiDAR-based method extracts HRBs by directly measuring accurate surface height, but it has disadvantages such as a sparse distribution of point cloud data and relatively complicated data processing, and furthermore, the extraction accuracy is affected by the shape of buildings [14]. The satellite photogrammetry-based method also extracts HRBs by directly measuring accurate surface height but in a different way, and it has the disadvantages of complicated data processing and relatively small spatial coverage [15,16]. The single satellite image-based method extracts HRBs by use of their unique spatial structures in the image, and it is a lightweight data approach compared to the other two. The essence of the last approach is to accurately model the complex morphological and spectral features of HRBs in the image.
Existing studies have carried out HRBs extraction on a regional scale from single 10 m spatial resolution Sentinel-2 images based on a fully convolutional network (FCN) [1,17]. Sentinel-2 images, with their advantages of 10 m resolution, vertical observation mode, global coverage, short imaging period and free access, provide ideal data for the large-scale extraction of HRBs. The 10 m resolution can well characterize HRBs on the spatial scale while suppressing unnecessary spatial details, while the vertical observation mode can reduce the complexity of the images [17]. On the other hand, the recently developed deep learning method can integrate feature learning and classification in an end-to-end approach using weight sharing and hierarchical representation. The deep learning method provides a powerful tool to characterize complex features in remote sensing images [18,19]. In particular, FCN uses a deconvolutional module to replace the fully connected module in a traditional convolutional neural network (CNN) and achieves an efficient image-to-mask learning mechanism [20,21].
However, Sentinel-2 was launched by the European Space Station (ESA) in 2015 [22], and its data are limited to a short period. In contrast, Landsat-7 data can be traced back to the beginning of this century and contain 15 m panchromatic data, offering the possibility of a longer period for HRBs, especially since the first 2 decades into the 21st century were the most significant period of urbanization in China. However, due to their three-dimensional structures, the image characteristics of HRBs change nonlinearly with spatial resolution; thus, the FCN model constructed based on Sentinel-2 images may not be directly applicable to Landsat-7 images. Additionally, a previous study on the extraction and analysis of HRBs changes was limited to the Xiong’an new district, which is a relatively local region [17].
Based on the above analysis, the current work is limited to relatively local areas and short-term analysis. To address this research gap, this paper proposes an efficient procedure to intelligently extract HRBs and their changes from multitemporal Landsat-7 and Sentinel-2 images, using a specifically designed fully convolutional network. Four typical cities in China, Beijing, Shanghai, Guangzhou, and Zhengzhou, were selected as the study areas. Landsat-7 images acquired in 2000 and 2010 and Sentinel-2 images acquired in 2020 were used as the experimental data. Three periods of HRBs and their changes between 2000 and 2020 were extracted and validated, and HRBs changes were also analyzed using the rail terminal data and GDP data in the four cities.
The contributions of this article are summarized as follows.
  • We prove the effectiveness of Landsat-7 images in the extraction of HRBs using the FCN-based method. Additionally, we validate that our procedure can efficiently extract HRBs and their changes in the last 20 years in 4 typical cities using Landsat-7 and Sentinel-2 images. The results indicate that our procedure has the potential to be an operational tool to extract long-term and large-scale HRBs and their changes in China.
  • We find that HRBs changes are primarily driven by urban planning policies and geographical factors. There is a strong positive correlation between the increase in HRBs and the increase in rail terminals, both in terms of quantity and spatial distribution. Additionally, there is a positive correlation between HRBs increase and GDP increase in terms of quantity, but the trend varies in different cities due to their diverse developing mode. These findings may pave the way for the wide use of HRBs in related studies.
This article is organized as follows. In Section 2, we detail the study data and methodology. In Section 3, we provide the results of HRBs and their changes. Section 4 discusses the HRBs changes from three perspectives. The Section 5 concludes our study and gives directions for future research.

2. Materials and Methods

2.1. Study Areas and Data

This study focuses on extracting and analyzing HRBs in four cities: Beijing, Shanghai, Guangzhou, and Zhengzhou. These cities have undergone rapid urbanization in the past 20 years. Additionally, they have diverse geographical locations and well represent the major urban cities in China. Only the core urban districts of each city were included in the experiment, covering a total area of approximately 33,299.37 km2, as illustrated in Figure 1.
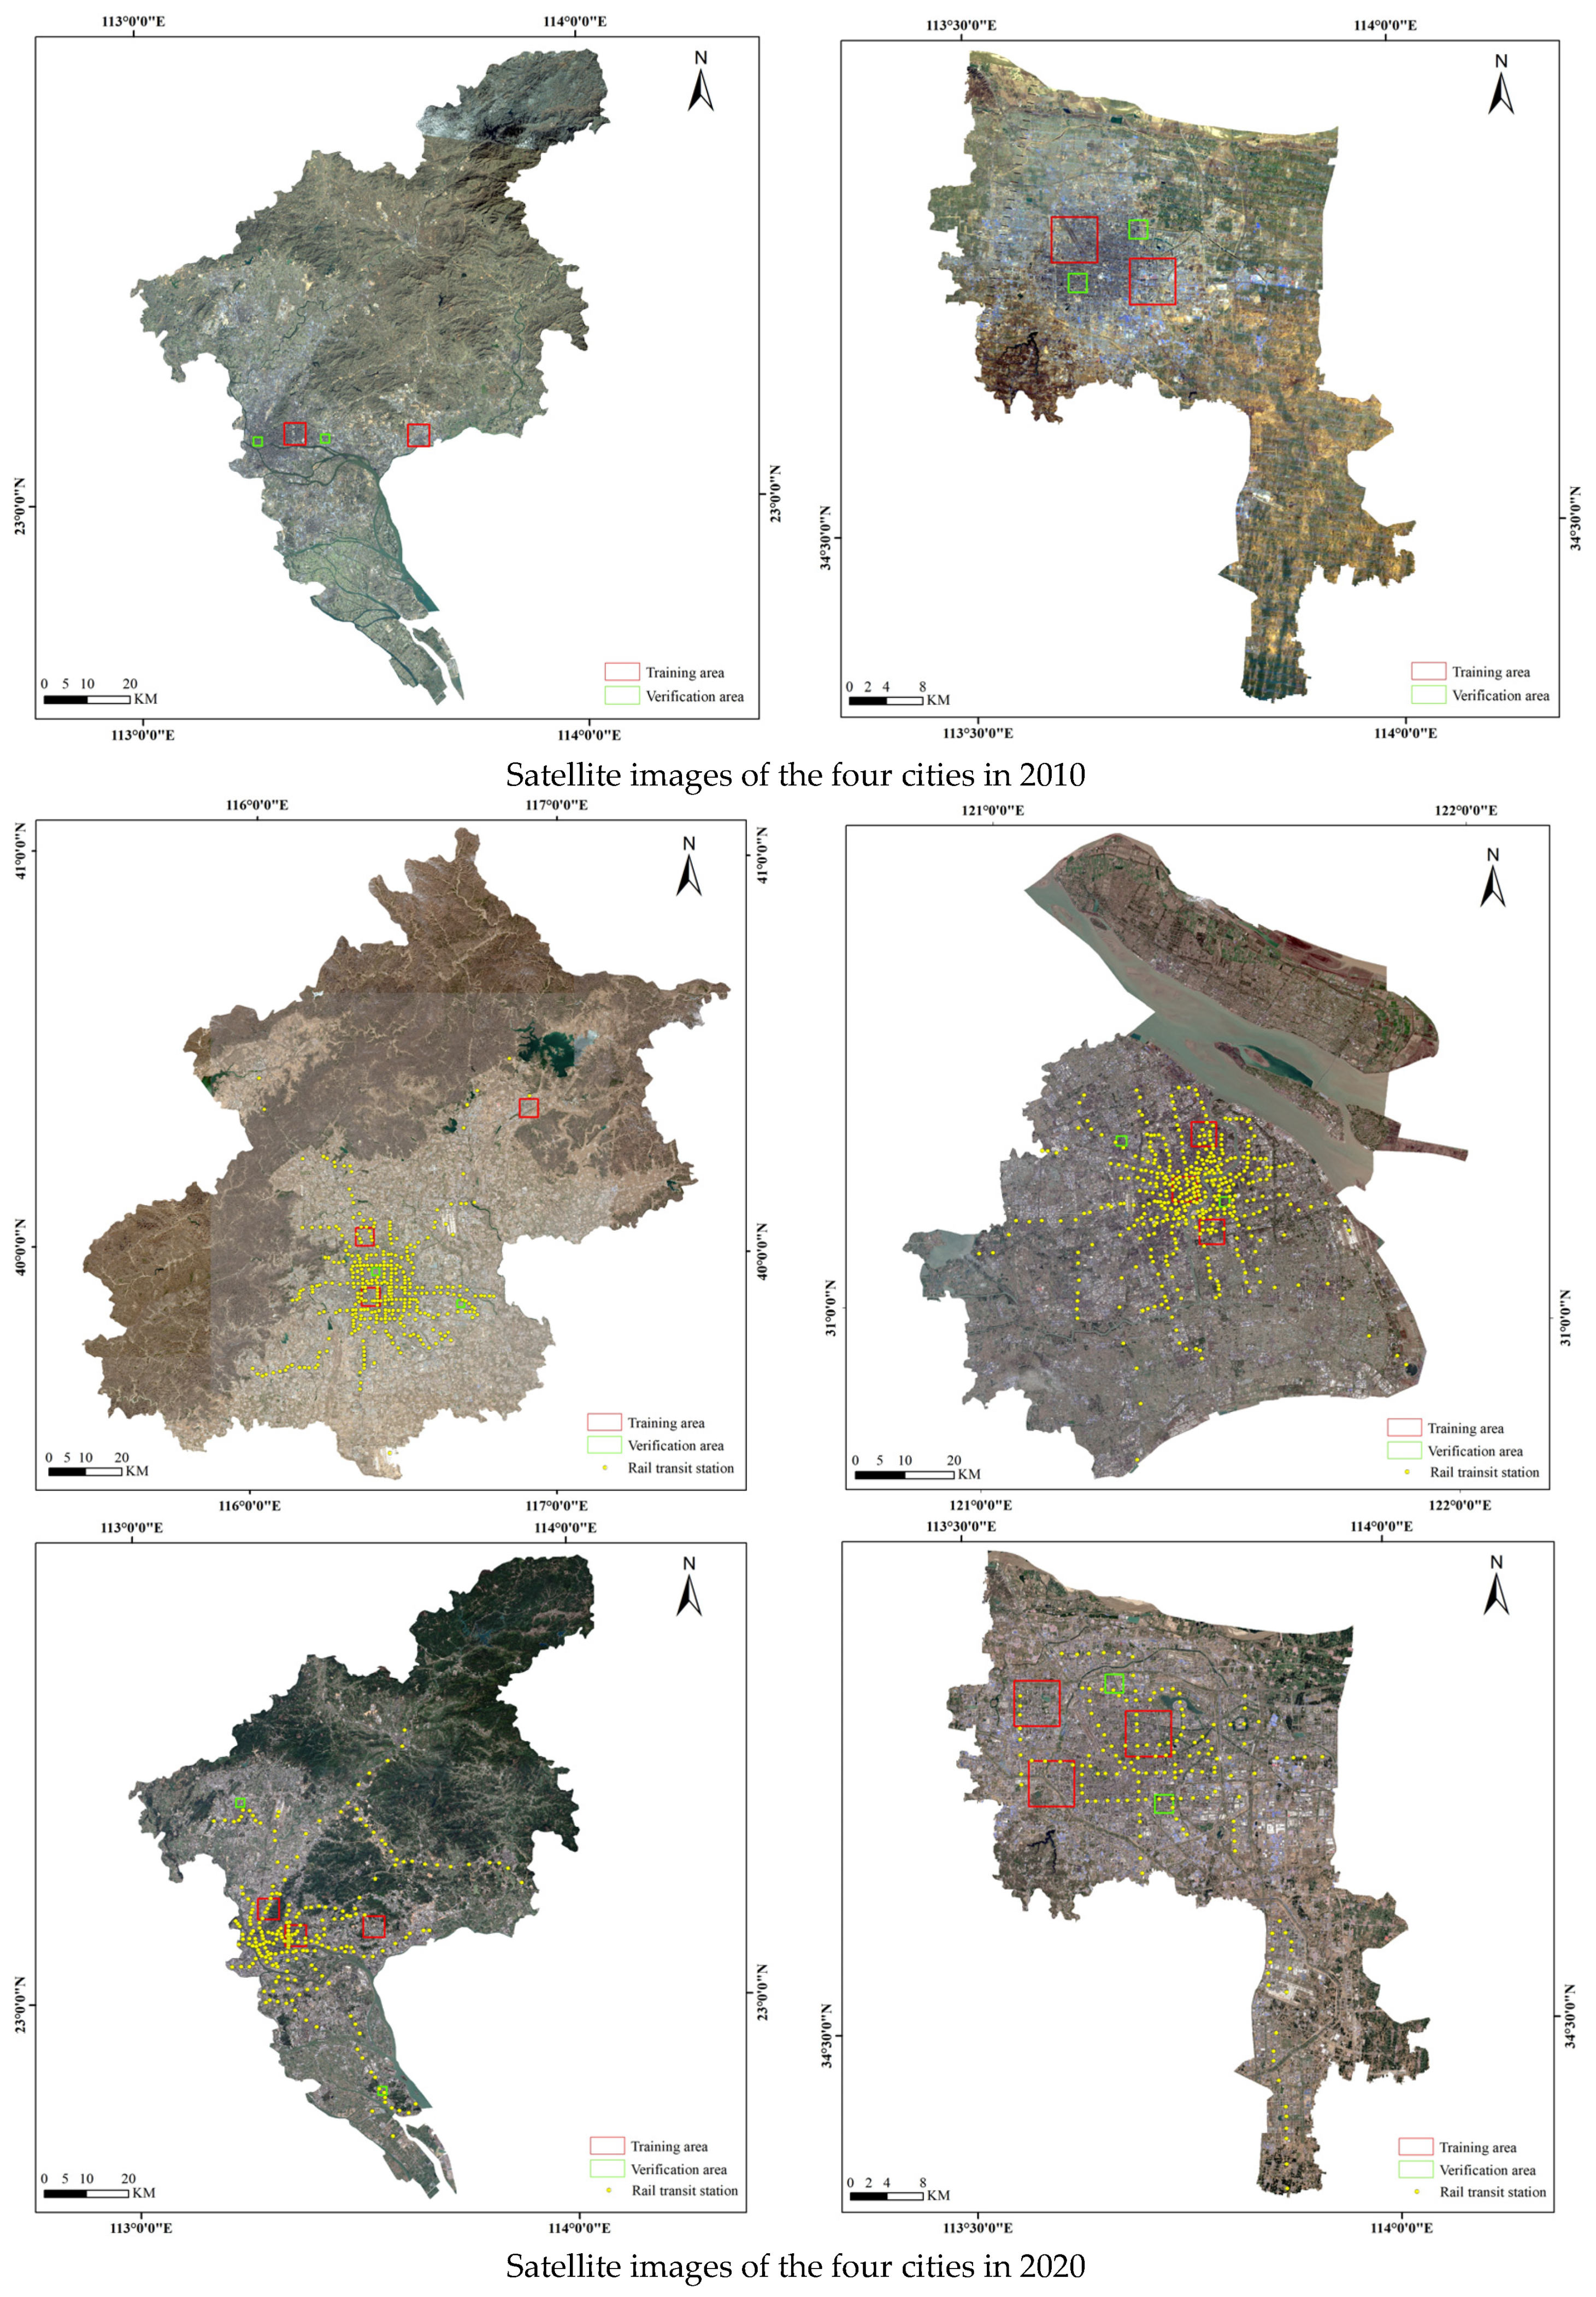
To obtain the HRBs, the study utilized Sentinel-2 images from the official website of ESA for the year 2020, and Landsat-7 images from the official website of USGS for 2000 and 2010. Table 1 highlights the sources and acquisition date of these data sets. The study opted for the late winter and early spring months to account for cloud-free data availability and significant image discrimination of HRBs during this period. Only the true-color channel was chosen for further processing, based on a previous study that demonstrated its effectiveness in identifying HRBs [17]. The 10 m RGB channels of L2A Sentinel-2 data were used in this experiment. The Landsat-7 images were firstly radiometrically corrected using empirical parameters, and then the 30 m RGB channels were fused with the 15 m panchromatic channel using the high-pass filter fusion algorithm to produce true-color images with a spatial resolution of 15 m. It should be noted that the data-driven FCN approach used in this study was resilient to errors in the radiometric correction of input images [1]. Image data from each year in the study areas can be found in the Appendix A, as shown in Figure A1. To perform a more in-depth analysis of the HRBs changes with social-economic factors, information on rail terminals was obtained for the years 2000 and 2020, as well as the GDP for the years 2000, 2010, and 2020 for each of the four cities. These data were sourced from open databases. Table 2 shows the GDP of the four cities in 2000, 2010, and 2020.
To train the FCN-based method, various sample areas of 5 × 5 km2 were independently selected from the 2020 and 2010 images of each of the four cities, as indicated in the Appendix A. Meanwhile, to validate the extracted HRBs changes between 2000, 2010, and 2020, various sample areas of 2 × 2 km2 were independently selected from the 2020 and 2010 images of each of the four cities. The location and number of the sample areas in each city vary according to the spatial distribution of HRBs in the corresponding years, and all of them are indicated in the Appendix A. The ground truth in the binary mask images in each sample area was obtained via manual interpretation with the help of high-resolution satellite images and street-view photos. The sample area images and their binary masks were cropped to patches of 128 × 128 pixels, as shown in Figure 2. It should be noted that there were only a few HRBs in the four cities in 2000, and they were not enough to build effective training and validation samples. Thus, all HRBs in 2000 were manually extracted using expert knowledge, and no sample data were collected.

2.2. Methods

2.2.1. General Workflow

The general workflow of our method was divided into three phases, including data curbing, HRBs extraction, and HRBs analysis, as shown in Figure 3.
In the first phase, the multitemporal Landsat-7 and Sentinel-2 images were cropped according to the administrative boundaries of the study areas, and training and validation samples were manually prepared independently with the help of street-view images and high-spatial-resolution satellite data.
In the second phase, the FCN model was trained on the training samples to generate the FCN-based model for HRBs extraction for each year. Following the completion of the model training, the study area images for each year were processed to obtain HRBs accordingly. The HRBs extraction results were then subjected to manual interpretation to make minor refinements. The extracted HRBs were subsequently validated and vectorized into blocks. Notably, due to the limited availability of training and validation samples for each study area, the HRBs in 2000 were directly manually interpreted. Using the HRBs data in block format for the three periods, the HRBs changes from 2000 to 2010 were computed by subtracting the intersection of HRBs in 2000 and 2010 from that of HRBs in 2010. A few manual edits were required to correct small false alarms and missing results and refine boundaries. Similarly, the HRBs changes from 2010 to 2020 were computed, taking into account the service life of HRBs whereby changes denoted an increase. The accuracy of the extracted HRBs changes was verified for analysis.
In the third phase, the HRBs changes were firstly analyzed using their quantity and spatial distribution in the four cities and two typical time ranges, and then they were analyzed to assess their correlation with rail terminal changes from 2000 to 2020 and GDP changes from 2000 to 2010 and from 2010 to 2020 in the four cities.

2.2.2. Fully Convolutional Network for HRBs Extraction

The FCN model employed in our experiment for HRBs extraction is presented in Figure 4. The FCN model comprises two main parts: encoding and decoding. The encoding stage is responsible for extracting hierarchical features, whereas the decoding stage focuses on extracting category information while maintaining full spatial resolution.
The FCN model utilizes VGG-16 architecture by removing the fully connected layer for its encoding stage [23]. The input image size was set to 128 × 128 × 3. After applying 2 convolutions and the Relu activation function, maximum pooling was utilized to produce pool1, resulting in an image size of 64 × 64 × 64. The process was repeated on pool1, utilizing 2 convolution operations and the Relu activation function, followed by maximum pooling, resulting in the production of pool2 with an image size of 32 × 32 × 128. To produce pool3, 3 convolutions and the Relu activation function were performed on pool2, which was then passed through maximum pooling, resulting in an image size of 16 × 16 × 256. Similarly, three convolutions were performed on pool3 along with the Relu activation function to produce pool4, which was also passed through maximum pooling. Finally, pooling was performed on pool4 to yield pool5. At this point, the image size was reduced to 4 × 4 × 512, marking the successful completion of the encoding stage.
During the decoding stage, the output image of pool5 underwent a convolution operation with a kernel size of 1 × 1 to adjust the channel size and obtain an image with a size of 4 × 4 × 2. Subsequently, 2-fold upsampling was performed on the image to obtain upsample1 with an image size of 8 × 8 × 2. Next, a convolution operation with a kernel size of 1 × 1 was carried out on pool4 to adjust the channel size, generating an image size of 8 × 8 × 2, which was then added to upsample1. The result was upsampled by 2 times to obtain upsample2, with an image size of 16 × 16 × 2. A similar process was implemented on pool3, where a convolution operation with a kernel size of 1 × 1 was performed to adjust the channel size of the image to 16 × 16 × 2, which was then added to upsample2. Finally, 8-fold upsampling was performed on the result to obtain upsample3 with an image size of 128 × 128 × 2, which was passed through the softmax&argmax classification function to obtain the final result. The introduction of the layer-skip addition enhanced the recognition accuracy of the image detail information.

2.2.3. Accuracy Assessment Method

Considering the spatial characteristics of HRBs, the block of HRBs in the vector form was used as the basic element in the accuracy assessment. The accuracy was measured using intersection over union (IoU), where IoU is the ratio of the area of the intersection of the true block and the extracted block, and an IoU greater than 60% was set as correct here. Based on the above settings, the mean accuracy of all of the blocks in 2 × 2 km2 validation areas was calculated in each study area. The validation of the extracted HRBs and their changes followed the same accuracy assessment procedure and validation areas.

3. Results

3.1. The Results of HRBs Extraction in Each Period

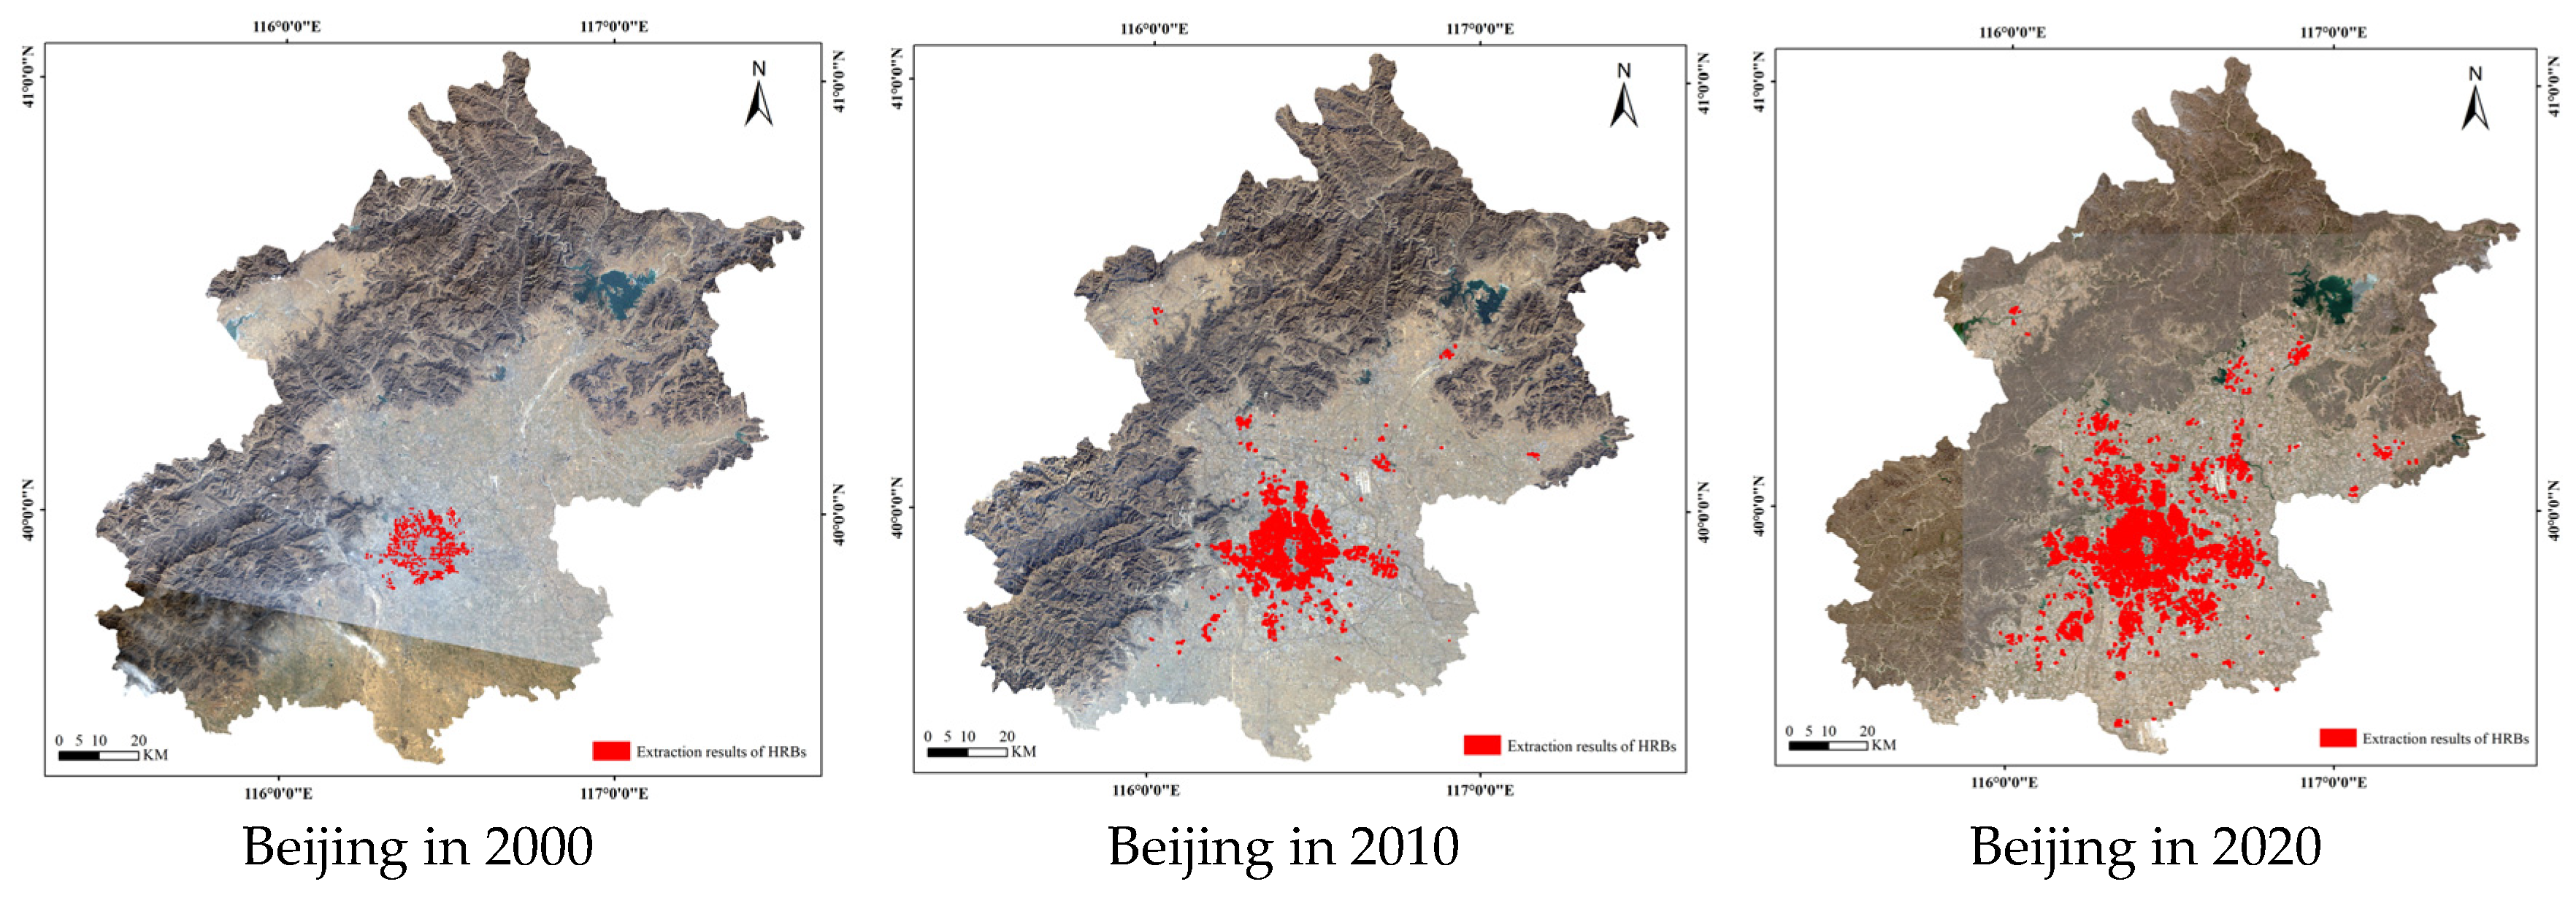
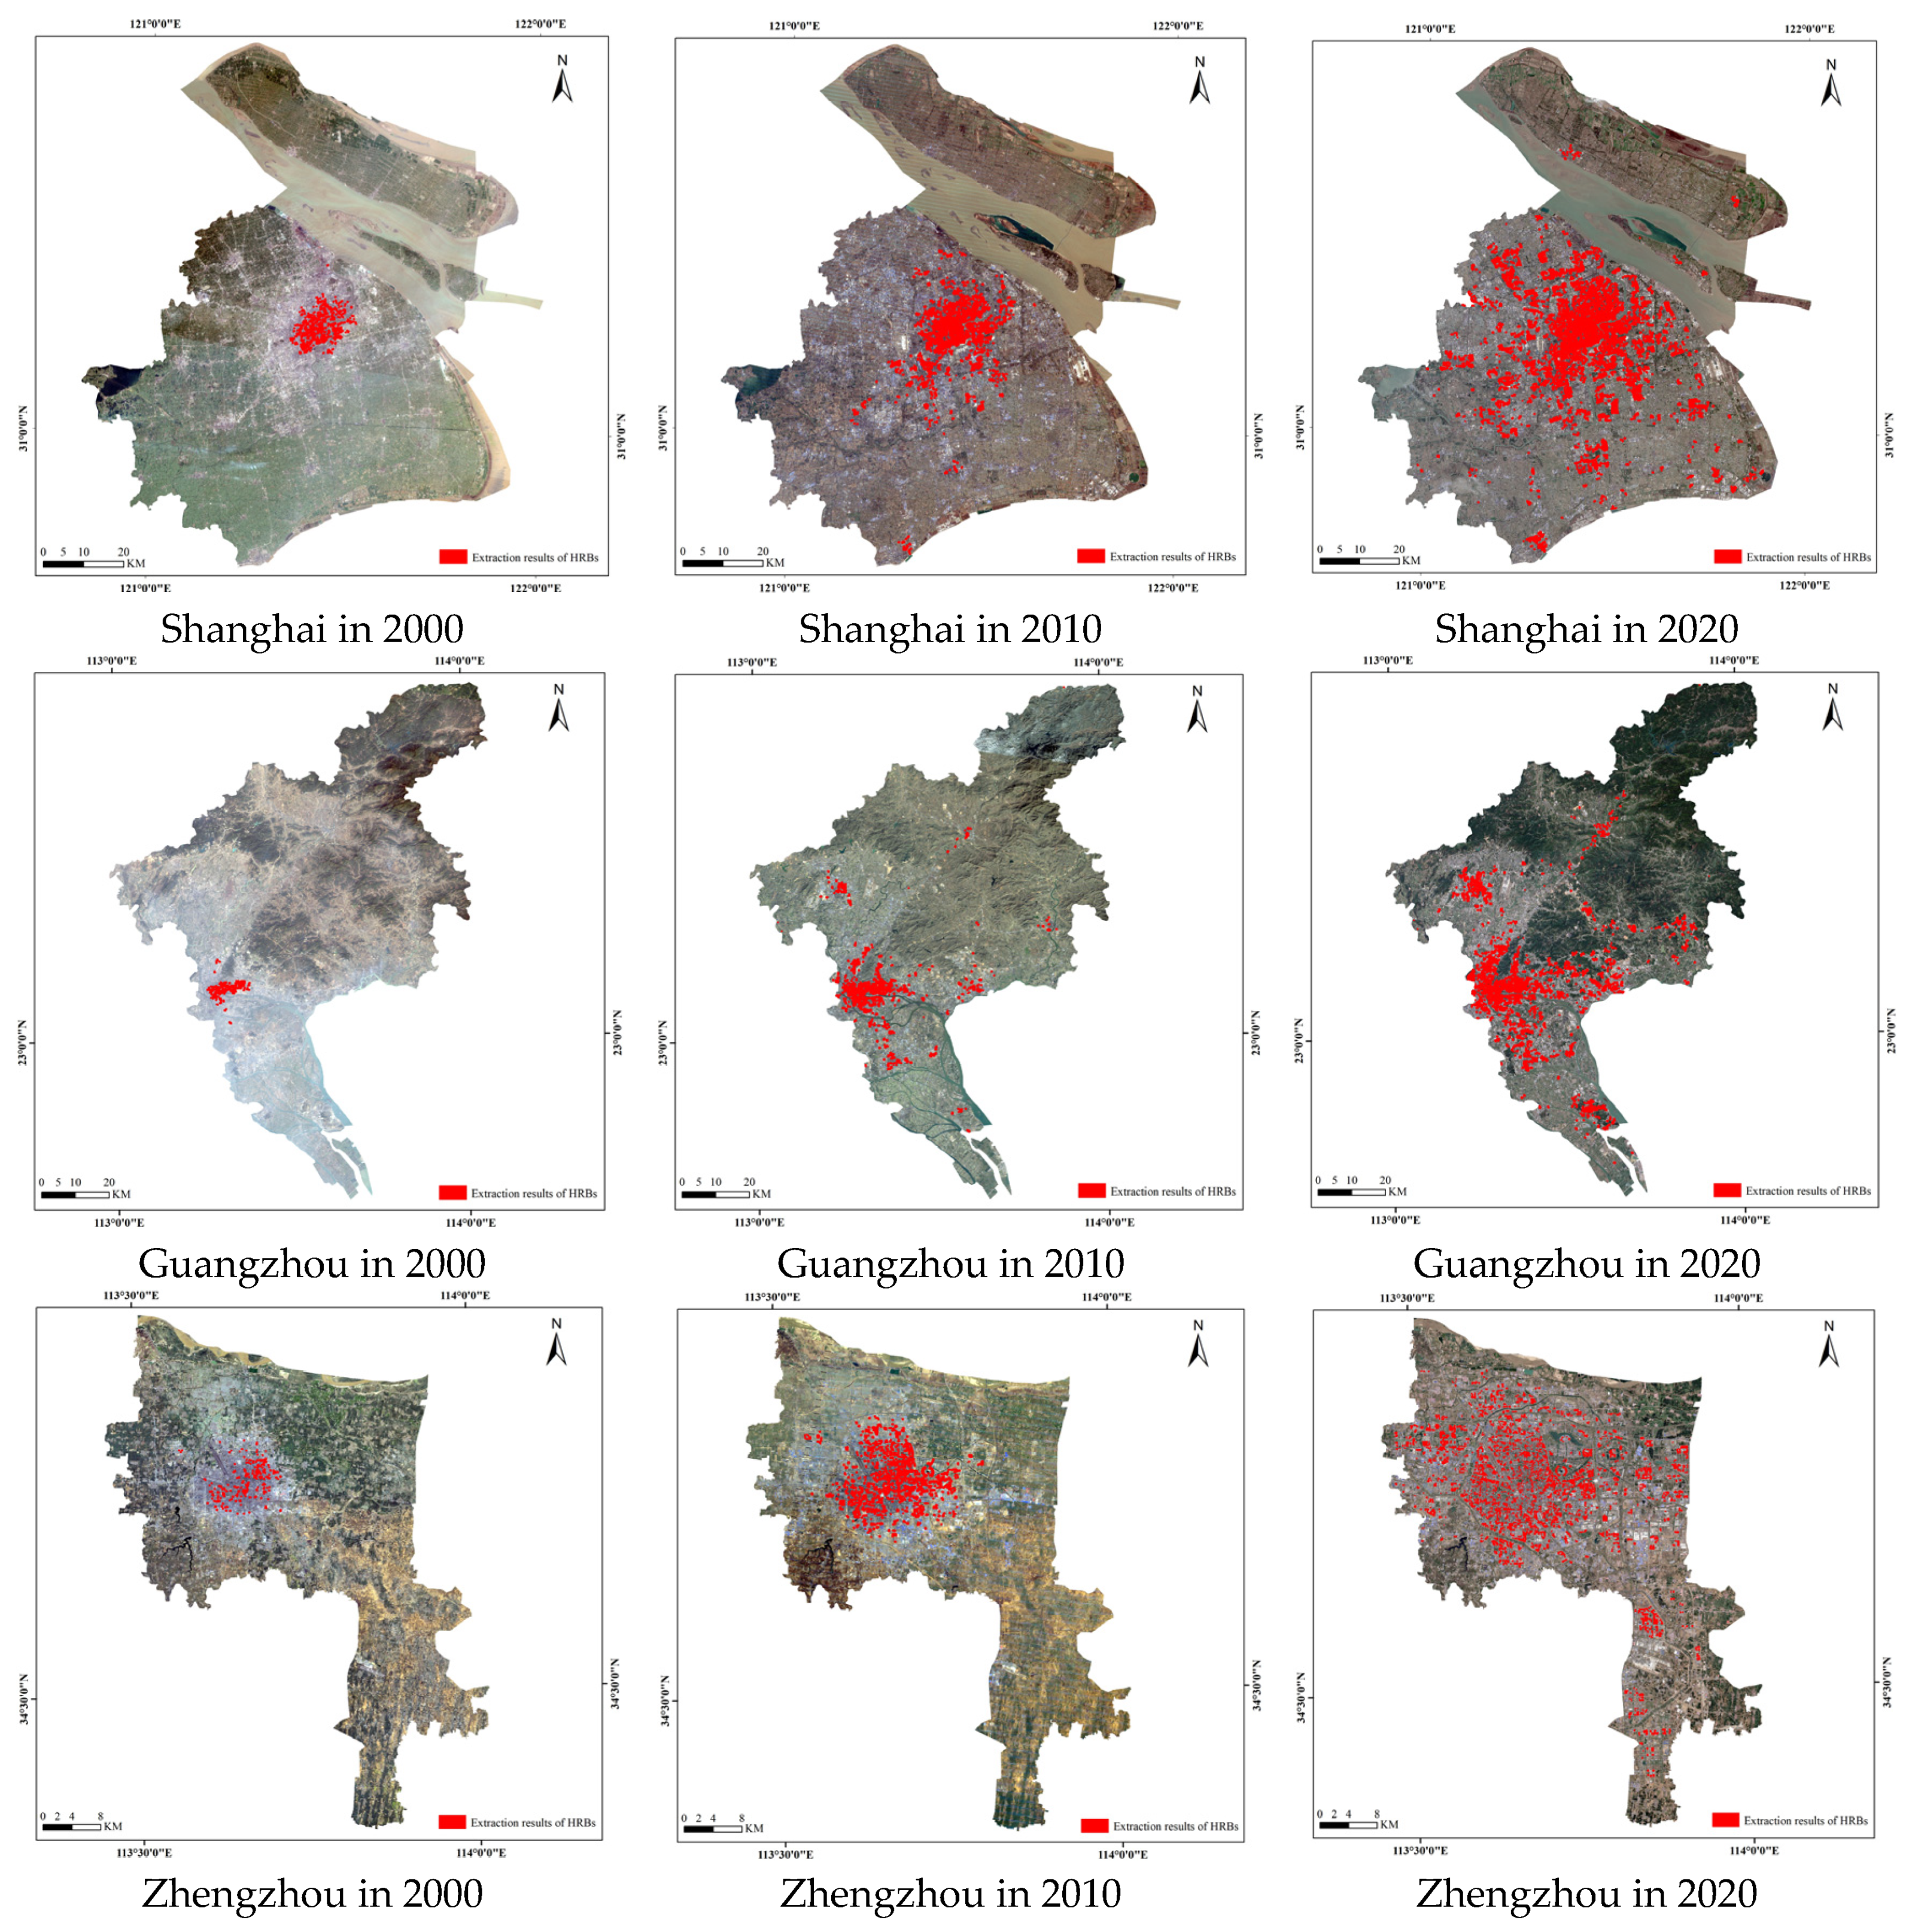
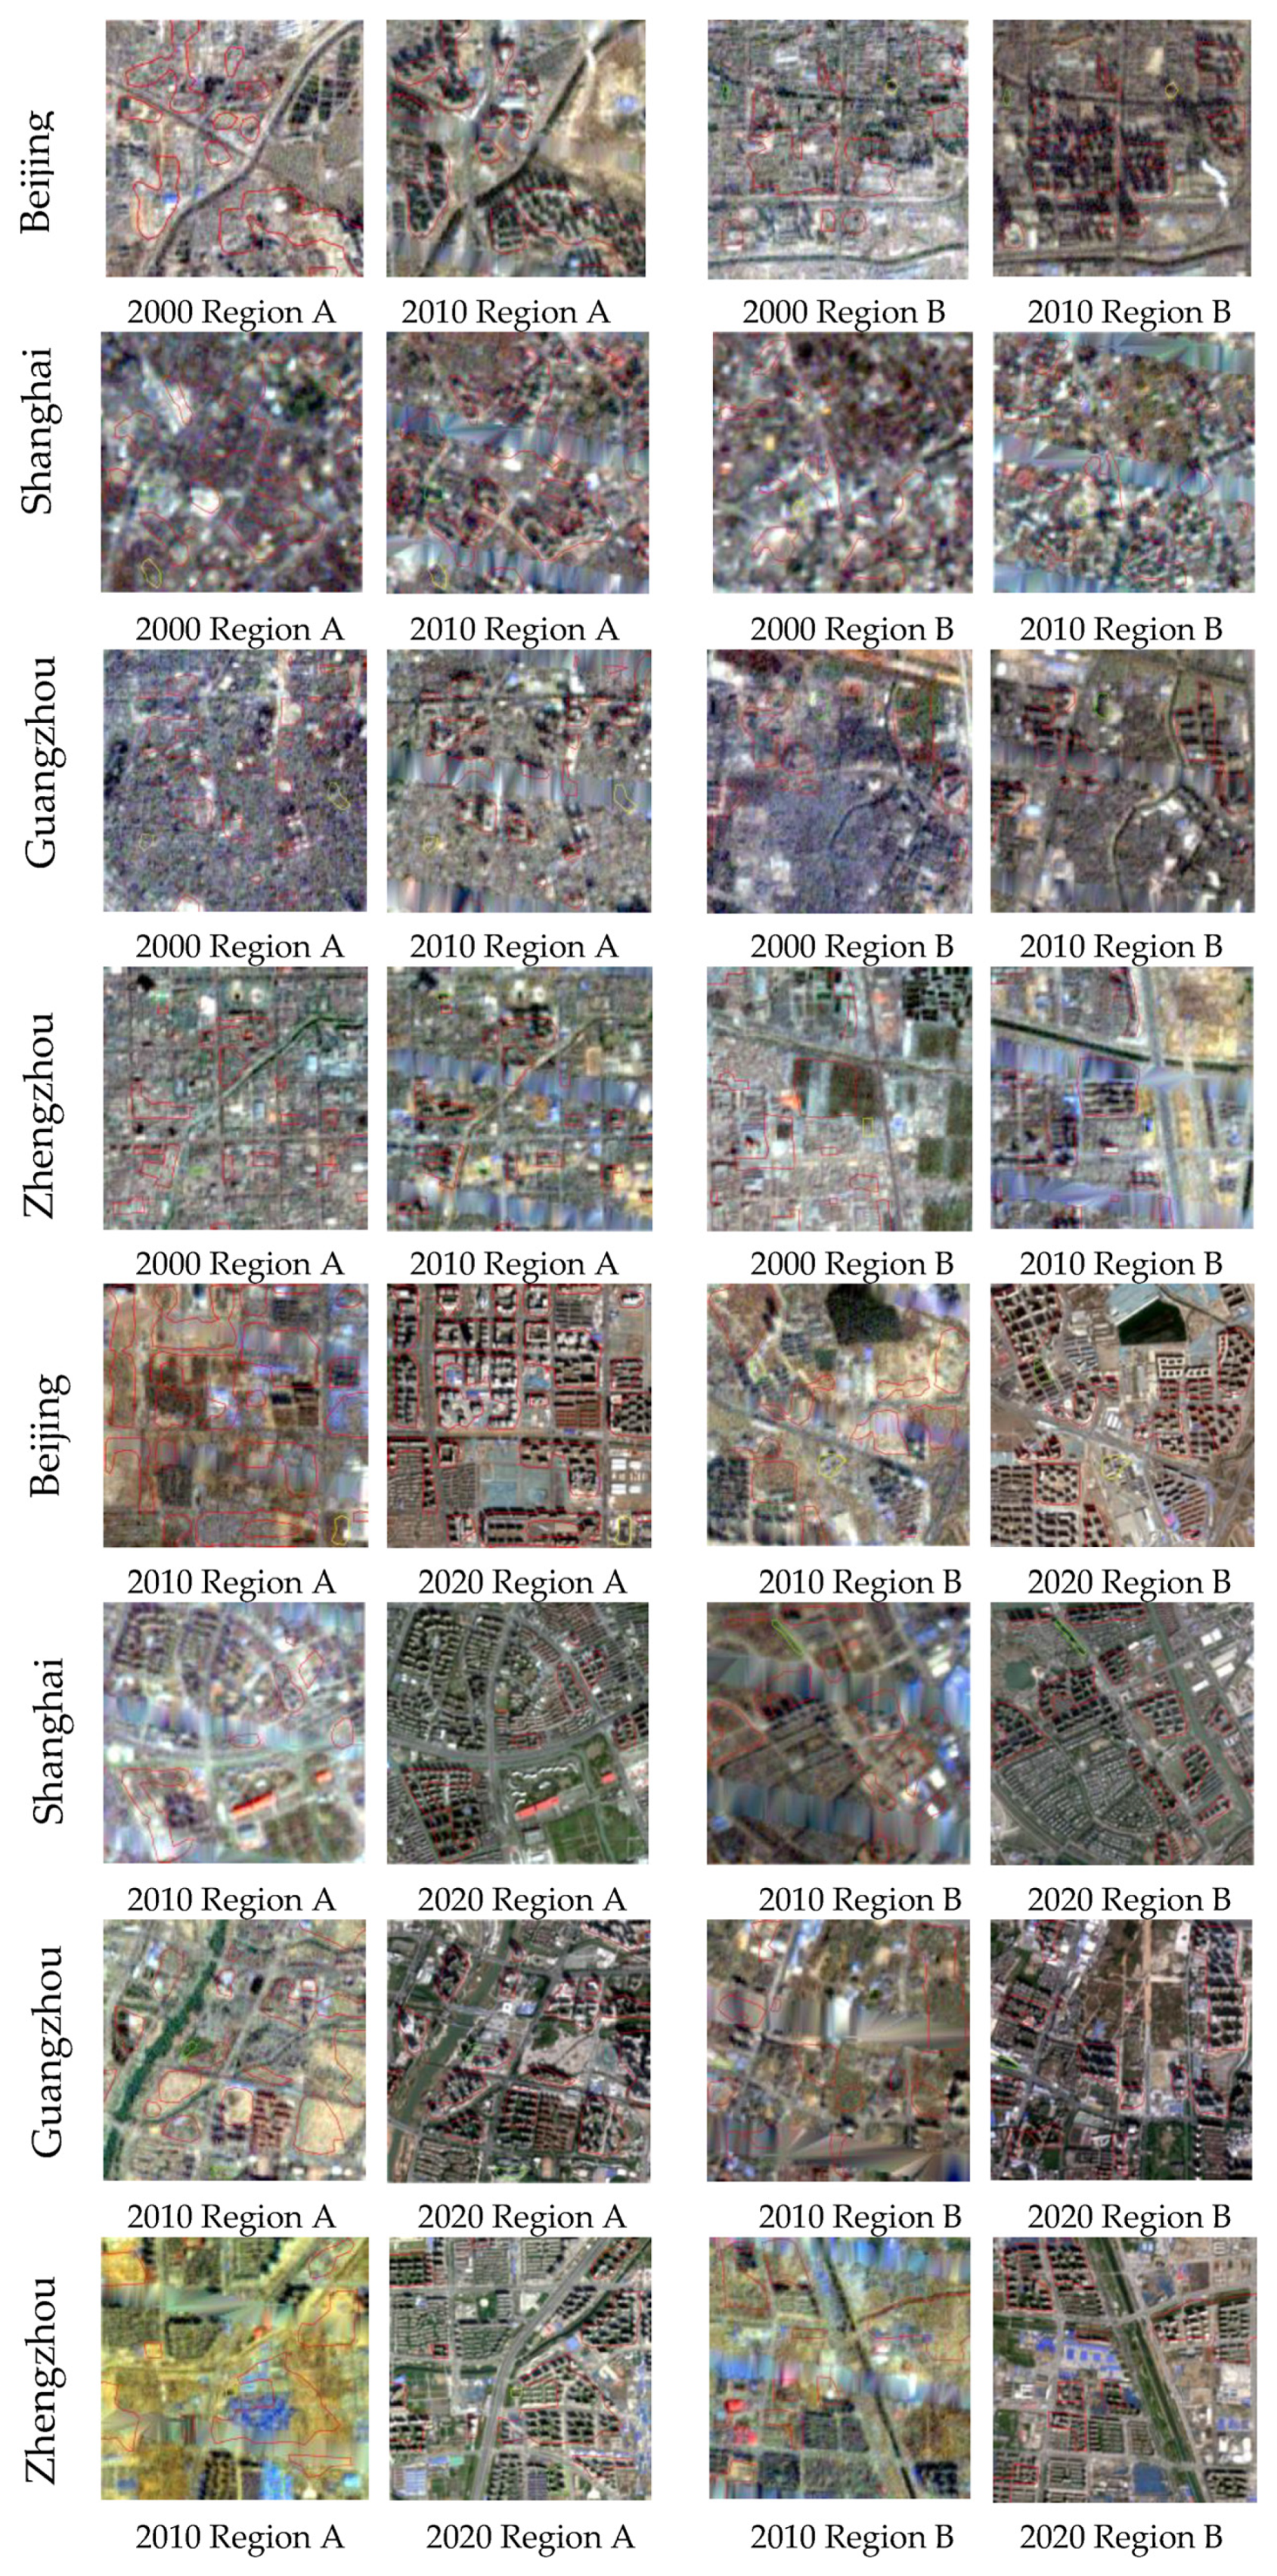
Figure 5 illustrates the HRBs extraction results in each period in each city. Table 3 is the accuracy verification table of the extracted HRBs in each study area in 2010 and 2020. It can be seen from Table 3 that the average extraction accuracy of the 4 study areas in 2010 reached 91.88%, and the average false alarm rate was 4.19%. In 2020, the average accuracy of the extracted HRBs in each study area reached 92.89%, and the average false alarm rate was 3.02%. Here, manually extracted HRBs from 2000 are regarded as correct without validation.

3.2. The Results of HRBs Change Extraction

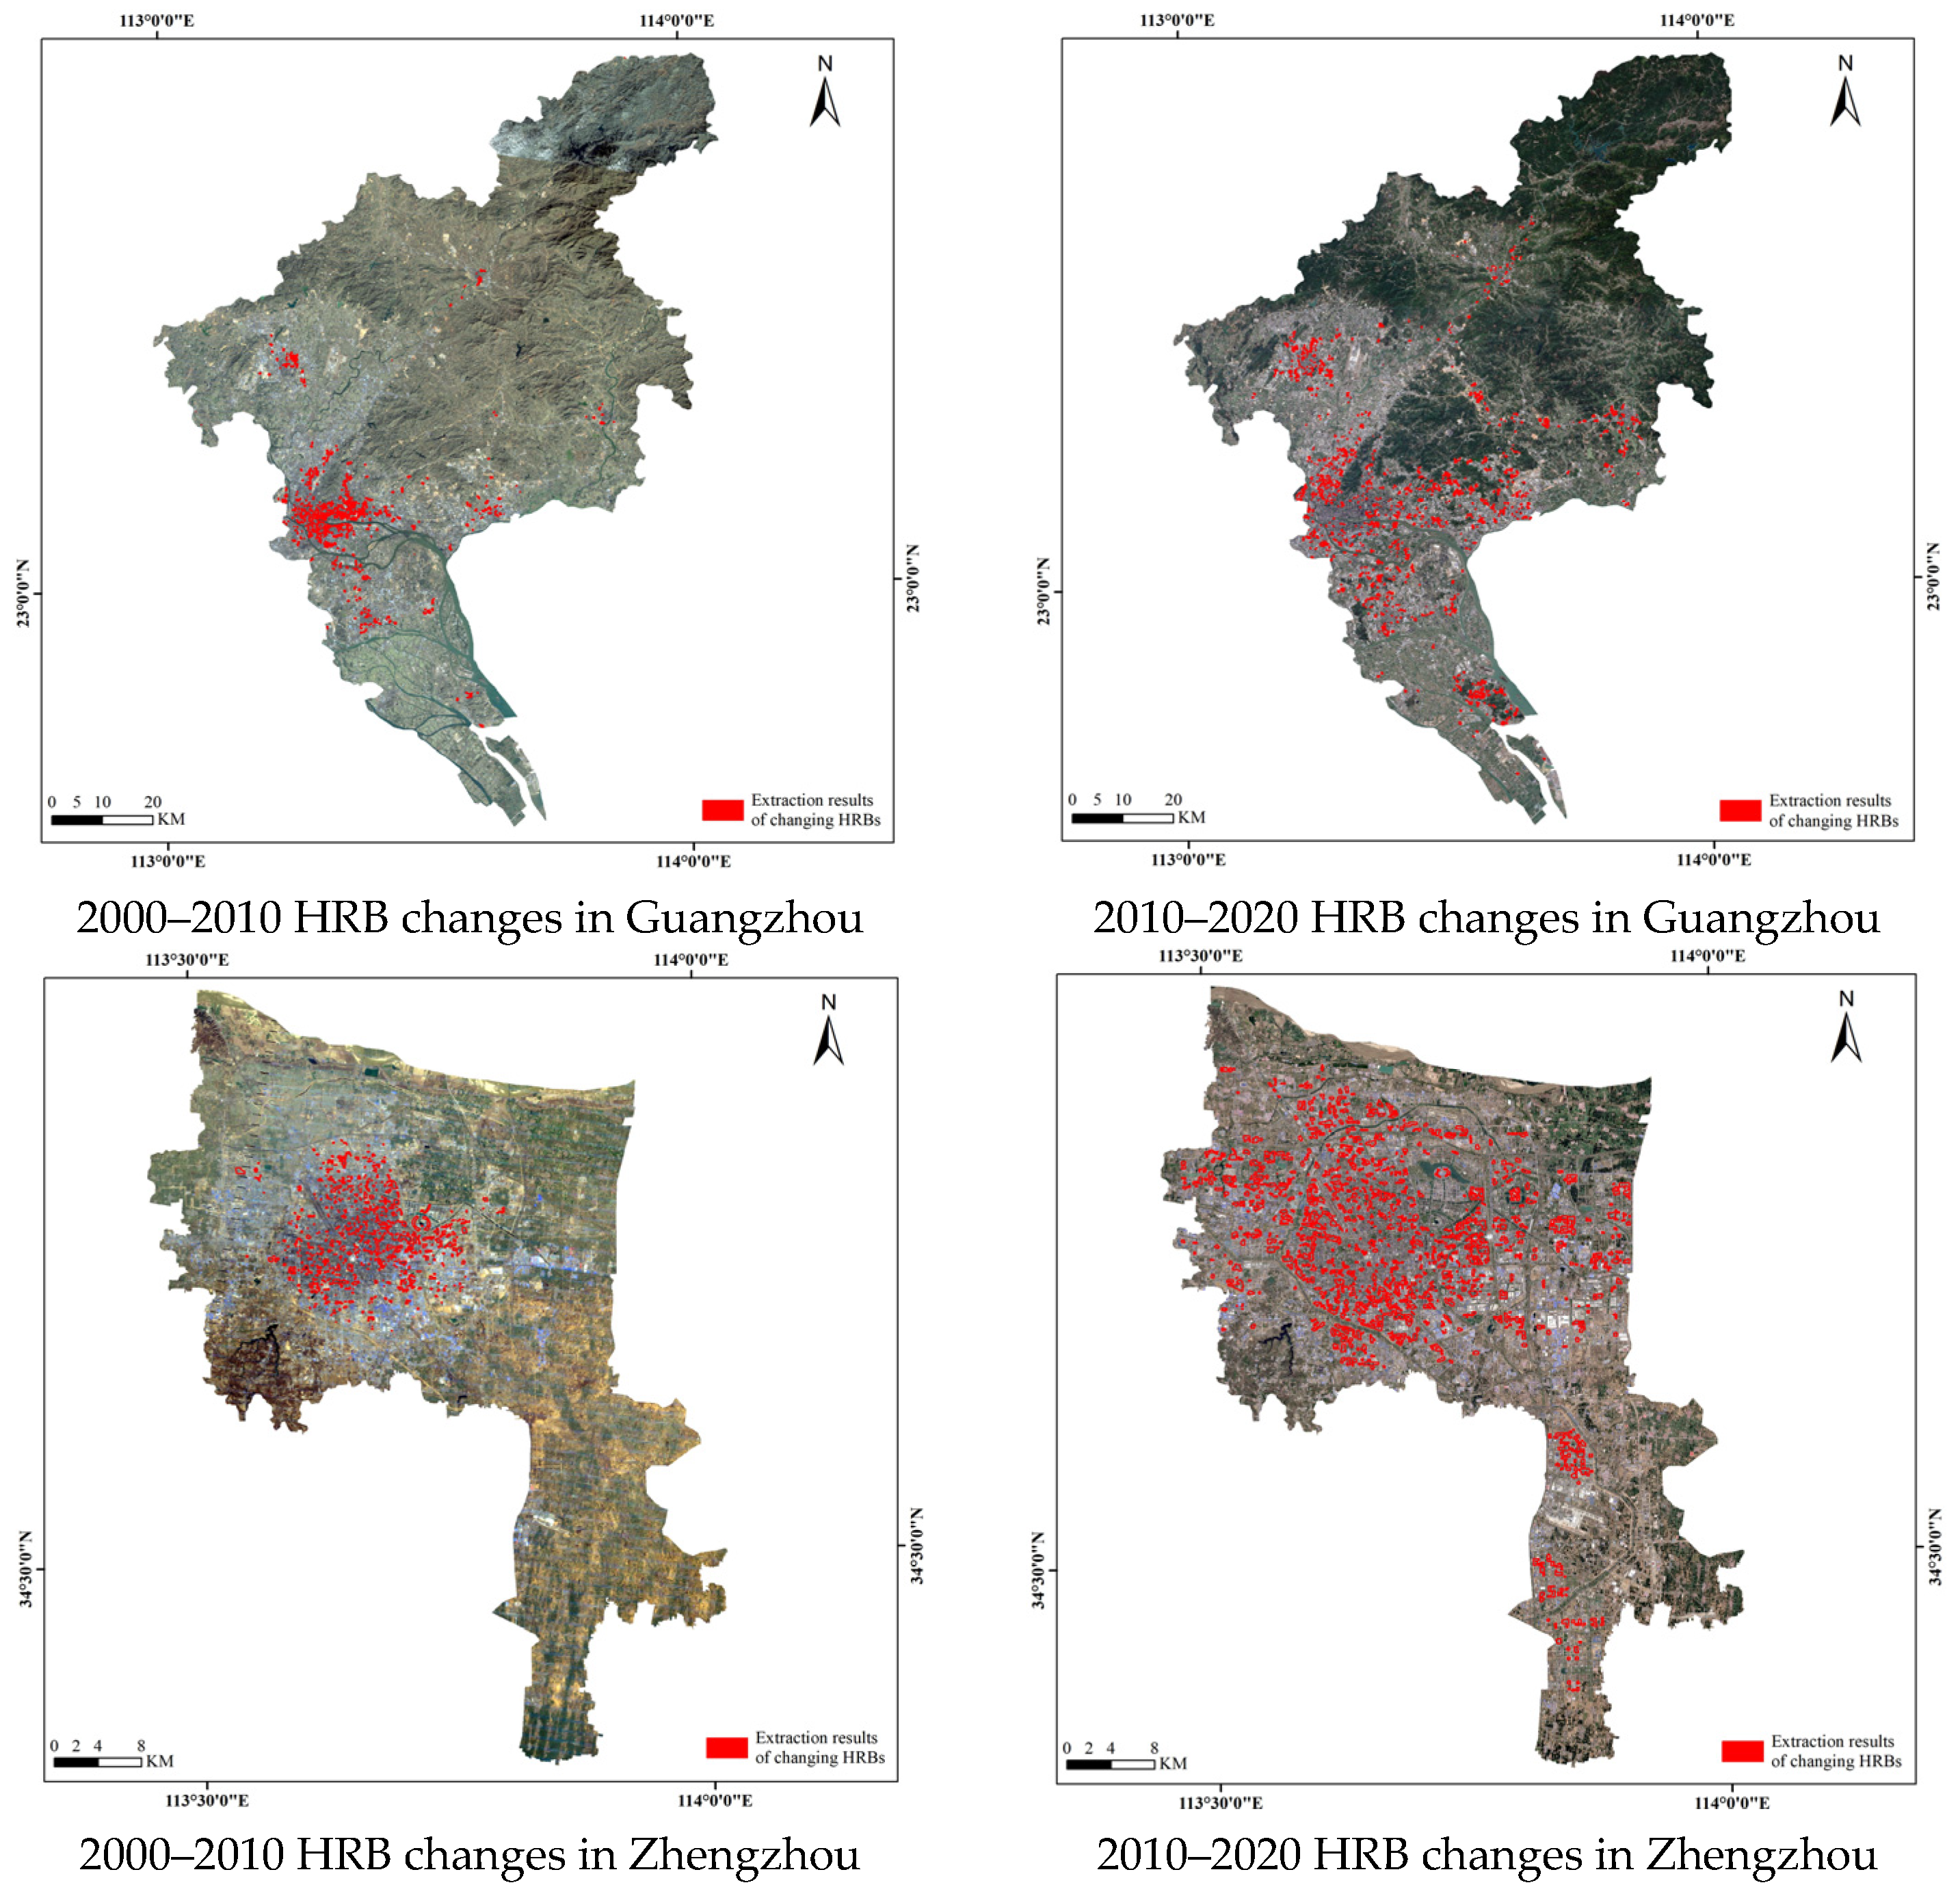
Figure 6 shows the extracted HRBs changes in two typical time ranges. Table 4 shows the accuracy of the extracted HRBs changes in two typical time ranges. From 2000 to 2010, the accuracy ranged from 90% to 91.18% in the 4 cities and the average accuracy was 90.60%, and the false alarm rate ranged from 3.57% to 6.67% in the 4 cities and the average false alarm rate was 5.27%. From 2010 to 2020, the accuracy ranged from 89.47% to 95.24% in the 4 cities and the average accuracy was 91.17%, and the false alarm rate ranged from 0 to 7.14% in the 4 cities and the average false alarm rate was 3.18%. Figure 7 shows a validation map of the extracted HRBs changes in the four cities in two typical time ranges. Additionally, in Figure 7, the red polygons refer to the extracted results, the yellow rectangles refer to the omitted areas, and the green rectangles refer to false alarms.

4. Discussion

4.1. Patterns of HRBs Changes in Terms of Quantity and Spatial Distribution

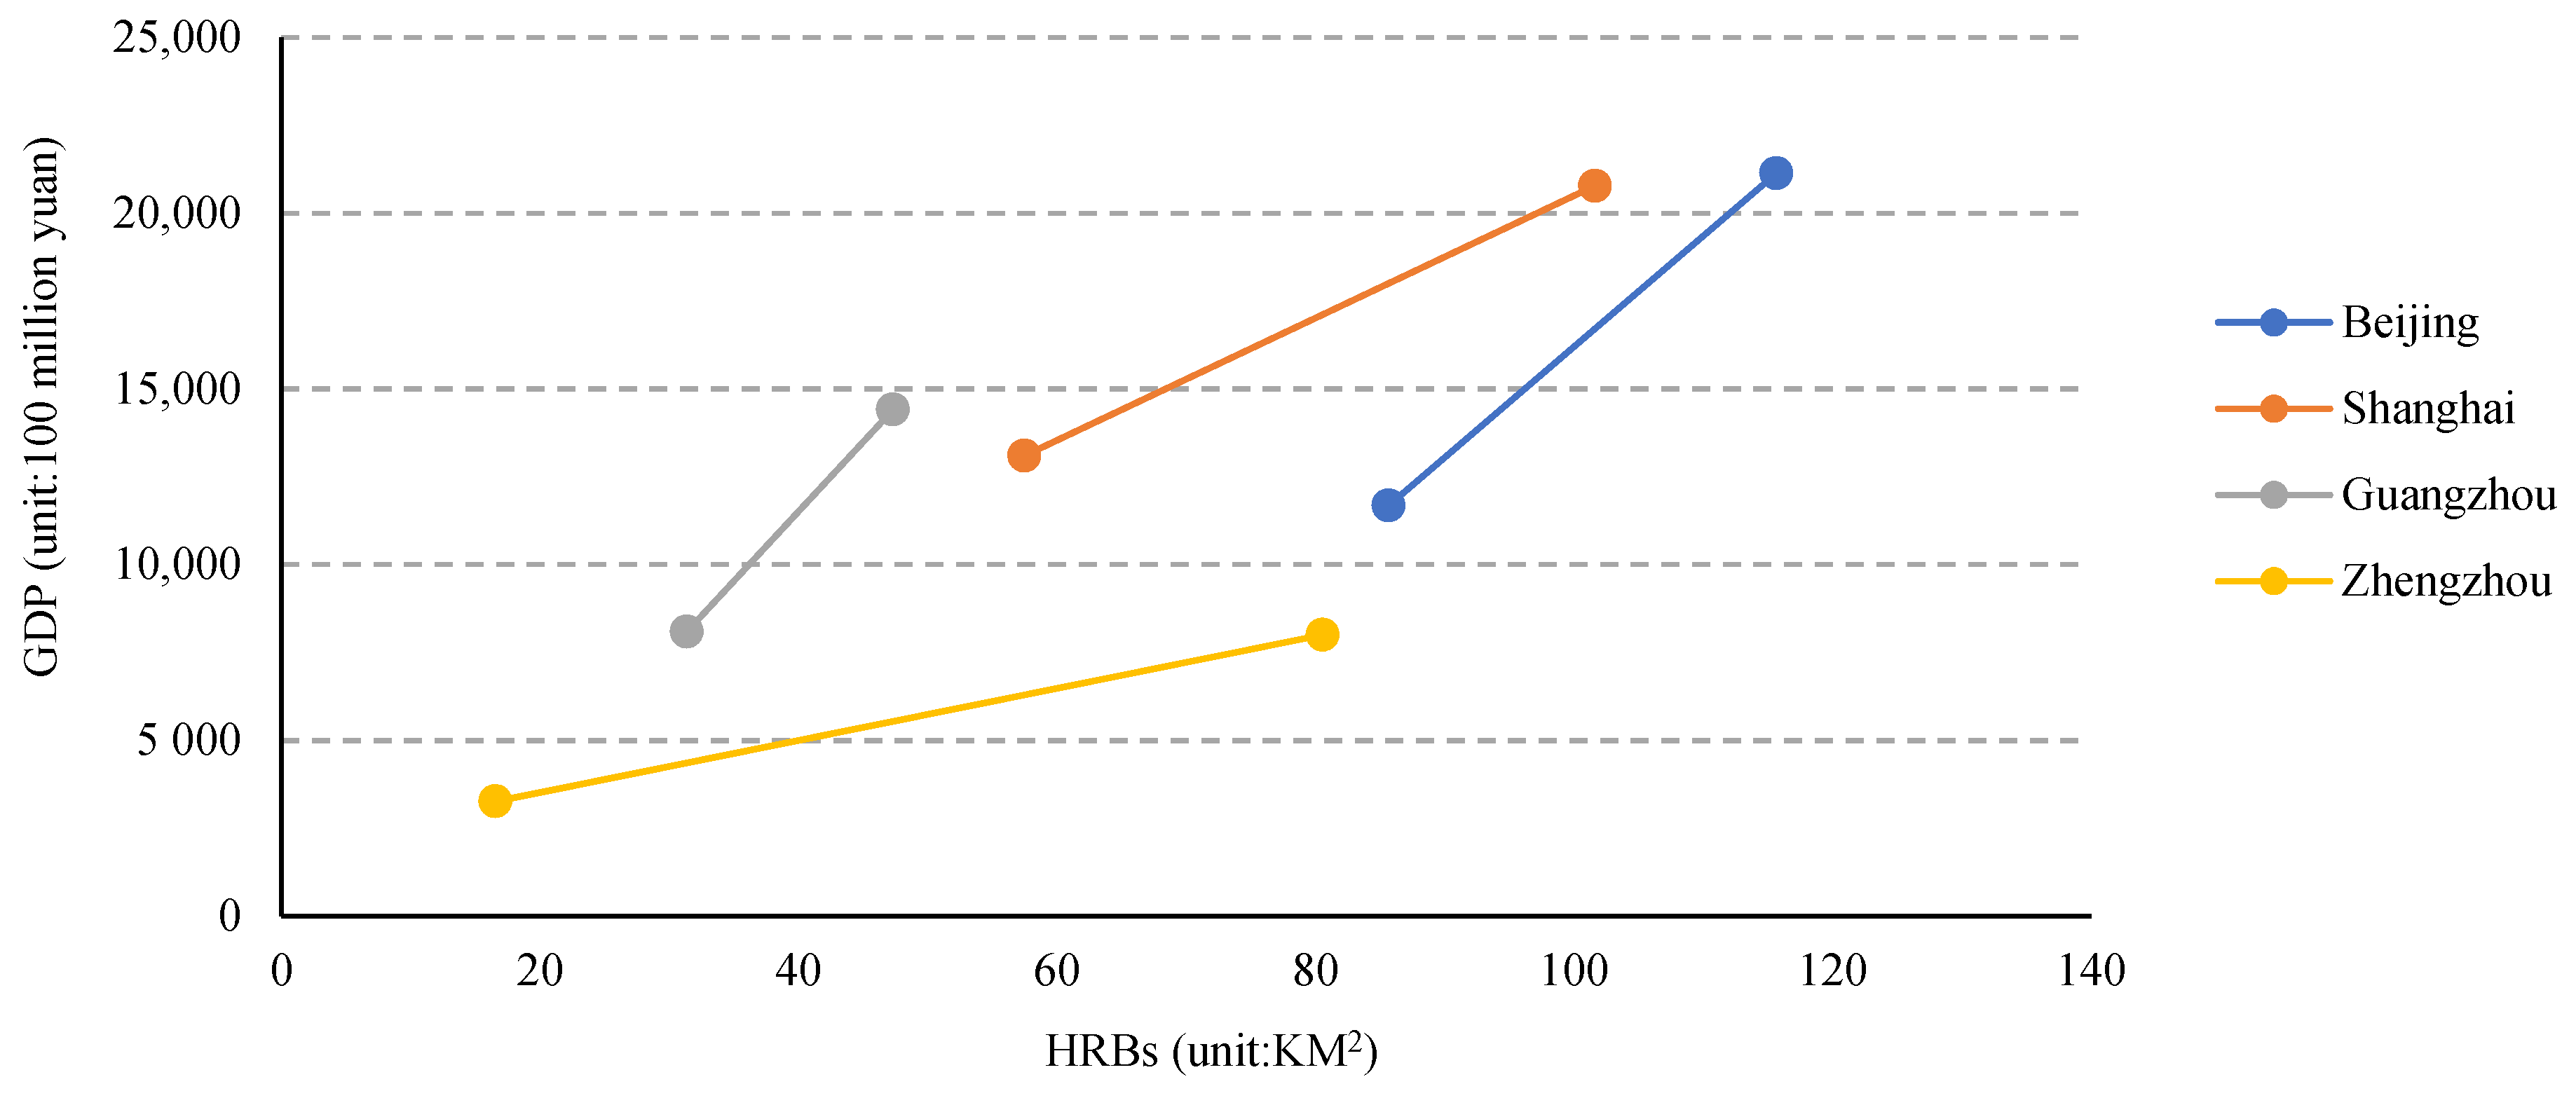
Figure 5 shows the area of extracted HRBs changes in each city in different time ranges. It can be seen that HRBs increased a lot in all 4 cities during the past 20 years, and the increase in HRBs from 2000 to 2010 was smaller than those from 2010 to 2020. This trend can also be seen in Figure 6. More specifically, from 2000 to 2010, the area of newly added HRBs in Beijing was about 85 km2, followed by Shanghai, Guangzhou, and Zhengzhou with 57 km2, 37 km2, and 16 km2, respectively. From 2010 to 2020, the area of newly added HRBs in Beijing was about 115 km2, followed by Shanghai, Zhengzhou, and Guangzhou with 101 km2, 80 km2, and 47 km2, respectively. The large increase in HRBs in the 4 cities was mainly driven by the rapid development of urbanization in the past 20 years in China.
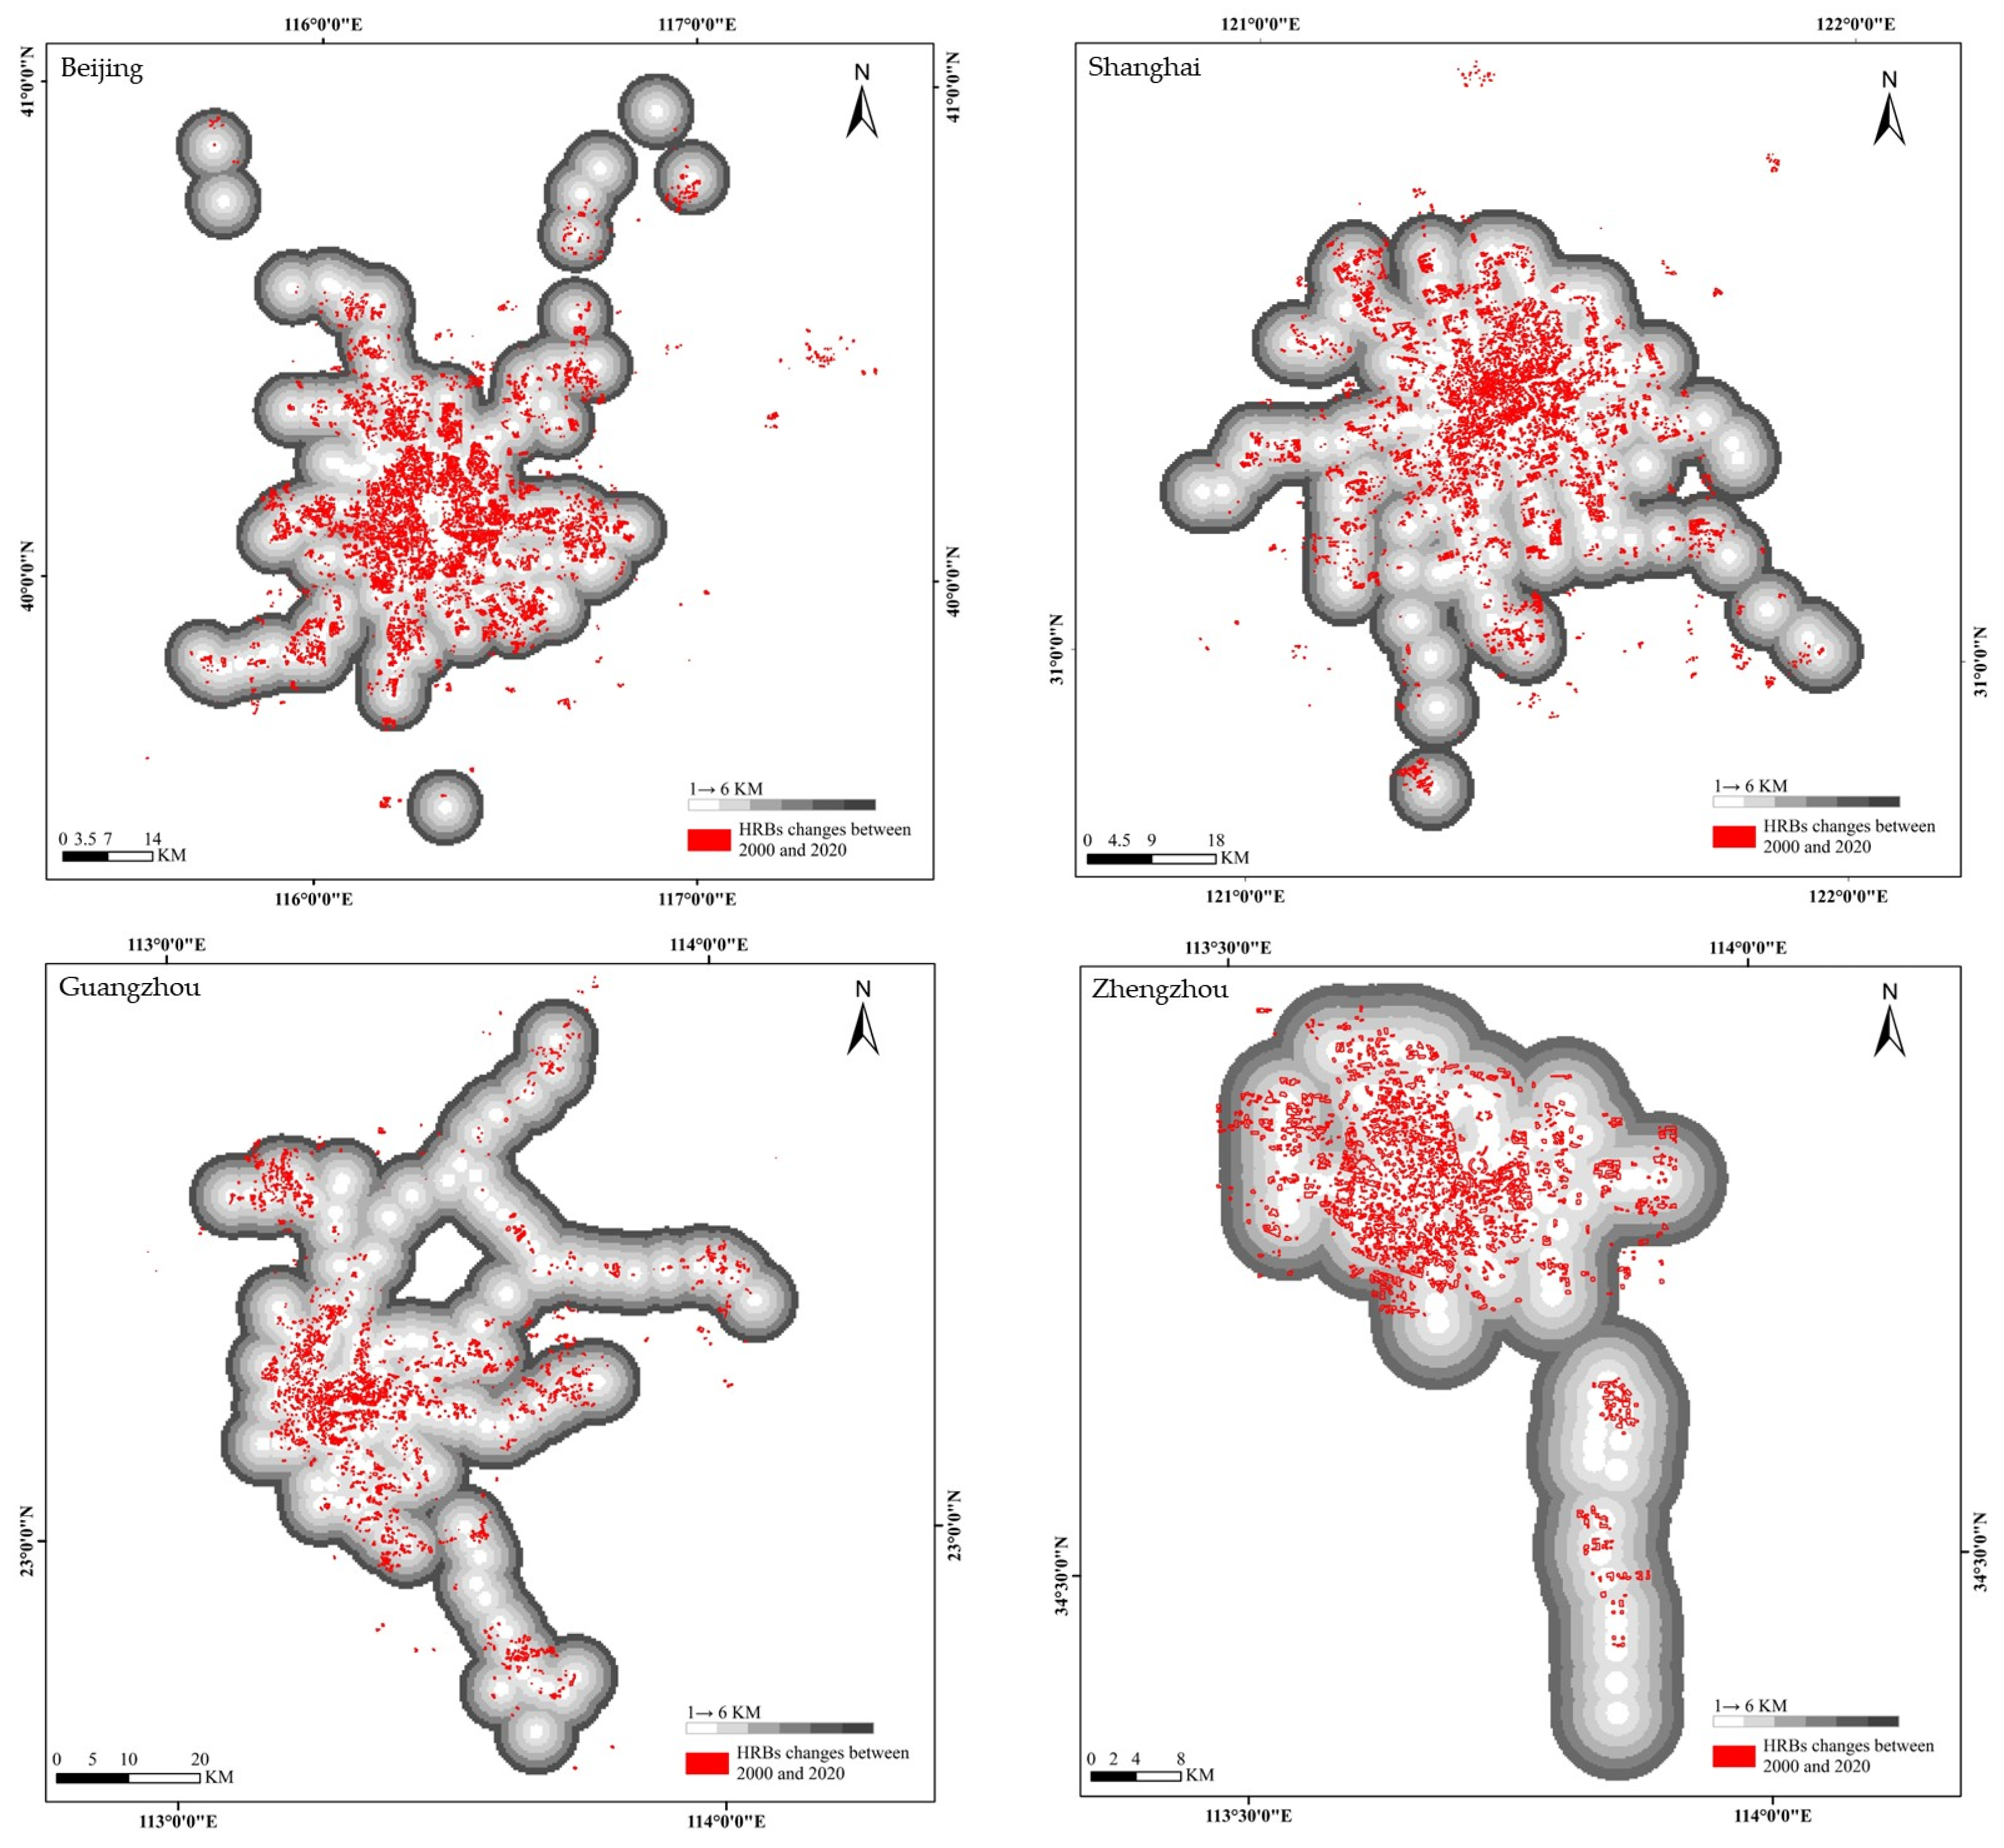
As for the spatial distribution of the HRBs changes, it is not difficult to see in Figure 6 that the new HRBs followed the trend of expansion from the center of each city to its surroundings. From 2000 to 2010, the new HRBs were mainly distributed in the central urban area, while from 2010 to 2020, the distribution of new HRBs began to expand to the suburbs. Meanwhile, the spatial distribution of the HRBs changes in the four cities varies a lot. The new HRBs in Beijing which expanded to the surrounding areas in a relatively uniform way are only slightly affected by the west mountain. This may be due to the historical urban center being a bit far from the mountain areas. The HRBs changes in Shanghai are limited by the Yangtze River in the north of the central city, and the expansion of HRBs is mainly concentrated in the west, south, and east of the central city. Almost no HRBs are seen on Chongming Island located in the northeast of the city. The island is regarded as the backyard of Shanghai and mainly provides recreation and vegetable services. Guangzhou is highly influenced by the administrative boundary and Baiyun Mountain in the northeast, and the expansion of HRBs is mainly from the central urban area to the north, east, and south. The distribution of the expansion of HRBs in Zhengzhou is also relatively uniform. Among them, the airport area far away from the central urban area also has a certain scale of HRBs, due to the development of airports and aviation logistics ports.

4.2. Correlation between HRBs Changes and Rail Terminal Changes

The spatial distribution of new HRBs in the study area was analyzed according to urban rail terminal changes between 2000 and 2020. The transportation accessibility of new HRBs in km was calculated based on the straight-line distance between each location and the nearest increased rail terminal, as shown in Figure 8. For each distance buffer, the percentage of the area of increased HRBs from 2000 to 2020 in each city was calculated, as shown in Table 5. As seen in Figure 8 and Table 5, there is an obvious positive correlation between the HRBs increase and the rail terminal increase, and the HRBs changes mainly happened in regions with high accessibility to rail terminals. More specifically, we can see that nearly half of the new HRBs are located within 1 km of rail terminals, and more than 75% of the new HRBs are within 2 kilometers of new rail terminals in Beijing, Shanghai, Guangzhou, and Zhengzhou.

4.3. Correlation between HRBs Changes and Urban GDP Changes

Figure 9 depicts the correlations between changes in the area of HRBs and the changes in the GDP in each city from 2000 to 2010 and from 2010 to 2020. The graph demonstrates a positive correlation between changes in the area of HRBs and the changes in local GDP. In other words, an increase in HRBs is positively associated with an increase in local GDP. This correlation is the result of a two-way interaction. Firstly, an increase in the area of HRBs indicates an increase in the local population who, in turn, contribute to the production and consumption of goods and services leading to an increase in local GDP. Secondly, the increased GDP is reinvested in urban construction, improving urban facilities and consequently attracting more people, leading to an expansion in the city’s scale and an increase in the area occupied by HRBs.
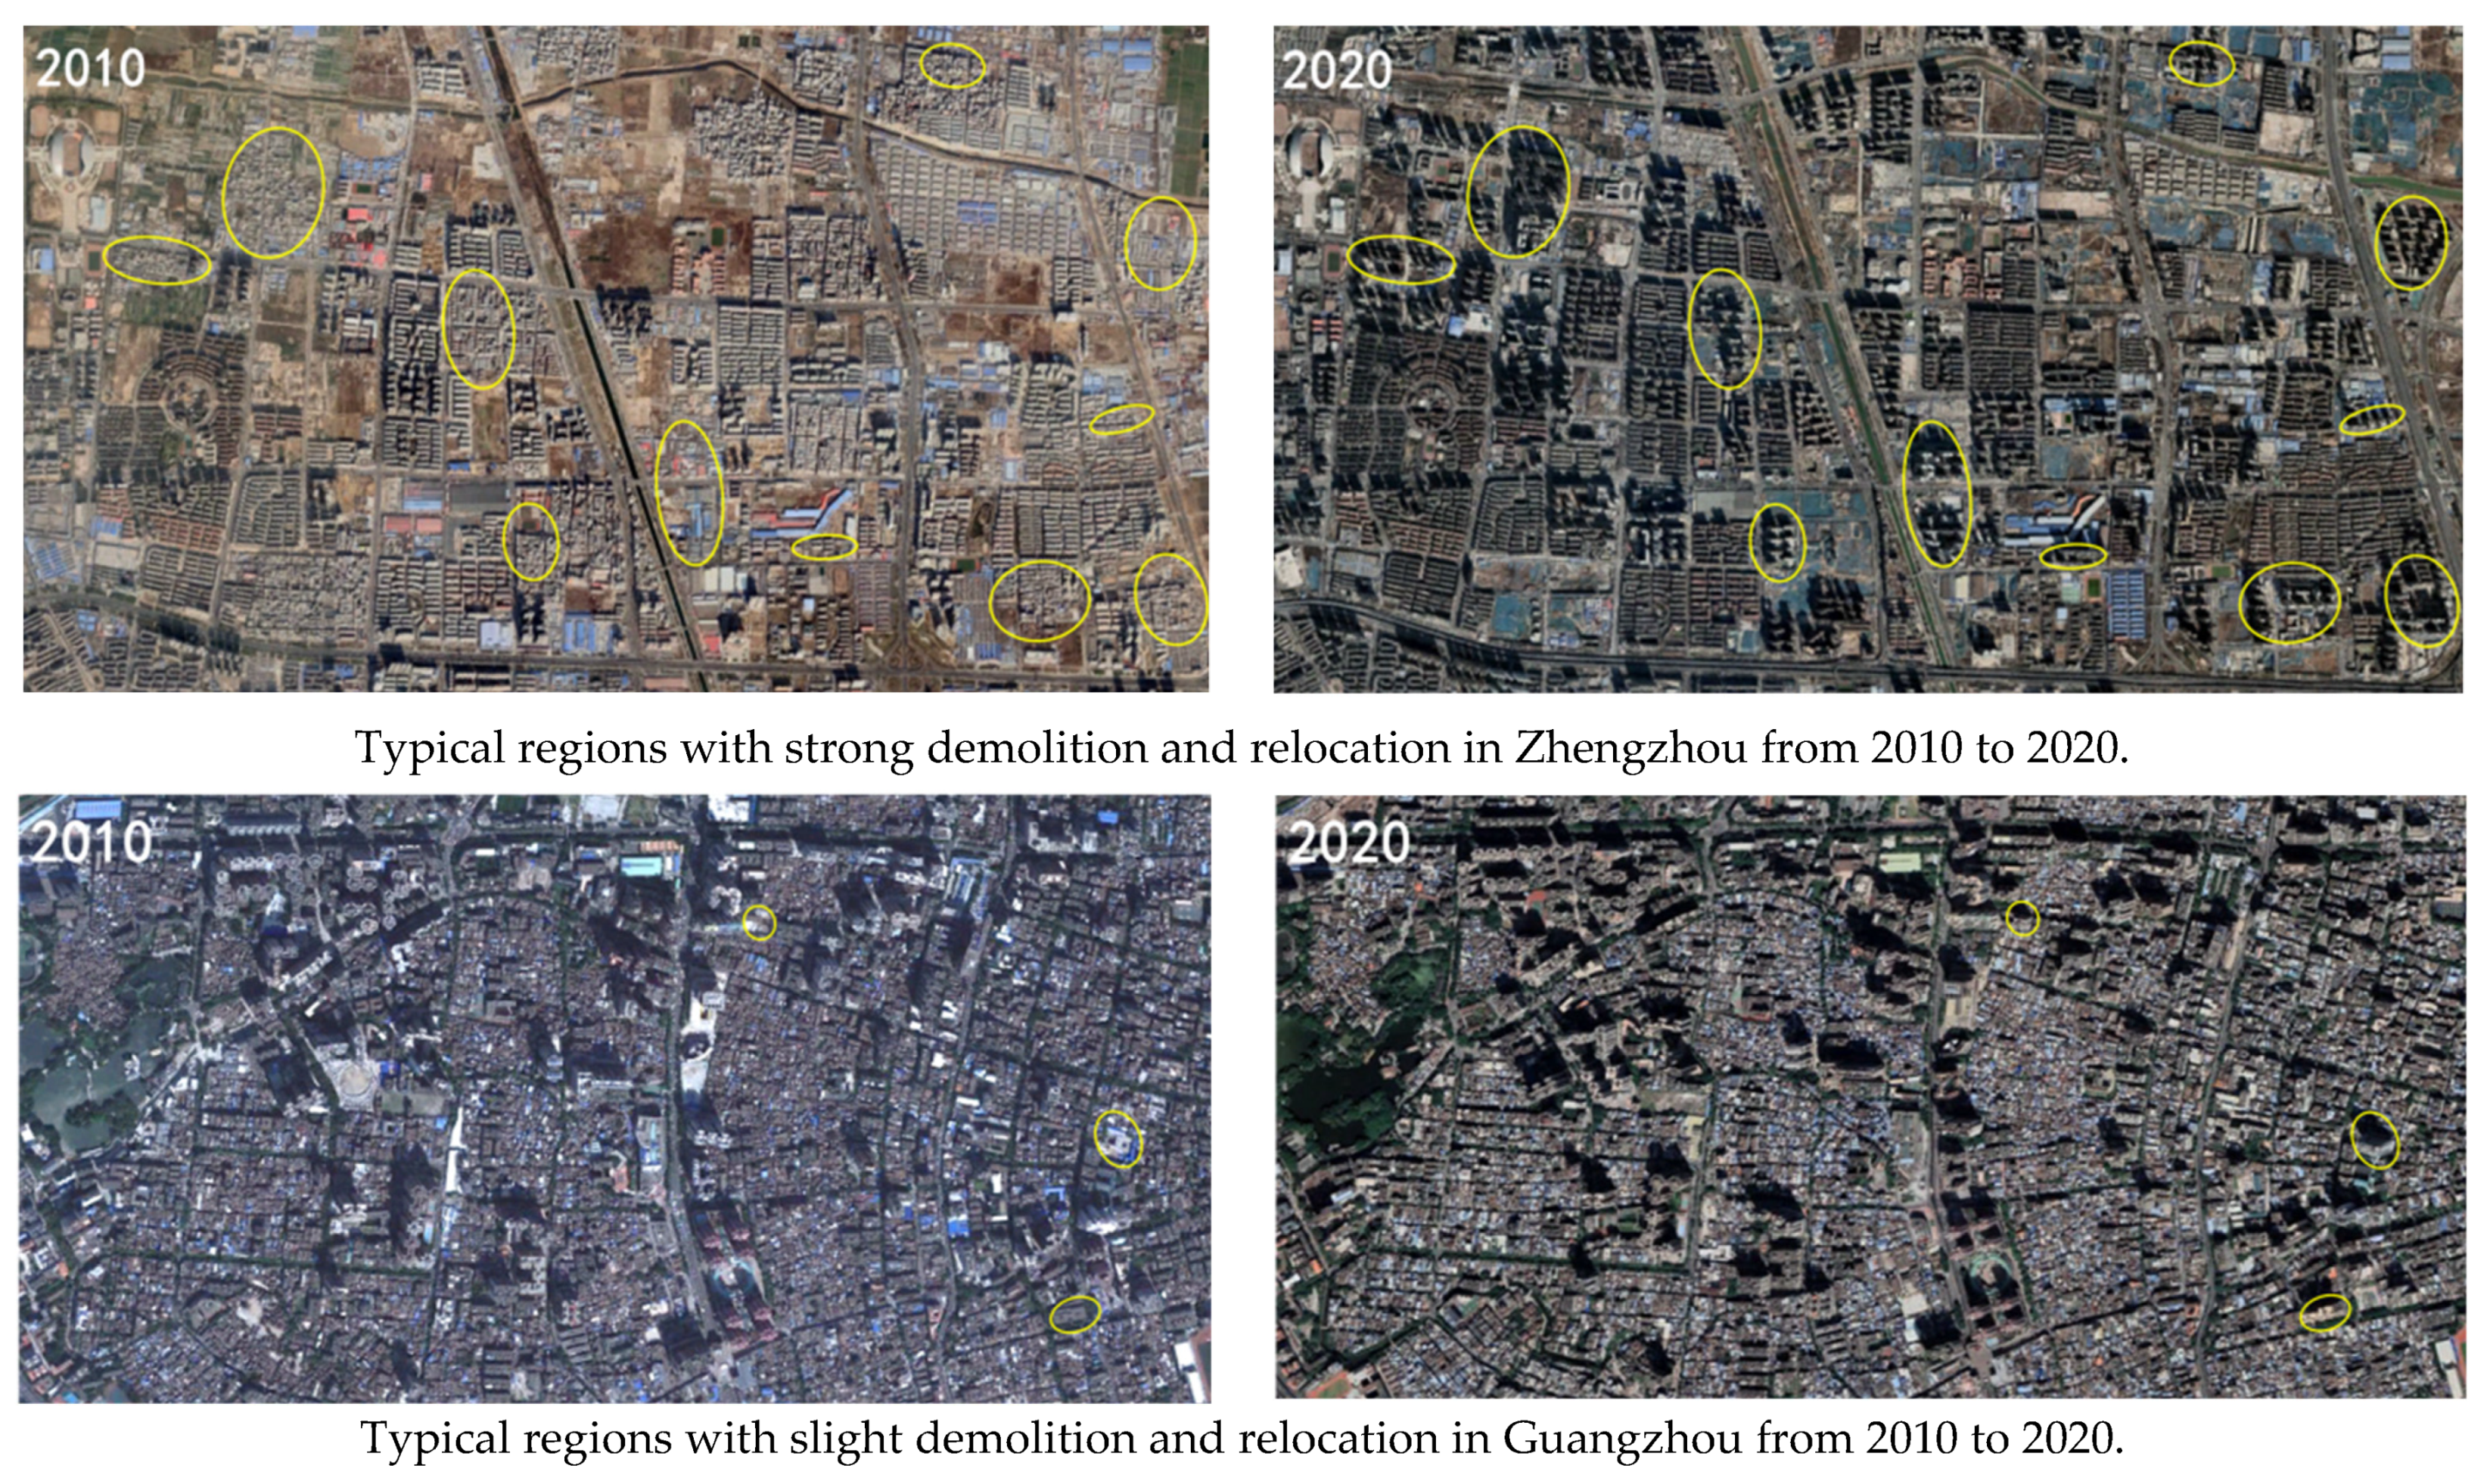
Among the four cities under study, Zhengzhou exhibits a gentle correlation trend between changes in HRBs and changes in GDP, implying that the increase in the area of HRBs has not strongly driven the change in local GDP. This phenomenon can be attributed to two key factors. Firstly, as the capital city of Henan province with a large population, Zhengzhou attracts human resources from across the province leading to less of an impact on the GDP as the increase in people is not just from the city. Secondly, the demolition of low-rise residences and urban villages in and around the downtown area of Zhengzhou has increased HRBs from 2010 to 2020. The urban village demolition process and the resulting HRBs construction is illustrated in Figure 10, which highlights the yellow boxes as the areas that were previously part of the urban village that have now been transformed into HRBs.
In contrast, the correlation trend between the change in HRBs and the change in local GDP in Guangzhou is steeper than that of other cities. This indicates that a limited increase in the area of HRBs can strongly drive changes in local GDP. This phenomenon can be attributed to several factors, whereby the existence of a large number of dense urban villages in the center of Guangzhou, although hindering demolition and HRBs construction due to economic and human factors, provides shelter for a significant number of migrants. The production and consumption brought about by this crowd directly propel the growth in local GDP. Figure 10 shows a typical urban village in Liwan District, Guangzhou, in 2010 and 2020, where only three new blocks of HRBs were built after the demolition of low-rise residential buildings in the urban village in the last ten years.

5. Conclusions

In this study, we proposed an FCN-based procedure to extract long-term and large-scale HRBs using multitemporal Landsat-7 and Sentinel-2 data. The procedure was validated in Beijing, Shanghai, Guangzhou, and Zhengzhou in 2000, 2010, and 2020. Our results show that Landsat-7 data, as well as the well-studied Sentinel-2 data, can be used to accurately extract HRBs in large cities. Thus, combining Sentinel-2 data and Landsat-7 data with the FCN-based method is feasible and applicable for producing long-term and large-scale HRBs data in China. Meanwhile, the spatial distribution of the HRBs changes varies in different cities mainly due to geographical factors and the local urban planning strategy. There is a positive correlation between HRBs changes and rail terminal changes. More than 75% of the changed HRBs are concentrated within 2 km of railway stations. The HRBs changes are also positively correlated with GDP changes in large cities, and the trends between HRBs changes and GDP changes vary in different cities due to their diverse developing modes.
This study does have certain limitations. Firstly, the experiments only considered two typical time ranges, which may not be sufficient for monitoring HRBs changes that can occur every year. Secondly, while the automatic extraction of HRBs yields promising results, it may miss small blocks of HRBs, necessitating manual interpretation to refine the results. Furthermore, the extracted HRBs often have blurred boundaries that are highly affected by shadow. Future studies will focus on two main aspects: (1) adding more time nodes to explore the dynamic evolution of HRBs, especially if we introduce Landsat-8/9 images into future studies, as they share similar sensor specifications with Landsat-7 in terms of HRBs extraction; (2) refining the extraction method to deal with existing problems such as missing small blocks and boundary inconsistencies. Potential ways to achieve this include enlarging the size of the training data and increasing the complexity of the neural network.

Author Contributions

Conceptualization, B.Z. and L.L.; methodology, L.L., G.C. and S.Y.; software, L.L. and S.Y.; validation, S.Y. and G.C.; formal analysis, S.Y.; investigation, L.L.; resources, S.Y.; data curation, S.Y.; writing—original draft preparation, S.Y.; writing—review and editing, L.L.; visualization, G.C.; project administration, L.L.; funding acquisition, L.L. All authors have read and agreed to the published version of the manuscript.

Funding

This research was funded by the National Natural Science Foundation of China (grant number 41971327).

Data Availability Statement

The Sentinel-2 images used in the experiments were all obtained from European Space Agency (ESA) (https://scihub.copernicus.eu/dhus/#/home, accessed on 26 March 2023). The Landsat-7 images used in the experiments were all obtained from United States Geological Survey (USGS) (https://earthexplorer.usgs.gov/, accessed on 26 March 2023).

Conflicts of Interest

The authors declare no conflict of interest.

Appendix A

Figure A1. True color images of the study area and related auxiliary data. Red boxes indicate training areas, green boxes indicate validation areas, and yellow points indicate increased rail terminals from 2000 to 2020.
Remotesensing 15 02427 g0a1aRemotesensing 15 02427 g0a1b

References

  1. Li, L.; Zhu, J.; Cheng, G.; Zhang, B. Detecting High-Rise Buildings from Sentinel-2 Data Based on Deep Learning Method. Remote Sens. 2021, 13, 4073. [Google Scholar] [CrossRef]
  2. Li, L.; Yan, Z.; Shen, Q.; Cheng, G.; Gao, L.; Zhang, B. Water body extraction from very high spatial resolution remote sensing data based on fully convolutional networks. Remote Sens. 2019, 11, 1162. [Google Scholar] [CrossRef]
  3. Bechtel, B.; Alexander, P.J.; Böhner, J.; Ching, J.; Conrad, O.; Feddema, J.; Mills, G.; See, L.; Stewart, I. Mapping Local Climate Zones for a Worldwide Database of the Form and Function of Cities. ISPRS Int. J. Geo-Inf. 2015, 4, 199–219. [Google Scholar] [CrossRef]
  4. Stewart, I.D.; Oke, T.R. Local climate zones for urban temperature studies. Bull. Am. Meteorol. Soc. 2012, 93, 1879–1900. [Google Scholar] [CrossRef]
  5. Xu, Y.; Chen, Y.; Zhou, K.; Guo, Y. The role of high-rise buildings in improving urban land use: A case study of Shanghai, China. Habitat Int. 2017, 60, 70–77. [Google Scholar]
  6. Chang, X.; Chen, R.; Wang, J.; Feng, Z.; Cao, S.J. Impacts of urban-scale building height diversity on urban climates: A case study of Nanjing, China. Energy Build. 2021, 251, 111350. [Google Scholar]
  7. Jia, S.; Wang, Y. Effect of heat mitigation strategies on thermal environment, thermal comfort, and walkability: A case study in Hong Kong. Build. Environ. 2021, 201, 107988. [Google Scholar] [CrossRef]
  8. Mislav, S.; Iztok, S.; Igor, G.; Vlatka, R. Seismic Design of Timber Buildings: Highlighted Challenges and Future Trends. Appl. Sci. 2020, 10, 1380. [Google Scholar]
  9. Mao, J.; Gao, N. The airborne transmission of infection between flats in high-rise residential buildings: A review. Build. Environ. 2015, 94, 516–531. [Google Scholar] [CrossRef] [PubMed]
  10. Miller, R.B.; Small, C. Cities from space: Potential applications of remote sensing in urban environmental research and policy. Environ. Sci. Policy 2003, 6, 129–137. [Google Scholar] [CrossRef]
  11. Gong, P.; Li, X.; Wang, J.; Bai, Y.; Chen, B.; Hu, T.; Liu, X.; Xu, B.; Yang, J.; Zhang, W.; et al. Annual maps of Global Artificial Impervious Area (GAIA) between 1985 and 2018. Remote Sens. Environ. 2020, 236, 111510. [Google Scholar] [CrossRef]
  12. Hong, T.; Kim, J.; Lee, M. A multi-objective optimization model for determining the building design and occupant behaviors based on energy, economic, and environmental performance. Energy 2019, 174, 823–834. [Google Scholar] [CrossRef]
  13. Zhao, J.; Du, Y. Multi-objective optimization design for windows and shading configuration considering energy consumption and thermal comfort: A case study for office building in different climatic regions of China. Sol. Energy 2020, 206, 997–1017. [Google Scholar] [CrossRef]
  14. Wu, C.; Yuan, Y.; Tang, Y.; Tian, B. Application of Terrestrial Laser Scanning (TLS) in the Architecture, Engineering and Construction (AEC) Industry. Sensors 2022, 22, 265. [Google Scholar] [CrossRef] [PubMed]
  15. Shao, Z.; Tang, P.; Wang, Z.; Saleem, N.; Yam, S.; Sommai, C. BRRNet: A Fully Convolutional Neural Network for Automatic Building Extraction From High-Resolution Remote Sensing Images. Remote Sens. 2020, 12, 1050. [Google Scholar] [CrossRef]
  16. Wang, Y.; Zorzi, S.; Bittner, K. Machine-Learned 3D Building Vectorization From Satellite Imagery. In Proceedings of the IEEE/CVF Conference on Computer Vision and Pattern Recognition (CVPR) Workshops, Virtual, 19–25 June 2021; pp. 1072–1081. [Google Scholar]
  17. Li, L.; Zhu, J.; Gao, L.; Cheng, G.; Zhang, B. Detecting and Analyzing the Increase of High-Rising Buildings to Monitor the Dynamic of the Xiong’an New Area. Sustainability 2020, 12, 4355. [Google Scholar] [CrossRef]
  18. Xu, X.; Li, W.; Ran, Q.; Du, Q.; Gao, L.; Zhang, B. Multisource remote sensing data classification based on convolutional neural network. IEEE Trans. Geosci. Remote Sens. 2018, 56, 937–949. [Google Scholar] [CrossRef]
  19. Li, Y.; Li, H.; Wu, X. Deep Learning-Based Classification of Hyperspectral Data. IEEE J. Sel. Top. Appl. Earth Obs. Remote Sens. 2014, 7, 2094–2107. [Google Scholar]
  20. Peng, C.; Li, Y.; Jiao, L.; Chen, Y.; Shang, R. Densely Based multi-scale and multi-modal fully convolutional networks for high-resolution remote-sensing image semantic segmentation. IEEE J. Sel. Top. Appl. Earth Obs. Remote Sens. 2019, 12, 2612–2626. [Google Scholar] [CrossRef]
  21. He, G.; Xing, S.; Xia, Z.; Huang, Q.; Fan, J. Panchromatic and multi-spectral image fusion for new satellites based on multi-channel deep model. Mach. Vis. Appl. 2018, 29, 933–946. [Google Scholar] [CrossRef]
  22. Qiu, C.; Schmitt, M.; Geiß, C.; Chen, T.K.; Zhu, X.X. A framework for large-scale mapping of human settlement extent from Sentinel-2 images via fully convolutional neural networks. ISPRS J. Photogramm. Remote Sens. 2020, 163, 152–170. [Google Scholar] [CrossRef] [PubMed]
  23. Krizhevsky, A.; Sutskever, I.; Hinton, G.E. ImageNet classification with deep convolutional neural networks. Commun. ACM 2017, 60, 84–90. [Google Scholar] [CrossRef]
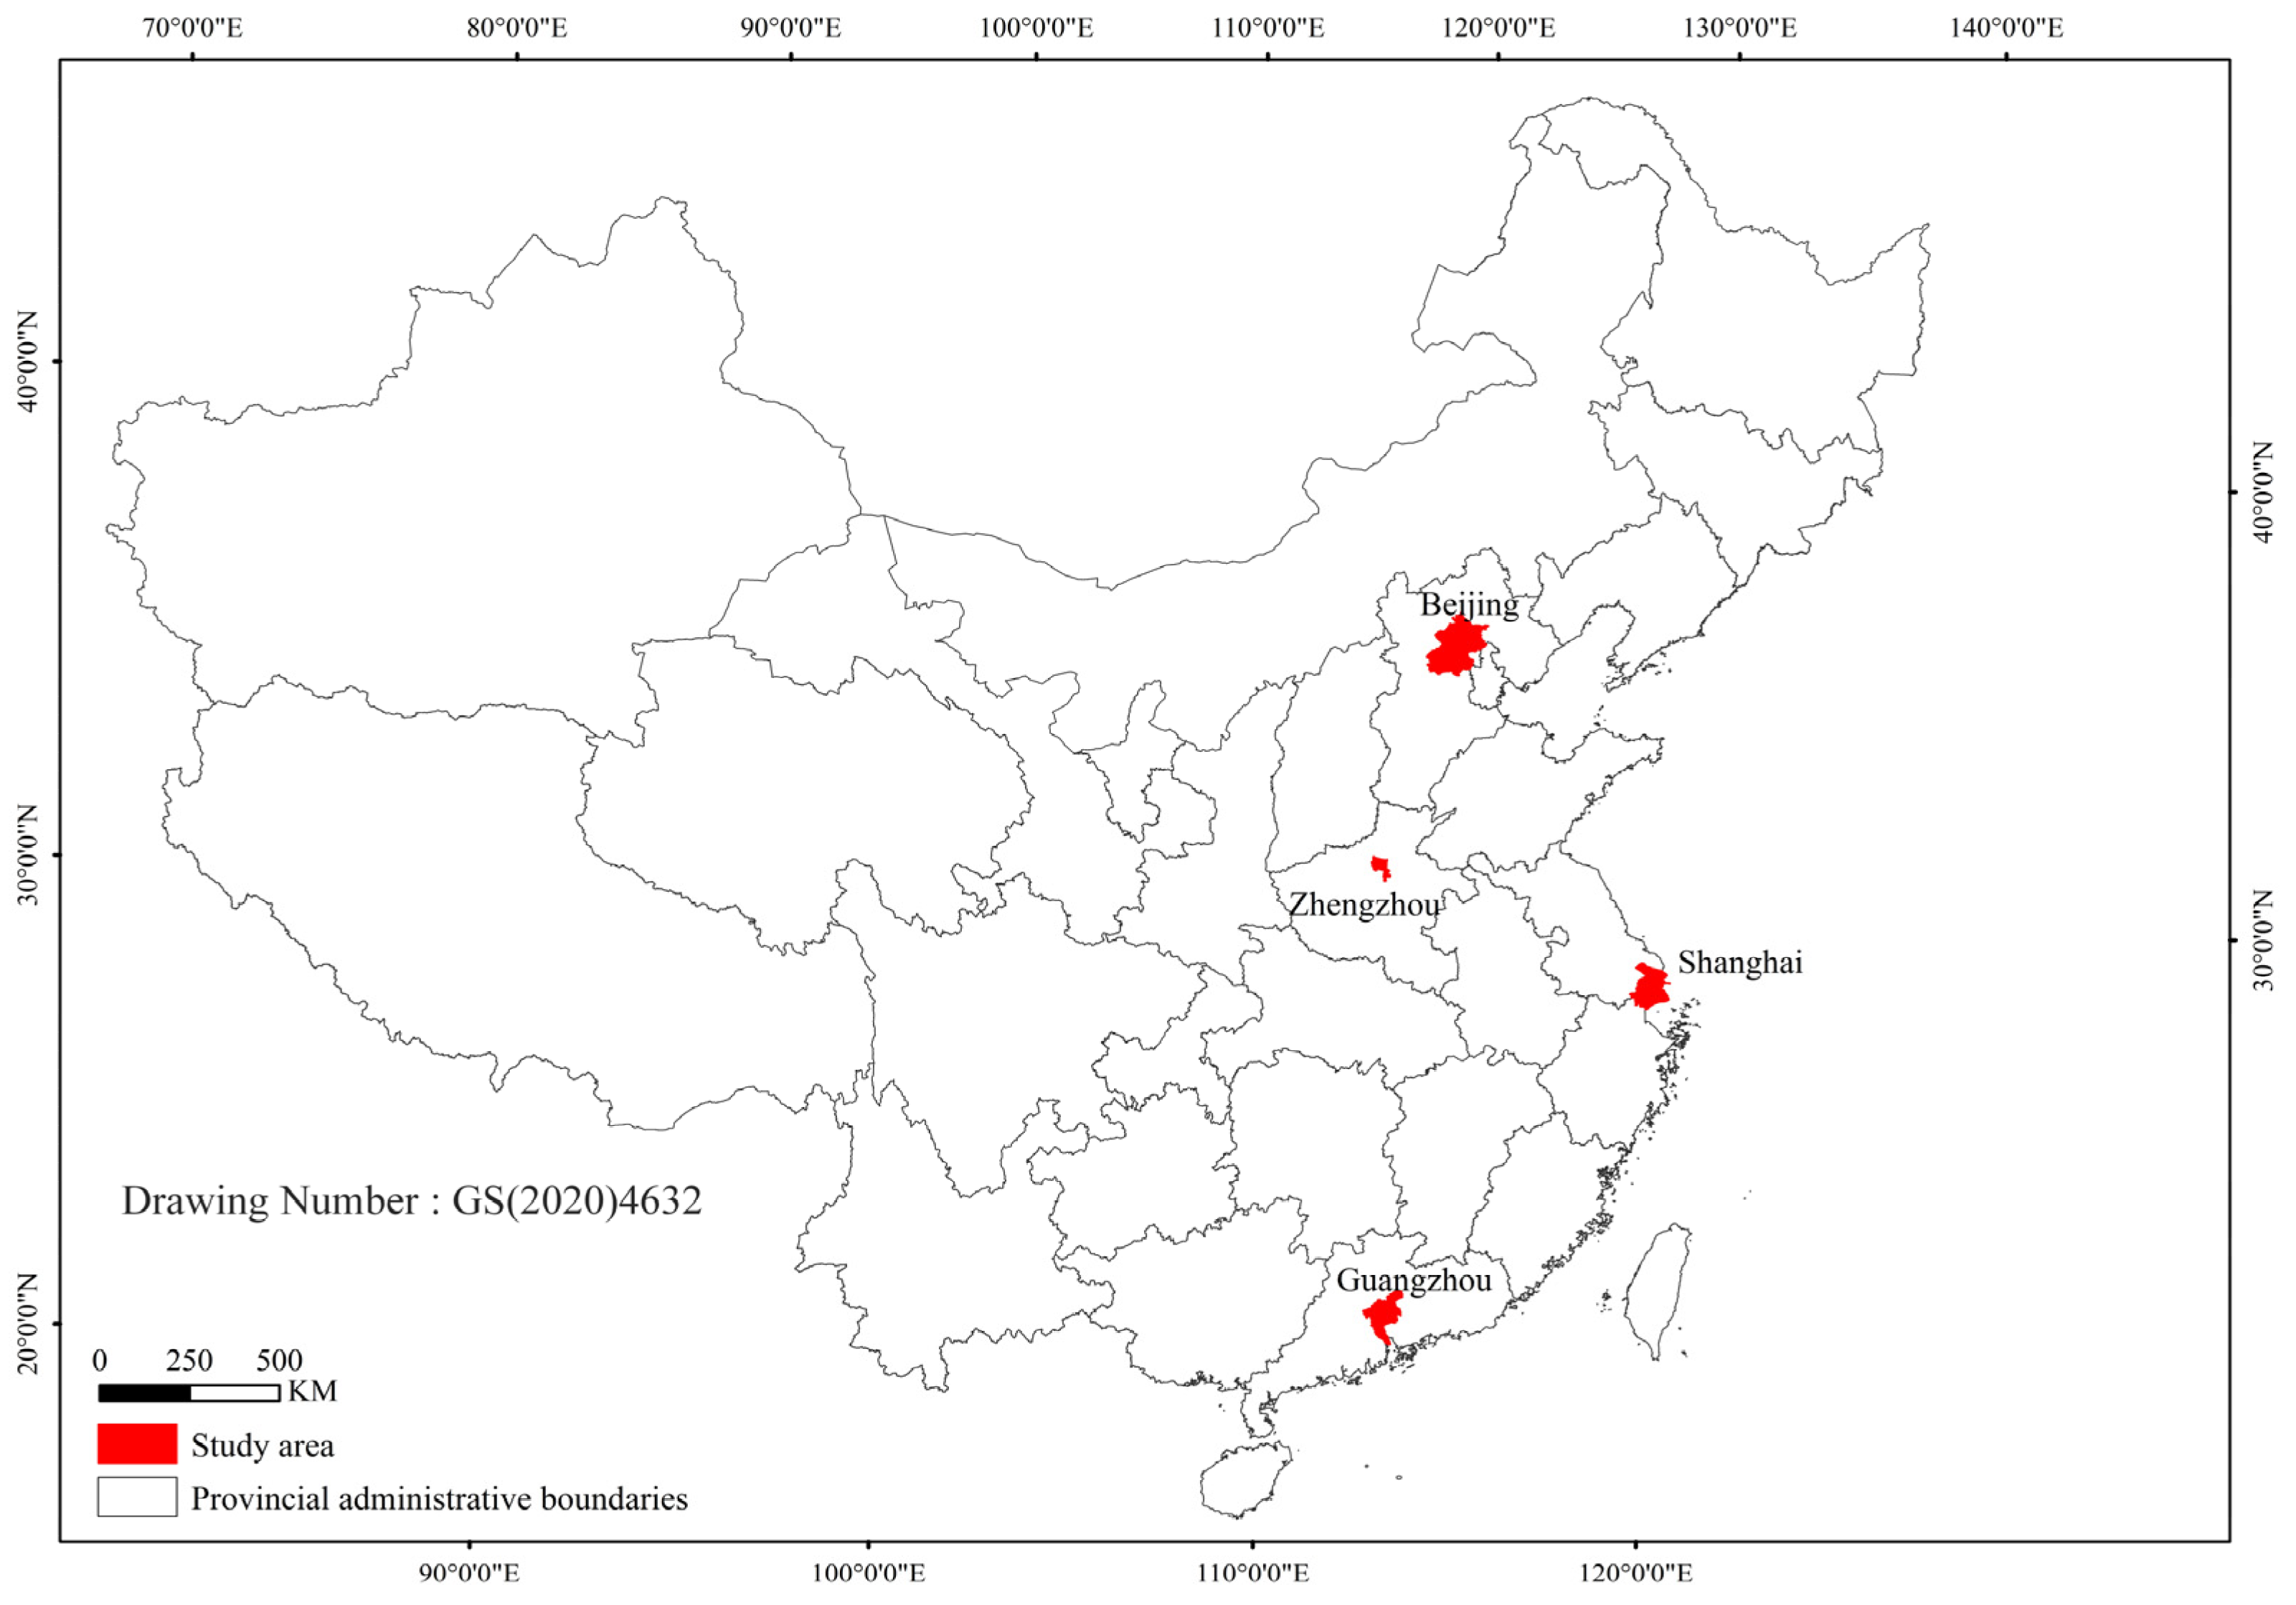
Figure 1. Geographical locations of study areas in four typical cities.
Remotesensing 15 02427 g001
Figure 2. Typical image slices and corresponding HRBs masks in the sample data.
Remotesensing 15 02427 g002aRemotesensing 15 02427 g002b
Figure 3. Flowchart of long-term and large-scale HRBs extraction and analysis.
Remotesensing 15 02427 g003
Figure 4. The architecture of the FCN model used in our method.
Remotesensing 15 02427 g004
Figure 5. HRBs extraction results overlayed on images of the four cities in 2000, 2010, and 2020.
Remotesensing 15 02427 g005aRemotesensing 15 02427 g005b
Figure 6. Results of HRBs change extraction in the four cities in two typical time ranges.
Remotesensing 15 02427 g006aRemotesensing 15 02427 g006b
Figure 7. Validation of HRBs changes in the four cities in two typical time ranges (red polygons refer to extracted results; yellow rectangles refer to omitted areas; and green rectangles refer to false alarms).
Remotesensing 15 02427 g007
Figure 8. Rail transportation accessibility of HRBs in km in the four cities.
Remotesensing 15 02427 g008
Figure 9. Chart of increased area of HRBs and GDP changes in the four cities in two time ranges.
Remotesensing 15 02427 g009
Figure 10. Illustrations of different patterns of HRBs changes driven by the demolition and relocation of urban villages in Zhengzhou and Guangzhou. Typical HRBs changes are circled by the yellow line.
Remotesensing 15 02427 g010
Table 1. List of multisource satellite images used in the experiment.
CityImage Source LocationAcquisition Date
BeijingS2-T50TNK10 May 2020
S2-T50TNL10 May 2020
S2-T50TML13 May 2020
S2-T50TLK23 May 2020
S2-T50TLL23 May 2020
S2-T50TMK23 May 2020
S2-T50SLJ2 April 2020
S2-T50SMJ15 May 2020
L7-12303219 December 2009
L7-12303319 December 2009
L7-12303224 December 1999
L7-12303329 May 2020
ShanghaiS2-T51RUQ23 February 2020
S2-T51SUR23 February 2020
S2-T51RTQ13 April 2020
S2-T51STR13 April 2020
L7-11803817 January 2010
L7-11803917 January 2010
L7-11803826 February 2000
L7-11803926 February 2000
GuangzhouS2-T49QFF30 January 2020
S2-T49QGF30 January 2020
S2-T49QGG30 January 2020
L7-12204328 December 2009
L7-12204431 December 2010
L7-12204325 November 1999
L7-1220442 January 2000
ZhengzhouS2-T49SGU12 April 2020
L333337-12403626 May 2010
L7-1240365 April 2000
Table 2. GDP data of the corresponding year in the four cities (unit: CNY 100 million).
City2000 GDP2010 GDP2020 GDP
Beijing3277.8014,964.0036,102.60
Shanghai4812.1517,915.4038,700.60
Guangzhou2505.5810,604.4825,019.11
Zhengzhou738.004000.0012,003.00
Table 3. Accuracy of the extracted HRBs in 2010 and 2020 in the four cities.
Accuracy of the Extracted HRBs in 2010
CityTrue ValueOverall AccuracyFalse RateAverage False RateAverage Accuracy
Beijing2592.00% (23)8.00% (2)4.19%91.88%
Shanghai3892.11% (35)2.78% (1)
Guangzhou3393.94% (31)3.13% (1)
Zhengzhou3889.47% (34)2.86% (1)
Accuracy of the extracted HRBs in 2020
CityTrue ValueOverall AccuracyFalse RateAverage False RateAverage Accuracy
Beijing5094.12% (48)2.00% (1)3.02%92.89%
Shanghai2792.86% (26)3.70% (1)
Guangzhou3293.94% (31)3.13% (1)
Zhengzhou3190.63% (29)3.23% (1)
Table 4. The accuracy of the extracted HRBs changes in two typical time ranges.
The Accuracy of the Extracted HRBs changes from 2000 to 2010
CityTrue ValueOverall AccuracyFalse RateAverage False RateAverage Accuracy
Beijing2190.91% (20)4.76% (1)5.27%90.60%
Shanghai3291.18% (31)6.06% (2)
Guangzhou2990.32% (28)6.67% (2)
Zhengzhou2990.00% (27)3.57% (1)
The accuracy of the extracted HRBs changes from 2010 to 2020
CityTrue ValueOverall AccuracyFalse RateAverage False RateAverage Accuracy
Beijing2789.66% (26)7.14% (2)3.18%91.17%
Shanghai2195.24% (20)(0)
Guangzhou3190.32% (28)(0)
Zhengzhou1889.47% (17)5.56% (1)
Table 5. Percentage of new HRBs in different distance bands.
Distance/CityBeijingShanghaiGuangzhouZhengzhou
0–1 km54.7%54.0%51.6%48.7%
1–2 km22.4%27.1%24.5%27.4%
2–3 km9.3%7.7%9.5%11.9%
3–4 km6.2%3.8%6.2%6.1%
4–5 km2.8%2.4%2.5%3.2%
5–6 km1.3%1.2%2.0%1.2%
≥6 km3.8%3.8%3.3%1.5%
Disclaimer/Publisher’s Note: The statements, opinions and data contained in all publications are solely those of the individual author(s) and contributor(s) and not of MDPI and/or the editor(s). MDPI and/or the editor(s) disclaim responsibility for any injury to people or property resulting from any ideas, methods, instructions or products referred to in the content.