Article

The Responses of Vegetation NPP Dynamics to the Influences of Climate–Human Factors on Qinghai–Tibet Plateau from 2000 to 2020

1
School of Architecture and Information Engineering, Shandong Vocational College of Industry, Zibo 256414, China
2
School of Civil Architectural Engineering, Shandong University of Technology, Zibo 255000, China
3
Key Laboratory of Agricultural Remote Sensing, Ministry of Agriculture and Rural Affairs/Institute of Agricultural Resources and Regional Planning, Chinese Academy of Agricultural Sciences, Beijing 100081, China
*
Author to whom correspondence should be addressed.
Remote Sens. 2023, 15(9), 2419; https://doi.org/10.3390/rs15092419
Submission received: 6 March 2023 / Revised: 29 April 2023 / Accepted: 3 May 2023 / Published: 5 May 2023
(This article belongs to the Special Issue Recent Progress of Change Detection Based on Remote Sensing)

Abstract

:
The dominant influencing factors of changes in vegetation NPP and the relative roles of climate–human factors on the Qinghai–Tibet Plateau (QTP) differ between historical periods and are unclear. Therefore, there is an urgent need to systematically and quantitatively analyze the evolution process of the QTP’s ecosystem pattern and the driving factors of this process. Based on MOD17A3H and meteorological data, the Miami model, correlation analysis, and the residual coefficient method were used to investigate the spatiotemporal patterns of changes in vegetation NPP on the QTP from 2000 to 2020. We then quantitatively distinguished the relative roles of climate change and human activity in the process of vegetation NPP change during different historical periods. The results show the following: (1) From 2000 to 2020, zones with increasing vegetation NPP (10–30%) were the most widely distributed, and were mainly located in the Three-Rivers Headwater Region and the northern part of the Hengduan Mountains. (2) From 2000 to 2020, zones with a significant positive correlation between vegetation NPP and annual precipitation were mostly distributed in the northeastern QTP and the Three-Rivers Headwater Region, while zones with a positive correlation between vegetation NPP and annual average temperature were mostly located in southern Tibet. Zones with a significant positive correlation between NPP and annual sunshine hours were mainly distributed in the southeastern part of the QTP and the southern part of the Tanggula Mountains. In contrast, zones with a significant positive correlation between NPP and accumulated temperature (>10 °C) were mainly concentrated in the northern and eastern parts of the QTP. (3) During different historical periods, the relative roles of climate–human factors in the process of vegetation NPP change on the QTP had obvious spatiotemporal differences. These results could provide scientific support for the protection and restoration of regional ecosystems on the QTP.

1. Introduction

Vegetation net primary productivity (NPP) refers to the amount of organic matter accumulated by green plants through photosynthesis in the natural environment. It refers to the remaining organic matter produced by green plants after removing autotrophic respiration [1], and provides essential supply and support services to ecosystems [2]. NPP research focuses on key scientific issues pertaining to global change, such as the carbon cycle, climate change, the water cycle, and food security [3,4]. Therefore, investigating the spatiotemporal changes in vegetation NPP can provide a theoretical basis for protecting and monitoring global terrestrial ecosystems. This study explores climate trends and the change rate of NPP in original vegetation, analyzes the correlation between vegetation NPP and climate factors, and quantitatively evaluates the relative roles of climate change and human activity in grassland degradation; this is conducive to exploring the temporal and spatial evolution patterns of vegetation NPP on the Qinghai–Tibet Plateau during different historical periods, and its response mechanism to climate–human interaction.
With the development of RS and computer technology, large-scale spatiotemporal changes in NPP have become a hot topic for scholars, who base their research on satellite images. Recently, scholars have utilized different analytical methods, such as geographic detectors and correlation analysis, to explore the impacts of human–nature interaction factors on regional NPP. Yuan et al. [5] applied the CASA model to explore the response of NPP to climate factors in the source region of the Yangtze River, and found that human activity was significantly related to NPP changes in the downstream areas. Shao et al. [6] found that, in recent years, human activity has caused great disturbance, leading to considerable NPP changes in Shanxi Province. Based on the CASA model, Jia et al. [7] explored the response of NPP to climate change in the six northwestern provinces, and found that the correlation between NPP and temperature and precipitation showed an increasing trend. Liu et al. [8] utilized the improved CASA model to investigate the spatiotemporal differentiation characteristics of NPP in the Yili River Basin, and found a fluctuating increasing trend. He et al. [9] investigated the influence of vegetation, climate, and terrain factors on NPP using a geographical detector, and found that NDVI was obviously related to NPP. Zhang et al. [10] explored the relationship between NPP and climate change in northwest China based on improved MOD17A3 data using change rate analysis, the MK statistical method, and the GIS analysis method. Wang et al. [11] believed that temperature, precipitation, and elevation had considerable impacts on vegetation NPP in the Yellow River Basin, and the contribution rates of the driving factors were significantly different. Shi et al. [12] found that precipitation was the dominant natural influencing factor of vegetation NPP on the Loess Plateau. Mu et al. [13] believed that the NPP of different vegetation types was sensitive to climate change, while the NPP of forest land was mainly limited by temperature, and the NPP of cultivated land and grassland was mainly influenced by precipitation. Ma et al. [14] used MOD17A3 data to investigate the relationships between NPP and climate factors in the karst areas of Yunnan, Guizhou, and Guangxi, and found that temperature significantly affected NPP changes. Sun et al. [15] found that the explanatory power of natural factors on NPP in Yunnan Province was greater than that of human disturbance, while that of human activity showed an increasing trend. Global vegetation NPP has shown an increasing trend since 1980, but its driving mechanisms differ between regions [16,17,18]. Under the stress of global change, China’s climate has also changed dramatically, and terrestrial vegetation NPP has shown a certain growth trend. Climate change has increased the effects of water and heat stress on vegetation growth [19,20,21]. However, vegetation NPP has changed in response to climate change in China [22,23]. In recent decades, increasing human activity has also become one an important factor affecting spatiotemporal changes in regional vegetation NPP [24]. However, climatic factors and human activity have different effects [25,26,27] on vegetation NPP in different regions. In addition, there are obvious differences in the response of vegetation NPP to climate–human factors during different historical periods [28,29,30]. Therefore, it is of great importance to further explore and distinguish the relative roles of climate–human factors on vegetation NPP in the context of global change.
In the 21st century, the natural and artificial ecosystems of the QTP have undergone extensive and profound changes. As a key ecological zone in China, there is an urgent need to systematically and quantitatively analyze the evolution process of its ecosystem pattern and distinguish the relative roles of climate change and human activity on vegetation NPP changes. In this paper, the objective and novelty are to quantitatively distinguish the relative roles of climate–human factors in vegetation NPP changes of different sub-regions during different historical periods.

2. Materials and Methods

2.1. Study Area

The QTP, located in the southwestern part of China, covers the coordinates 26°00′12″–39°46′50″N, 73°18′52″–104°46′59″E, with a total area of 2.6 × 10⁶ km2, accounting for 26.8% of the total area (Figure 1). It mainly includes all of the Tibet Autonomous Region and Qinghai Province, as well as the southwestern regions of Gansu Province, northern Sichuan, northwestern Yunnan, and the southern Xinjiang Uygur Autonomous Region. The plateau climate dominates the QTP, which is characterized by a high altitude, low temperatures, and large temperature differences between day and night. In addition, this area has less precipitation and large regional differences. The average temperature of the coldest month ranges from −15 to 10 °C, while that of the warmest month is less than 10 °C. The QTP’s altitude shows an increasing trend from the Hengduan Mountains (less than 3500 m) to the Kunlun Mountains (more than 6000 m). In the southeast, forests, shrubs, and grasslands are widely distributed, while desert ecosystems are mainly concentrated in the northwest (Figure 1). Grassland is mainly distributed in the mountains and beaches above altitudes of 3500~4000 m. Water bodies are concentrated in the Qaidam Basin and the northern and western regions of Tibet. Forest land is concentrated in the eastern and south-eastern parts of Tibet and the middle reaches of the Yarlung Zangbo River. Shrub land is distributed throughout the Qinghai–Tibet Plateau because of its extensive ecological adaptations.

2.2. Data Source and Preprocessing

Vegetation net primary productivity (NPP) data from 2000 to 2020 were derived from the MOD17A3H data set, which is available at https://lpdaac.usgs.gov/, accessed on 12 January 2023, with spatial and temporal resolutions of 500 m and 1 a, respectively. Data from three hundred and fifty-six meteorological stations on the QTP and its surrounding areas, including daily precipitation, daily average temperature, and daily sunshine hours, were derived from the China Meteorological Data Network (The MODIS Projection Tool (MRT) was applied to mosaic to project the MOD17A3H data). The annual precipitation, accumulated temperature (>10 °C), average temperature, and sunshine hours from 2000 to 2020 were calculated in C# programing language, and the corresponding 1 km × 1 km grid data were obtained using ArcGIS 10.3. However, due to the scarcity of meteorological stations in the western part of the QTP, the interpolation accuracy in the non-station area was not high. This study used the high-spatiotemporal-resolution surface meteorological element driving data set for China to interpolate the entire QTP, especially the central and western regions (Figure 1).

2.3. Methods

2.3.1. Correlation Analysis

Correlations can reflect the influence degree and influence direction between factors. In this study, SPSS software was used to analyze the correlations between vegetation NPP change and climate factors such as temperature and precipitation. ArcGIS software was used to further analyze differences in the spatial distribution of the correlation between vegetation NPP and climate factors, by employing the Pearson correlation coefficient based on pixels. The calculation formulas are as follows:
r x , y = i = 1 n ( x i x ¯ ) ( y i y ¯ ) i = 1 n ( x i x ¯ ) 2 i = 1 n ( y i y ¯ ) 2
r x y 1 , y 2 = r x y 1 r x y 2 r y 1 y 2 1 r 2 x y 2 1 r 2 y 1 y 2
R x , y 1 y 2 = 1 ( 1 r 2 x y 1 ) ( 1 r 2 x y 2 , y 1 )
  • In the above formulas, r x , y represents the correlation coefficient of variables, with values ranging from −1 to 1; r x y 1 , y 2 represents the partial correlation coefficient of x and y 1 after fixing y2; R x , y 1 y 2 represents the multiple correlation coefficient of x and y 1 y 2 ; and r x y 2 , y 1 is the partial correlation coefficient of x and y 2 after fixing y 1 . The formulas for the T and F tests are as follows:
    T = r x y 1 , y 2 1 r x y 1 , y 2 × n m 1
    F = R 2 x , y 1 y 2 1 R 2 x , y 1 y 2 × n m 1 m
In the above formulas, n and m are the numbers of samples and variables, respectively.

2.3.2. Trend Analysis

The univariate linear regression analysis method can eliminate the influence of extreme climate in a specific year to a certain extent. This study used univariate linear regression analysis to analyze the time series change trend of vegetation NPP (Equation (6)).
θ s l o p e = n × i = 1 n i × NPP i i = 1 n i = 1 n NPP i n × i = 1 n i 2 i = 1 n i 2
The change ratio (NPPcr) was applied to characterize the change degree of NPP in n years (Equation (7)).
NPP cr = θ slope NPP mean × n × 100 %

2.3.3. Miami Model

In this study, the Miami model was selected to estimate the potential NPP. Based on the temperature and precipitation data, a vegetation net primary productivity model was established using the least squares method. The Miami model, based on Liebig ‘s lowest method, is the first widely used method of estimating potential NPP, and its equation is as follows:
NPP potential = min { ( 1 + 3000 exp ( 1.315 0.119 T ) ) , ( 3000 [ 1 exp ( 0.000664 P ) ] ) ) }
where NPP potential is the potential NPP, T is annual average temperature (°C), and P is annual precipitation (mm).

2.3.4. Climate Tendency Rate and Trend Coefficient

The climatic trend coefficient can reflect the direction and degree of the long-term change trend for each climatic factor. The calculation method is the climatic factor and the natural number 1, 2, 3,… multiplied by n. The correlation coefficient of n is calculated as follows:
r x t = i = 1 n ( x i x ¯ ) ( i t ¯ ) i = 1 n ( x i x ¯ ) 2 i = 1 n ( i t ¯ ) 2
In the above formula, r x t is the absolute value of the trend coefficient; x i is climate factor i; x is the multi-year average of climate factor i; n is the time series (time series 2000–2020, n = 21); and t = (n + 1)/2; among these factors, r x t indicates that the interannual variation in the corresponding climatic factors is more intense. The linear equation for calculating the trend change in climatic elements is:
y = a 0 + a 1 t t = 1 , 2 , , n
In the above formula, a1 is the climate tendency rate, and its unit is a certain factor unit. The equation, according to linear regression theory, is as follows:
a 1 = r x t ρ x ρ t
In the above formula, ρx refers to the mean square error of factor x, and t refers to the mean square error of sequence 1 to n. Thus, the climate tendency rate can be obtained from the trend coefficient r x t .

3. Results

3.1. Change Ratio of Vegetation NPP on QTP from 2000 to 2020

As shown in Figure 2, zones of increasing vegetation NPP (10–30%) covered the largest area, and were mainly distributed in the Three-Rivers Headwater Region, the northern part of the Hengduan Mountains, and the central and eastern parts of Nagqu County, such as Linzhi County, Changdu, and Golmud City. The stable zones (−10 < change rate < 10%) were mostly concentrated along the eastern edge of the QTP and southern Tibet, in areas such as Xiahe County, central and northern Maerkang County, central and eastern Maqin County, Tongren County, and northern Shigatse City. Zones with a change rate > 30% were mostly concentrated in Golmud City, Linzhi County, eastern Wulan County, and central and eastern Gonghe County. Zones of NPP reduction (change rate < −10%) were mostly concentrated on the Ali Plateau, in areas such as the western and southern parts of Gaer County and the southwestern part of Naqu County. Zones with −30% < change rate < 10% had a smaller area proportion, and were mainly distributed in the eastern part of Gar County, the southwest of Naqu County, and the northeastern part of Kaze City.

3.2. Correlations between Vegetation NPP and Climatic Factors from 2000 to 2020

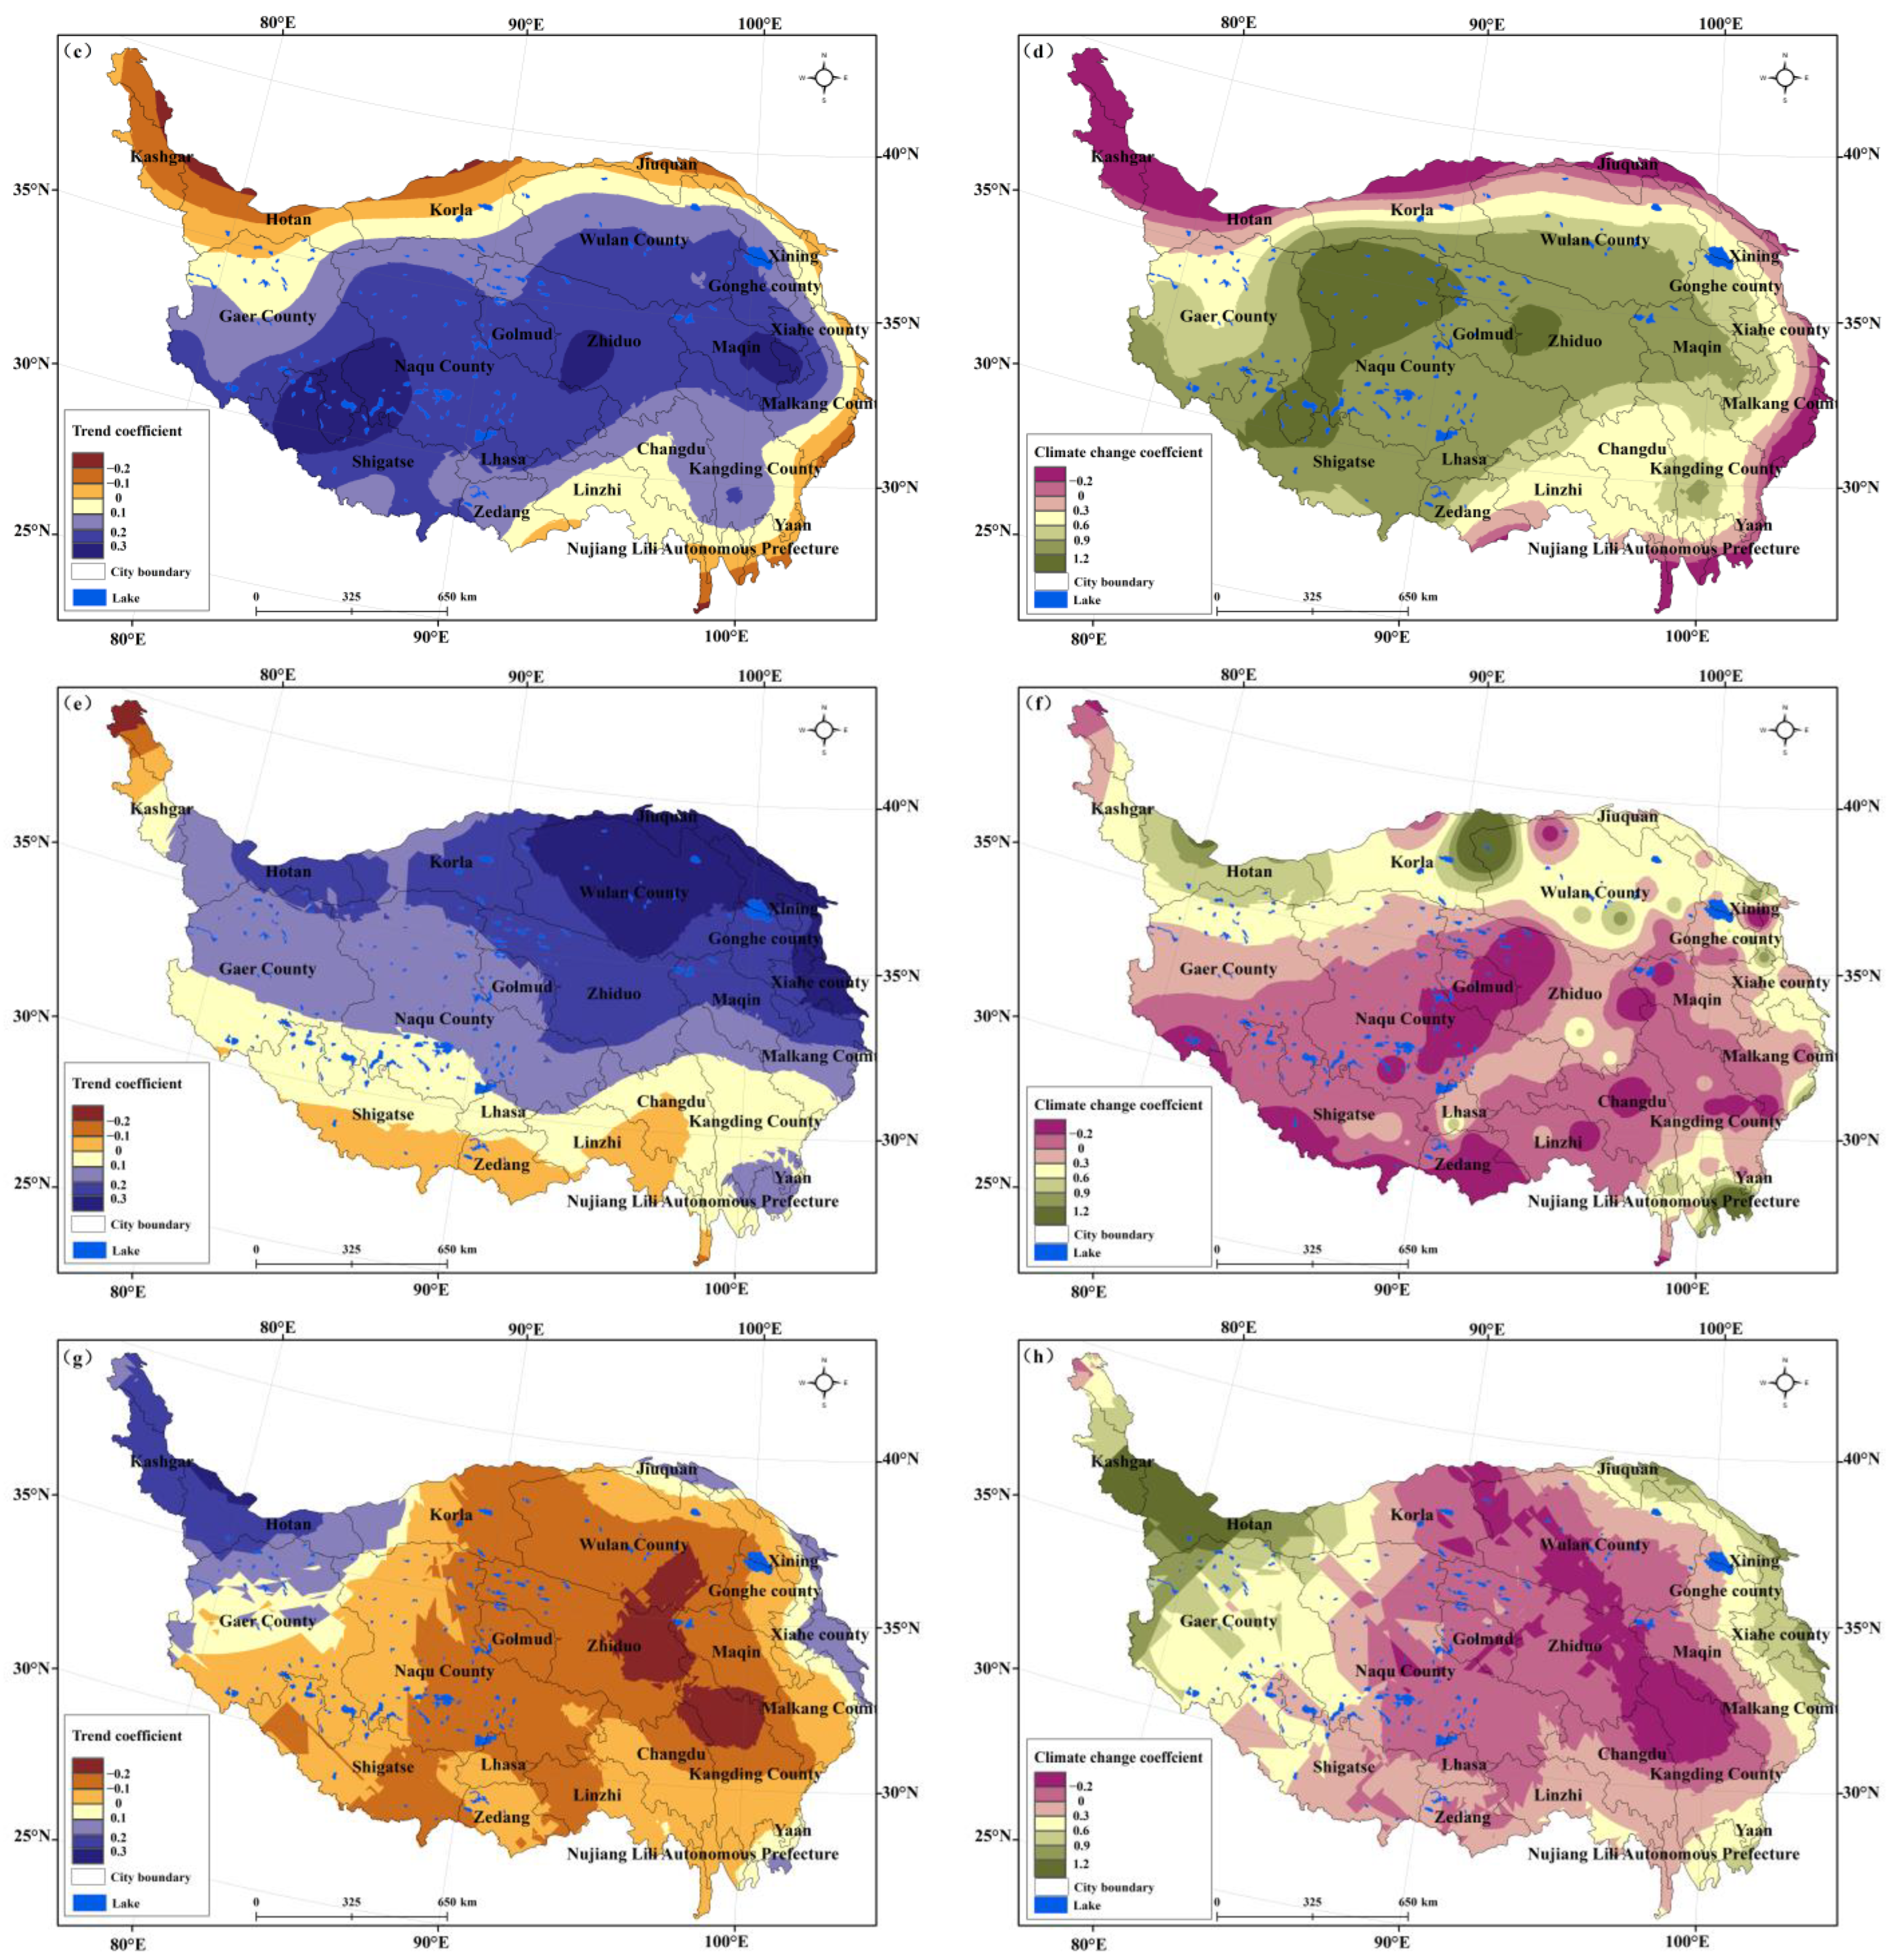
This study shows the climate tendency rate and trend coefficient of the above climatic factors on the QTP, such as annual precipitation and average annual temperature, from 2000 to 2020 (Figure 3). As shown in Figure 3a,b, precipitation on the QTP showed an increasing trend in the northwestern region and a decreasing trend in the southeastern region. Precipitation increased significantly in the boundary zone of Naqu, Geermu, and Zhiduo Counties and the boundary zone of Gar and Naqu Counties. The trend coefficient was greater than 0.3, and the climate tendency rate was higher than 100 mm × 10 a−1. An obvious area of reduced precipitation was formed in the southeastern part of the QTP, with a trend coefficient of less than −0.2 and a climate tendency rate of less than −150 mm × 10 a−1. At the same time, two centers of reduced precipitation were formed in the southeastern parts of Linzhi County and Maerkang County, with a climate tendency rate of less than −100 mm × 10 a−1. As shown in Figure 3c,d, an increasing temperature zone was formed in the central part of the QTP from the middle to the periphery, and its trend coefficient and climate tendency rate were greater than 0. There was an increasing center temperature in the Nagqu–Gar–Shigatse border zone and in the southwestern part of Zhiduo County, with the trend coefficient and climate tendency rate greater than 0.4 and 1.2 °C × 10a−1, respectively. On the edge of the QTP, a zone of reduced temperature was formed, which had a trend coefficient and climate tendency rate of less than 0. As shown in Figure 3e,f, the accumulated temperature (>10 °C) of the QTP decreased from the northeast to the southwest, and the southwest showed a significant decrease in accumulated temperature (>10 °C), with a trend coefficient of less than 0.55 and a climate tendency rate of less than −25 °C·10 a−1. As shown in Figure 3g,h, a zone of reduced sunshine was formed from the middle to the periphery of the central QTP, with a trend coefficient and a climate tendency rate of less than 0. There was a center of reduced sunshine at the boundary zones of Zhiduo County, Geermu City, and Naqu County and of Kangding County and Changdu, with a trend coefficient and a climate tendency rate of less than 0.1 and −25 °C·10 a−1, respectively. In the northwest of the QTP, a zone of increasing sunshine was formed, with the trend coefficient and climate tendency rate greater than 0.
The spatiotemporal evolutions of vegetation NPP were often affected by various climatic factors. Moreover, the effects among multiple climatic factors were non-independent. In this study, the partial correlation coefficient and multiple correlation coefficient, and their significance on the QTP from 2000 to 2020, were calculated pixel-by-pixel.
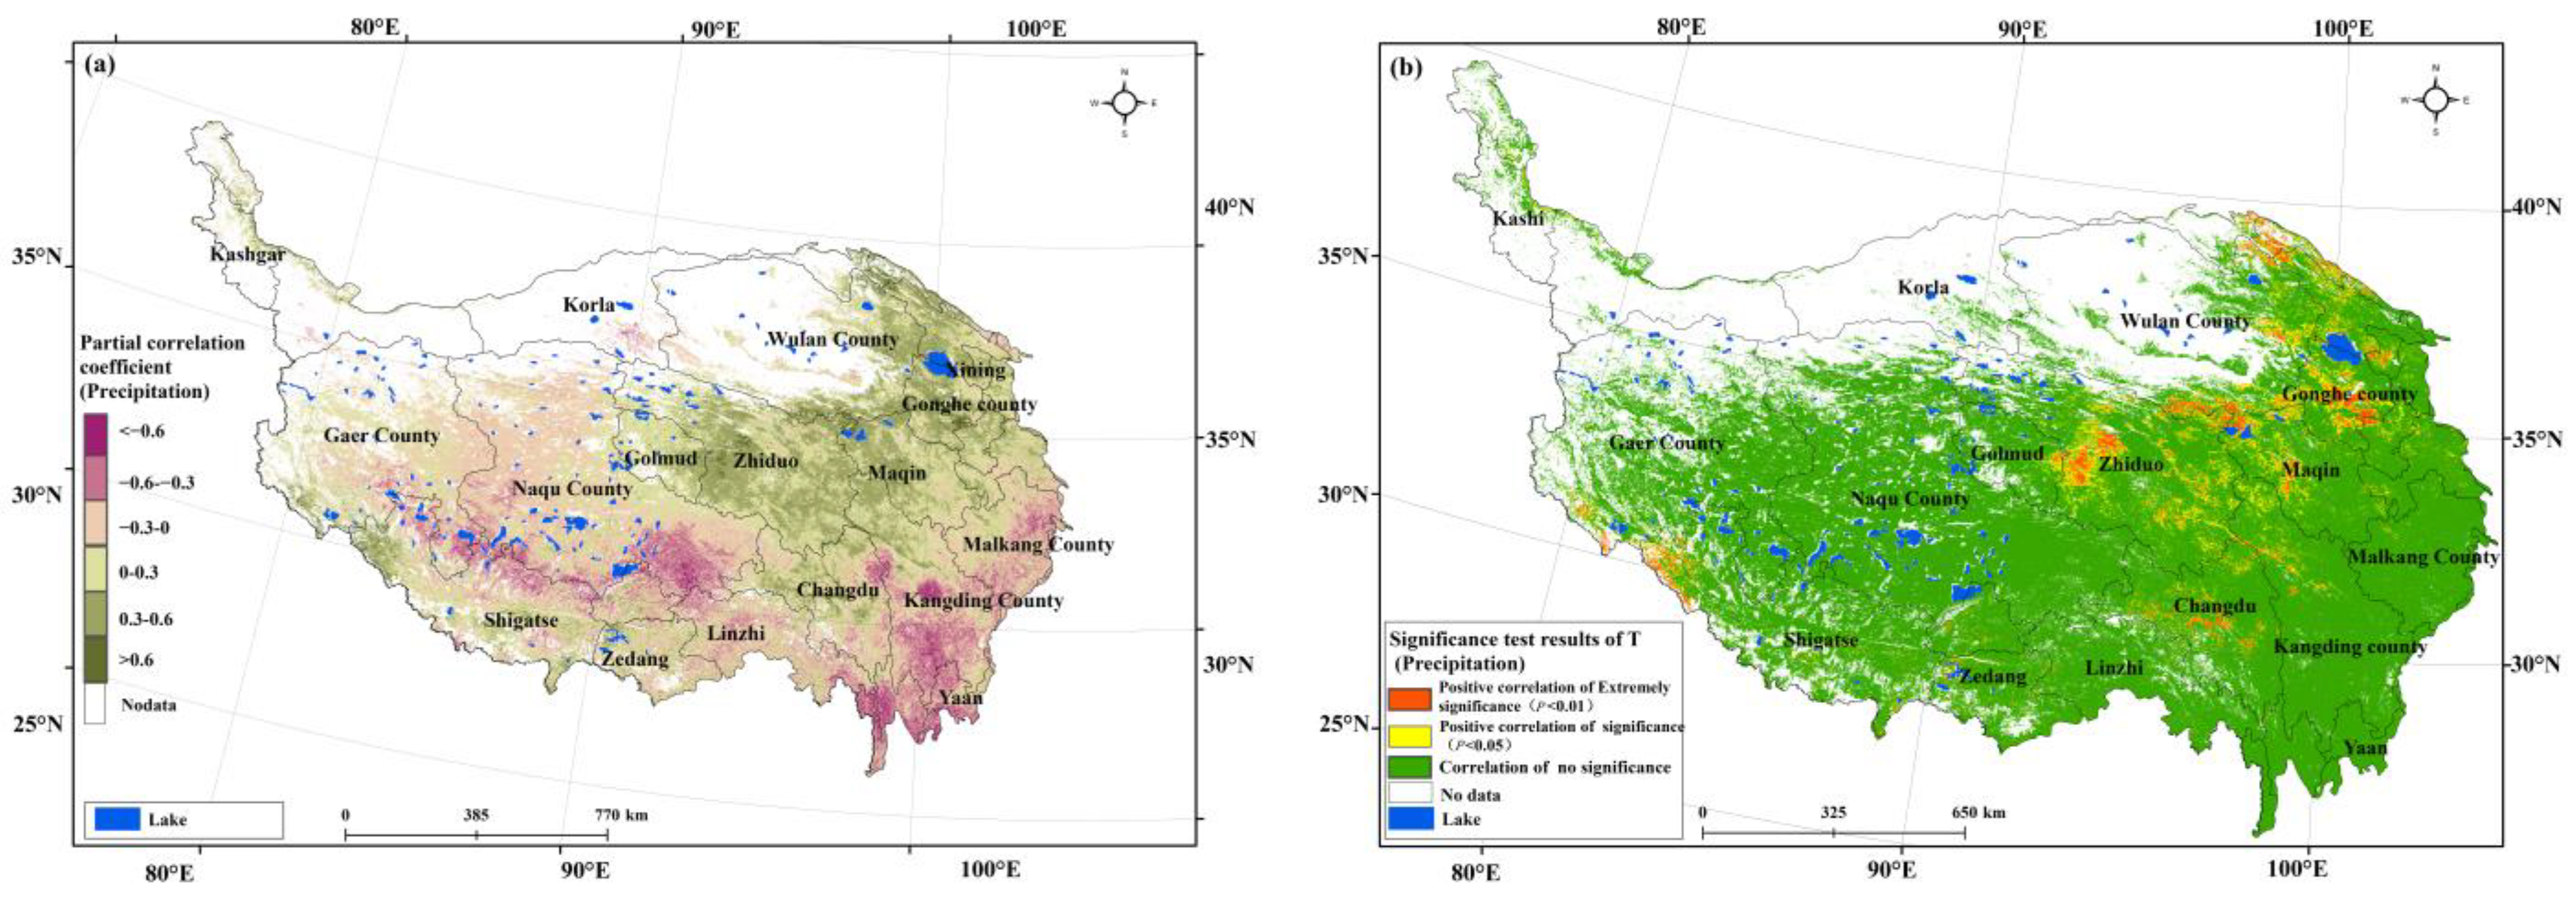
Figure 4a shows that zones with a partial positive correlation between vegetation NPP and annual precipitation were the most widely distributed, accounting for 54.57% of the total area, and were mostly concentered in the northeastern part of the QTP. Zones with a partial negative correlation accounted for 45.43%, and were mostly located in the northern Tibetan Plateau and the Ali Plateau. Figure 4c shows that zones with a positive correlation between vegetation NPP and annual average temperature accounted for 47.13% of the total area, and were mostly concentrated in the eastern part of the QTP and the middle and lower reaches of the Brahmaputra River Basin, and the zones with a negative correlation accounted for 52.87%, and were mostly located in the western part of the Three-Rivers Source region, the upper reaches of the Brahmaputra River Basin, and the southeastern edge of the QTP. At the same time, the partial correlation coefficients of vegetation NPP with annual precipitation and annual average temperature were tested using a T test of significance. The results (Figure 4b,d) show that 15.83% of the regions of the partial correlation coefficients of annual precipitation and vegetation NPP were significant at the p < 0.05 level, and 5.34% of the regions were significant at the p < 0.01 level. Zones with extremely significant correlations were mostly concentrated in the central part of Gonghe County, the southeastern part of Wulan County, the eastern part of Zhiduo County, and the western part of Changdu County. About 12.65% of the regions of the partial correlation coefficient between vegetation NPP and annual average temperature were significant at the p < 0.05 level, and 6.13% of the areas were significant at the p < 0.01 level. Zones with extremely significant correlations were mostly located in the border area of Zedang and Nyingchi Counties, the central part of Changdu County, and the border area of Xining City, Gonghe County, and Tongren County. The multiple correlations between vegetation NPP and temperature and precipitation were tested using an F test of significance. As shown in Figure 4f, 1.43% of the areas were significant at the p < 0.01 level (extremely significant correlation), and 6.91% of the areas were significant at the p < 0.05 level (significant correlation). Zones with extremely significant correlations were mostly concentrated in the northwestern part of Zhiduo County, the middle of Lhasa City, the middle of Changdu, and the middle and southwestern parts of Kangding County.
Figure 5a shows that zones with a positive correlation between vegetation NPP and annual precipitation were the most widely distributed, accounting for 53.33% of the total area, and were mostly concentrated in Tanggula and Qilian Mountains. Zones with a negative correlation accounted for 46.67% of the total area, and were mostly located on the northern Tibetan Plateau, the southeastern QTP, and the Hengduan Mountains. Figure 5c shows that zones with a positive correlation between vegetation NPP and annual sunshine hours accounted for 54.59% of the total area, and were mostly concentrated in the southeastern part of the QTP, the edge of the Hengduan Mountains, and the southern part of the Tanggula Mountains. Zones with a negative correlation accounted for 45.41% of the total area, and were mostly located along the western and southern edge of the northern Tibetan Plateau and the edge of the Qilian Mountains. Meanwhile, a T test of significance was conducted to determine the partial correlation coefficients between vegetation NPP and precipitation and sunshine hours. The results (Figure 5b,d) show that 9.01% of zones with a partial correlation coefficient between vegetation NPP and annual precipitation were significant at the p < 0.05 level, and 3.63% of the regions were significant at the p < 0.01 level. Zones with extremely significant correlations were mostly located in the central and eastern regions of the QTP. About 9.29% of the regions with a partial correlation coefficient between NPP and annual sunshine hours were significant at the p < 0.05 level; 4% of the regions with extremely significant correlations were mostly located in the Hengduan Mountains and the southeastern part of the Lancang River. The multiple correlations between vegetation NPP, annual precipitation, and annual sunshine hours were tested using an F test of significance. As shown in Figure 5f, 2.22% of the regions were significant at the p < 0.01 level (extremely significant correlation test), and 8.99% of the regions were significant at the p < 0.05 level (significant correlation). Zones with extremely significant correlations were mostly located in the southern part of Kangding County, the western part of Yaan City, and the northeastern part of Maerkang County.
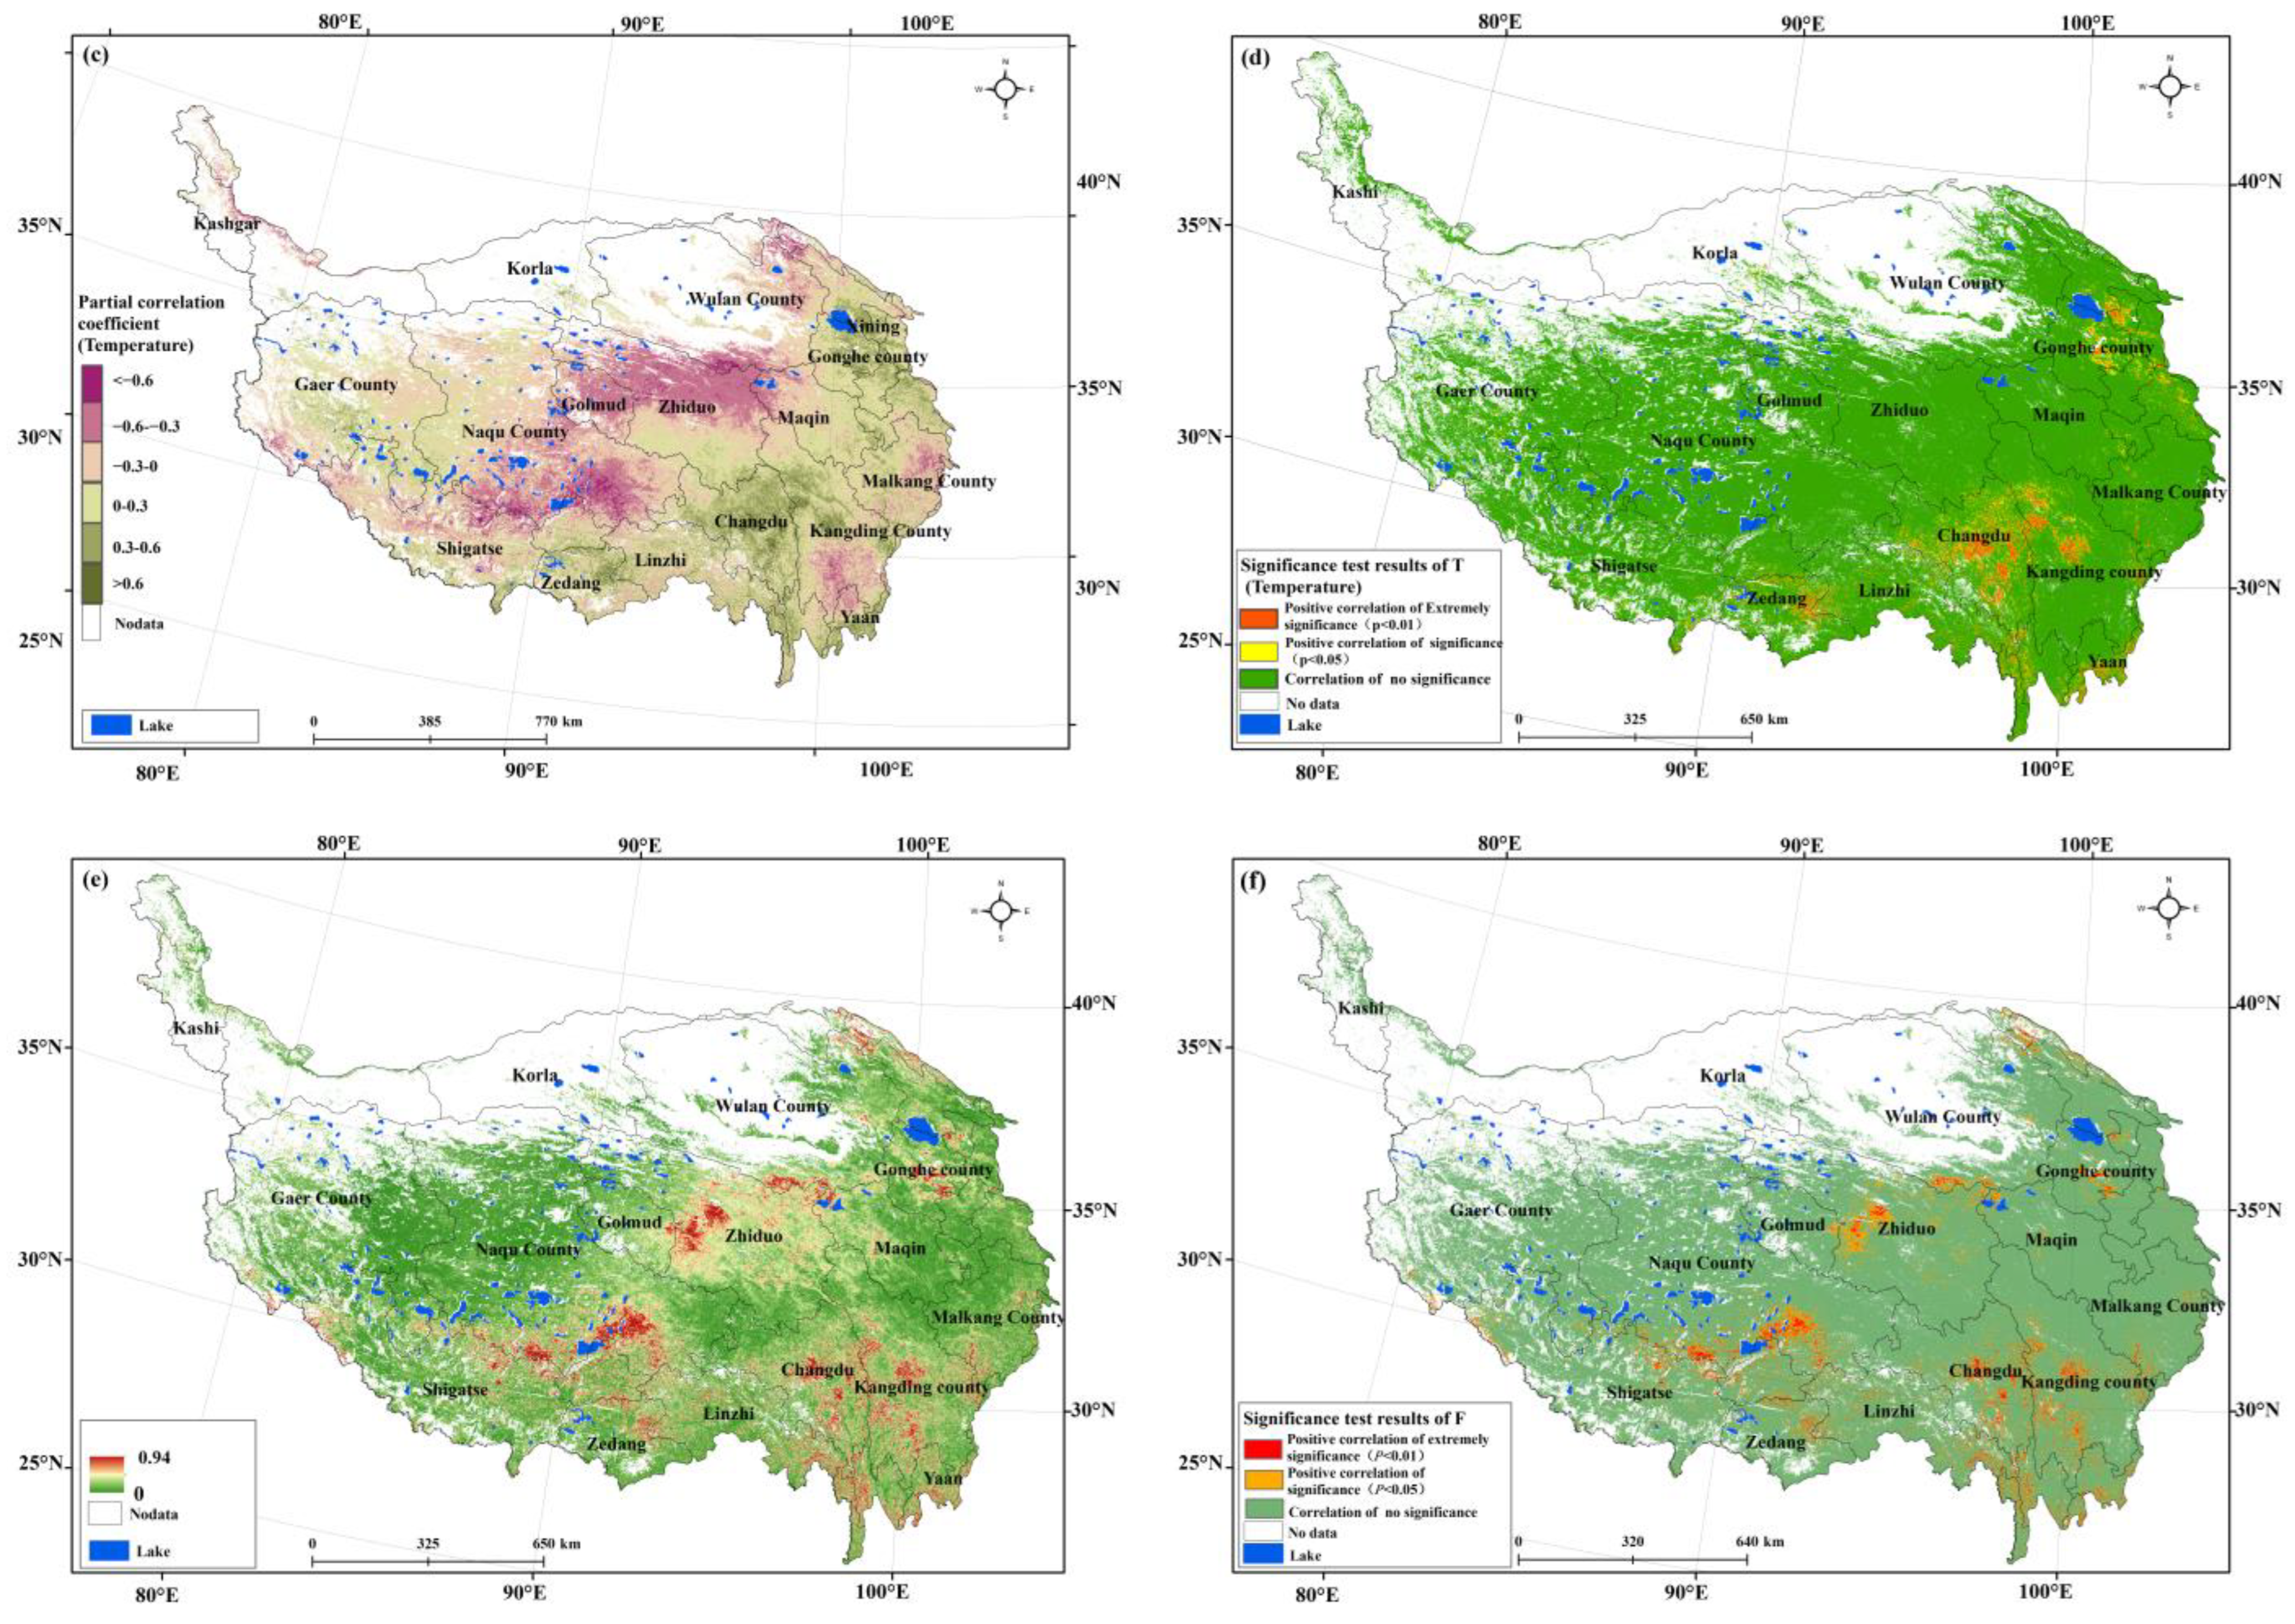
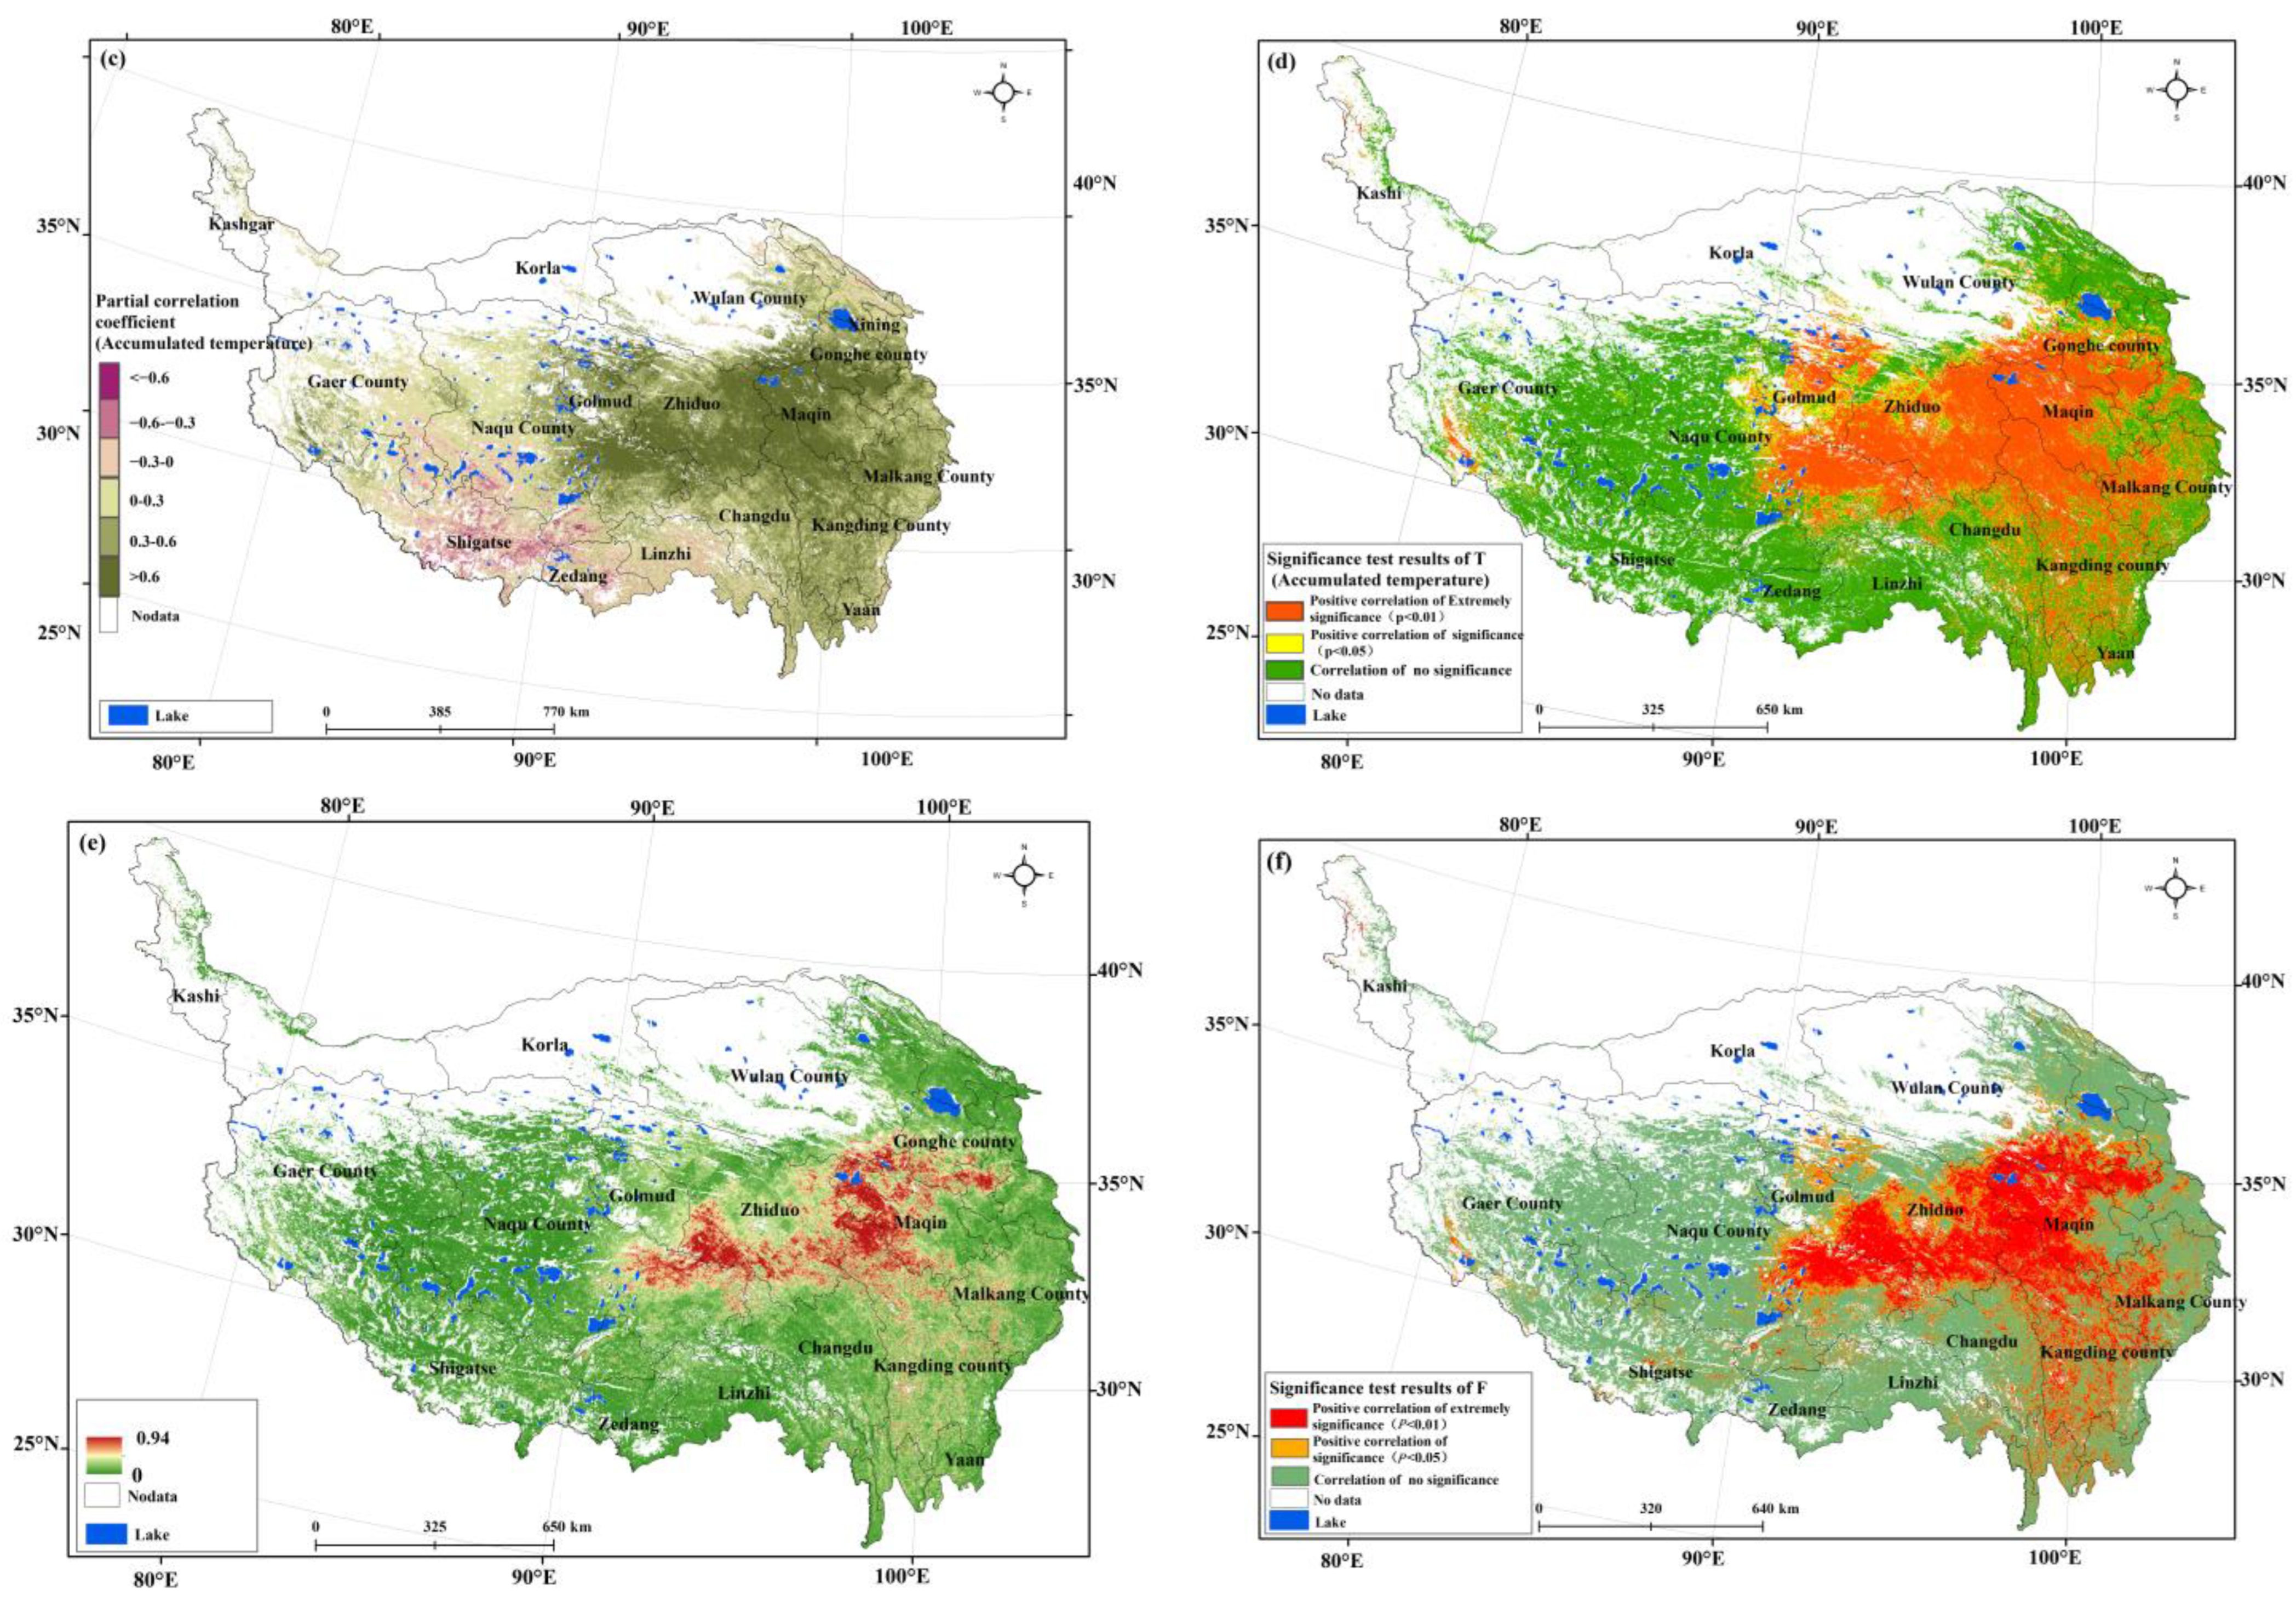
Figure 6a shows that zones with positive correlations between vegetation NPP and annual precipitation accounted for 48.66% of the total area, and were mostly concentrated in the eastern part of the Northern Tibetan Plateau, the Brahmaputra River Basin, and the northeastern part of the Hengduan Mountains. The areas with a negative correlation accounted for 51.34% of the total area, and were mostly located in the eastern and northeastern parts of the QTP. As shown in Figure 6c, the areas with a positive correlation between vegetation NPP and accumulated temperature (>10 °C) accounted for 84.57% of the total area, and were mostly concentrated in the northern and eastern parts of the QTP. Zones with a negative correlation accounted for 15.43% of the total area, and were mostly concentered in the southwestern part of the QTP. At the same time, the partial correlation coefficients of vegetation NPP with precipitation and accumulated temperature (>10 °C) underwent a T test of significance. The results (Figure 6b,d) show that 10.49% of zones with partial correlation coefficients of precipitation were significant at the p < 0.05 level, and 5.36% of the regions were significant at the p < 0.01 level. Zones with extremely significant correlations were mostly located in the southwestern part of Zhiduo County and the northeastern part of Naqu County. About 43.14% of the zones with partial correlation coefficients of accumulated temperature (>10 °C) were significant at the p < 0.05 level, and 30.73% of the regions were significant at the p < 0.01 level. Zones with extremely significant correlations were mostly located along the eastern edge of the northern Tibet Plateau and the central and eastern parts of the QTP. The multiple correlations between vegetation NPP and precipitation and accumulated temperature (>10 °C) were tested using an F test of significance. As shown in Figure 6f, about 17.39% of the zones were significant at the p < 0.01 level (extremely significant correlation test), and 32.07% of the areas were significant at the p < 0.05 level (significant correlation). Zones with extremely significant correlations were mostly concentrated in the southwestern part of Tongren County, Maqin County, the northwestern part of Kangding County, and the northeastern part of Naqu County.
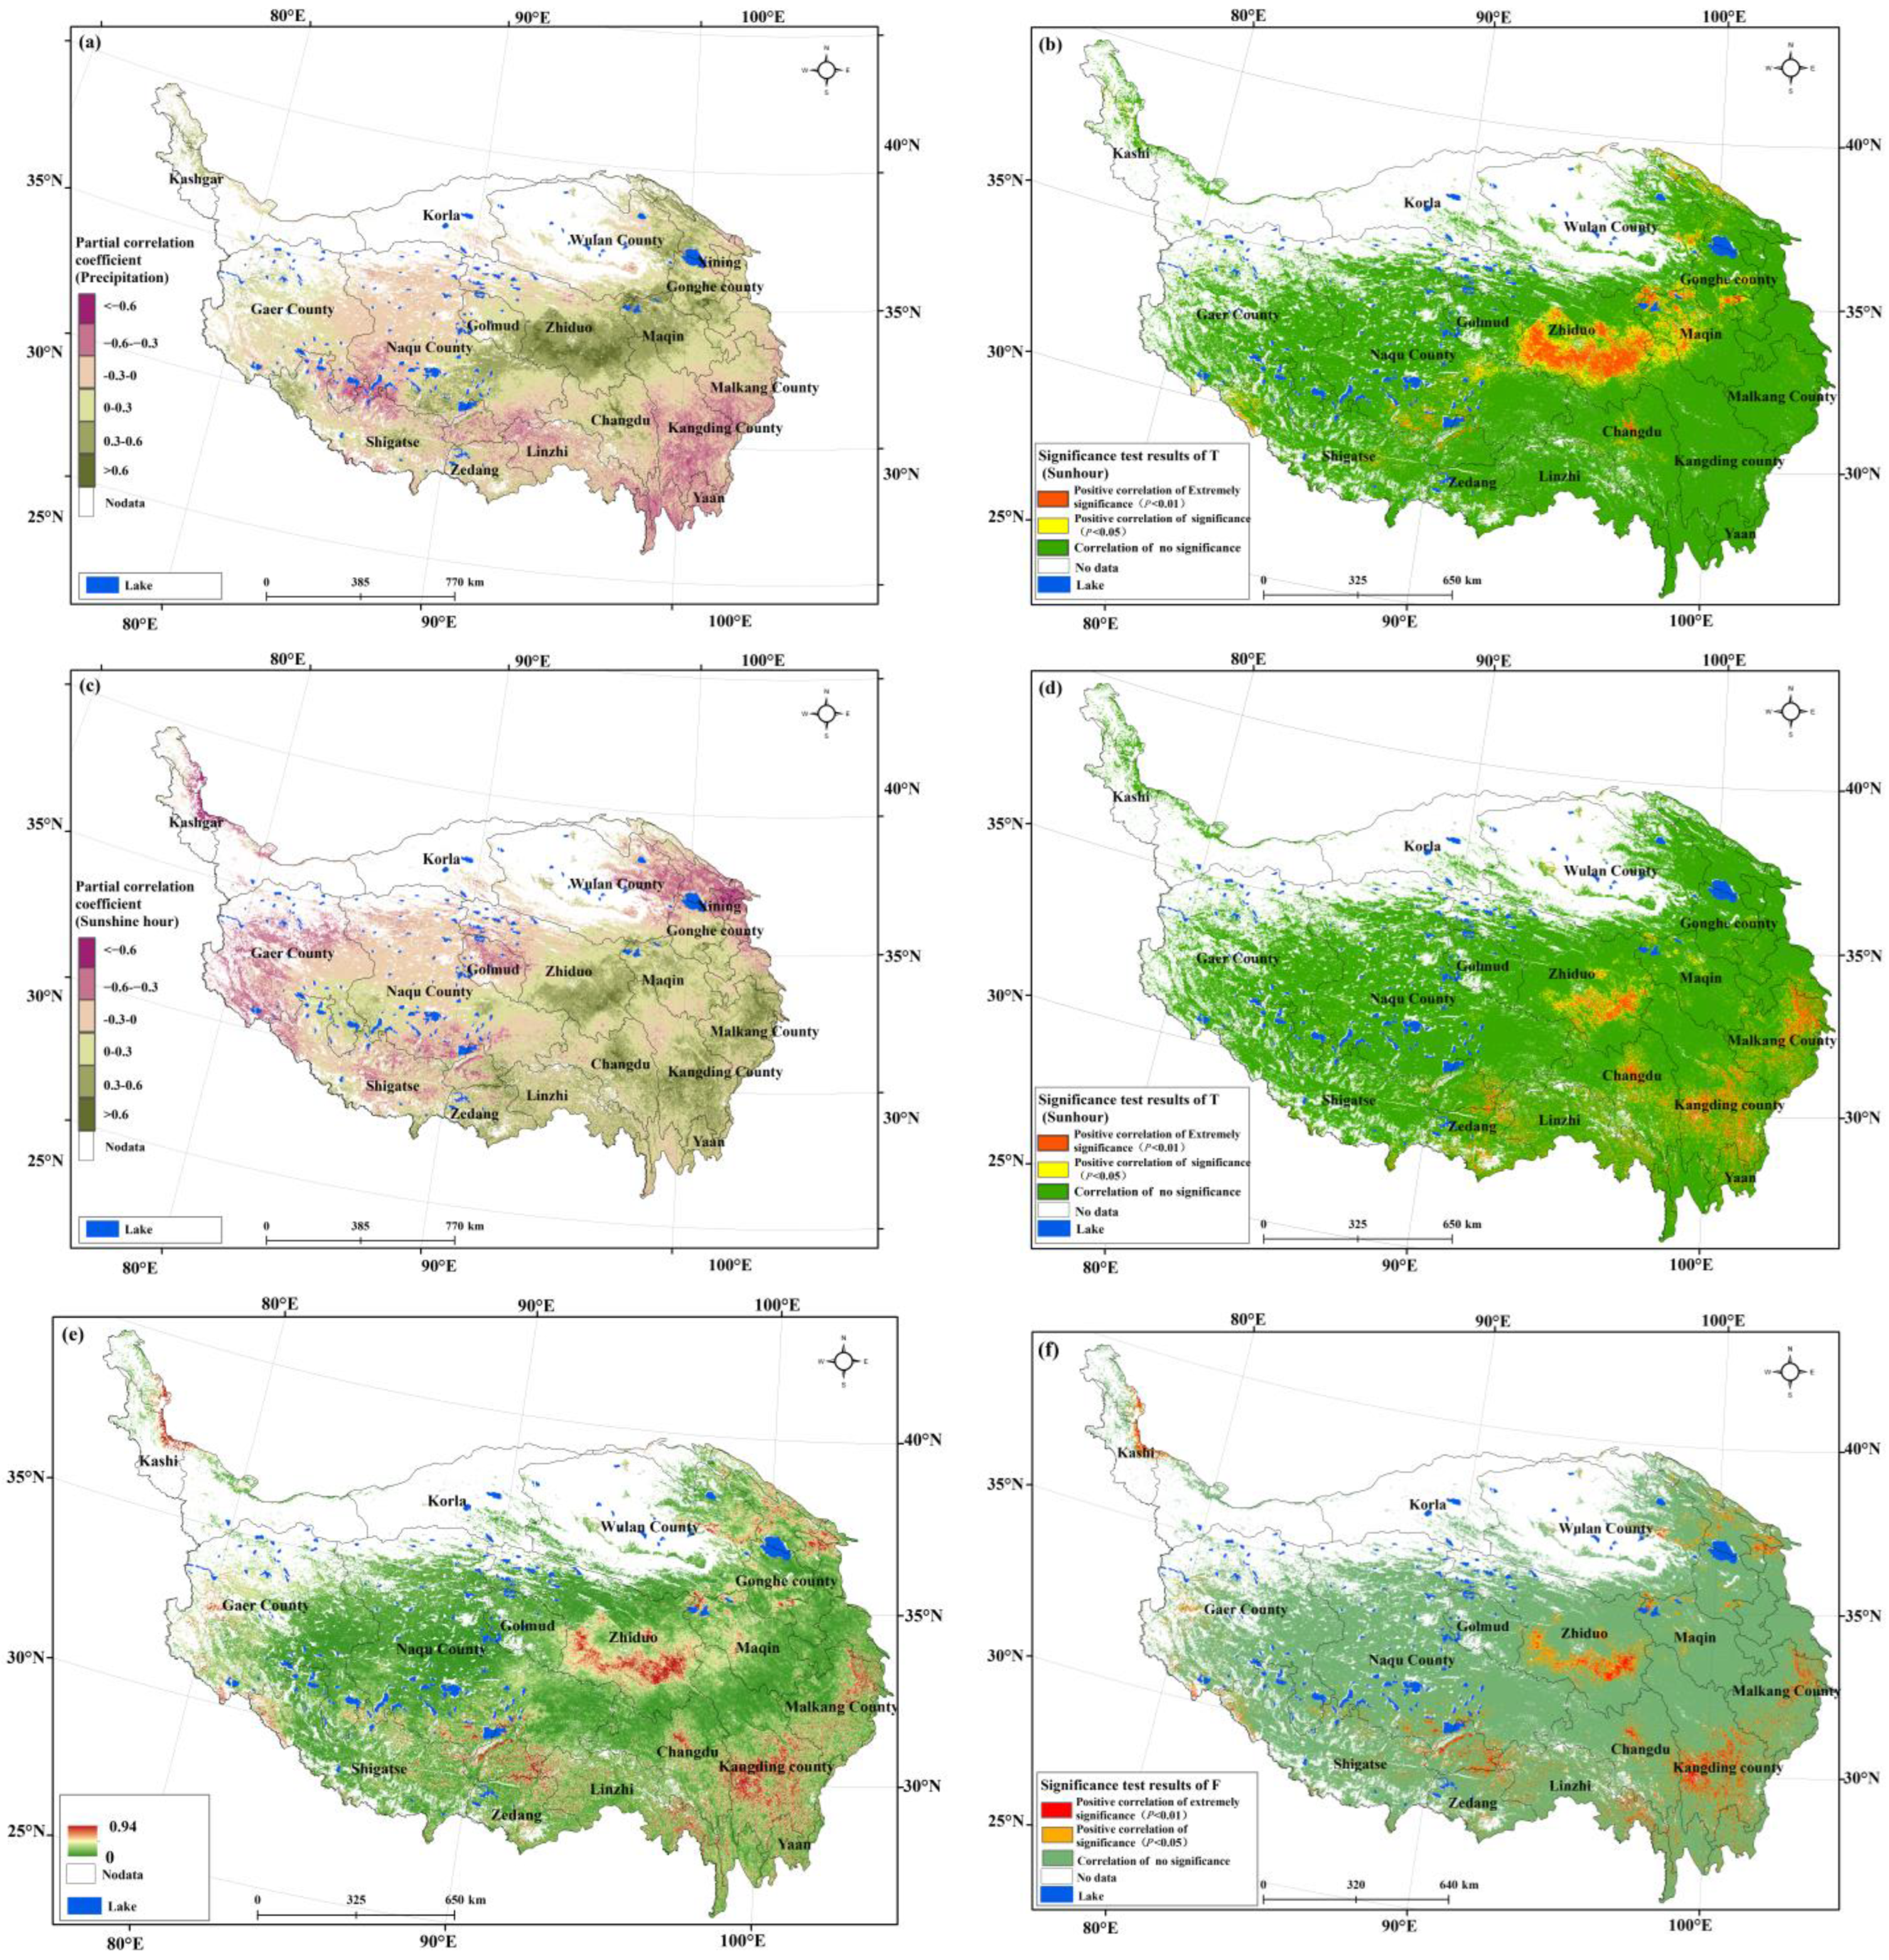
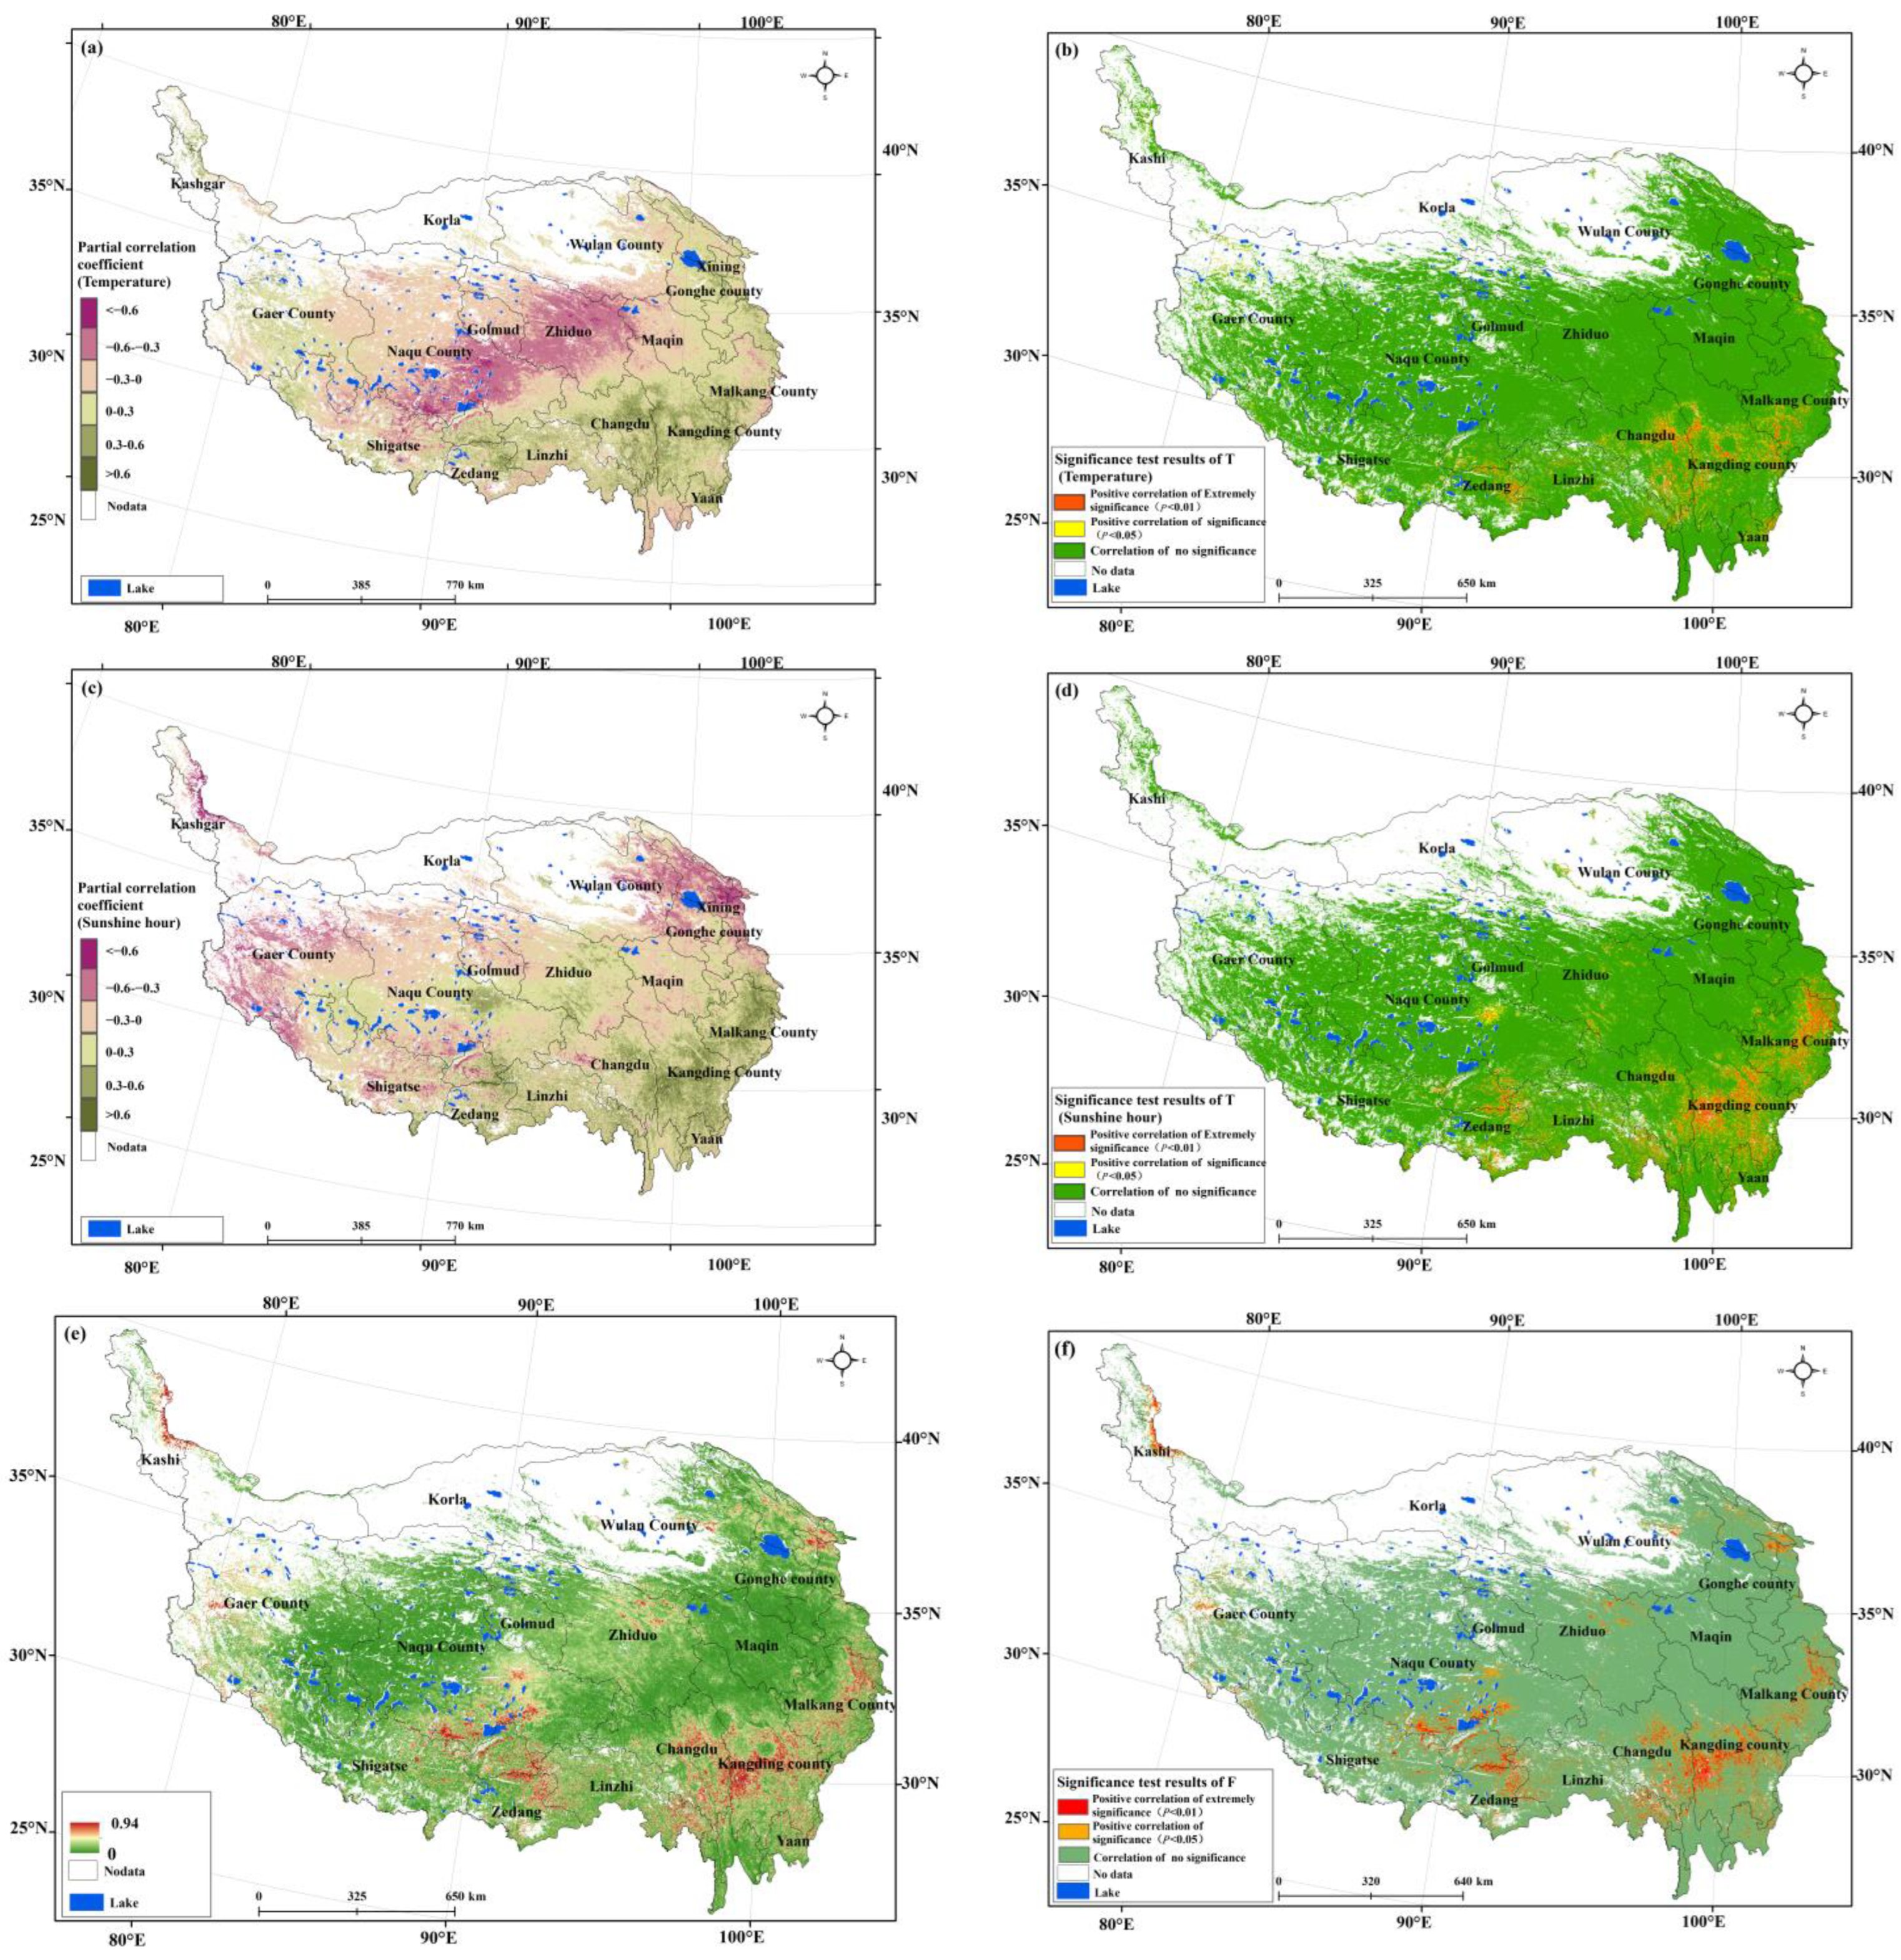
Figure 7a shows that zones with positive correlations between vegetation NPP and annual average temperature had the largest area, accounting for 46.28% of the QTP, and were mostly concentrated in the southern part of the QTP, along the edge of the Qilian Mountains, and along the western edge of the northern Tibetan Plateau. Zones with negative correlation accounted for 53.72% of the total area, and were mainly distributed in Zhiduo County and the southern part of Naqu County. As shown in Figure 7c, zones with a partial positive correlation between vegetation NPP and annual sunshine hours accounted for 50.79% of the total area, and were mostly located in the southern and northern parts of the QTP, along the edge of the Hengduan Mountains, and the southern part of the Tanggula Mountains. Zones with a partial negative correlation accounted for 49.20% of the total area, and were mostly concentrated in Xining City, the western part of Gar County, and the eastern part of Shigatse City. At the same time, the partial correlation coefficients of vegetation NPP with temperature and sunshine were tested using the T test of significance. The results (Figure 7b,d) show that about 7.95% of the zones with partial correlation coefficients of temperature were significant at the p <0.05 level, and 2.24% of the regions were significant at the p < 0.01 level. Zones with extremely significant correlations were mostly located in the northeastern part of Zedang, the eastern part of Changdu, and the central part of Kangding County. About 8.06% of the regions with partial correlation coefficients of sunshine were significant at the p < 0.05 level, and 3.70% of the regions were significant at the p < 0.01 level. Zones with extremely significant correlations were mostly concentrated in the central part of Kangding County and the eastern part of Malkang County. The multiple correlations between vegetation NPP and temperature and sunshine were tested using an F test of significance. As shown in Figure 7f, 2.24% of the zones were significant at the p < 0.01 level (extremely significant correlation test), and 7.95% of the regions were significant at the p < 0.05 level (significant correlation). Zones with extremely significant correlations were mostly located in the central part of Maerkang County, the central part of Kangding County, the southwestern part of Lhasa City, and the southern part of Naqu County.

3.3. Characterization of the Relative Roles of Climate–Human Factors in the Evolution of Vegetation NPP during Different Historical Periods

Climate and human factors both have great impacts on the dynamic changes in vegetation NPP. Therefore, quantitative characterization of the relative roles of climate change and human activity in vegetation changes can be assessed using NPP changes. This study adopted three categories of NPP change: the first was the actual NPP (NPP actual) obtained using MOD17A3H, which represents the result of the combined action of climate and human factors; the second was the potential NPP (NPP potential) obtained using the Miami model, which mainly reflects the impacts of climate change on NPP; and the third reflects the impact of human activity on NPP change (NPPhuman).
The impacts of 350 climate–human factors on NPP were assessed using the slope of potential NPP (Kc) and NPP residual (Kh). If kc was positive, it indicated that climate change had beneficial effects on vegetation growth and restoration; if kc was negative, it indicated that climate change had adverse effects on vegetation growth and restoration. If Kh was positive, it indicated that human activity had beneficial effects on vegetation degradation (Table 1).
The slope (ka) of actual NPP represented the change conditions of vegetation. If ka was positive, it indicated that the vegetation was undergoing a restoration process. If ka was negative, it indicated that the vegetation was undergoing a degradation process. The following table expresses six possible scenarios of NPP change.
Because the contribution rates of climate–human factors to the spatiotemporal evolution of vegetation NPP on the QTP differed greatly between study periods, this study analyzed and quantitatively distinguished the relative roles of climate–human factors in the evolution of vegetation NPP during 2000–2010 and 2010–2020.
Figure 8 shows that zones with vegetation restoration covered the largest area, accounting for 61.65% of the QTP, while the vegetation restoration zones caused by climate change accounted for 37.28%, and were mostly concentrated in the northeastern and central parts of the QTP, such as Xining City, Gonghe City, Xiahe County, and the southeastern part of Golmud City. The vegetation restoration zones caused by human activity accounted for 11.01% of the total area, and were mostly located in the southeastern and central parts of the QTP, including the central part of Golmud City and the southeastern part of Naqu County. The area of vegetation restoration zones promoted by climate change and human activity was smaller, accounting for 12.99% of the total area. Meanwhile, zones of vegetation degradation caused by human activity accounted for 25.23% of the total area, and were mostly concentered in the western part of the northern Tibetan Plateau, the southeastern part of the Himalayas, and the southeastern part of the QTP, in areas such as the southern part of Gar County, Lhasa City, the southeastern parts of Naqu County, Zhiduo County, and Linzhi County, the northwestern part of Changdu, and Kangding County. Zones with vegetation degradation caused by climate change accounted for 10.72% of the total area, and were mainly located in the middle of the northern Tibetan Plateau, in areas such as Naqu County. Zones with vegetation degradation promoted by climate change and human activity covered a smaller area, accounting for 2.4% of the QTP.
Figure 9 shows that zones with vegetation restoration accounted for 57.22% of the QTP, while the vegetation degradation zones accounted for 42.54%, from 2010 to 2020. Zones with vegetation restoration caused by climate change accounted for 19.37% of the total area, and were mostly concentered in the southern part of the northern Tibetan Plateau, the eastern part of the Hengduan Mountains, and the eastern part of the QTP. Zones with vegetation restoration caused by human activity accounted for 35.05% of the total area, and were mainly distributed in the southeastern part of the Tanggula Mountains, the junction of Lancang River and the Tanggula Mountains, and the junction of Jinsha River and the Tanggula Mountains, in areas such as the south of Naqu County, the south of Zhiduo County, and Linzhi County. Zones with vegetation restoration promoted by climate change and human activity only accounted for 2.8% of the total area. Meanwhile, zones with vegetation degradation caused by human activity accounted for 28.67% of the total are, and were mostly located in the central part of the northern Tibetan Plateau, the southeastern part of the Tanggula Mountains, and the Qilian Mountains, in areas such as southern Nagqu County, Golmud City, southeastern Zhiduo County, Maqin County, Tongren County, and northeastern Wulan County. Zones with vegetation degradation caused by climate change accounted for 12.05% of the total area, and were mostly concentrated in the northern–central part of the northern Tibetan Plateau, the western part of the Yellow River Basin, and the eastern part of the Tanggula Mountains, in areas such as the western part of Gar County and the northern part of Naqu County. Zones with vegetation degradation caused by human activity and climate change covered a small area, accounting for 1.82% of the QTP.

4. Discussion

The following can be deduced from the spatial distribution map of different grades of NPP on the Qinghai–Tibet Plateau in Figure 2: Vegetation NPP on the QTP showed a decreasing trend from southeast to northwest [31]. The results of this study are consistent with previous studies. The main reason for this trend was that the southeastern part of the QTP was affected by the warm and humid airflow of the Pacific Ocean and the Indian Ocean. The climate in these regions was humid and rainy, and the vegetation types were diverse, which was conducive to plant photosynthesis [32]. A trend of variation in climate factors on the Qinghai–Tibet Plateau can be seen in Figure 3: From east to west, with increasing altitude, temperature and precipitation decreased. Meanwhile, the vegetation types shifted from forest to grassland and meadow, so vegetation NPP showed a decreasing trend [33]. During the past 20 years, the average annual NPP of the QTP showed an upward trend, especially after 2004. The average vegetation NPP of regional vegetation showed a rapid steep upward slope. The main reason for this trend was that during the past 20 years, the climate of the QTP became warmer and more humid, and the soil moisture showed an increasing trend, which was conducive to the growth and photosynthesis of vegetation [34]. Therefore, vegetation NPP showed an upward trend. In addition, since 2000, policies of returning farmland to grassland and returning grazing land to grassland have been strongly implemented, so forest land and grassland have been significantly restored. Previous studies have found that the increase in NPP on the QTP since 2000 is mainly the result of an increase in grassland NPP, which is consistent with the policy of returning grazing land to grassland.
From Figure 4, Figure 5, Figure 6 and Figure 7, we can obtain the following information: Zones with a significant positive correlation between vegetation NPP and annual precipitation were mostly concentrated in the northeastern part of the QTP and the Three-River Source region. This is because precipitation in these regions was scarce, and the increase in precipitation significantly improved regional hydrothermal conditions, which was conducive to the growth of vegetation [35]. Zones with positive correlations between vegetation NPP and annual average temperature were mainly distributed in the southern part of Tibet and the northern part of the Hengduan Mountains. These regions had higher altitudes and abundant precipitation, but their temperatures were slightly lower (inhibiting the growth of vegetation); thus, the higher the temperature, the better the growth of vegetation (due to strong photosynthesis) [36]. Zones with negative correlations between vegetation NPP and average annual temperature were mostly located in the central and northern parts of the QTP. The main reason was that precipitation in these zones was scarce. Although the temperature rise was conducive to plant photosynthesis, it also aggravated regional droughts, which inhibited vegetation growth [37]. Zones with significant positive correlations between NPP and annual sunshine hours were mostly located southeast of the QTP, along the edge of the Hengduan Mountains, and in the southern part of the Tanggula Mountains. The reason lies in these regions having sufficient hydrothermal conditions and cloudy and rainy weather. Therefore, solar radiation has become a key factor in determining vegetation photosynthesis [38]. Zones with significant negative correlations with annual sunshine hours were mainly distributed in the western and southern marginal areas of the northern QTP and the marginal areas of the Qilian Mountains. The main reason for this was that precipitation in this area was scarce, and the increase in sunshine duration increased the evaporation of surface soil moisture, which led to a certain degree of drought and inhibited the growth of vegetation [39]. Zones with significant positive correlations between NPP and accumulated temperature (>10 °C) were mainly concentrated in the northern and eastern parts of the QTP. This is because these zones had sufficient precipitation, high altitudes, and lower temperatures, and rises in temperature are conductive to photosynthesis in vegetation [40]. Zones with negative correlations between NPP and accumulated temperature (>10 °C) were mostly concentrated in the southwestern part of the QTP. In this area, precipitation was scarce, and the increase in accumulated temperature (>10 °C) led to a certain degree of drought in the region, which was not suitable for the growth of vegetation [41].
During 2000–2020, the contribution rates of climate–human factors to the evolution of vegetation NPP differed between study periods [42]. The relative role of climate–human interaction in the evolution of vegetation NPP from 2000 to 2010 can be seen in Figure 8. During 2000–2010, zones with vegetation restoration caused by climate change had the largest area, accounting for 37.28% of the QTP, and were mainly distributed in the northeastern and central parts of the QTP [43]. The main reason for this was that during the processes of climate warming and wetting, the regional precipitation and temperature increased, which greatly improved the vegetation growth environment and contributed to the increase in vegetation NPP [44]. The relative role of climate–human interaction in the evolution of vegetation NPP during 2010–2020 can be seen in Figure 9. During 2010–2020, zones with vegetation restoration caused by human activity had the largest area, accounting for 35.05% of the QTP, and were mostly located in the southeastern part of the Tanggula Mountains, the junction of Lancang River and the Tanggula Mountains, and the junction of Jinsha River and the Tanggula Mountains. This is because with the strong implementation of the policy of returning farmland to forest and grassland, regional vegetation had been rapidly restored [45,46].

5. Conclusions

Based on MOD17A3H, this study explored and discussed the spatiotemporal variation patterns of vegetation NPP on the QTP from 2000 to 2020; then, we quantitatively distinguished the relative roles of climate–human factors in the process of vegetation NPP change during different historical periods. The main conclusions were as follows:
(1) From 2000 to 2020, zones with incasing vegetation NPP (10–30%) covered the largest area, and were mainly located in the Three-Rivers Source area and the northern Hengduan Mountains. The areas of NPP reduction (change rate < −10%) were mainly distributed in the upper reaches of the Yarlung Zangbo River and the Ali Plateau.
(2) From 2000 to 2020, zones with significant positive correlations between vegetation NPP and annual precipitation were mostly concentrated in the northeastern part of the QTP and the Three-Rivers Source region, while zones with positive correlations between vegetation NPP and annual average temperature were mostly located in southern Tibet and the northern part of the Hengduan Mountains. Zones with significant positive correlations between NPP and annual sunshine hours were mostly concentrated in the southeastern part of the QTP, along the edge of the Hengduan Mountains, and in the southern part of the Tanggula Mountains, while zones with significant positive correlation between NPP and accumulated temperature (>10 °C) were mainly concentrated in the northern and eastern parts of the QTP.
(3) From 2000 to 2020, there were obvious differences in the influencing roles of climate–human factors in the evolution of vegetation NPP in the different study regions. During 2000–2010, zones with vegetation restoration caused by climate change covered the largest area, accounting for 37.28% of the QTP. Areas with vegetation degradation caused by human activity were the most widely distributed, accounting for 25.23% of the total area, while during 2010–2020, zones with vegetation restoration caused by human activity covered the largest area, accounting for 35.05% of the QTP. The area of vegetation degradation caused by human activity was the largest, accounting for 28.67% of the QTP.

Author Contributions

Conceptualization, methodology, and writing—original draft preparation, X.Y. Investigation, supervision, project administration, and funding acquisition, B.G. and M.L. B.G. and M.L. contributed to this paper equally as corresponding authors. All authors have read and agreed to the published version of the manuscript.

Funding

This research was funded by Natural Science Foundation of Shandong Province, grant number ZR2021MD047; Scientific Innovation Project for Young Scientists in Shandong Provincial Universities, grant number 2022KJ224; National Natural Science Foundation of China, grant number 42101306; the Fundamental Research Funds for Central Non-profit Scientific Institution, grant number 1610132020016; Project of Special Investigation on Basic Resources of Science and Technology, grant number 2019FY202501; Agricultural Science and Technology Innovation Program, grant number CAAS-ZDRW202201; a grant from State Key Laboratory of Resources and Environmental Information System; and the Strategic priority research program of the Chinese Academy of Sciences, grant number XDA2002040203.

Data Availability Statement

Not applicable.

Conflicts of Interest

The authors declare no conflict of interest.

References

  1. Liu, Y.Y.; Yang, Y.; Wang, Q.; Du, X.L.; Li, J.L.; Gang, C.C.; Zhou, W.; Wang, Z.Q. Evaluating the responses of net primary productivity and carbon use efficiency of global grassland to climate variability along an aridity gradient. Sci. Total Environ. 2019, 652, 671–682. [Google Scholar] [CrossRef] [PubMed]
  2. Wang, Z.; Zhong, J.; Lan, H.; Wang, Z.; Sha, Z. Association analysis between spatiotemporal variation of net primary productivity and its driving factors in inner Mongolia, China during 1994–2013. Ecol. Indic. 2019, 105, 355–364. [Google Scholar] [CrossRef]
  3. Li, M.L.; Yin, L.C.; Zhang, Y.; Su, X.K.; Liu, G.H.; Wang, X.F.; Ao, Y.; Wu, X. Spatio-temporal dynamics of fractional vegetation coverage based on MODIS-EVI and its driving factors in Southwest China. Acta Ecol. Sin. 2021, 41, 1138–1147. [Google Scholar]
  4. Yang, Y.H.; Pu, S.L. Variations in Grassland Vegetation Cover in Relation to Climatic Factors on the Tibetan Plateau. Chin. J. Plant Ecol. 2006, 30, 1–8. [Google Scholar]
  5. Yuan, Z.; Wang, Y.Q.; Xu, J.J. Effects of climatic factors on the net primary productivity in the source region of Yangtze River, China. Sci. Rep. 2021, 11, 1376. [Google Scholar] [CrossRef]
  6. Shao, J.H.; Li, J.; Yan, X.G.; Ma, T.Y.; Zhang, R. Analysis of spatiotemporal variation characteristics and driving forces of NPP in Shanxi Province from 2000 to 2020 Based on Geodetector. Environ. Sci. 2023, 44, 312–322. [Google Scholar]
  7. Jia, J.H.; Liu, H.Y.; Lin, Z.S. Multi-time scale changes of vegetation NPP in six provinces of northwest China and their responses to climate change. Acta Ecol. Sin. 2019, 39, 5058–5069. [Google Scholar]
  8. Liu, L.; Guan, J.Y.; Mu, C.; Han, W.Q.; Qiao, X.L.; Zheng, J.H. Spatio-temporal characteristics of vegetation net primary productivity in the Ili River Basin from 2008 to 2018. Acta Ecol. Sin. 2022, 42, 4861–4871. [Google Scholar]
  9. He, Q.; Yang, X.Q.; Dai, X.A. Variation Characteristics and Influence Factors of Net Primary Productivity of Vegetation in the Three-River Headwaters Region from 2010 to 2015. J. Yangtze River Sci. Res. Inst. 2020, 37, 59–66. [Google Scholar]
  10. Zhang, Z.Y.; Zhong, R.S.; Li, X.Y.; Sun, H. Change of NPP and Its Response to Drought in Northwest China. Res. Environ. Sci. 2019, 32, 431–439. [Google Scholar]
  11. Wang, T.; Zhao, Y.Z.; Wang, H.; Cao, Y.N.; Peng, J.; Cao, Y.N. Spatial and temporal changes of vegetation index and their response to temperature and precipitation in the Tibetan Plateau based on GIMMS NDVI. J. Glaciol. Geocryol. 2020, 42, 641–652. [Google Scholar]
  12. Shi, X.L.; Yang, Z.Y.; Wang, Q.S.; Gao, J.; Hu, Y. Spatial and temporal variation of net primary productivity and its relationship with climate factors in the Chinese Loess. Plateau. Chin. J. Agrometeorol. 2016, 37, 445–453. [Google Scholar]
  13. Mu, S.J.; Li, J.L.; Zhou, W.; Yang, H.F.; Zhang, C.B.; Ju, W.M. Spatial-temporal distribution of net primary productivity and its relationship with climate factors in Inner Mongolia from 2001 to 2010. Acta Ecol. Sin. 2013, 33, 3752–3764. [Google Scholar]
  14. Ma, B.X.; Jing, J.L.; Xu, Y. Study on the spatial and temporal variation of vegetation NPP and its relationship with climate change in Yunnan-Guizhou-Guangxi karst area from 2000 to 2019. Ecol. Environ. Sci. 2021, 30, 2285–2293. [Google Scholar]
  15. Sun, Z.J.; Xie, S.Y. Spatio temporal variation in net primary productivity and factor detection in Yunan Province based on Geodetector. Chin. J. Ecol. 2021, 40, 3836–3848. [Google Scholar]
  16. Wen, Y.; Liu, X.; Bai, Y.; Sun, Y.; Yang, J.; Lin, K.; Pei, F.; Yan, Y. Determining the impacts of climate change and urban expansion on terrestrial net primary production in China. J. Environ. Manag. 2019, 240, 75–83. [Google Scholar] [CrossRef] [PubMed]
  17. Guo, B.; Yang, F.; Fan, Y.W.; Zang, W.Q. The dominant driving factors of rocky desertification and their variations in typical mountainous karst areas of Southwest China in the context of global change. Catena 2023, 220, 106674. [Google Scholar] [CrossRef]
  18. Zhang, J.; Yuan, M.S.; Zhang, J.; Li, H.W.; Wang, J.Y.; Zhang, X.; Ju, P.J.; Jiang, H.B.; Chen, H.; Zhu, Q.A. Responses of the NDVI of alpine grasslands on the Qinghai-Tibetan Plateau to climate change and human activities over the last 30 years. Acta Ecol. Sin. 2020, 40, 6269–6281. [Google Scholar]
  19. Lu, Q.; Wu, S.H.; Zhao, D.S. Variations in Alpine Grassl Cover and Its Correlation with Climate Variabl es on the Qinghai-Tibet Plateau in 1982-2013. Sci. Geogr. Sin. 2017, 37, 292–300. [Google Scholar]
  20. Pu, S.L.; Fang, J.Y. Seasonal Changes in Vegetation Activity in Response to Climate Changes in China between 1982 and 1999. Acta Geogr. Sin. 2003, 58, 119–125. [Google Scholar]
  21. Wang, J.; He, H.J.; Dong, J.F.; Huo, B. Spatio-temporal distribution of vegetation net primary productivity in the Yellow River Basin in 2000–2019 and its natural driving factors. J. Desert Res. 2021, 41, 213–222. [Google Scholar]
  22. Liu, Z.Y.; Zhang, J.; Chen, L. The Latest Change in the Qinghai-Tibetan Plateau Vegetation Index and Its Relationship with Climate Factors. Clim. Environ. Res. 2017, 22, 289–300. [Google Scholar]
  23. Li, L.H.; Zhang, Y.L.; Wu, J.S.; Li, S.C.; Zhang, B.H.; Zu, J.X.; Zhang, H.M.; Ding, M.J.; Paudel, B. Increasing sensitivity of alpine grasslands to climate variability along an elevational gradient on the Qinghai-Tibet Plateau. Sci. Total. Environ. 2019, 678, 21–29. [Google Scholar] [CrossRef] [PubMed]
  24. Guo, B.; Lu, M.; Fan, Y.W.; Wu, H.W.; Yang, Y.; Wang, C.L. A novel remote sensing monitoring index of salinization based on three dimensional feature space model and its application in the Yellow River Delta. Geomat. Nat. Haz. Risk. 2023, 14, 95–156. [Google Scholar] [CrossRef]
  25. Xiong, Q.L.; Xiao, Y.; Halmy, M.W.A.; Dakhil, M.A.; Liang, P.H.; Liu, C.G.; Zhang, L.; Pandey, B.; Pan, K.W.; El Kafraway, S.B.; et al. Monitoring the impact of climate change and human activities on grassland vegetation dynamics in the northeastern Qinghai-Tibet Plateau of China during 2000–2015. J. Arid. Land. 2019, 11, 637–651. [Google Scholar] [CrossRef]
  26. Wei, Y.Q.; Lu, H.Y.; Wang, J.N.; Sun, J.; Wang, X.F. Responses of vegetation zones, in the Qinghai-Tibetan Plateau, to climate change and anthropogenic influences over the last 35 years. Pratacultural Sci. 2019, 36, 1163–1176. [Google Scholar]
  27. Yu, G.R.; Yang, M. Ecological economics foundation research on ecological values, ecological asset management, and value realization: Scientific concepts, basic theories, and realization paths. Chin. J. Appl. Ecol. 2022, 33, 1153–1165. [Google Scholar]
  28. Zhang, L.N. Dynamic changes of land use and ecosystem services value in Altai Mountains. Chin. J. Soil Sci. 2022, 53, 1286–1294. [Google Scholar]
  29. Liu, Y.F.; Guo, B.; Lu, M.; Zang, W.Q.; Yu, T.; Chen, D.H. Quantitative distinction of the relative actions of climate change and human activities on vegetation evolution in the Yellow River Basin of China during 1981–2019. J. Arid. Land. 2023, 15, 91–108. [Google Scholar] [CrossRef]
  30. Yang, D.; Wang, X.F. Contribution of climatic change and human activities to changes in net primary productivity in the Loess Plateau. Arid Zone Res. 2022, 39, 584–593. [Google Scholar]
  31. Jing, H.C.; Liu, Y.H.; He, P.; Zhang, J.Q.; Dong, J.Y.; Wang, Y. Spatial heterogeneity of econsystem services and it’s influencing factors in typical areas of the Qinghai-Tibet Plateau: A case study of Nagqu City. Acta Ecol. Sin. 2022, 42, 2657–2673. [Google Scholar]
  32. Wang, Q.; Zeng, J.; Leng, S.; Fan, B.; Tang, J.; Jiang, C.; Huang, Y.; Zhang, Q.; Qu, Y.; Wang, W.; et al. The effects of air temperature and precipitation on the net primary productivity in China during the early 21st century. Front. Earth Sci. 2018, 12, 818–833. [Google Scholar] [CrossRef]
  33. Zhang, Y.M.; Lang, M.F.; Liu, M.Y.; Xie, B.N.; Chang, Q.R. Vegetation carbon sequestration in the Loess Plateau under the synergistic effects of land cover change and elevations. Acta Ecol. Sin. 2022, 42, 3897–3908. [Google Scholar]
  34. Yu, Y.; Guo, B.; Wang, C.L.; Zang, W.Q.; Huang, X.Z.; Wu, Z.W.; Xu, M.; Zhou, K.D.; Li, J.L.; Yang, Y. Carbon storage simulation and analysis in Beijing Tianjin Hebei region based on CA plus model under dual carbon background. Geomat. Nat. Haz. Risk. 2023, 14, 2173661. [Google Scholar] [CrossRef]
  35. Du, R.H.; Wu, J.J.; Feng, T.; Yang, J.H.; Han, X.Y.; Chen, M.; Zhao, B.Y.; Lin, J.Y. Reversal of soil moisture constraint on vegetation growth in North China. Sci. Total Environ. 2023, 865, 161246. [Google Scholar] [CrossRef]
  36. Shi, L.P.; Meng, D.C.; An, P.C. Altitude and temperature dependence of change in the spring vegetation green-up date from 1982 to 2006 in the Qinghai-Xizang Plateau. Agric. Forest. Meteopol. 2011, 151, 1599–1608. [Google Scholar]
  37. Lan, X.; Sun, H.; Xu, Y. Spatial and temporal pattern of vegetation NPP variations in Guizhou and its response to climate change. Anhui Agric. Sci. Bull. 2020, 26, 162–166. [Google Scholar]
  38. Xu, X.K.; Chen, H.; LEVY, J.K. Spatio-temporal changes and causes of vegetation cover characteristics in the Qinghai-Tibet Plateau under the background of climate warming. Chin. Sci. Bull. 2008, 53, 456–462. [Google Scholar]
  39. An, S.; Chen, X.; Zhang, X.; Lang, W.; Ren, S.; Xu, L. Precipitation and Minimum Temperature are Primary Climatic Controls of Alpine Grassland Autumn Phenology on the Qinghai-Tibet Plateau. Remote. Sens. 2020, 12, 431. [Google Scholar] [CrossRef]
  40. Zhang, R.; Liu, Y.X.; Zhao, S.; Fu, B.J. Chinese urban residents’ willingness to pay for ecosystem service of the Tibetan Plateau: A case study of 27 cities in China. J. Nat. Resour. 2020, 35, 563–575. [Google Scholar]
  41. Bao, G.; Chen, J.Q.; Chopping, M.; Bao, Y.H.; Bayarsaikhan, S.; Dorjsuren, A.; Tuya, A.; Jirigala, B.; Qin, Z.H. Dynamics of net primary productivity on the MongolianPlateau: Joint regulations of phenology and drought. Int. J. Appl. Earth Obs. Geoinf. 2019, 81, 85–97. [Google Scholar]
  42. Chen, S.T.; Guo, B.; Yang, F.; Han, B.M.; Fan, Y.W.; Yang, X.; He, T.L.; Liu, Y.; Yang, W.N. Spatial and temporal patterns of NPP and its response to climate change in the Qinghai-Tibet Plateau from 2000 to 2015. J. Nat. Resour. 2020, 35, 2511–2527. [Google Scholar] [CrossRef]
  43. Zhuo, G.; Chen, S.R.; Zhou, B. Spatio-temporal variation of vegetation coverage over the Tibetan Plateau and its responses to climatic factors. Acta Ecol. Sin. 2018, 38, 3208–3218. [Google Scholar]
  44. Yang, D.; Yi, G.H.; Zhang, Y.B.; Li, J.J.; Qin, Y.B.; Wen, B.; Liu, Z.Y. Spatiotemporal variation and driving factors of growing season NDVI in the Tibetan Plateau, China. Chin. J. Appl. Ecol. 2021, 32, 1361–1372. [Google Scholar]
  45. Guo, B.; Yang, F.; Fan, J.F.; Lu, Y.F. The Changes of Spatiotemporal Pattern of Rocky Desertification and Its Dominant Driving Factors in Typical Karst Mountainous Areas under the Background of Global Change. Remote Sens. 2022, 14, 2351. [Google Scholar] [CrossRef]
  46. Lin, X.; Cai, X.; Wang, J.; Mei, Z.; Dai, L. Study of spatial and temporal variation of the net primary productivity of vegetation in Guizhou Province from the year of 2000 to 2010. Environ. Prot. Sci. 2015, 41, 136. [Google Scholar]
Figure 1. Location of the QTP and its vegetation conditions.
Remotesensing 15 02419 g001
Figure 2. Different grades of NPP change ratio on QTP from 2000 to 2020.
Remotesensing 15 02419 g002
Figure 3. Trend coefficient and climate tendency rate of climatic factors on QTP: (a) trend coefficient of annual precipitation; (b) climate tendency rate of annual precipitation; (c) trend coefficient of annual average temperature; (d) climate tendency rate of annual average temperature; (e) trend coefficient of accumulated temperature (>10 °C); (f) climate tendency rate of accumulated temperature (>10 °C); (g) trend coefficient of annual sunshine hours; (h) climate tendency rate of annual sunshine hours.
Remotesensing 15 02419 g003aRemotesensing 15 02419 g003b
Figure 4. Partial correlations between vegetation NPP and annual average temperature and annual precipitation: (a) annual precipitation; (b) T test of significance (annual precipitation); (c) annual average temperature; (d) T test of significance (average annual temperature); (e) the multiple correlation coefficient; (f) F test of significance.
Remotesensing 15 02419 g004aRemotesensing 15 02419 g004b
Figure 5. Partial correlations between vegetation NPP and annual precipitation and annual sunshine hours: (a) annual precipitation; (b) T test of significance (annual precipitation); (c)annual sunshine hours; (d) T test of significance (annual sunshine hours); (e) multiple correlation coefficient; (f) F test of significance.
Remotesensing 15 02419 g005
Figure 6. Partial correlations between vegetation NPP and annual precipitation and accumulated temperature (>10 °C): (a) annual precipitation; (b) T test of significance (annual precipitation); (c) accumulated temperature (>10 °C); (d) T test of significance (accumulated temperature (>10 °C)); (e) the multiple correlation coefficient; (f) F test of significance.
Remotesensing 15 02419 g006aRemotesensing 15 02419 g006b
Figure 7. Partial correlations between vegetation NPP and annual average temperature and annual sunshine hours: (a) annual average temperature; (b) T test of significance (annual average temperature); (c) annual sunshine hours; (d) T test of significance (annual sunshine hours); (e) the multiple correlation coefficient; (f) F test of significance.
Remotesensing 15 02419 g007
Figure 8. The relative roles of climate–human factors in the evolution of vegetation NPP from 2000 to 2010.
Remotesensing 15 02419 g008
Figure 9. The relative roles of climate–human factors in the evolution of vegetation NPP from 2010 to 2020.
Remotesensing 15 02419 g009
Table 1. Six scenarios of relative roles of climate–human factors in the evolution of vegetation NPP.
NPP ChangesScenarioKcKhRelative Effect of ClimateRelative Role of Human Activity
NPP increases (vegetation restoration)1>0>01000
2<0<00100
3>0<0Combined actionCombined action
NPP decreases (vegetation degradation)4>0>01000
5<0<00100
6<0<0Combined actionCombined action
Disclaimer/Publisher’s Note: The statements, opinions and data contained in all publications are solely those of the individual author(s) and contributor(s) and not of MDPI and/or the editor(s). MDPI and/or the editor(s) disclaim responsibility for any injury to people or property resulting from any ideas, methods, instructions or products referred to in the content.