
Effects of Vegetation Belt Movement on Wildfire in the Mongolian Plateau over the Past 40 Years


Abstract
1. Introduction
2. Materials and Methods
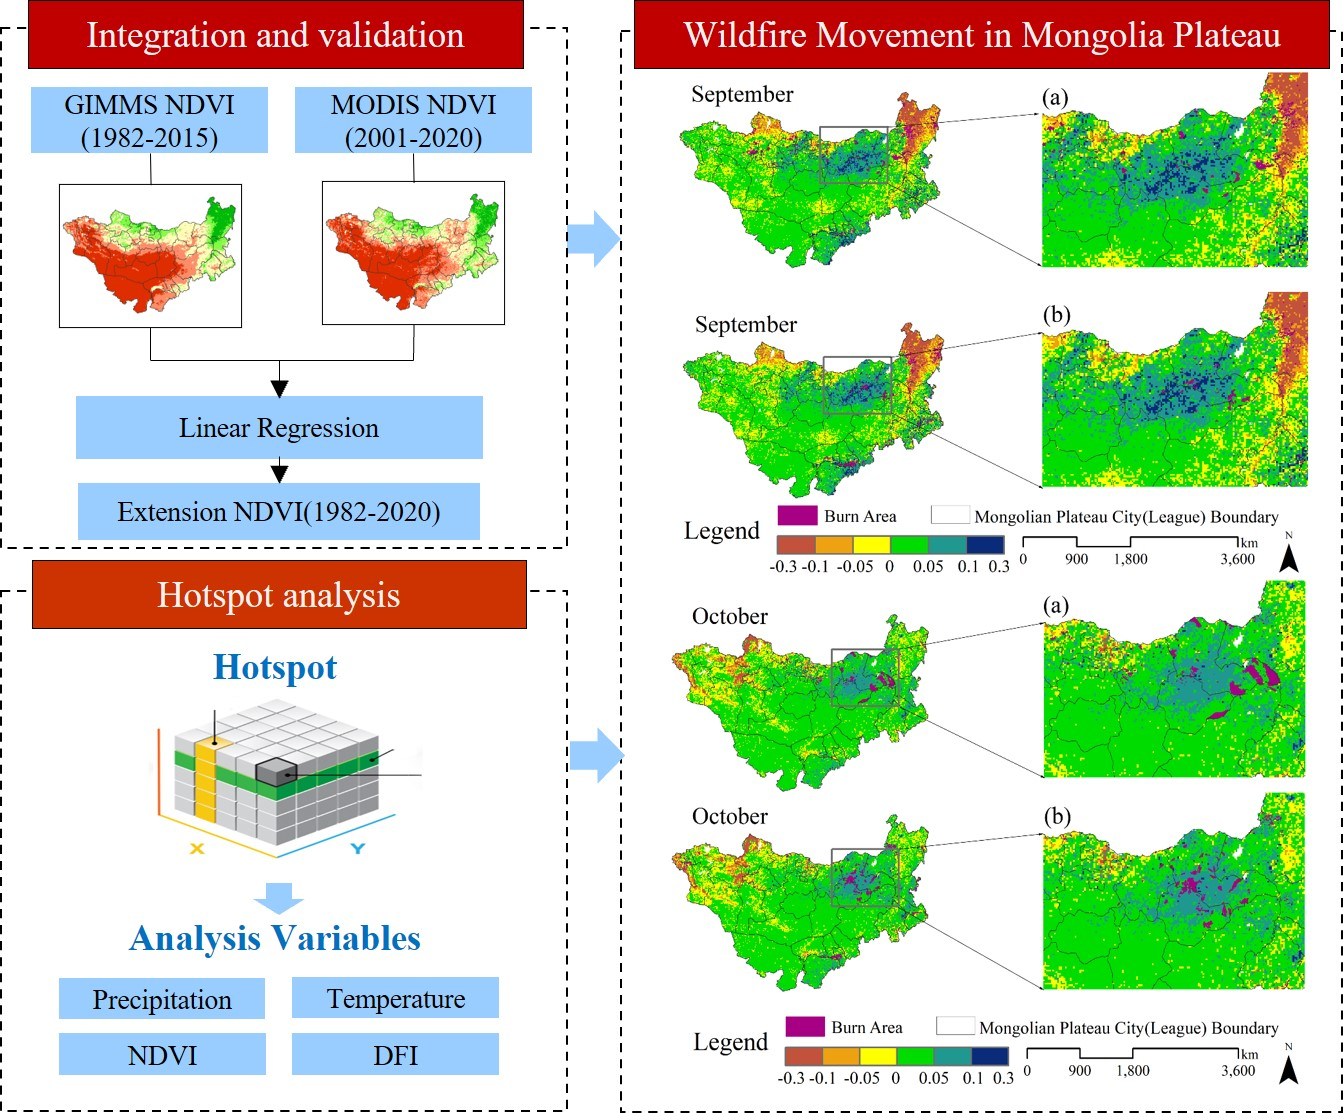
2.1. Study Area
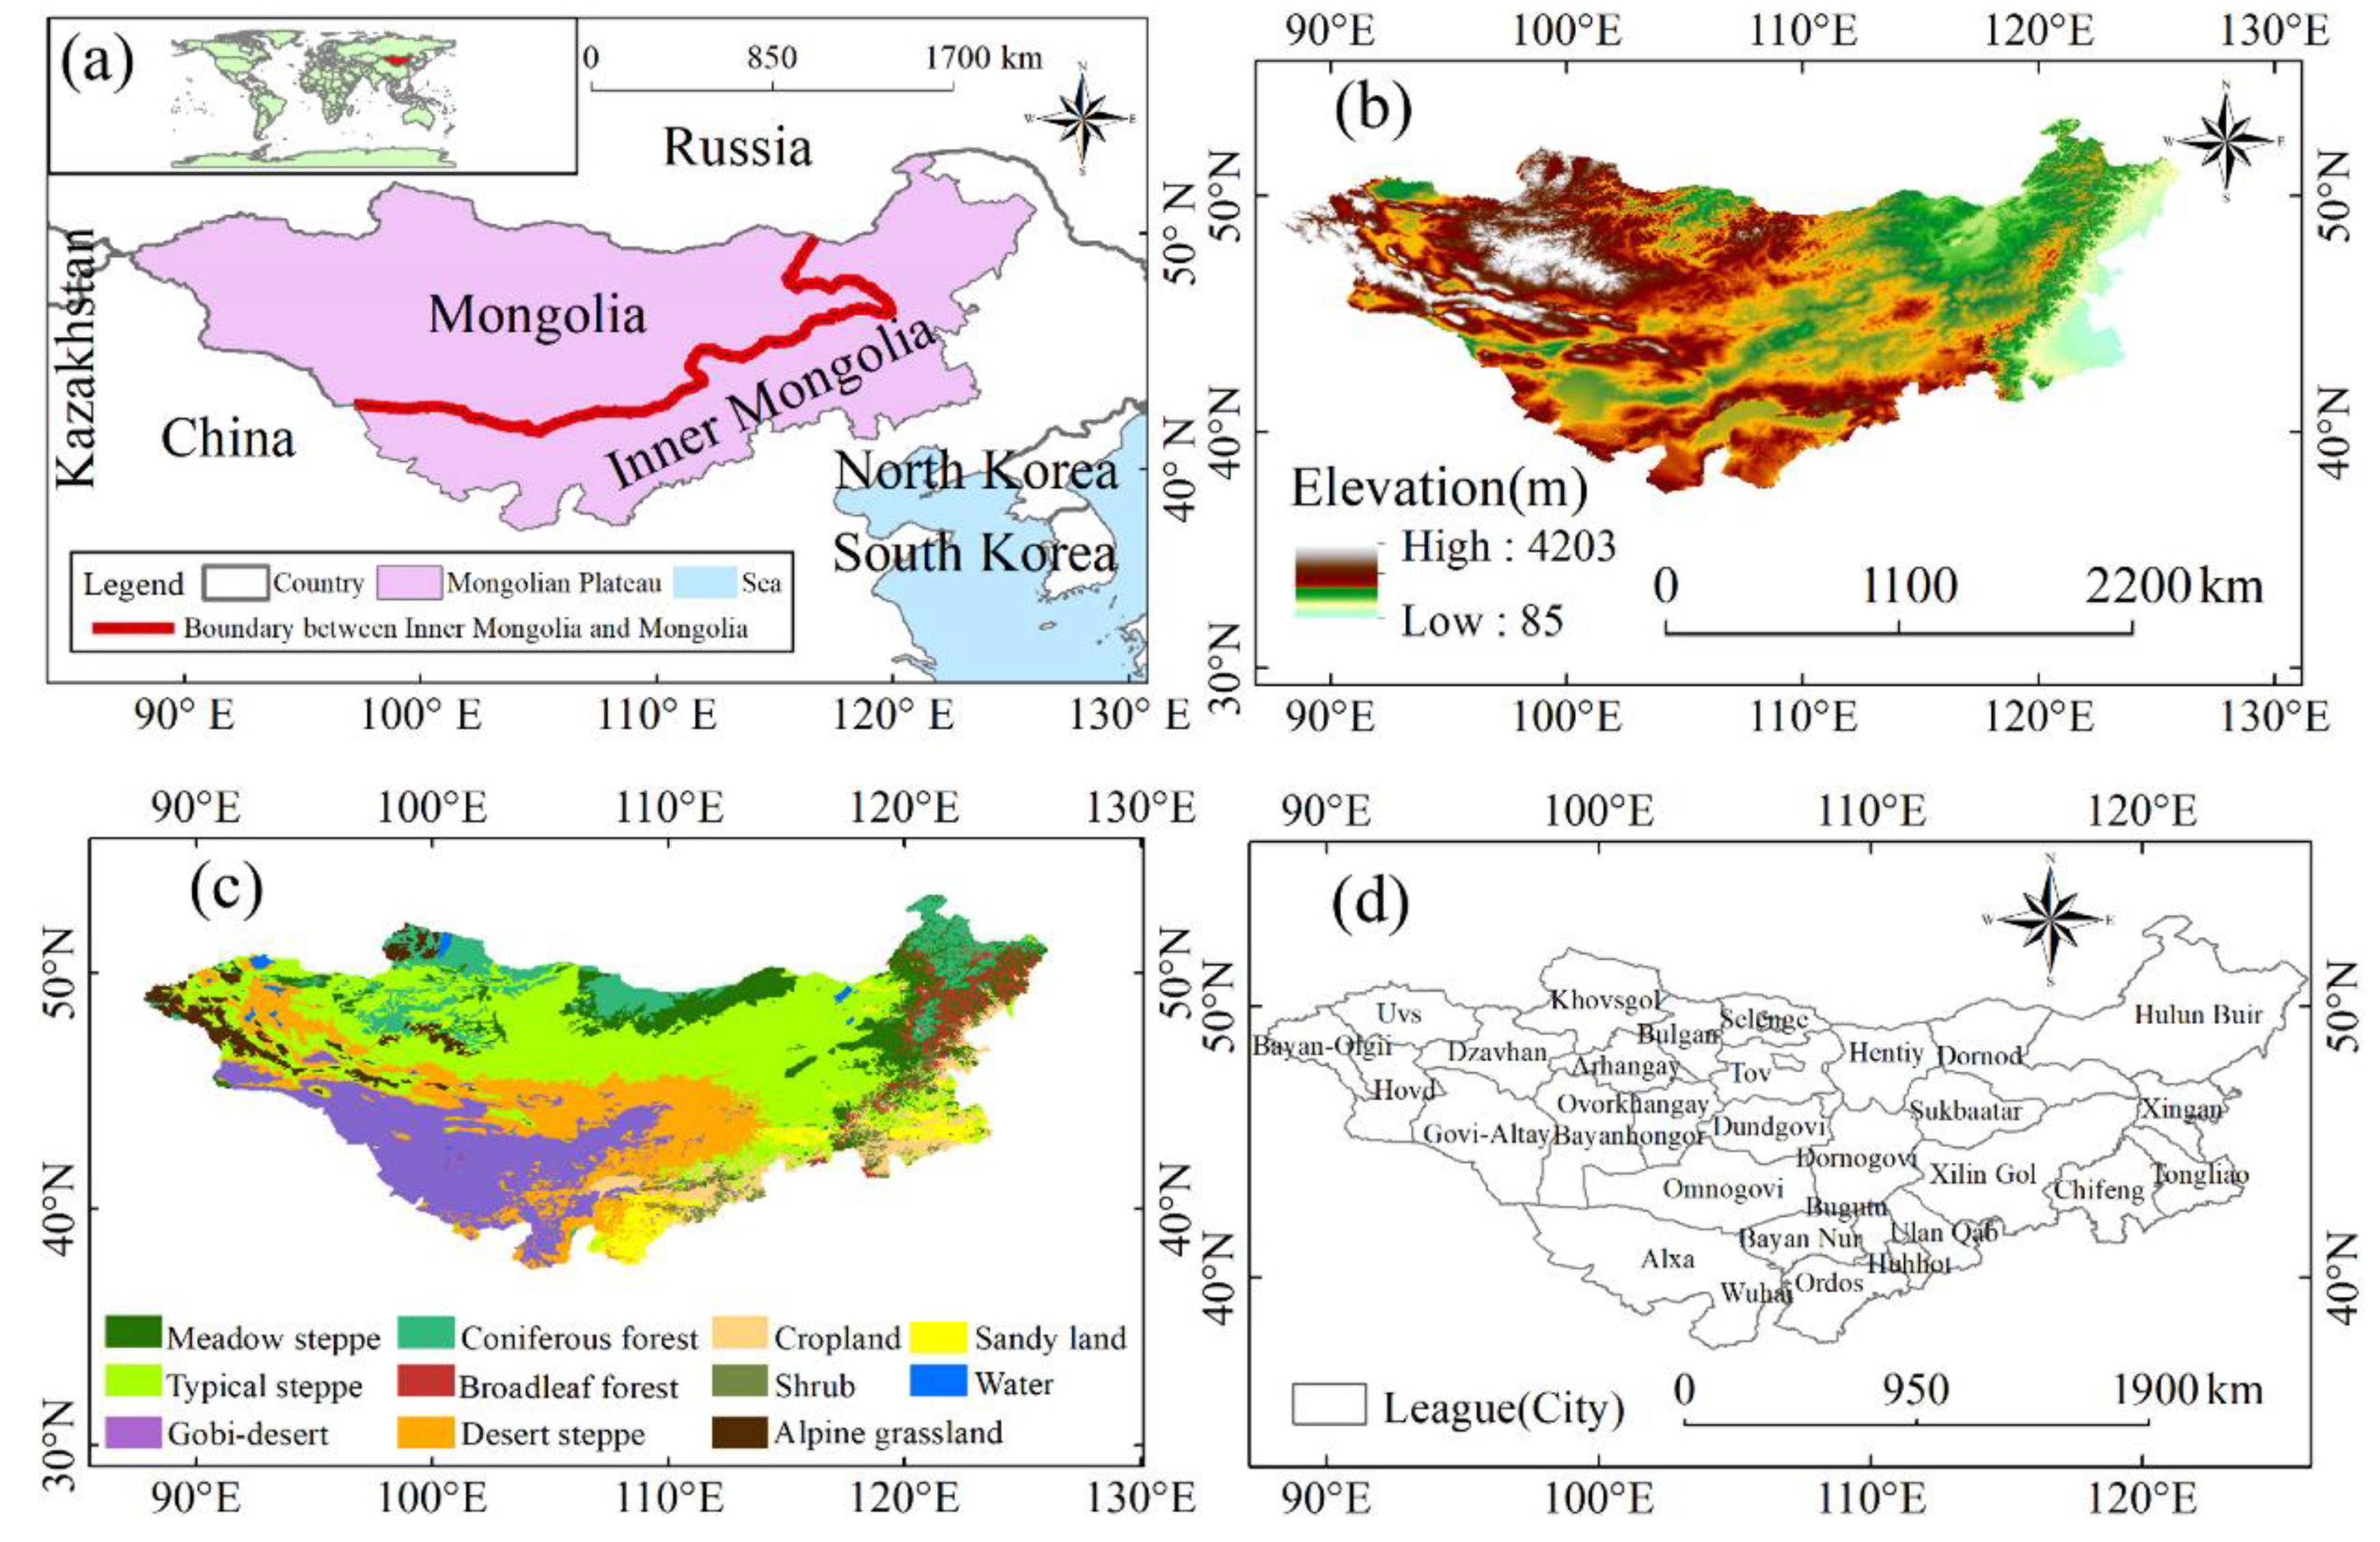
2.2. Data
2.3. Method
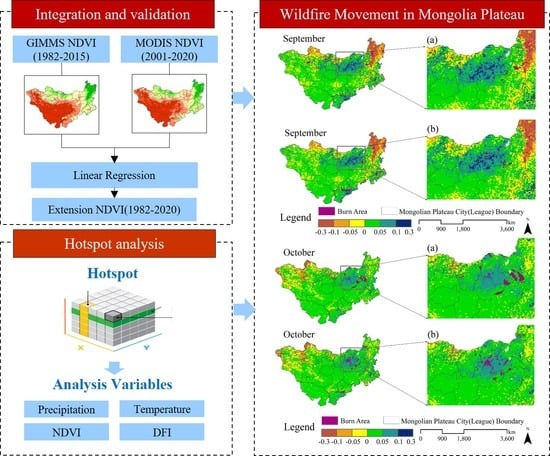
2.3.1. Integration and Validation with AVHRR GIMMS and MODIS NDVI Data
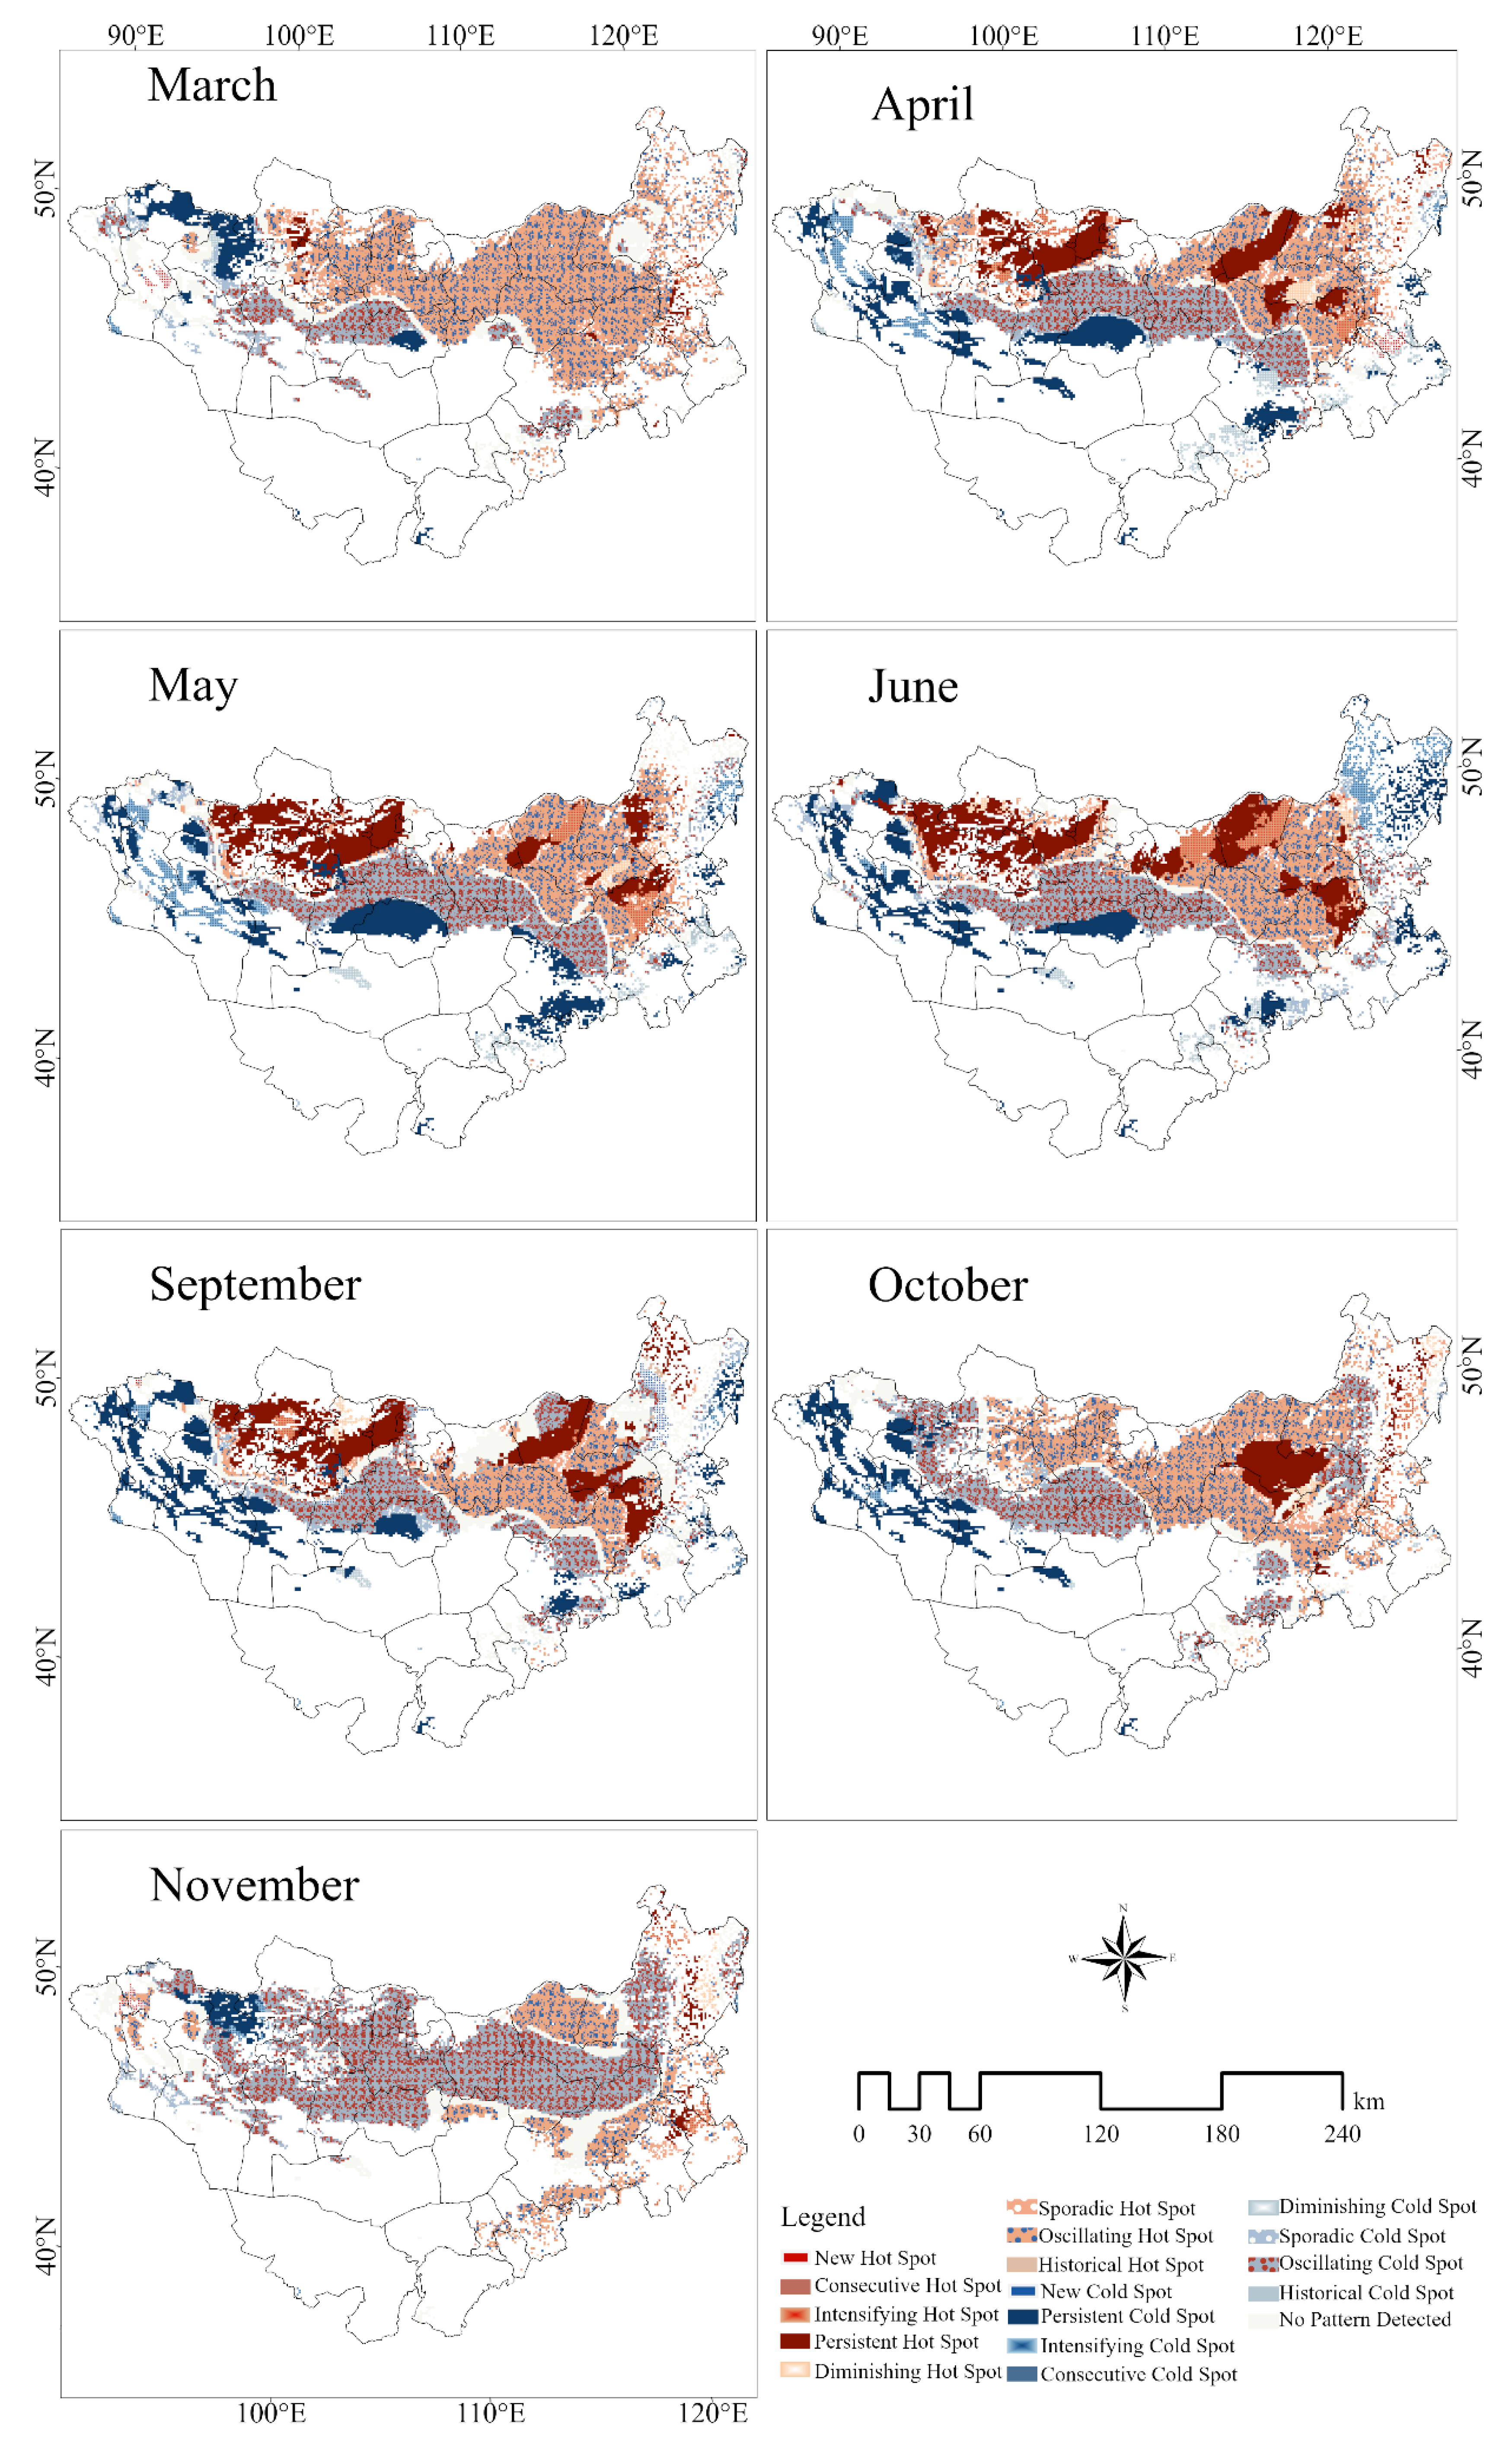
2.3.2. Emerging Hot Spot Analysis
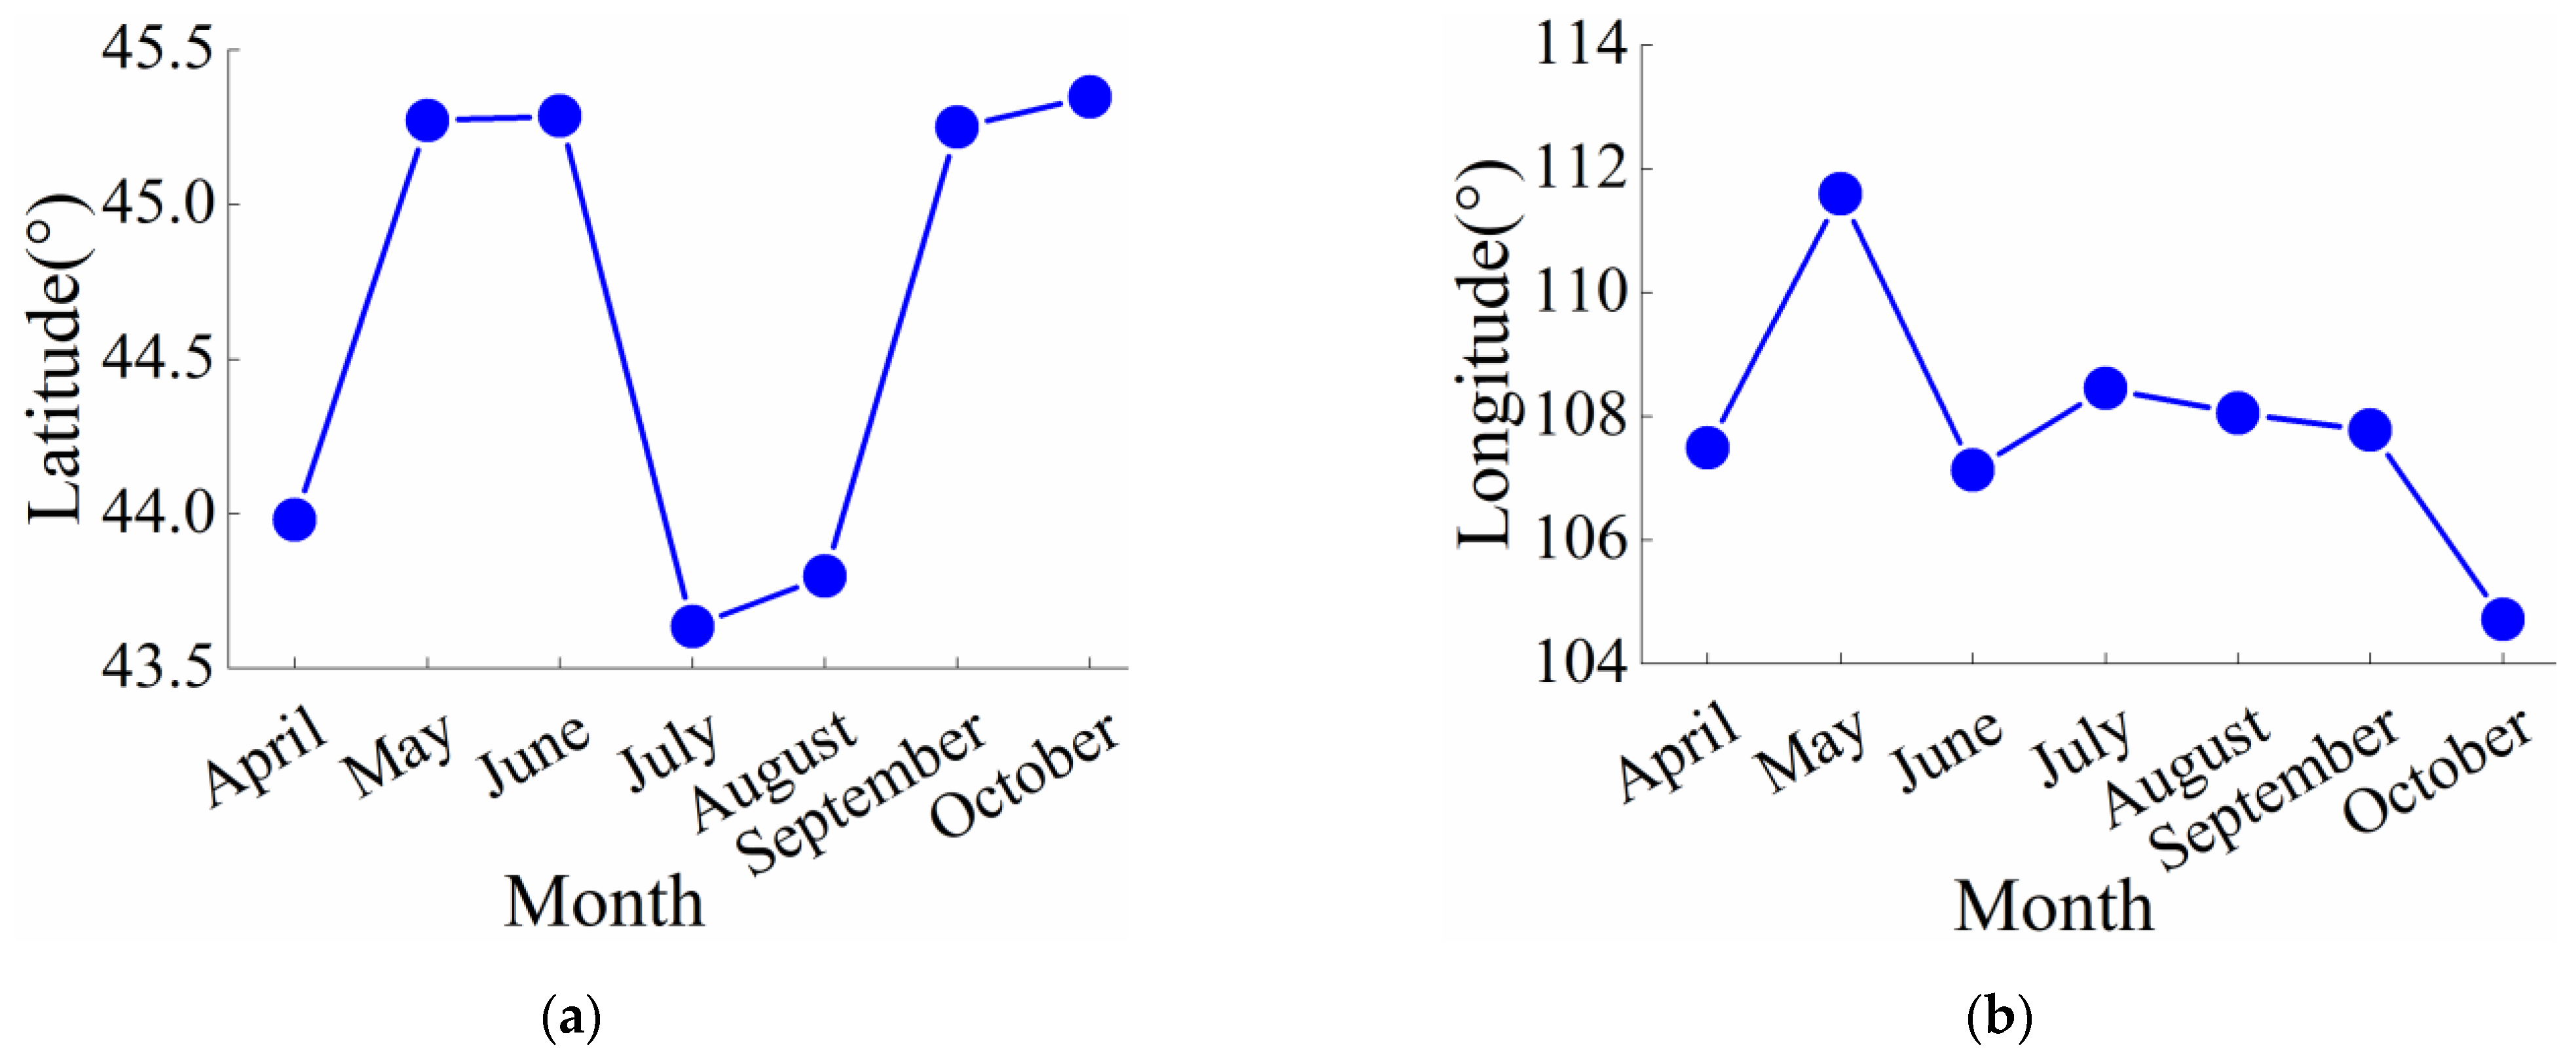
2.3.3. Gravity Center Change Mode
2.3.4. DFI
3. Result
3.1. Analysis of the Variation Patterns of Hydrothermal Conditions over the Mongolian Plateau in the Last 40 Years
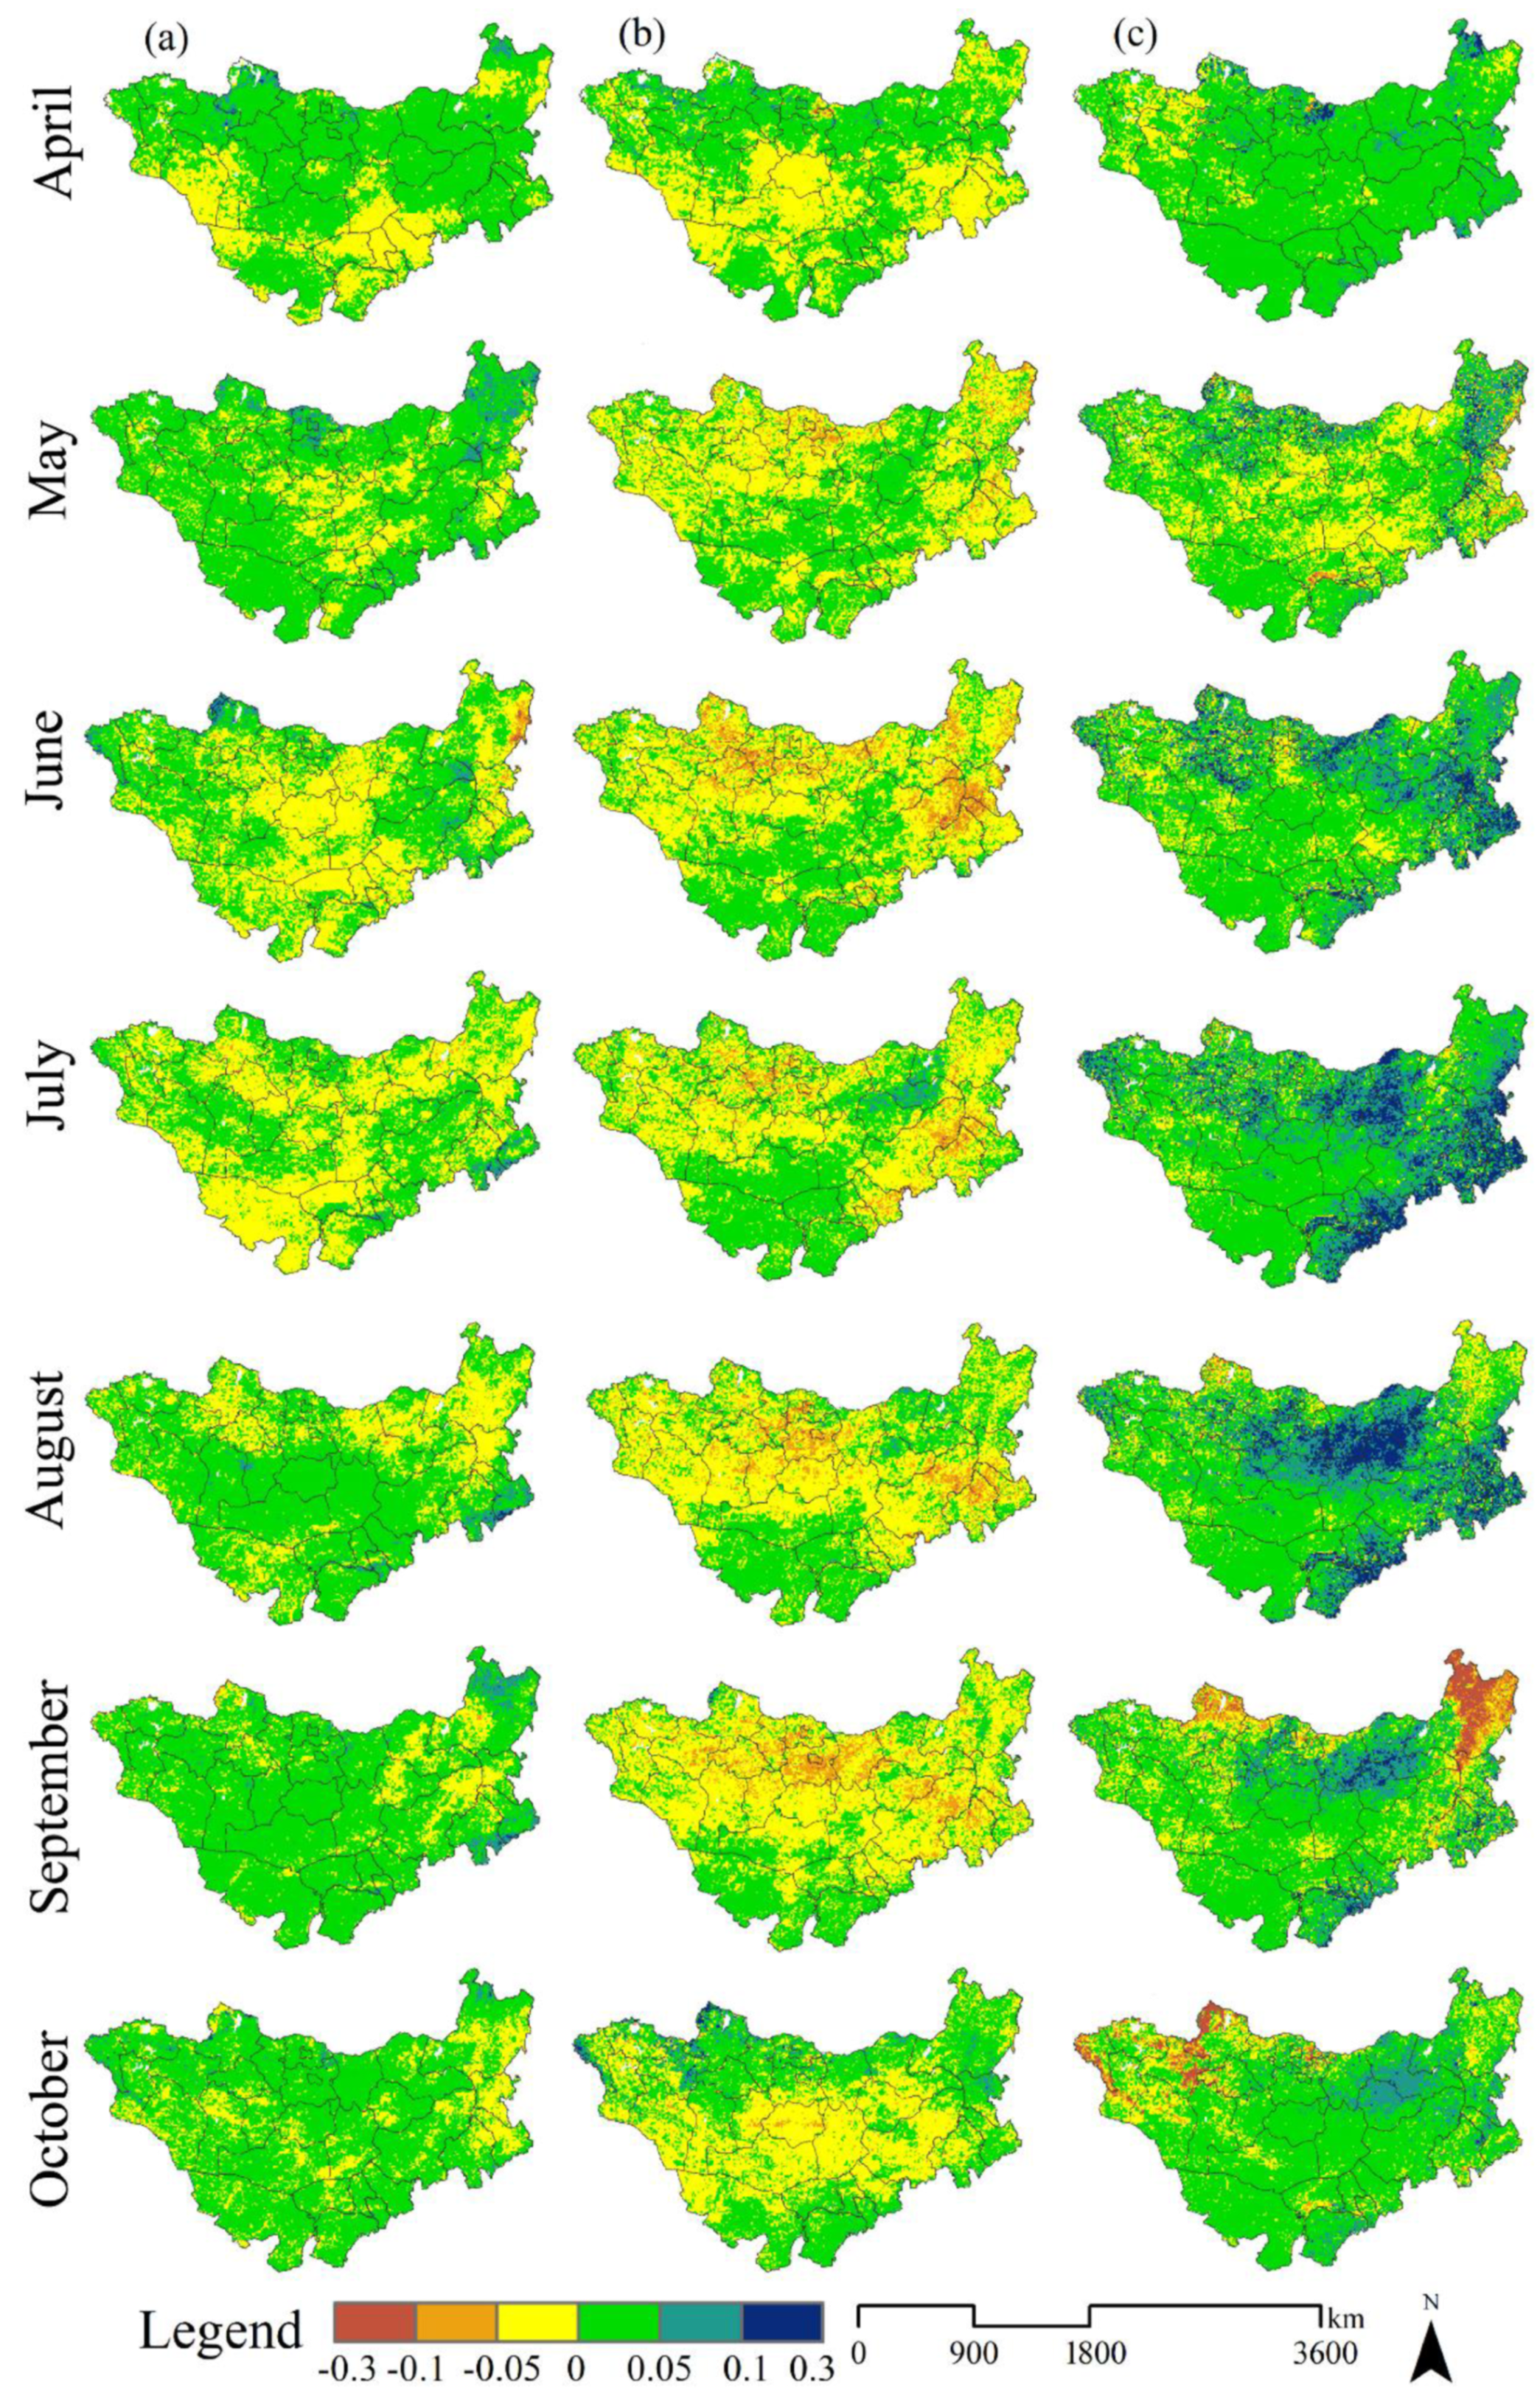
3.2. NDVI Change Patterns and Shifting Characteristics of Vegetation Zones in the Mongolian Plateau in the Last 40 Years
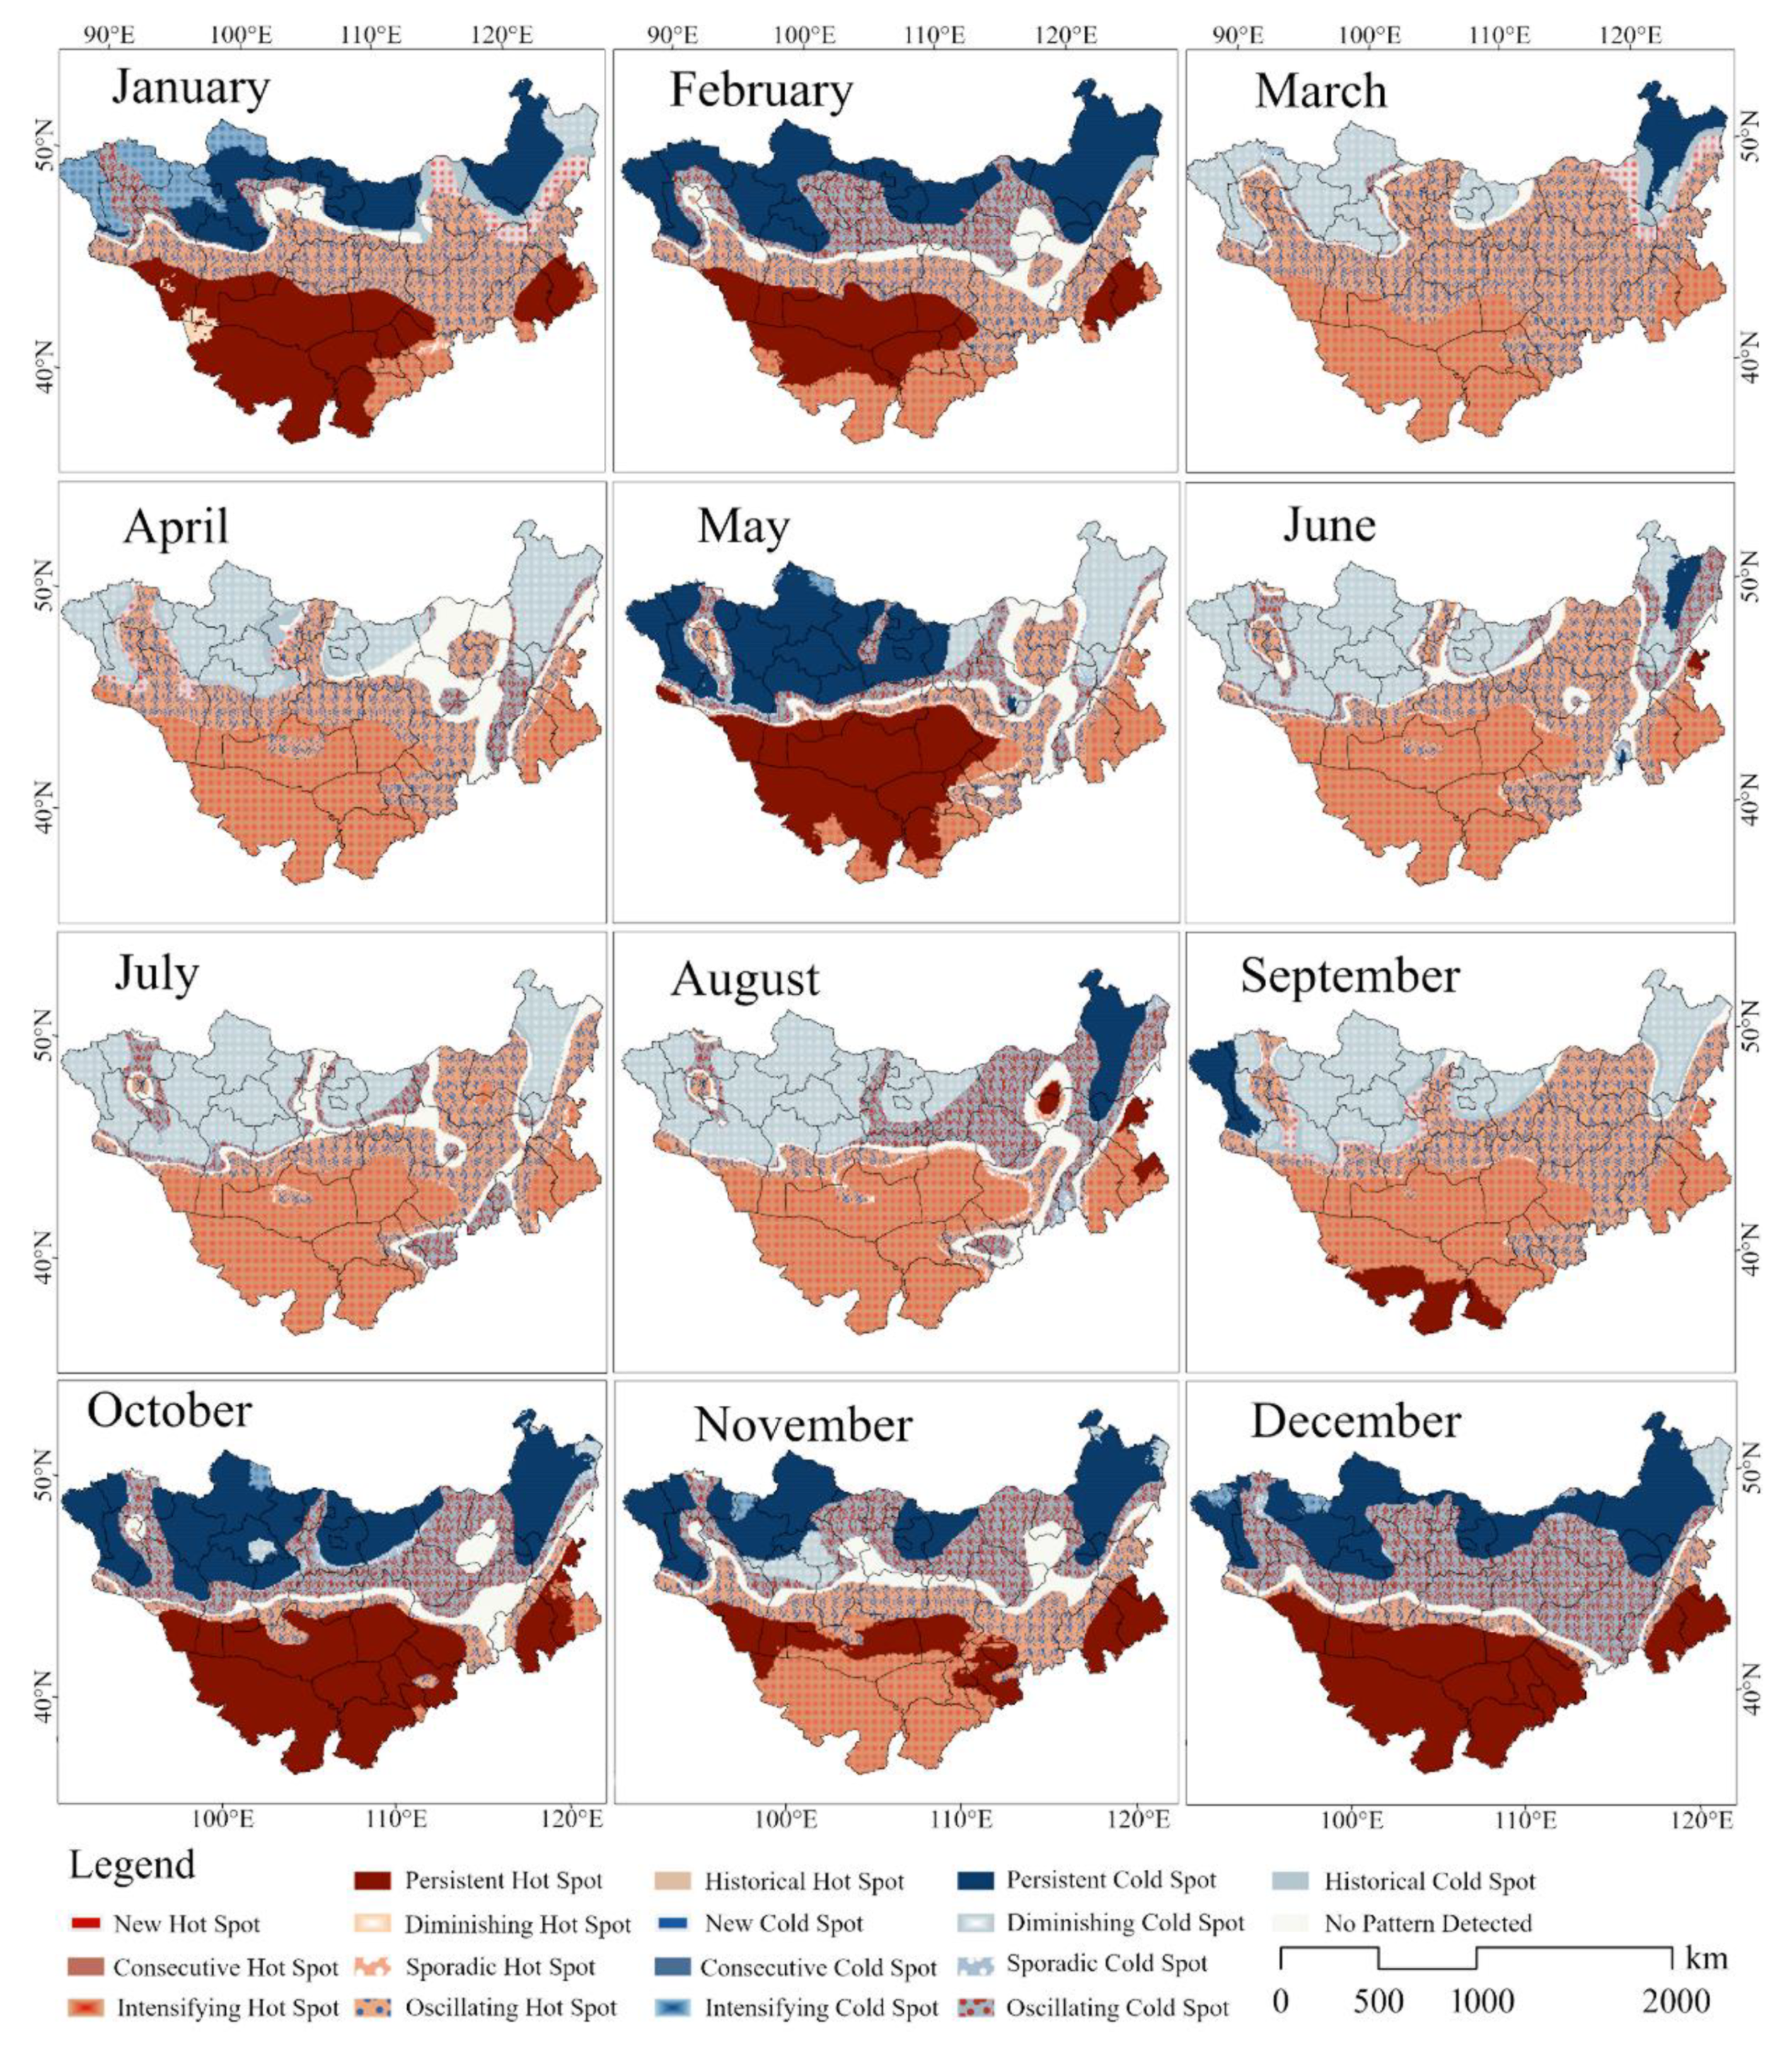
3.2.1. Analysis of NDVI Change Patterns in Mongolia Plateau in the Last 40 Years
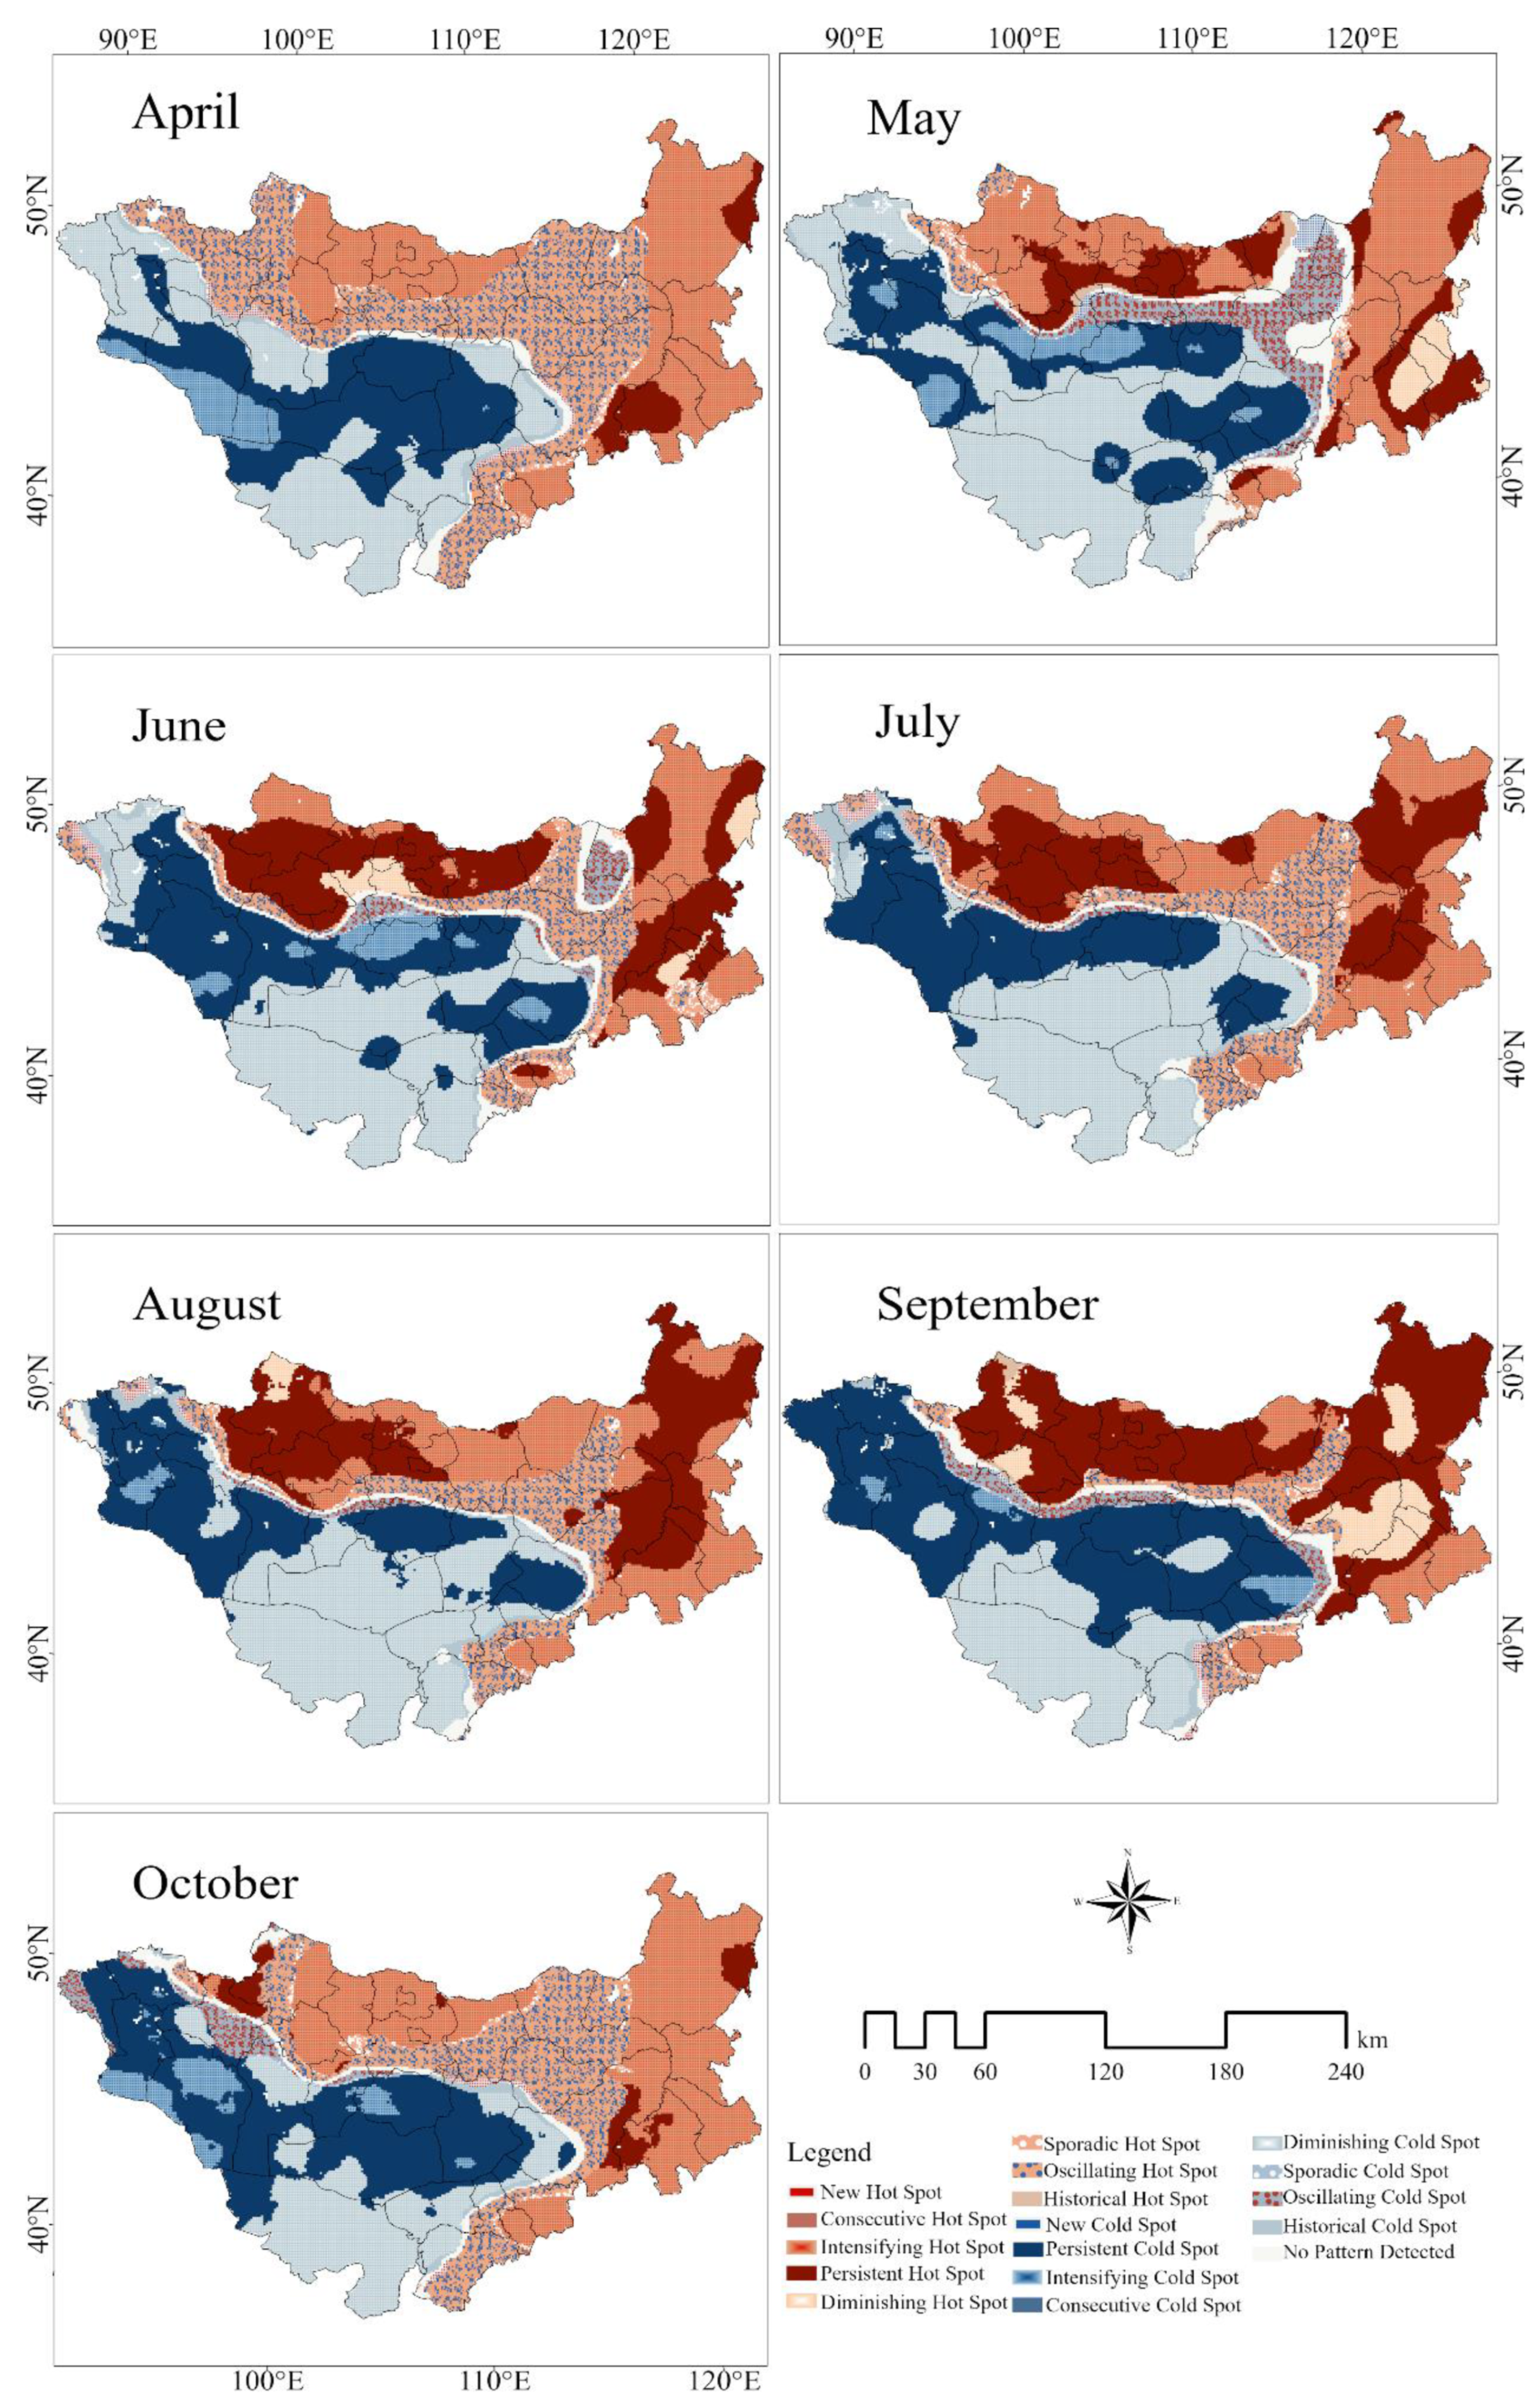
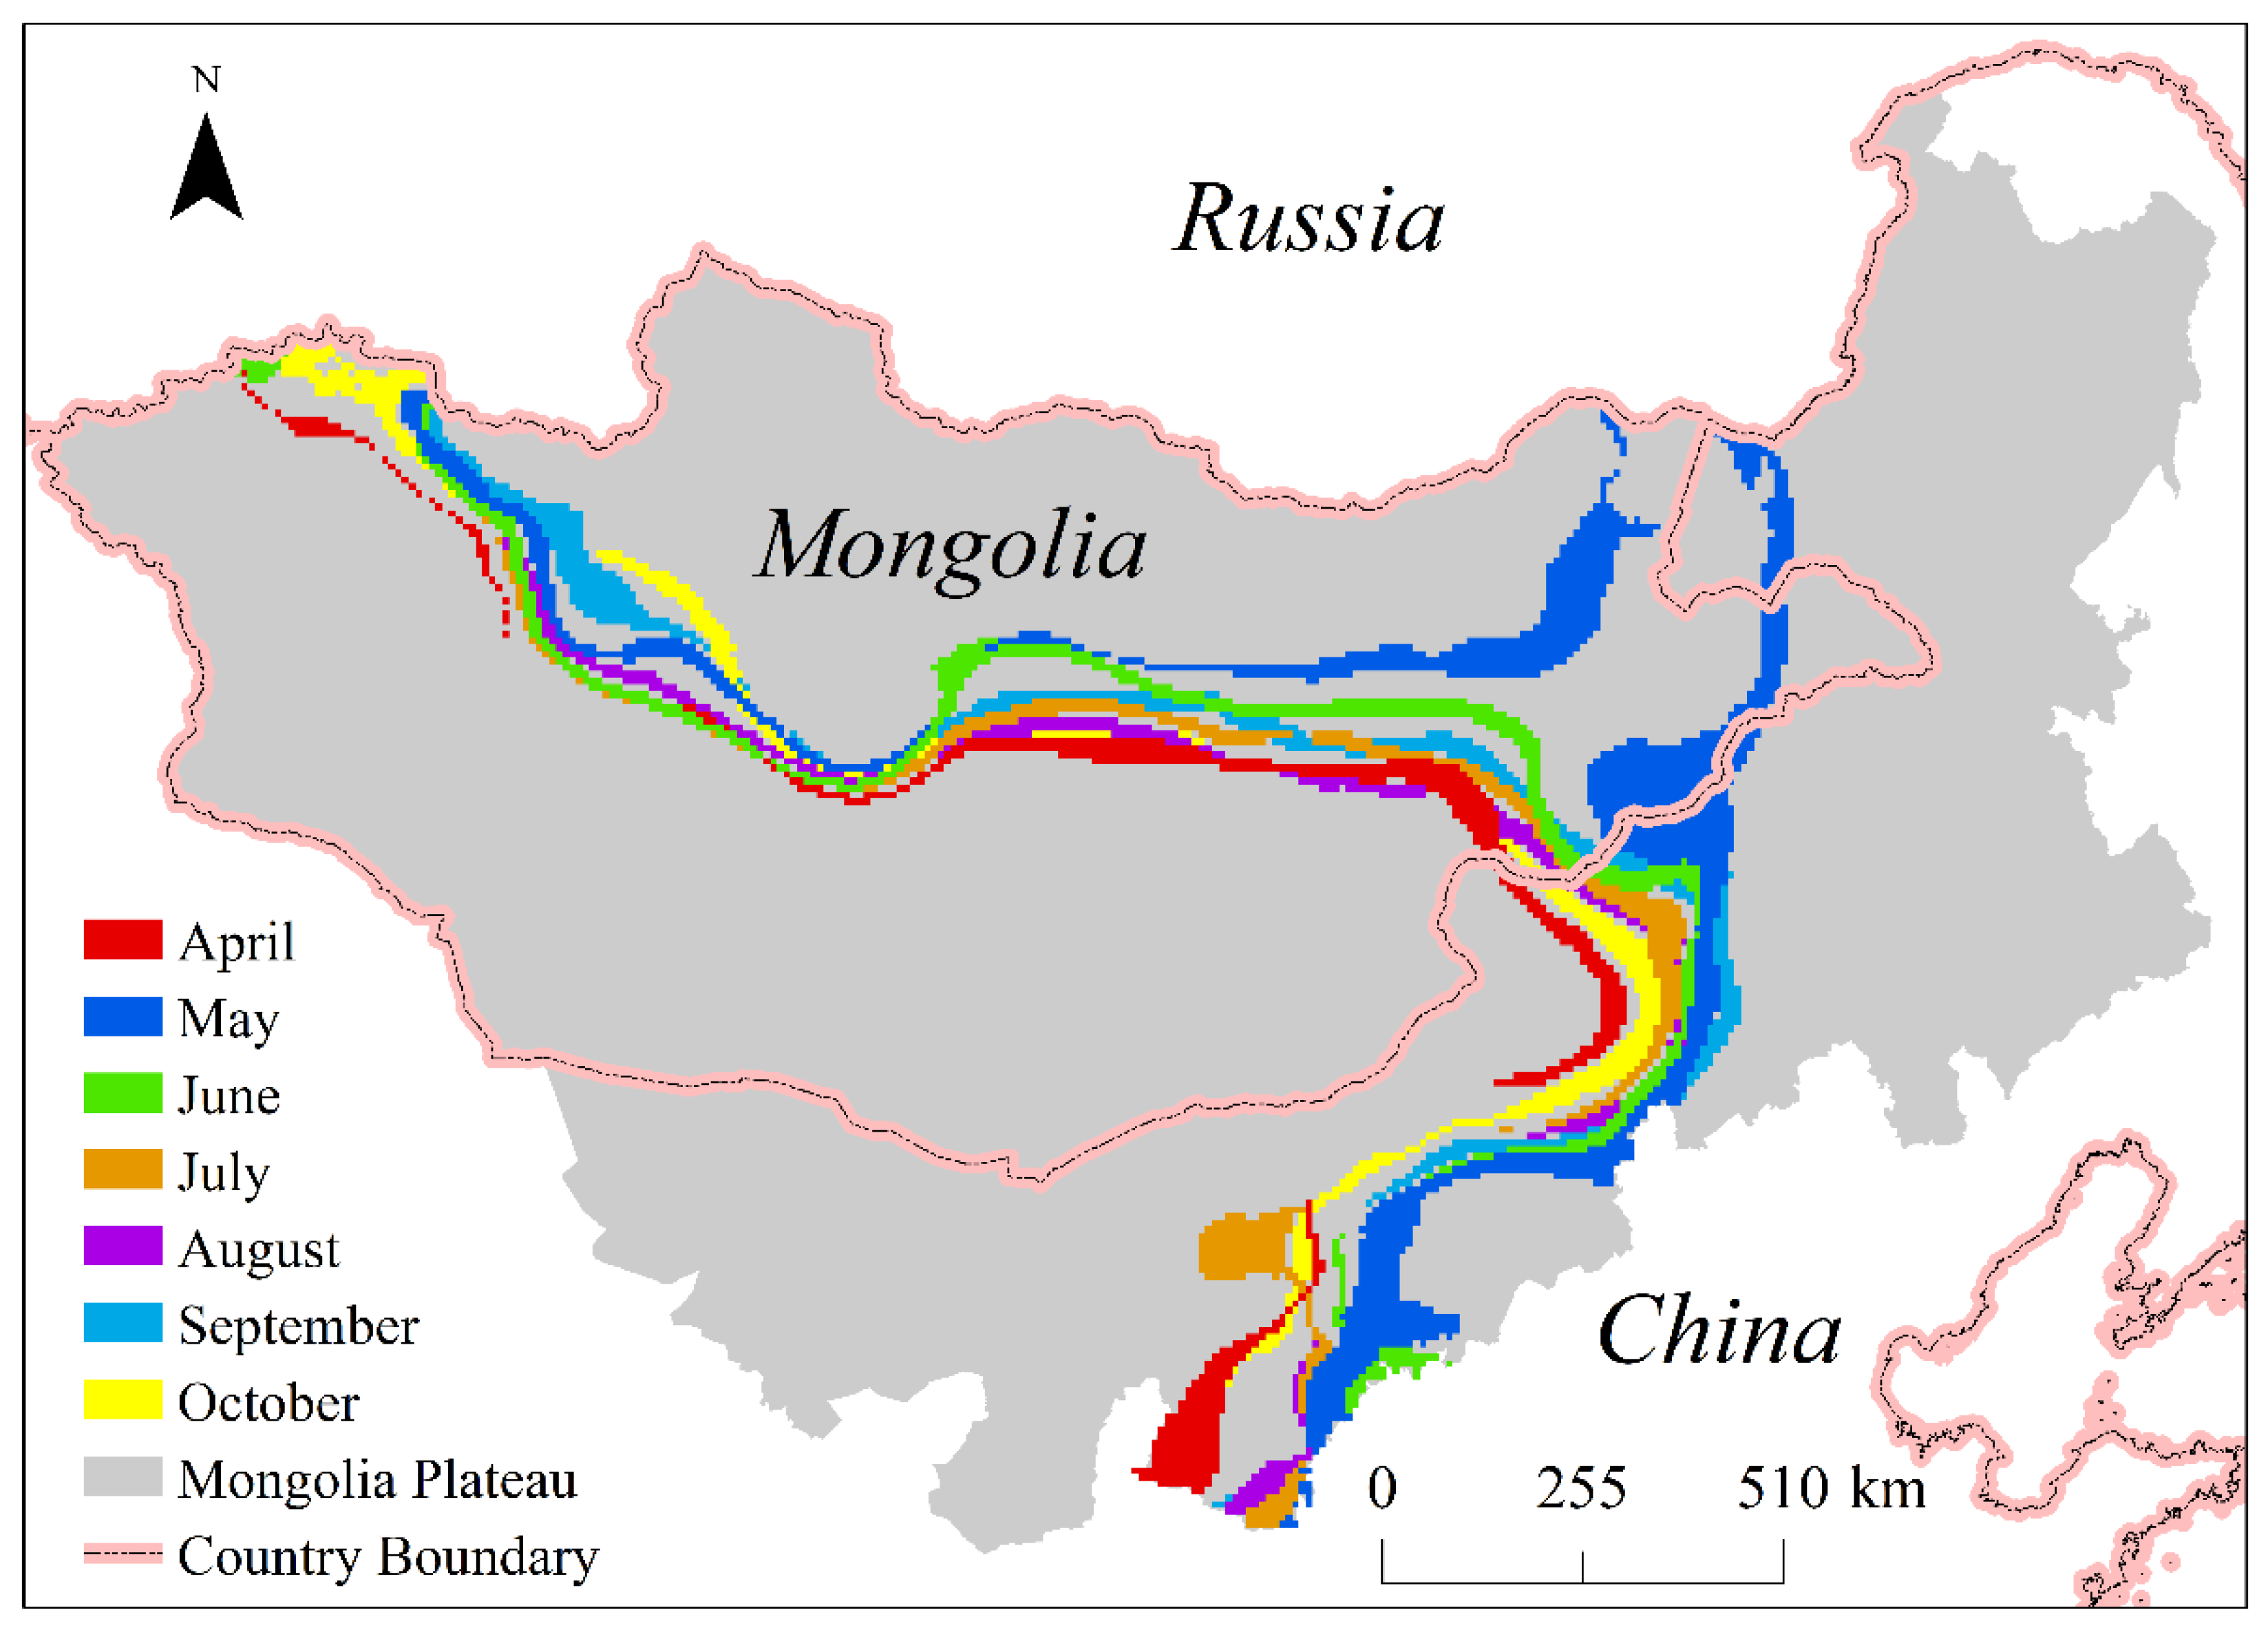
3.2.2. Vegetation Belt Movement Features
3.3. Effects of Vegetation Belt Movement Characteristics on Wildfire in the Last 40 Years
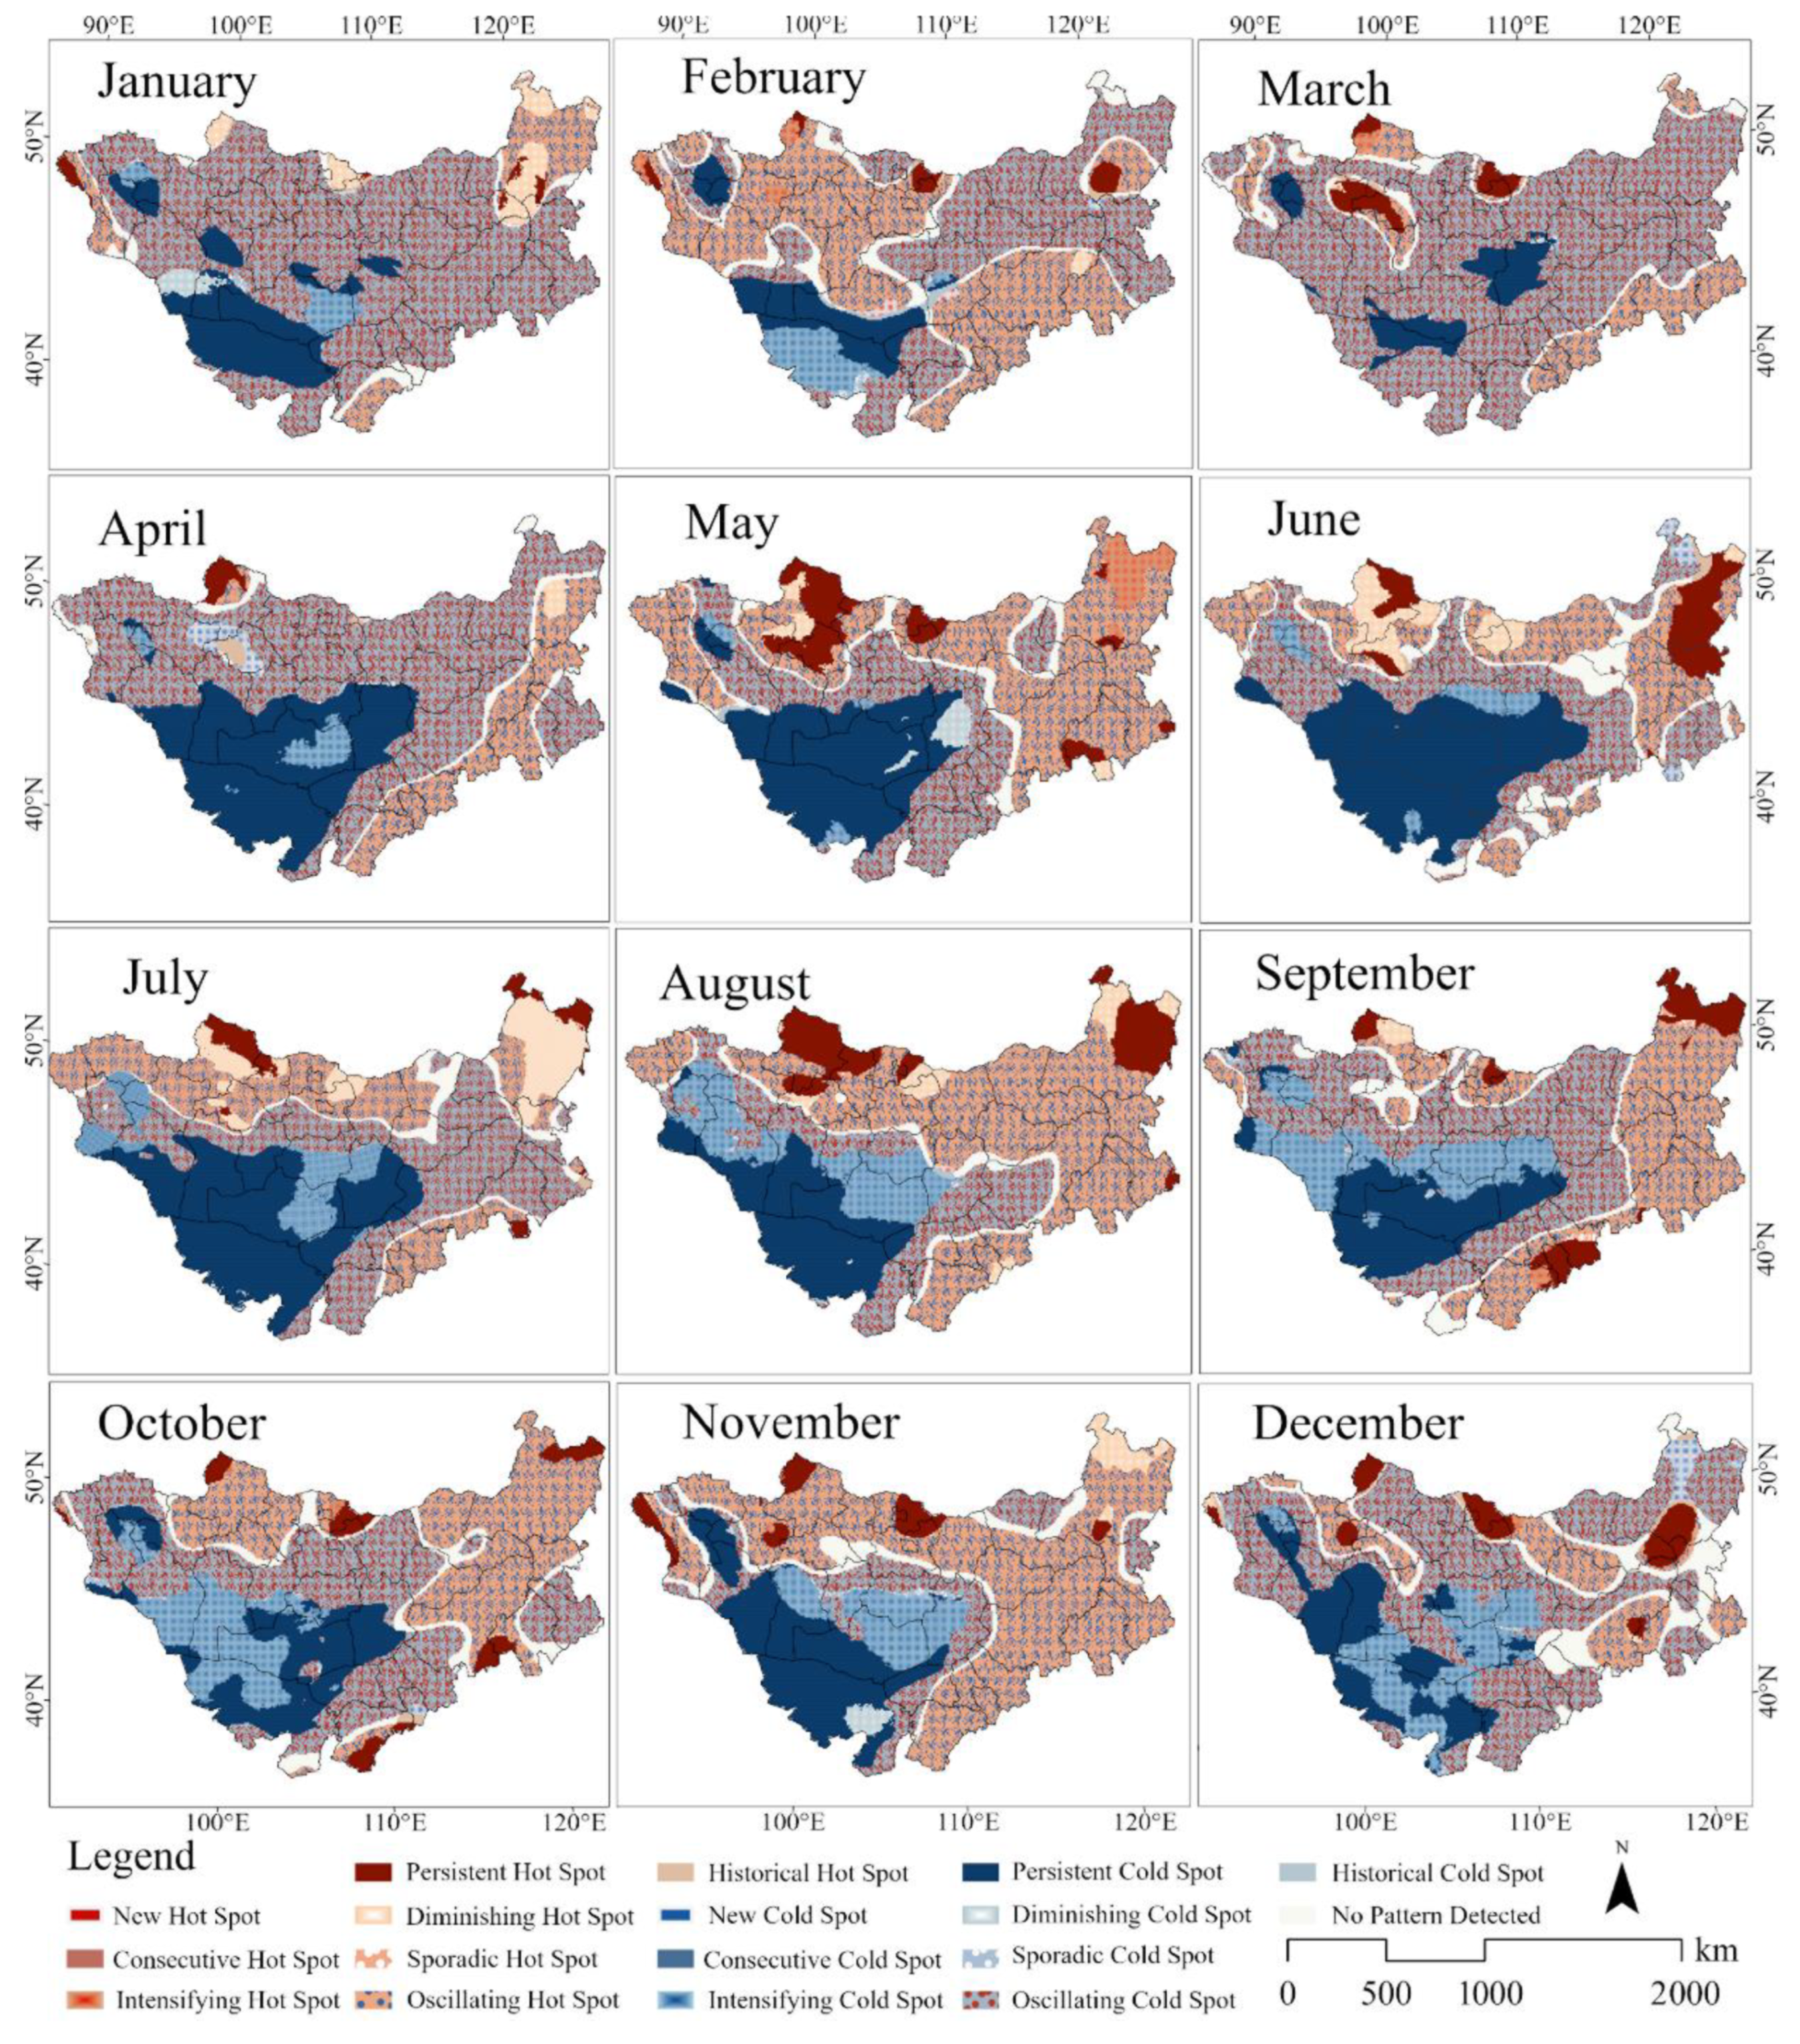
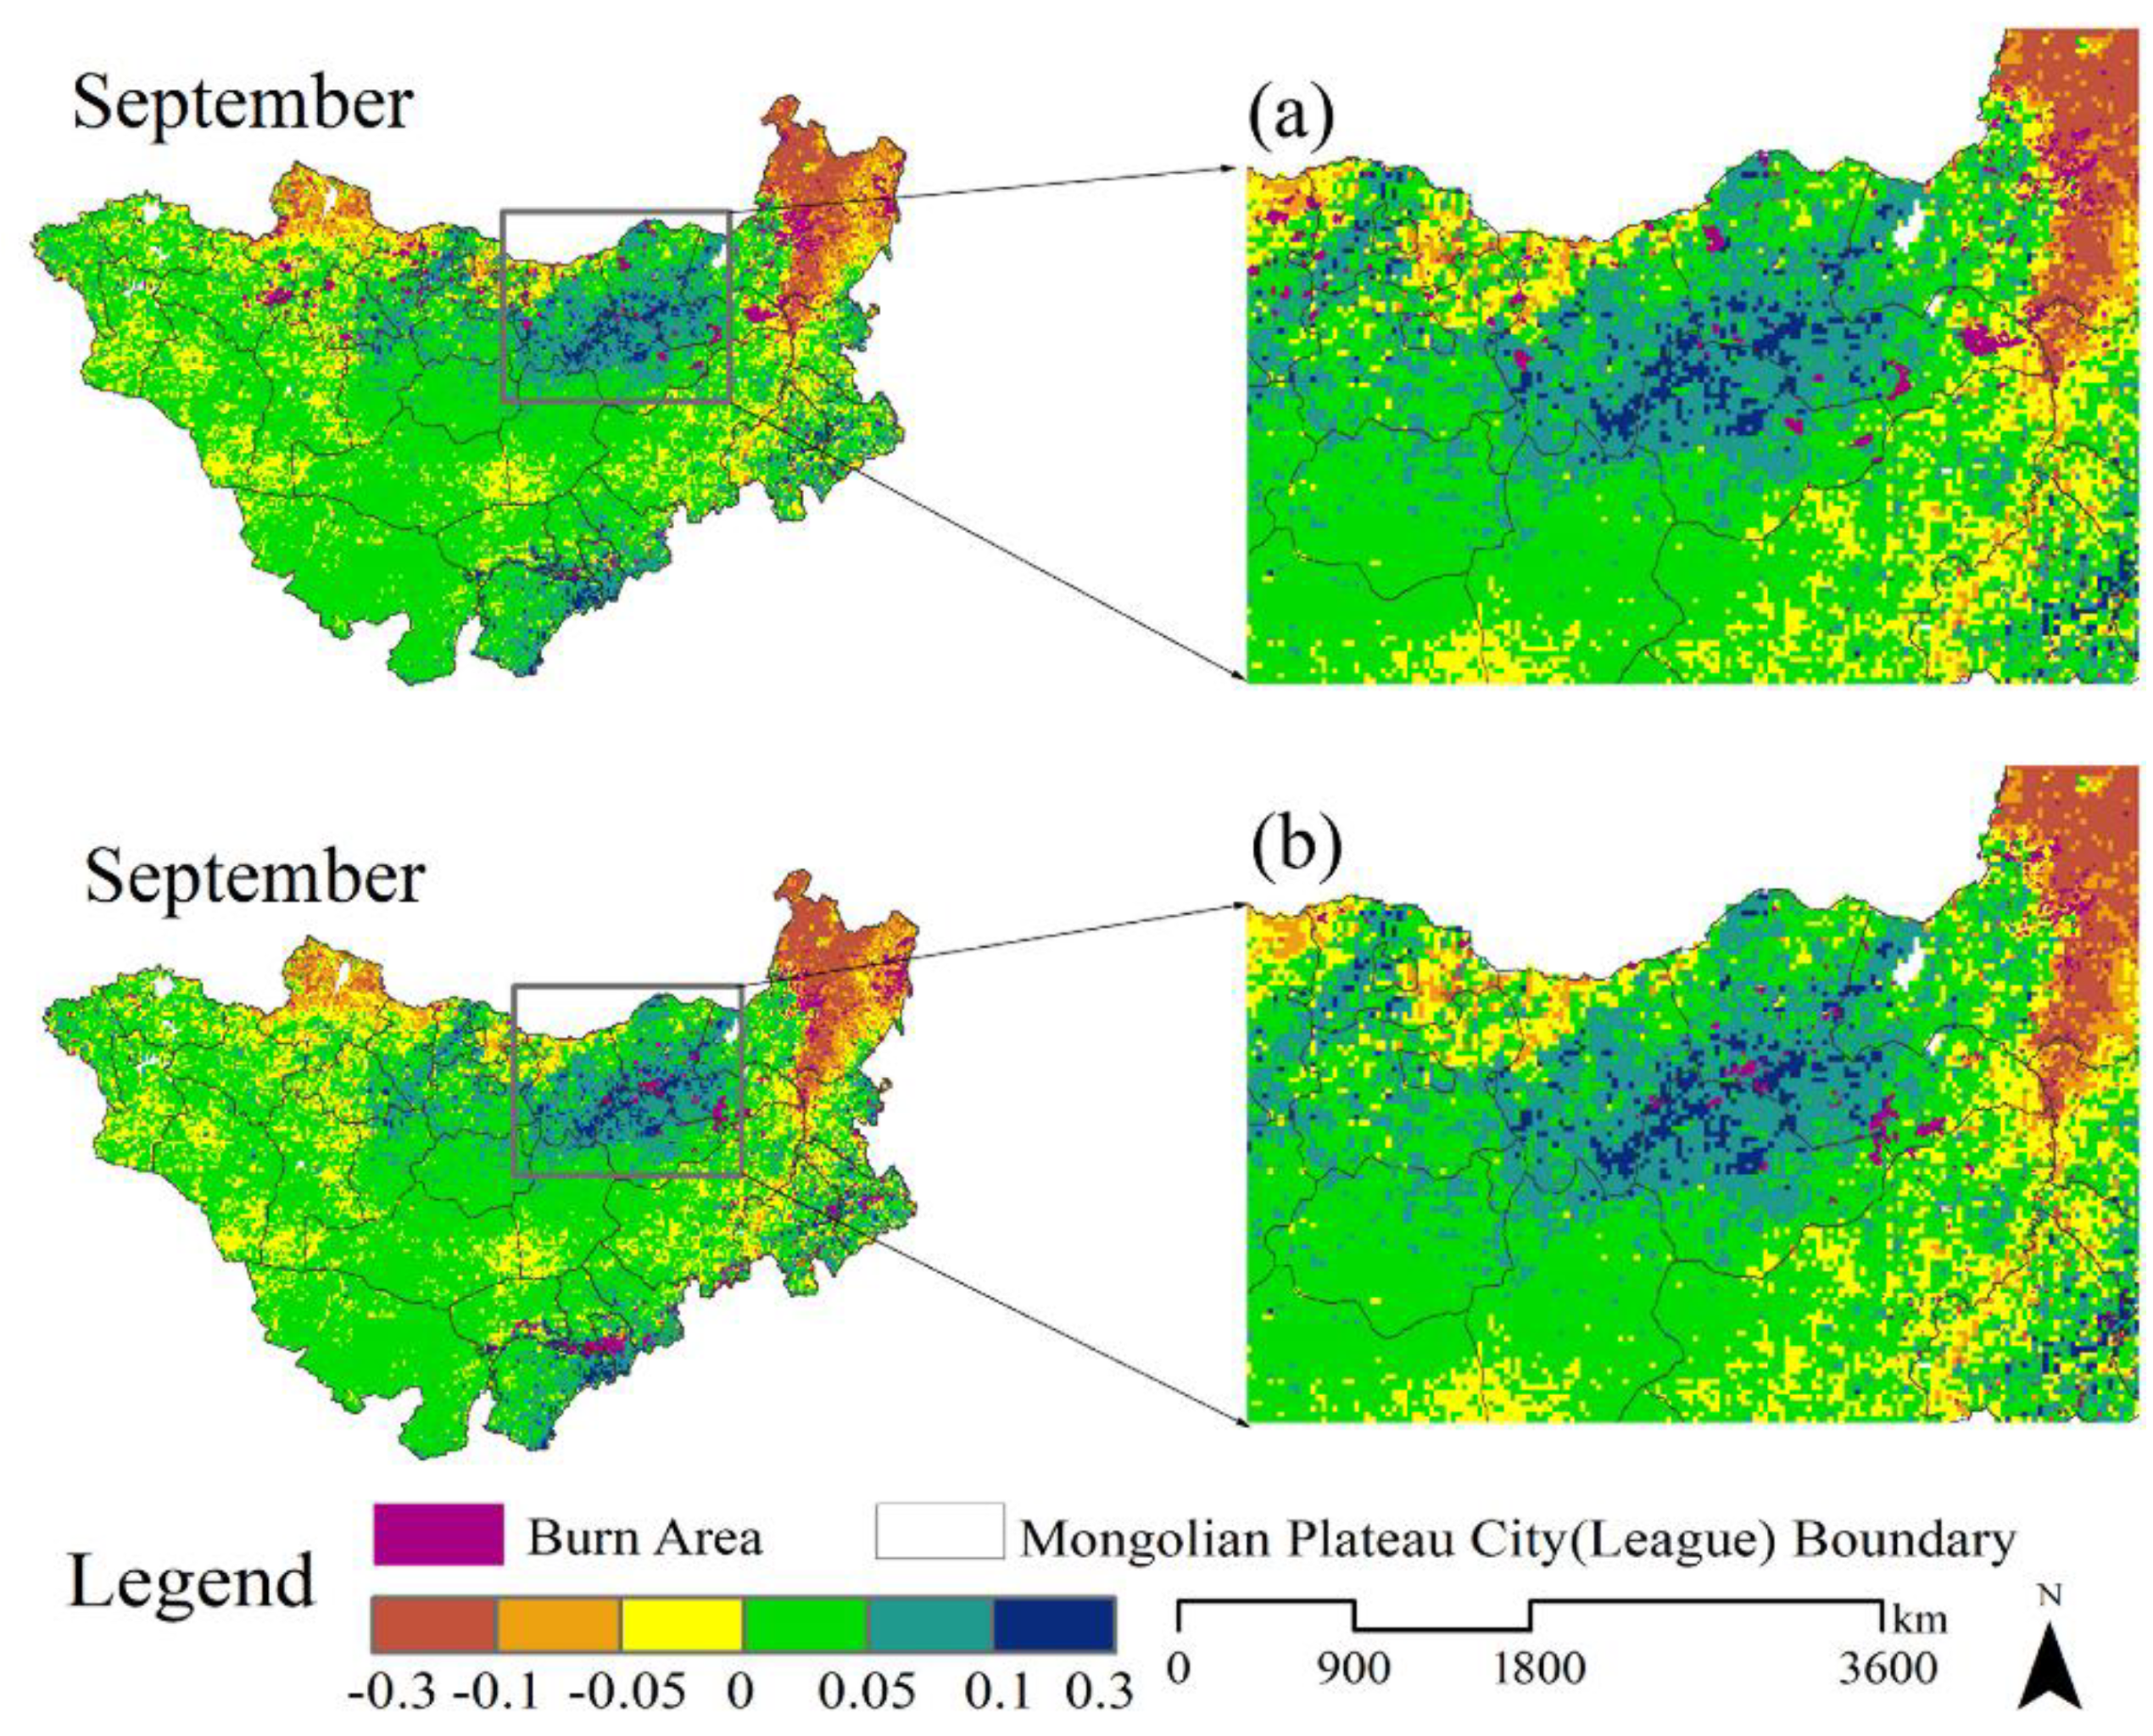
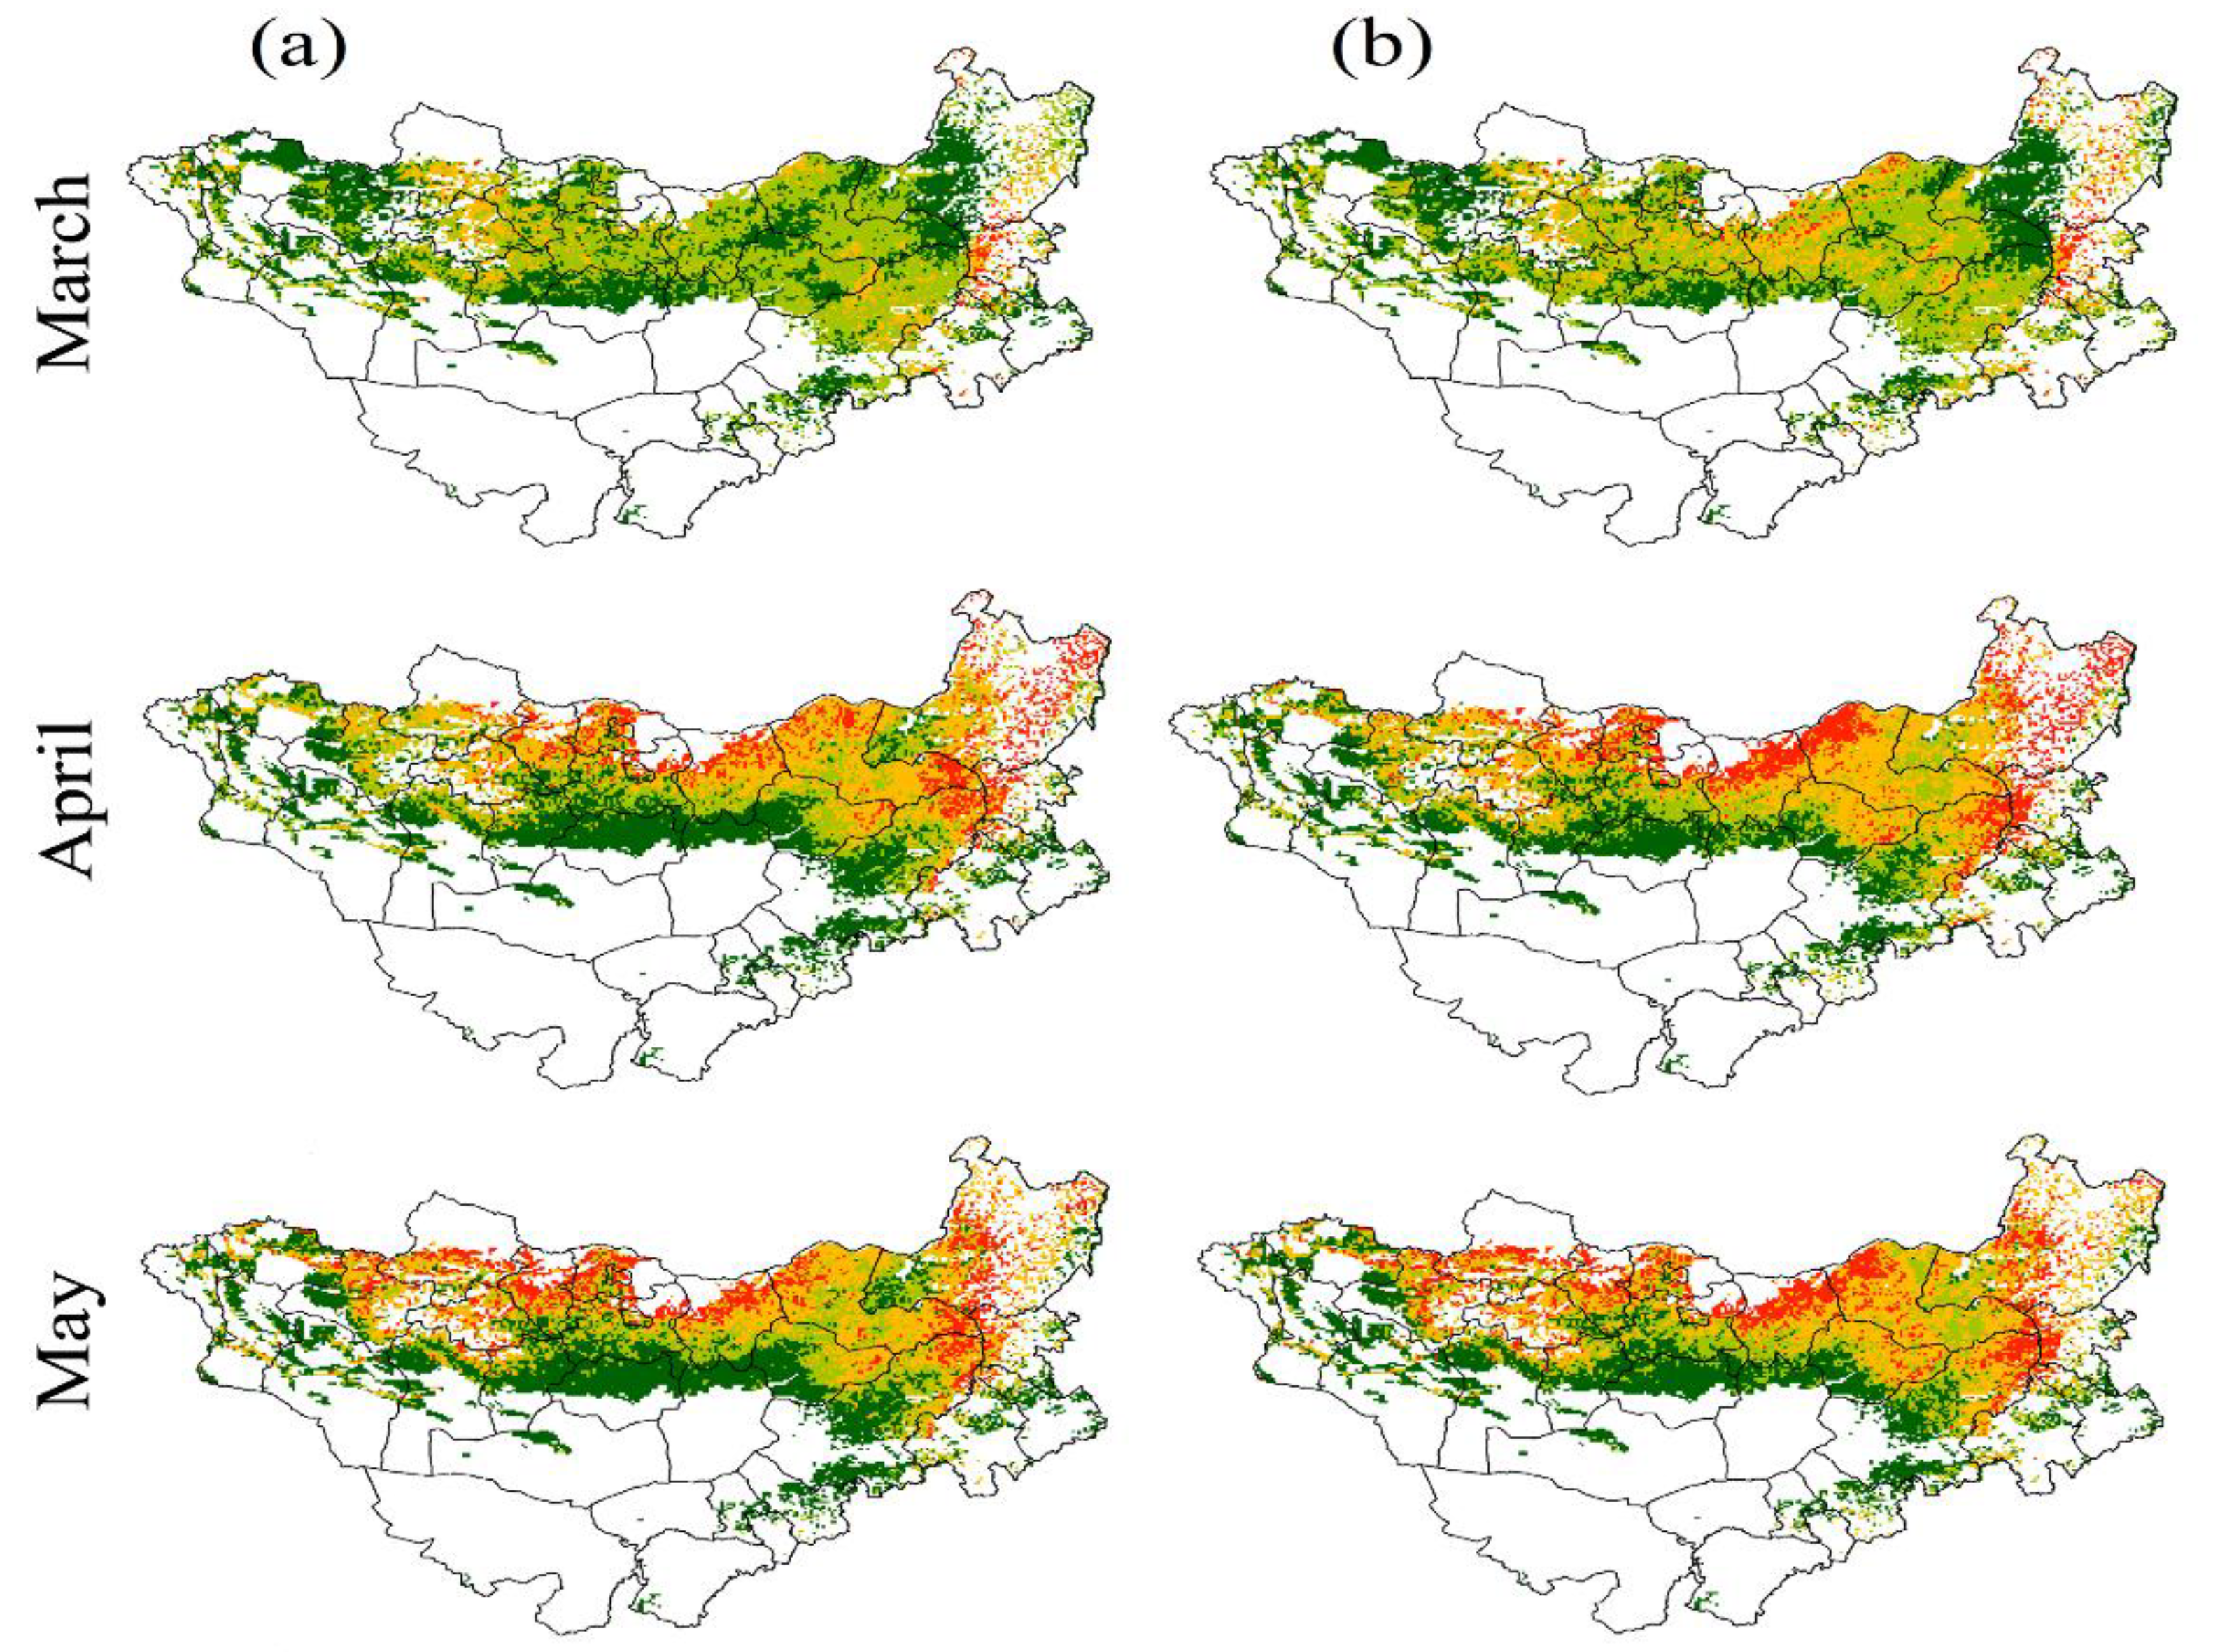
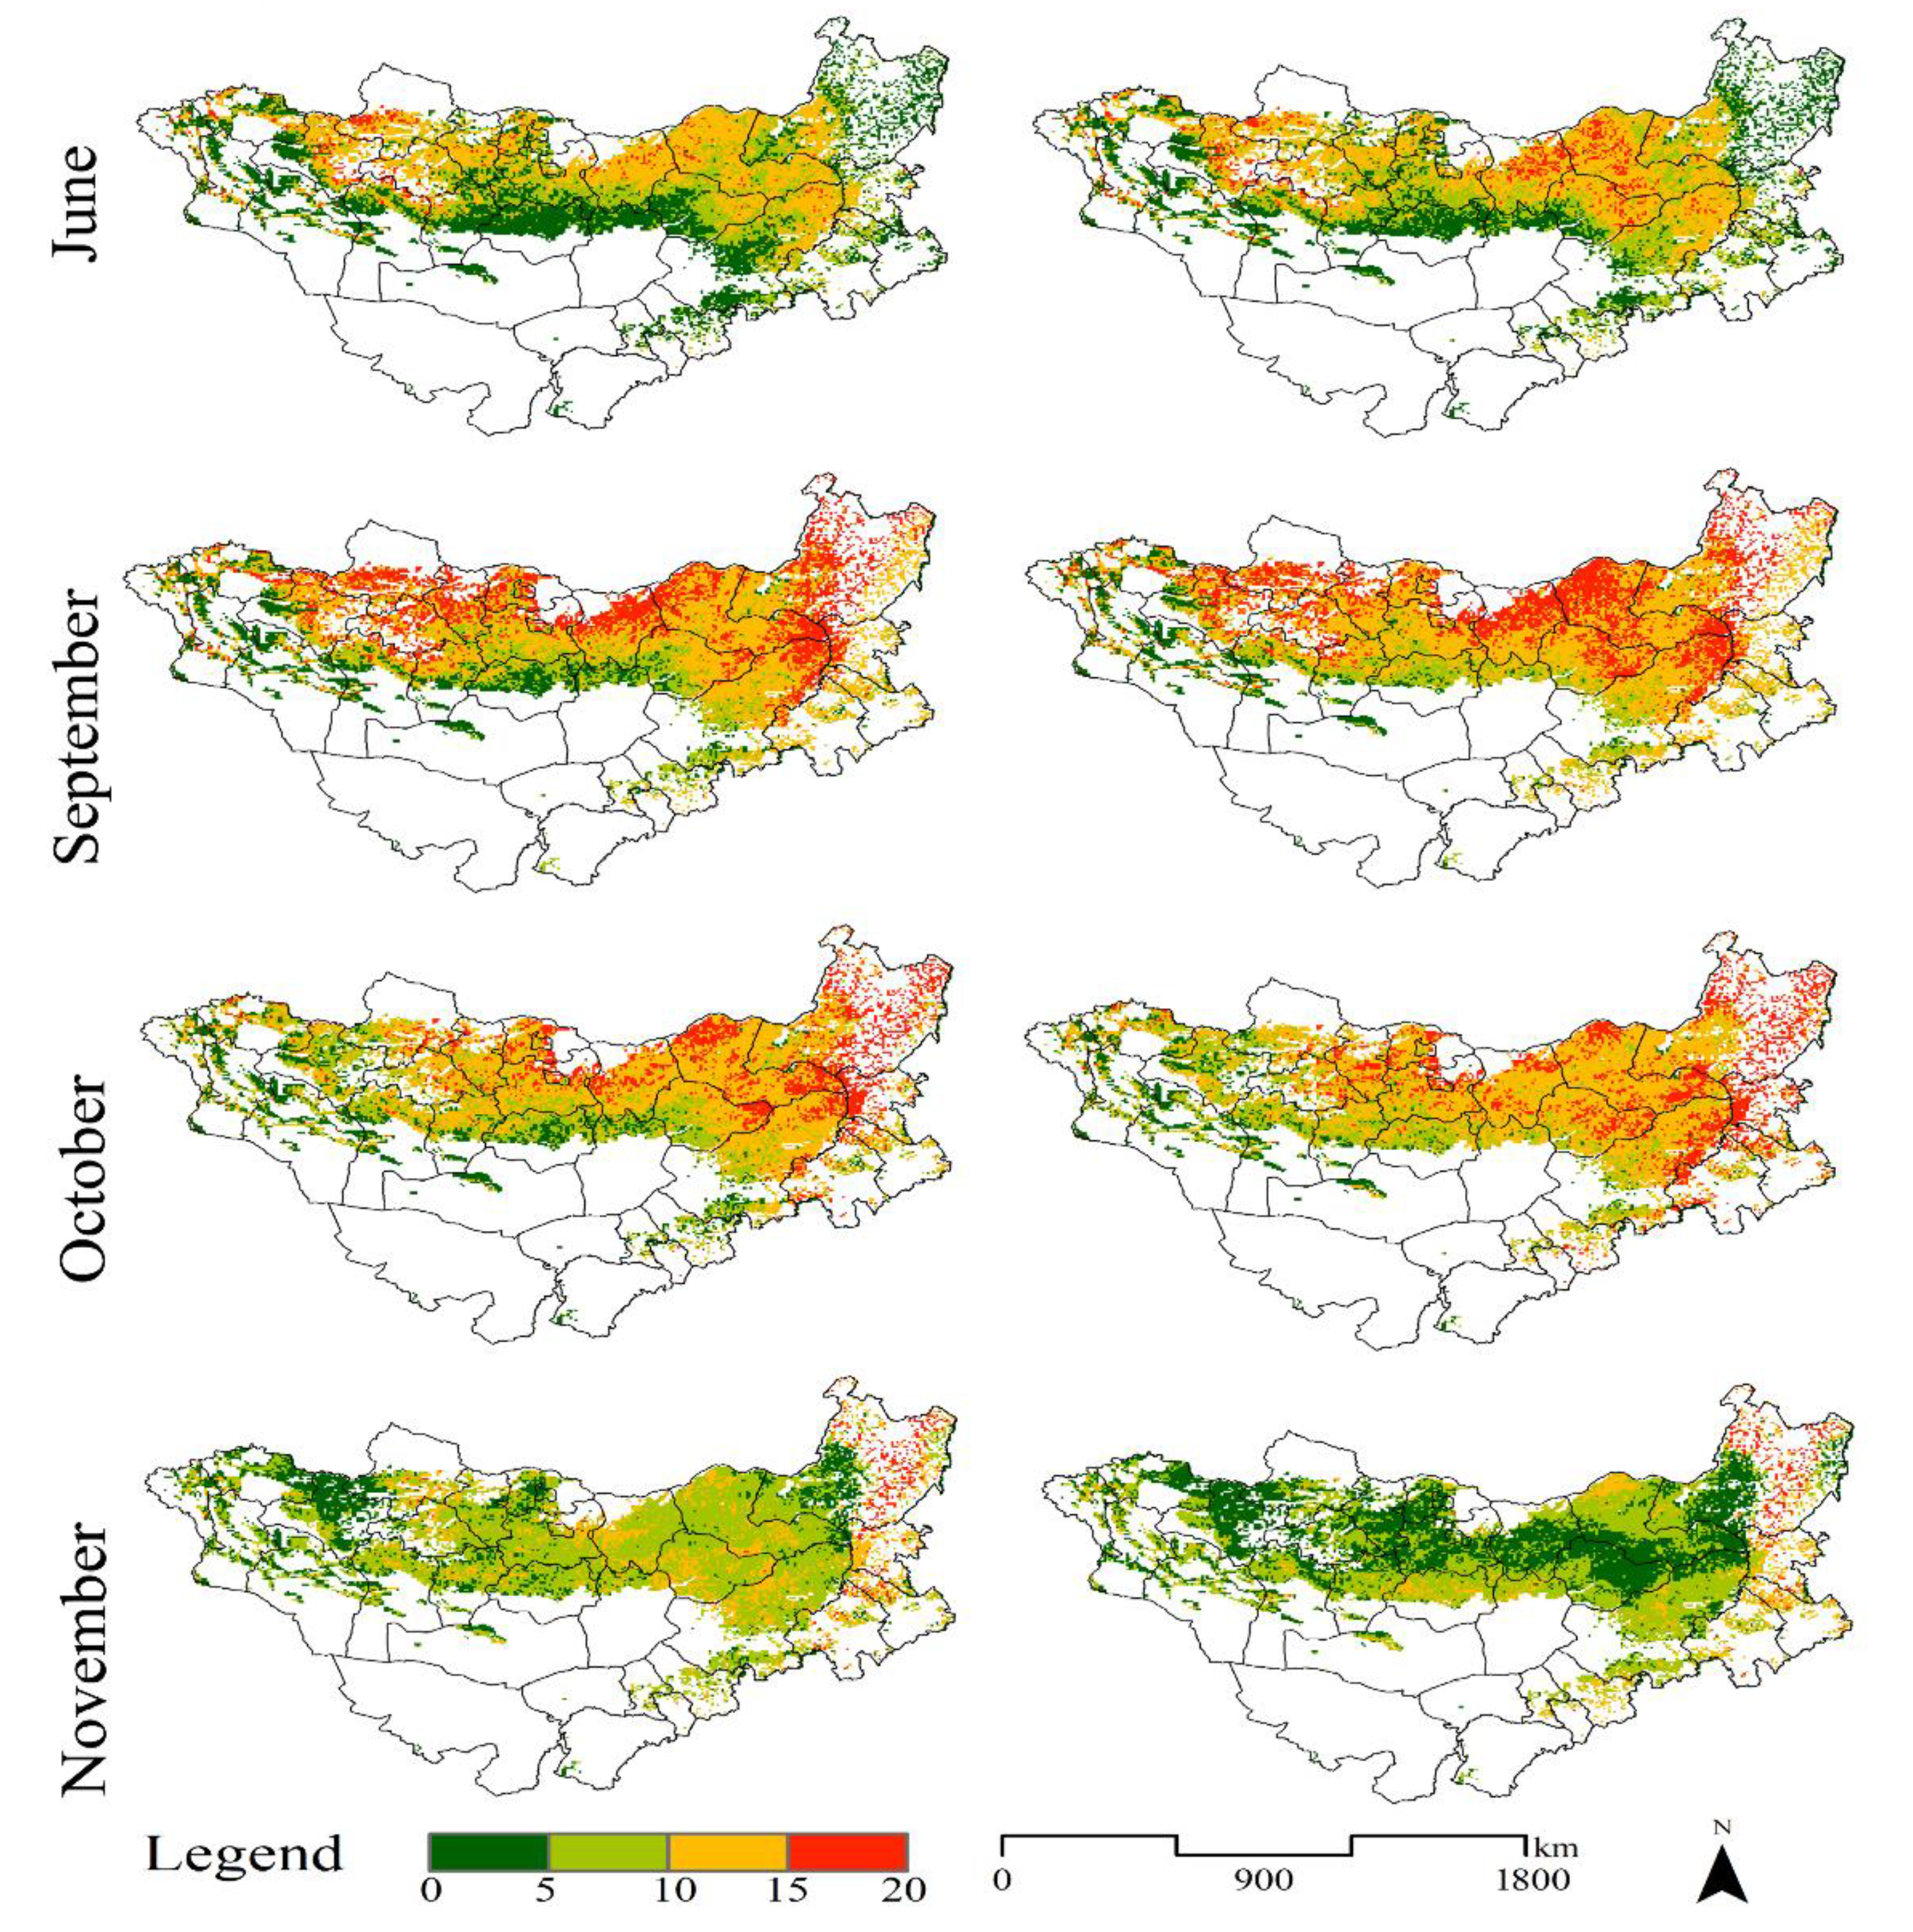
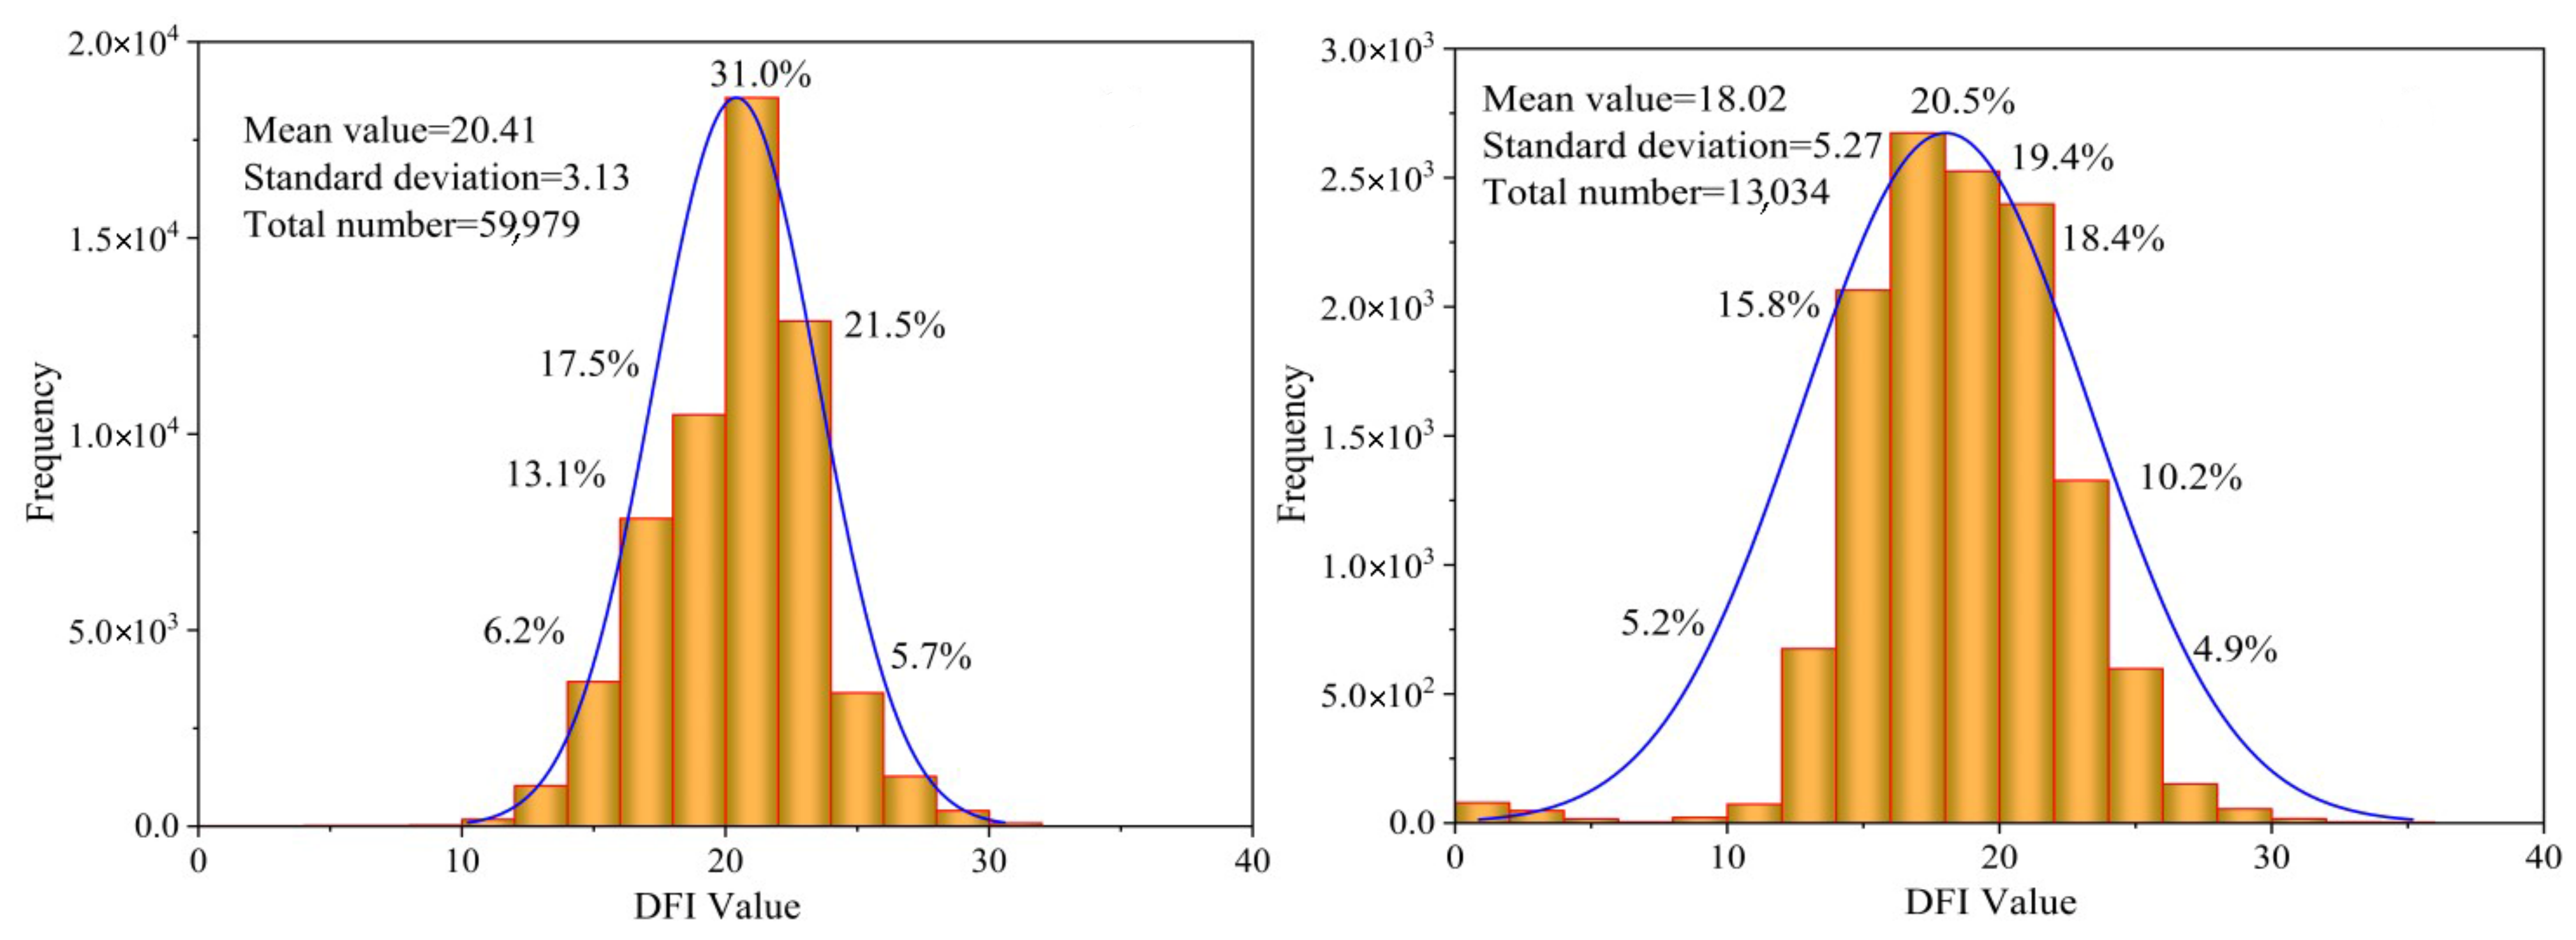
3.3.1. Analysis of DFI Change Patterns in the Mongolian Plateau from 2000 to 2020
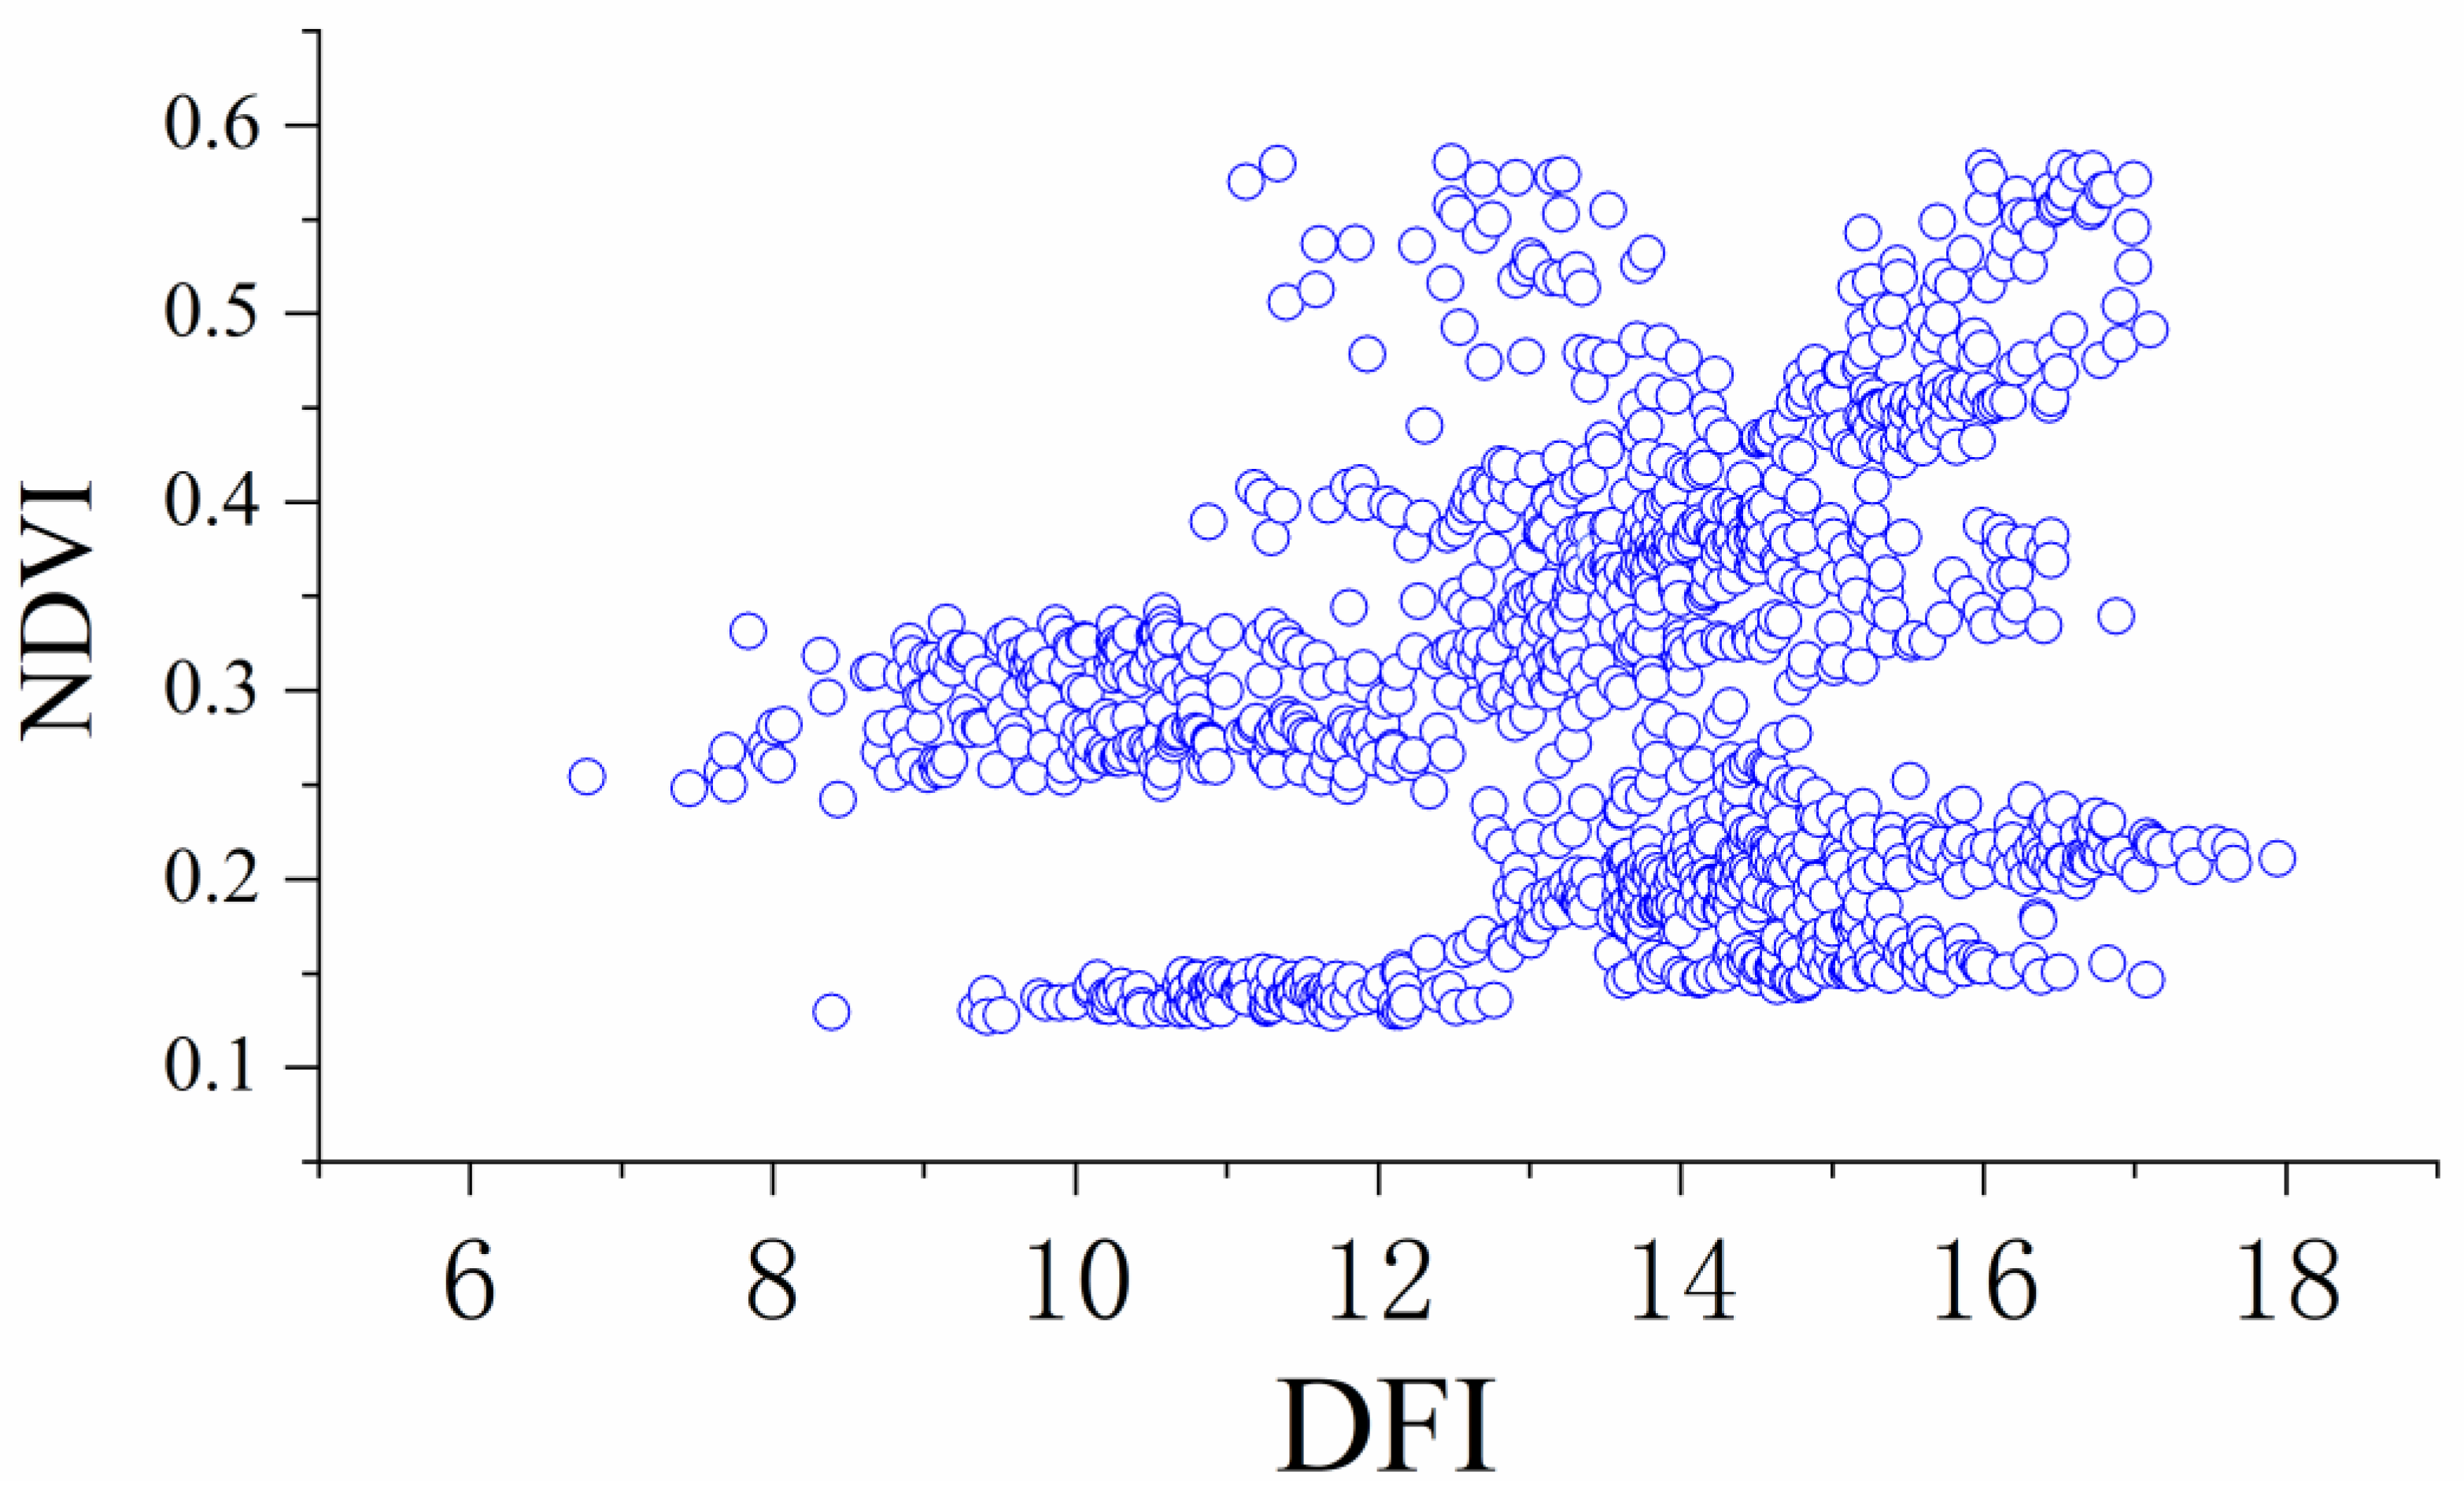
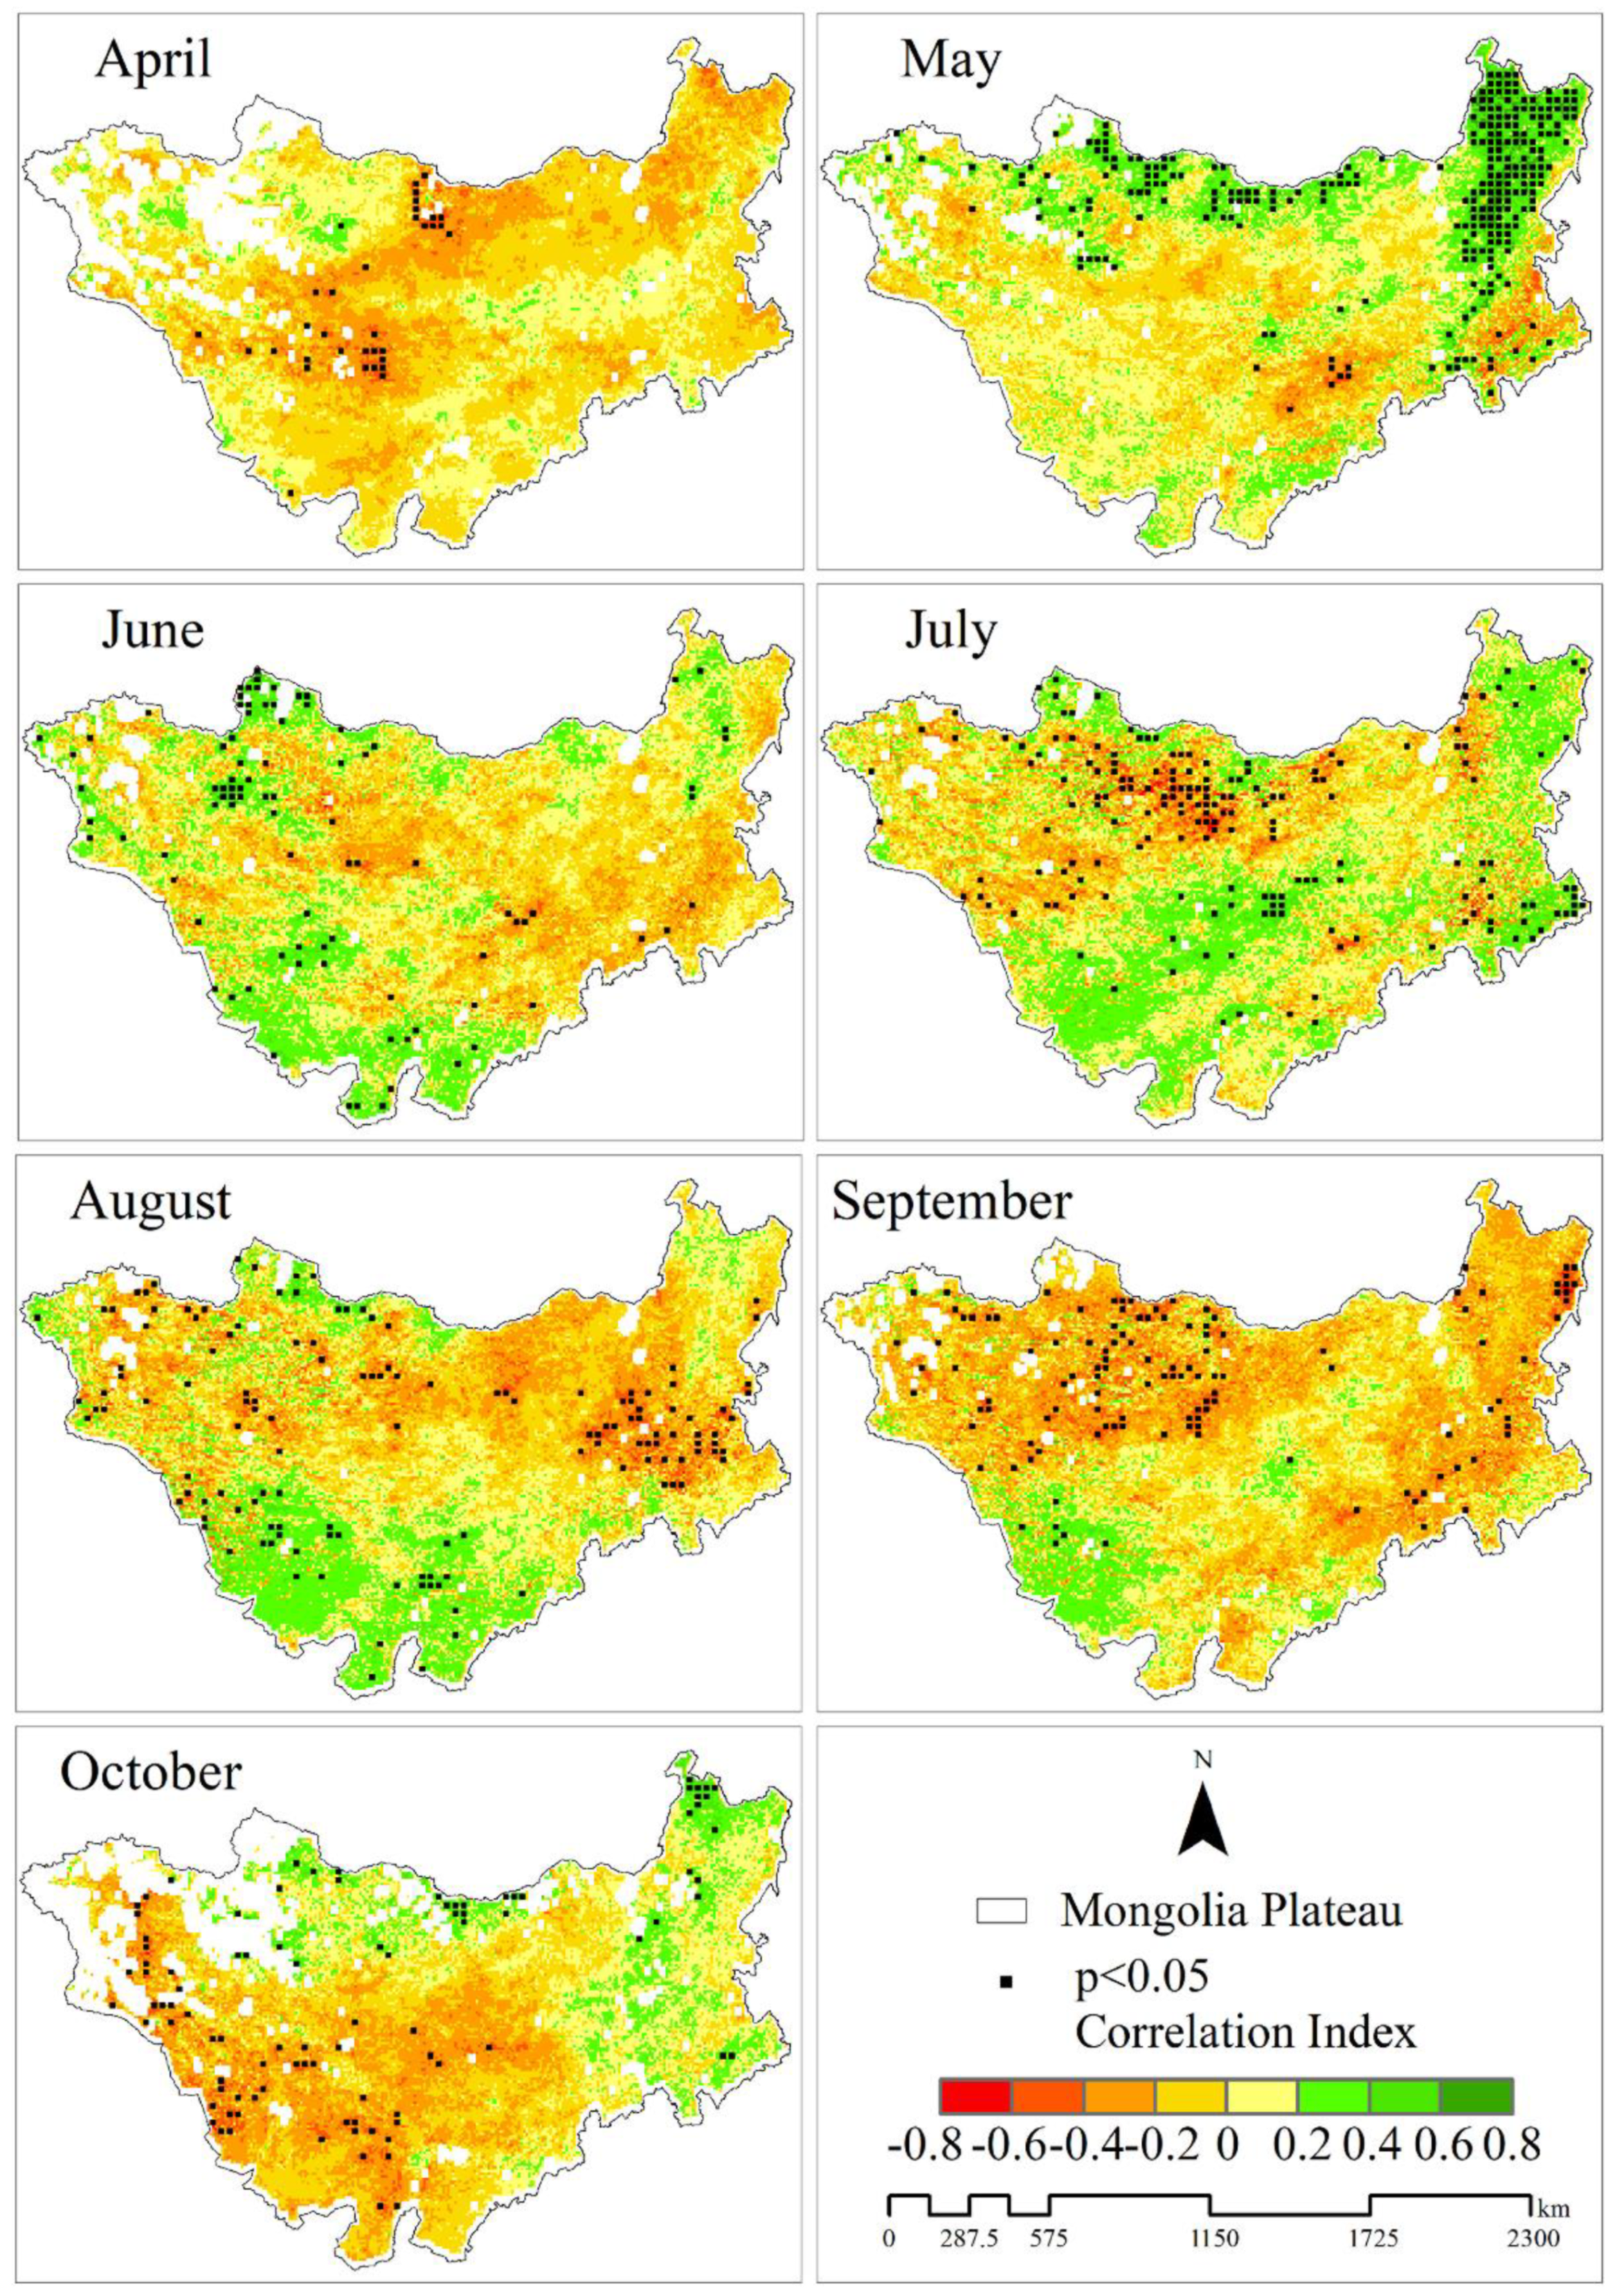
3.3.2. Relationship between NDVI and Wildfire with Vegetation Zone Change
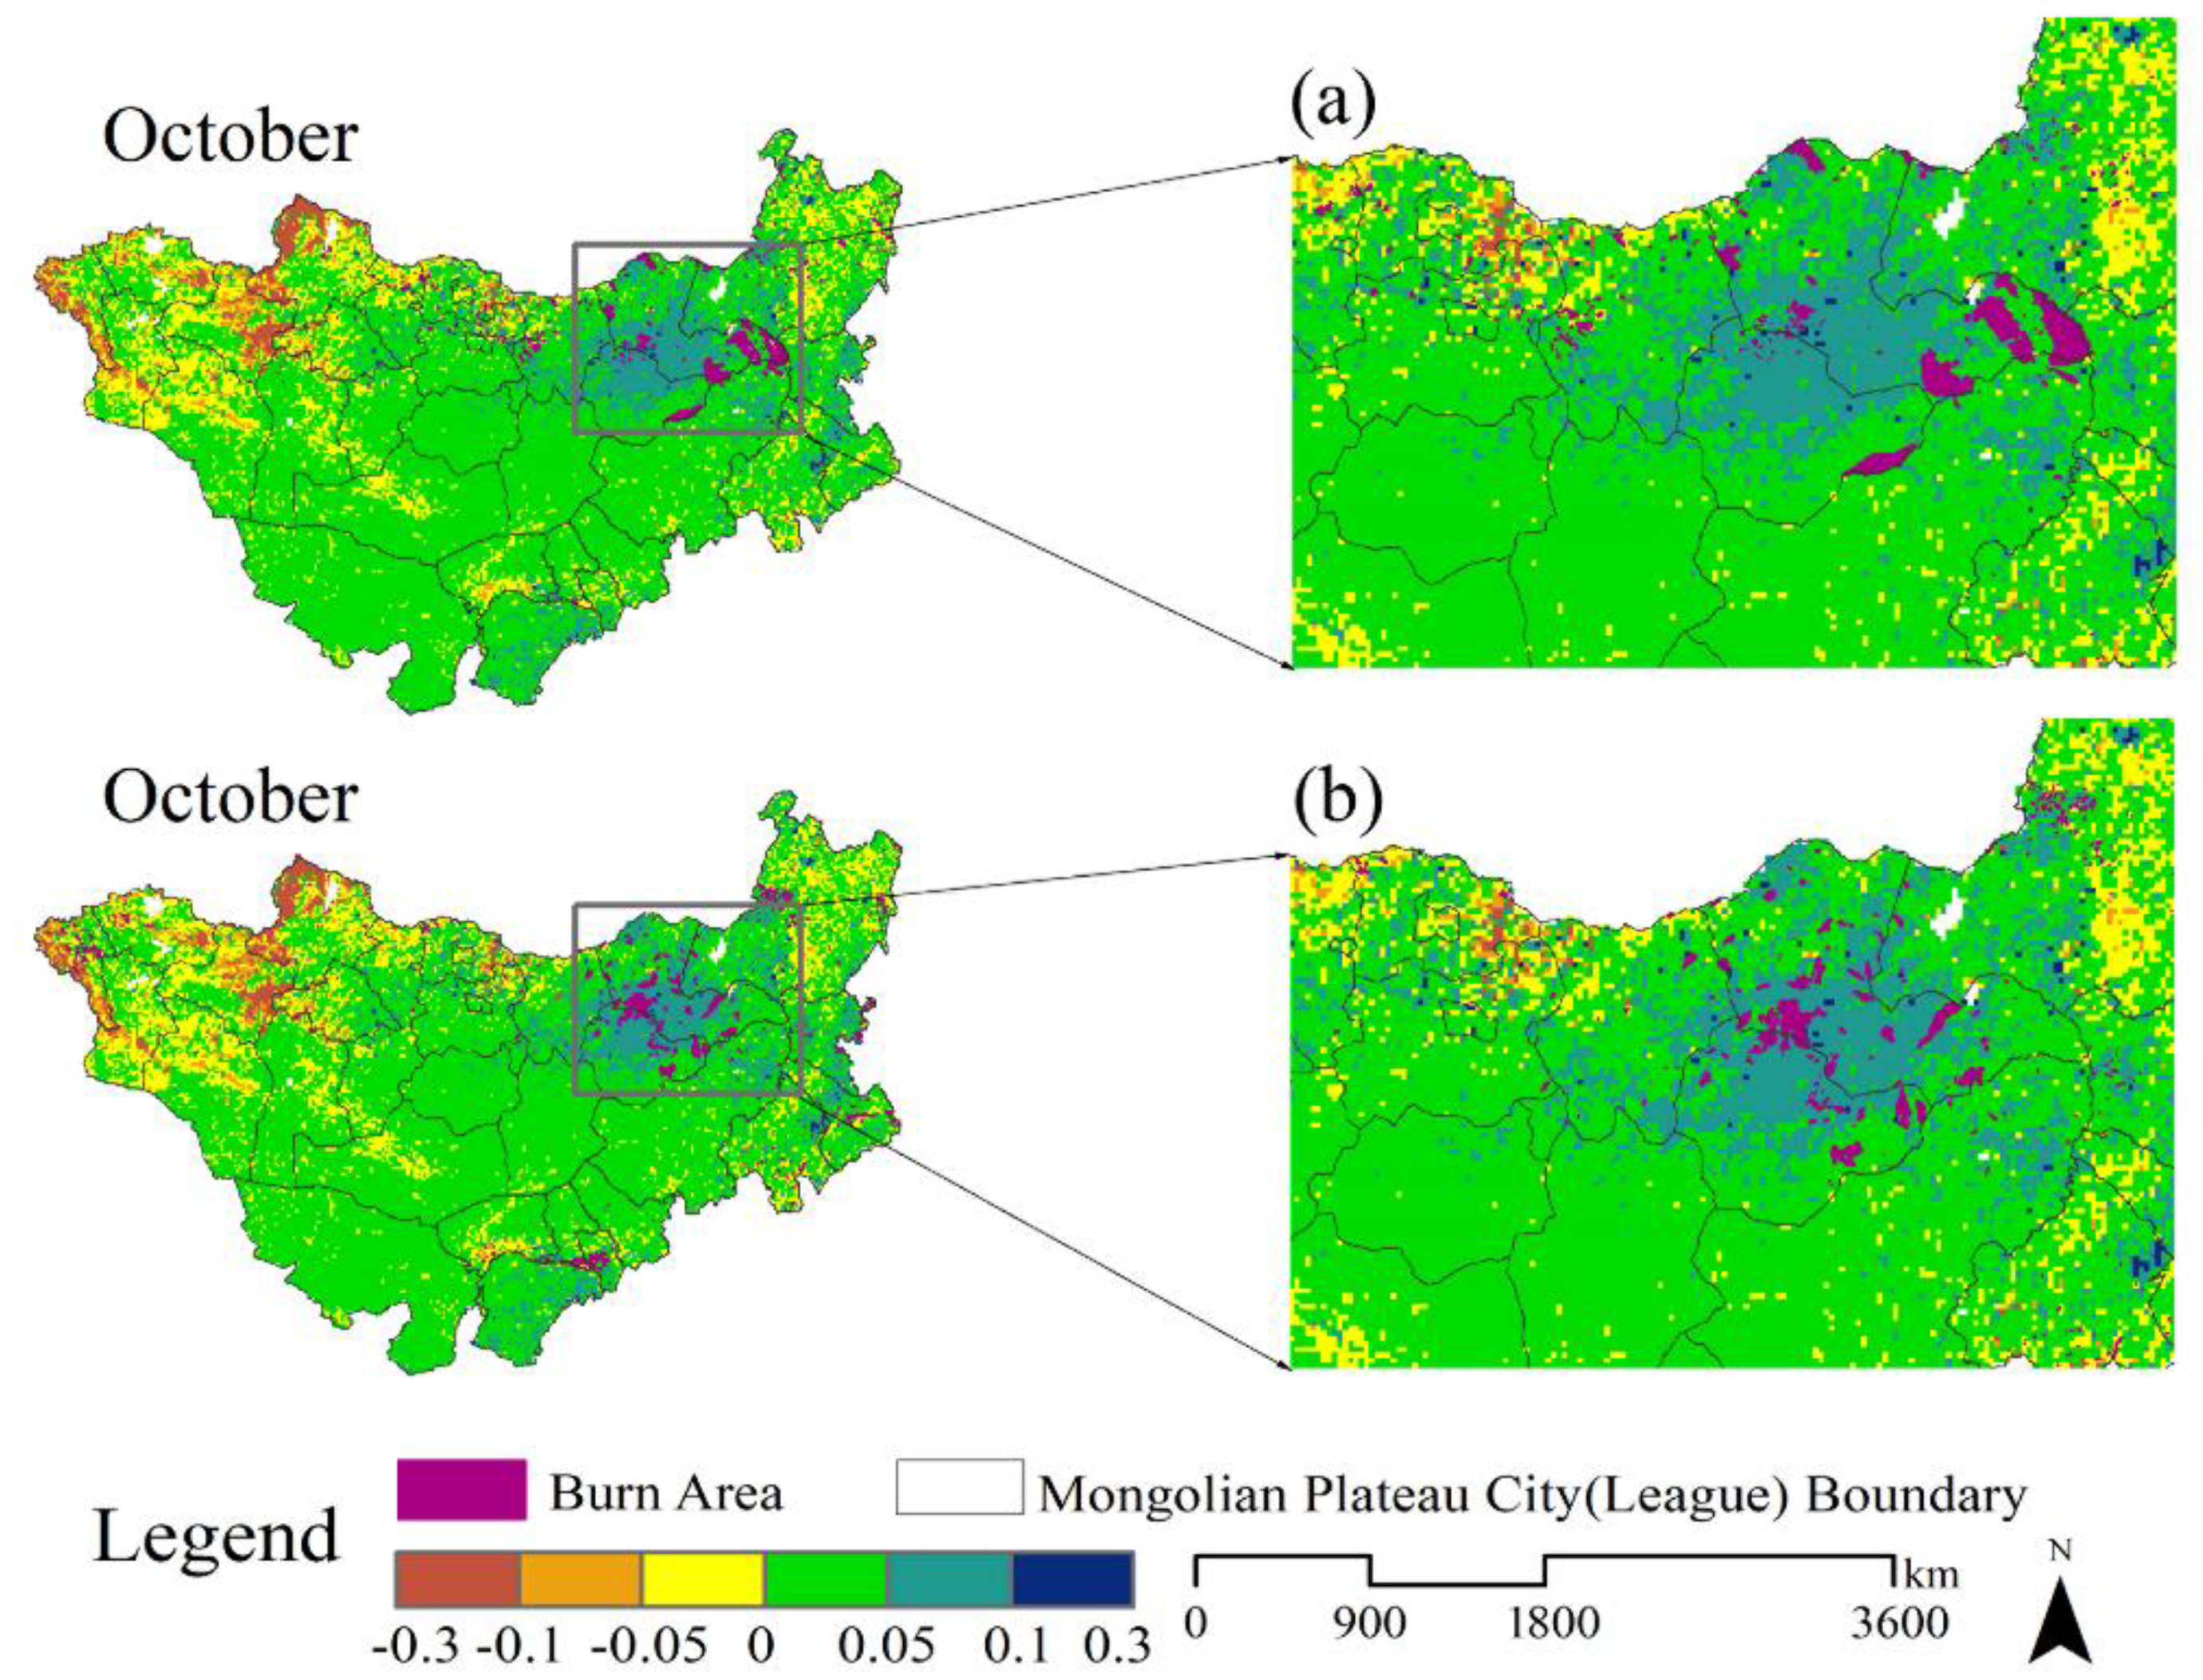
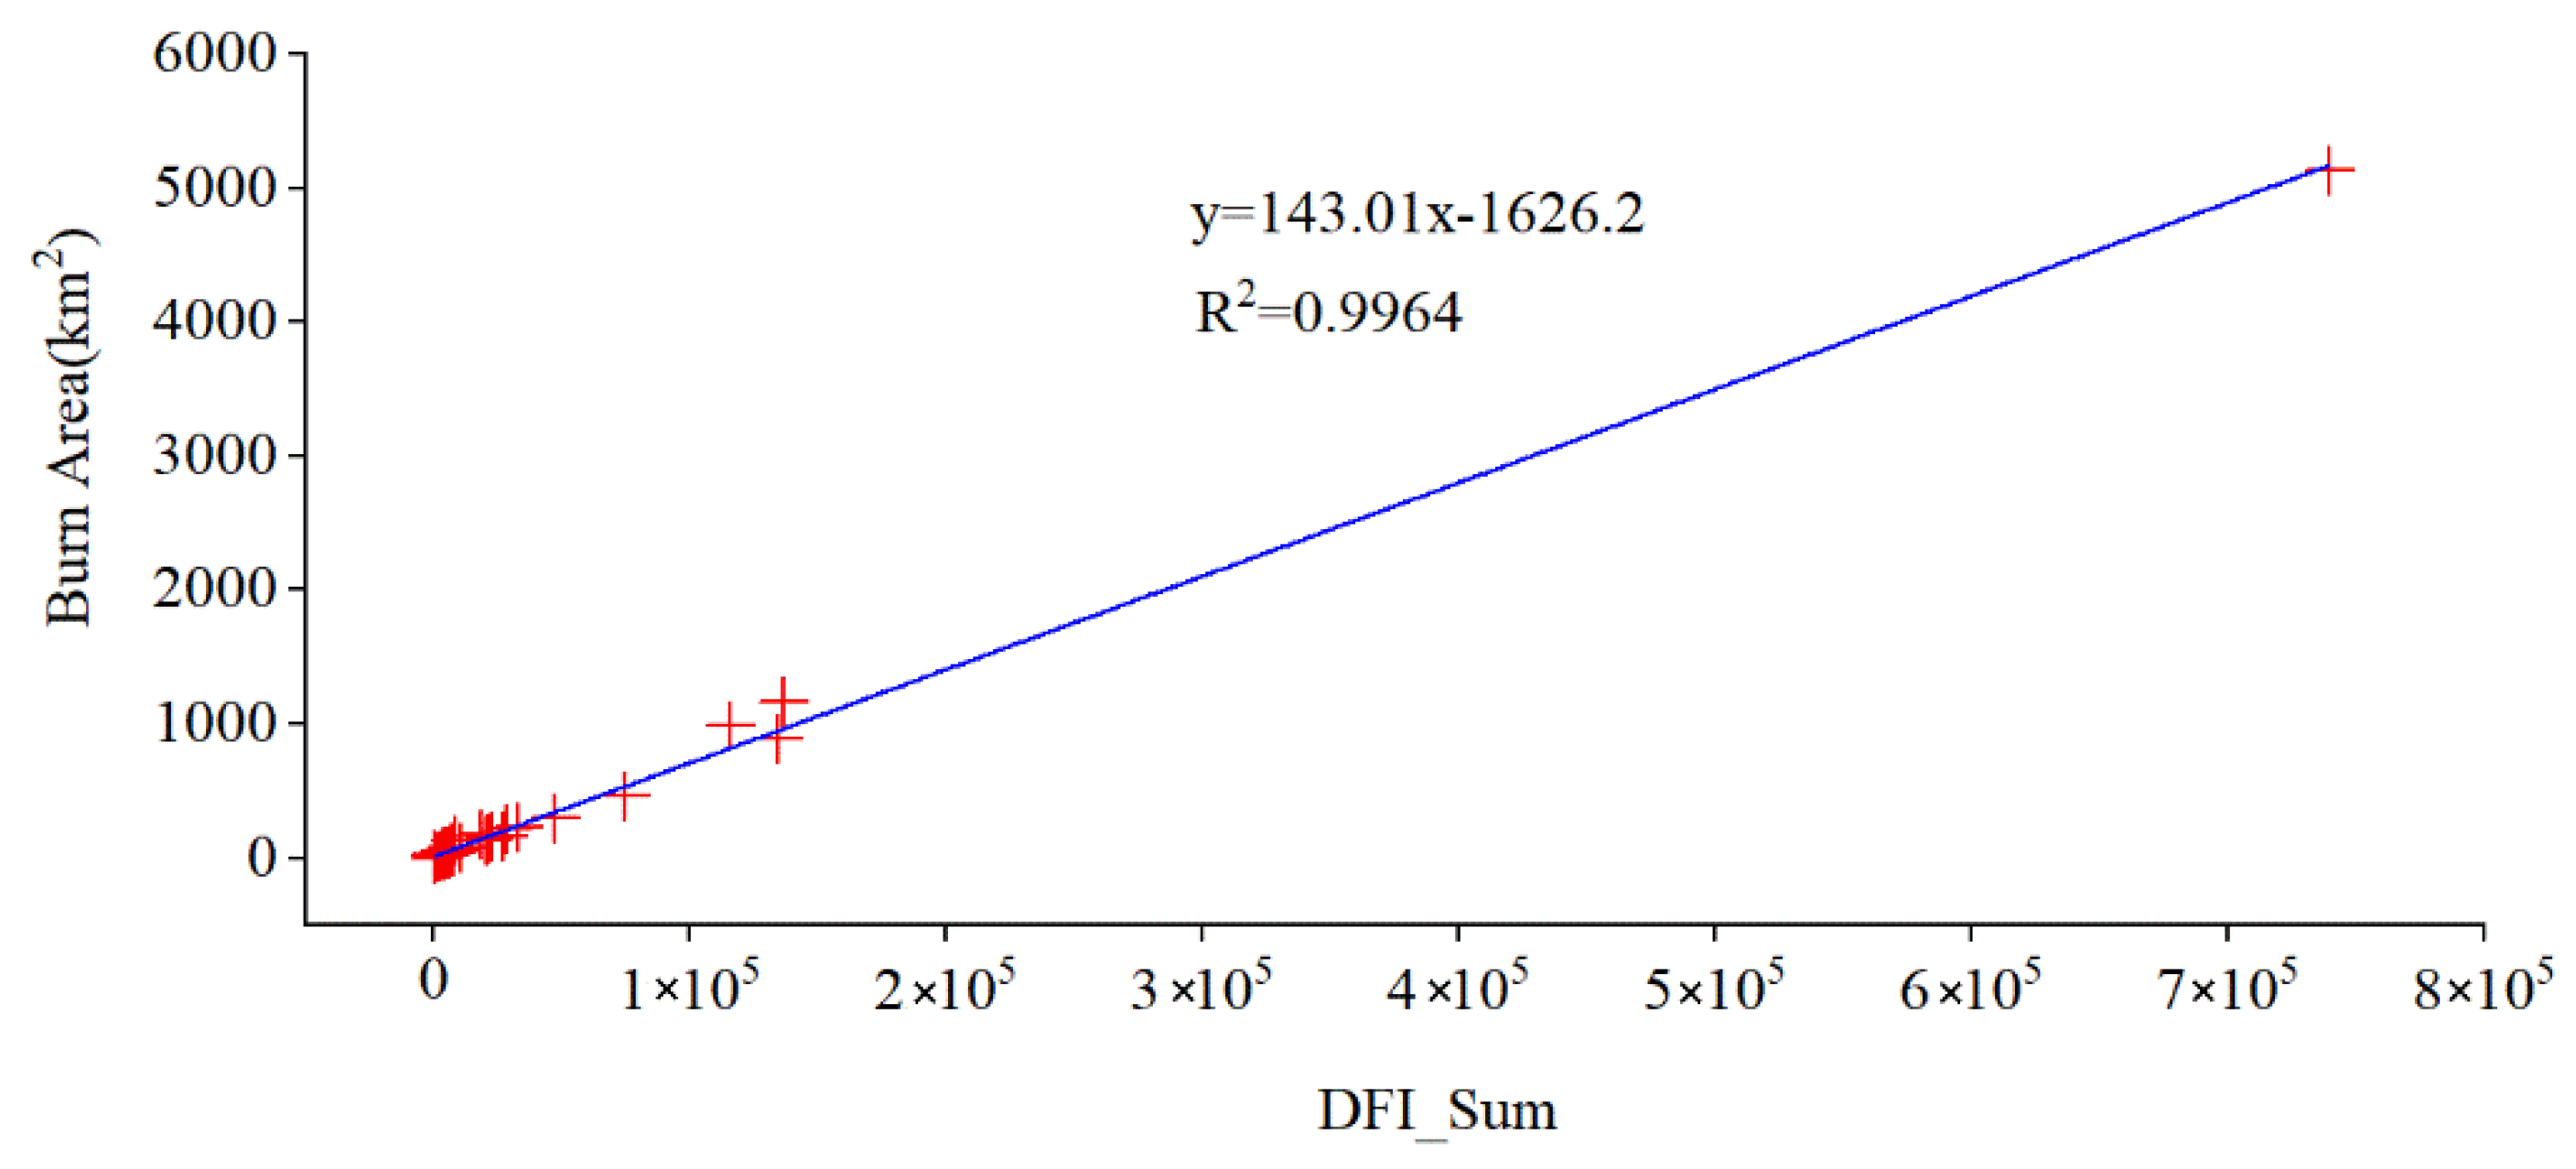
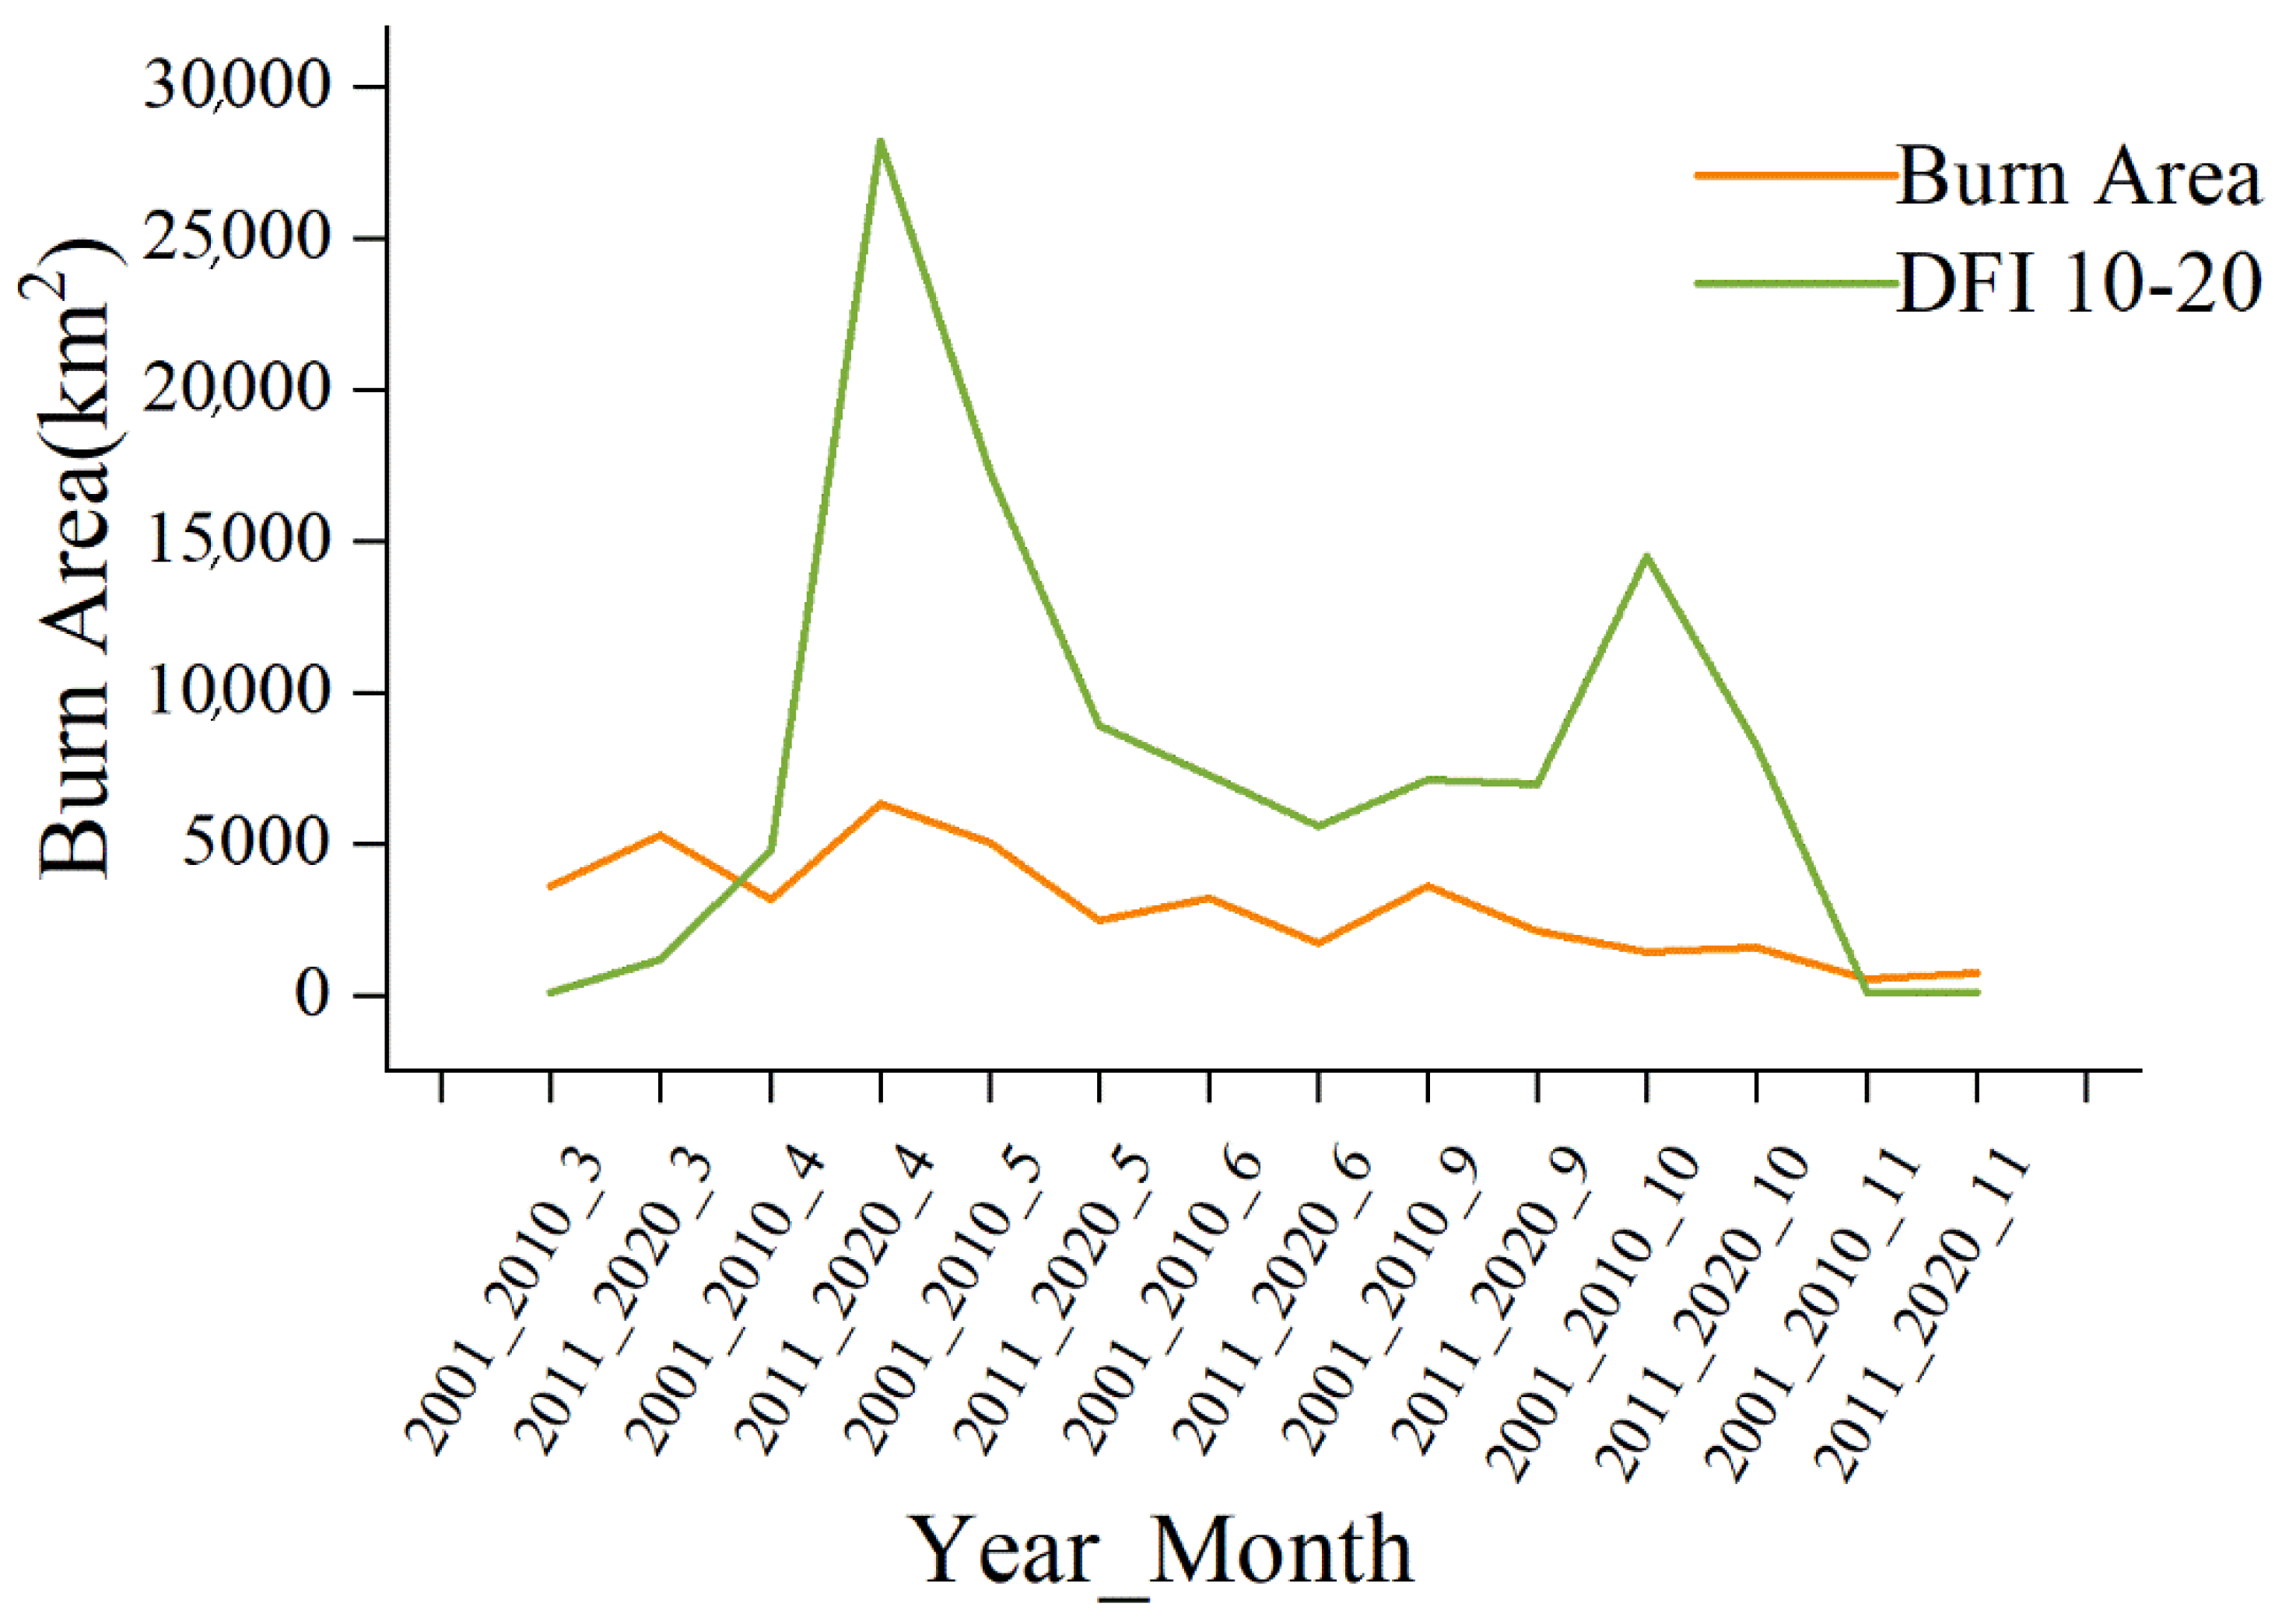
3.3.3. Relationship between DFI and wildfire with Vegetation Zone Change
4. Discussion
4.1. NDVI and Hydrothermal Conditions
4.2. NDVI and DFI Movement Distribution
4.3. NDVI and DFI Movement Distribution and the Relationship between Fires
5. Conclusions
Author Contributions
Funding
Data Availability Statement
Conflicts of Interest
References
- Løkken, J.O.; Evju, M.; Söderström, L.; Hofgaard, A. Vegetation response to climate warming across the forest–tundra ecotone: Species-dependent upward movement. J. Veg. Sci. 2020, 31, 854–866. [Google Scholar] [CrossRef]
- Pecl, G.T.; Araújo, M.B.; Bell, J.D.; Blanchard, J.; Bonebrake, T.C.; Chen, I.-C.; Clark, T.D.; Colwell, R.K.; Danielsen, F.; Evengård, B.; et al. Biodiversity redistribution under climate change: Impacts on ecosystems and human well-being. Science 2017, 355, 1389. [Google Scholar] [CrossRef] [PubMed]
- Hansson Amanda, D.P.; Jamie, S. A review of modern treeline migration, the factors controlling it and the implications for carbon storage. J. Mt. Sci. 2021, 18, 291–306. [Google Scholar] [CrossRef]
- Harsch, M.A.; Hulme, P.E.; McGlone, M.S.; Duncan, R. Are treelines advancing? A global meta-analysis of treeline response to climate warming. Ecol. Lett. 2009, 12, 1040–1049. [Google Scholar] [CrossRef]
- Mekonnen, Z.A.; Riley, W.J.; Berner, L.T.; Bouskill, N.J.; Torn, M.S.; Iwahana, G.; Breen, A.L.; Myers-Smith, I.H.; Criado, M.G.; Liu, Y.; et al. Arctic tundra shrubification: A review of mechanisms and impacts on ecosystem carbon balance. Environ. Res. Lett. 2021, 16, 053001. [Google Scholar] [CrossRef]
- Anne, E.; Kelly, M.L.G. Rapid shifts in plant distribution with recent climate change. Proc. Natl. Acad. Sci. USA 2008, 105, 11823–11826. [Google Scholar]
- Crimmins, S.M. Changes in climatic water balance drive downhill shifts in plant species’optimum elevations. Science 2011, 331, 324–327. [Google Scholar] [CrossRef]
- Liang, Q.; Xu, X.; Mao, K.; Wang, M.; Wang, K.; Xi, Z.; Liu, J. Shifts in plant distributions in response to climate warming in a biodiversity hotspot, the Hengduan mountains. J. Biogeogr. 2018, 45, 1334–1344. [Google Scholar] [CrossRef]
- Oliveira, U.; Soares-Filho, B.; Costa, W.L.d.S.; Gomes, L.; Bustamante, M.; Miranda, H. Modeling fuel loads dynamics and fire spread probability in the brazilian cerrado. For. Ecol. Manag. 2021, 482, 118889. [Google Scholar] [CrossRef]
- Bowman, D.M.; Kolden, C.A.; Abatzoglou, J.T.; Johnston, F.H.; van der Werf, G.R.; Flannigan, M. Vegetation fires in the anthropocene. Nat. Rev. Earth Environ. 2020, 1, 500–515. [Google Scholar] [CrossRef]
- Chen, Y.; Romps, D.M.; Seeley, J.T.; Veraverbeke, S.; Riley, W.J.; Mekonnen, Z.A.; Randerson, J.T. Future increases in arctic lightning and fire risk for permafrost carbon. Nat. Clim. Change 2021, 11, 404–410. [Google Scholar] [CrossRef]
- Liu, M.; Yang, L. Northward expansion of fire-adaptative vegetation in future warming. Environ. Res. Lett. 2022, 17, 024008. [Google Scholar] [CrossRef]
- Carlson, J.D.; Burgan, R.E. Review of users’ needs in operational fire danger estimation: The Oklahoma example. Int. J. Remote Sens. 2010, 24, 1601–1620. [Google Scholar] [CrossRef]
- Ping, G.; Chunli, K.; Wei, T. Relationship between the characteristics of fuel bed and fire behavior in grassland. Arid Zone Res. 2002, 19, 13–16. [Google Scholar]
- Zheng, H.; Ju, E.; Chai, R.; Du, X. Forest Fire Management; Press of Northeast Forestry University: Harbin, China, 1988; pp. 5–10. [Google Scholar]
- Li, Y.; Wang, S. Response of plant and plant community to different stocking rates. Grassl. China 1999, 3, 11–19. [Google Scholar]
- Li, H.; Pan, H.; Wang, G. Degradation causes of typical steppe in Inner Mongolia. Pratacultural Sci. 2004, 21, 49–51. [Google Scholar]
- Wang, S.-P.; Li, Y.-H.; Wang, Y.-F.; Chen, Z.-Z. Influence of different stocking rates on plant diversity of artemisia frigida community in Inner Mongolia steppe. Acta Bot. Sin. 2001, 43, 89–96. [Google Scholar]
- Taneja, R.; Hilton, J.; Wallace, L.; Reinke, K.; Jones, S. Effect of fuel spatial resolution on predictive wildfire models. Int. J. Wildland Fire 2021, 30, 776–789. [Google Scholar] [CrossRef]
- Hurteau, M.D.; Liang, S.; Westerling, A.L.; Wiedinmyer, C. Vegetation-fire feedback reduces projected area burned under climate change. Sci. Rep. 2019, 9, 2838. [Google Scholar] [CrossRef]
- Hanan, E.J.; Kennedy, M.C.; Ren, J.; Johnson, M.C.; Smith, A.M.S. Missing climate feedbacks in fire models limitations and uncertainties in fuel loadings and the role of decomposition in fine fuel accumulation. J. Adv. Model. Earth Syst. 2021, 14, 2818. [Google Scholar] [CrossRef]
- Riley, K.L.; Williams, A.P.; Urbanski, S.P.; Calkin, D.E.; Short, K.C.; O’Connor, C.D. Will landscape fire increase in the future a systems approach to climate, fire, fuel, and human drivers. Curr. Pollut. Rep. 2019, 5, 9–24. [Google Scholar] [CrossRef]
- Davis, C. Earth, fuel and fire. Nat. Rev. Earth Environ. 2021, 2, 742. [Google Scholar] [CrossRef]
- Abatzoglou, J.T.; Battisti, D.S.; Williams, A.P.; Hansen, W.D.; Harvey, B.J.; Kolden, C.A. Projected increases in western US forest fire despite growing fuel constraints. Commun. Earth Environ. 2021, 2, 227. [Google Scholar] [CrossRef]
- Calviño-Cancela, M.; Lorenzo, P.; González, L. Fire increases eucalyptus globulus seedling recruitment in forested habitats effects of litter, shade and burnt soil on seedling emergence and survival. For. Ecol. Manag. 2018, 409, 826–834. [Google Scholar] [CrossRef]
- van der Werf, G.R.; Randerson, J.T.; Giglio, L.; van Leeuwen, T.T.; Chen, Y.; Rogers, B.M.; Mu, M.; van Marle, M.J.E.; Morton, D.C.; Collatz, G.J.; et al. Global fire emissions estimates during 1997–2016. Earth Syst. Sci. Data 2017, 9, 697–720. [Google Scholar] [CrossRef]
- John, T.; Abatzoglou, A.P.W. Impact of anthropogenic climate change on wildfire across western US forests. Proc. Natl. Acad. Sci. USA 2016, 113, 11770. [Google Scholar]
- Carol Miller, D.L.U. Connectivity of forest fuels and surface fire regimes. Landsc. Ecol. 2000, 15, 145–154. [Google Scholar] [CrossRef]
- Juli, G.; Pausas, S.P. Fuel shapes the fire–climate relationship: Evidence from mediterranean ecosystems. Glob. Ecol. Biogeogr. 2012, 21, 1074–1082. [Google Scholar]
- Sah, J.P.; Ross, M.S.; Snyder, J.R.; Koptur, S.; Cooley, H.C. Fuel loads, fire regimes, and post-fire fuel dynamics in Florida keys pine forests. Int. J. Wildland Fire 2006, 15, 463–478. [Google Scholar] [CrossRef]
- Syphard, A.D.; Radeloff, V.C.; Keeley, J.E.; Hawbaker, T.J.; Clayton, M.K.; Stewart, S.I.; Hammer, R.B. Human influence on California fire regimes. Ecol. Appl. 2007, 17, 1388–1402. [Google Scholar] [CrossRef]
- Balch, J.K.; Bradley, B.A.; Abatzoglou, J.T.; Nagy, R.C.; Fusco, E.J.; Mahood, A.L. Human-started wildfires expand the fire niche across the United States. Proc. Natl. Acad. Sci. USA 2016, 114, 2946–2951. [Google Scholar] [CrossRef]
- Tong, S.; Zhang, J.; Bao, Y.; Lai, Q.; Lian, X.; Li, N.; Bao, Y. Analyzing vegetation dynamic trend on the Mongolian plateau based on the hurst exponent and influencing factors from 1982–2013. J. Geogr. Sci. 2018, 28, 595–610. [Google Scholar] [CrossRef]
- Bao, G.; Qin, Z.; Bao, Y.; Zhou, Y.; Li, W.; Sanjjav, A. Ndvi-based long-term vegetation dynamics and its response to climatic change in the Mongolian plateau. Remote Sens. 2014, 6, 8337–8358. [Google Scholar] [CrossRef]
- Na, L.; Zhang, J.; Bao, Y.; Bao, Y.; Na, R.; Tong, S.; Si, A. Himawari-8 satellite based dynamic monitoring of grassland fire in China-Mongolia border regions. Sensors 2018, 18, 276. [Google Scholar] [CrossRef]
- Liu, X.; Zhang, J.; Tong, Z.; Bao, Y. Gis-based multi-dimensional risk assessment of the grassland fire in northern China. Nat. Hazards 2012, 64, 381–395. [Google Scholar] [CrossRef]
- Bao, Y.L.; Zhang, J.Q.; Liu, X.P.; Chen, P.; Liu, X.J.; Zhang, Q. Analysis on grass fire traces extracted and pre-disaster characteristics of combustibles based on hj-1b satellite data. J. Catastrophology 2013, 28, 32–45. [Google Scholar]
- Zhang, J.; Cui, L.; Tong, Z.; Liu, X.; Bao, Y. Grid gis and optimal segmentation based early warning of grassland fire disaster risk threshold in Hulunbeier grassland. Syst. Eng.-Theory Pract. 2013, 33, 770–775. [Google Scholar]
- Liu, M.; Yang, L. Human-caused fires release more carbon than lightning-caused fires in the conterminous United States. Environ. Res. Lett. 2020, 16, 014013. [Google Scholar] [CrossRef]
- Chen, G.; Hayes, D.J.; David McGuire, A. Contributions of wildland fire to terrestrial ecosystem carbon dynamics in North America from 1990 to 2012. Glob. Biogeochem. Cycles 2017, 31, 878–900. [Google Scholar] [CrossRef]
- Na, R.; Na, L.; Du, H.; He, H.S.; Shan, Y.; Zong, S.; Huang, L.; Yang, Y.; Wu, Z. Vegetation greenness variations and response to climate change in the arid and semi-arid transition zone of the Mongolian plateau during 1982–2015. Remote Sens. 2021, 13, 4066. [Google Scholar] [CrossRef]
- Luo, M.; Meng, F.; Sa, C.; Duan, Y.; Bao, Y.; Liu, T.; De Maeyer, P. Response of vegetation phenology to soil moisture dynamics in the Mongolian plateau. Catena 2021, 129, 107945. [Google Scholar] [CrossRef]
- Neupert, R.F. Population, nomadic pastoralism and the environment in the Mongolian plateau. Popul. Environ. 1999, 20, 413–441. [Google Scholar] [CrossRef]
- Feng, Z.D.; Zhai, X.W.; Ma, Y.Z.; Huang, C.Q.; Wang, W.G.; Zhang, H.C.; Khosbayar, P.; Narantsetseg, T.; Liu, K.B.; Rutter, N.W. Eolian environmental changes in the northern Mongolian plateau during the past∼35,000 year. Palaeogeogr. Palaeoclimatol. Palaeoecol. 2007, 245, 505–517. [Google Scholar] [CrossRef]
- Liu, J.; Qi, Y.; Shi, H.; Zhuang, D.; Hu, Y. Estimation of wind erosion rates by using 137cs tracing technique: A case study in Tariat-Xilin Gol Transect, Mongolian plateau. Chin. Sci. Bull. 2008, 53, 751–758. [Google Scholar] [CrossRef]
- Zhang, X.; Hu, Y.; Zhuang, D.; Qi, Y.; Ma, X. Ndvi spatial pattern and its differentiation on the Mongolian plateau. J. Geogr. Sci. 2009, 19, 403–415. [Google Scholar] [CrossRef]
- Bao, G.; Bao, Y.; Qin, Z.; Xin, X.; Bao, Y.; Bayarsaikan, S.; Zhou, Y.; Chuntai, B. Modeling net primary productivity of terrestrial ecosystems in the semi-arid climate of the Mongolian plateau using lswi-based casa ecosystem model. Int. J. Appl. Earth Obs. Geoinf. 2016, 46, 84–93. [Google Scholar] [CrossRef]
- Bao, G.; Jin, H.; Tong, S.; Chen, J.; Huang, X.; Bao, Y.; Shao, C.; Mandakh, U.; Chopping, M.; Du, L. Autumn phenology and its covariation with climate, spring phenology and annual peak growth on the Mongolian plateau. Agric. For. Meteorol. 2021, 298–299, 108312. [Google Scholar] [CrossRef]
- Zhao, X.; Shen, H.; Geng, X.; Fang, J. Three-decadal destabilization of vegetation activity on the Mongolian plateau. Environ. Res. Lett. 2021, 16, 034049. [Google Scholar] [CrossRef]
- Bao, G.; Chen, J.; Chopping, M.; Bao, Y.; Bayarsaikhan, S.; Dorjsuren, A.; Tuya, A.; Jirigala, B.; Qin, Z. Dynamics of net primary productivity on the Mongolian plateau: Joint regulations of phenology and drought. Int. J. Appl. Earth Obs. Geoinf. 2019, 81, 85–97. [Google Scholar] [CrossRef]
- Chen, J.; John, R.; Sun, G.; Fan, P.; Henebry, G.M.; Fernández-Giménez, M.E.; Zhang, Y.; Park, H.; Tian, L.; Groisman, P.; et al. Prospects for the sustainability of social-ecological systems (ses) on the Mongolian plateau: Five critical issues. Environ. Res. Lett. 2018, 13, 123004. [Google Scholar] [CrossRef]
- Hilker, T.; Natsagdorj, E.; Waring, R.H.; Lyapustin, A.; Wang, Y. Satellite observed widespread decline in Mongolian grasslands largely due to overgrazing. Glob. Change Biol. 2014, 20, 418–428. [Google Scholar] [CrossRef]
- Gunin, P.D.; Saandar, M. Ecosystems of Mongolia: Atlas; Institute of Ecology and Evolution, Russian Academy of Sciences: Moscow, Russia, 2019. [Google Scholar]
- Xu, D.; Ding, W. Impacts and Risks of Climate Change: Impacts and Risks of Climate Change on Desertification; Science Press: Beijing, China, 2016. [Google Scholar]
- Ord, J.K.; Getis, A. Local spatial autocorrelation statistics distributional issues and an application. Geograph. Anal. 1995, 27, 286–306. [Google Scholar] [CrossRef]
- Mann, B.H.B. Nonparametric tests against trend. J. Econom. Soc. 1945, 13, 245–259. [Google Scholar] [CrossRef]
- Fan, P.Y.; Chun, K.P.; Mijic, A.; Tan, M.L.; He, Q.; Yetemen, O. Quantifying land use heterogeneity on drought conditions for mitigation strategies development in the Dongjiang river basin, China. Ecol. Indic. 2021, 129, 107945. [Google Scholar] [CrossRef]
- Sun, J.Y.; Li, M.Z.; Zheng, L.H.; Hu, Y.G.; Zhang, X.J. Real-time analysis of soil moisture, soil organic matter, and soil total nitrogen with nir spectra. Spectrosc. Spectr. Anal. 2006, 26, 426–429. [Google Scholar]
- Na, R.; Du, H.; Na, L.; Shan, Y.; He, H.S.; Wu, Z.; Zong, S.; Yang, Y.; Huang, L. Spatiotemporal changes in the aeolian desertification of Hulunbuir grassland and its driving factors in China during 1980–2015. Catena 2019, 182, 10412. [Google Scholar] [CrossRef]
- Yue, J.; Tian, Q. Estimating fractional cover of crop, crop residue, and soil in cropland using broadband remote sensing data and machine learning. Int. J. Appl. Earth Obs. Geoinf. 2020, 89, 1–15. [Google Scholar] [CrossRef]
- Li, Y.; Zhao, J.; Guo, X.; Zhang, Z.; Tan, G.; Yang, J. The influence of land use on the grassland fire occurrence in the northeastern Inner Mongolia autonomous region, China. Sensors 2017, 17, 437. [Google Scholar] [CrossRef]
- Wu, L.; Ma, X.; Dou, X.; Zhu, J.; Zhao, C. Impacts of climate change on vegetation phenology and net primary productivity in arid Central Asia. Sci. Total Environ. 2021, 796, 149055. [Google Scholar] [CrossRef]
- Sharma, S.; Carlson, J.D.; Krueger, E.S.; Engle, D.M.; Twidwell, D.; Fuhlendorf, S.D.; Patrignani, A.; Feng, L.; Ochsner, T.E. Soil moisture as an indicator of growing-season herbaceous fuel moisture and curing rate in grasslands. Int. J. Wildland Fire 2021, 30, 57–69. [Google Scholar] [CrossRef]
- Sukhbaatar, G.; Purevragchaa, B.; Ganbaatar, B.; Tseveen, B. Deforestation and degradation of forests in the Khustai Nuruu mountains of Northern Mongolia. Sib. J. For. Sci. 2021, 62, 53–63. [Google Scholar]
- Che, M.; Chen, B.; Innes, J.L.; Wang, G.; Dou, X.; Zhou, T.; Zhang, H.; Yan, J.; Xu, G.; Zhao, H. Spatial and temporal variations in the end date of the vegetation growing season throughout the Qinghai–Tibetan plateau from 1982 to 2011. Agric. For. Meteorol. 2014, 189–190, 81–90. [Google Scholar] [CrossRef]
- Bai, Y.; Zha, T.; Bourque, C.P.-A.; Jia, X.; Ma, J.; Liu, P.; Yang, R.; Li, C.; Du, T.; Wu, Y. Variation in ecosystem water use efficiency along a Southwest-to-Northeast aridity gradient in China. Ecol. Indic. 2020, 110, 105932. [Google Scholar] [CrossRef]
- Yuan, H.Y. Analysis of Spatial-Temporal Changes of Vegetation Ndvi in Border Areas of China-Mongolia. Master’s Thesis, College of Geographical Science, Inner Mongolia Normal University, Hohhot, China, 2016. [Google Scholar]
- Sukhbaatar, B.; Ulziikhutag, O.; Sukhbaatar, T. A Study on e-Government Policy in Mongolia. In Proceedings of the Symposium on Information & Telecommunication Technologies, Bangkok, Thailand, 20 September–18 October 2006. [Google Scholar]
- Olji; Bolor; Gerelchoktu; Liu, S. Present situation and protection in Daurian steppe ecological area. J. MUC Nat. Sci. Ed. 2013, 12, 24–26. [Google Scholar]
- Wang, G.; Wang, J.; Zou, X.; Chai, G.; Wu, M.; Wang, Z. Estimating the fractional cover of photosynthetic vegetation, non-photosynthetic vegetation and bare soil from modis data: Assessing the applicability of the ndvi-dfi model in the typical Xilingol grasslands. Int. J. Appl. Earth Obs. Geoinf. 2019, 76, 154–166. [Google Scholar] [CrossRef]
- Guo, Z.; Kurban, A.; Ablekim, A.; Wu, S.; Van de Voorde, T.; Azadi, H.; Maeyer, P.D.; Dufatanye Umwali, E. Estimation of photosynthetic and non-photosynthetic vegetation coverage in the lower reaches of Tarim river based on sentinel-2a data. Remote Sens. 2021, 13, 1458. [Google Scholar] [CrossRef]
- Zhou, R.; Yang, G.; Ping, M. Exploitation and utilization of natural grassland in Greater Khingan mountains. Nat. Resour. Res. 1987, 4, 44–50. [Google Scholar]
- Gao, J.; Zhao, Y.; Xu, W.; Chen, X.; Bao, Y. Exploitation and utilization of interforest margin grassland in Greater Khingan mountains. Inn. Mong. For. Sci. T Echnology 2001, 84–85. [Google Scholar]
- Cao, X.; Chen, J.; Matsushita, B.; Imura, H. Developing a modis-based index to discriminate dead fuel from photosynthetic vegetation and soil background in the Asian steppe area. Int. J. Remote Sens. 2010, 31, 1589–1604. [Google Scholar] [CrossRef]
- Liu, X.; Zhang, J.; Tong, Z. Modeling the early warning of grassland fire risk based on fuzzy logic in Xilingol, Inner Mongolia. Nat. Hazards 2014, 75, 2331–2342. [Google Scholar] [CrossRef]
- Chai, G.; Wang, J.; Wu, M.; Li, G.; Zhang, L.; Wang, Z. Mapping the fractional cover of non-photosynthetic vegetation and its spatiotemporal variations in the Xilingol grassland using modis imagery (2000−2019). Geocarto Int. 2020, 37, 1863–1879. [Google Scholar] [CrossRef]
- Atchley, A.L.; Linn, R.; Jonko, A.; Hoffman, C.; Hyman, J.D.; Pimont, F.; Sieg, C.; Middleton, R.S. Effects of fuel spatial distribution on wildland fire behaviour. Int. J. Wildland Fire 2021, 30, 179. [Google Scholar] [CrossRef]
- Jin, Y.X.; Xu, B.; Yang, X.C.; Li, J.Y.; Wang, D.L.; Ma, H.L. Remote sensing dynamic estimation of grass production in Xilinguole, Inner Mongolia. Sci. Sin. Vitae 2011, 41, 1185–1195. [Google Scholar]
- Gu, Z.J.; Zeng, Z.Y. Overview of researches on vegetation coverage in remote sensing. Res. Soil Water Conserv. 2005, 12, 18–21. [Google Scholar]
- Hernandez-Leal, P.A.; Arbelo, M.; Gonzalez-Calvo, A. Fire risk assessment using satellite data. Adv. Space Res. 2006, 37, 741–746. [Google Scholar] [CrossRef]
- Savage, M.; Swetnam, T.W. Early 19th-century fire decline following sheep pasturing in a Navajo Ponderosa pine forest. Ecology 1990, 71, 2374–2378. [Google Scholar] [CrossRef]
- Zhang, X.; Xiao, X.; Qiu, S.; Xu, X.; Wang, X.; Chang, Q.; Wu, J.; Li, B. Quantifying latitudinal variation in land surface phenology of spartina alterniflora saltmarshes across coastal wetlands in China by landsat 7/8 and sentinel-2 images. Remote Sens. Environ. 2022, 269, 112810. [Google Scholar] [CrossRef]
- Zhu, W.; Tian, H.; Xu, X.; Pan, Y.; Chen, G.; Lin, W. Extension of the growing season due to delayed autumn over mid and high latitudes in North America during 1982–2006. Glob. Ecol. Biogeogr. 2012, 21, 260–271. [Google Scholar] [CrossRef]
- Shen, M.; Jiang, N.; Peng, D.; Rao, Y.; Huang, Y.; Fu, Y.H.; Yang, W.; Zhu, X.; Cao, R.; Chen, X. Can changes in autumn phenology facilitate earlier green-up date of northern vegetation? Agric. For. Meteorol. 2020, 291, 108077. [Google Scholar] [CrossRef]
- Battulga, P.; Tsogtbaatar, J.; Dulamsuren, C.; Hauck, M. Equations for estimating the above-ground biomass of larix sibirica in the forest-steppe of Mongolia. J. For. Res. 2013, 24, 431–437. [Google Scholar] [CrossRef]
- Usoltsev, V.A.; Danilin, I.M.; Zaandrabalyn Tsogt, Z.; Anna, A.; Osmirko, A.A.; Tsepordey, I.S.; Chasovskikh, V.P. Aboveground biomass of Mongolian larch (Larix sibirica ledeb.) forests in the Eurasian region. Geogr. Environ. Sustain. 2019, 12, 117–132. [Google Scholar] [CrossRef]
- Zeng, W.S.; Duo, H.R.; Lei, X.D.; Chen, X.Y.; Wang, X.J.; Pu, Y.; Zou, W.T. Individual tree biomass equations and growth models sensitive to climate variables for larix spp. in China. Eur. J. For. Res. 2017, 136, 233–249. [Google Scholar] [CrossRef]


| DFI | Number of Samples | Person Correlation | |
|---|---|---|---|
| NDVI | |||
| 1160 | 0.193 ** |
Disclaimer/Publisher’s Note: The statements, opinions and data contained in all publications are solely those of the individual author(s) and contributor(s) and not of MDPI and/or the editor(s). MDPI and/or the editor(s) disclaim responsibility for any injury to people or property resulting from any ideas, methods, instructions or products referred to in the content. |
© 2023 by the authors. Licensee MDPI, Basel, Switzerland. This article is an open access article distributed under the terms and conditions of the Creative Commons Attribution (CC BY) license (https://creativecommons.org/licenses/by/4.0/).
Share and Cite
Chao, L.; Bao, Y.; Zhang, J.; Bao, Y.; Mei, L.; Cha, E. Effects of Vegetation Belt Movement on Wildfire in the Mongolian Plateau over the Past 40 Years. Remote Sens. 2023, 15, 2341. https://doi.org/10.3390/rs15092341
Chao L, Bao Y, Zhang J, Bao Y, Mei L, Cha E. Effects of Vegetation Belt Movement on Wildfire in the Mongolian Plateau over the Past 40 Years. Remote Sensing. 2023; 15(9):2341. https://doi.org/10.3390/rs15092341
Chicago/Turabian StyleChao, Lumen, Yulong Bao, Jiquan Zhang, Yuhai Bao, Li Mei, and Ersi Cha. 2023. "Effects of Vegetation Belt Movement on Wildfire in the Mongolian Plateau over the Past 40 Years" Remote Sensing 15, no. 9: 2341. https://doi.org/10.3390/rs15092341
APA StyleChao, L., Bao, Y., Zhang, J., Bao, Y., Mei, L., & Cha, E. (2023). Effects of Vegetation Belt Movement on Wildfire in the Mongolian Plateau over the Past 40 Years. Remote Sensing, 15(9), 2341. https://doi.org/10.3390/rs15092341