
Slight Mass Loss in Glaciers over the Ulugh Muztagh Mountains during the Period from 2000 to 2020


Abstract
1. Introduction
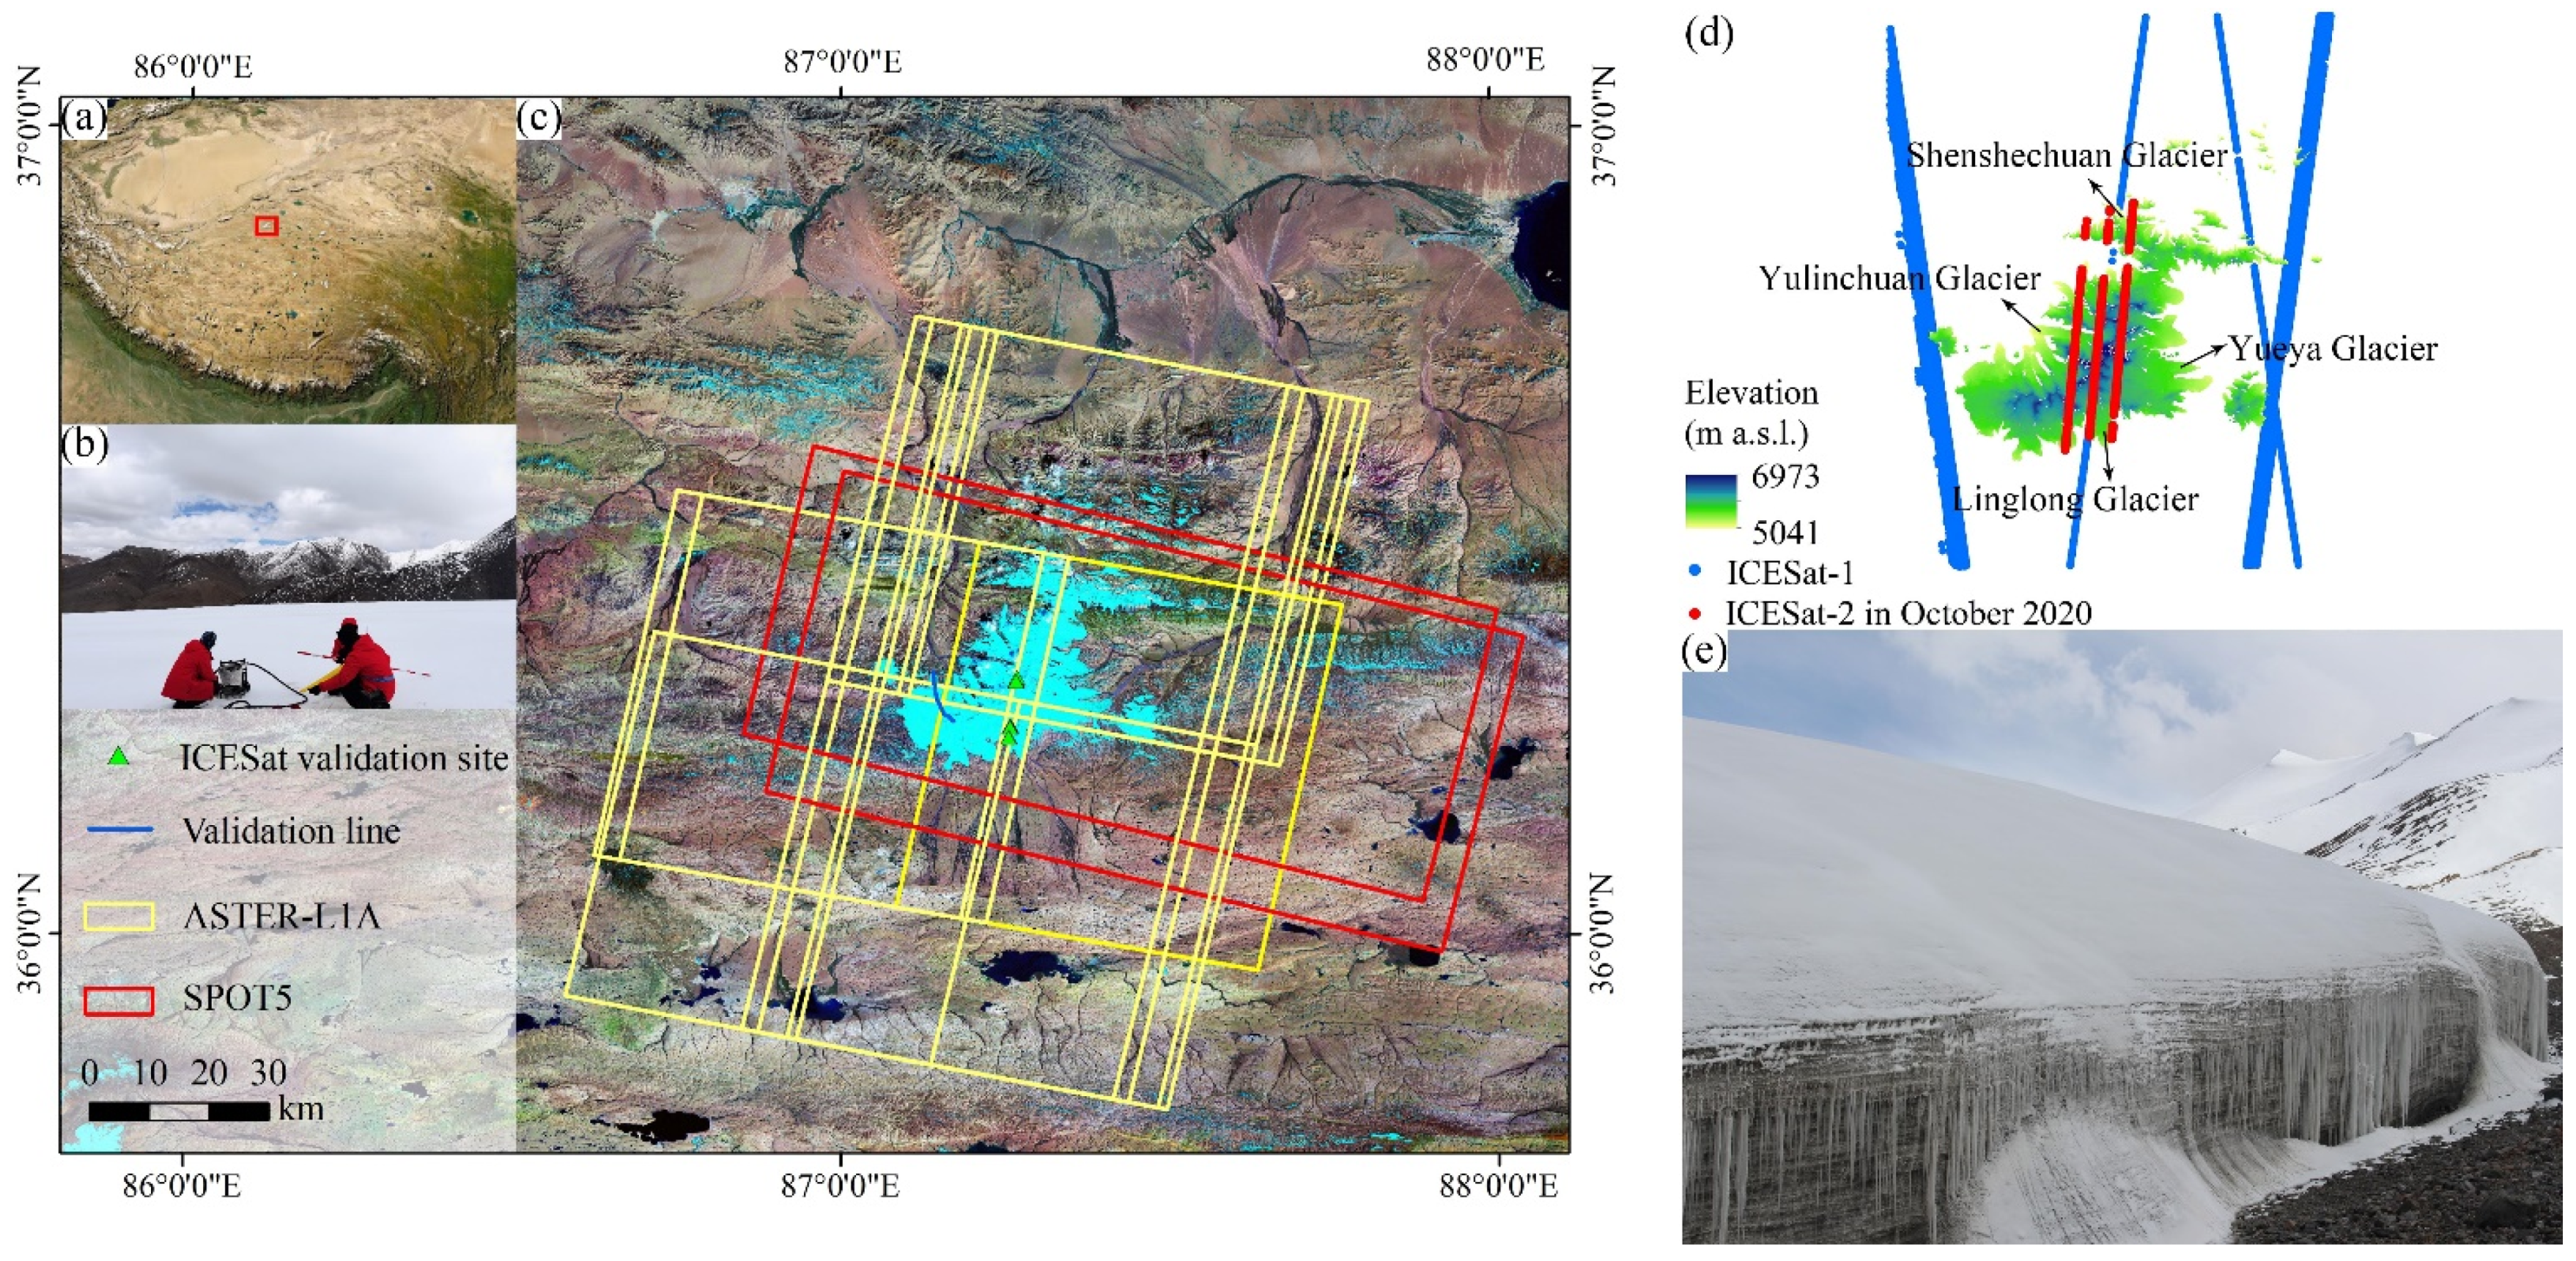
2. Study Area
3. Materials and Methods
3.1. Data
3.1.1. ASTER Images
3.1.2. ICESat
3.1.3. Meteorological Dataset
3.1.4. Other Data
3.2. Methods
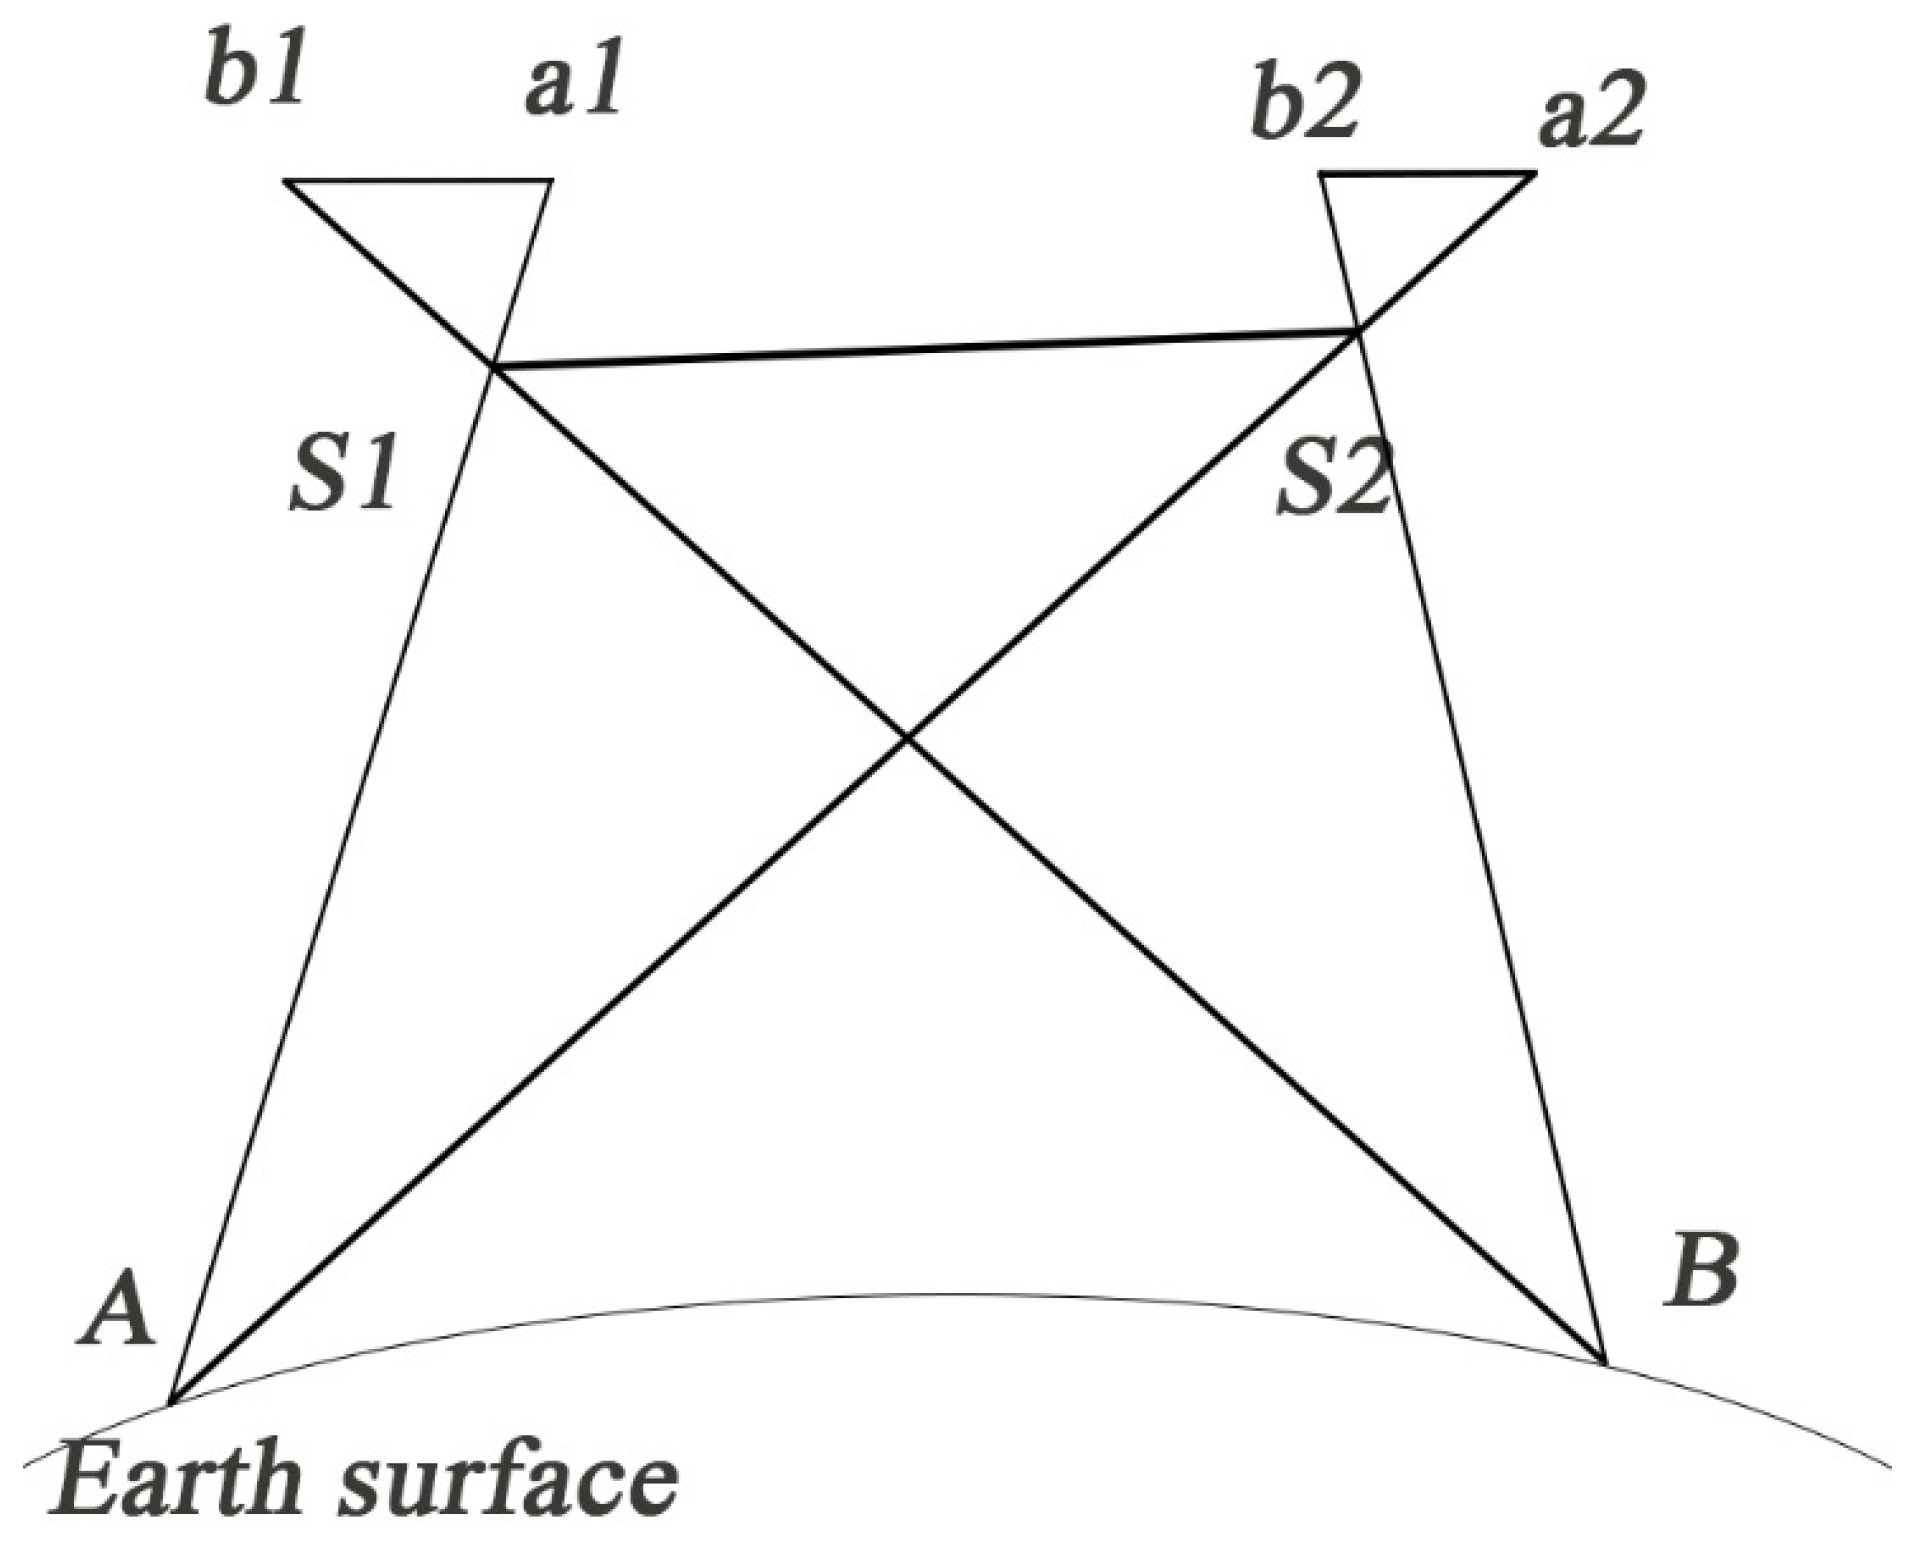
3.2.1. Principle of DEM Extraction from ASTER Stereopairs
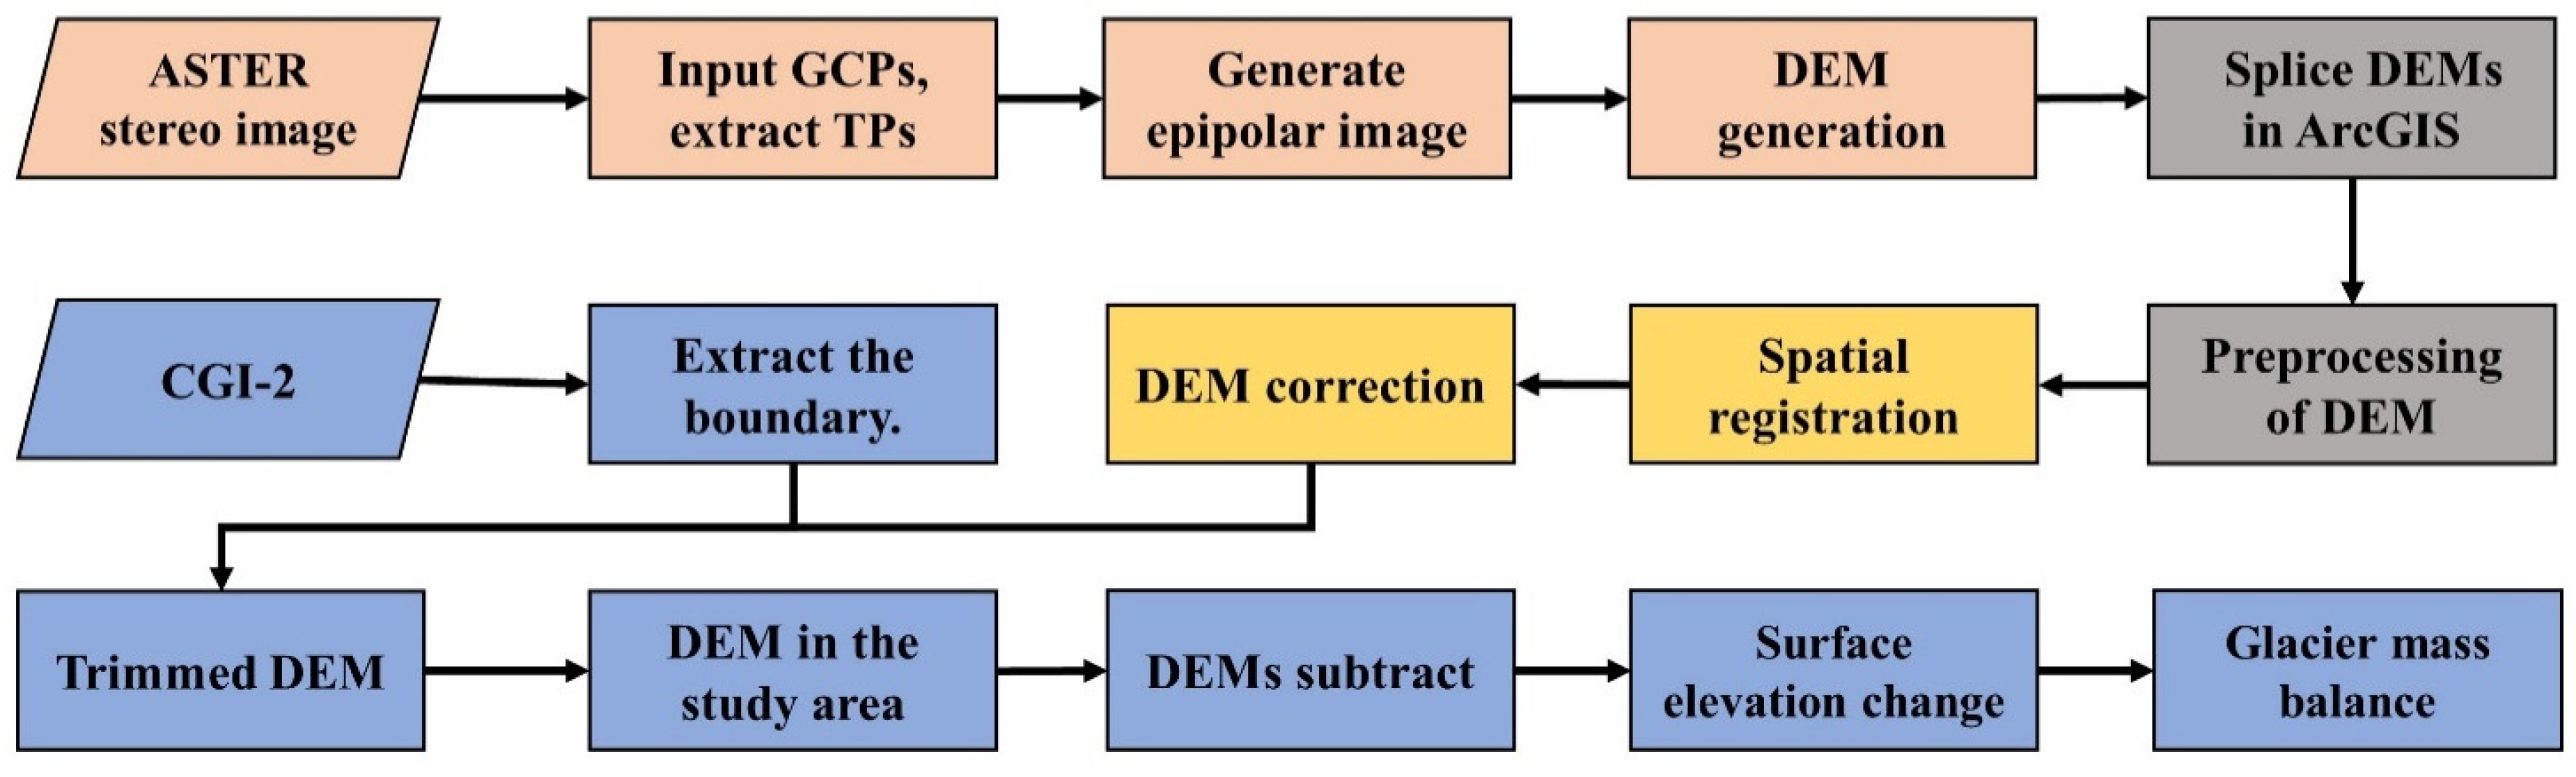
3.2.2. Data Processing Flow
- Generation of ASTER DEMs;
- 2.
- Preprocessing of ASTER DEM;
- 3.
- Spatial registration of ASTER DEM;
- 4.
- Glacier surface elevation and mass balance.
3.2.3. Uncertainty Assessment
4. Results
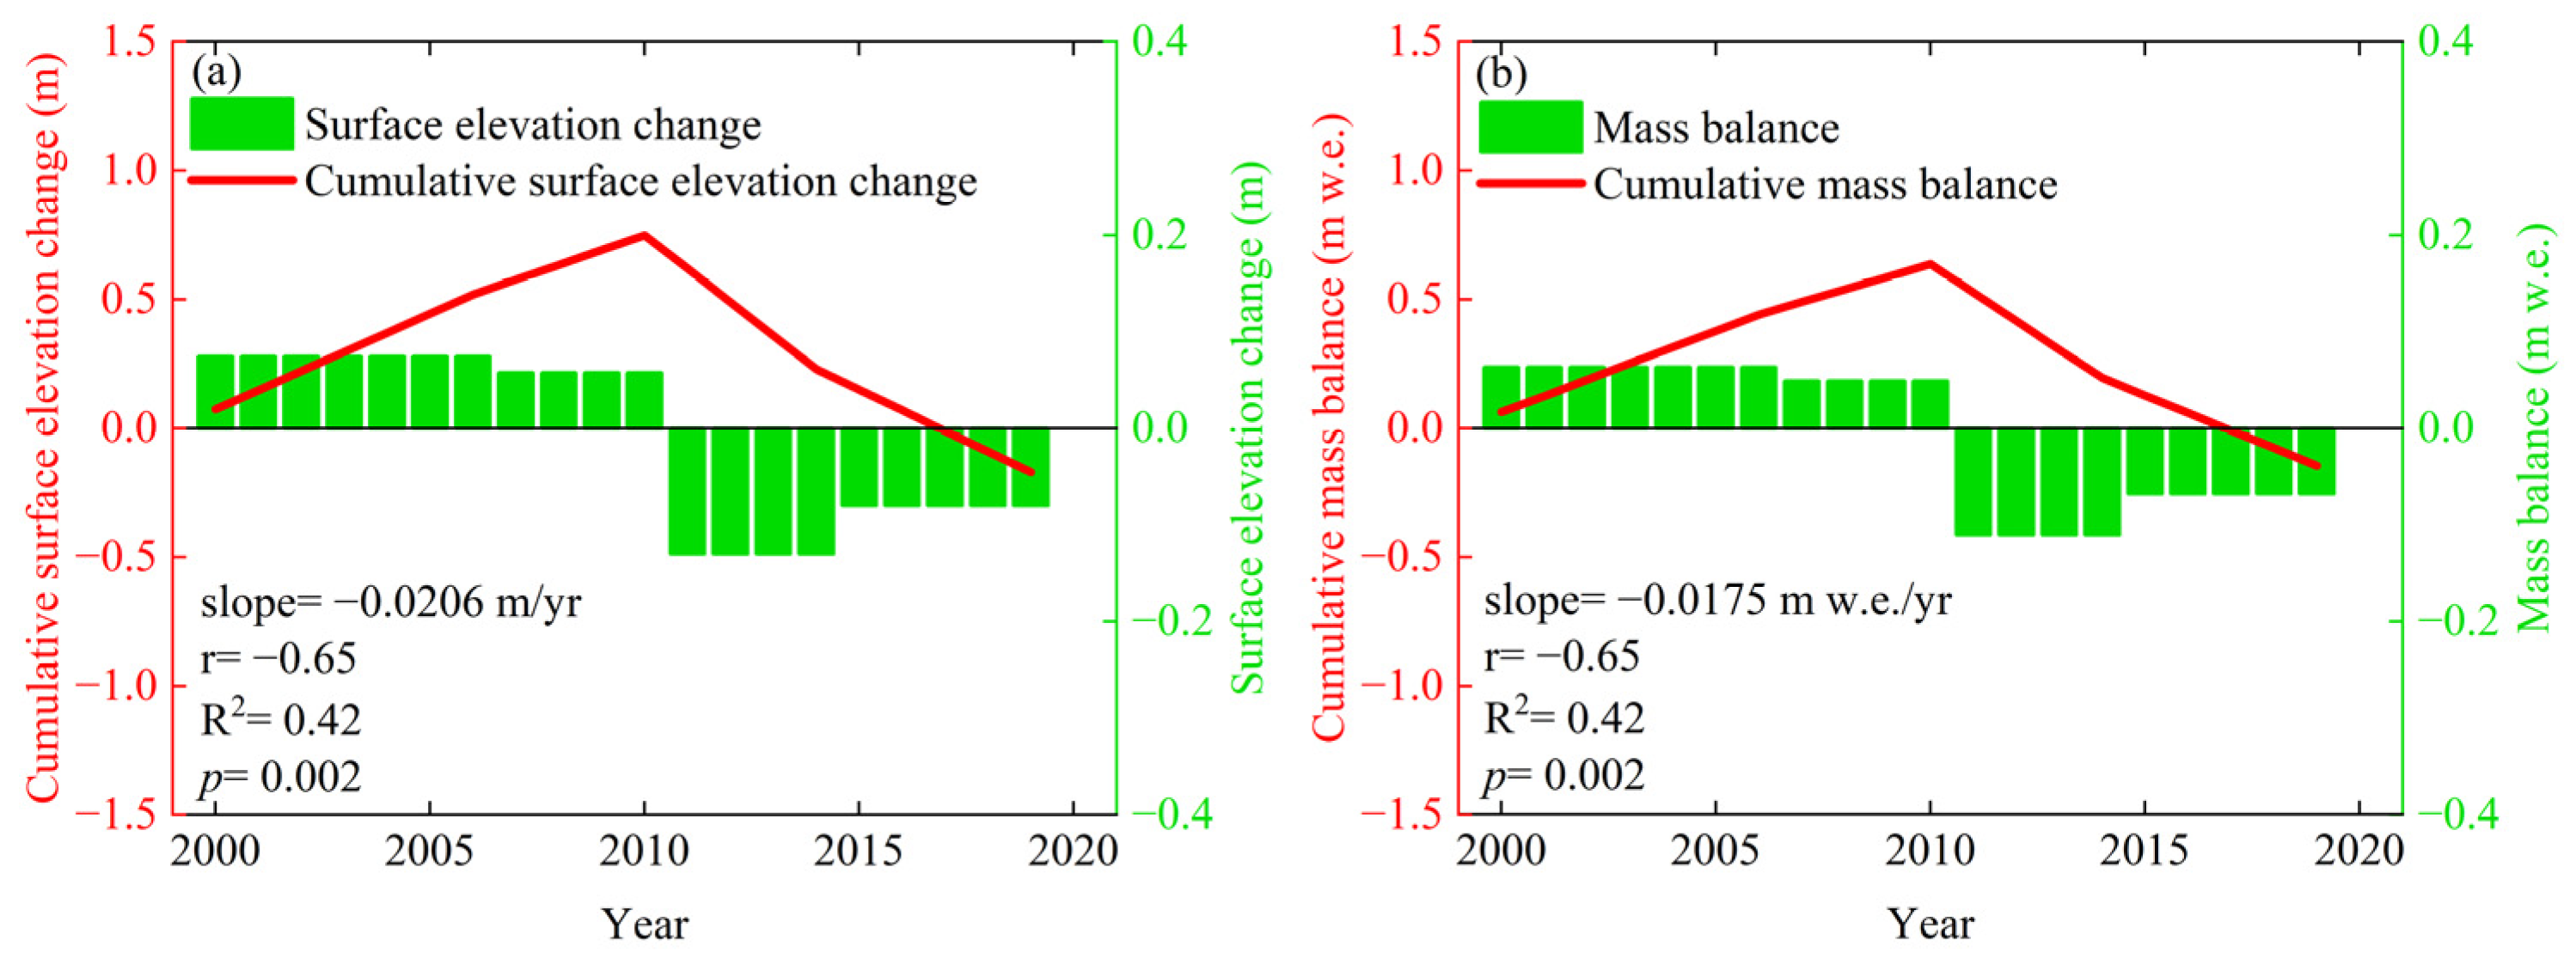
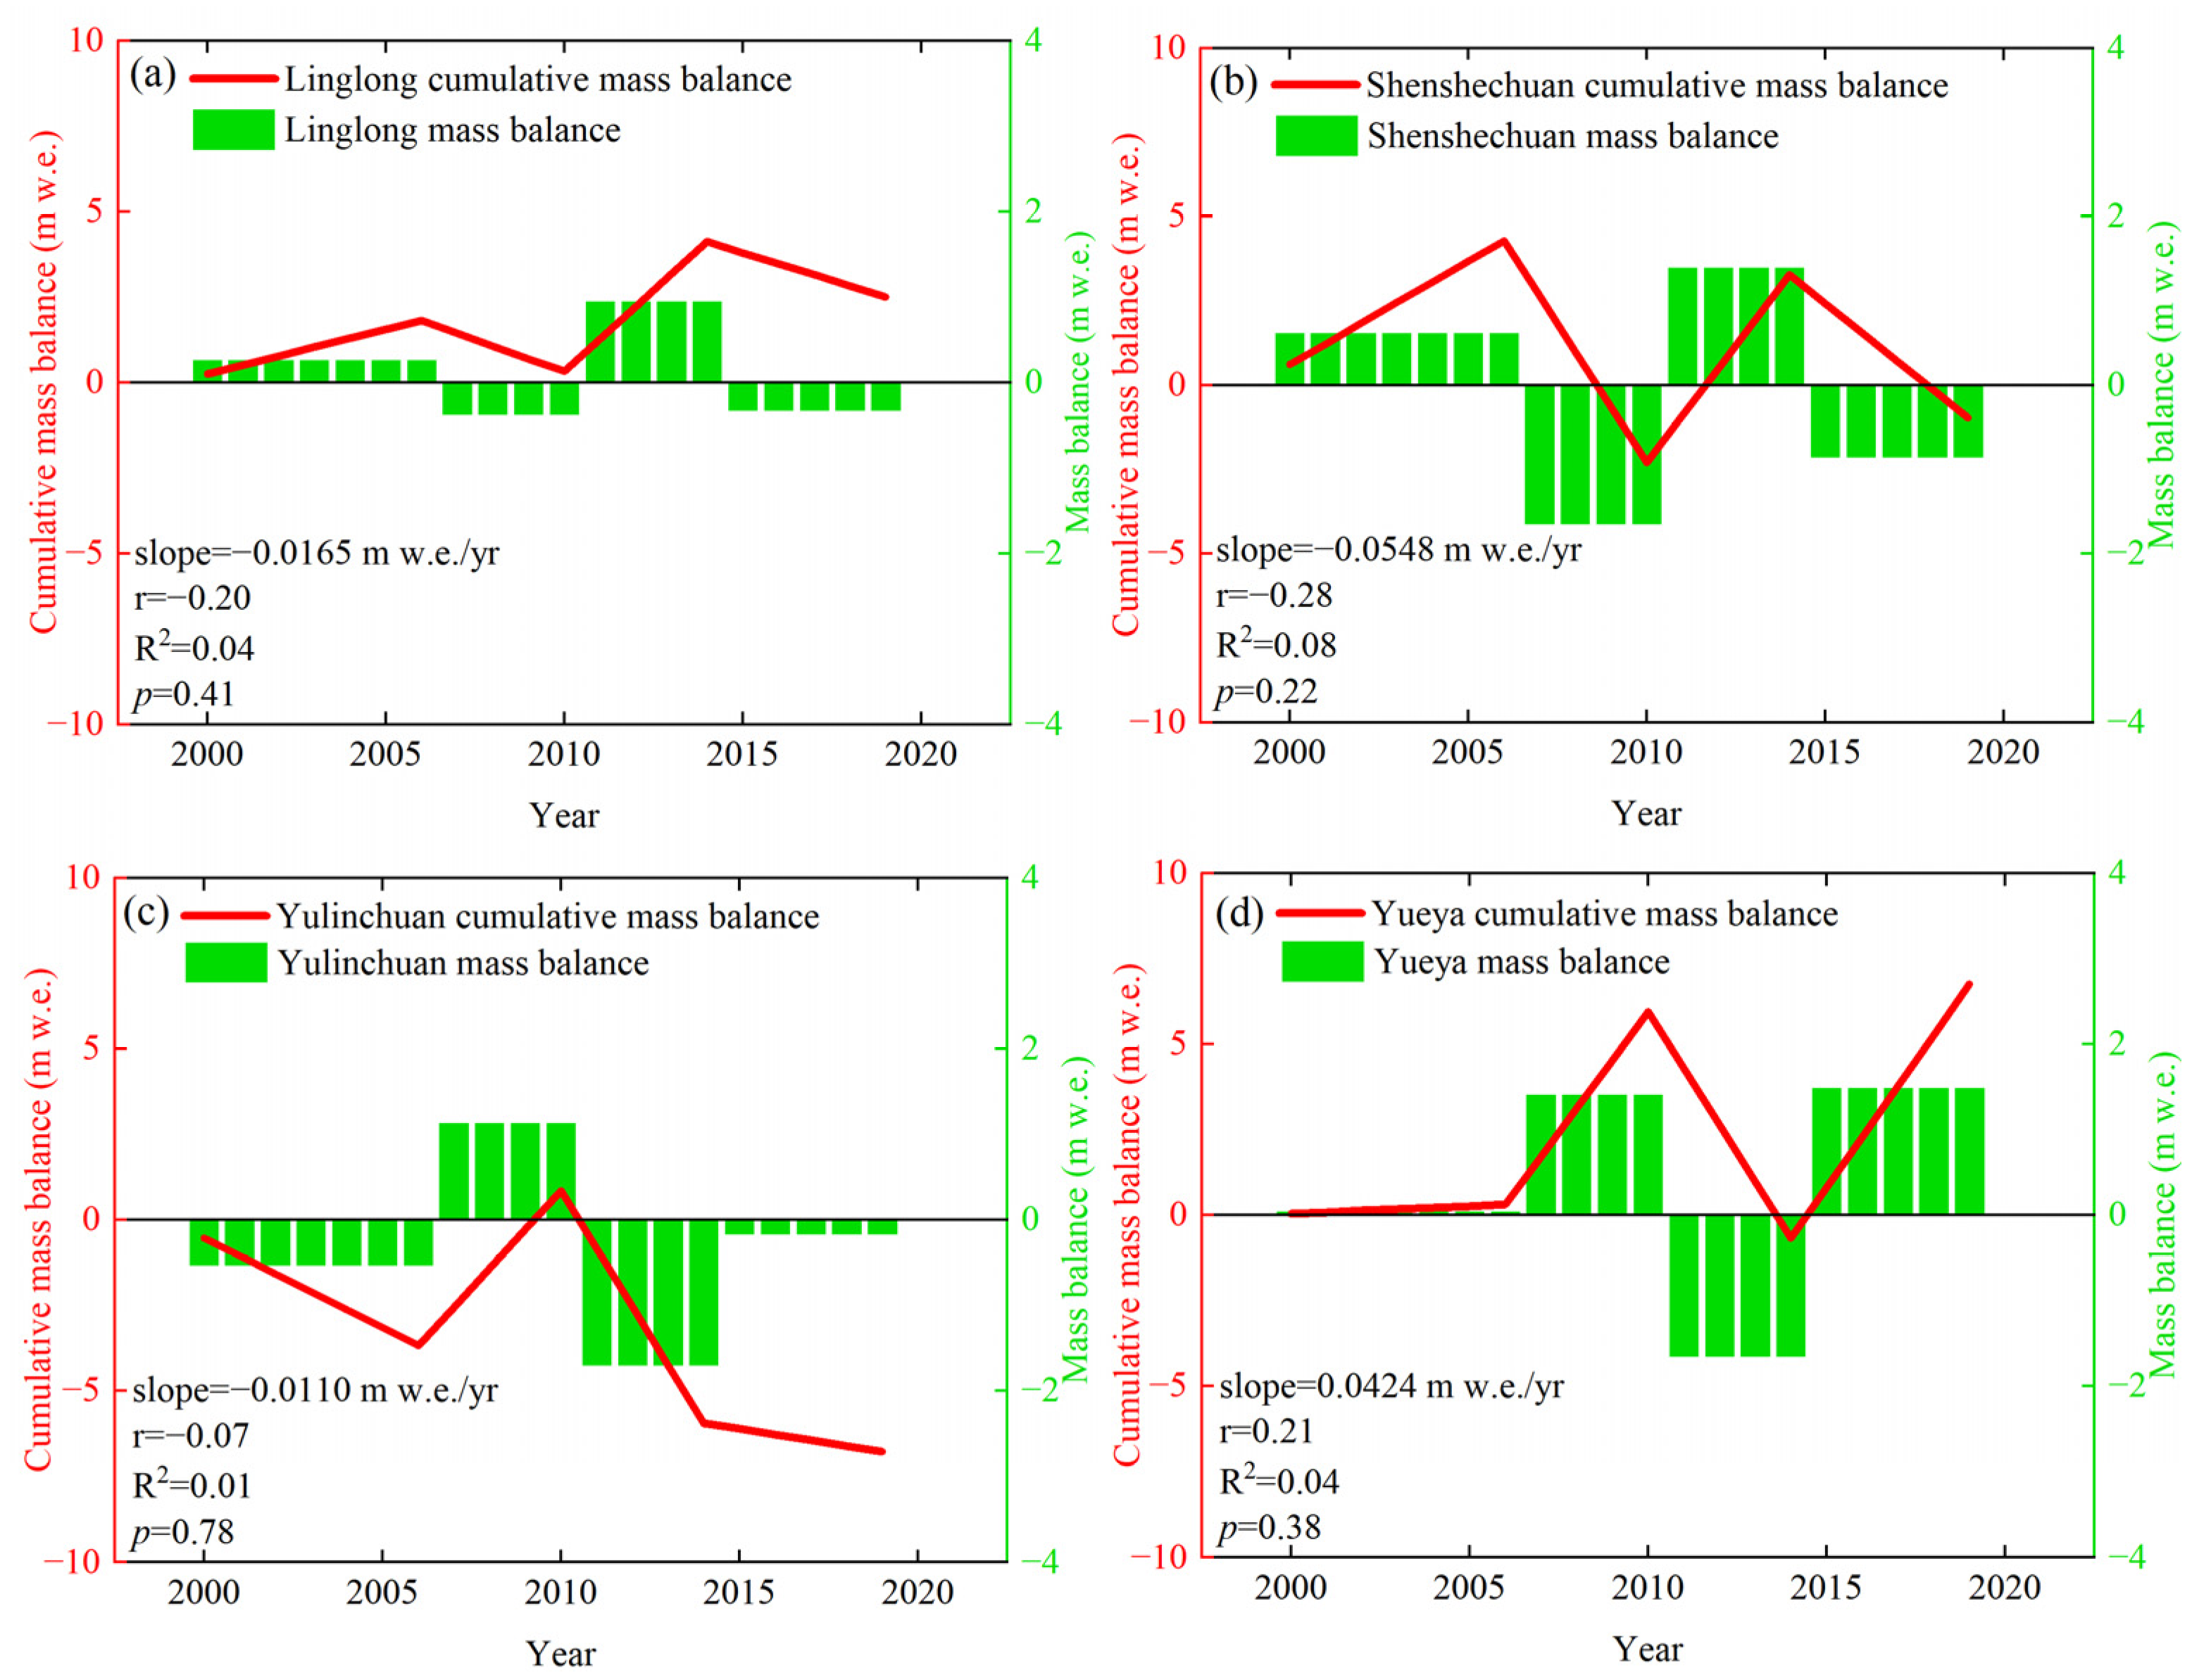
4.1. Annual Changes in the Glacier Surface Mass Balance from 2000 to 2020
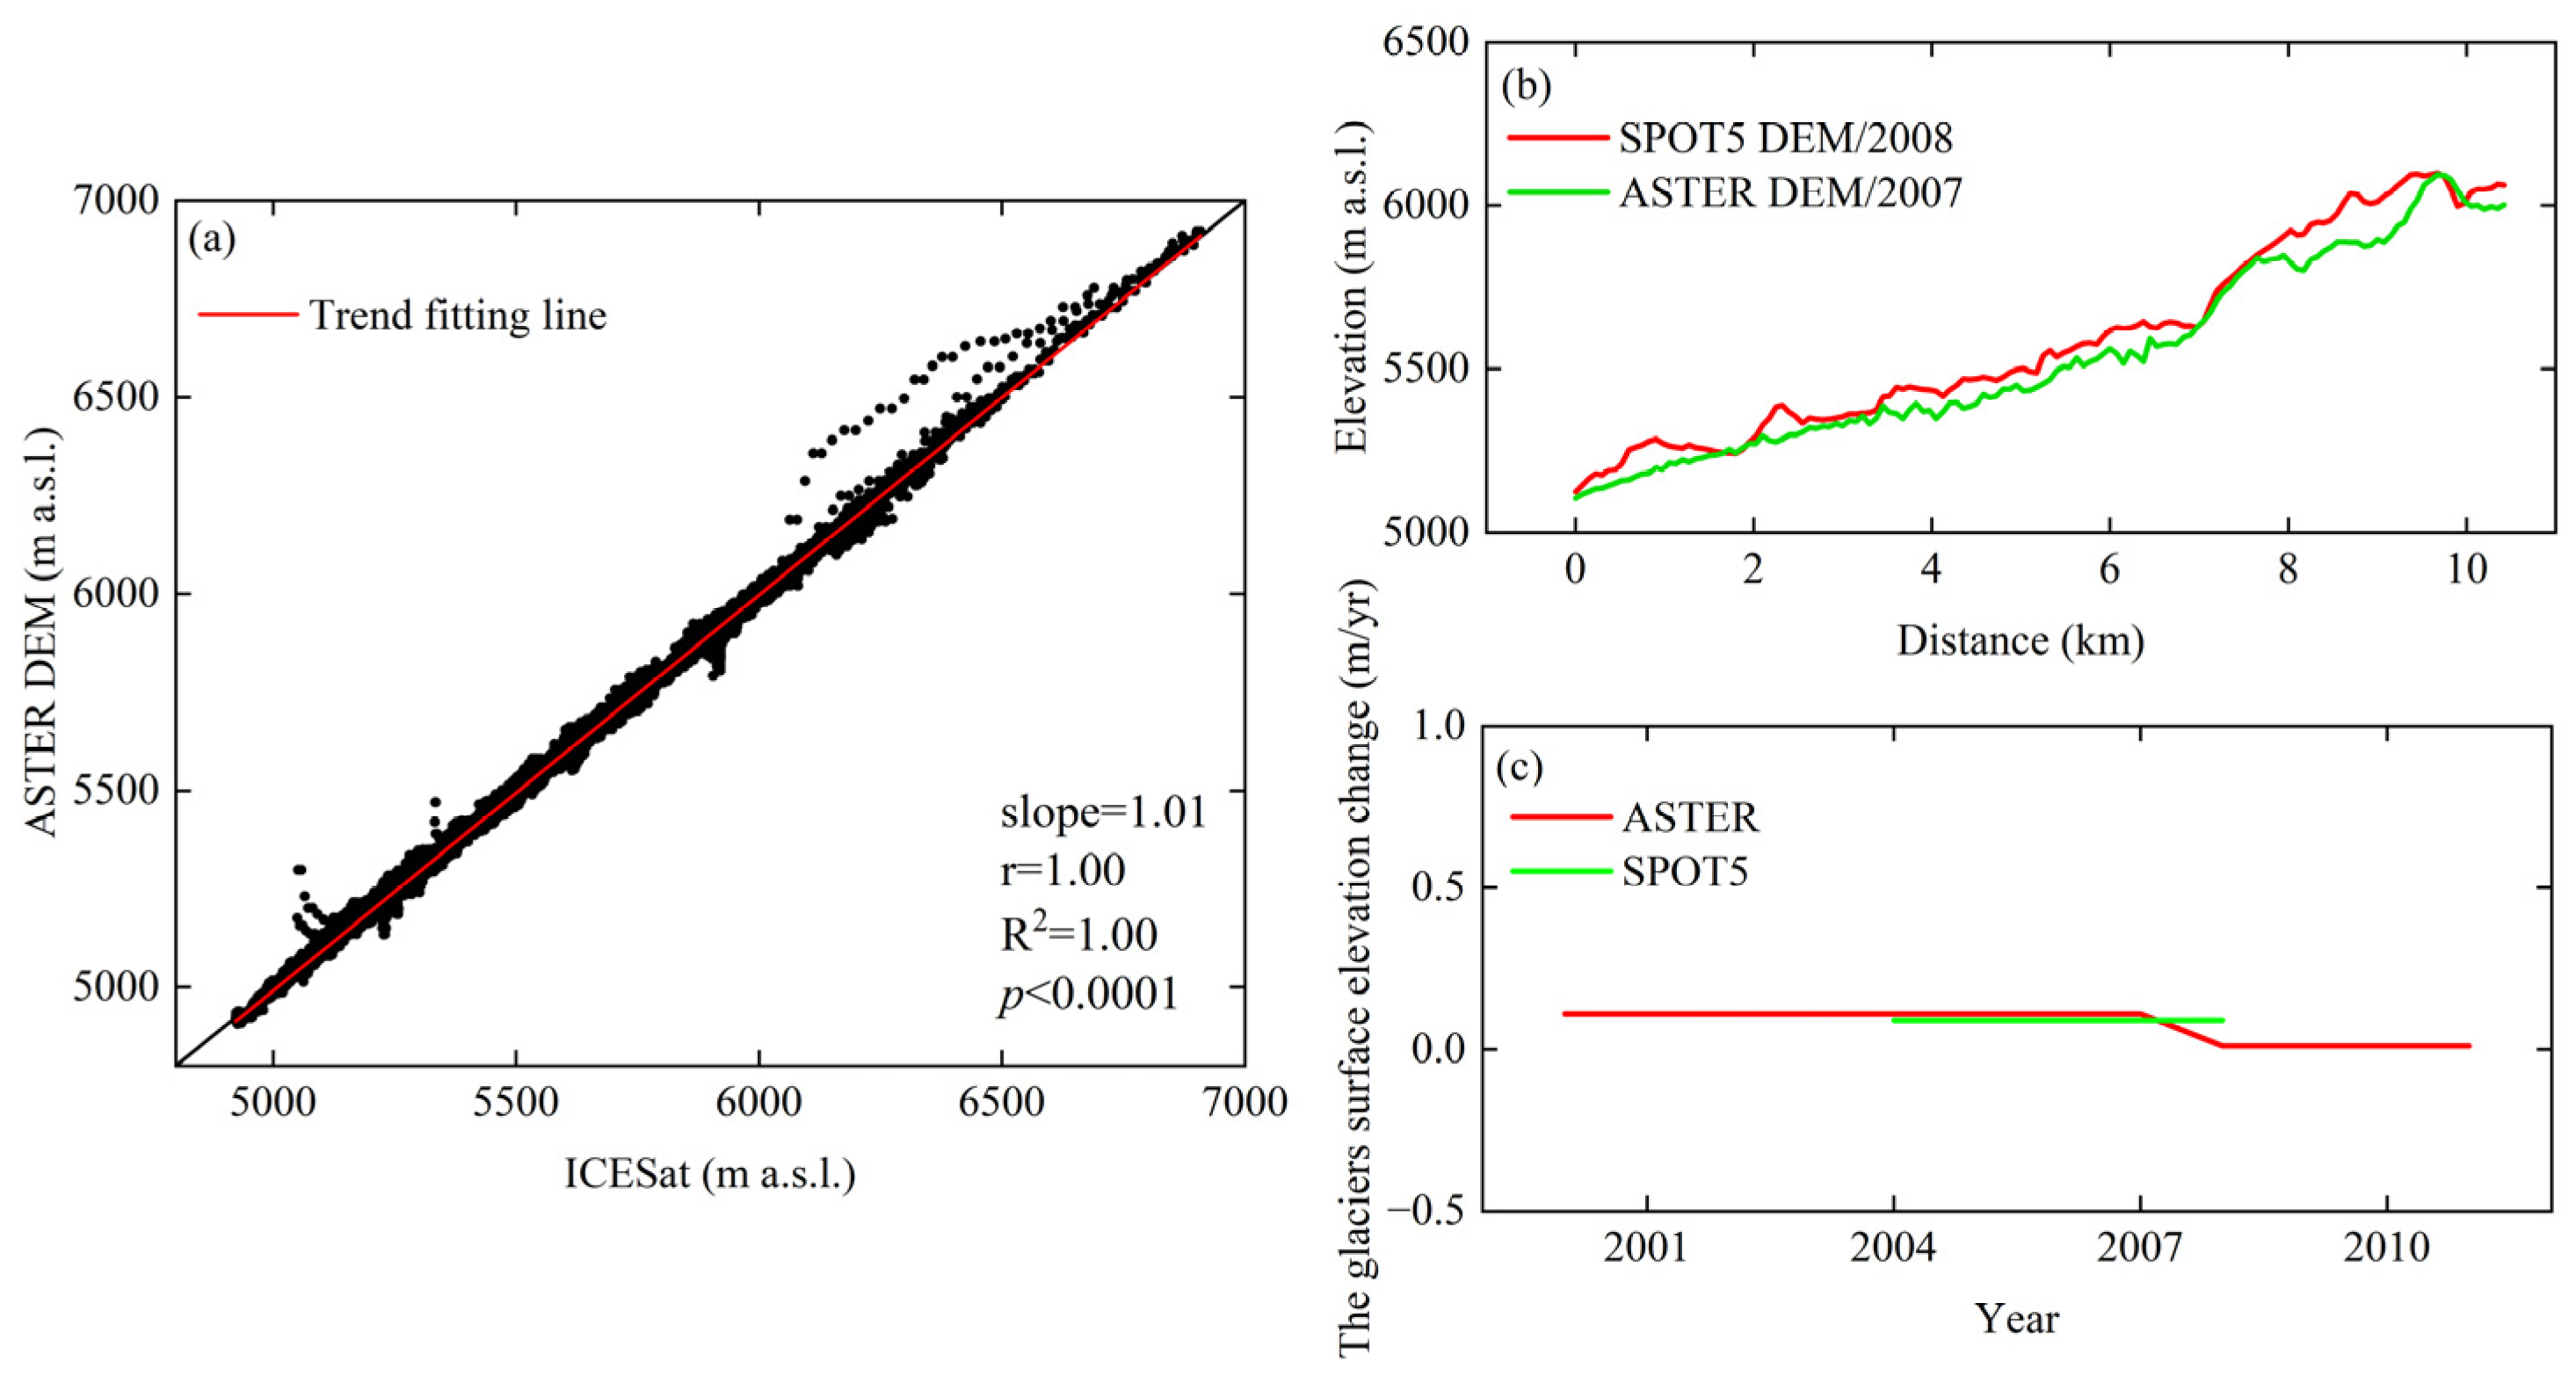
4.2. Assessment of the Glacier Surface Elevation from the ASTER
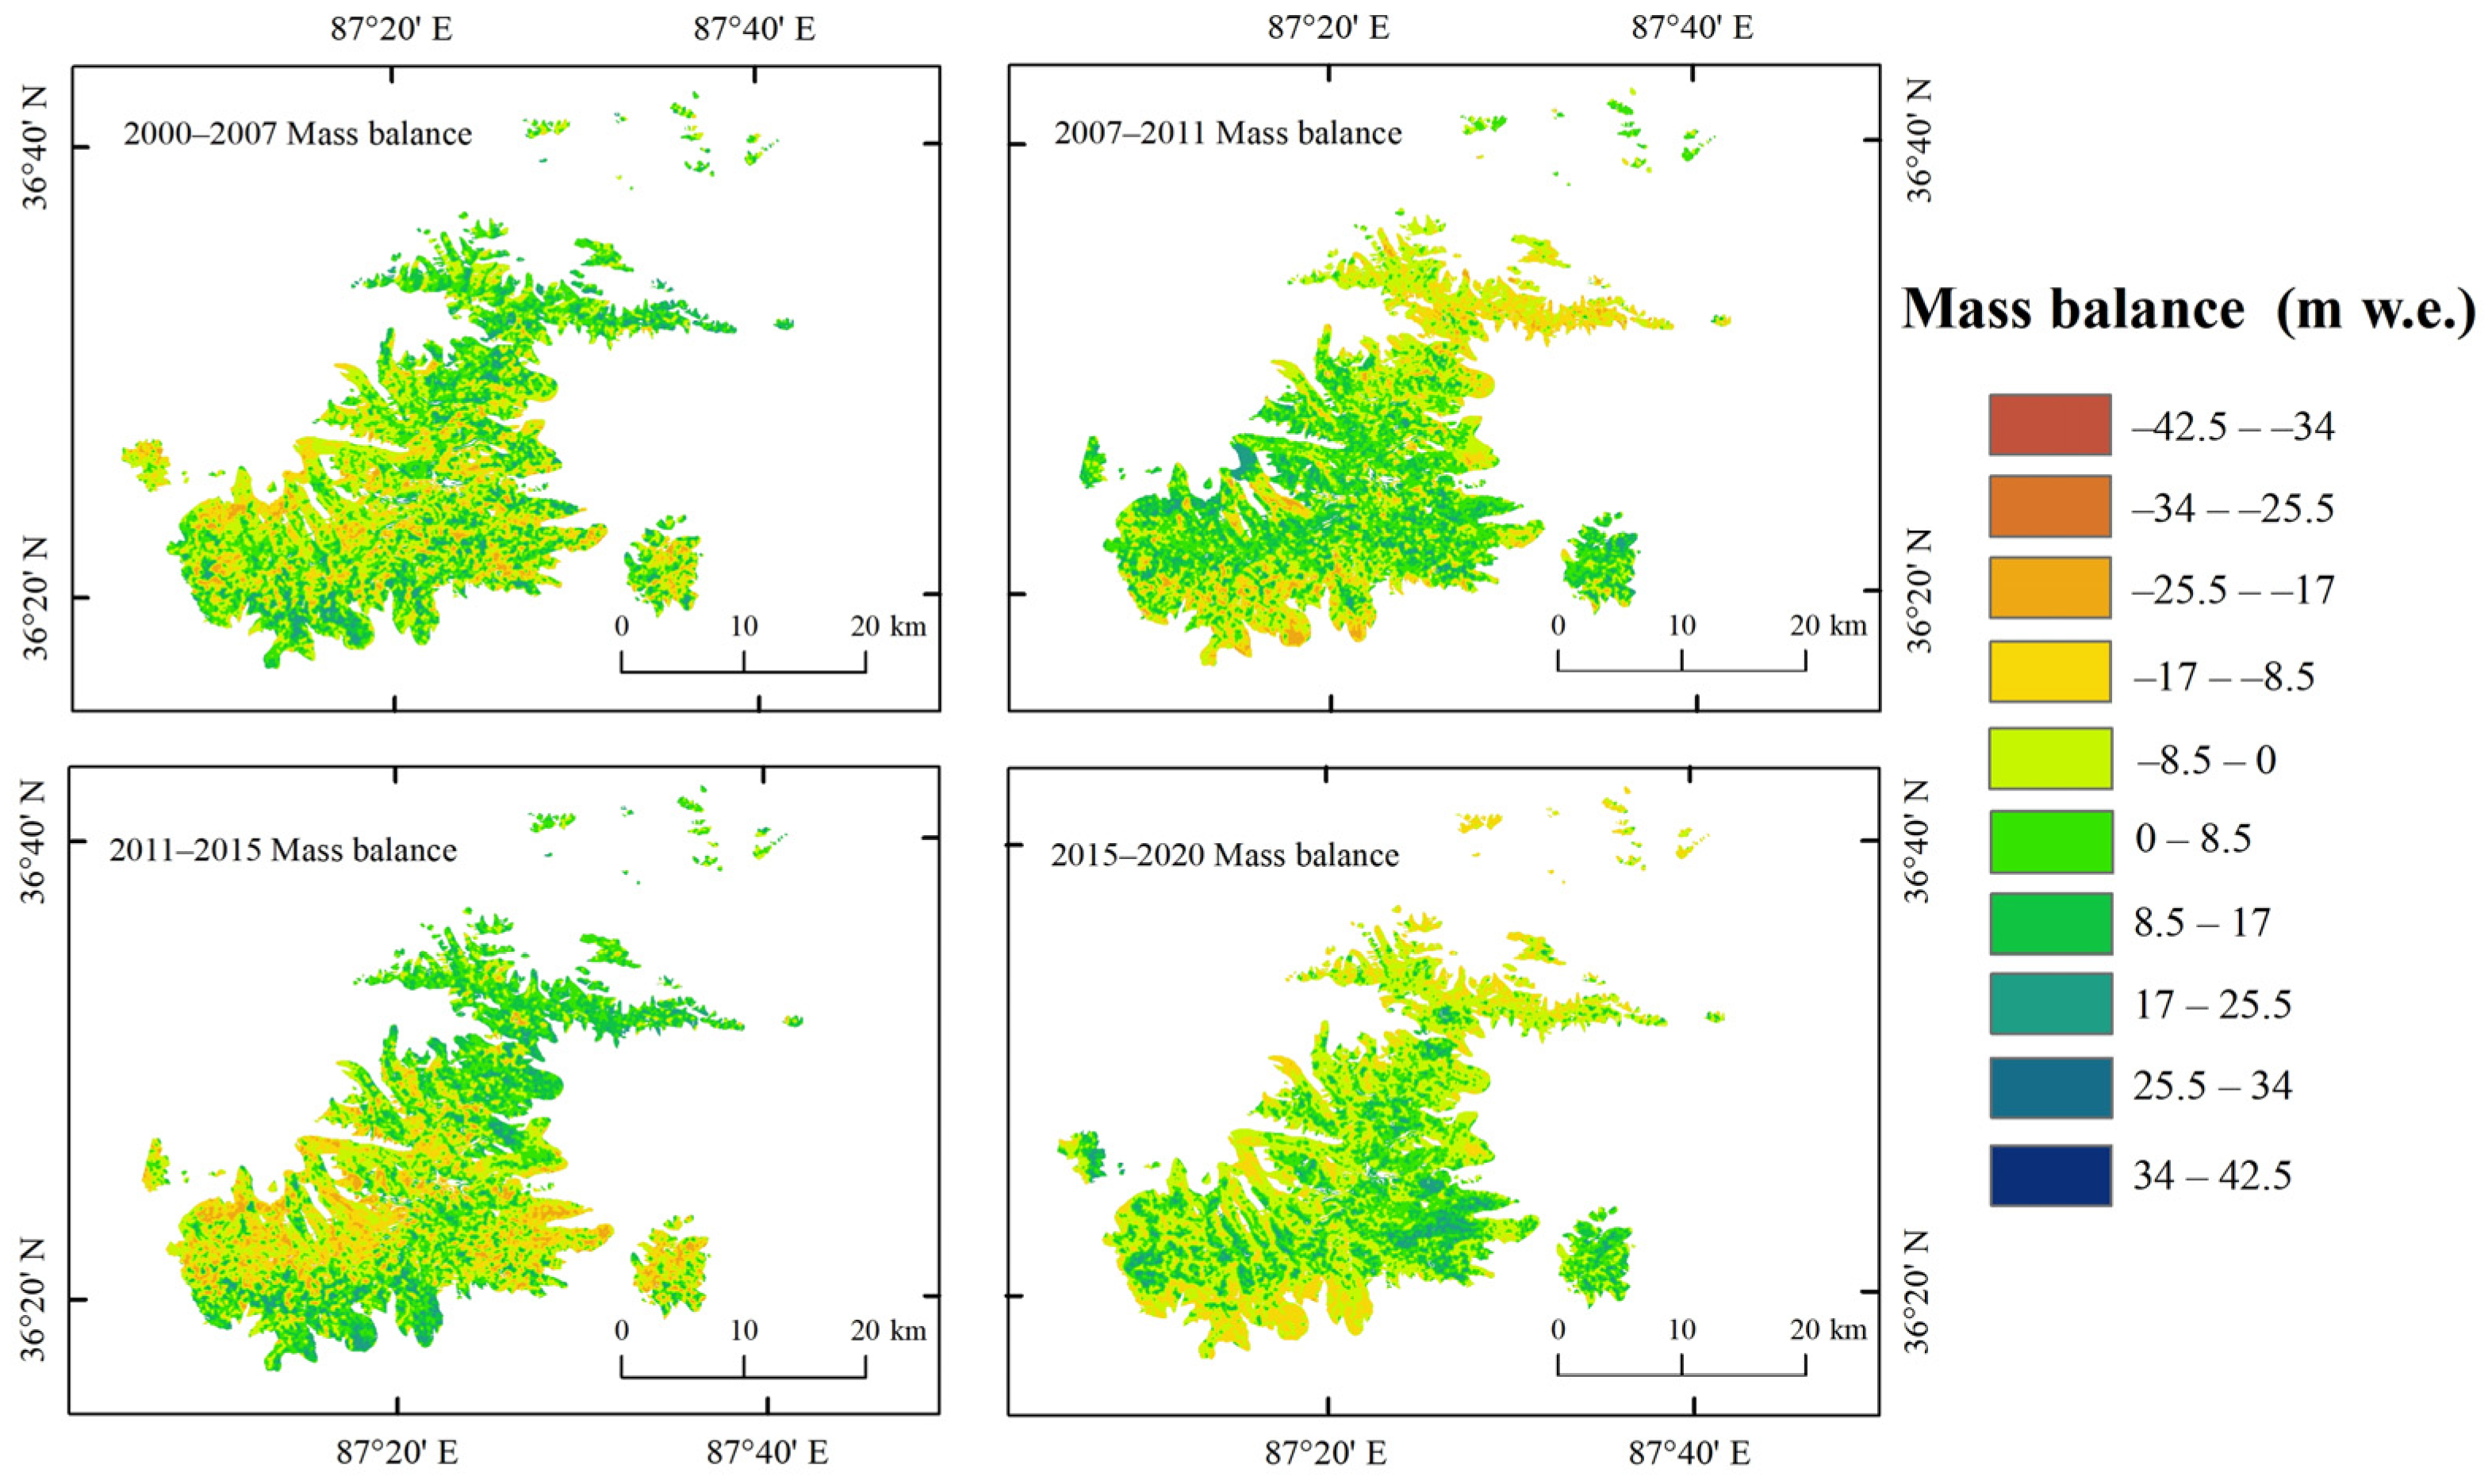
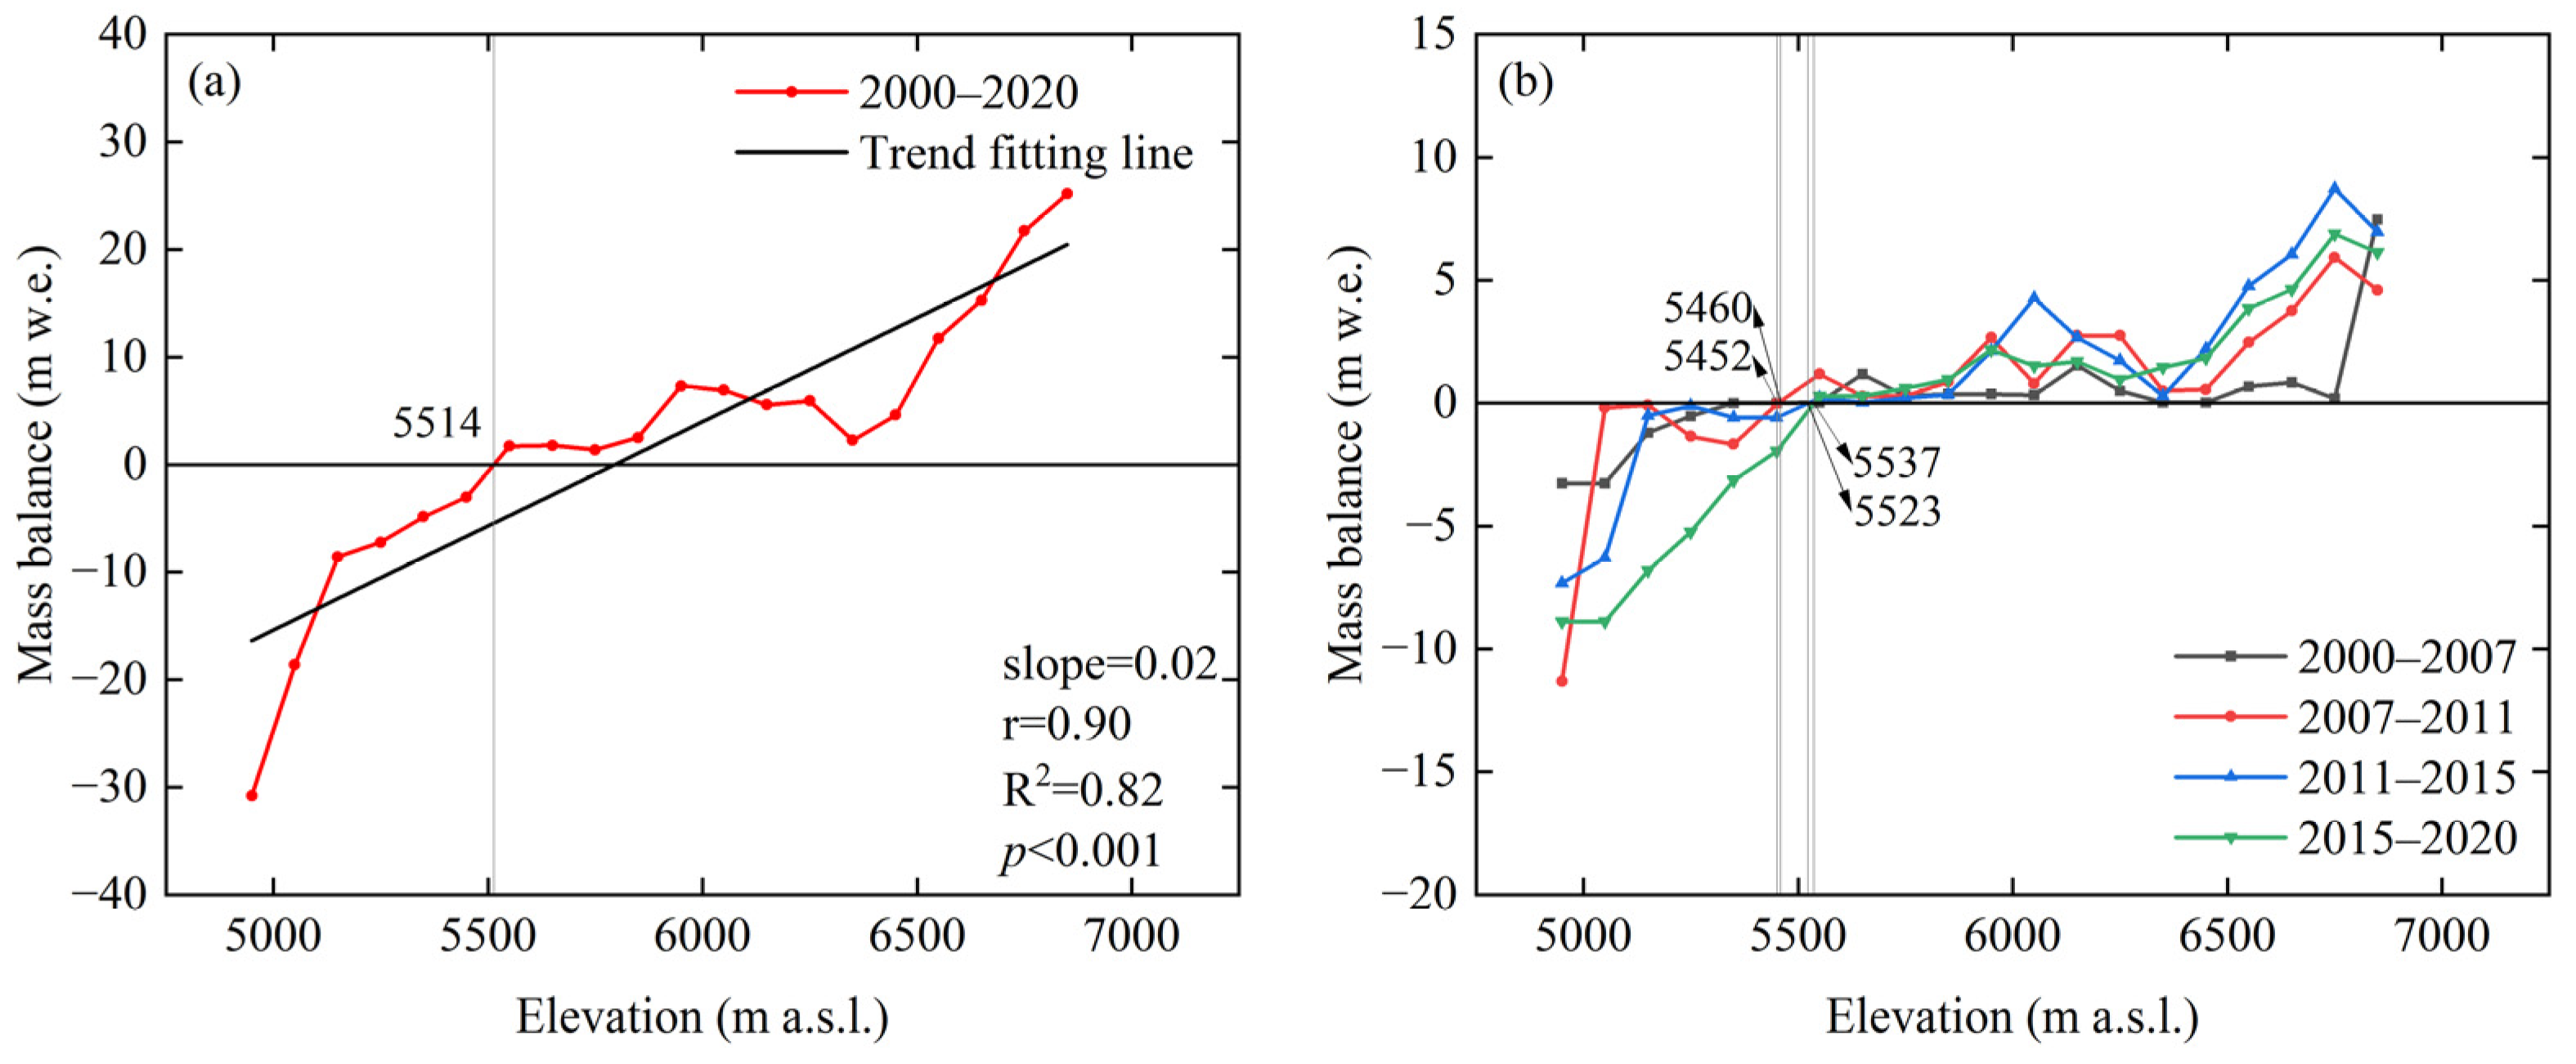
4.3. Spatial Changes in the Glacier Surface Mass Balance from 2000 to 2020
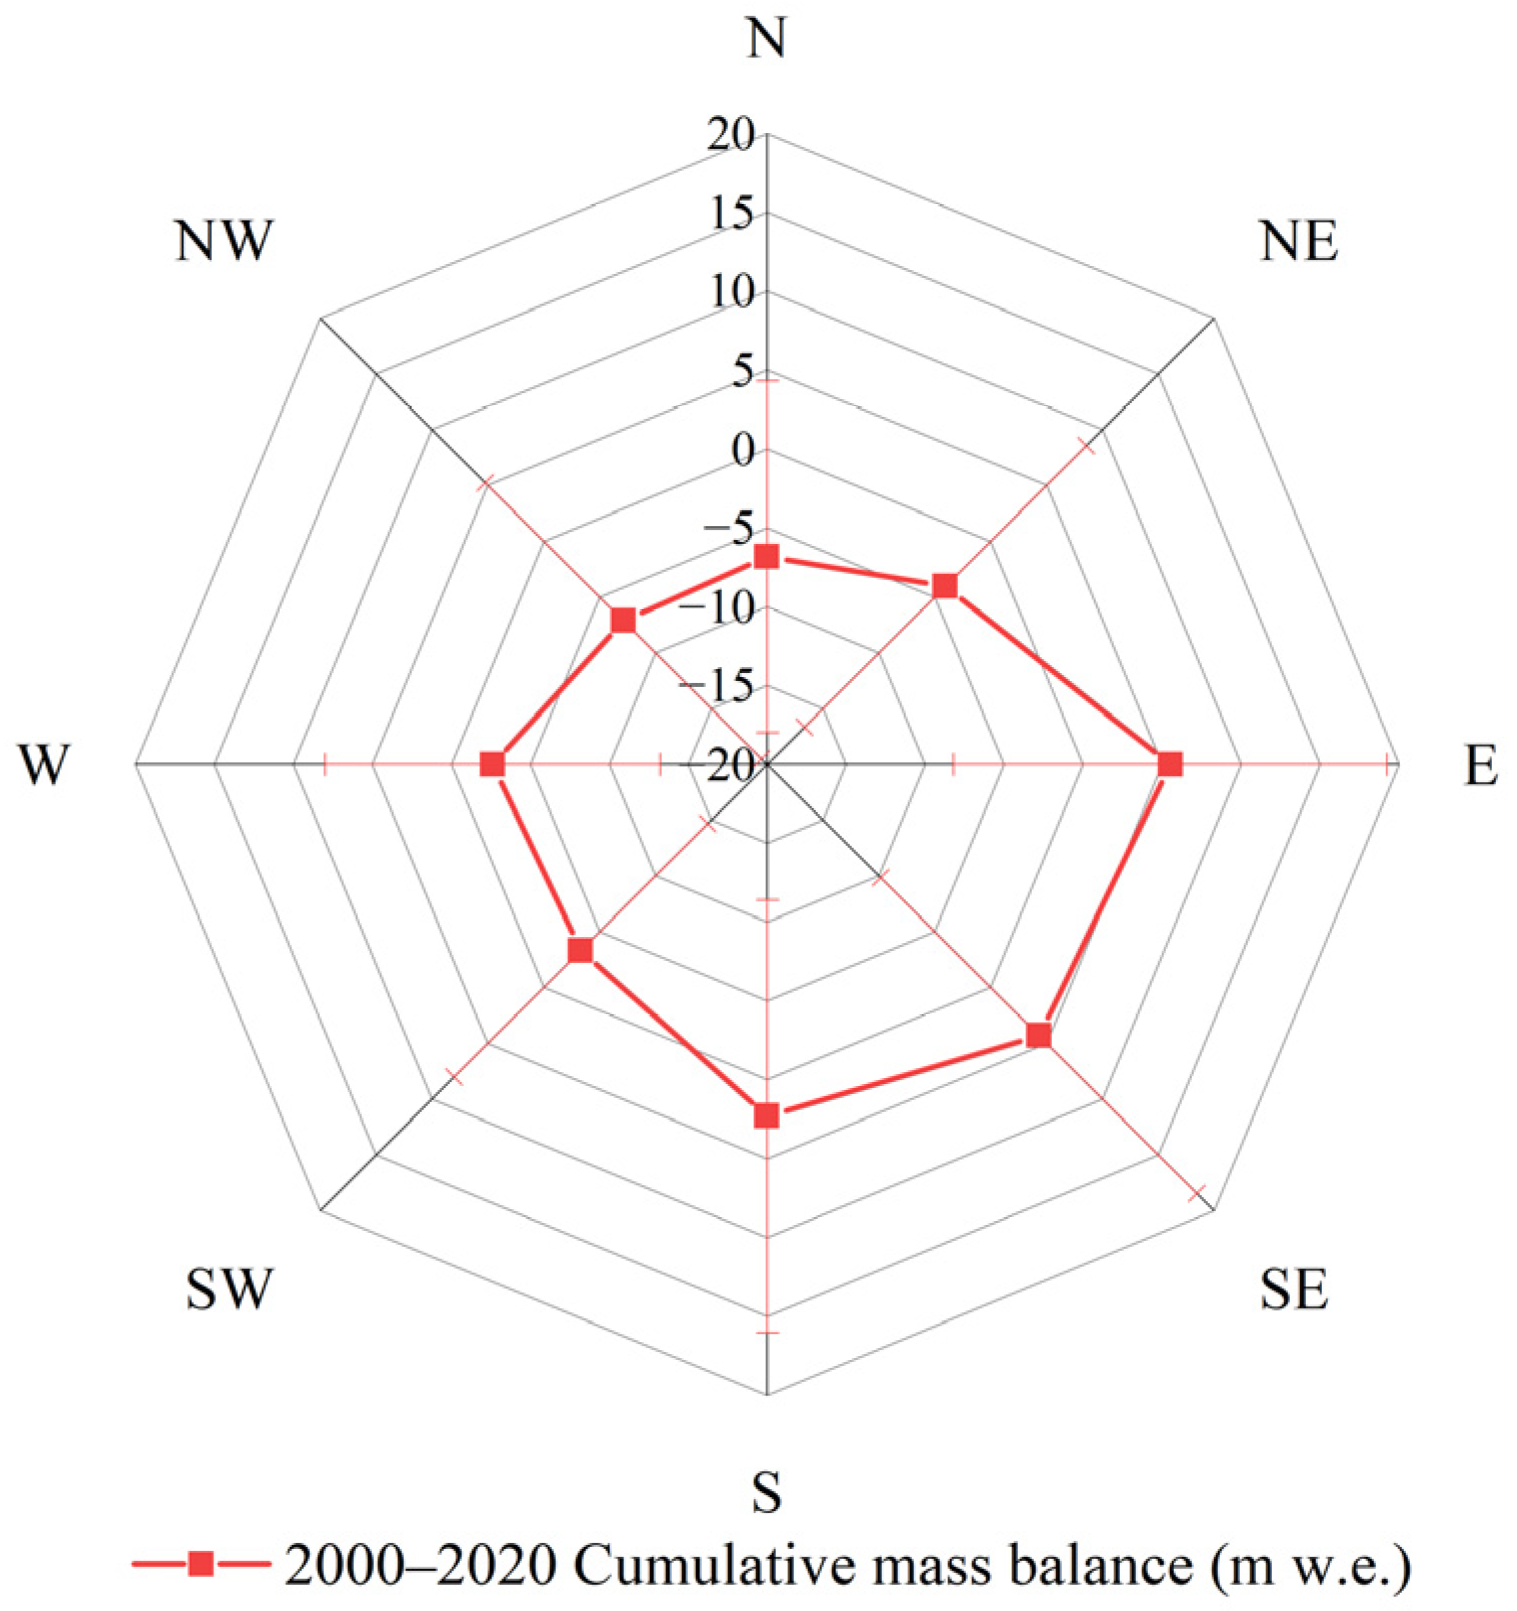
4.4. Glacier Surface Mass Balance in Different Directions and Slope Aspects
5. Discussion
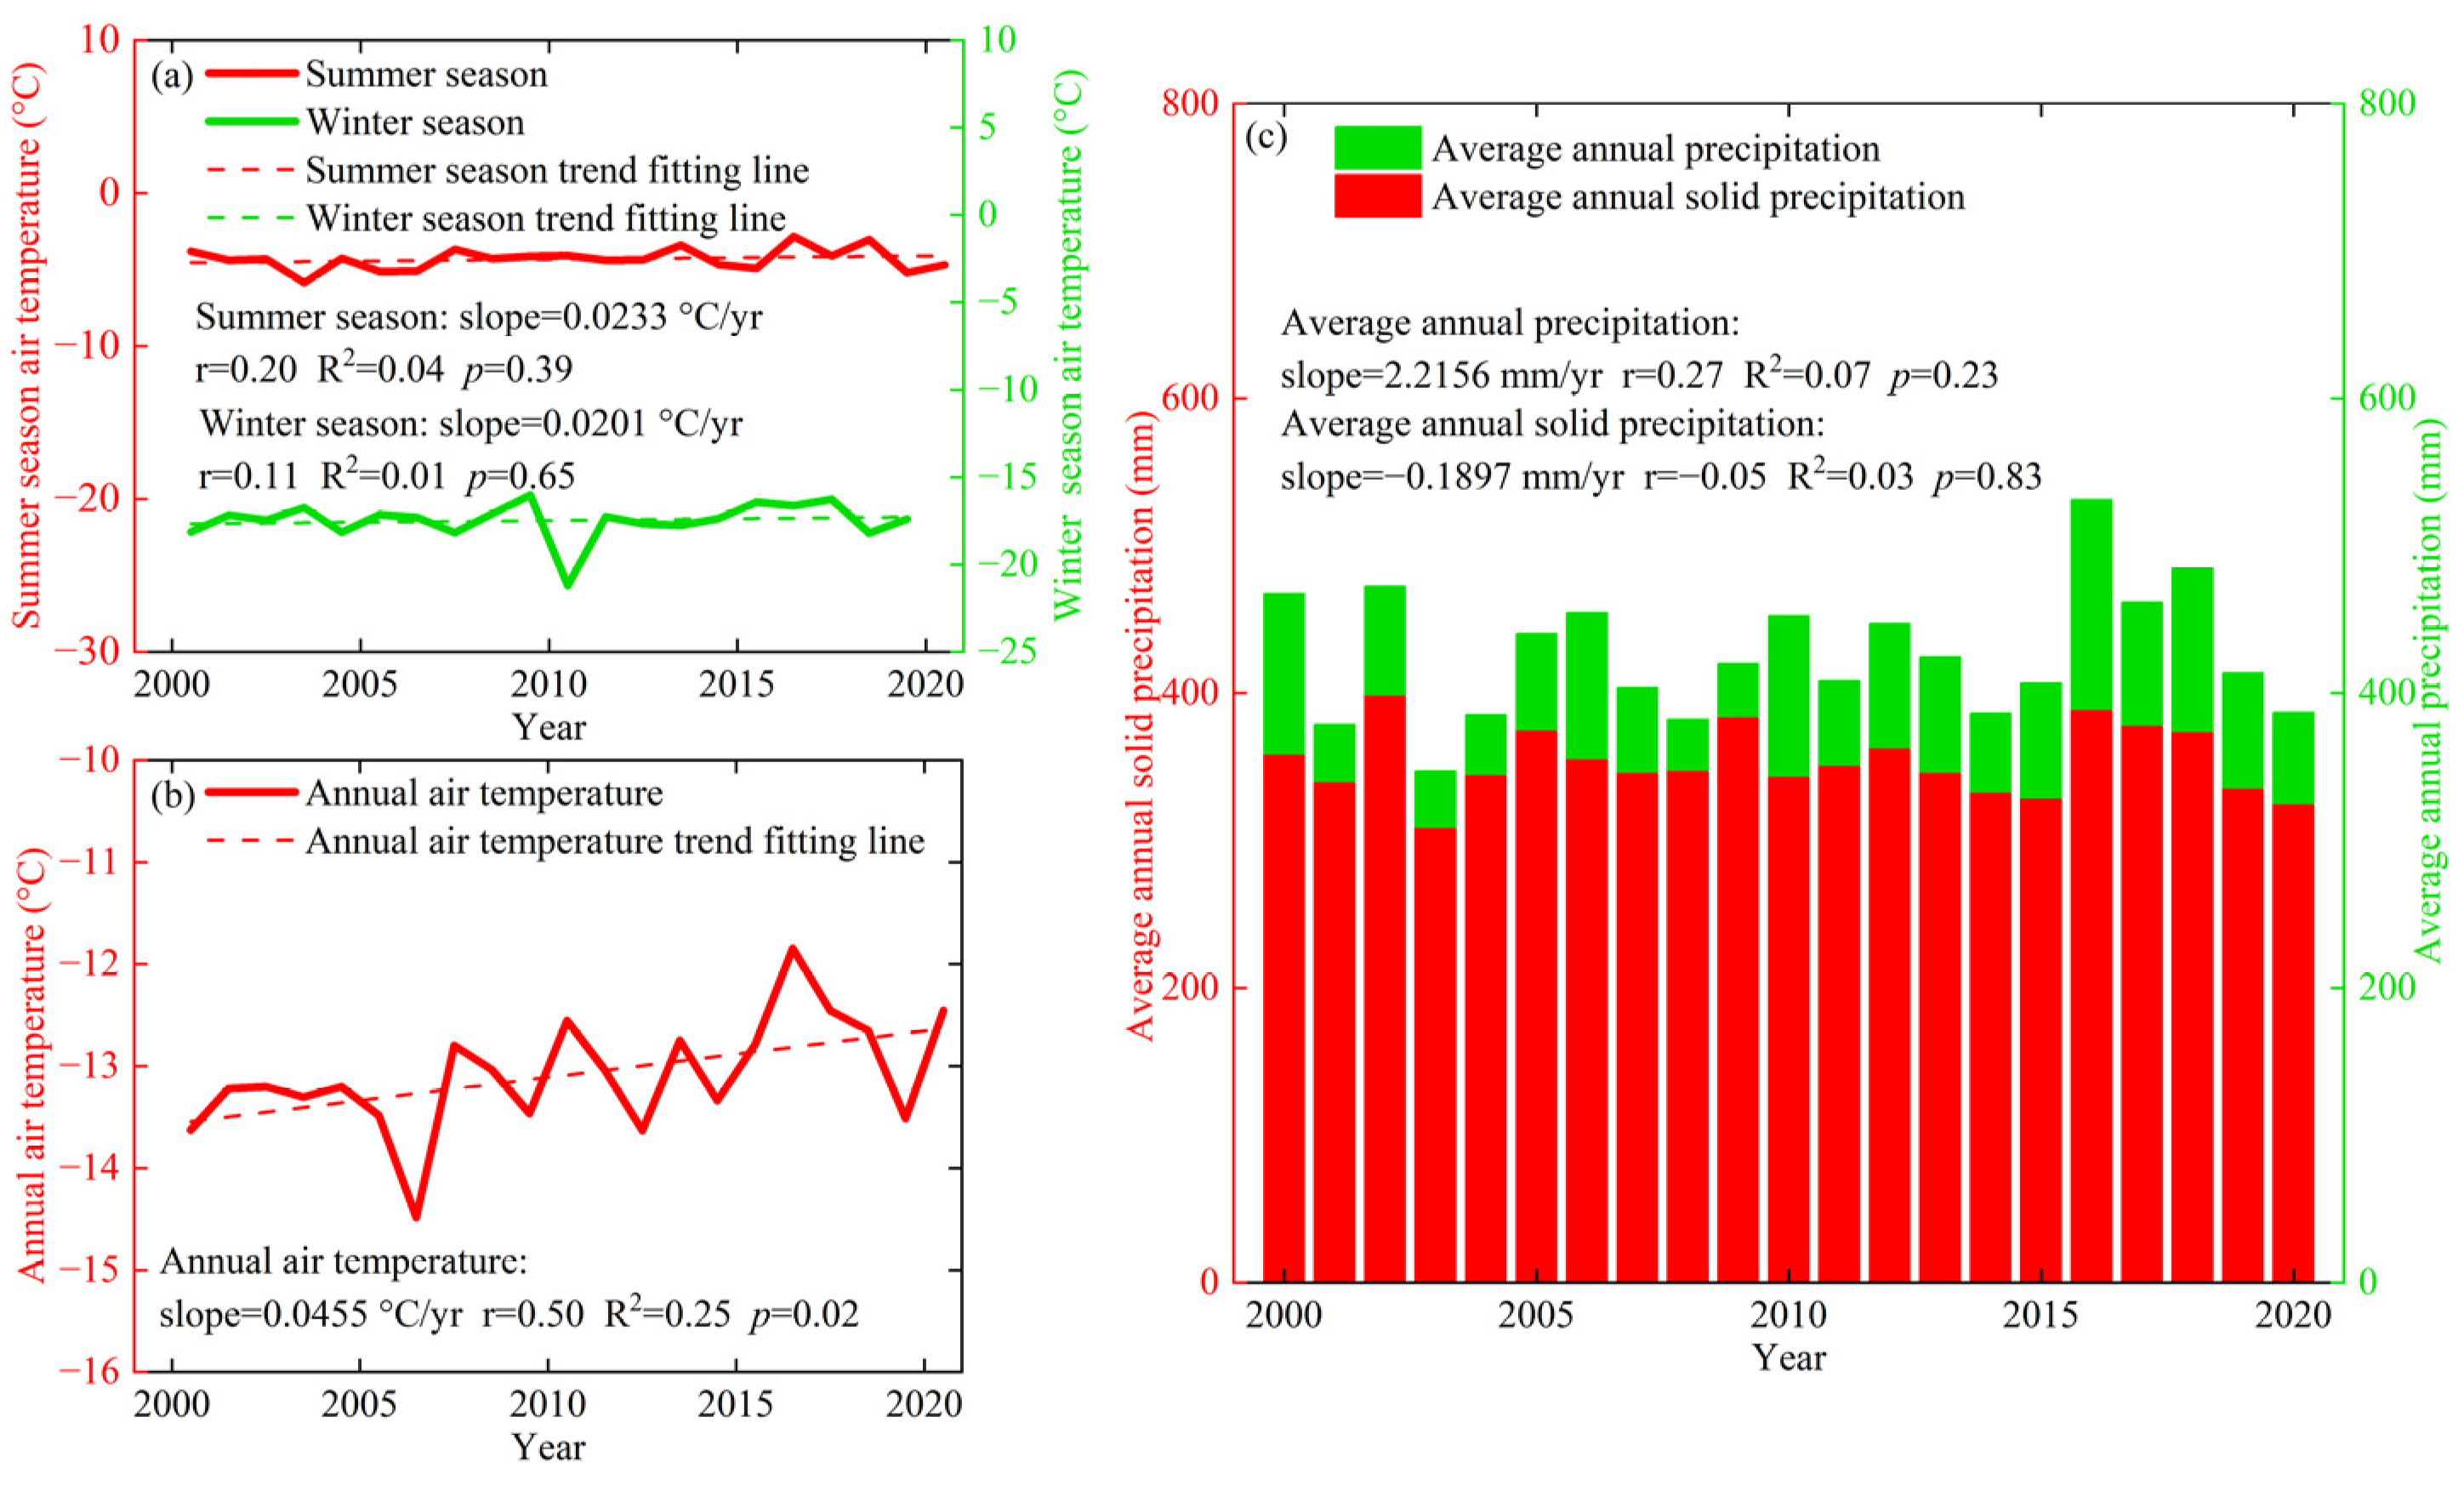
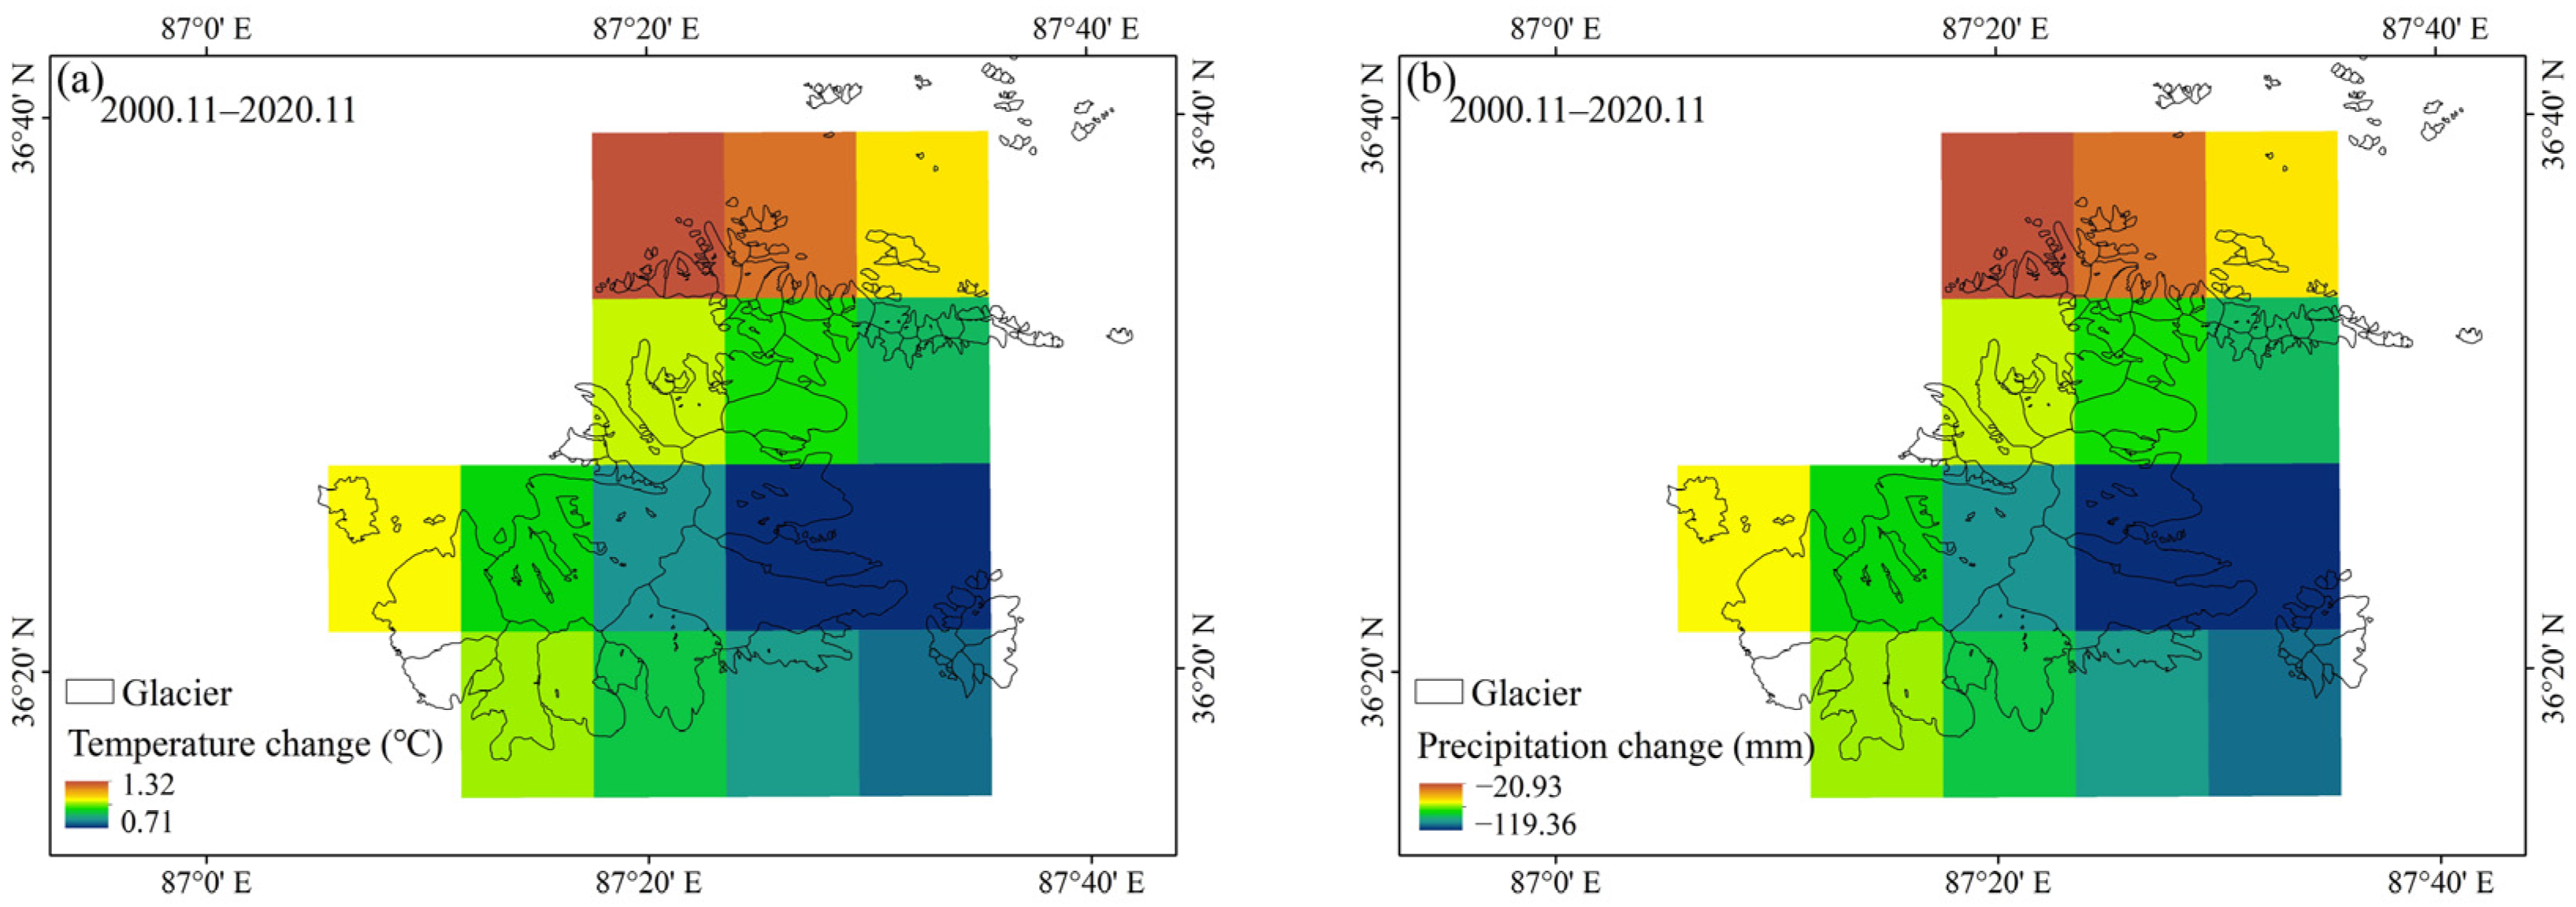
5.1. Climate Change in the Ulugh Muztagh Mountains
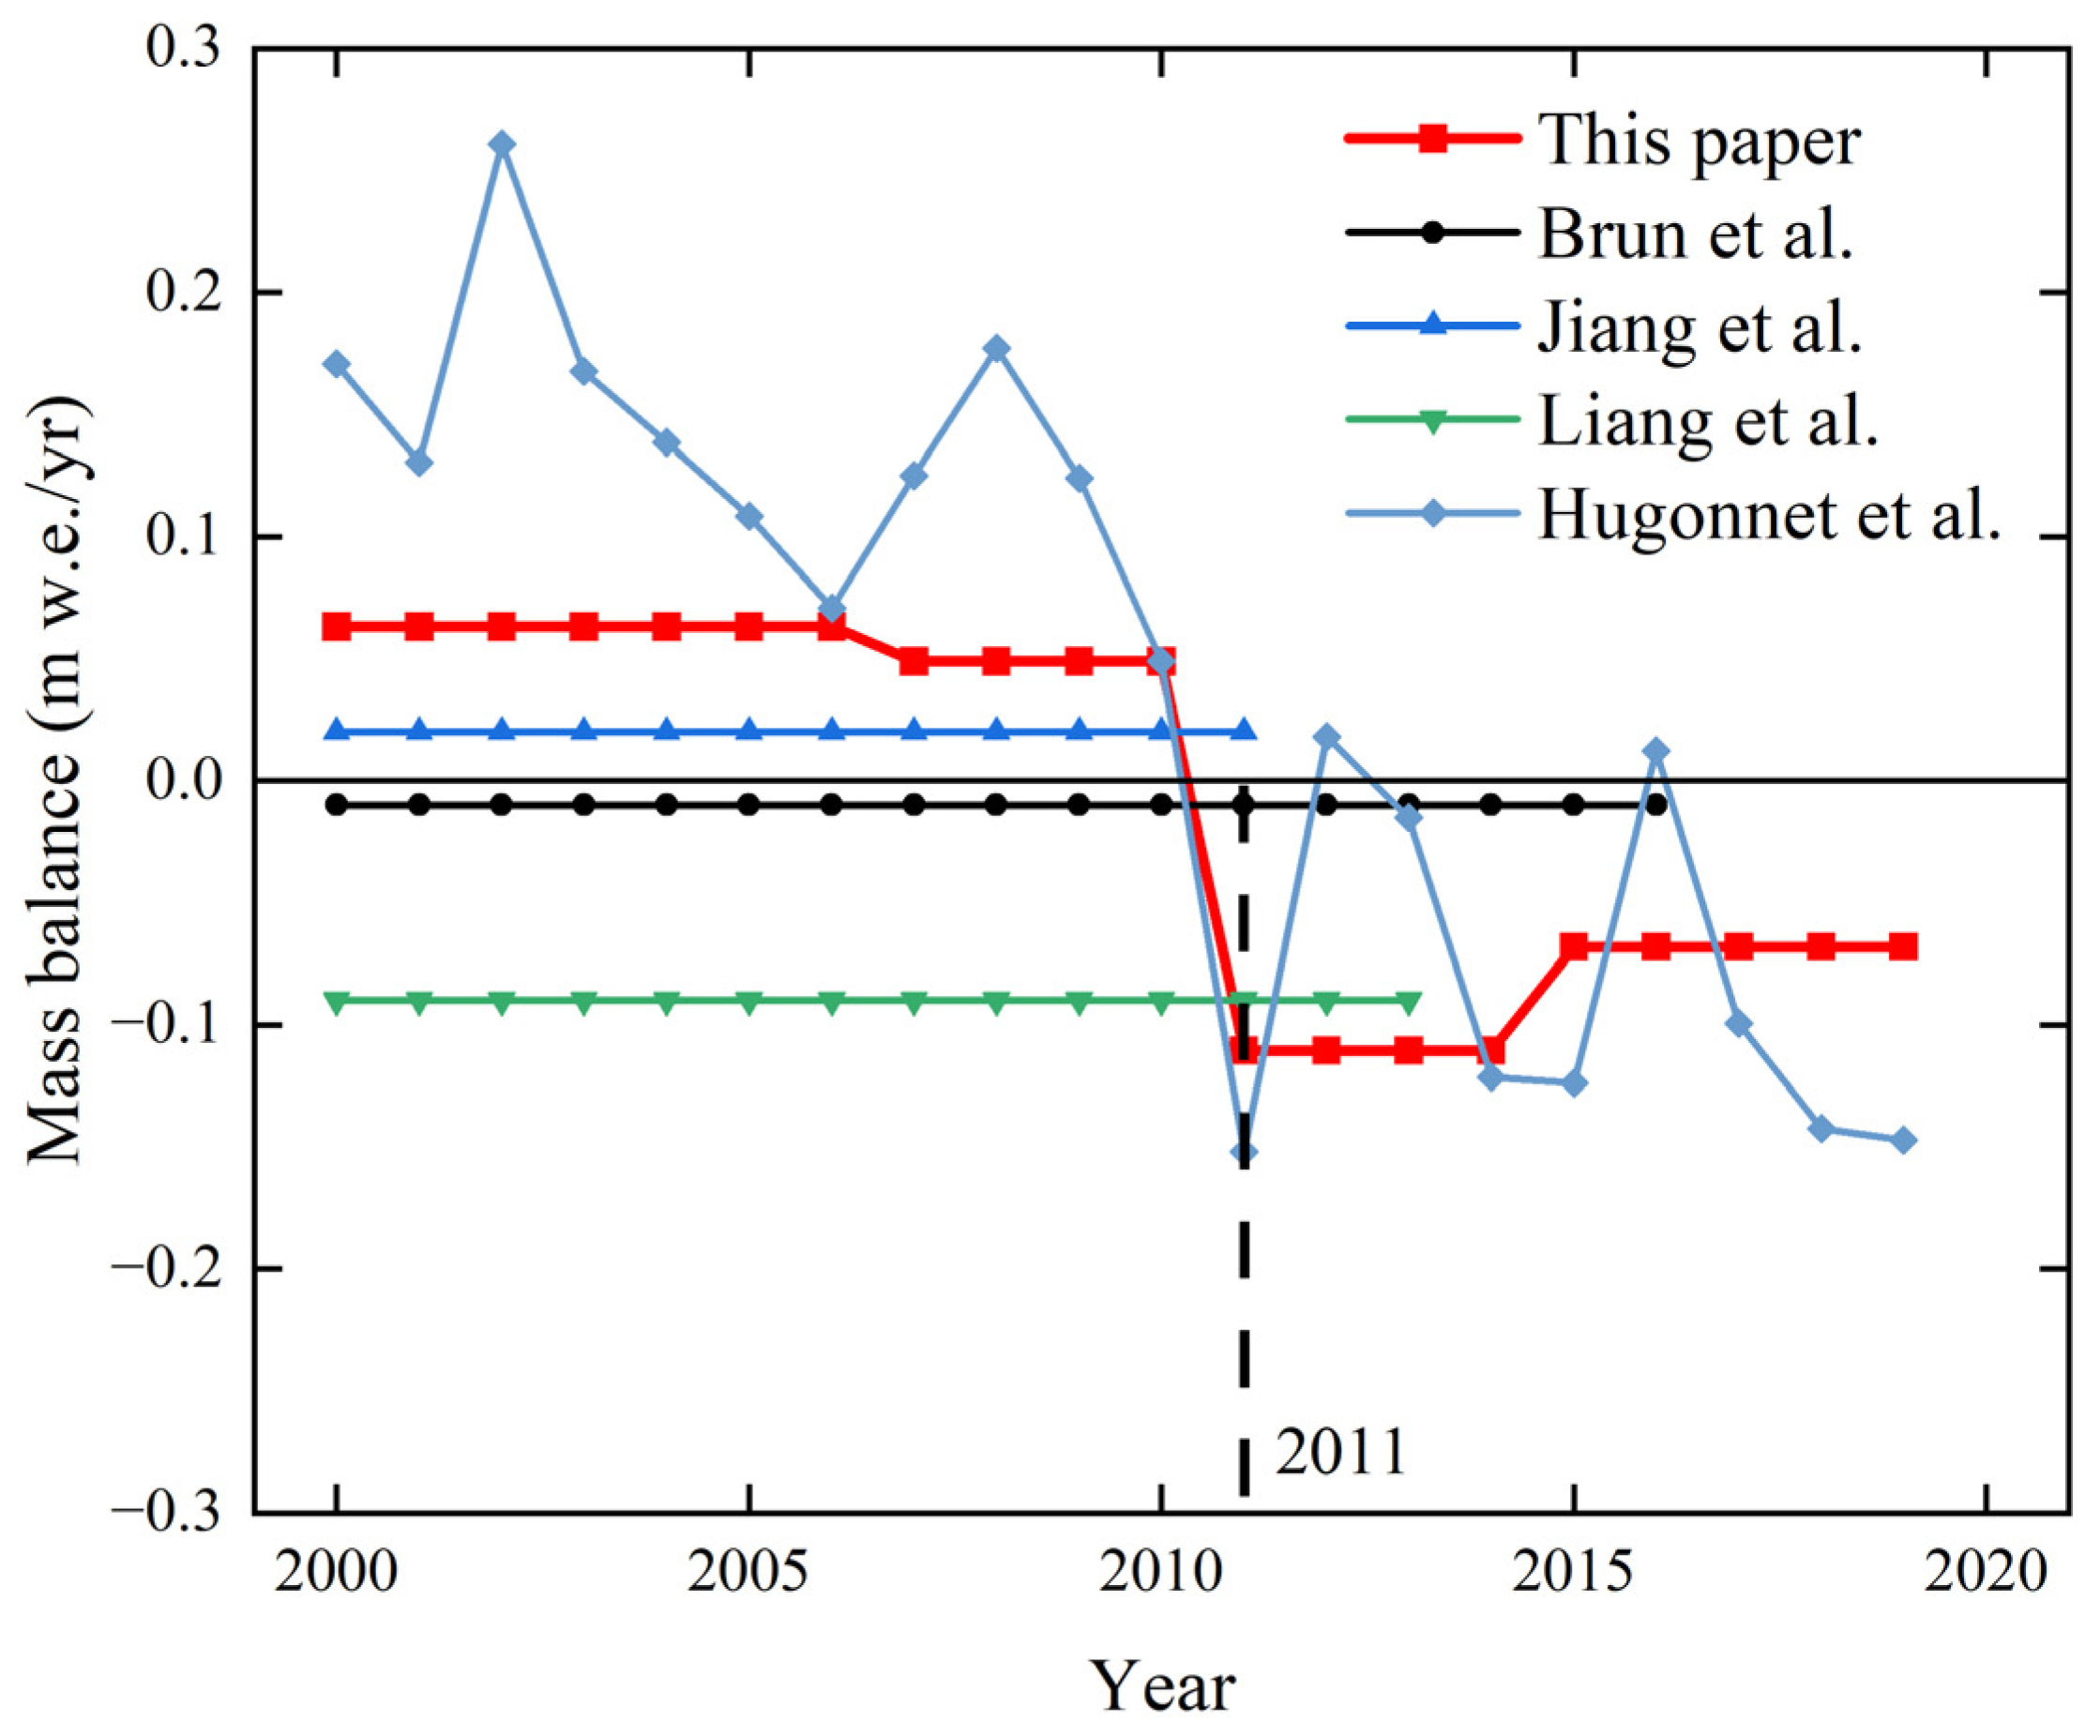
5.2. Glacier Mass Balance Change in the Ulugh Muztagh Mountains and around the Region
5.3. Typical Glacier Surge in the Ulugh Muztagh Mountains
5.4. Deficiency and Outlook
6. Conclusions
Author Contributions
Funding
Data Availability Statement
Acknowledgments
Conflicts of Interest
References
- Bhattacharya, A.; Bolch, T.; Mukherjee, K.; King, O.; Menounos, B.; Kapitsa, V.; Neckel, N.; Yang, W.; Yao, T. High Mountain Asian glacier response to climate revealed by multi-temporal satellite observations since the 1960s. Nat. Commun. 2021, 12, 4133. [Google Scholar] [CrossRef]
- Jacob, T.; Wahr, J.; Pfeffer, W.T.; Swenson, S. Recent contributions of glaciers and ice caps to sea level rise. Nature 2012, 482, 514–518. [Google Scholar] [CrossRef]
- Zemp, M.; Huss, M.; Thibert, E.; Eckert, N.; McNabb, R.; Huber, J.; Barandun, M.; Machguth, H.; Nussbaumer, S.U.; Gärtner-Roer, I.; et al. Global glacier mass changes and their contributions to sea-level rise from 1961 to 2016. Nature 2019, 568, 382–386. [Google Scholar] [CrossRef]
- Lamsal, D.; Sawagaki, T.; Watanabe, T.; Byers, A.C. Assessment of glacial lake development and prospects of outburst susceptibility: Chamlang South Glacier, eastern Nepal Himalaya. Geomat. Nat. Hazards Risk 2016, 7, 403–423. [Google Scholar] [CrossRef]
- Wang, S.; Yang, Y.; Che, Y. Global Snow-and Ice-Related Disaster Risk: A Review. Nat. Hazards Rev. 2022, 23, 03122002. [Google Scholar]
- Shugar, D.H.; Burr, A.; Haritashya, U.K.; Kargel, J.S.; Watson, C.S.; Kennedy, M.C.; Bevington, A.R.; Betts, R.A.; Harrison, S.; Strattman, K. Rapid worldwide growth of glacial lakes since 1990. Nat. Clim. Chang. 2020, 10, 939–945. [Google Scholar] [CrossRef]
- Kääb, A.; Treichler, D.; Nuth, C.; Berthier, E. Brief Communication: Contending estimates of 2003–2008 glacier mass balance over the Pamir–Karakoram–Himalaya. Cryosphere 2015, 9, 557–564. [Google Scholar] [CrossRef]
- Millan, R.; Mouginot, J.; Rabatel, A.; Morlighem, M. Ice velocity and thickness of the world’s glaciers. Nat. Geosci. 2022, 15, 124–129. [Google Scholar] [CrossRef]
- Hugonnet, R.; McNabb, R.; Berthier, E.; Menounos, B.; Nuth, C.; Girod, L.; Farinotti, D.; Huss, M.; Dussaillant, I.; Brun, F.; et al. Accelerated global glacier mass loss in the early twenty-first century. Nature 2021, 592, 726–731. [Google Scholar] [CrossRef]
- Immerzeel, W.W.; Lutz, A.F.; Andrade, M.; Bahl, A.; Biemans, H.; Bolch, T.; Hyde, S.; Brumby, S.; Davies, B.J.; Elmore, A.C.; et al. Importance and vulnerability of the world’s water towers. Nature 2020, 577, 364–369. [Google Scholar] [CrossRef]
- Gardner, A.S.; Moholdt, G.; Cogley, J.G.; Wouters, B.; Arendt, A.A.; Wahr, J.; Berthier, E.; Hock, R.; Pfeffer, W.T.; Kaser, G.; et al. A Reconciled Estimate of Glacier Contributions to Sea Level Rise: 2003 to 2009. Science 2013, 340, 852–857. [Google Scholar] [CrossRef]
- Shen, C.; Jia, L.; Ren, S. Inter- and Intra-Annual Glacier Elevation Change in High Mountain Asia Region Based on ICESat-1&2 Data Using Elevation-Aspect Bin Analysis Method. Remote Sens. 2022, 14, 1630. [Google Scholar] [CrossRef]
- Che, Y.; Zhang, M.; Li, Z.; Li, H.; Wang, S.; Sun, M.; Zha, S. Glacier mass-balance and length variation observed in China during the periods 1959–2015 and 1930–2014. Quat. Int. 2017, 454, 68–84. [Google Scholar] [CrossRef]
- Jouberton, A.; Shaw, T.E.; Miles, E.; McCarthy, M.; Fugger, S.; Ren, S.; Dehecq, A.; Yang, W.; Pellicciotti, F. Warming-induced monsoon precipitation phase change intensifies glacier mass loss in the southeastern Tibetan Plateau. Proc. Natl. Acad. Sci. USA 2022, 119, e2109796119. [Google Scholar] [CrossRef]
- Gardelle, J.; Berthier, E.; Arnaud, Y. Slight mass gain of Karakoram glaciers in the early twenty-first century. Nat. Geosci. 2012, 5, 322–325. [Google Scholar] [CrossRef]
- Chen, Y.N.; Wang, Y.S.; Wang, Z.C. Distribution, quantity and types of modern glaciers in the Muztag peak area, eastern Kunlun. Arid Zone Res. 1985, 2, 56–61. [Google Scholar]
- Guo, W.; Liu, S.; Xu, J.; Wei, j.; Ding, l. Monitoring Recent Surging of the Yulinchuan Glacier on North Slopes of Muztag Range by Remote Sensing. J. Glaciol. Geocryol. 2012, 34, 765–774. [Google Scholar]
- Jiang, Z.; Zhang, J.; Zhang, Z. Glacier change and mass balance (1972—2011) in Ulugh Muztagh, eastern Kunlun Mountains, monitored by remote sensing. Remote Sens. Land Resour. 2019, 31, 128–136. [Google Scholar] [CrossRef]
- Liang, Q.; Wang, N.; Yang, X.; Chen, A.; Hua, T.; Li, Z.; Yang, D. The eastern limit of ‘Kunlun-Pamir-Karakoram Anomaly’ reflected by changes in glacier area and surface elevation. J. Glaciol. 2022, 68, 1167–1176. [Google Scholar] [CrossRef]
- Guillet, G.; King, O.; Lv, M.; Ghuffar, S.; Benn, D.; Quincey, D.; Bolch, T. A regionally resolved inventory of High Mountain Asia surge-type glaciers, derived from a multi-factor remote sensing approach. Cryosphere 2022, 16, 603–623. [Google Scholar] [CrossRef]
- Ren, S.; Menenti, M.; Jia, L.; Zhang, J.; Zhang, J.; Li, X. Glacier Mass Balance in the Nyainqentanglha Mountains between 2000 and 2017 Retrieved from ZiYuan-3 Stereo Images and the SRTM DEM. Remote Sens. 2020, 12, 864. [Google Scholar] [CrossRef]
- Zhou, Y.; Li, Z.; Li, J.; Zhao, R.; Ding, X. Glacier mass balance in the Qinghai–Tibet Plateau and its surroundings from the mid-1970s to 2000 based on Hexagon KH-9 and SRTM DEMs. Remote Sens. Environ. 2018, 210, 96–112. [Google Scholar] [CrossRef]
- Moholdt, G.; Nuth, C.; Hagen, J.O.; Kohler, J. Recent elevation changes of Svalbard glaciers derived from ICESat laser altimetry. Remote Sens. Environ. 2010, 114, 2756–2767. [Google Scholar] [CrossRef]
- Rignot, E.; Echelmeyer, K.; Krabill, W. Penetration depth of interferometric synthetic-aperture radar signals in snow and ice. Geophys. Res. Lett. 2001, 28, 3501–3504. [Google Scholar] [CrossRef]
- Wang, D.; Kaab, A. Modeling Glacier Elevation Change from DEM Time Series. Remote Sens. 2015, 7, 10117–10142. [Google Scholar] [CrossRef]
- Brun, F.; Berthier, E.; Wagnon, P.; Kaab, A.; Treichler, D. A spatially resolved estimate of High Mountain Asia glacier mass balances from 2000 to 2016. Nat. Geosci. 2017, 10, 668–673. [Google Scholar] [CrossRef] [PubMed]
- Berthier, E.; Cabot, V.; Vincent, C.; Six, D. Decadal Region-Wide and Glacier-Wide Mass Balances Derived from Multi-Temporal ASTER Satellite Digital Elevation Models. Validation over the Mont-Blanc Area. Front. Earth Sci. 2016, 4, 63. [Google Scholar] [CrossRef]
- Farinotti, D.; Immerzeel, W.W.; de Kok, R.J.; Quincey, D.J.; Dehecq, A. Manifestations and mechanisms of the Karakoram glacier Anomaly. Nat. Geosci. 2020, 13, 8–16. [Google Scholar] [CrossRef]
- Quincey, D.J.; Braun, M.; Glasser, N.F.; Bishop, M.P.; Hewitt, K.; Luckman, A. Karakoram glacier surge dynamics. Geophys. Res. Lett. 2011, 38, L18504. [Google Scholar] [CrossRef]
- Wang, Y.; Hou, S.; Huai, B.; An, W.; Pang, H.; Liu, Y. Glacier anomaly over the western Kunlun Mountains, Northwestern Tibetan Plateau, since the 1970s. J. Glaciol. 2018, 64, 624–636. [Google Scholar] [CrossRef]
- Wang, A.; Smith, J.A.; Wang, G.; Zhang, K.; Xiang, S.; Liu, D. Late Quaternary river terrace sequences in the eastern Kunlun Range, northern Tibet: A combined record of climatic change and surface uplift. J. Asian Earth Sci. 2009, 34, 532–543. [Google Scholar] [CrossRef]
- Guo, W.; Liu, S.; Wei, J.; Bao, W. The 2008/09 surge of central Yulinchuan glacier, northern Tibetan Plateau, as monitored by remote sensing. Ann. Glaciol. 2013, 54, 299–310. [Google Scholar] [CrossRef]
- Liu, S.; Yao, X.; Guo, W.; Xu, J.; Shangguan, D.; Wei, J.; Bao, W.; Wu, L. The contemporary glaciers in China based on the Second Chinese Glacier Inventory. Acta Geogr. Sin. 2015, 70, 3–16. [Google Scholar]
- Fujisada, H. Overview of ASTER Instrument on EOS-AM1 Platform; SPIE: Bellingham, WA, USA, 1994; Volume 2268. [Google Scholar]
- Fujisada, H. ASTER Level-1 data processing algorithm. IEEE Trans. Geosci. Remote Sens. 1998, 36, 1101–1112. [Google Scholar] [CrossRef]
- Zwally, H.J.; Schutz, B.; Abdalati, W.; Abshire, J.; Bentley, C.; Brenner, A.; Bufton, J.; Dezio, J.; Hancock, D.; Harding, D.; et al. ICESat’s laser measurements of polar ice, atmosphere, ocean, and land. J. Geodyn. 2002, 34, 405–445. [Google Scholar] [CrossRef]
- Smith, B.; Fricker, H.A.; Gardner, A.S.; Medley, B.; Nilsson, J.; Paolo, F.S.; Holschuh, N.; Adusumilli, S.; Brunt, K.; Csatho, B.; et al. Pervasive ice sheet mass loss reflects competing ocean and atmosphere processes. Science 2020, 368, 1239–1242. [Google Scholar] [CrossRef]
- Markus, T.; Neumann, T.; Martino, A.; Abdalati, W.; Brunt, K.; Csatho, B.; Farrell, S.; Fricker, H.; Gardner, A.; Harding, D.; et al. The Ice, Cloud, and land Elevation Satellite-2 (ICESat-2): Science requirements, concept, and implementation. Remote Sens. Environ. 2017, 190, 260–273. [Google Scholar] [CrossRef]
- Brunt, K.M.; Neumann, T.A.; Smith, B.E. Assessment of ICESat-2 Ice Sheet Surface Heights, Based on Comparisons Over the Interior of the Antarctic Ice Sheet. Geophys. Res. Lett. 2019, 46, 13072–13078. [Google Scholar] [CrossRef]
- Shepherd, A.; Ivins, E.R.; A, G.; Barletta, V.R.; Bentley, M.J.; Bettadpur, S.; Briggs, K.H.; Bromwich, D.H.; Forsberg, R.; Galin, N.; et al. A Reconciled Estimate of Ice-Sheet Mass Balance. Science 2012, 338, 1183–1189. [Google Scholar] [CrossRef]
- Munoz-Sabater, J.; Dutra, E.; Agusti-Panareda, A.; Albergel, C.; Arduini, G.; Balsamo, G.; Boussetta, S.; Choulga, M.; Harrigan, S.; Hersbach, H.; et al. ERA5-Land: A state-of-the-art global reanalysis dataset for land applications. Earth Syst. Sci. Data 2021, 13, 4349–4383. [Google Scholar] [CrossRef]
- Zhao, P.; He, Z.B. A First Evaluation of ERA5-Land Reanalysis Temperature Product Over the Chinese Qilian Mountains. Front. Earth Sci. 2022, 10, 907730. [Google Scholar] [CrossRef]
- Guo, W.; Liu, S.; Xu, J.; Wu, L.; Shangguan, D.; Yao, X.; Wei, J.; Bao, W.; Yu, P.; Liu, Q.; et al. The second Chinese glacier inventory: Data, methods and results. J. Glaciol. 2015, 61, 357–372. [Google Scholar] [CrossRef]
- Liu, S.; Guo, W.; Xu, J. The Second Glacier Inventory Dataset of China (Version 1.0) (2006–2011); National Tibetan Plateau Data Center, Ed.; National Tibetan Plateau Data Center: Beijing, China, 2012. [Google Scholar] [CrossRef]
- Korona, J.; Berthier, E.; Bernard, M.; Rémy, F.; Thouvenot, E. SPIRIT. SPOT 5 stereoscopic survey of Polar Ice: Reference Images and Topographies during the fourth International Polar Year (2007–2009). ISPRS J. Photogramm. Remote Sens. 2009, 64, 204–212. [Google Scholar] [CrossRef]
- Toutin, T. Elevation modelling from satellite visible and infrared (VIR) data. Int. J. Remote Sens. 2001, 22, 1097–1125. [Google Scholar] [CrossRef]
- Hirano, A.; Welch, R.; Lang, H. Mapping from ASTER stereo image data: DEM validation and accuracy assessment. ISPRS J. Photogramm. Remote Sens. 2003, 57, 356–370. [Google Scholar] [CrossRef]
- Toutin, T. Three-dimensional topographic mapping with ASTER stereo data in rugged topography. IEEE Trans. Geosci. Remote Sens. 2002, 40, 2241–2247. [Google Scholar] [CrossRef]
- Madani, A.A. Accuracy assessment of digital elevation model from aster data using automatic stereocorrelation technique, east Luxor, Egypt. J. King Abdulaziz Univ. Earth Sci. 2012, 23, 23–33. [Google Scholar] [CrossRef]
- Shean, D.E.; Bhushan, S.; Montesano, P.; Rounce, D.R.; Arendt, A.; Osmanoglu, B. A Systematic, Regional Assessment of High Mountain Asia Glacier Mass Balance. Front. Earth Sci. 2020, 7, 363. [Google Scholar] [CrossRef]
- Girod, L.; Nuth, C.; Kääb, A.; McNabb, R.; Galland, O. MMASTER: Improved ASTER DEMs for Elevation Change Monitoring. Remote Sens. 2017, 9, 704. [Google Scholar] [CrossRef]
- San, B.T.; Suzen, M.L. Digital elevation model (DEM) generation and accuracy assessment from ASTER stereo data. Int. J. Remote Sens. 2005, 26, 5013–5027. [Google Scholar] [CrossRef]
- Deilami, K.; Mohd, M.I.S.; Atashpareh, N. An accuracy assessment of ASTER stereo images-derived digital elevation model by using rational polynomial coefficient model. Sci. Eng. Fac. 2012, 55, 128–135. [Google Scholar]
- Lang, H.; Welch, R.; Miyazaki, Y.; Bailey, G.B.; Kelly, G. ASTER Along-Track Stereo Experiment: A Potential Source of Global DEM Data in the Late 1990s. In Proceedings of the SPIE’s 1996 International Symposium on Optical Science, Engineering, and Instrumentation, Denver, CO, USA, 21 October 1996; Volume 2817. [Google Scholar]
- Nuth, C.; Kääb, A. Co-registration and bias corrections of satellite elevation data sets for quantifying glacier thickness change. Cryosphere 2011, 5, 271–290. [Google Scholar] [CrossRef]
- Nuimura, T.; Sakai, A.; Taniguchi, K.; Nagai, H.; Lamsal, D.; Tsutaki, S.; Kozawa, A.; Hoshina, Y.; Takenaka, S.; Omiya, S.; et al. The GAMDAM glacier inventory: A quality-controlled inventory of Asian glaciers. Cryosphere 2015, 9, 849–864. [Google Scholar] [CrossRef]
- Zhao, F.Y.; Long, D.; Li, X.D.; Huang, Q.; Han, P.F. Rapid glacier mass loss in the Southeastern Tibetan Plateau since the year 2000 from satellite observations. Remote Sens. Environ. 2022, 270, 112853. [Google Scholar] [CrossRef]
- Sochor, L.; Seehaus, T.; Braun, M.H. Increased Ice Thinning over Svalbard Measured by ICESat/ICESat-2 Laser Altimetry. Remote Sens. 2021, 13, 2089. [Google Scholar] [CrossRef]
- Qin, C.; Chen, C.; Yang, N.; Gao, Y.; Wang, M. Elevation Accuracy Evaluation and Correction of SRTM and ASTER GDEM in Shandong Province based on ICESat/GLAS. J. Geo-Inf. Sci. 2020, 22, 351. [Google Scholar] [CrossRef]
- Zhou, Y.; Li, X.; Zheng, D.; Li, Z. Evolution of geodetic mass balance over the largest lake-terminating glacier in the Tibetan Plateau with a revised radar penetration depth based on multi-source high-resolution satellite data. Remote Sens. Environ. 2022, 275, 113029. [Google Scholar] [CrossRef]
- Huss, M. Density assumptions for converting geodetic glacier volume change to mass change. Cryosphere 2013, 7, 877–887. [Google Scholar] [CrossRef]
- Gardelle, J.; Berthier, E.; Arnaud, Y.; Kääb, A. Region-wide glacier mass balances over the Pamir-Karakoram-Himalaya during 1999–2011. Cryosphere 2013, 7, 1263–1286. [Google Scholar] [CrossRef]
- Houghton, J.T.; Meira Filho, L.G.; Callander, B.A.; Harris, N.; Katternberg, A.; Maskell, K.; Lakeman, J.A. Climate Change 1995: The Science of Climate Change; Cambridge University Press, for the Intergovernmental Panel on Climate Change: Cambridge, UK, 1996. [Google Scholar]
- Zhang, H.; Li, Z.; Zhou, P. Mass balance reconstruction for Shiyi Glacier in the Qilian Mountains, Northeastern Tibetan Plateau, and its climatic drivers. Clim. Dyn. 2021, 56, 969–984. [Google Scholar] [CrossRef]
- Yao, T.; Thompson, L.; Yang, W.; Yu, W.; Gao, Y.; Guo, X.; Yang, X.; Duan, K.; Zhao, H.; Xu, B.; et al. Different glacier status with atmospheric circulations in Tibetan Plateau and surroundings. Nat. Clim. Chang. 2012, 2, 663–667. [Google Scholar] [CrossRef]
- Zhang, M.J.; Wang, S.J.; Li, Z.Q.; Wang, F.T. Glacier area shrinkage in China and its climatic background during the past half century. J. Geogr. Sci. 2012, 22, 15–28. [Google Scholar] [CrossRef]
- Hugonnet, R.; McNabb, R.; Berthier, E.; Menounos, B.; Nuth, C.; Girod, L.; Farinotti, D.; Huss, M.; Dussaillant, I.; Brun, F.; et al. Accelerated Global Glacier Mass Loss in the Early Twenty-First Century—Dataset; Theia, Ed.; Service d’Observation en Environnement Atmosphérique/Observatoire Midi-Pyrénées: Toulouse, France, 2021. [Google Scholar] [CrossRef]
- Quincey, D.J.; Glasser, N.F.; Cook, S.J.; Luckman, A. Heterogeneity in Karakoram glacier surges. J. Geophys. Res.-Earth Surf. 2015, 120, 1288–1300. [Google Scholar] [CrossRef]
- Zhang, Z.; Liu, S.; Zhang, Y.; Wei, J.; Jiang, Z.; Wu, K. Glacier variations at Aru Co in western Tibet from 1971 to 2016 derived from remote-sensing data. J. Glaciol. 2018, 64, 397–406. [Google Scholar] [CrossRef]
- Kääb, A.; Leinss, S.; Gilbert, A.; Bühler, Y.; Gascoin, S.; Evans, S.G.; Bartelt, P.; Berthier, E.; Brun, F.; Chao, W.-A.; et al. Massive collapse of two glaciers in western Tibet in 2016 after surge-like instability. Nat. Geosci. 2018, 11, 114–120. [Google Scholar] [CrossRef]
- Rivera, A.; Casassa, G.; Bamber, J.; Kääb, A. Ice-elevation changes of Glaciar Chico, southern Patagonia, using ASTER DEMs, aerial photographs and GPS data. J. Glaciol. 2005, 51, 105–112. [Google Scholar] [CrossRef]
- Fan, Y.B.; Ke, C.Q.; Zhou, X.B.; Shen, X.Y.; Yu, X.N.; Lhakpa, D. Glacier mass-balance estimates over High Mountain Asia from 2000 to 2021 based on ICESat-2 and NASADEM. J. Glaciol. 2022, 1–13. [Google Scholar] [CrossRef]
- Round, V.; Leinss, S.; Huss, M.; Haemmig, C.; Hajnsek, I. Surge dynamics and lake outbursts of Kyagar Glacier, Karakoram. Cryosphere 2017, 11, 723–739. [Google Scholar] [CrossRef]


| Code | File Name | Acquisition Time | Cloud Cover | Usage |
|---|---|---|---|---|
| 1 | AST_L1A_00310282000052253 | 28.10.2000 | 10% | DEM/2000 |
| 2 | AST_L1A_00310282000052302 | 28.10.2000 | 3% | |
| 3 | AST_L1A_00311012007050912 | 01.11.2007 | 3% | DEM/2007 |
| 4 | AST_L1A_00311172007050902 | 17.11.2007 | 9% | |
| 5 | AST_L1A_00311172007050911 | 17.11.2007 | 6% | |
| 6 | AST_L1A_00311282011050847 | 28.11.2011 | 4% | DEM/2011 |
| 7 | AST_L1A_00311282011050856 | 28.11.2011 | 2% | |
| 8 | AST_L1A_00311072015051000 | 07.11.2015 | 6% | DEM/2015 |
| 9 | AST_L1A_00311072015051009 | 07.11.2015 | 6% | |
| 10 | AST_L1A_00310122020050316 | 12.10.2020 | 2% | DEM/2020 |
| 11 | AST_L1A_00311042020050914 | 04.11.2020 | 7% | |
| 12 | AST_L1A_00311202005050230 | 20.11.2020 | 4% |
| Code | Category | Acquisition Time | Longitude | Latitude | Elevation (m) | Group |
|---|---|---|---|---|---|---|
| 1 | ICESat-1 | 10.10.2003 | 87.351974 | 36.418060 | 6249.8900 | 1 |
| 2 | ICESat-2 | 14.04.2019 | 87.351534 | 36.418233 | 6270.6895 | |
| 3 | ICESat-1 | 10.10.2003 | 87.352505 | 36.421158 | 6421.6040 | 2 |
| 4 | ICESat-2 | 14.04.2019 | 87.352140 | 36.421185 | 6415.4270 | |
| 5 | ICESat-1 | 10.10.2003 | 87.339819 | 36.348248 | 5783.9330 | 3 |
| 6 | ICESat-2 | 04.10.2020 | 87.339718 | 36.348318 | 5782.0796 | |
| 7 | ICESat-1 | 10.10.2003 | 87.339550 | 36.346695 | 5785.6910 | 4 |
| 8 | ICESat-2 | 10.04.2020 | 87.339528 | 36.346702 | 5783.5347 | |
| 9 | ICESat-1 | 10.10.2003 | 87.339279 | 36.345139 | 5784.7470 | 5 |
| 10 | ICESat-2 | 10.04.2020 | 87.339342 | 36.345080 | 5782.8230 | |
| 11 | ICESat-1 | 10.10.2003 | 87.336791 | 36.331104 | 5668.7550 | 6 |
| 12 | ICESat-2 | 10.04.2020 | 87.336714 | 36.331127 | 5668.0386 | |
| 13 | ICESat-1 | 10.10.2003 | 87.336512 | 36.329548 | 5660.0320 | 7 |
| 14 | ICESat-2 | 10.04.2020 | 87.336525 | 36.329508 | 5658.8433 | |
| 15 | ICESat-1 | 10.10.2003 | 87.351445 | 36.414959 | 6043.7600 | 8 |
| 16 | ICESat-2 | 03.07.2021 | 87.350754 | 36.414980 | 6048.1650 |
| Code | Category | Track ID | Time | Usage |
|---|---|---|---|---|
| 1 | ICESat-1 | 265 | 2003–2009 | Calibration |
| 2 | ICESat-1 | 1180 | 2003–2009 | Calibration |
| 3 | ICESat-1 | 317 | 2003–2009 | Calibration |
| 4 | ICESat-1 | 1247 | 2003–2009 | Calibration |
| 5 | ICESat-2 | 157 | 4 October 2020 | Validation |
| Code | File Name | Acquisition Time | Usage |
|---|---|---|---|
| 1 | 004-008_S5_224-277-0_2004-09-13-05-05-30_HRS-1_S_MX_KK | 13 September 2004 | Verify ASTER DEM |
| 2 | 004-008_S5_224-277-0_2004-09-13-05-07-01_HRS-2_S_MX_KK | 13 September 2004 | |
| 3 | 002-003_S5_223-277-0_2008-07-18-04-54-43_HRS-1_S_MX_KK | 18 July 2008 | Verify ASTER DEM |
| 4 | 001-003_S5_223-276-7_2008-07-18-04-56-06_HRS-2_S_MX_KK | 18 July 2008 |
| ASTER DEM | Corrected Value in X Direction (m) | Corrected Value in Y Direction (m) | Corrected Value in Z Direction (m) |
|---|---|---|---|
| DEM/2000 | - | - | 10.57 |
| DEM/2007 | −1.00 | 7.40 | 2.49 |
| DEM/2011 | −9.50 | 47.80 | 15.64 |
| DEM/2015 | −41.40 | −12.50 | −8.77 |
| DEM/2020 | −5.60 | 1.30 | 15.38 |
| Code | Data | Change in Glacier Surface Elevation (m) | Standard Deviation (m) |
|---|---|---|---|
| 1 | 28 October 2000–17 November 2007 | 0.52 | ±10.99 |
| 2 | 17 November 2007–28 November 2011 | 0.23 | ±10.70 |
| 3 | 28 November 2011–07 November 2015 | −0.52 | ±11.75 |
| 4 | 07 November 2015–04 November 2020 | −0.40 | ±9.51 |
Disclaimer/Publisher’s Note: The statements, opinions and data contained in all publications are solely those of the individual author(s) and contributor(s) and not of MDPI and/or the editor(s). MDPI and/or the editor(s) disclaim responsibility for any injury to people or property resulting from any ideas, methods, instructions or products referred to in the content. |
© 2023 by the authors. Licensee MDPI, Basel, Switzerland. This article is an open access article distributed under the terms and conditions of the Creative Commons Attribution (CC BY) license (https://creativecommons.org/licenses/by/4.0/).
Share and Cite
Gu, L.; Che, Y.; Zhang, M.; Chen, L.; Zhou, Y.; Ma, X. Slight Mass Loss in Glaciers over the Ulugh Muztagh Mountains during the Period from 2000 to 2020. Remote Sens. 2023, 15, 2338. https://doi.org/10.3390/rs15092338
Gu L, Che Y, Zhang M, Chen L, Zhou Y, Ma X. Slight Mass Loss in Glaciers over the Ulugh Muztagh Mountains during the Period from 2000 to 2020. Remote Sensing. 2023; 15(9):2338. https://doi.org/10.3390/rs15092338
Chicago/Turabian StyleGu, Lailei, Yanjun Che, Mingjun Zhang, Lihua Chen, Yushan Zhou, and Xinggang Ma. 2023. "Slight Mass Loss in Glaciers over the Ulugh Muztagh Mountains during the Period from 2000 to 2020" Remote Sensing 15, no. 9: 2338. https://doi.org/10.3390/rs15092338
APA StyleGu, L., Che, Y., Zhang, M., Chen, L., Zhou, Y., & Ma, X. (2023). Slight Mass Loss in Glaciers over the Ulugh Muztagh Mountains during the Period from 2000 to 2020. Remote Sensing, 15(9), 2338. https://doi.org/10.3390/rs15092338