
Optimizing Ecological Spatial Network Topology for Enhanced Carbon Sequestration in the Ecologically Sensitive Middle Reaches of the Yellow River, China


Abstract
1. Introduction
2. Material and Methods
2.1. Material
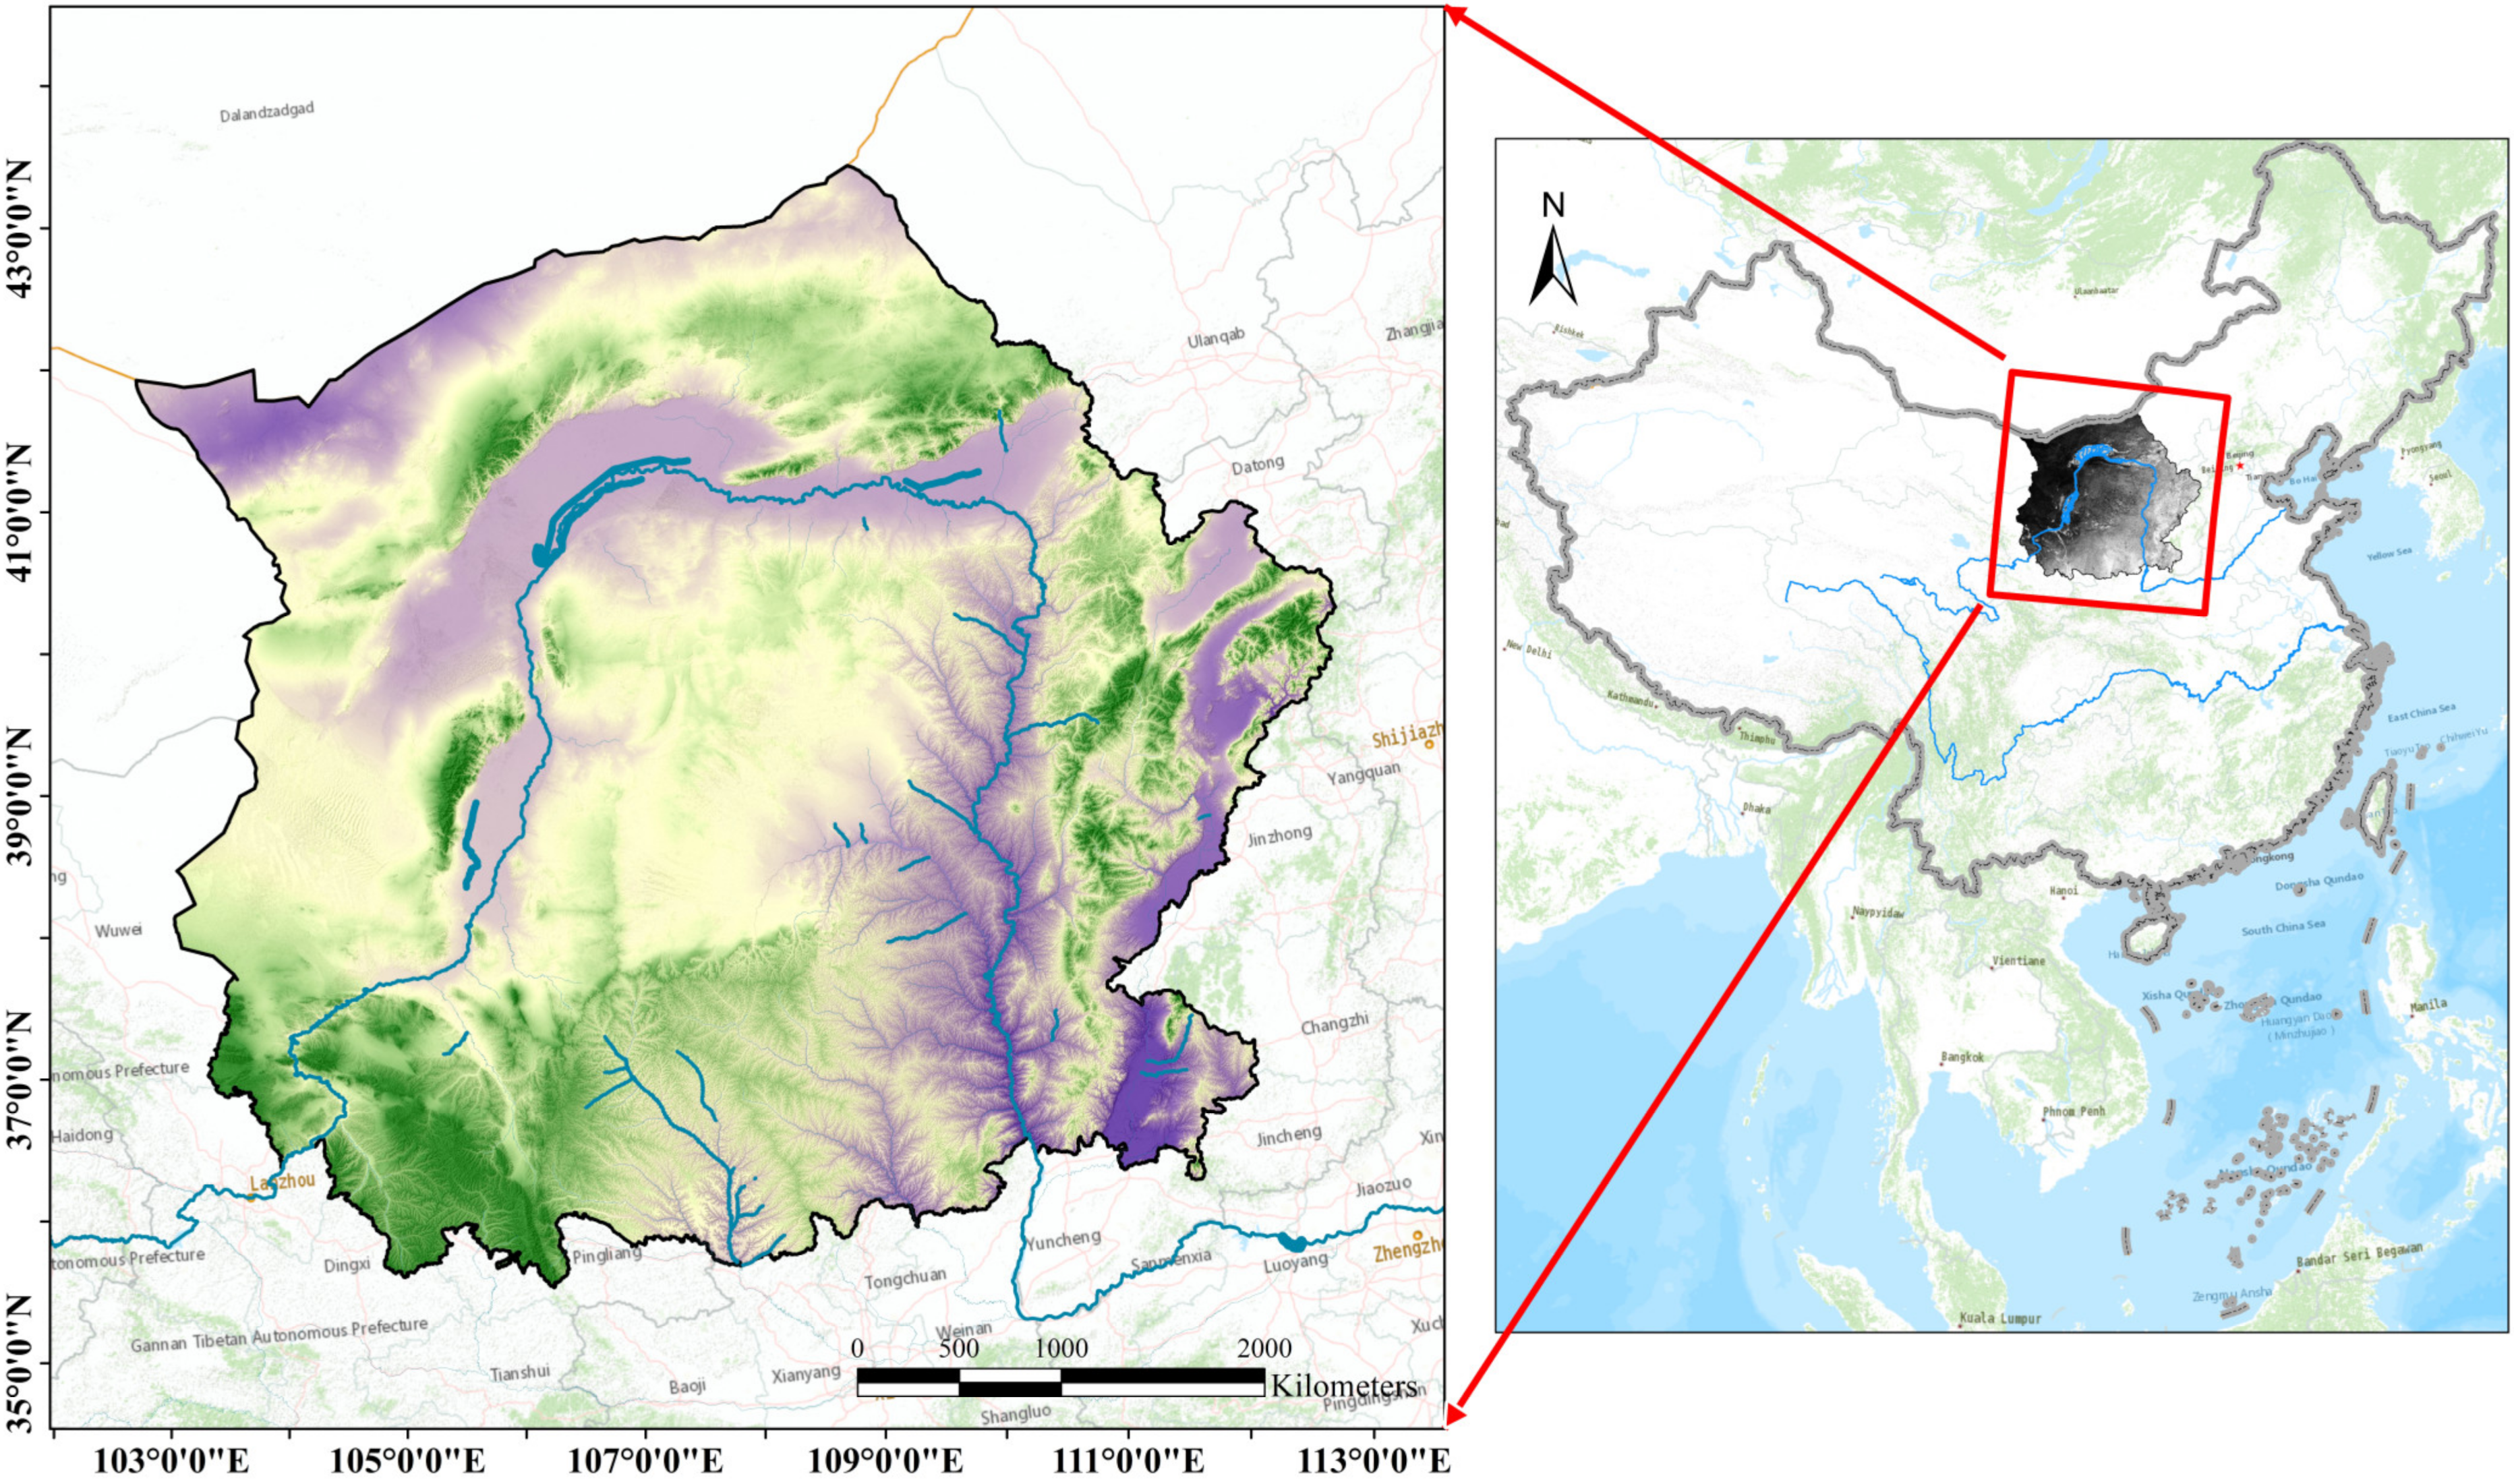
2.1.1. Study Area
2.1.2. Data Sources and Processing
2.1.3. Remote Sensing Data Acquisition and Processing
2.2. Establishment of the Ecological Spatial Network
2.2.1. Extraction of Ecological Sources
2.2.2. Identification of Ecological Corridors Using MCR Model
2.2.3. Topological Analysis of Ecological Spatial Networks
2.3. Estimating the Carbon Sink of the Ecosystem Using Theoretical Model of Photonic Energy Utilization Efficiency
2.3.1. Theoretical Model of Photonic Energy Utilization Efficiency
2.3.2. Ecosystem Carbon Sink Estimation
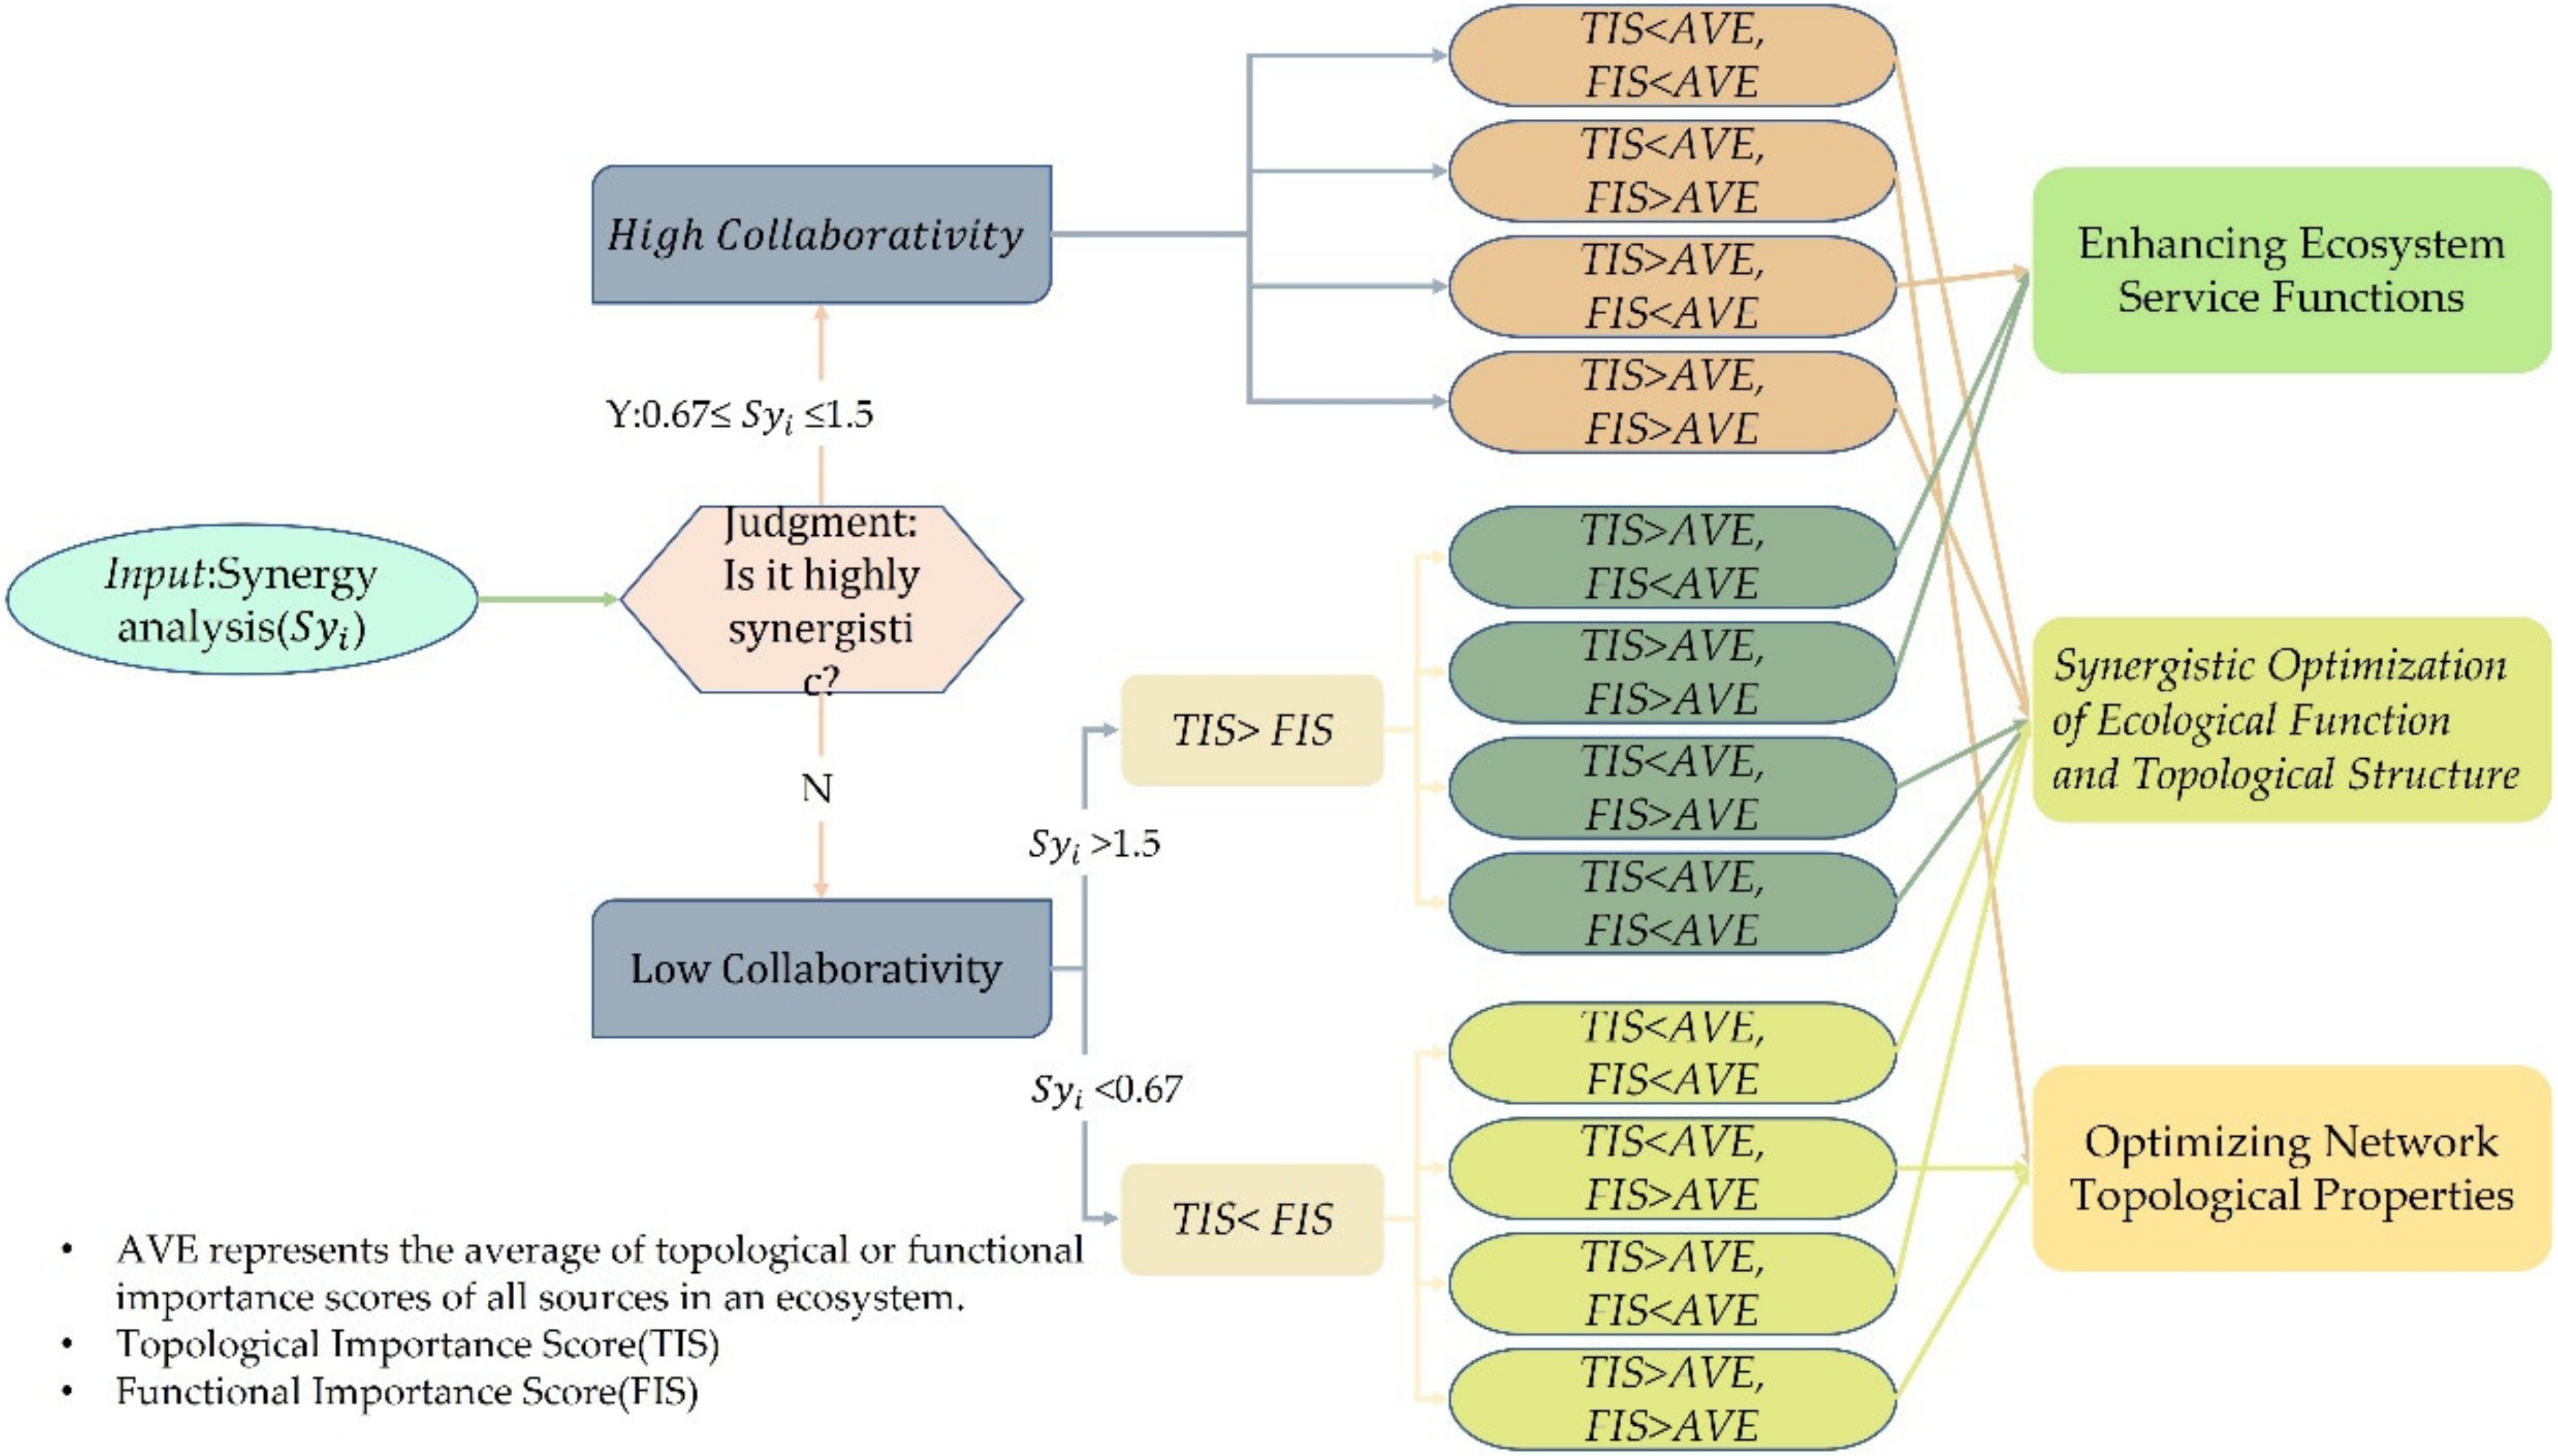
2.4. Topology and Function Coupling Optimization Model
3. Results
3.1. Analysis of Ecological Space Network
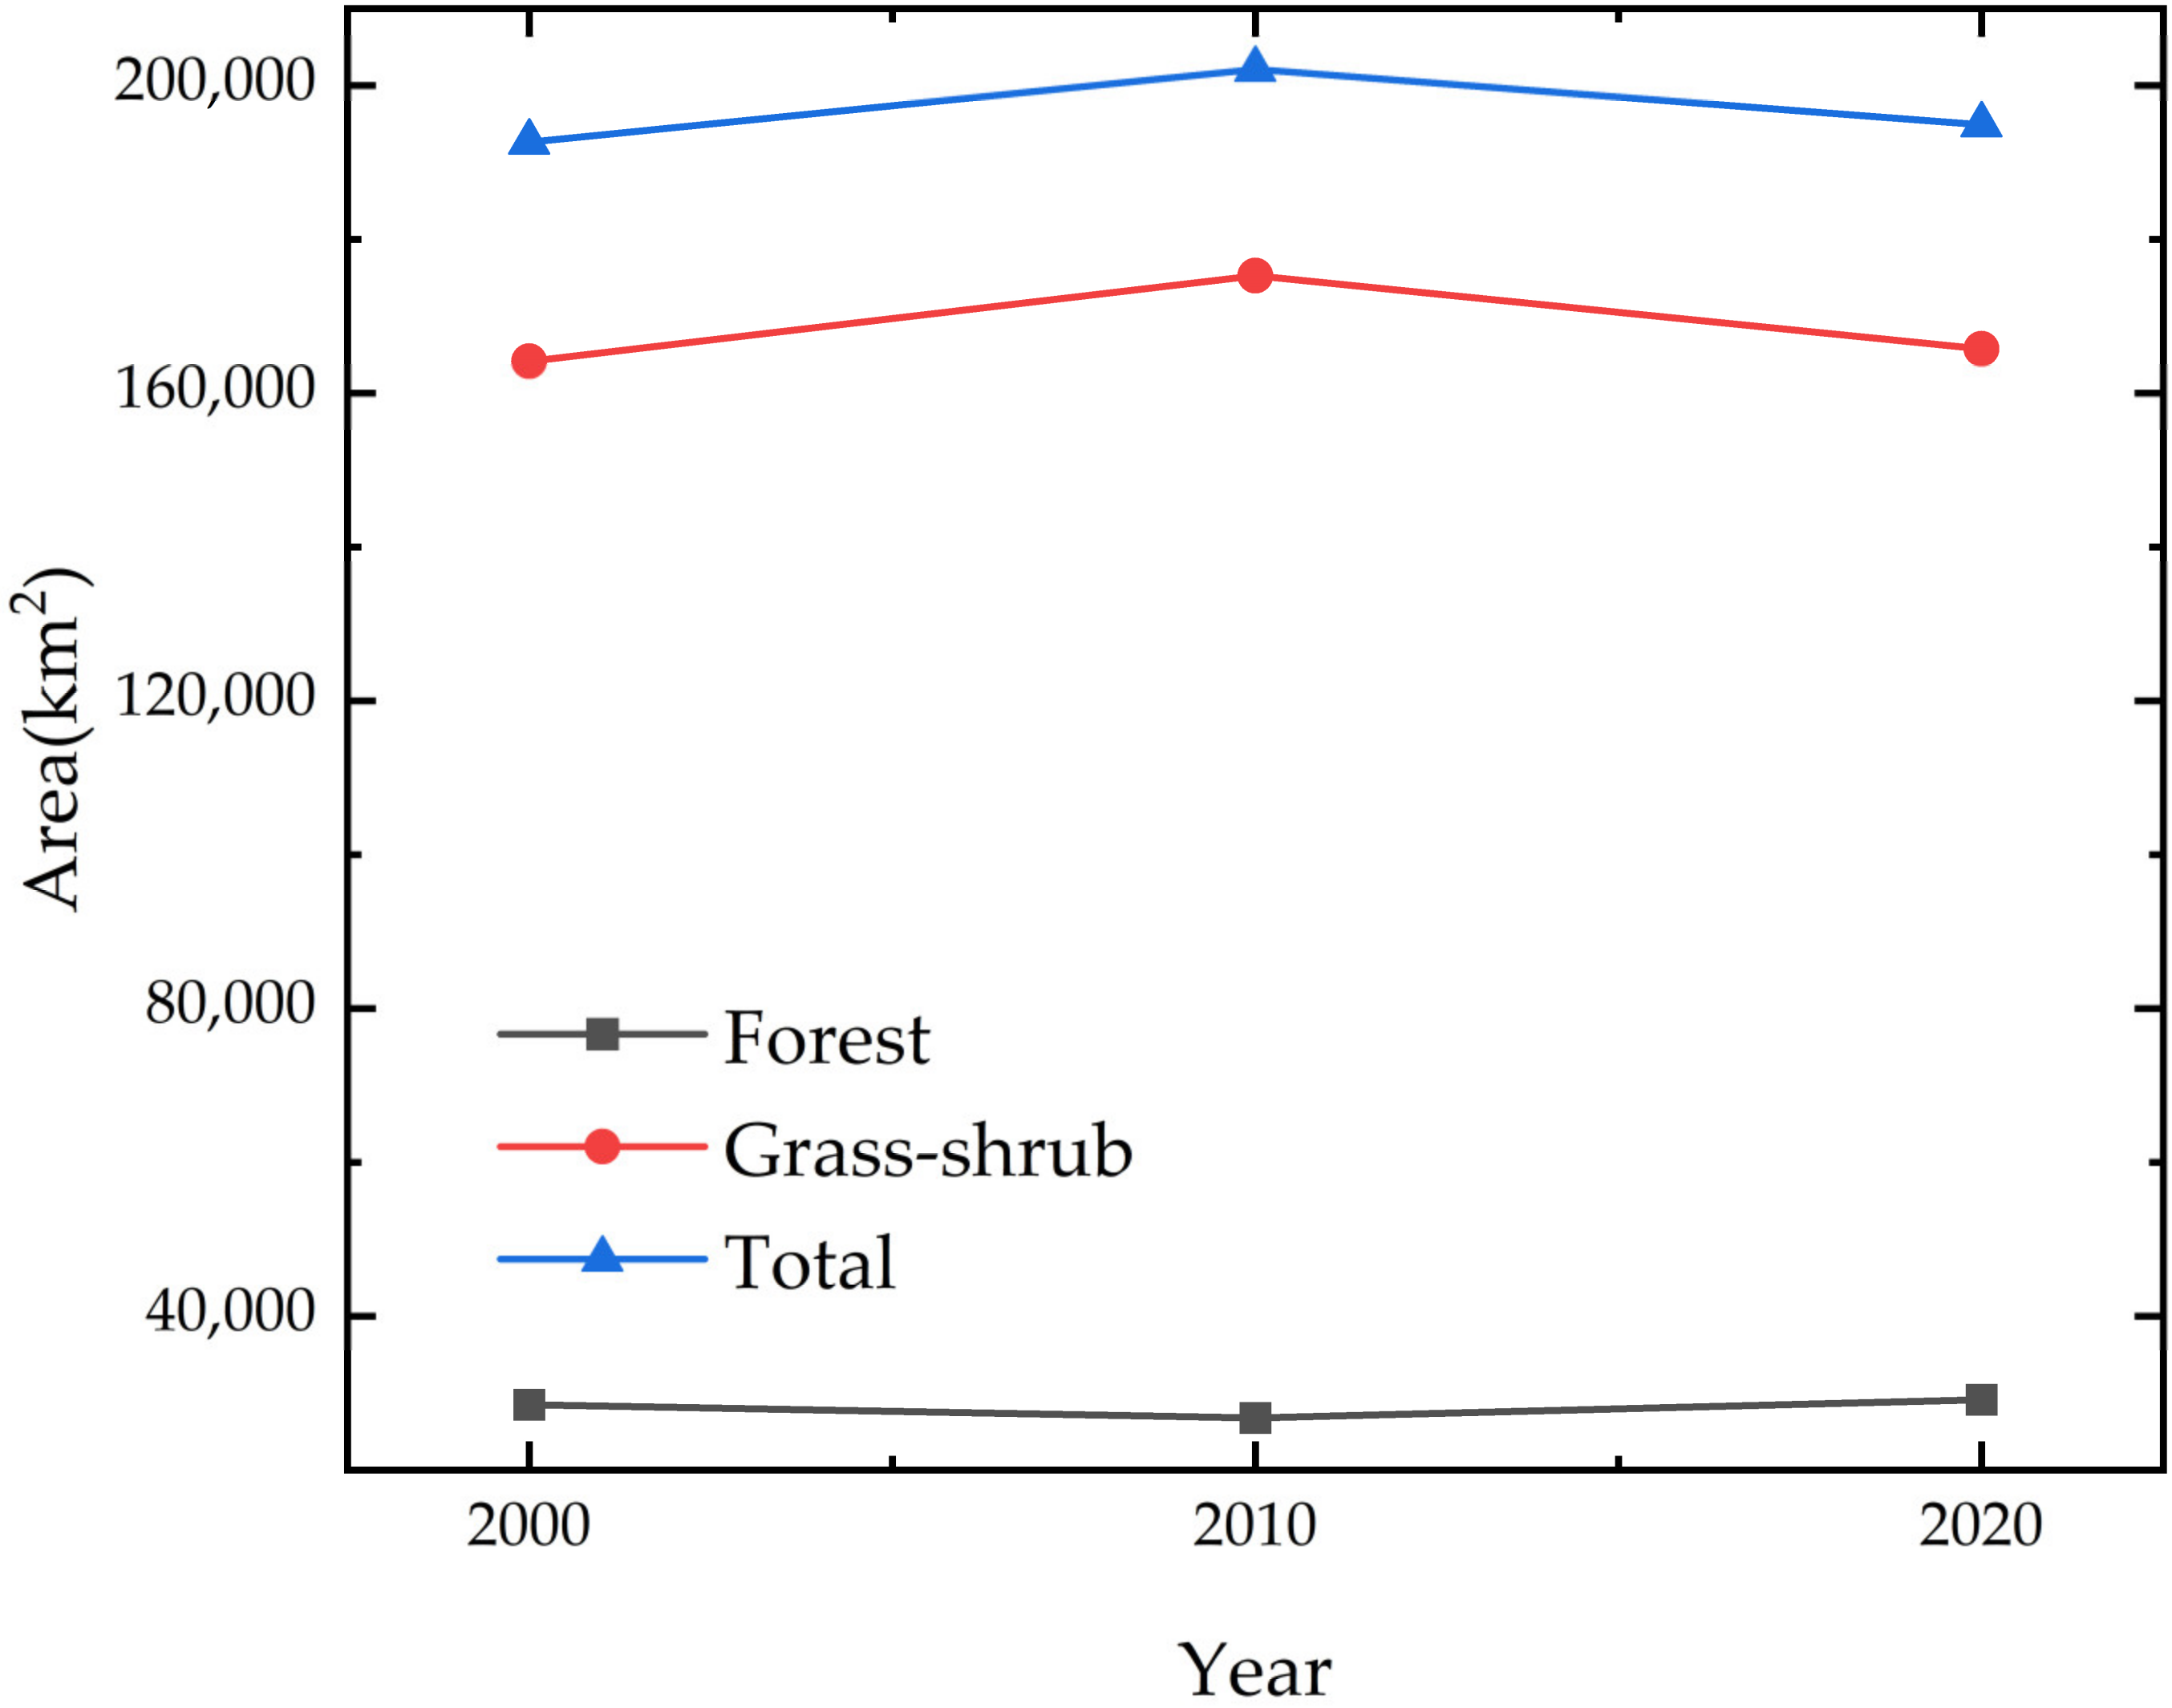
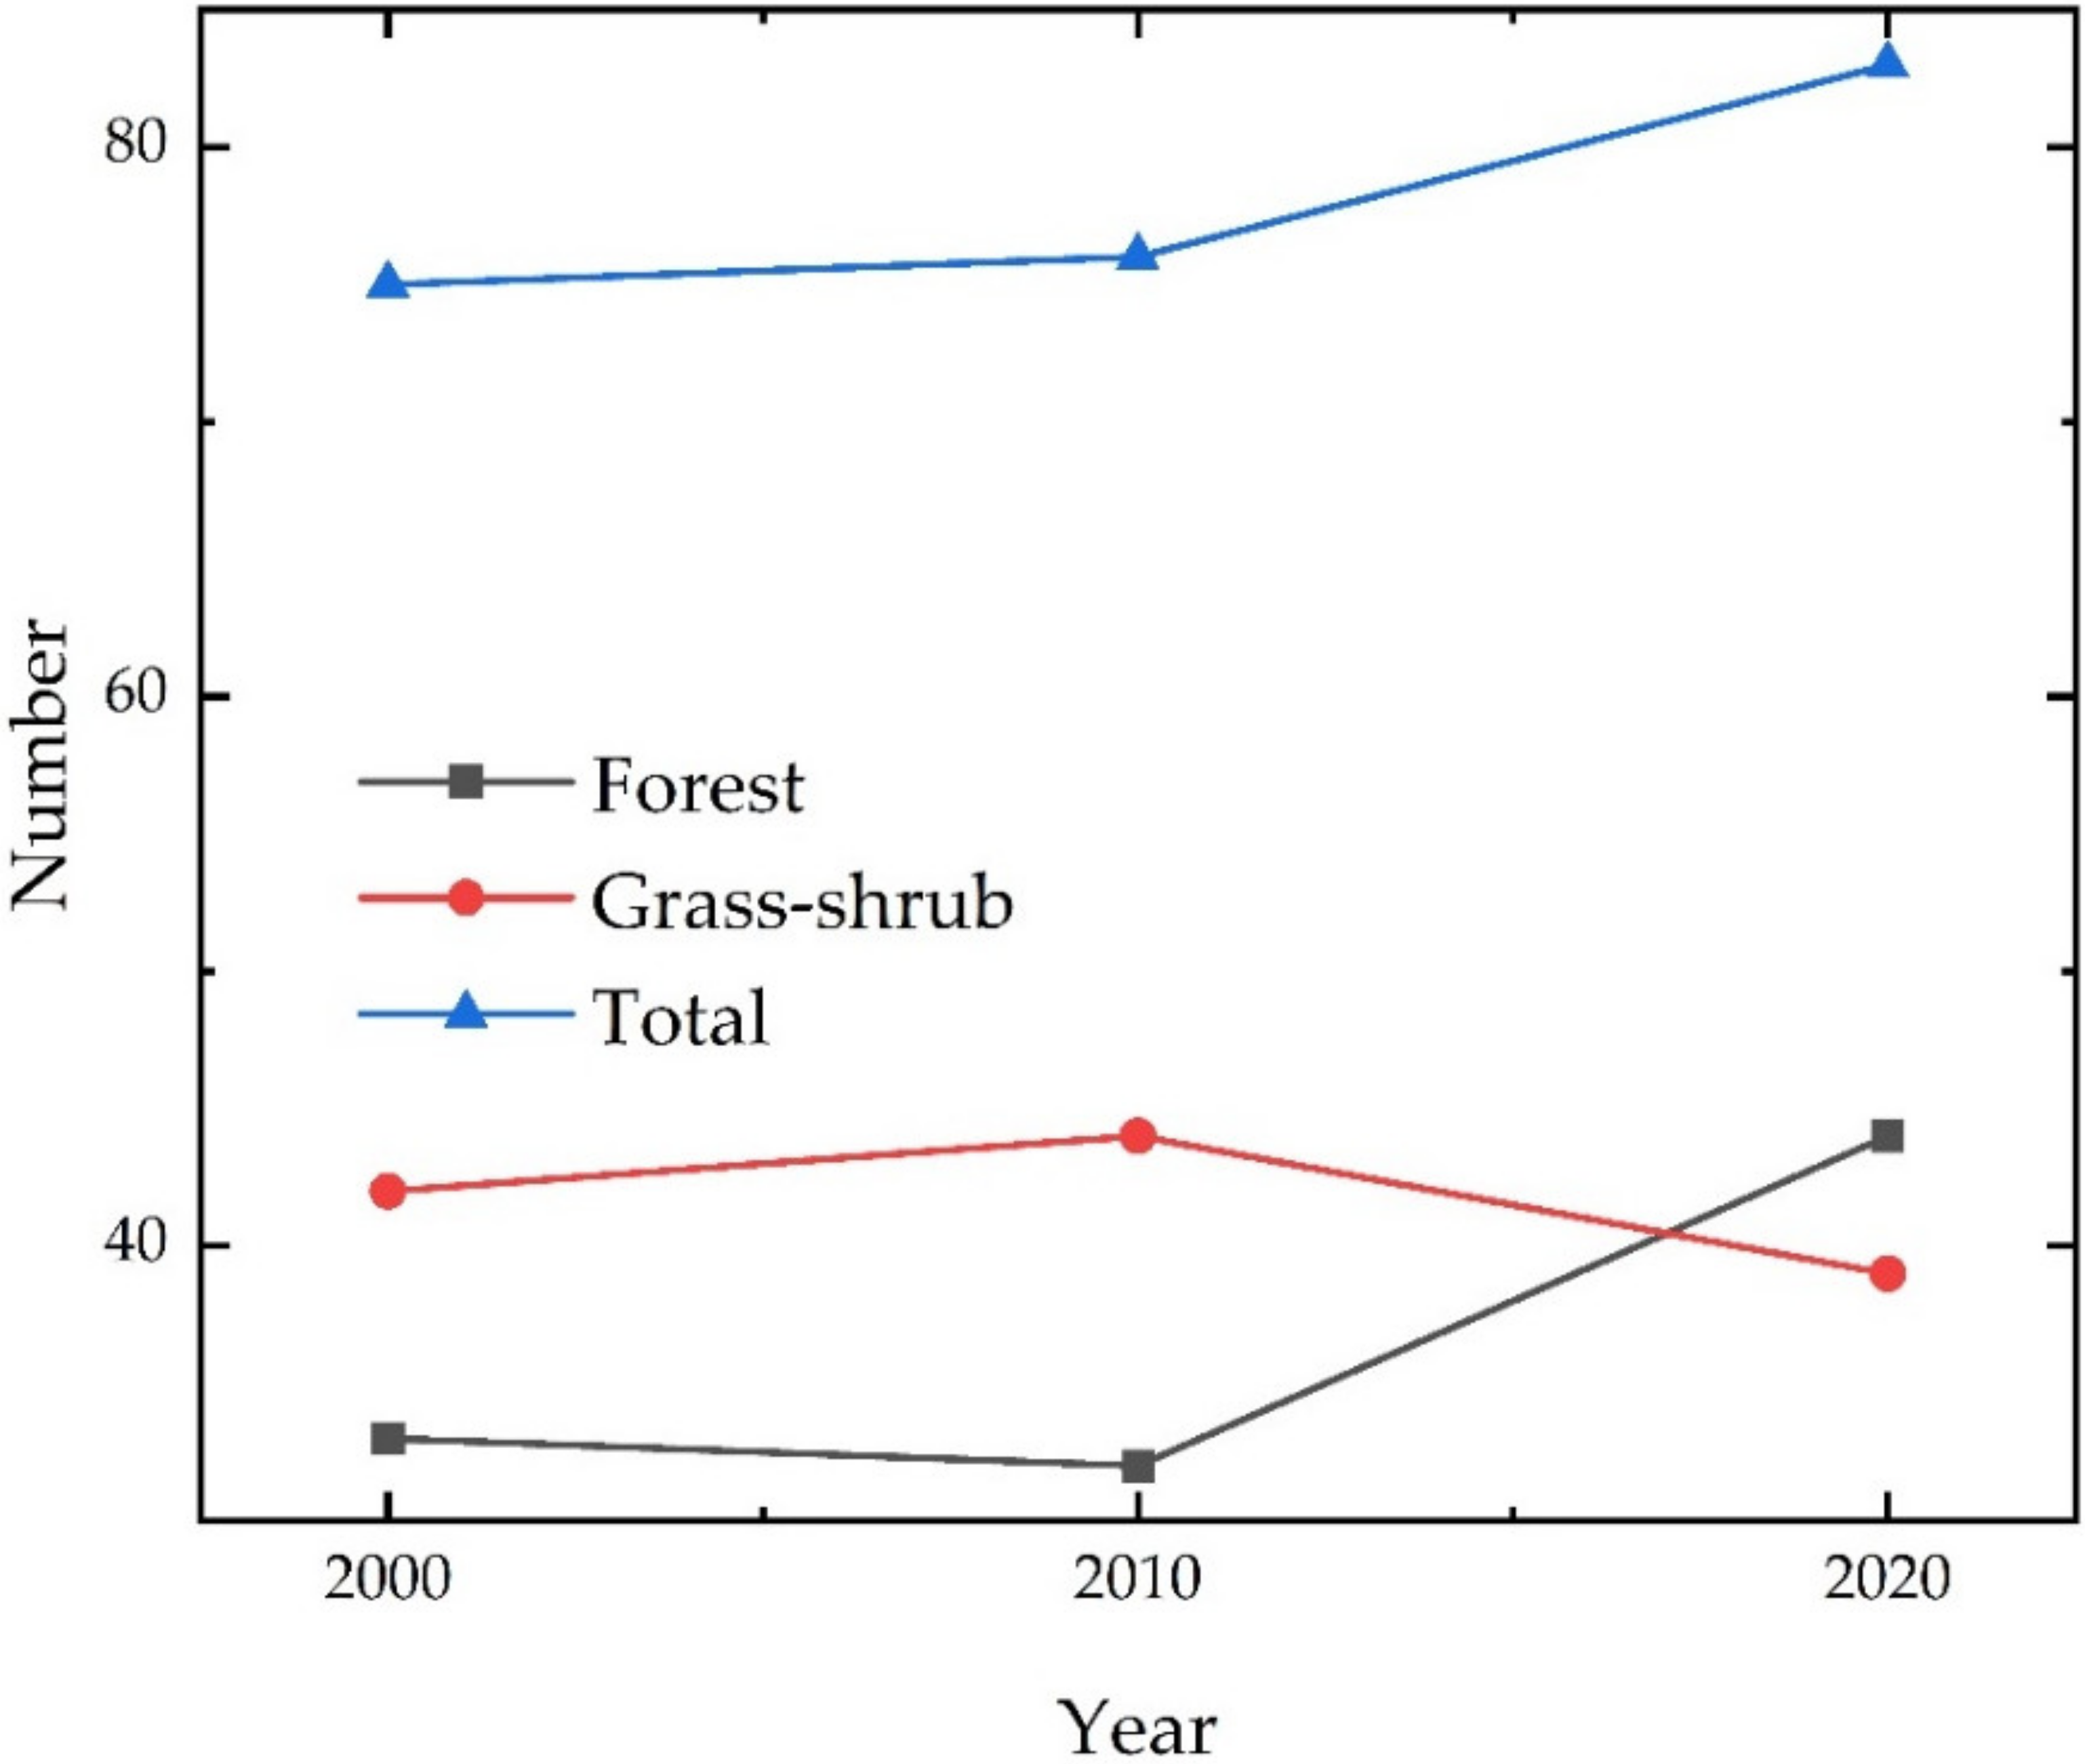
3.1.1. Ecological Source
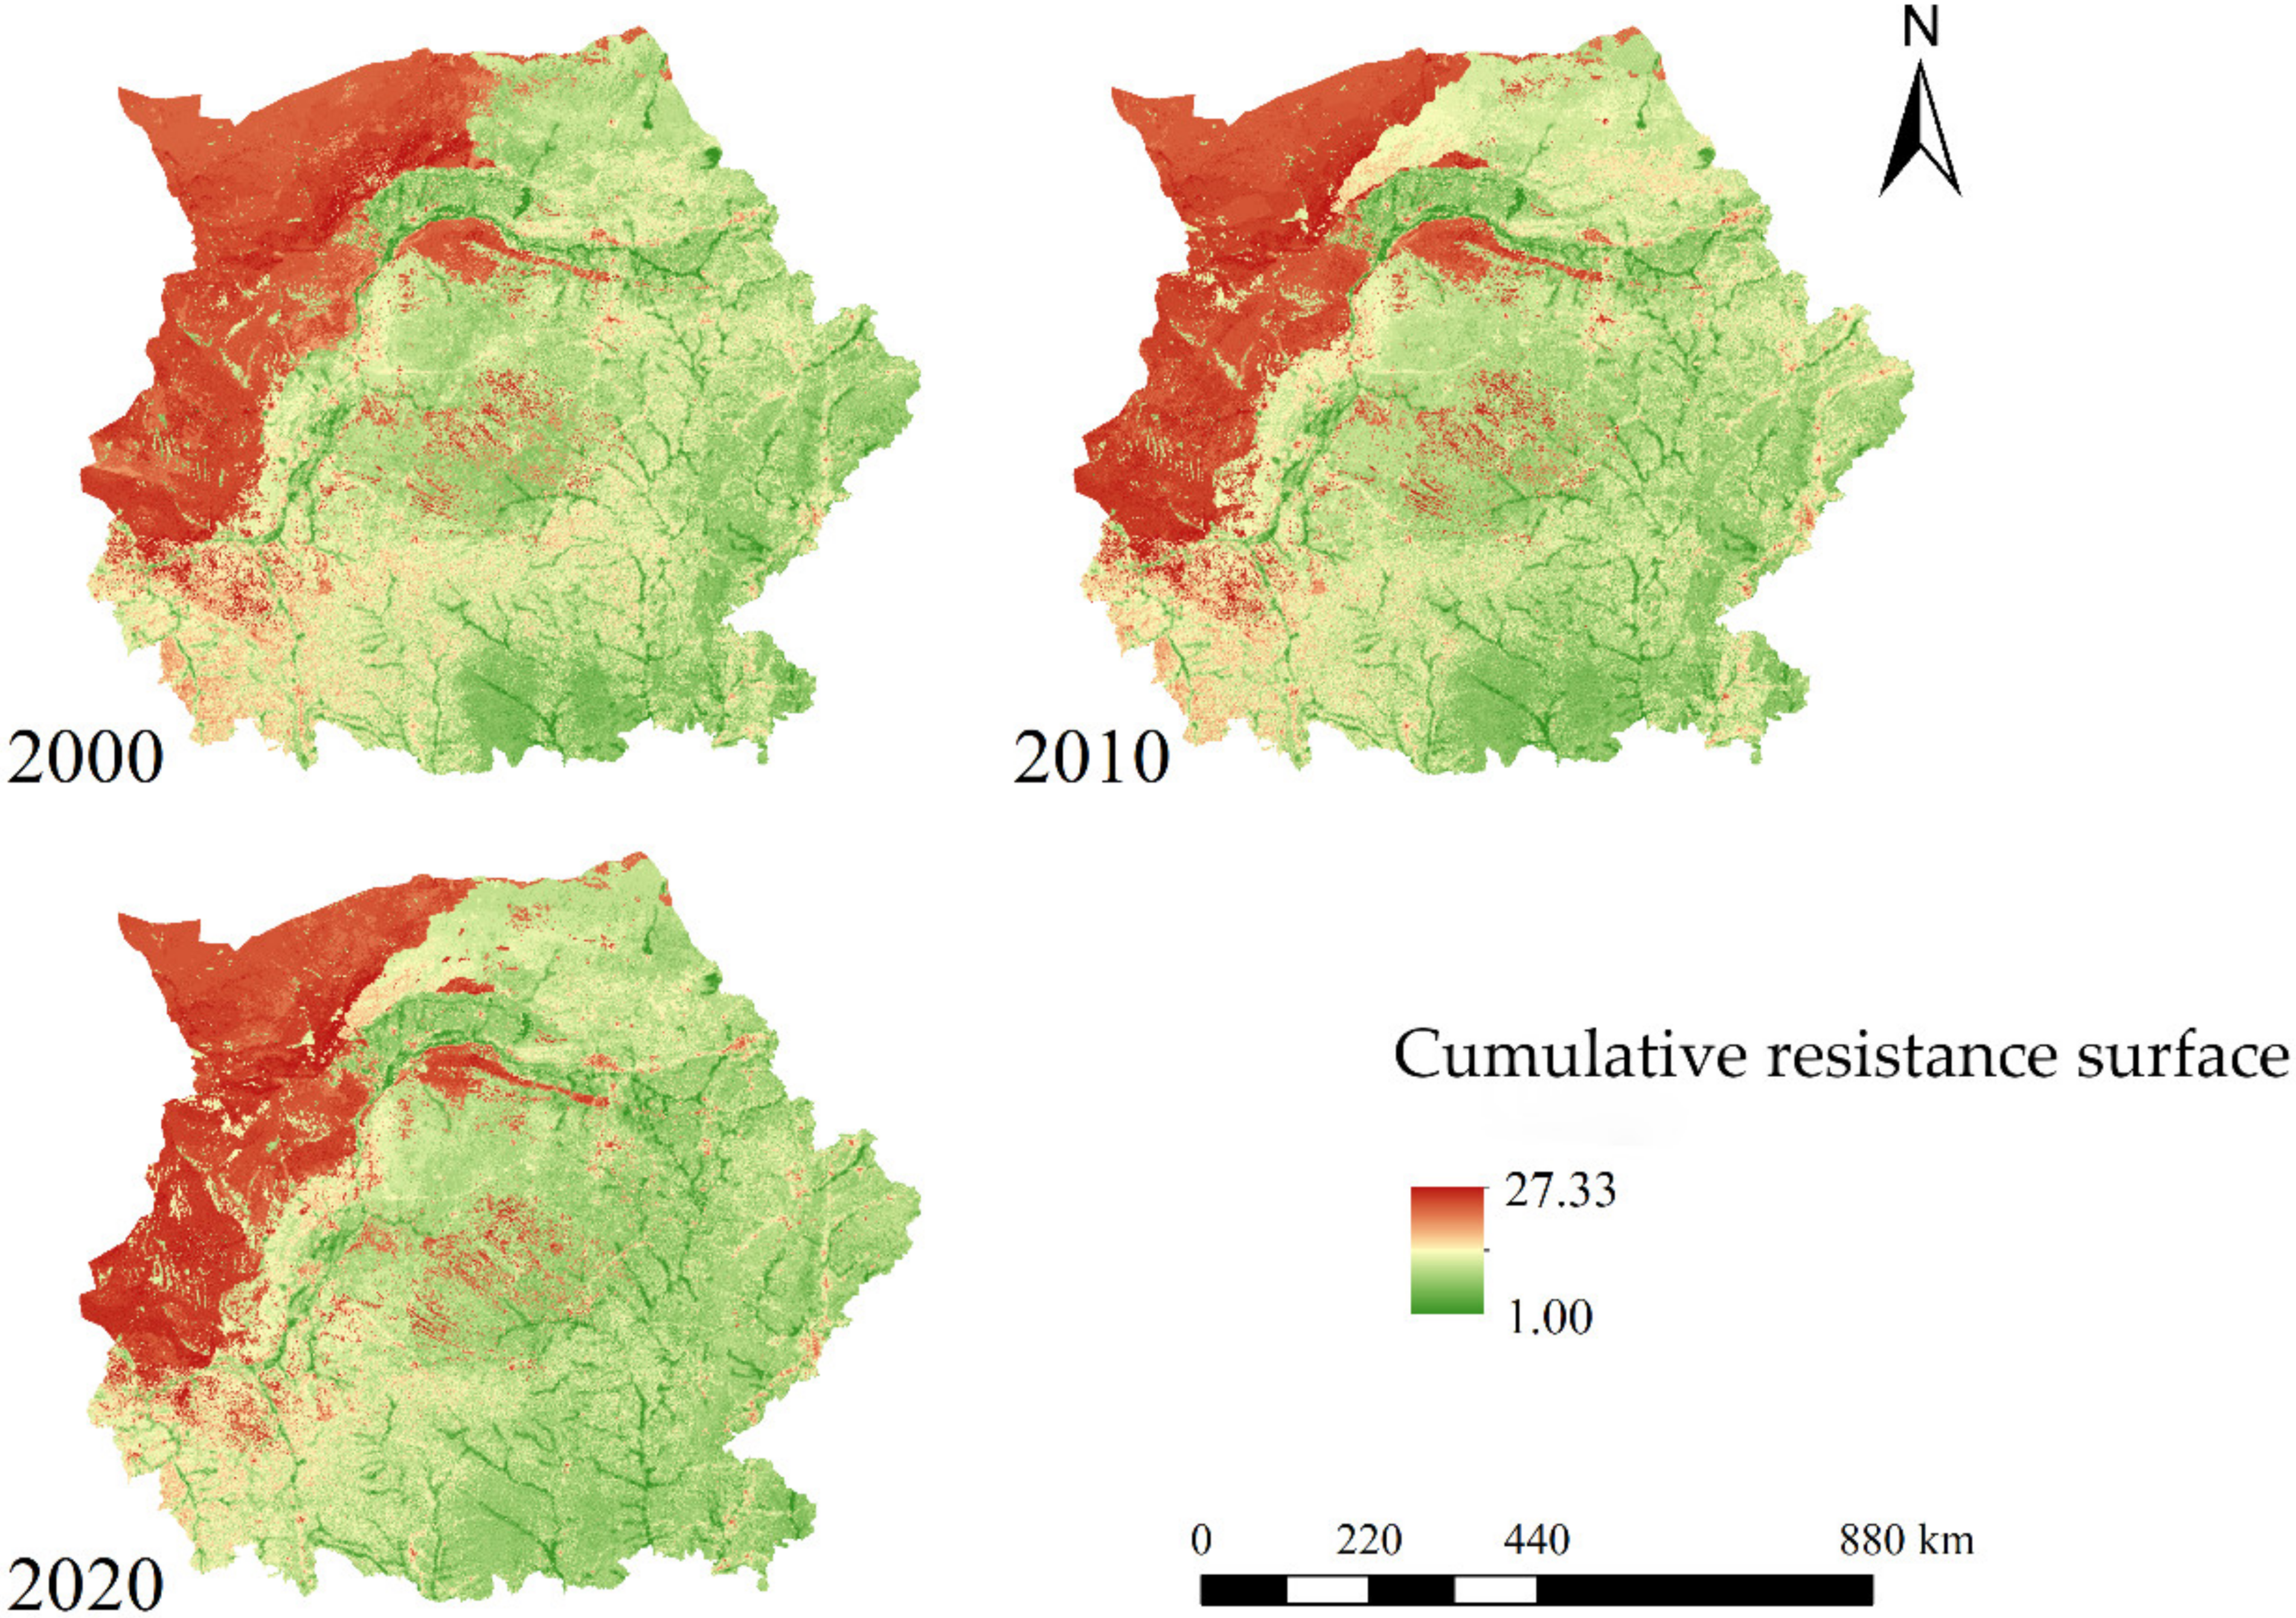
3.1.2. Analysis of Ecological Resistance
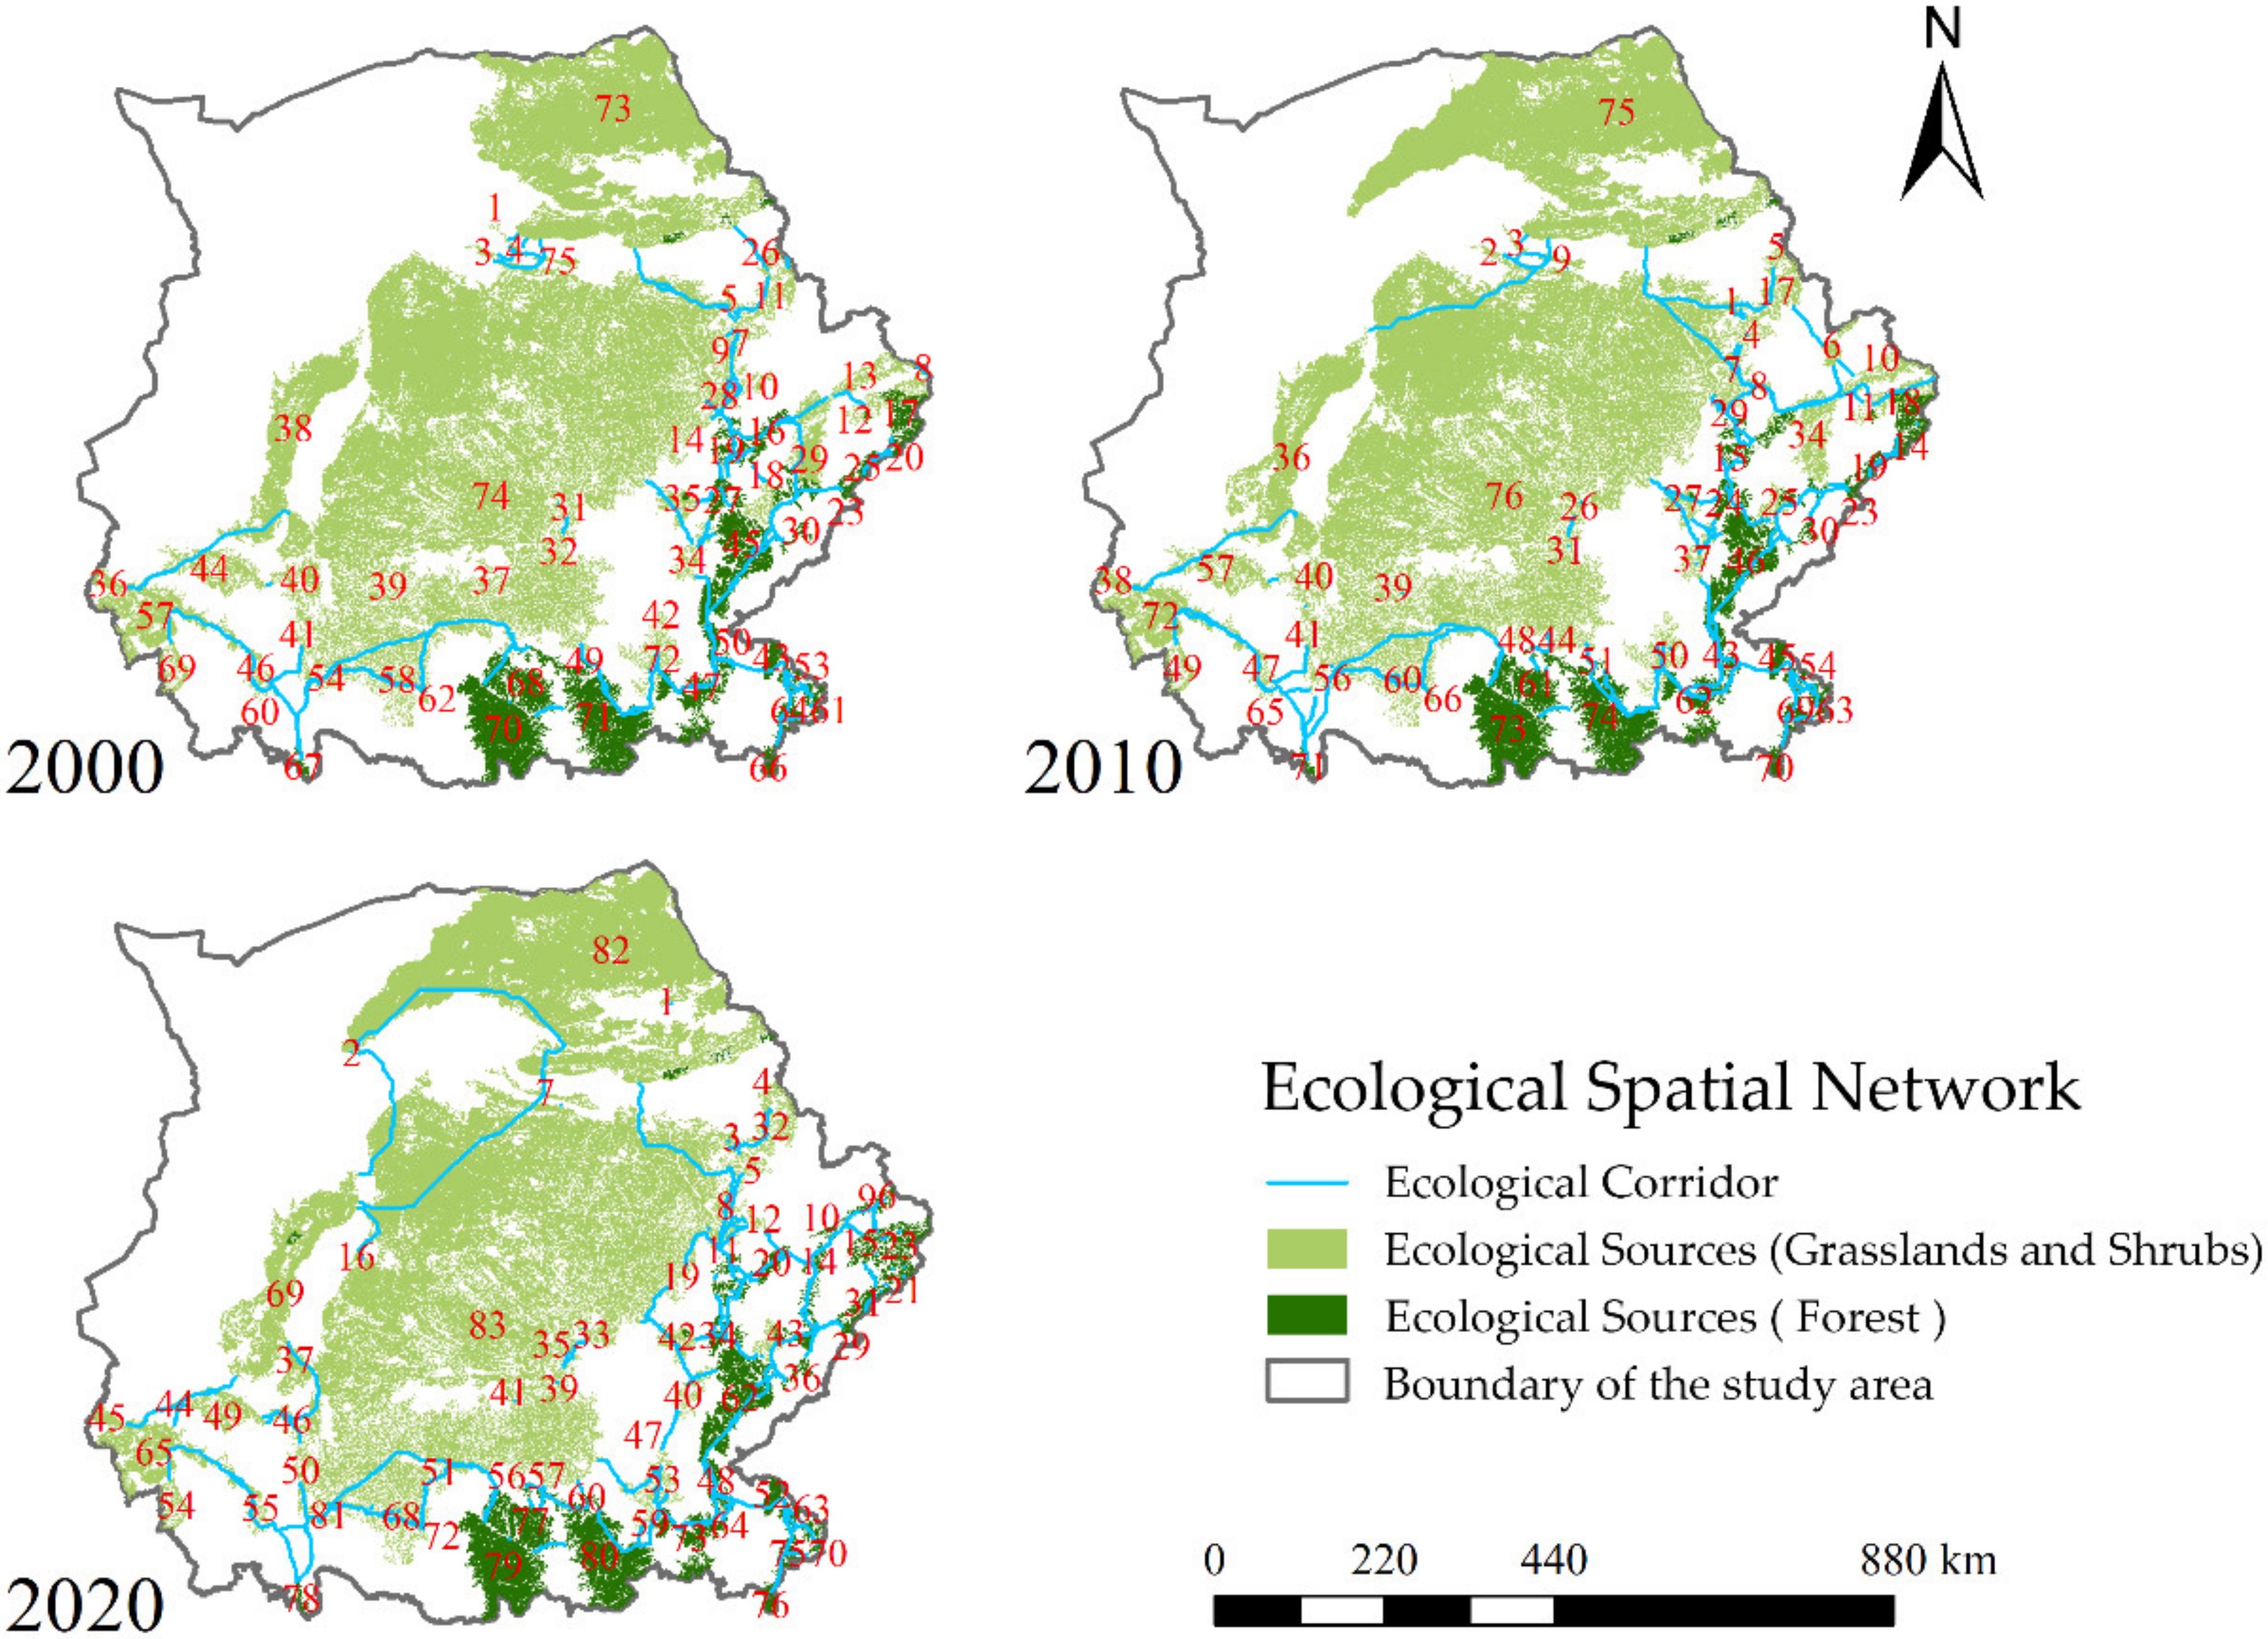
3.1.3. Analysis of Ecological Spatial Network
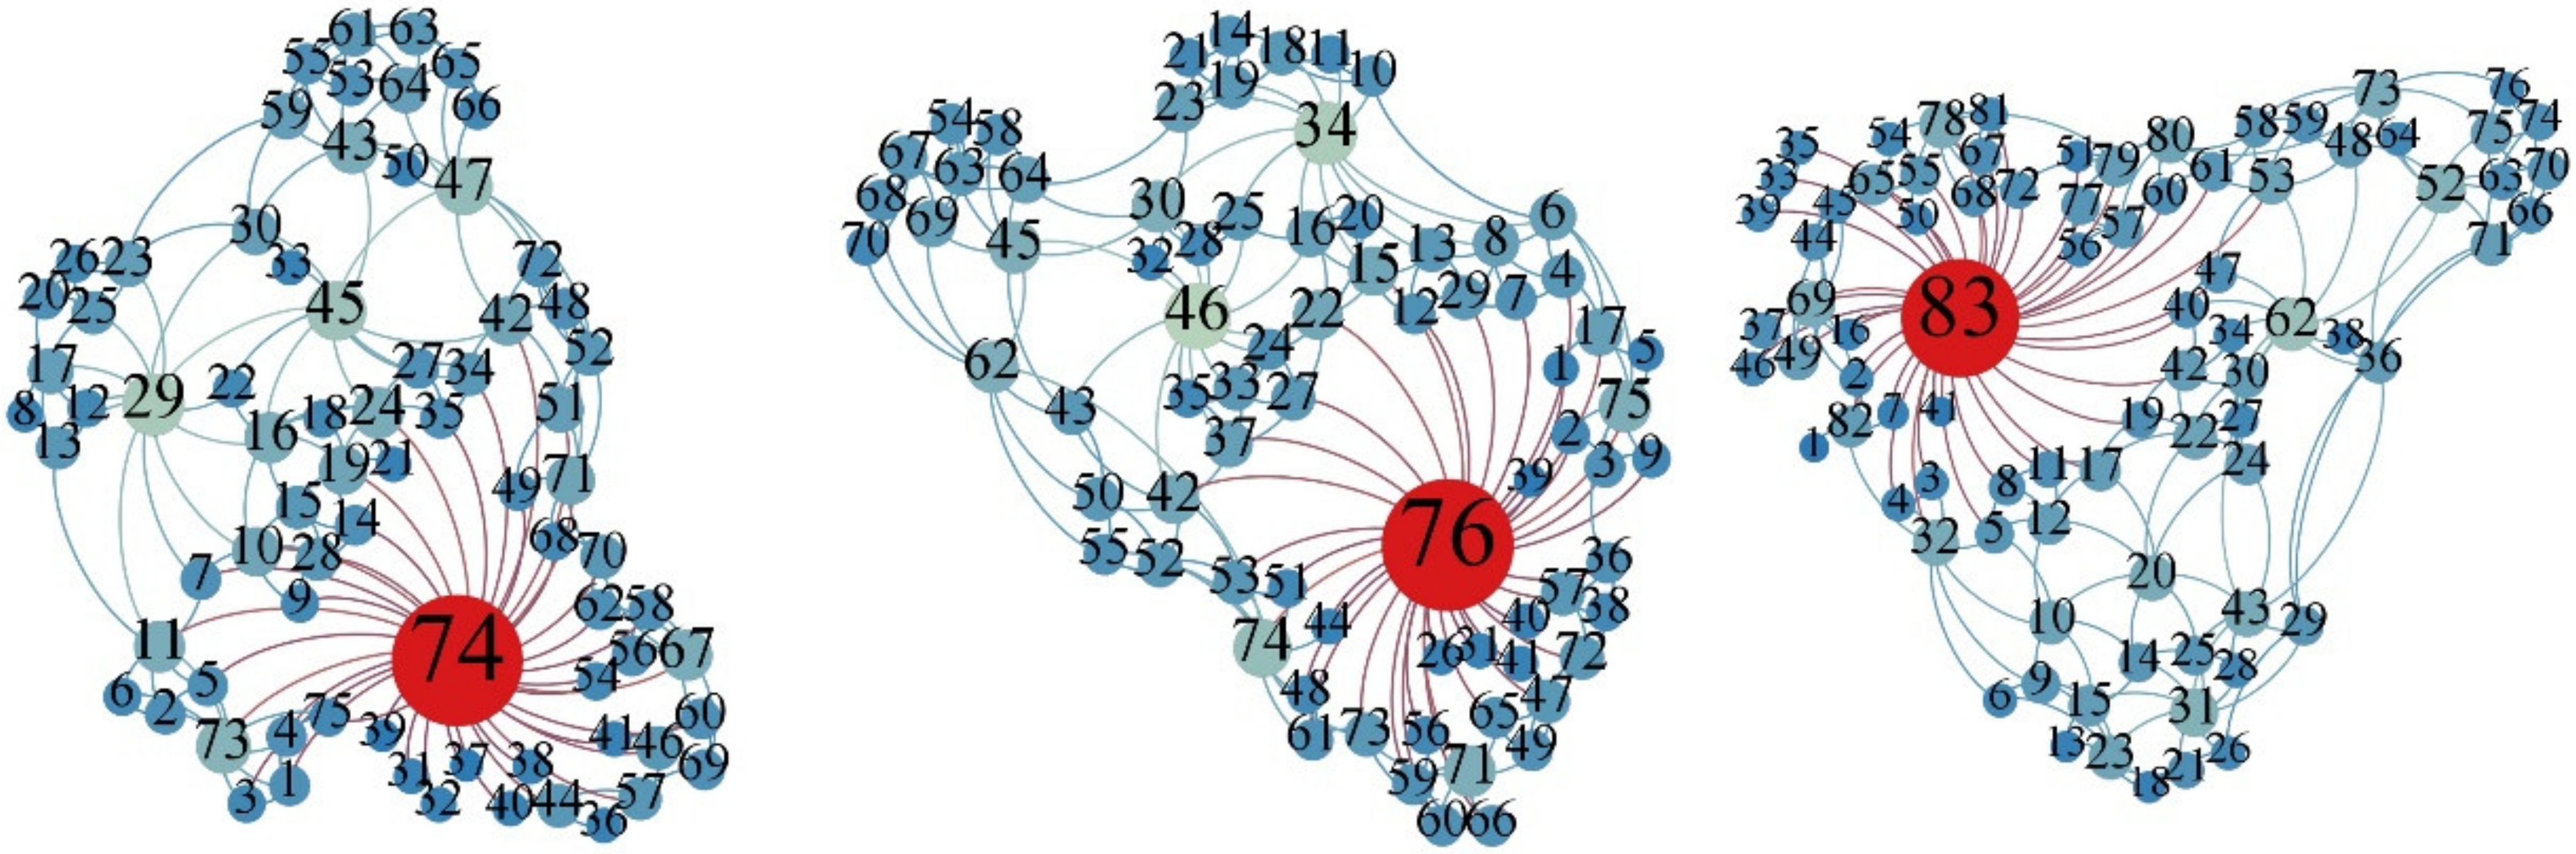
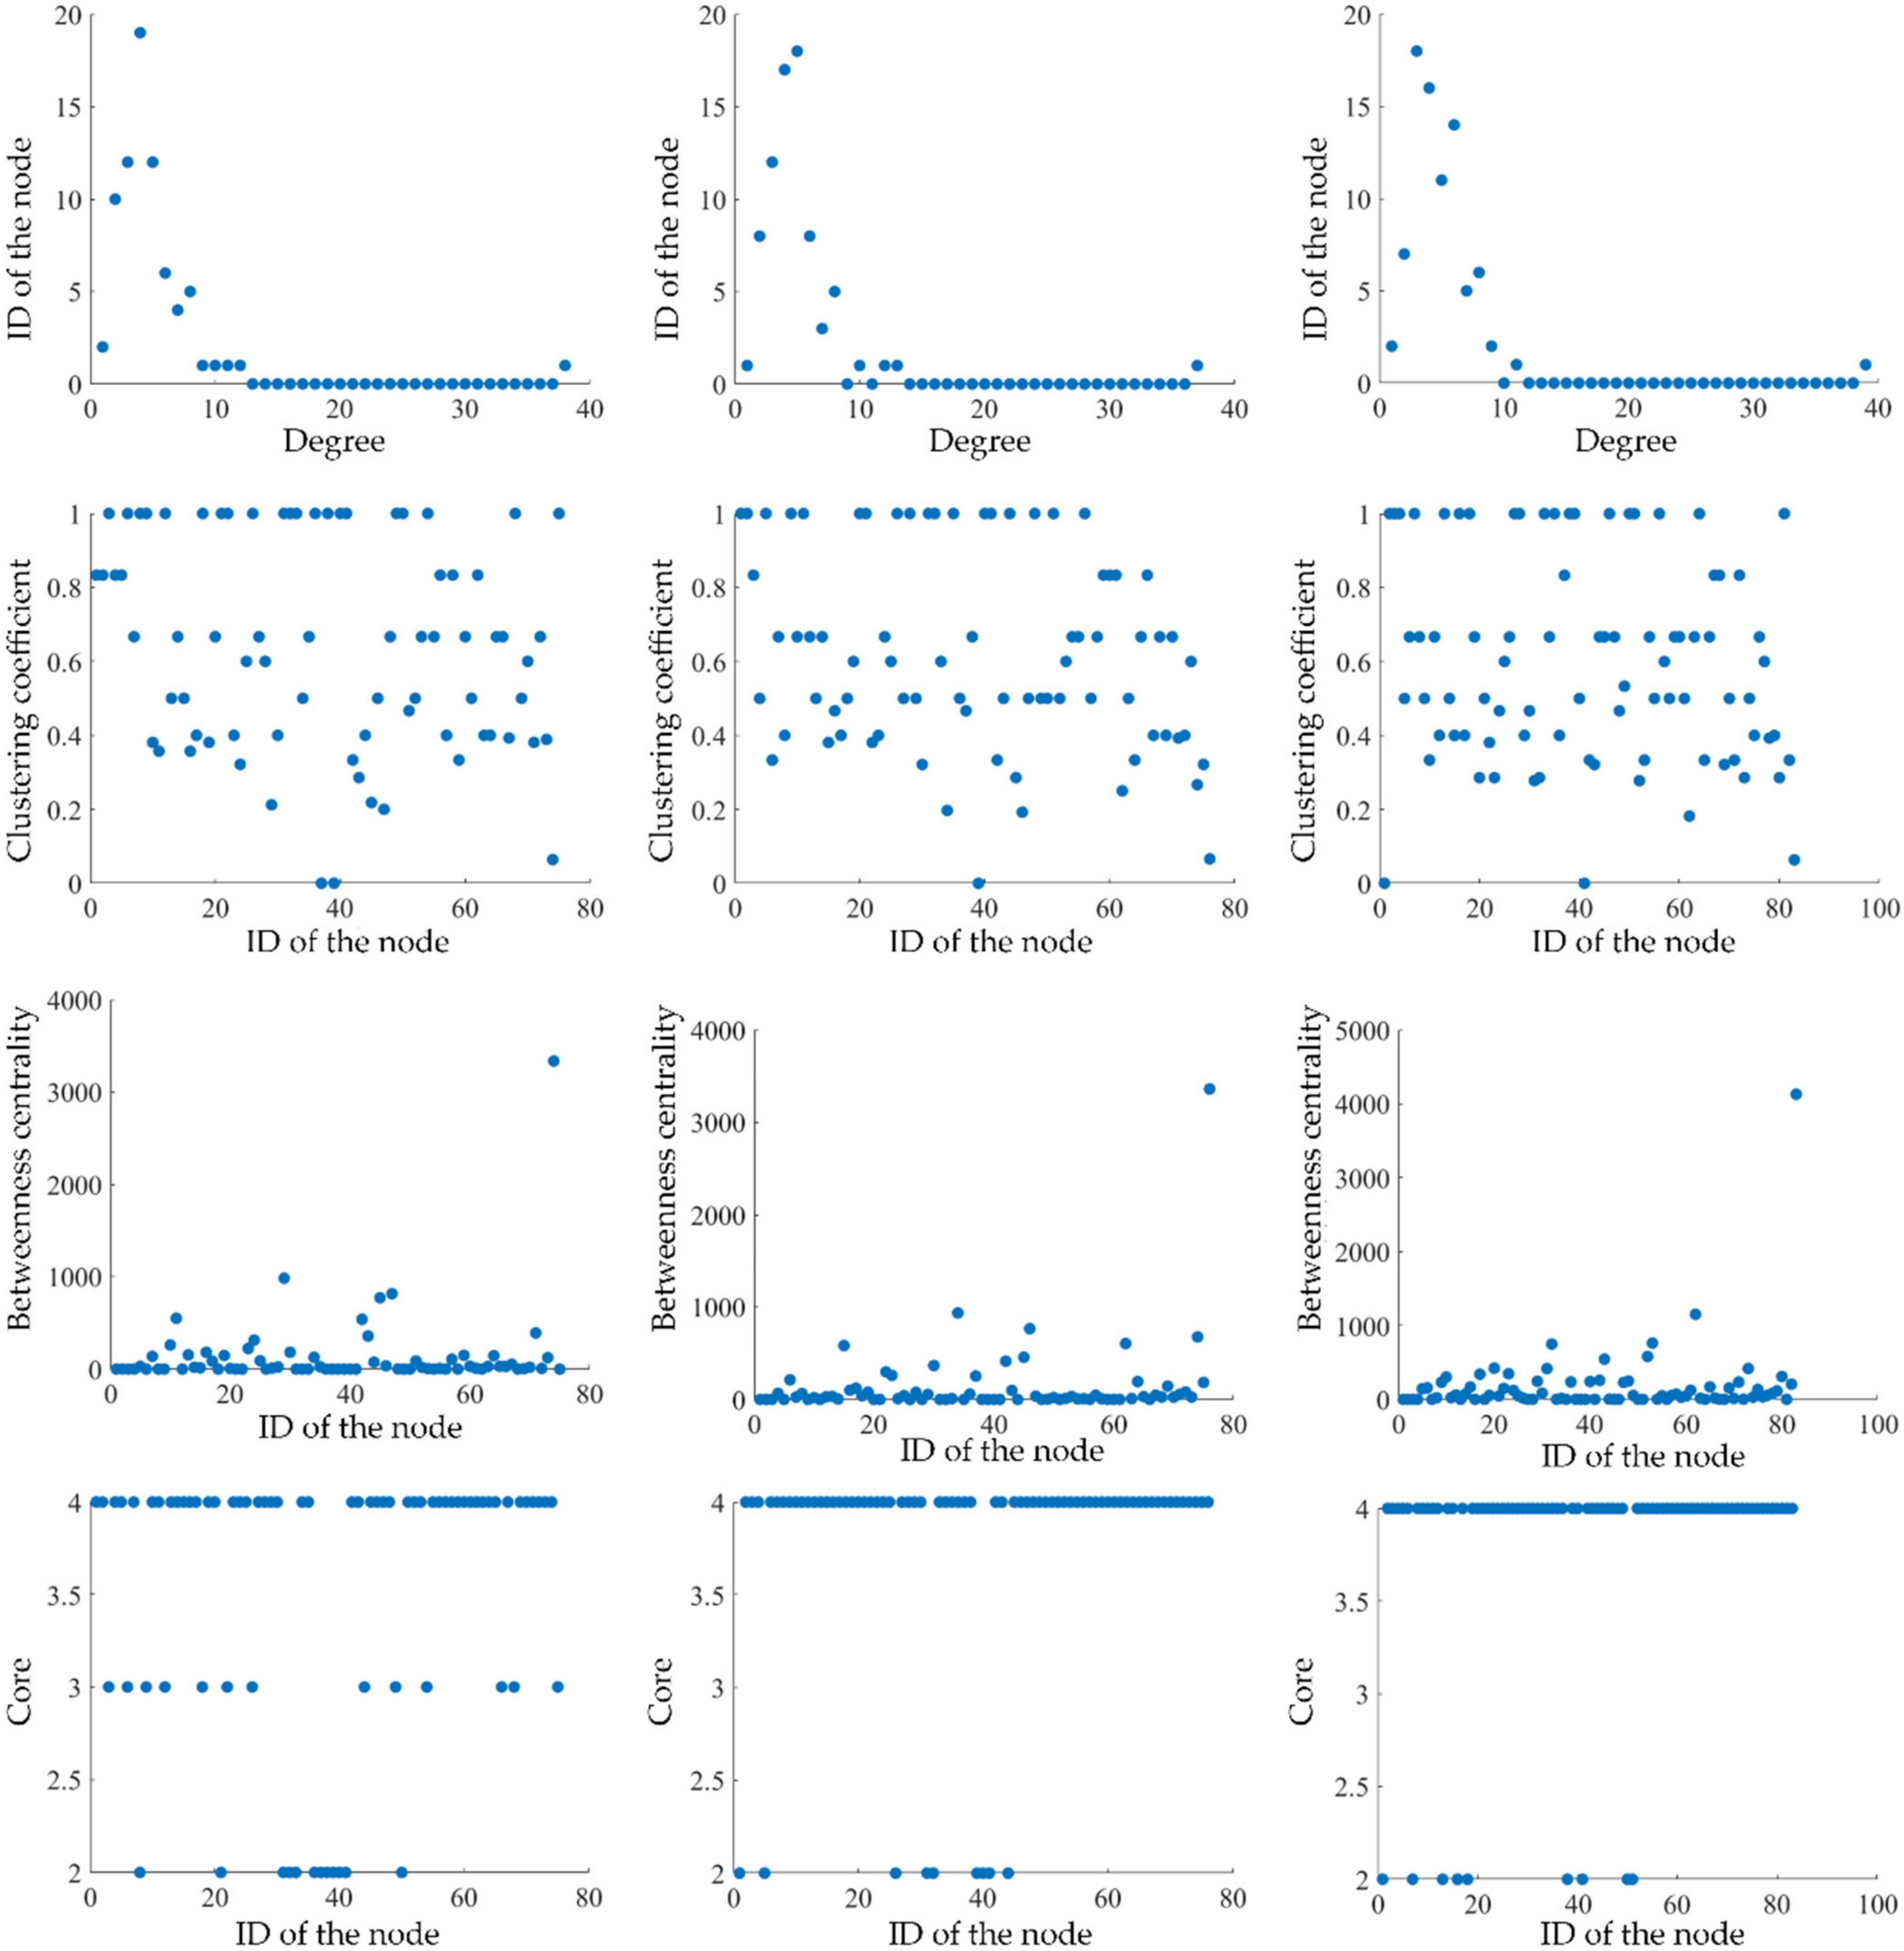
3.2. The Spatial Topological Characteristics of the Ecological Spatial Network
3.3. Topological Characteristics of the Ecological Spatial Network
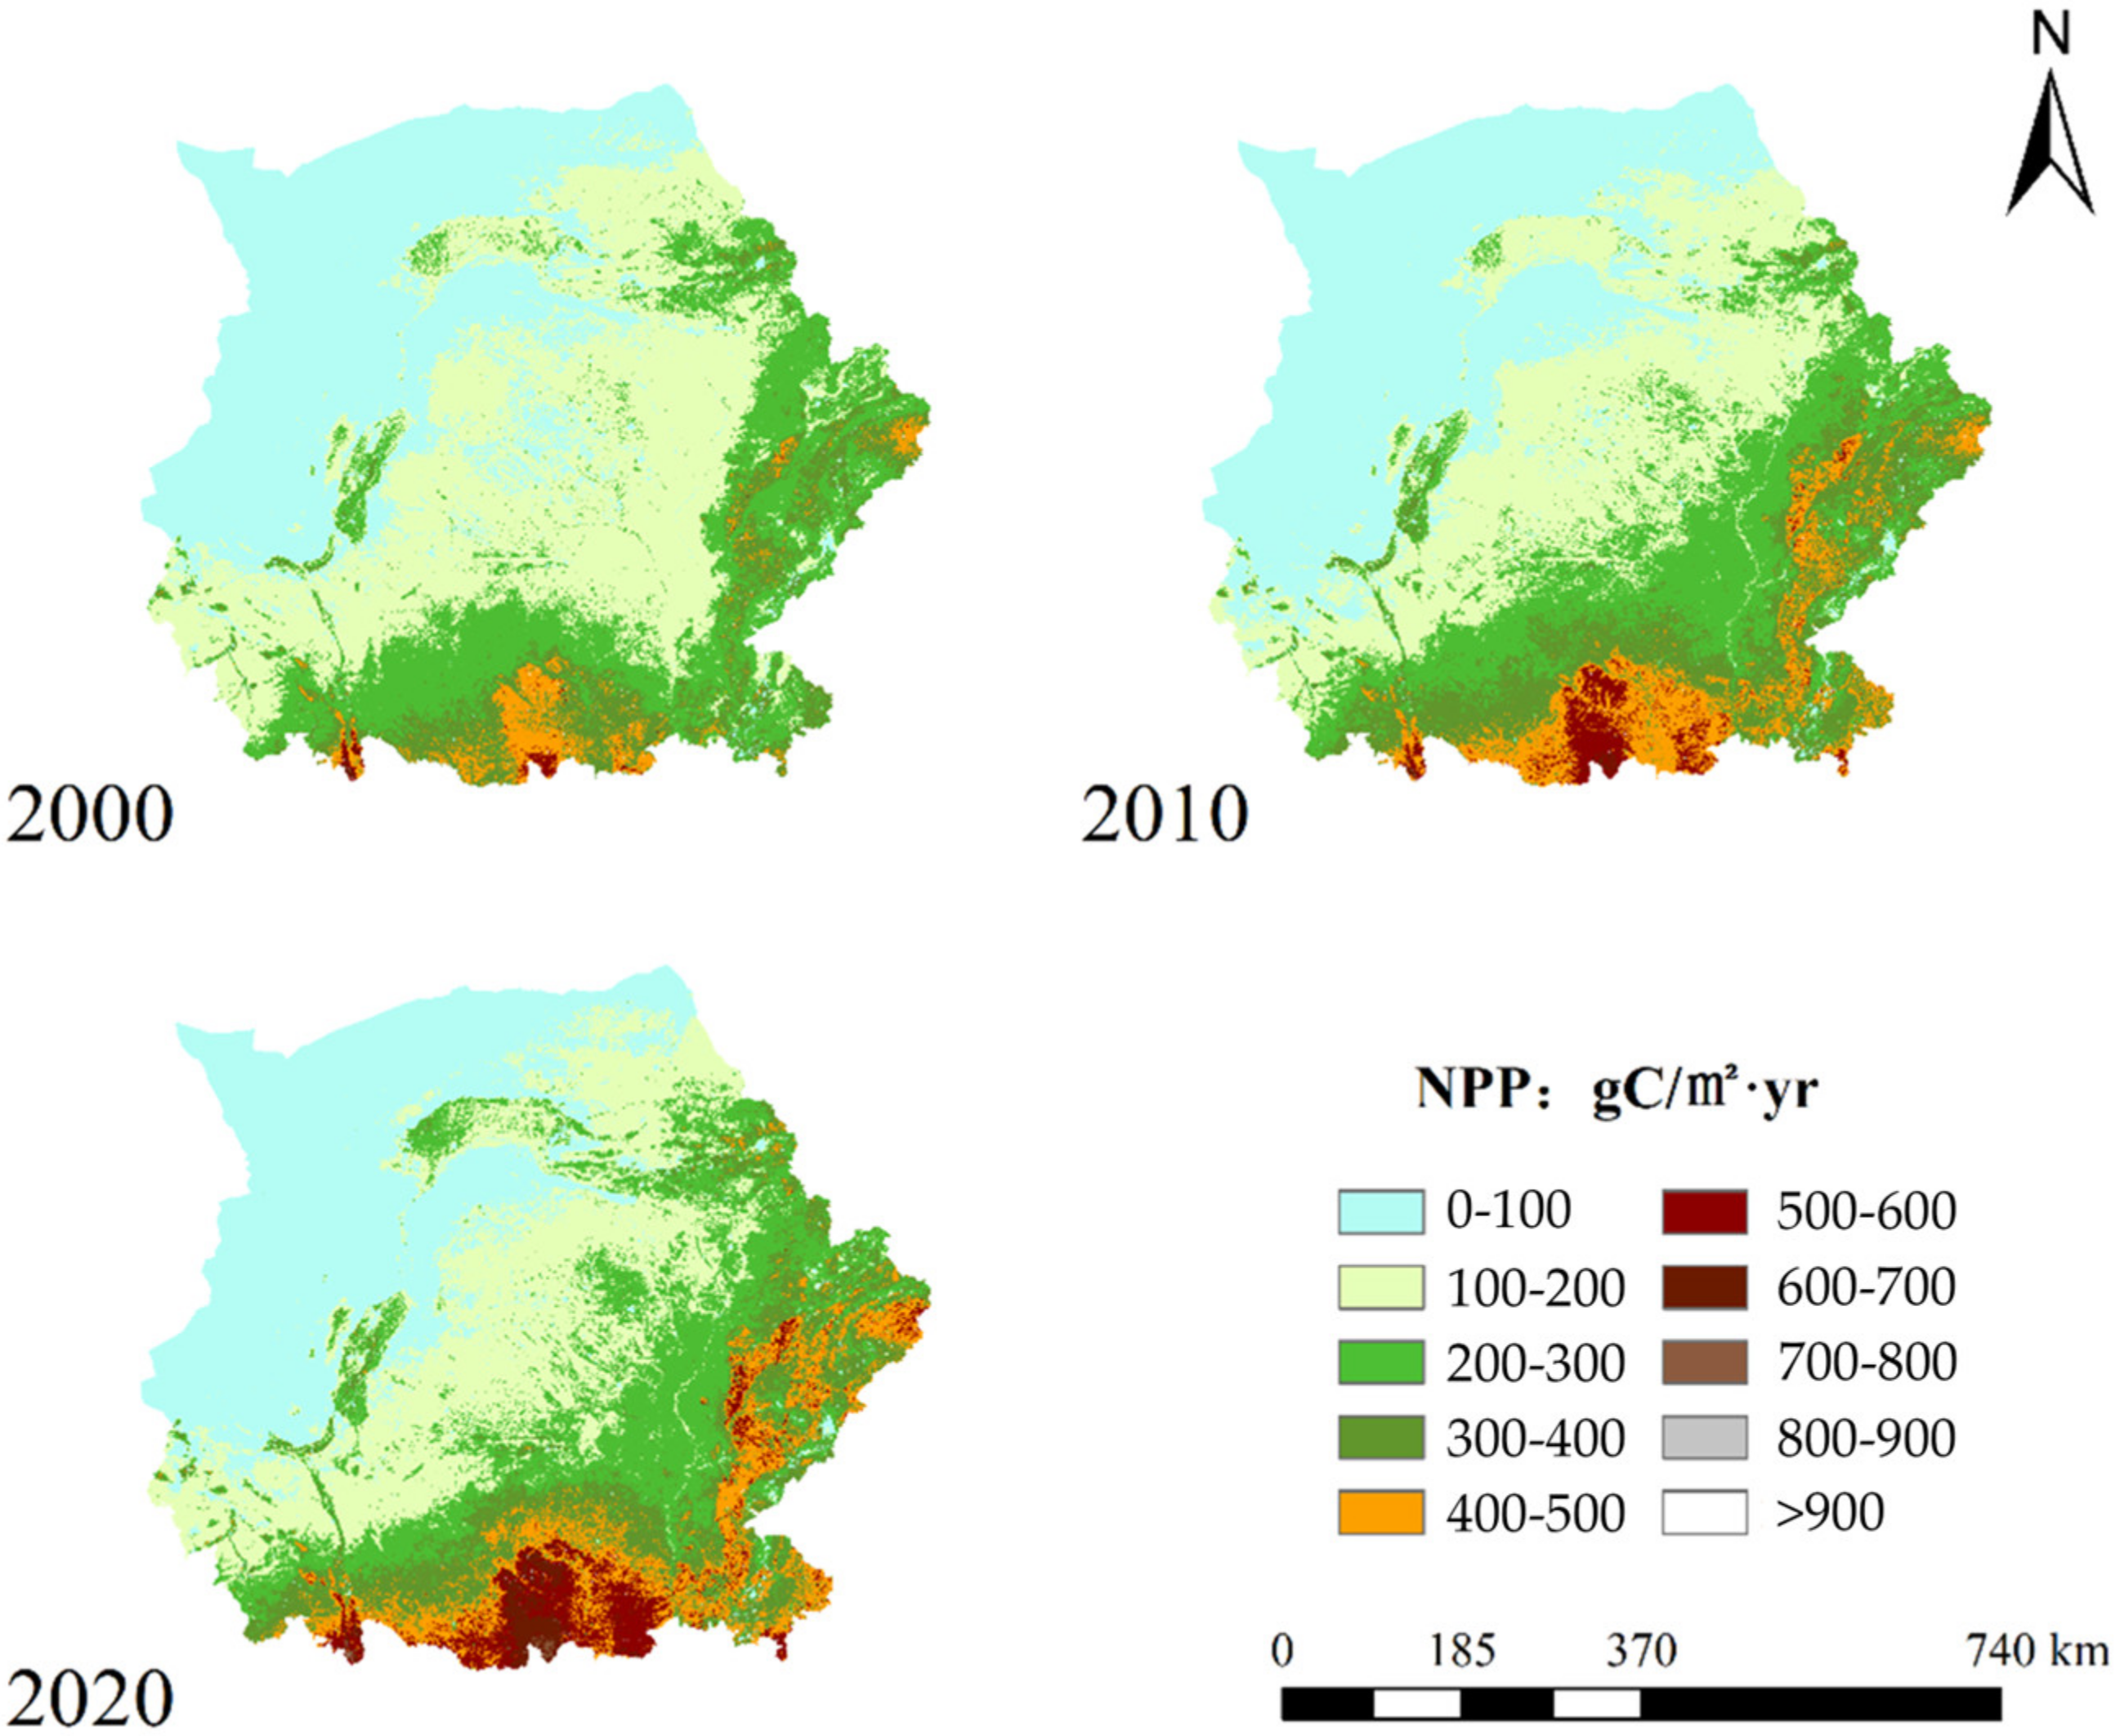
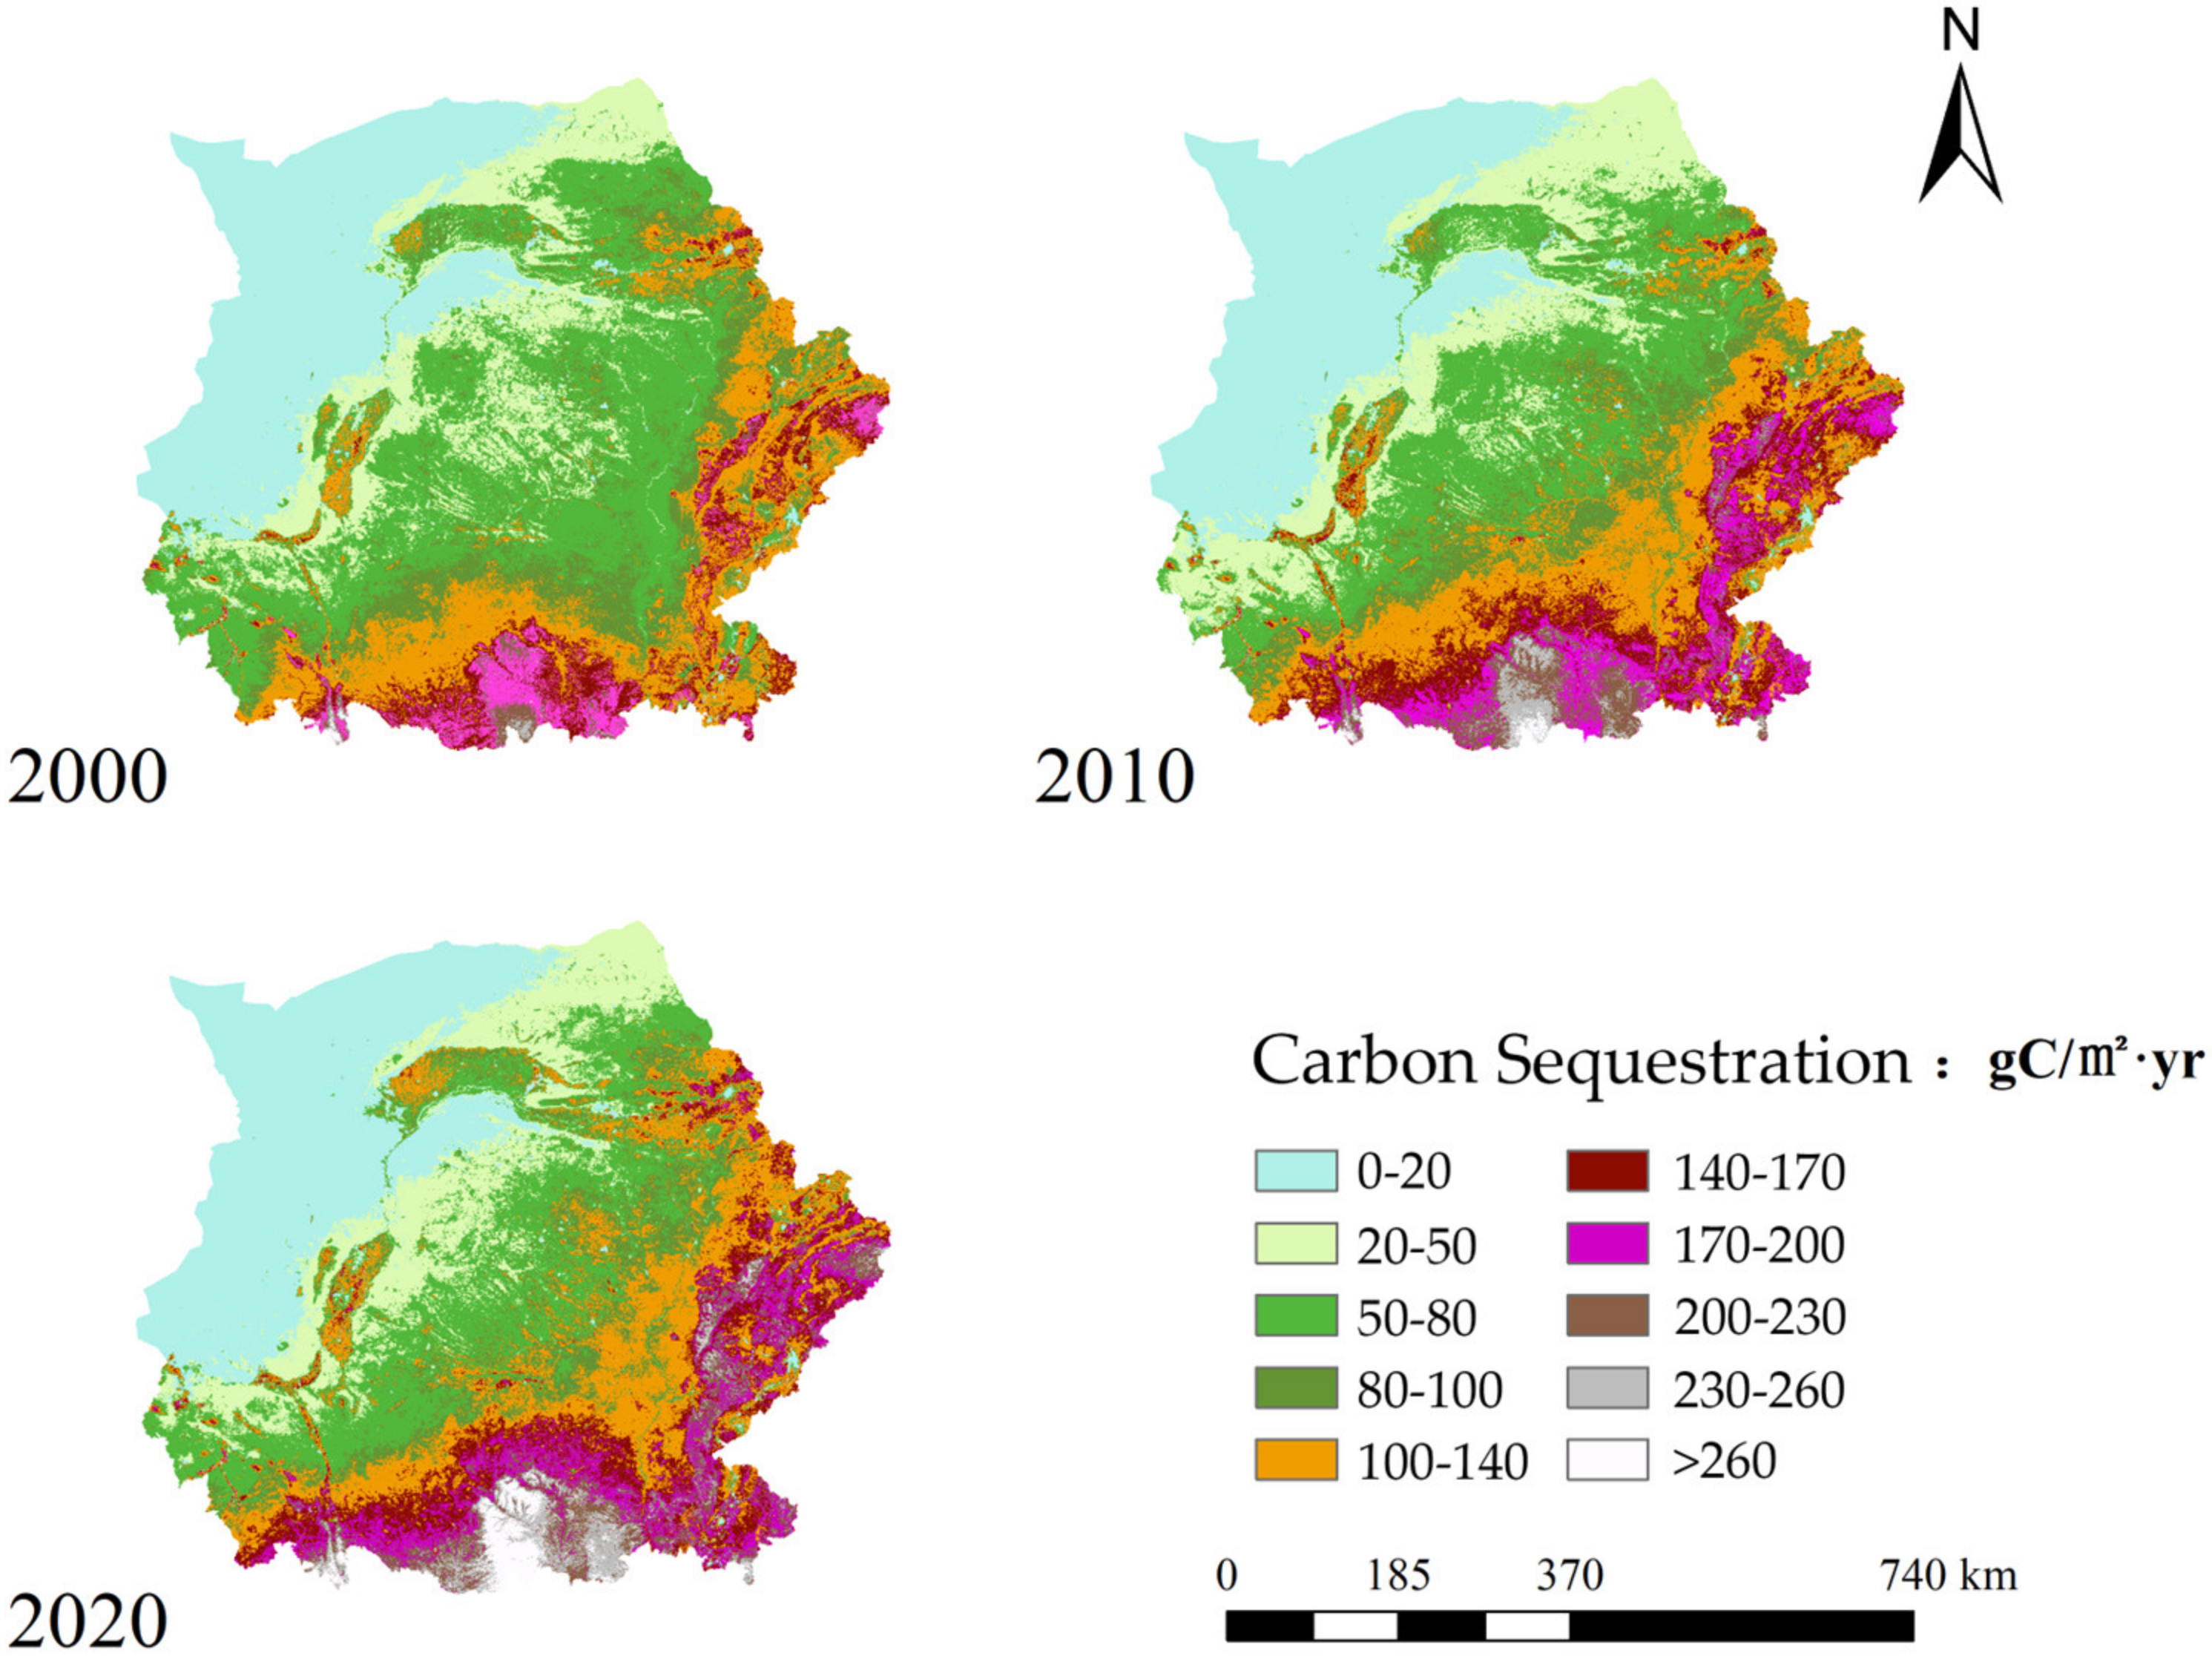
3.4. Carbon Sink Analysis of Ecosystem
3.5. Analysis and Optimization of the TFCO Model
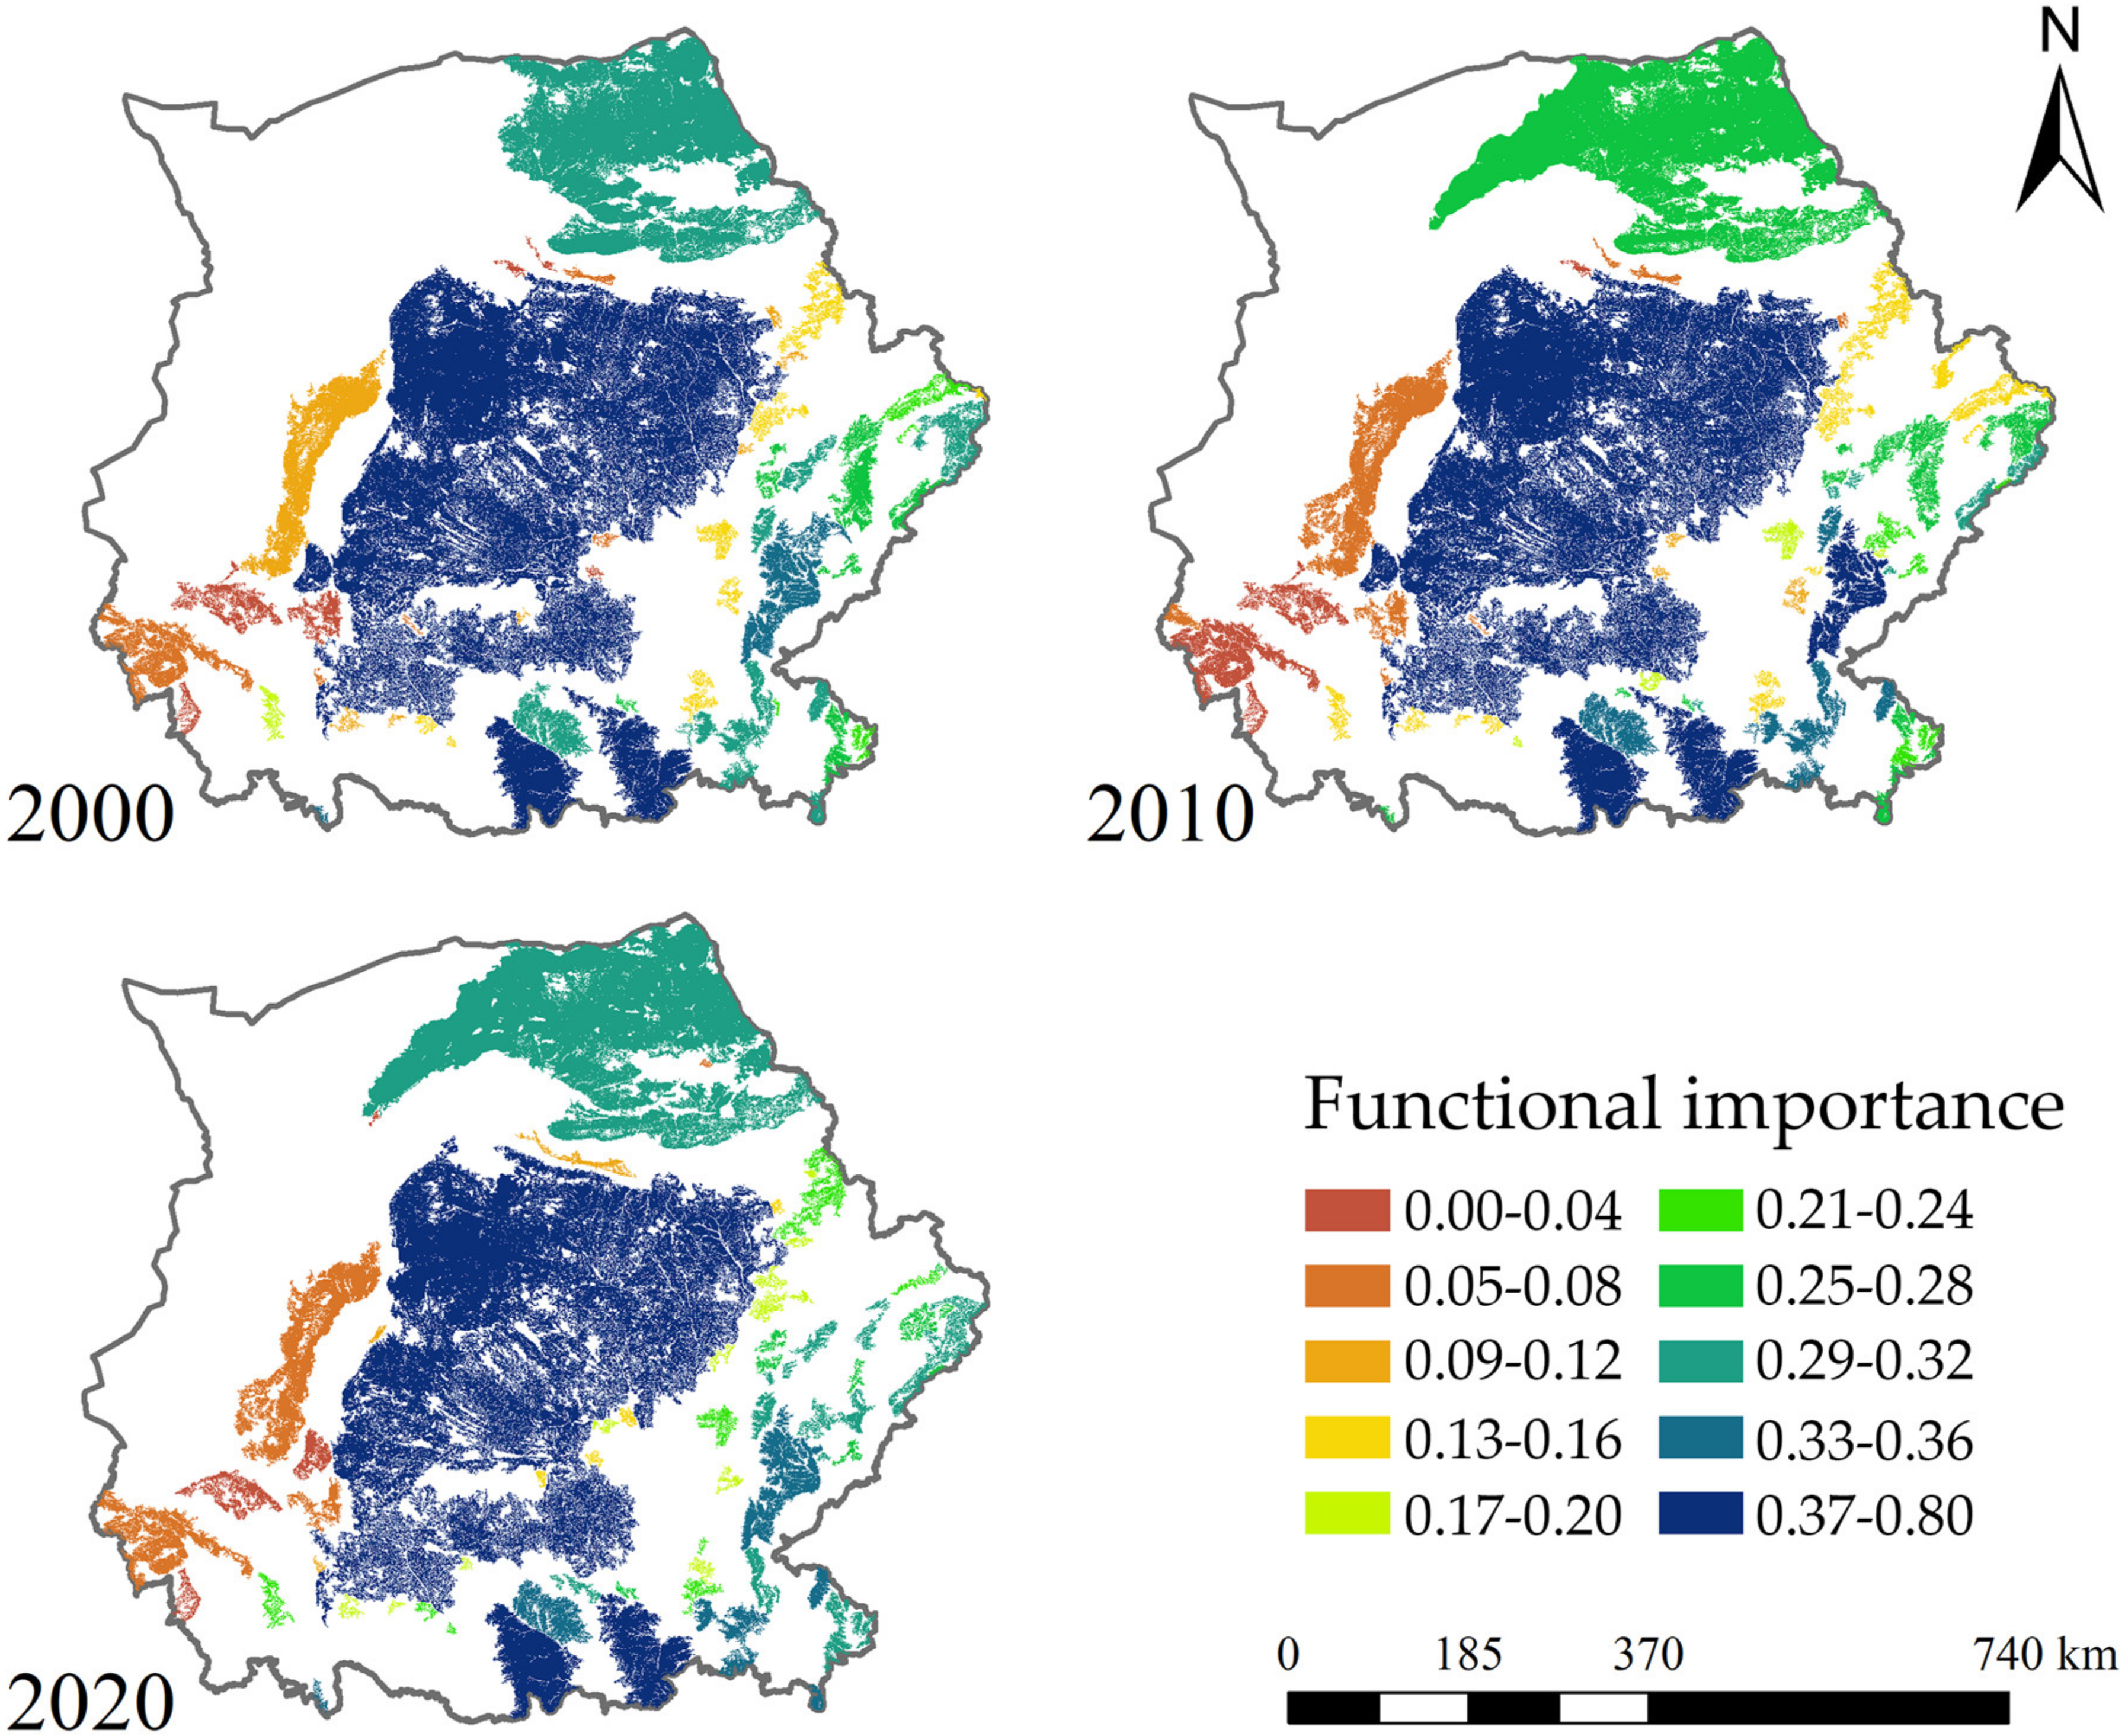
3.5.1. Functional Importance of Ecological Sources
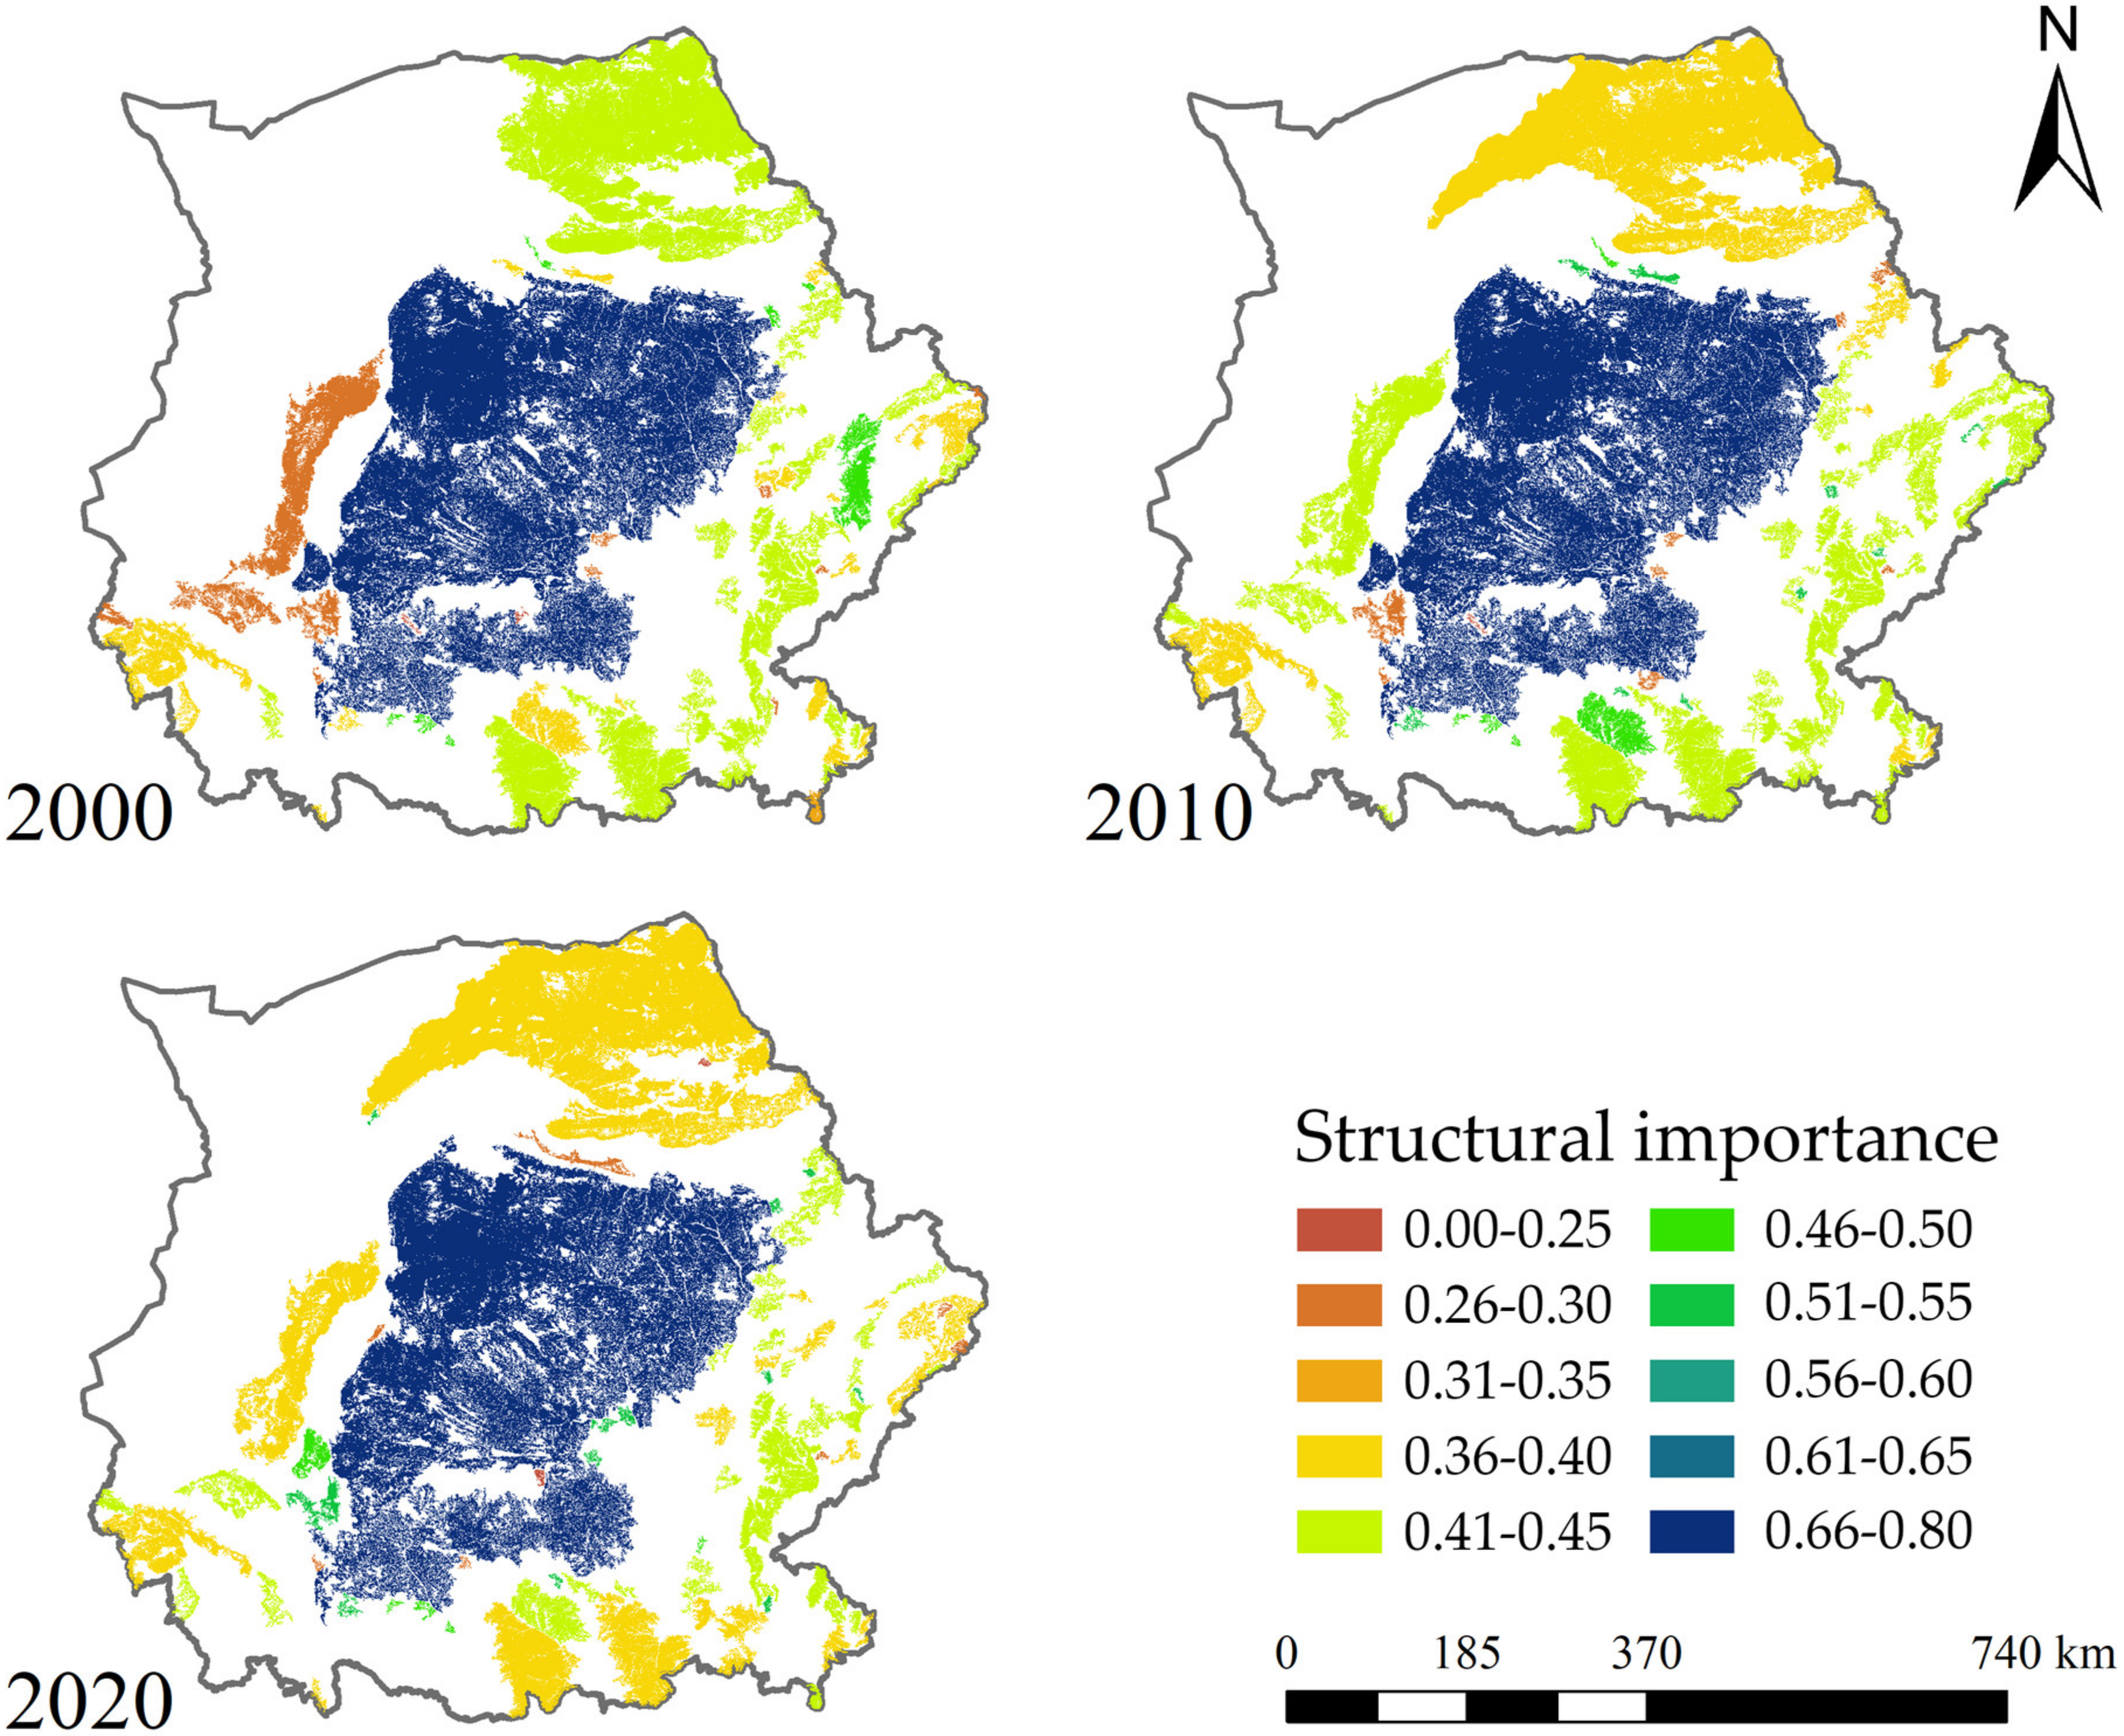
3.5.2. Topological Importance of Ecological Sources
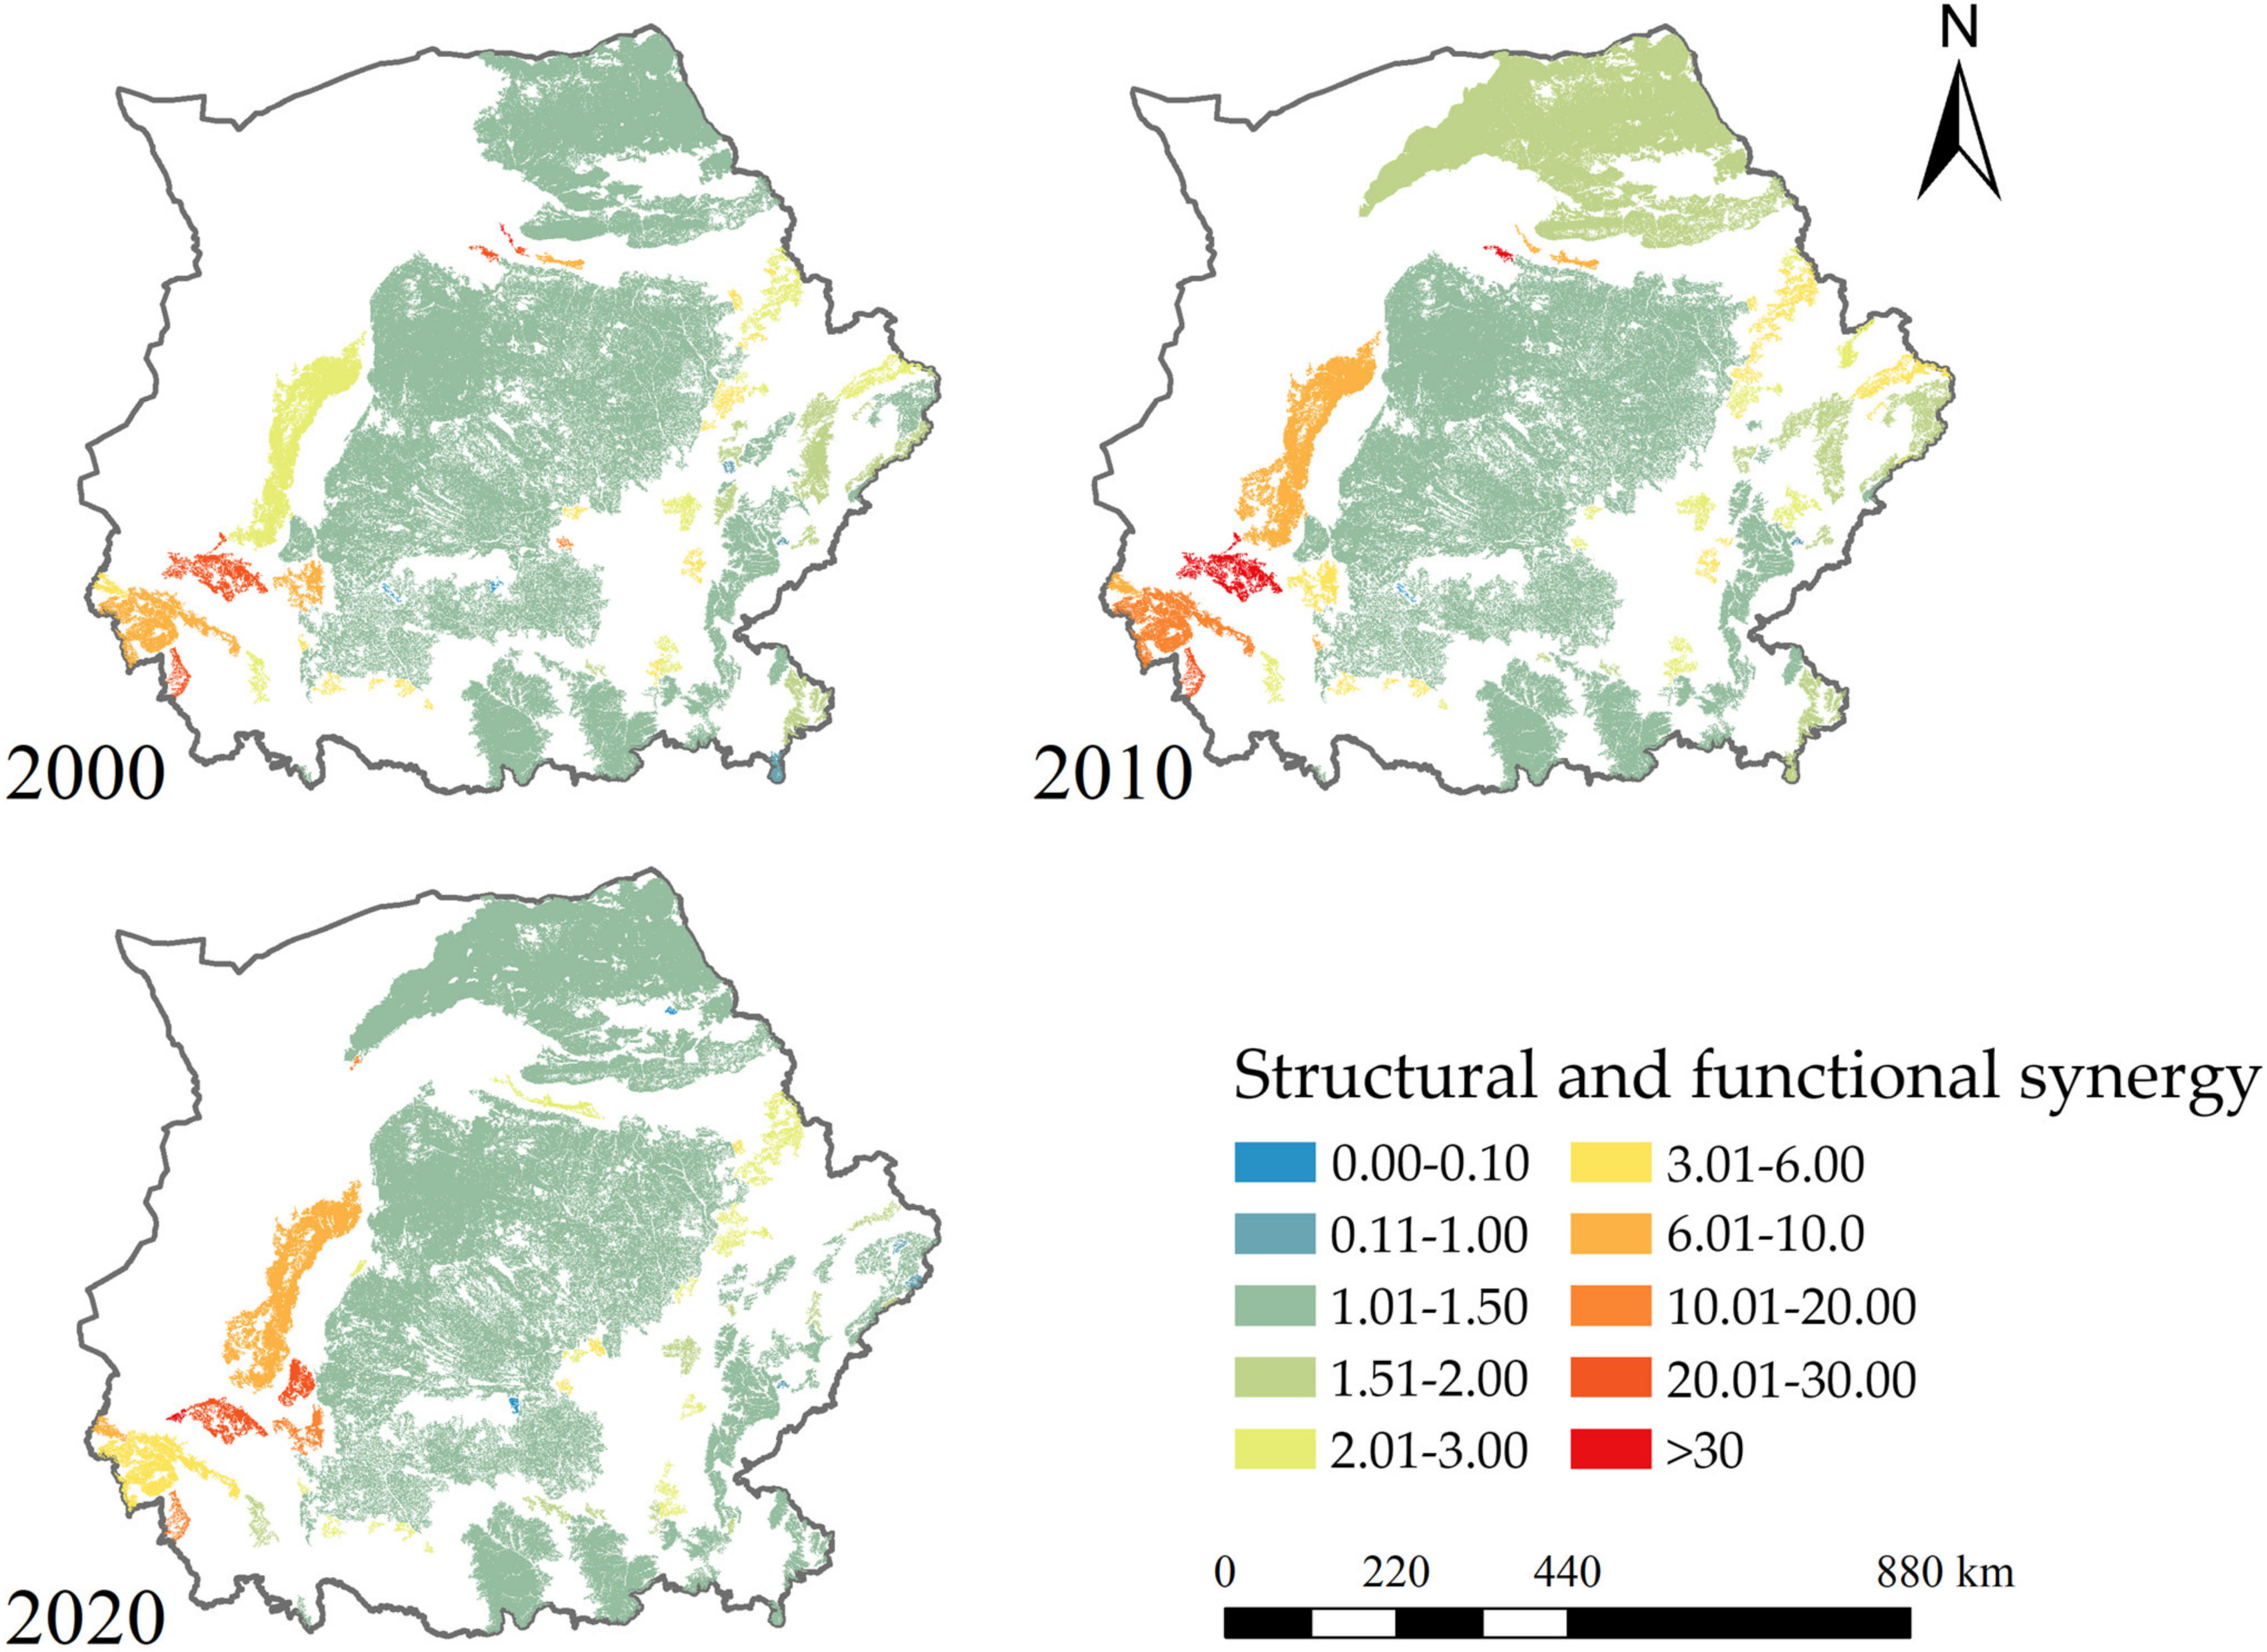
3.5.3. Coordination between Topological Importance and Functional Importance
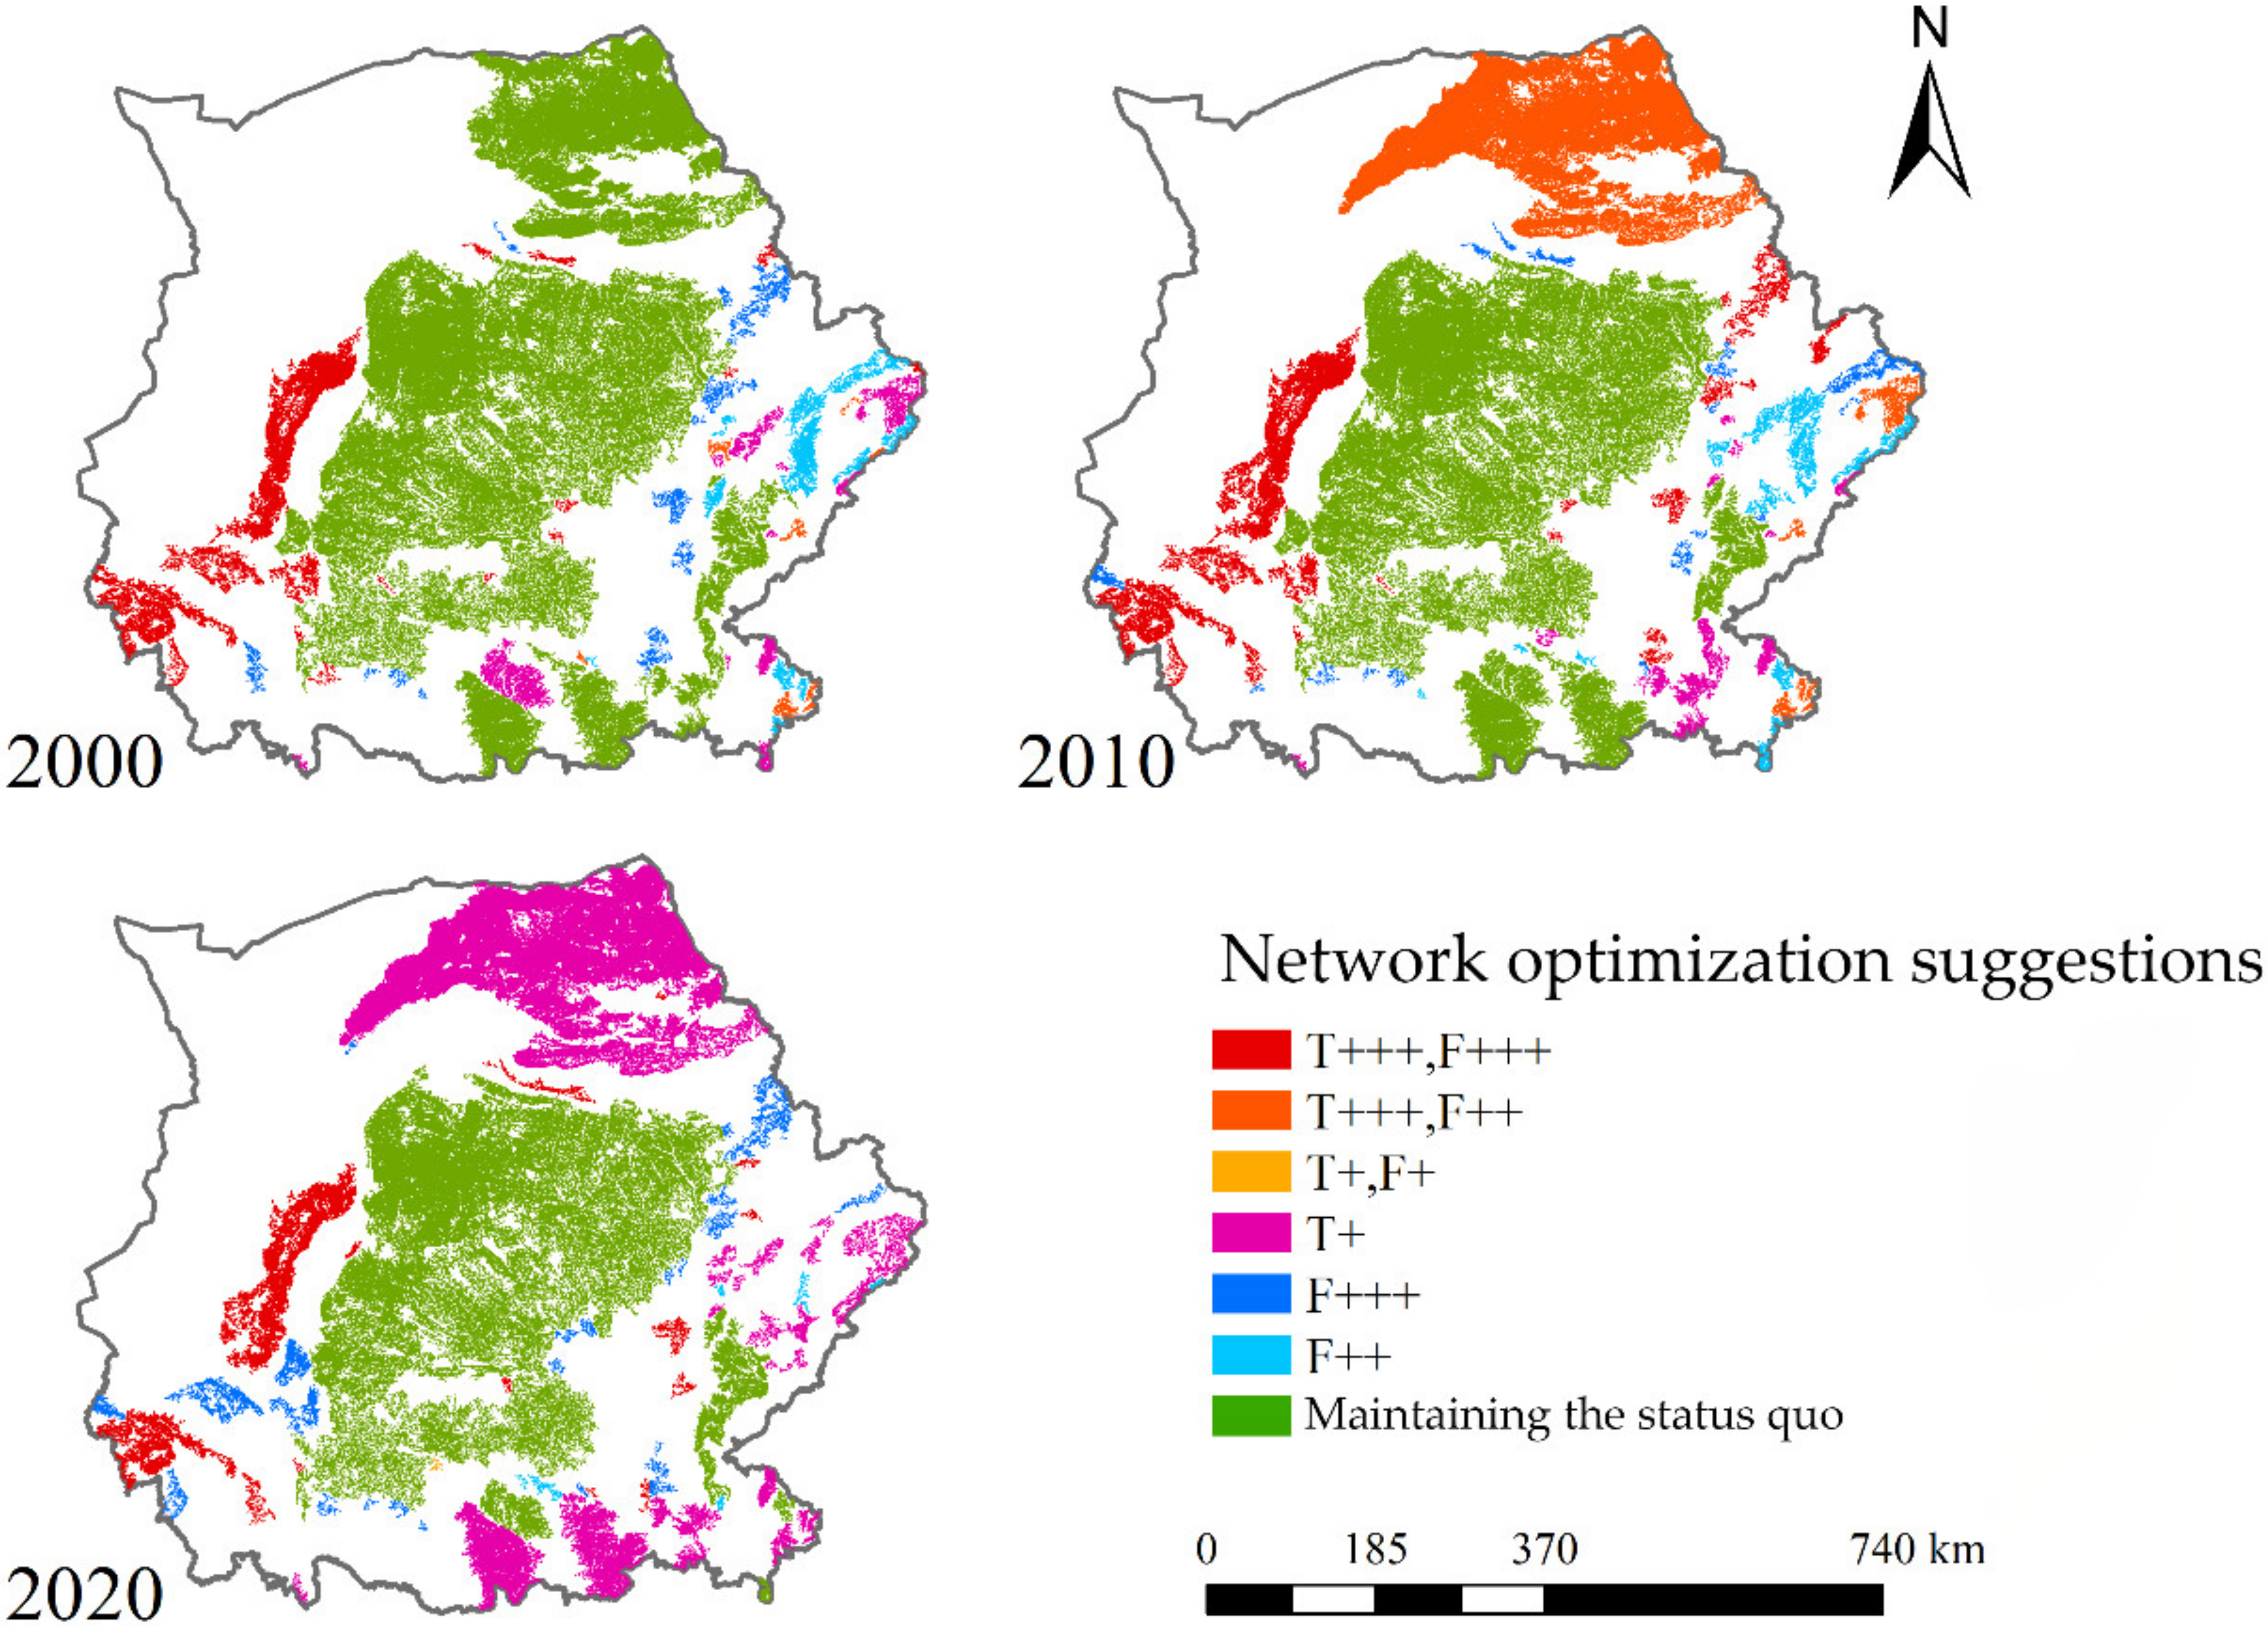
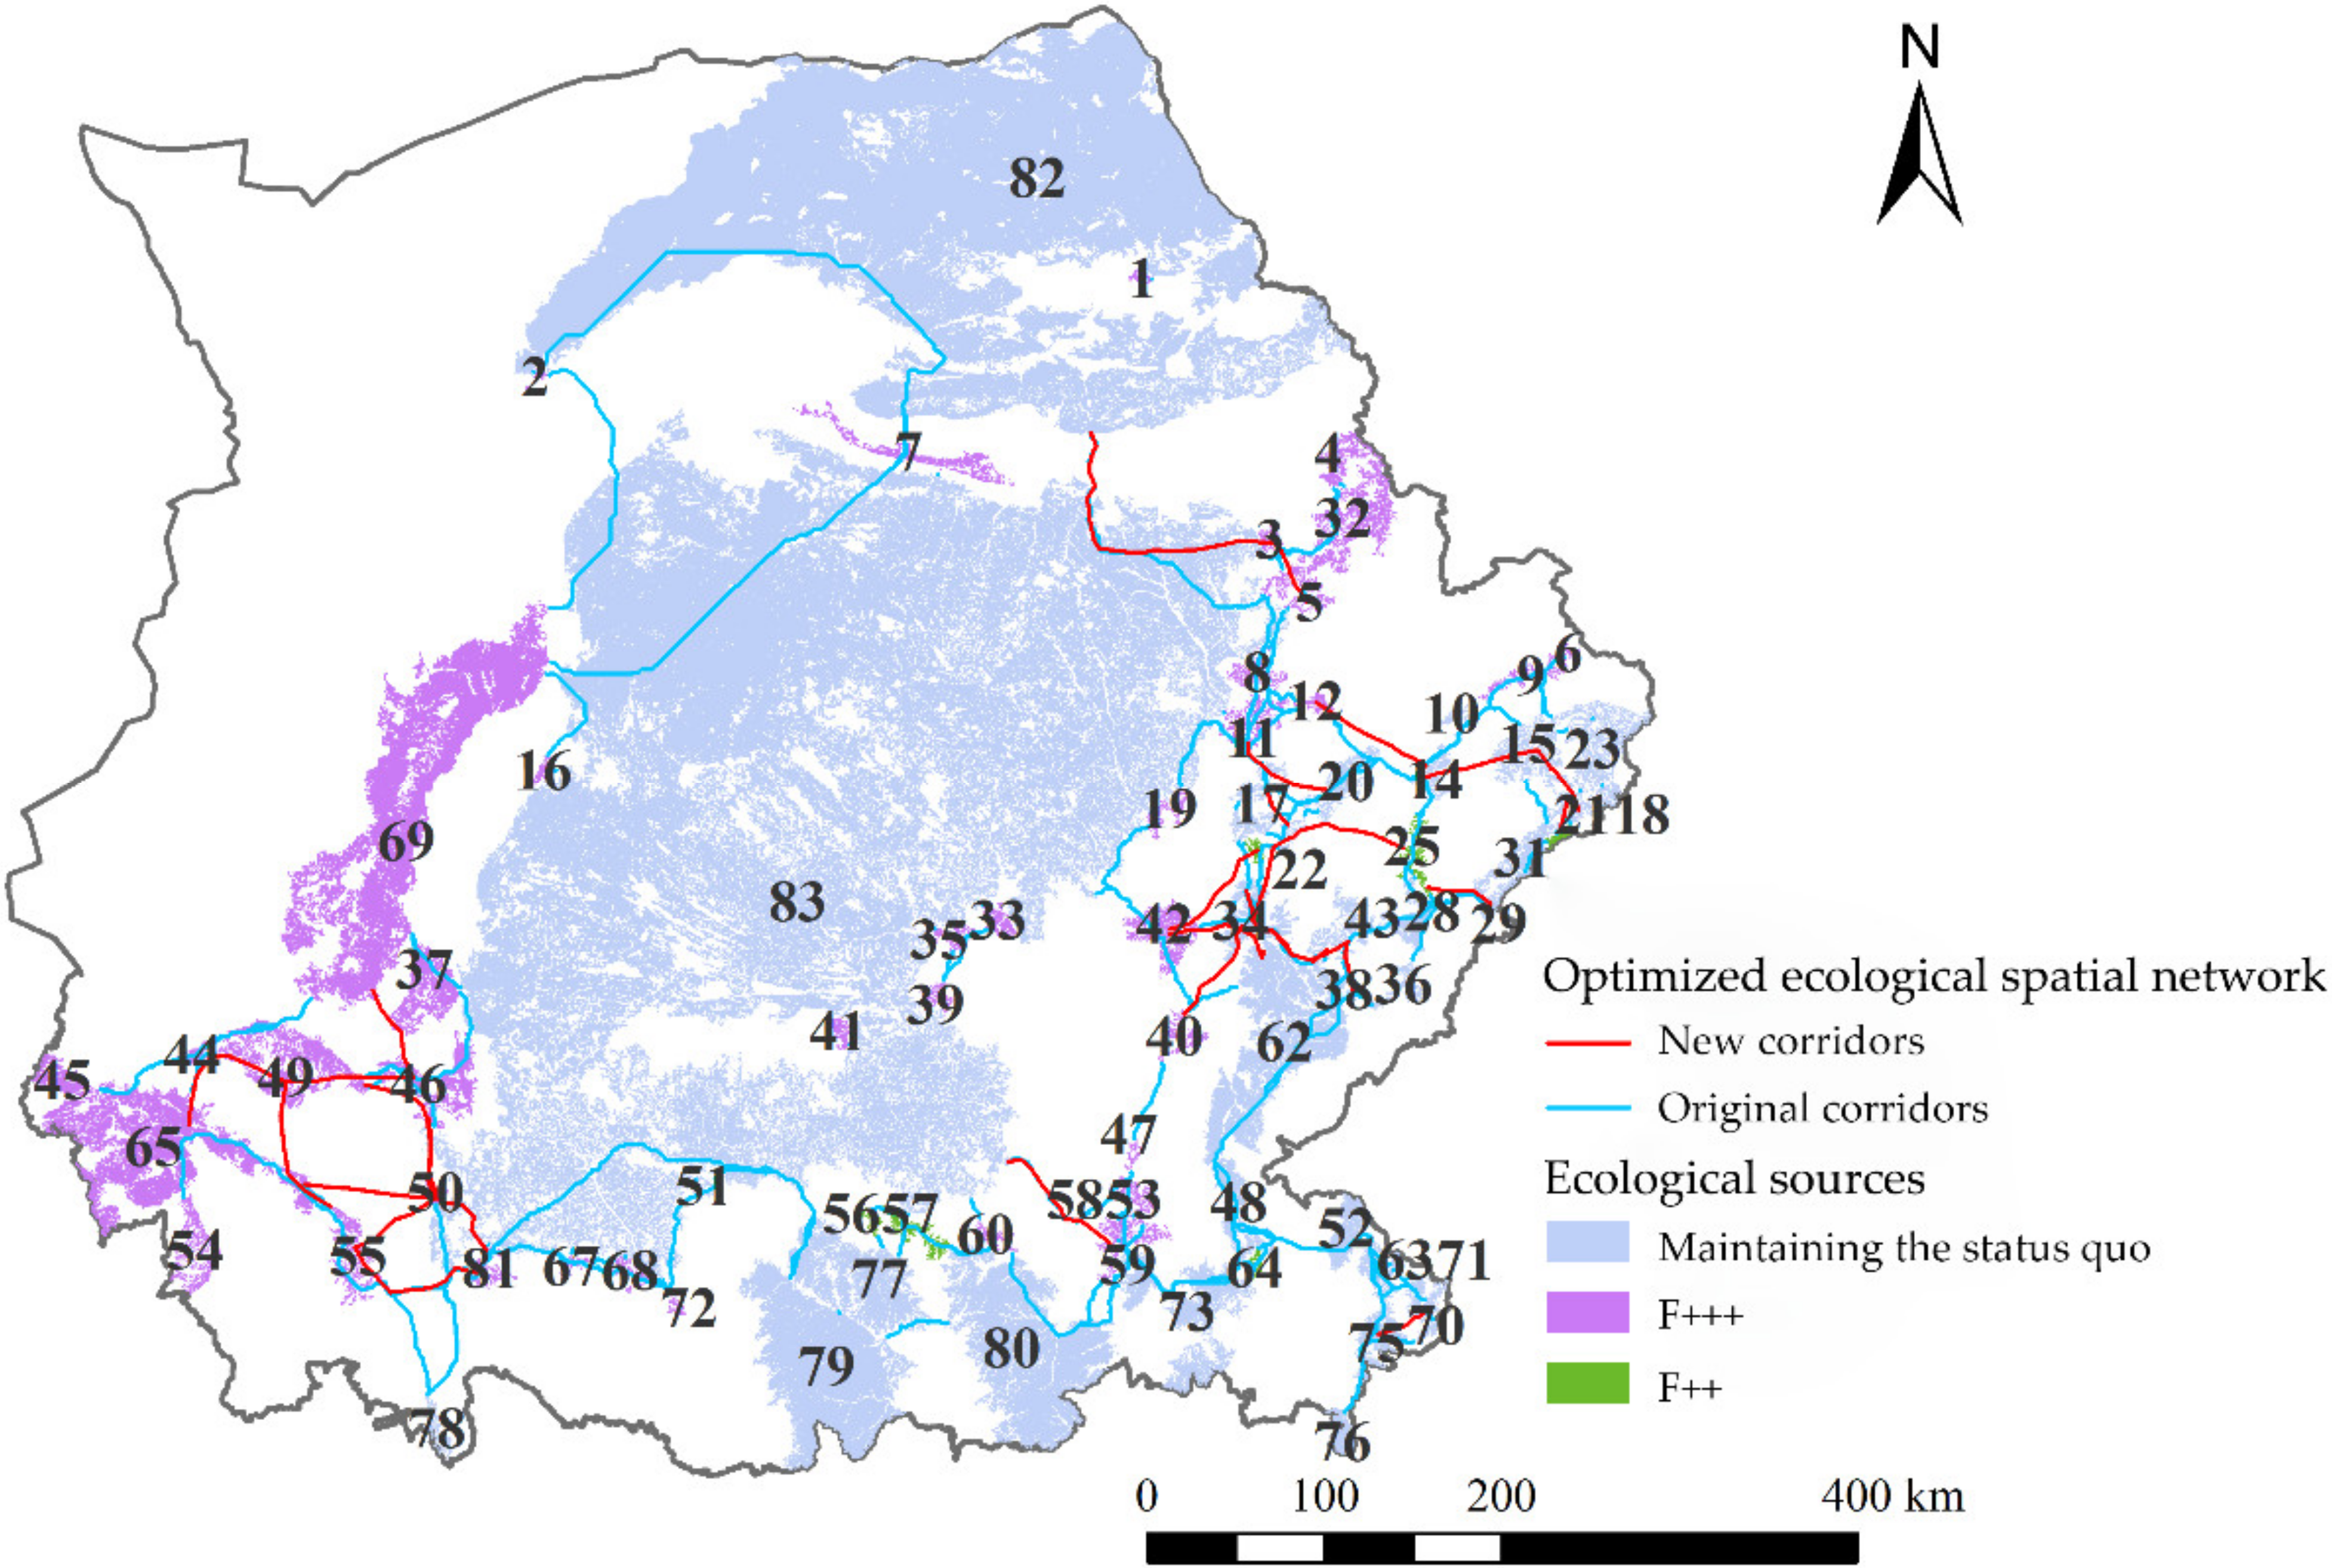
3.6. Optimization of the Ecological Spatial Network in ESAMRYR
3.7. Assessment of Optimization Effect
3.7.1. Carbon Sequestration
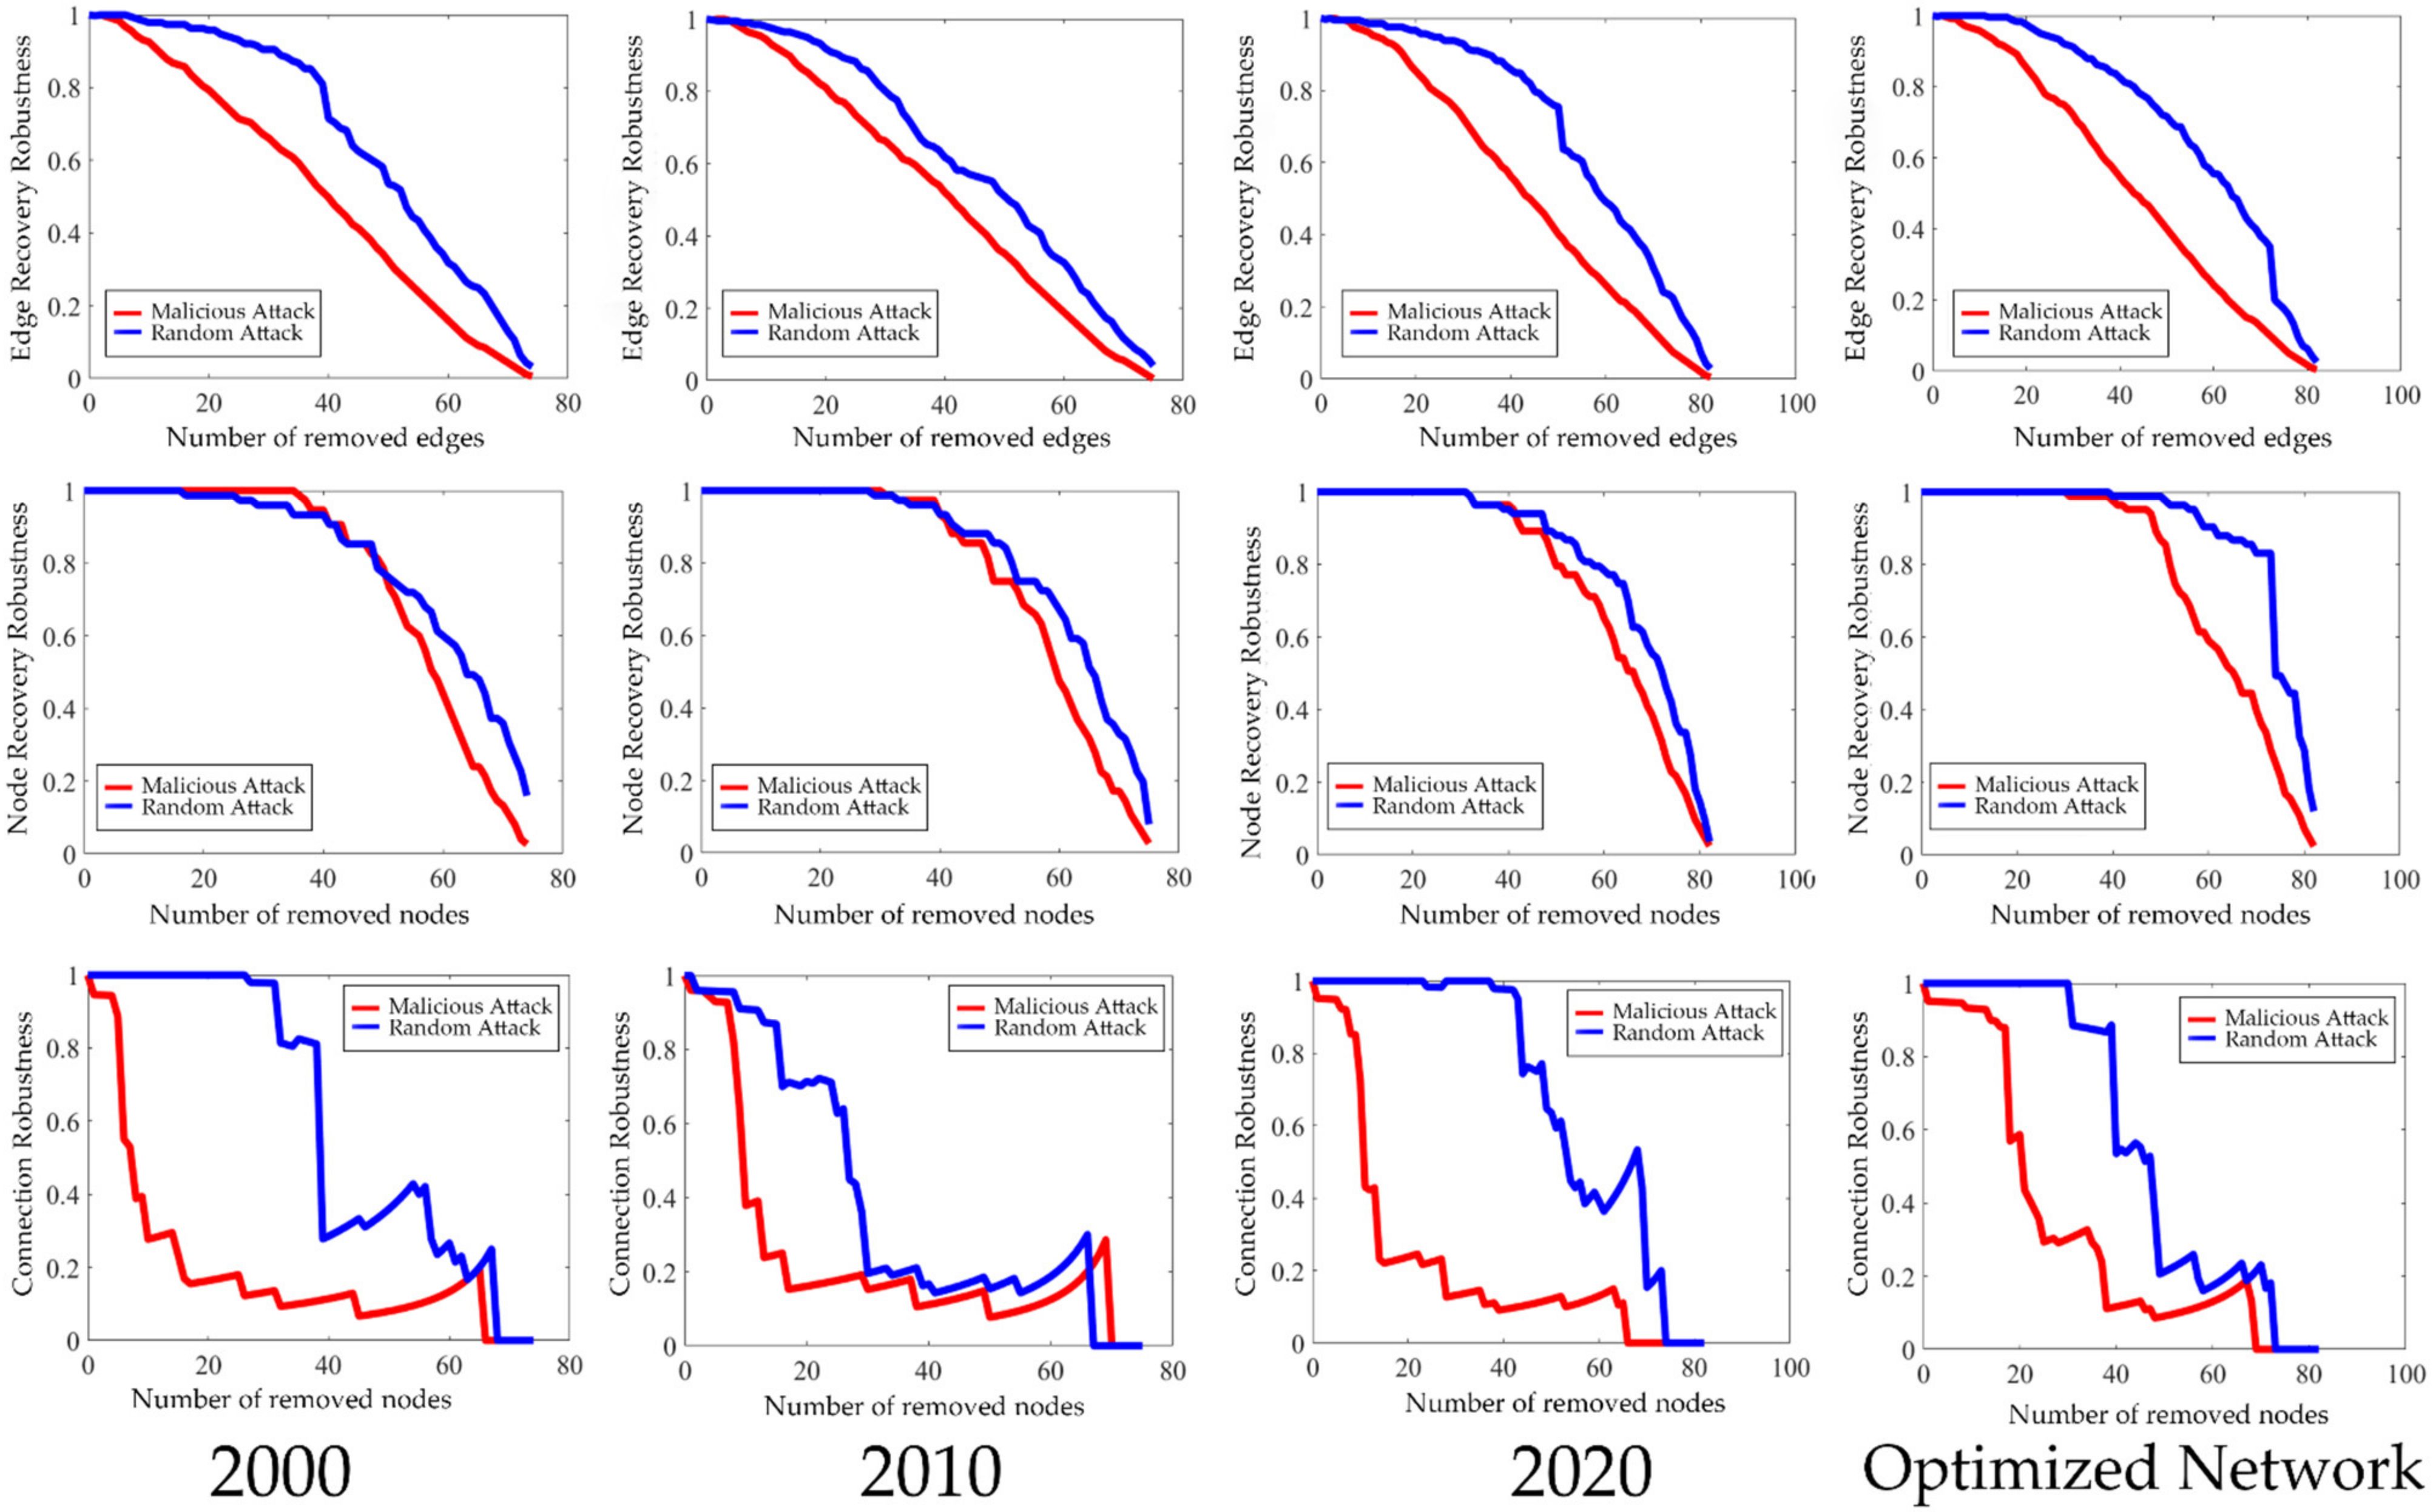
3.7.2. Robustness
4. Discussion
4.1. Optimization of the Assessment of Carbon Sequestration Capacity in Ecological Sources
4.2. Optimization of Topological Assessment of Ecological Sources
5. Conclusions
Author Contributions
Funding
Data Availability Statement
Acknowledgments
Conflicts of Interest
References
- Ledley, T.S.; Sundquist, E.T.; Schwartz, S.E.; Hall, D.K.; Fellows, J.D.; Killeen, T.L. Climate change and greenhouse gases. EOS 1999, 80, 453–458. [Google Scholar] [CrossRef]
- Kim, H.; Kim, S.; Dale, B.E.J.E.s. Technology, Biofuels, land use change, and greenhouse gas emissions: Some unexplored variables. Environ. Sci. Technol. 2009, 43, 961–967. [Google Scholar] [CrossRef] [PubMed]
- Mikhaylov, A.; Moiseev, N.; Aleshin, K.; Burkhardt, T.J.E.; Issues, S. Global climate change and greenhouse effect. Entrep. Sustain. Issues 2020, 7, 2897. [Google Scholar] [CrossRef] [PubMed]
- Hensher, D.A. Climate change, enhanced greenhouse gas emissions and passenger transport–What can we do to make a difference? Transp. Res. Part D Transp. Environ. 2008, 13, 95–111. [Google Scholar] [CrossRef]
- Zhang, H.; Li, S. Carbon emissions’ spatial-temporal heterogeneity and identification from rural energy consumption in China. J. Environ. Manag. 2022, 304, 114286. [Google Scholar] [CrossRef]
- Fang, M.; Si, G.; Yu, Q.; Huang, H.; Huang, Y.; Liu, W.; Guo, H.J.R.S. Study on the relationship between topological characteristics of vegetation ecospatial network and carbon sequestration capacity in the Yellow River Basin, China. Remote Sens. 2021, 13, 4926. [Google Scholar] [CrossRef]
- Xu, Q.; Yang, R.; Dong, Y.-X.; Liu, Y.-X.; Qiu, L.-R. The influence of rapid urbanization and land use changes on terrestrial carbon sources/sinks in Guangzhou, China. Ecol. Indic. 2016, 70, 304–316. [Google Scholar] [CrossRef]
- Xu, G.; Schwarz, P.; Yang, H. Adjusting energy consumption structure to achieve China’s CO2 emissions peak. Renew. Sustain. Energy Rev. 2020, 122, 109737. [Google Scholar] [CrossRef]
- Zhang, C.-y.; Zhao, L.; Zhang, H.; Chen, M.-n.; Fang, R.-y.; Yao, Y.; Zhang, Q.-p.; Wang, Q. Spatial-temporal characteristics of carbon emissions from land use change in Yellow River Delta region, China. Ecol. Indic. 2022, 136, 108623. [Google Scholar] [CrossRef]
- Piao, S.; Fang, J.; Ciais, P.; Peylin, P.; Huang, Y.; Sitch, S.; Wang, T. The carbon balance of terrestrial ecosystems in China. Nature 2009, 458, 1009–1013. [Google Scholar] [CrossRef]
- Lloyd, J. The CO2 dependence of photosynthesis, plant growth responses to elevated CO2 concentrations and their interaction with soil nutrient status, II. Temperate and boreal forest productivity and the combined effects of increasing CO2 concentrations and increased nitrogen deposition at a global scale. Funct. Ecol. 1999, 13, 439–459. [Google Scholar]
- Li, K.; Wang, S.; Cao, M. Vegetation and soil carbon storage in China. Sci. China Earth Sci. 2004, 47, 49–57. [Google Scholar] [CrossRef]
- Song, C.; Woodcock, C.E. A regional forest ecosystem carbon budget model: Impacts of forest age structure and landuse history. Ecol. Model. 2003, 164, 33–47. [Google Scholar] [CrossRef]
- Yu, Q.; Yue, D.; Wang, Y.; Kai, S.; Fang, M.; Ma, H.; Zhang, Q.; Huang, Y. Optimization of ecological node layout and stability analysis of ecological network in desert oasis: A typical case study of ecological fragile zone located at Deng Kou County (Inner Mongolia). Ecol. Indic. 2018, 84, 304–318. [Google Scholar] [CrossRef]
- Parker, K.; Head, L.; Chisholm, L.A.; Feneley, N.J.L.; Planning, U. A conceptual model of ecological connectivity in the Shellharbour local government area, New South Wales, Australia. Landsc. Urban Plan. 2008, 86, 47–59. [Google Scholar] [CrossRef]
- Hagen, M.; Kissling, W.D.; Rasmussen, C.; De Aguiar, M.A.; Brown, L.E.; Carstensen, D.W.; Alves-Dos-Santos, I.; Dupont, Y.L.; Edwards, F.K.; Genini, J. Biodiversity, species interactions and ecological networks in a fragmented world. In Advances in Ecological Research; Elsevier: Amsterdam, The Netherlands, 2012; Volume 46, pp. 89–210. [Google Scholar]
- Xu, W.; Wang, J.; Zhang, M.; Li, S. Construction of landscape ecological network based on landscape ecological risk assessment in a large-scale opencast coal mine area. J. Clean. Prod. 2021, 286, 125523. [Google Scholar] [CrossRef]
- Delmas, E.; Besson, M.; Brice, M.H.; Burkle, L.A.; Riva, G.V.D.; Fortin, M.J.; Gravel, D.; Guimarães, P.R., Jr.; Hembry, D.H.; Newman, E.A.J.B.R. Analysing ecological networks of species interactions. Biol. Rev. Camb. Philos. Soc. 2019, 94, 16–36. [Google Scholar] [CrossRef]
- Zhao, S.-M.; Ma, Y.-F.; Wang, J.-L.; You, X.-Y. Landscape pattern analysis and ecological network planning of Tianjin City. Urban For. Urban Green. 2019, 46, 126479. [Google Scholar] [CrossRef]
- Peng, J.; Yang, Y.; Liu, Y.; Du, Y.; Meersmans, J.; Qiu, S.J. Linking ecosystem services and circuit theory to identify ecological security patterns. Sci. Total. Environ. 2018, 644, 781–790. [Google Scholar] [CrossRef]
- Wang, F.; Yu, Q.; Qiu, S.; Xu, C.; Ma, J.; Liu, H. Study on the relationship between topological characteristics of ecological spatial network and soil conservation function in southeastern Tibet, China. Ecol. Indic. 2023, 146, 109791. [Google Scholar] [CrossRef]
- Zhao, G.; Tian, P.; Mu, X.; Jiao, J.; Wang, F.; Gao, P. Quantifying the impact of climate variability and human activities on streamflow in the middle reaches of the Yellow River basin, China. J. Hydrol. 2014, 519, 387–398. [Google Scholar] [CrossRef]
- Zhang, Q.; Xu, C.-Y.; Chen, Y.D.; Ren, L. Comparison of evapotranspiration variations between the Yellow River and Pearl River basin, China. Stoch. Environ. Res. Risk Assess. 2011, 25, 139–150. [Google Scholar] [CrossRef]
- Gao, P.; Mu, X.-M.; Wang, F.; Li, R.J.H.; Sciences, E.S. Changes in streamflow and sediment discharge and the response to human activities in the middle reaches of the Yellow River. Hydrol. Earth Syst. Sci. 2011, 15, 1–10. [Google Scholar] [CrossRef]
- Pan, B.; Hu, Z.; Wang, J.; Vandenberghe, J.; Hu, X. A magnetostratigraphic record of landscape development in the eastern Ordos Plateau, China: Transition from Late Miocene and Early Pliocene stacked sedimentation to Late Pliocene and Quaternary uplift and incision by the Yellow River. Geomorphology 2011, 125, 225–238. [Google Scholar] [CrossRef]
- Xu, D.; Kang, X.; Zhuang, D.; Pan, J. Multi-scale quantitative assessment of the relative roles of climate change and human activities in desertification–a case study of the Ordos Plateau, China. J. Arid. Environ. 2010, 74, 498–507. [Google Scholar] [CrossRef]
- Tomar, V.; Mandal, V.P.; Srivastava, P.; Patairiya, S.; Singh, K.; Ravisankar, N.; Subash, N.; Kumar, P. Rice equivalent crop yield assessment using MODIS sensors’ based MOD13A1-NDVI data. IEEE Sens. J. 2014, 14, 3599–3605. [Google Scholar] [CrossRef]
- Su, K.; Yu, Q.; Yue, D.; Zhang, Q.; Yang, L.; Liu, Z.; Niu, T.; Sun, X. Simulation of a forest-grass ecological network in a typical desert oasis based on multiple scenes. Ecol. Model. 2019, 413, 108834. [Google Scholar] [CrossRef]
- An, Y.; Liu, S.; Sun, Y.; Shi, F.; Beazley, R. Construction and optimization of an ecological network based on morphological spatial pattern analysis and circuit theory. Landsc. Ecol. 2020, 36, 2059–2076. [Google Scholar] [CrossRef]
- Li, Y.-Y.; Zhang, Y.-Z.; Jiang, Z.-Y.; Guo, C.-X.; Zhao, M.-Y.; Yang, Z.-G.; Guo, M.-Y.; Wu, B.-Y.; Chen, Q.-L. Integrating morphological spatial pattern analysis and the minimal cumulative resistance model to optimize urban ecological networks: A case study in Shenzhen City, China. Ecol. Process. 2021, 10, 1–15. [Google Scholar] [CrossRef]
- Dong, J.; Dai, W.; Shao, G.; Xu, J. Ecological network construction based on minimum cumulative resistance for the city of Nanjing, China. ISPRS Int. J. Geo-Inform. 2015, 4, 2045–2060. [Google Scholar] [CrossRef]
- Balbi, M.; Petit, E.J.; Croci, S.; Nabucet, J.; Georges, R.; Madec, L.; Ernoult, A. Ecological relevance of least cost path analysis: An easy implementation method for landscape urban planning. J. Environ. Manag. 2019, 244, 61–68. [Google Scholar] [CrossRef]
- Ding, R.J.C. The complex network theory-based urban land-use and transport interaction studies. Complexity 2019, 2019, 4180890. [Google Scholar] [CrossRef]
- Liu, H.; Niu, T.; Yu, Q.; Yang, L.; Ma, J.; Qiu, S.; Wang, R.; Liu, W.; Li, J. Spatial and temporal variations in the relationship between the topological structure of eco-spatial network and biodiversity maintenance function in China. Ecol. Indic. 2022, 139, 108919. [Google Scholar] [CrossRef]
- Heer, H.; Streib, L.; Schäfer, R.B.; Ruzika, S. Maximising the clustering coefficient of networks and the effects on habitat network robustness. PLoS ONE 2020, 15, e0240940. [Google Scholar] [CrossRef]
- Pereira, M.; Segurado, P.; Neves, N. Using spatial network structure in landscape management and planning: A case study with pond turtles. Landsc. Urban Plan. 2011, 100, 67–76. [Google Scholar] [CrossRef]
- Galiana, N.; Lurgi, M.; Bastazini, V.A.; Bosch, J.; Cagnolo, L.; Cazelles, K.; Claramunt-López, B.; Emer, C.; Fortin, M.-J.; Grass, I.J.N.e.; et al. Ecological network complexity scales with area. Nat. Ecol. Evol. 2022, 6, 307–314. [Google Scholar] [CrossRef] [PubMed]
- Cramer, W.; Kicklighter, D.W.; Bondeau, A.; Iii, B.M.; Churkina, G.; Nemry, B.; Ruimy, A.; Schloss, A.L. The. Participants of The Potsdam NPP. Model Intercomparison. Comparing global models of terrestrial net primary productivity (NPP): Overview and key results. Glob. Chang. Biol. 1999, 5, 1–15. [Google Scholar] [CrossRef]
- Woodward, F.; Smith, T.M. Predictions and measurements of the maximum photosynthetic rate, A max, at the global scale. Ecophysiol. Photosynth. 1995, 100, 491–509. [Google Scholar]
- Makino, A.; Mae, T. Photosynthesis and plant growth at elevated levels of CO2. Plant Cell Physiol. 1999, 40, 999–1006. [Google Scholar] [CrossRef]
- Zhou, L.; Liu, Z.; Wang, Z.; Yu, S.; Long, T.; Zhou, X.; Bao, Y. Astragalus polysaccharides exerts immunomodulatory effects via TLR4-mediated MyD88-dependent signaling pathway in vitro and in vivo. Sci. Rep. 2017, 7, 1–13. [Google Scholar] [CrossRef]
- Yang, L.; Niu, T.; Yu, Q.; Zhang, X.; Wu, H. Relationship between Topological Structure and Ecosystem Services of Forest Grass Ecospatial Network in China. Remote Sens. 2022, 14, 4700. [Google Scholar] [CrossRef]
- Zhang, R.; Zhang, L.; Zhong, Q.; Zhang, Q.; Ji, Y.; Song, P.; Wang, Q. An optimized evaluation method of an urban ecological network: The case of the Minhang District of Shanghai. Urban For. Urban Green. 2021, 62, 127158. [Google Scholar] [CrossRef]
- Qiu, S.; Yu, Q.; Niu, T.; Fang, M.; Guo, H.; Liu, H.; Li, S.; Zhang, J. Restoration and renewal of ecological spatial network in mining cities for the purpose of enhancing carbon Sinks: The case of Xuzhou, China. Ecol. Indic. 2022, 143, 109313. [Google Scholar] [CrossRef]
- Drake, B.G.; Gonzàlez-Meler, M.A.; Long, S.P. More efficient plants: A consequence of rising atmospheric CO2? Annu. Rev. Plant Physiol. Plant Mol. Biol. 1997, 48, 609–639. [Google Scholar] [CrossRef]
- Raven, J.A.; Handley, L.L.; Wollenweber, B. Plant nutrition and water use efficiency. Water Use Effic. Plant Biol. 2004, 171–197. [Google Scholar] [CrossRef]
- Jiang, B.; Claramunt, C. Topological analysis of urban street networks. Environ. Plan. B Plan. Des. 2004, 31, 15. [Google Scholar] [CrossRef]


| Topological Index | Topological Definition | Ecological Significance of Topological Indices | References |
|---|---|---|---|
| Betweenness centrality | The proportion of all shortest paths in the network that pass through node v. | It evaluates the ability of ecological sources to maintain the information and material exchange in the ecological space network, and reflects its role and influence in the network. | [34] |
| Clustering coefficient | The ratio of the number of actual edges between k neighboring nodes of node v to the number of possible edges. | It reflects the connectivity of the ecological sources around the source. | [35] |
| Coreness | The number of nodes remaining in the subgraph after repeatedly removing nodes and their connections smaller than k. | It measures the connectivity of the ecological system. | [36] |
| Degree | The number of edges connecting a node in a network. | It reflects the efficiency of information and material communication between ecological sources and ecosystems. | [37] |
| Vegetation Type | Maximum Light Use Efficiency (gC/MJ) | Vegetation Type | Maximum Light Use Efficiency (gC/MJ) |
|---|---|---|---|
| Deciduous coniferous forest | 0.485 | Shrub | 0.429 |
| Evergreen coniferous forest | 0.389 | Grassland | 0.542 |
| Deciduous broad-leaved forest | 0.692 | Cultivated Vegetation | 0.542 |
| Mixed forest | 0.475 | Other | 0.542 |
| 2000 | 2010 | 2020 | ||||
|---|---|---|---|---|---|---|
| Carbon Sequestration (tC/yr) | Proportion (%) | Carbon Sequestration (tC/yr) | Proportion (%) | Carbon Sequestration (tC/yr) | Proportion (%) | |
| Cultivated land | 13,163,611.85 | 37.56 | 14,946,366.04 | 36.77 | 16,649,330.16 | 37.69 |
| Forest | 6,503,518.42 | 18.56 | 8,088,711.82 | 19.90 | 9,399,560.90 | 21.28 |
| Grassland | 15,133,555.89 | 43.18 | 17,121,131.84 | 42.12 | 17,629,028.08 | 39.91 |
| Shrubland | 243,602.50 | 0.70 | 491,432.10 | 1.21 | 499,548.69 | 1.13 |
| Total | 35,044,288.66 | 100 | 40,647,641.80 | 100 | 44,177,467.82 | 100 |
| State | Type | Amount | Area (km2) | Original Carbon Sequestration (tC/yr) | Carbon Sequestration Increment (tC/yr) | Proportion (%) |
|---|---|---|---|---|---|---|
| T+++, F+++ | Forest | 1 | 53.28 | 11,502.14 | 484.51 | 0.23 |
| T+++, F+++ | Grass and shrubland | 13 | 15,425.12 | 781,788.85 | 136,744.07 | 63.51 |
| F+++ | Forest | 3 | 364.84 | 63,272.30 | 3255.97 | 1.51 |
| F+++ | Grass and shrubland | 23 | 8059.96 | 678,197.98 | 71,344.63 | 33.14 |
| F++ | Forest | 7 | 786.44 | 174,106.36 | 3481.55 | 1.62 |
| Total | 47 | 24,689.64 | 1,708,867.63 | 215,310.73 | 100.00 |
Disclaimer/Publisher’s Note: The statements, opinions and data contained in all publications are solely those of the individual author(s) and contributor(s) and not of MDPI and/or the editor(s). MDPI and/or the editor(s) disclaim responsibility for any injury to people or property resulting from any ideas, methods, instructions or products referred to in the content. |
© 2023 by the authors. Licensee MDPI, Basel, Switzerland. This article is an open access article distributed under the terms and conditions of the Creative Commons Attribution (CC BY) license (https://creativecommons.org/licenses/by/4.0/).
Share and Cite
Wang, F.; Guo, H.; Zhang, Q.; Yu, Q.; Xu, C.; Qiu, S. Optimizing Ecological Spatial Network Topology for Enhanced Carbon Sequestration in the Ecologically Sensitive Middle Reaches of the Yellow River, China. Remote Sens. 2023, 15, 2308. https://doi.org/10.3390/rs15092308
Wang F, Guo H, Zhang Q, Yu Q, Xu C, Qiu S. Optimizing Ecological Spatial Network Topology for Enhanced Carbon Sequestration in the Ecologically Sensitive Middle Reaches of the Yellow River, China. Remote Sensing. 2023; 15(9):2308. https://doi.org/10.3390/rs15092308
Chicago/Turabian StyleWang, Fei, Hongqiong Guo, Qibin Zhang, Qiang Yu, Chenglong Xu, and Shi Qiu. 2023. "Optimizing Ecological Spatial Network Topology for Enhanced Carbon Sequestration in the Ecologically Sensitive Middle Reaches of the Yellow River, China" Remote Sensing 15, no. 9: 2308. https://doi.org/10.3390/rs15092308
APA StyleWang, F., Guo, H., Zhang, Q., Yu, Q., Xu, C., & Qiu, S. (2023). Optimizing Ecological Spatial Network Topology for Enhanced Carbon Sequestration in the Ecologically Sensitive Middle Reaches of the Yellow River, China. Remote Sensing, 15(9), 2308. https://doi.org/10.3390/rs15092308