Abstract
Distributed coherent aperture radar (DCAR) can realize high-precision long-range detection because of its excellent angular resolution. However, it is accompanied by a low search efficiency problem caused by the narrow main lobe and the angular ambiguity problem stemming from the high grating lobes. By simultaneously utilizing multiple grating lobes, we propose an effective search method and pertinent unambiguous signal processing algorithms to address the issue of using collocated DCAR for unambiguous target search. We investigate the beam migration of a grating lobe-irradiated target at various frequencies in order to carry out the multi-frequency coherent integration of the suggested search method in DCAR. In order to address the issue of using multiple beam lobes to simultaneously detect multiple targets, we also take into account the scenario of multiple targets and introduce the multiple hypothesis method to solve the problem. The DCAR search efficiency can be improved by tens of times through grating lobes exploitation, which makes use of DCAR to make the searches feasible. We also improved the performance of multi-frequency DOA ambiguity solving compared to existing algorithms with the sliding window clustering scheme. The viability of using grating lobes for the DCAR target searching and detection is shown in simulations. The experiments confirm the performance enhancement of multi-frequency coherent integration for parameter estimation.
1. Introduction
The angular resolution of a distributed aperture coherent radar could be quite excellent due to its large size. Even when employing long-range detection, it is still possible to obtain high-precision position information [1,2]. Thus, it is widely used in a long-range tracking task. However, when the DCAR is applied in the long-range searching task, there exists a critical problem of low search efficiency, which strongly prohibits its application [3].
DCAR’s narrow main lobe is the reason for its low search efficiency, as the current search method only uses the main lobe energy of the antenna beam. The narrower a DCAR-formed beam’s main lobe is, the smaller the area to be searched using that main lobe is [4,5]. The straightforward idea of addressing the inefficiency problem is to make the main lobe wider, which can be achieved by reducing the DCAR aperture size. Unfortunately, we need the main lobe to be as narrow as possible to ensure the angular resolution performance from the perspective of the receiving antenna. Therefore, using the same DCAR antenna for transmitting and receiving is a difficult trade-off to reconcile. The second method is to use different antennas for transmitting and receiving [3,6,7]. This method has the disadvantage of poor applicability. Not all applications can satisfy bistatic antenna requirements such as collocated DCAR with flexible configurations [8,9,10].
Another idea to improve the search efficiency is applying grating lobes to search and modify the conventional main lobe search idea. X. Liu proposed the idea of using the grating of a uniformly sparse array in sonar to first improve the transmit search efficiency in [11]. Then, T. Takayama developed the application of grating search in radar systems using a hybrid SIMO and MIMO approach [12]. It is a pity that neither of them discussed the implementation of DCAR. Lately, J.L. Wu and J.Y. Huang discussed the efficiency comparison of using grating lobes in DCAR [13,14]. However, it does not develop a particular signal processing solution for grating lobe exploitation search.
When the DCAR is used as the receiving antenna, there will be the discrimination ambiguity in angle estimation due to the presence of high grating lobes [15,16]. If the target is irradiated by one grating lobe, it may also be detected during signal processing. The challenging issue is that the angle will be identified as the main lobe angle rather than the actual target angle.
There are two types of methods to deal with grating lobes: grating lobe rejection and grating lobe ambiguity solving. Grating lobe rejection has been adequately researched because it can fundamentally solve the angle ambiguity. Researchers have proposed various grating lobe-free configurations and introduced various optimization algorithms such as sparse Bayesian learning, genetic algorithms and differential evolution to obtain grating lobe-free array configurations [17,18,19,20]. The virtual interpolation can also achieve an equivalent grating lobe-free beam pattern [21,22,23] by filling the transmitted sparsity using an virtually unambiguous receiving structure. Those grating lobe rejection methods are always highly demanding in terms of computational complexity or for signal processing speed. Regardless of the disadvantages, those methods are still not suitable for transceiver-collocated DCARs because the optimized array has no grating lobes which are necessary for grating lobe exploitation in transmission. The grating lobe ambiguity solving uses additional information (such as waveform diversity information [24,25,26], frequency diversity information [24,27,28,29,30], and array configuration information [31,32,33]) to solve the ambiguity while preserving the grating lobes. In comparison with the first two aforementioned methods, this method requires less processing and does not alter the array structure. The drawback is that obtaining more information needs more time or hardware resources in practice.
In this paper, we proposed an efficient simultaneous multiple targets search method applicable to collocated DCAR via grating lobes exploitation. We call this search method grating lobes exploitation (GLE) search because it uses the grating lobes that have not previously been used for the DCAR search task. The major focus of this paper is the signal processing implementation of this search method and expansion in multi-target scenarios. The major contributions of this paper can be concluded as follows:
- We redesigned the conventional signal processing method which is based on the main lobe search to accommodate the GLE searching method. On the basis of the disambiguation of the main lobe and grating lobes discrimination using multi-frequency information, the proposed processing method can achieve the simultaneous recognition of targets irradiated by the main and grating lobes;
- We observed the beam migration phenomenon at different frequencies of the grating irradiated target. After studying and summarizing this phenomenon, we achieved the cross-beam multi-frequency coherent integration of the grating irradiated target using the method of iterating through all the migration hypothesis spaces;
- For the scenario of detecting multiple targets at the same time, we address the problem of correlating different targets at different frequencies by applying the idea of multiple hypothesis tracking. The aforementioned signal processing was successfully extended to the scenario of a simultaneous coherent search for multiple targets. All the above work has been validated and analyzed by simulation experiments for feasibility and performance improvement.
This paper is organized according to the following framework. In Section 2, we first present the DCAR signal model and the pattern function representation. Furthermore, we provide the distribution characteristics of the grating lobes and analyze the viability of the GLE search by examining the DCAR pattern function. Then, in Section 3, we discuss the target search strategy using GLE and the recognition of the grating lobe detected targets using multi-frequency information. This section also interprets how to carry out the coherent integration of the multiple-frequency grating lobe irradiated target. We categorize several multi-target scenarios for the case of multiple targets existing in the search region simultaneously and accomplish the GLE search by introducing the idea of multiple hypothesis tracking. All the simulation experimental results are presented and analyzed in Section 4. Finally, we conclude this paper in Section 5.
2. Signal Model and Problem Formulation
In this section, we first introduce the DCAR signal model and beam pattern. The distribution characteristics of the grating lobes are given, and the beam pattern of a uniformly dispersed array antenna is examined. The challenges that come up when using DCAR as a radar antenna to find the targets are described.
2.1. Signal Model and Beam Pattern Function
Consider a basic DCAR configuration, as shown in Figure 1. The system comprises Q same configured subarrays (N-element uniform linear array).
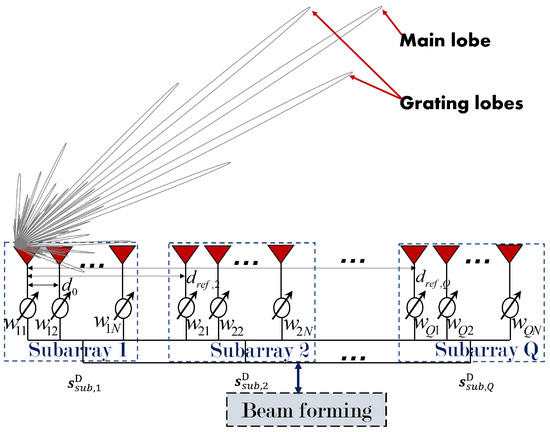
Figure 1.
DCAR configuration and beam pattern.
Assuming each array element is of equal-amplitude feed in the same initial phase and the system satisfies the far-field condition [34,35]. There is a target of interest in the detection area, and its angle relative to the i- subarray reference point (the first array element is taken as the reference point) is . For individual subarrays, the steering vector of the subarray can be expressed as
where represents the n- element inner-array phase difference of the subarray. is the operating wavelength of DCAR, is the space between the subarray and represents the matrix transposition.
Considering all subarrays as one distributed system in a unified manner, then the steering vector of the i- subarray is represented as
where denotes the distance between the reference element of the first subarray and the distributed system reference element. Here, we choose the first element of the first subarray as the reference element of the DCAR.
Then, the steering vector of the DCAR can be represented as
where represents the inter-array phase difference of the i- subarray and ‘⊗’ represents the Kronecker product [23]. and denote the inter-array steering vector and the inner-array steering vector, respectively.
The beam pattern function for the direction can be expressed as [36,37,38]
where represents the DCAR steering vector with angles for beamforming and H represents conjugate transposition operation. , represent the inter-array beam pattern and the inner sub-array beam pattern, respectively.
2.2. Grating Lobes Distribution Characteristics
Figure 2 shows the DCAR pattern graphs for uniform inter-array spacing and random non-uniform inter-array spacing, as well as the subarray pattern graphs and inter-array pattern graphs.
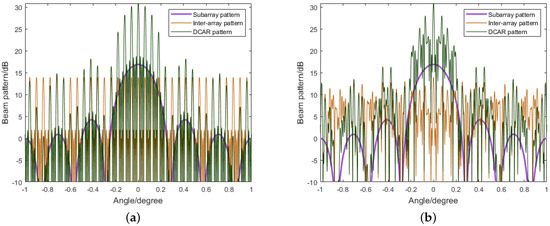
Figure 2.
DCAR pattern, subarray pattern, and inter-array pattern graphs: (a) Uniform spacing DCAR; and (b) non-uniform spacing DCAR.
Figure 2’s results allow us to observe that the DCAR’s pattern graph is the product of the inter-array pattern and the subarray pattern. The distribution of grating lobes in DCAR with uniform inter-array spacing is regular, and a mathematical equation is available to determine the distribution. Mathematical derivations can also prove that the number, power gain, and distribution interval sinusoidal properties of DCAR grating lobes with uniform inter-array hardly vary with the beam scan angle bias (see Appendix A). If we want to exploit the energy of the grating lobes to improve the search efficiency, then it is more appropriate to choose DCAR with uniform inter-array spacing.
The DCAR grating lobes distribution characteristics are mainly determined by the inter-array pattern function. The role of the subarray is like a filter to give different compound gains at a different angle to the inter-array pattern function. In DCAR, only the grating lobes within the subarray pattern’s main lobe need to be considered.
Let us assume that the inter-array spacing is all . Taking the two-norm operation of (4) and normalizing it, we can determine the power gain of the formed beam at a different angle as
where the former term in (5) represents the pattern gain function of inter-array, and the latter term is the pattern gain function of the sub-array. Denote the two terms as and , respectively.
Firstly, we investigate the original grating lobes’ distribution in the inter-array pattern gain function. Mathematically, is a periodic function in the range with period . The maximum value of appears periodically [39] as the following expression
The main lobe maximum appears at , and we can have
where represents the main lobe angle.
When m takes other non-zero integer values, the angular position where the grating appears can be obtained as
where the subscript represents for ‘grating lobe’. represents a half of the grating lobes number, and represents the round-up operation.
The DCAR grating lobes appear at the same angles as the grating lobes in the inter-array pattern function. However, the number of grating lobes becomes less, and the grating lobes only appear within the width of the sub-array on both sides of the DCAR main lobe.
where denotes the width of the subarray main lobe.
The power gain value at the grating lobe is
2.3. DCAR Searching Efficiency
2.3.1. DCAR Target Searching Process Using Only the Main Lobe
By adjusting the weights , array radar systems could change the direction of the beam to . Therefore, the searching process can be completed using beamforming operation. Before the searching is performed, the first task is beam scheduling [40,41], which performs an effective energy coverage of the search area.
Considering the searching problem in Figure 3, is the beamwidth and is the angle range to be searched. Then, the number of beams to cover the range can be approximately calculated by
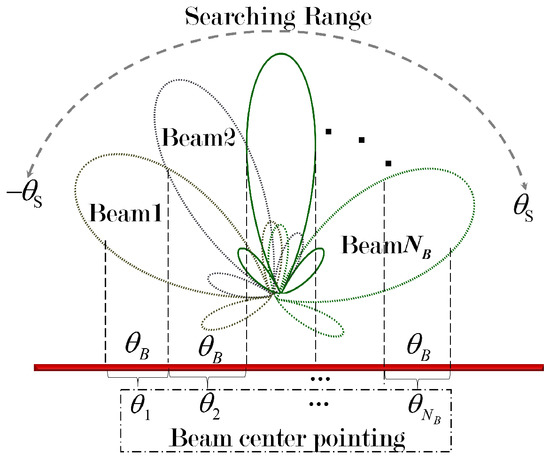
Figure 3.
Target searching and beam scheduling.
Denote as the transmit beam scheduling result,
The process of beam searching can be performed by calculating the vector of weights corresponding to the beam center pointing separately.
The power gain of the formed beam at is
where represents the scanning beam center pointing of .
The receiving search can use the same beam scheduled result as the transmission, then there is no need to perform the weight calculation operation again. In contrast to transmitting beamforming, receiving beamforming can also use a narrower search interval to mitigate the gain loss. Denote the receiving beam scheduling as , then the power gain of the receiving beam at is
After the receiving beamforming, signal processes including pulse compression and pulse doppler are applied to enhance the target’s signal-to-noise ratio (SNR) and suppress the interference and clutter. The main remaining task is to determine whether the target exists. If there is a target, we also need to obtain estimations of the parameters. Range information can be obtained by detecting the echo data in the fast time dimension. Velocity information can be obtained by Doppler filtering or transforming in the slow time dimension. The target angle information can be obtained by the sum and difference beam. In array signal processing, the target angle information can also be obtained by DOA spectrum estimation method. DOA estimation can be achieved [42] by finding the location of the peak in the power-angle spectrum
2.3.2. Low-Efficiency Challenges of Conventional Single Main Lobe Search in DCAR
In DCAR, the energy is diffusely distributed in a very narrow main lobe and grating lobes. The main-lobe-only search approach is much less effective. We give three metrics to measure the search efficiency to evaluate the limits of the main lobe search approach. These metrics are the energy utilization ratio, the number of search beams, and the search time.
When performing the transmit and receive search, the basic unit for searching is a beam. Within the coverage of this beam, the radar can accomplish the search task with an energy loss of no less than 1.5 db or 3 db. Areas beyond the beam will be covered by other scheduled beams. In this case, the effective energy of the search beam is only within the area of a single main lobe beam. The energy utilization [16] of this search can be defined as
where represents the current beam center pointing, represents the pattern beamwidth, and represents the angle range of beam pattern.
The energy utilization ratio under different cases can be obtained by simulations with statistical calculations. Here, we compare the energy utilization ratio of a single subarray (eight array elements ULA with spacing), and a DCAR with an inter-array spacing of , DCAR (five sub-arrays) with an inter-array spacing of , and DCAR with an inter-array spacing of , as shown in Table 1.

Table 1.
The energy utilization ratio under different cases.
As can be noticed, the main lobe’s decreased energy leads to a decline in the DCAR’s energy utilization ratio. The greater the DCAR aperture relation to the wavelength is, the larger the energy utilization ratio becomes.
We can also measure the search efficiency of DCAR by the number of search beams and the search time required to complete the search task. Table 2 shows the number of search beams and search time of various DCARs for the area of in contrast to the search of a single subarray.

Table 2.
The search beams and search time under different cases.
Table 2 shows that the DCAR appears to be completely ineffective for search tasks without using grating lobes. Even using 3 dB power interleaving, it takes over 10 s for DCAR to complete the search of a 120 degree range. This means that in tracking with the searching (TWS) mode of the array radar, the target data update rate is at least 10 s. Obviously, this rate is not possible to accept in engineering. Therefore, employing a single main lobe for searching in DCAR is inefficient. A fresh, effective search technique must be proposed.
3. DCAR Efficient Search Method with Grating Lobe Exploitation
In this section, we describe the GLE search method for DCAR and the multi-frequency coherent DOA ambiguous-solving method. We first provide a method for using GLE in receiving search, which can address the DCAR inefficiency issue. Moreover, it is feasible to transmit and receive an electromagnetic wave signal using the same DCAR antenna. In Section 3.2, we provide a strategy for ambiguity-solving by employing several frequencies because there is DOA ambiguity at a single frequency. Using transceiver multi-frequency operating and the sliding window averaging approach, we resolve the ambiguous DOA described in Section 3.2. In Section 3.3, we investigate the beam migration issue of the grating lobe searching target and achieve coherent multi-frequency integration in the GLE search.
3.1. DCAR Transceiver Search Method with GLE
Three main issues with GLE search need to be resolved: how to employ the grating lobes in the DCAR search; how to distinguish whether the target is searched by the main lobe or the grating lobe; and how to accurately estimate the target’s angle.
Firstly, we provide a brief overview of how to utilize grating lobes in transmitting. Due to the uniformly sparse inter-array DCAR’s regular distribution of the grating lobes, the effectiveness of the transmitting search will improve if the grating lobes are employed for search. Figure 4 demonstrates how to simultaneously search with grating lobes. As can be observed, a GLE search only needs three beamforming operations at three beam points to finish the target area’s search, but a main lobe search needs fifteen scans.
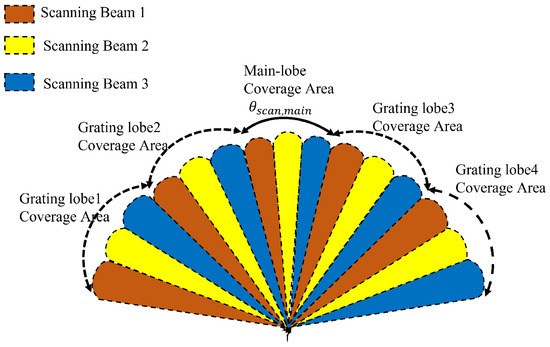
Figure 4.
GLE searching beam power coverage.
Since the beams are periodically repeated in the inter-array pattern, the DCAR search can be decomposed into two steps, namely inter-array and intra-array search for simplicity. The intra-array search provides a rough coverage of the search area with the wide beams of the subarray. In this step, we calculate the inter-array search weight vectors corresponding to . Different subarrays share the same set of weight vectors. Then, we search with the narrow inter-array beam in the range of the wide beam. The inter-array weights are solved for as shown in Figure 5. The same inter-array search weights can be used for different subarray wide beam pointings. Importantly, if we need to point out that what we call step-by-step here actually refers to a fast beamforming weight calculation method, rather than a real scanning process.
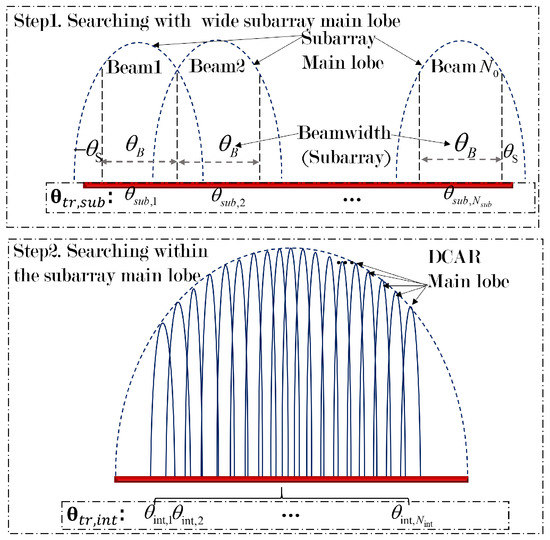
Figure 5.
DCAR two-step search process illustration.
In GLE search, what is modified is the beam adjusting process in the second step for the inter-array. The search range of the main lobe in GLE is no longer the whole wide main lobe of the subarray, instead, we only need to search for the range . The rest area will be covered by the grating lobes.
Denote as the transmit beam scheduling result from the GLE search
where represents the main lobe scanning beam center pointing, .
When the main lobe is pointing at the n-th arranged beam position , the grating lobes will point at as illustrated in Figure 6.
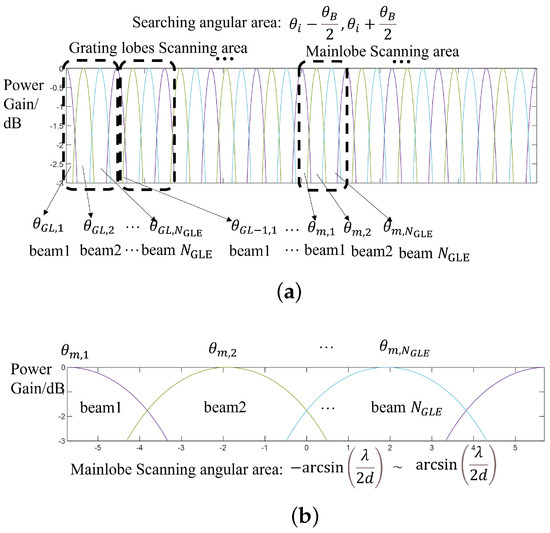
Figure 6.
GLE scanning: (a) main lobe searching area power gain; and (b) searching area power gain (including main lobe and grating lobes).
The transmitting GLE search process can be described as calculating the vector of weights corresponding to the pointing of the beam center pointing separately, and carrying out the transmitting DBF [43] weight to complete the search process. The specific execution process can be found in the procedure given in Algorithm 1.
Receiving must take into account the resolution and identification of the target that the grating is searching for, where, unlike in transmitting, power coverage is simply taken into account. Targets searched by the grating lobes would ordinarily be suppressed as interference. This issue arises because, historically, we have assumed that a single search equates to a single target. It is vital to recognize this situation and obtain the real angle estimate of the target since the GLE search may search for several targets that are not in the main lobe.
Let us assume that a signal processing method exists to identify the case of the grating search target and that the angular information can be correctly estimated, which is the focus of the next section. Then, the GLE search at receiving is performed in almost the same way as at transmitting. A smaller beam hop can also be selected during receiving process to avoid the power gain loss at the non-beam center area as described in Section 2.3.1.
| Algorithm 1: Transmitting Grating Lobes Searching Method |
|
In this scenario, the weight vector upon receiving DBF needs to be recalculated.
The receiving GLE search process at a single frequency can be described using the following algorithmic flow. The process of target detection and parameter estimation is described in the later sections.
| Algorithm 2: Transceiving GLE Search Signal Processing Method (Without DOA ambiguity Solving) |
|
3.2. Unambiguous DOA Estimation Method for Objectives with GLE Search
The principle of multi-frequency DOA ambiguity-solving is similar to multi-frequency Doppler ambiguity-solving or communication delay ambiguity solving [44]. Assuming that the frequencies are and the frequency varies with pulses periodically repeated. The received data are noted as , where is a multi-dimensional matrix corresponding to the pulse frequency, array element, and range cell, respectively. The data matrix format is shown in Figure 7, where the data at each frequency are noted as , and .
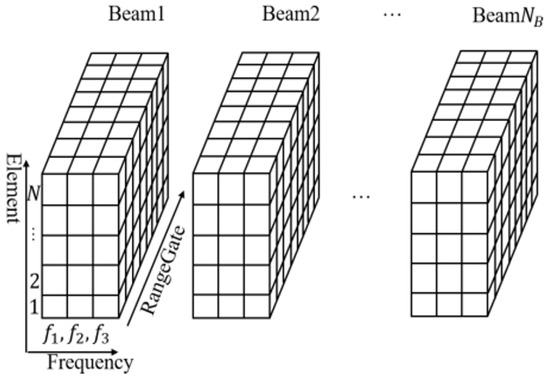
Figure 7.
Data matrix format.
The ambiguous DOA estimations are obtained by performing DBF scanning on the received data. The specific process is performing beamforming at multiple receiving angles, as shown in (17) of the multi-channel data for each scanning beam, each frequency, and each range cell of the received data. Multi-dimensional search detection of the beamforming results in the range estimate and ambiguous DOA estimate of the target at each frequency being obtained.
If the target range between pulses has no migration within a coherent processing interval (CPI), then the range estimates at each frequency are equal. The transmitting scanning beam position can be obtained from DOA estimates. If the scheduling of the scanning beam upon receiving is the same as at transmission, then the DOA estimates will be equal to the corresponding beam center angle in . It is also possible to receive with a narrower angular interval for a more accurate DOA estimate. DOA ambiguity-solving must obtain the most accurate ambiguous DOA values possible. This will directly affect the accuracy of the final DOA estimation.
Extending the ambiguous DOA to the range according to the ambiguity period to obtain all possible DOA value sequences, represents the current subarray wide beam pointing, and represents the subarray wide beam width
where , is equal to the angular difference between two neighboring lobes of the sparse inter-array pattern at frequency.
Set all the possible DOA sequences into a vector and rearrange them in ascending or descending order. Perform a sliding window process with a length of I to vector . Denote the DOA set of sliding window detection as and calculate the mean of . Take the sum of the absolute value of the difference between each element in and the DOA set mean as the judgment factor,
Figure 8 illustrates the process of multi-frequency sliding window averaging ambiguity-solving. After performing sliding window averaging on the vector , we can obtain the actual DOA set of the different frequencies by finding the smallest judgment factor . Take the mean value of this DOA set as the ambiguity-solved DOA estimation, .
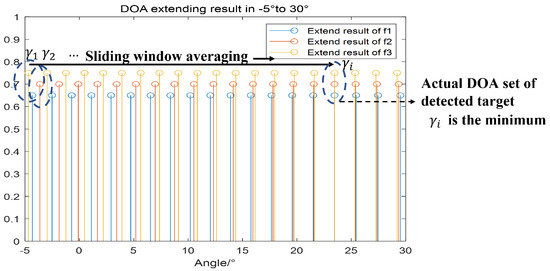
Figure 8.
Sliding window averaging for ambiguity solving.
The minimum judgment factor of the real DOA set should be equal to 0 in the ideal situation. However, the ambiguous DOA obtained from parameter estimation is the beam pointing angle with the smallest angular spectrum value. The angular spectrum calculation is only performed at a finite number of scanning beam positions. Therefore, the DOA is usually with errors. In addition, the ambiguity period is an irrational value, and the ambiguity period is also with errors in practical operation. Thus, the judgement factor is not equal to 0, which is why the method mentioned earlier is used instead of directly using the mathematical solution when performing DOA ambiguity-solving.
The sliding window averaging ambiguity-solving process can be described using the following algorithmic procedure.
| Algorithm 3: Multi−Frequency Sliding Window Averaging Ambiguity-Solving |
|
3.3. Multi-Frequency Coherent Integration with GLE Search
Multi-pulse integration is an important processing method in radar signal processing. The basic principle is summing multiple pulses to improve the SNR by exploiting the property that the target signal is correlated between pulses and that the SNR is not. Since the signal representation is complex and the system operating parameters between pulses may differ, the signal phase between pulses may differ. If the pulses are summed in the same phase, the integration is called coherent integration [45] and can obtain the maximum SNR improvement. If only summing the pulse amplitude without considering the phase information, the integration is called non-coherent integration.
The signal phase in GLE search is more complex than the traditional multi-pulse coherent integration scenario. For the targets in the main lobe scanning area, the ambiguous DOAs are the same, which means that they are scanned at the same scanning beam in GLE search. However, the targets in the grating lobe scanning area are not scanned at the same scanning beam position in GLE search due to the different distribution of the grating lobes at different frequencies. In other words, the target in the grating lobe scanning area has a situation similar to the inter-pulse beam migration, which needs to be considered for coherent integration.
The array manifold of the DCAR at different frequencies is
where and represents the time delay of the reference element.
First, integrate the multiple channel signal within the single pulse. The receiving DBF is performed along the element dimension, and the weights use the transmitting DBF weights (for equal transmission and receiving a scanning beam). When the integration of multiple-frequency data between pulses is not considered, parameter estimation can be roughly described as searching along the range dimension to obtain the range estimation, and searching along the beam dimension to obtain the DOA estimation.
The target signal of each i- frequency after DBF can be expressed as
where represents the complex envelope signal of the target echo, . According to the array signal theory, is valid when the detection signal satisfies the narrow-band condition. represents the amplitude gain of the target signal after receiving and transmitting DBF, and we assume that the receiving scanning beam scheduling is the same as the transmission.
Writing all target signals of all frequencies after DBF in vector form, we have
More SNR gain can be obtained by summing multiple pulses, as shown in Figure 9. Taking the target in the main lobe scanning area as an example, the SNR gain can be utilized when summing the data at three frequencies. The result of the coherent summation of is
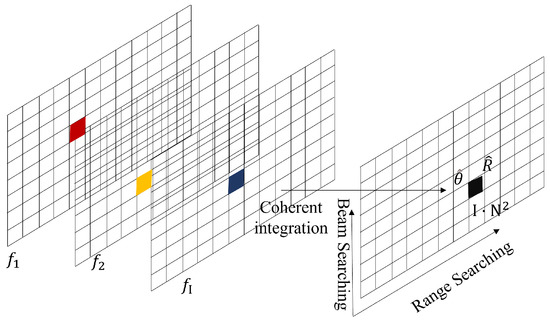
Figure 9.
Main lobe scanning target coherent integration.
is not easily available in practical signal processing, so the coherent weight vector shown in (24) is unlikely to be available in practical applications. However, if the frequency is uniformly stepped, then the phase difference between frequencies is also uniform. The multi-frequency coherent integration can be accomplished by performing FFT on the data .
Its beam position after DBF at different frequencies may be different for the grating lobe scanning area target. Moreover, it is impossible to directly integrate the data without knowing the beam position (i.e., the DOA estimates) where the target is located. In this scenario, we can iterate all possible beam positions to find the actual beam position combination of the target at each frequency, as shown in Figure 10. The area covered by color in Figure 10 represents the beam position of the target.
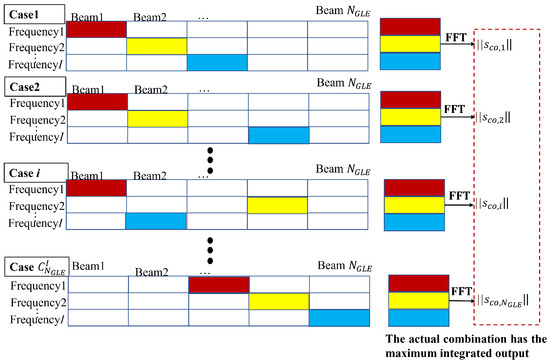
Figure 10.
Coherent integration for grating the lobe scanning target.
After determining the current beam position combination, the target’s corresponding receiving scanning beam position can also be determined. The FFT is performed on the I data identified by the current combination. Furthermore, the maximum accumulation amplitude can be obtained for the combination of the target true beam positions.
The processing of the receiving the signal with multi-frequency coherent integration in GLE search is described in the Algorithm 4.
| Algorithm 4: Receiving Signal Processing with Multi-Frequency Coherent Integration |
|
The signal power gain of a single pulse (frequency) is
where is the signal power of a single channel.
It is assumed that the noise of different pulses and different antenna elements are independent and identically distributed zero-mean Gaussian white noise. The noise power of a single channel is , then the noise after DBF is a zero-mean Gaussian with variance . The noise power gain after DBF is
In general, the signal-to-noise ratio gain that can be utilized to obtain ambiguous DOA and range estimates based on single-pulse data is
When the target is in the direction of the center of the scanned beam, the maximum SNR is achieved as
The signal-to-noise gain that can be utilized to obtain the estimates of multi-frequency coherent integration is
3.4. Multiple Target Scenarios for GLE Search Implementation Expansion
When multiple targets are simultaneously in the detection area, there will be multiple ranges and DOA estimation results after target detection. In this section, we divide the multiple targets into two scenarios, depending on how they are processed. The different colors in the figure express the different estimates of DOA obtained at different frequencies.
3.4.1. Multiple Targets in the Different Range Cell
Firstly, we discuss the multiple targets located at the different ranges of cell scenarios shown in Figure 11a. Without loss of generality, we assume the number of multi-frequencies to be 3. The detection results obtained at each frequency are
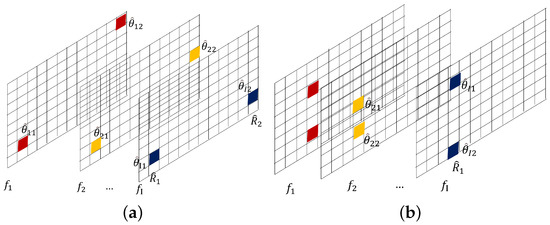
Figure 11.
Detection result of two multiple targets scenario: (a) targets in different range cells; and (b) targets in the same range cell.
Each set of ambiguous DOA estimates in the detection result corresponds to a range estimate,
According to the matching of range estimation and DOAs, we can perform the multi-frequency coherent integration and the ambiguity-solving operation separately. The signal-to-noise ratio gain in this scenario is the same as in the single-target scenario.
3.4.2. Multiple Targets in the Same Range Cell
When multiple targets are in the same range cell, it is impossible to determine the combination of multiple DOA correspondences in this detection result, i.e., the scenario shown in Figure 11b.
The detection results obtained at each frequency are
The DOA estimates that the number in the same range estimate is greater than the number of frequencies. We cannot determine the scenario of DOA combination based on the detection results of (32), which results in us being unable to perform the ambiguity-solving operation.
We can employ the multi-hypothesis [46] approach of multiple-target tracking into the multiple targets scenario to solve the problem. The process of multi-hypothesis detection consists of two parts that are consistent with the single-target scenario: multi-frequency coherent integration and multi-frequency ambiguity-solving.
Multi-frequency coherent integration for scenario B is different from scenario A. The multiple targets of each frequency after DBF can be expressed as
where M is the number of targets.
Since multiple targets exist in the same range cell, that means multiple target signals correspond to the same detection estimate . Then we can have
The signal-to-noise ratio gain in this scenario after coherent integration is
Multi-frequency ambiguity-solving for scenario B is similar to multi-hypothesis tracking (MHT). In MHT, all possible hypotheses are identified and associated with the scenario of multiple targets within each data frame in the tracking data. Only the true target association hypothesis can obtain the maximum association likelihood probability. In our problem, we can make multiple hypotheses about the DOA estimates
where is the set consisting of the DOA detected under , and ‘×’ represents the Descartes product of sets.
Then, performing the ambiguity-solving operation for each hypothesis , and obtaining the minimum set factors of the hypothesis ,
where H represents the cardinal number of H.
The true DOA combination is the combination corresponding hypotheses to the smallest M value . The number of targets in the current range cell M is equal to the maximum of , , .
The specific execution process of multiple targets is described as follows.
| Algorithm 5: Multiple Targets Multi-Frequency Coherent Integration with GLE Search |
|
4. Simulation Results
This section describes the simulation experiments using the methods proposed in this paper and presents the obtained experimental results. We refer to the DCAR configuration settings presented in paper [31,33]. Table 3 gives the specific parameter settings. In contrast to [31], the subarray size is reduced to 5. This is because excessively large-scale subarrays will affect the search efficiency in a half-wavelength spacing. All experiments and comparative analyses in this section are based on the configuration.

Table 3.
Simulation parameters value.
4.1. Search Efficiency Comparison Results
Three different search methods are considered in the search efficiency comparison, namely single subarray search (subarray orthogonal MIMO transmit), DCAR single main lobe search (conventional main lobe transmit search), and DCAR GLE search (method in this paper). Under the aforementioned DCAR parameters, the number of required beams and search time with typical search parameters for the 1.5 dB and 3 dB power interleaving scenarios are given in Table 4.

Table 4.
Simulation parameters value.
Table 4 shows that the DCAR appears to be completely ineffective for search tasks without using grating lobes. Even using 3 dB power interleaving and the each beam position continuously transmits 32 pulses, it takes approximately 20 s for DCAR to complete the search for a 120 degree range. This means that, in TWS mode, the target data update rate is at least 18 s. Obviously, this rate cannot possibly be accepted in engineering.
The search efficiency can be significantly improved to an acceptable level using grating lobes. In fact, the search efficiency is basically comparable to that of elements ULA after using the GLE search. The reason for which the GLE search efficiency is still lower than that of a single subarray is that the DCAR sampling point is 40, so even for a half-wavelength ULA, it requires at least approximately 40 search beams to complete the search task.
4.2. GLE Search Performance Simulations
The pattern characteristics of DCAR show that the peak of the main lobe is always higher than the peak of the grating lobes. Theoretically, it is possible to obtain the unambiguous angle estimate of the target by performing a dense DBF search to receive the signal processing method with the GLE transmit search. Suppose that there is a target with an original SNR of 0 dB at 2.8 degrees. Figure 12 gives the DBF search results at a search interval of 0.01 degrees as the result of the dense search. It can be seen that dense DBF search is possible to obtain unambiguous angle estimates when the SNR is sufficient for detection.
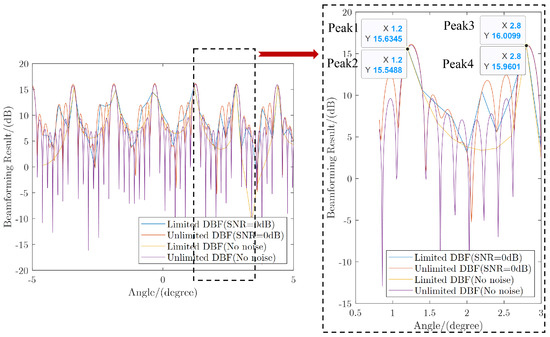
Figure 12.
DCAR configuration and beam pattern.
As shown in Section 2.1, the spatial frequency of DCAR is not uniformly and continuously sampled because of the different spacing within and between subarrays. Therefore, the fast Fourier transform is no longer available to use to complete the DBF in DCAR, and the computational requirements to complete the DBF must be considered. The DOA estimation results for the case where a dense DBF search cannot be performed are shown to the right of Figure 12. When only a limited number of non-dense DBF searches can be performed, the DBF result near the true target angle is not always the largest due to the off-center power loss of the main lobe. At certain grating angles, the DBF result may be larger than the DBF result near the true target angle. Then, the grating angle will be mistaken for the target angle, and this situation can only be treated as a false alarm. The DOA estimation using limited beamforming with a single frequency is not sufficiently robust.
The robustness can be enhanced by summing the limited times that beamforming results in multiple frequencies, as shown in [29]. The two methods will also later be used as comparison methods for the performance analysis of our method.
Here, we set the angle of the target to and the original single channel SNR to 0 dB. We perform the DBF search in one ambiguous period using our method to obtain the ambiguous DOA estimate. The DBF results at different frequencies in one ambiguous period are shown in Figure 13d. As mentioned previously, the spatial frequencies of DCAR are not uniformly or continuously distributed due to the unequal inter-array spacing. This prevents the fast implementation of the DBF using FFT. In the simulation experiments, we found that the angle estimates can be obtained by performing a two dimensional FFT after extracting and rearranging the inner array and inter array data. However, the corresponding mathematical equivalence has not yet been fully derived, so the description of this fast implementation method is not expanded in Section 3.
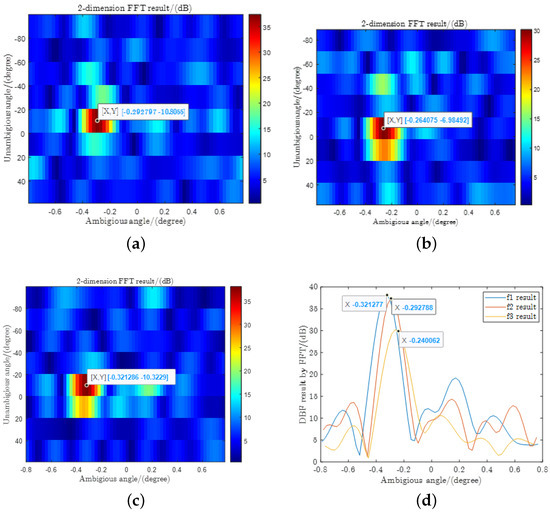
Figure 13.
Receiving DBF result (SNR = 0 dB): (a) DBF result of frequency1; (b) DBF result of frequency2; (c) DBF result of frequency3; and (d) DBF result in one ambiguous period.
By searching for the maximum value of the DBF result at each frequency, we can obtain the ambiguous DOAs of the target and extend them by the ambiguous period. The period extension results from to are shown in Figure 14a.
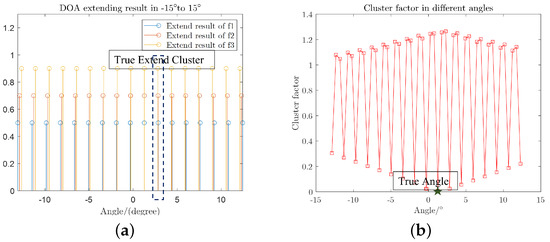
Figure 14.
DOA ambiguity solving results: (a) extension results; and (b) sliding window averaging factor.
It needs to be noted that the magnitude of DOA is not physically meaningful, and the different magnitudes are set in the figure to distinguish the extended results at different frequencies. It can be seen that the extended DOA is the closest at the true angle at . The results of Figure 14a are sliding-window-averaged, and the factor results of each set are shown in Figure 14b.
Similarly to the Doppler ambiguity-solving, a minimum of three sets of frequencies are required to solve the ambiguity. The more frequencies are used, the higher the accuracy of the ambiguity solving will be. To evaluate the DOA ambiguity solving performance of the proposed method at receiving signal processing, we perform Monte Carlo experiments to compare the unambiguous DOA estimation for targets located at under different SNR conditions. Monte Carlo experiments were performed for 5000 times. The experimental results are shown in Figure 15a. We can see that the non dense DBF search method using only the main lobe is relatively less robust. The estimation error rate after solving ambiguity for the target angle at is not as good as the other two methods under equitable SNR. Our method is comparable in terms of error rate under different SNR conditions. However, we only perform the DBF search within one ambiguous period, so the computational effort required is less than that of the method in [29].
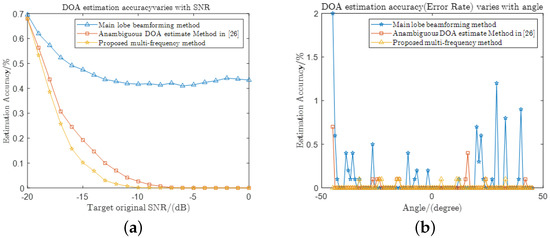
Figure 15.
DOA estimation performance: (a) different SNR; and (b) different target angle.
Different angles that the target locates also affect the ambiguity solving performance. Therefore, we performed Monte Carlo experiments for ambiguity solving under SNR sufficient (0 dB) conditions for different angles located in the range of –. The experimental results are shown in Figure 15b. It can be seen that the method using the main lobe only causes estimation errors at quite a few angles. For example, at approximately , the remaining two methods estimate almost no estimation errors. In contrast, the method using a non-dense search of the main lobe at a single frequency may suffer from more than 1% chance of incorrectly solving the ambiguity. The estimation robustness of our method at different angles can also be comparable to that of [29].
Performing parameter estimation after the coherent integration of multiple frequencies can exploit more SNR gains. The amplitude gain of the signal after coherent integration is larger than the noise. Since the transceiving DBF is not exactly the same at different frequencies, the detection result is also not exactly the same at each frequency. In order to more accurately evaluate the effect of the coherent integration on the detection performance, we conducted 5000 Monte Carlo simulation experiments at different SNRs. The correct target detection probability variation with SNR was counted, as shown in Figure 16. Due to signal’s coherent integration of three groups of frequencies, it is possible to correctly detect the target at a lower SNR. After coherent integration, it is possible to detect targets with an SNR lower of approximately 3 dB compared to the detection results of signals without the integration of single frequency.
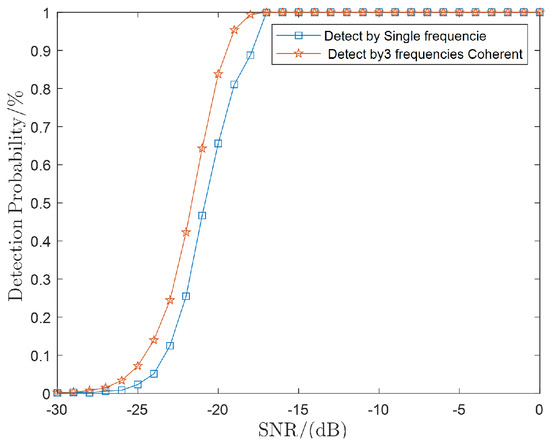
Figure 16.
Detection probability variation results with different SNR scenarios.
4.3. Multiple Targets Scenario Results
We used a multiple hypothesis approach to obtain DOA estimates for multiple targets when there are multiple targets in one range cell. The multiple hypotheses can handle the case better than extending all ambiguous DOAs and sliding window averaging when two ambiguous DOAs at the same frequency have similar period extend values. In order to compare different processing methods, we performed the following experiments.
Suppose that two targets in the same range cell have angles of −7.5° and 17.3°. Both targets have an SNR of −9 dB. The right graph in Figure 17 shows the summing of the continuous receiving DBF results for each frequency. The summing pattern was normalized in the figure. It can be seen that there are also some higher peaks at other angles except for the true angles of the two targets. These peaks are the angles where the extended values of two different targets at the same frequency are close to each other. Moreover, these peaks may bring false alarms when performing detection and affect the correct detection of the target.
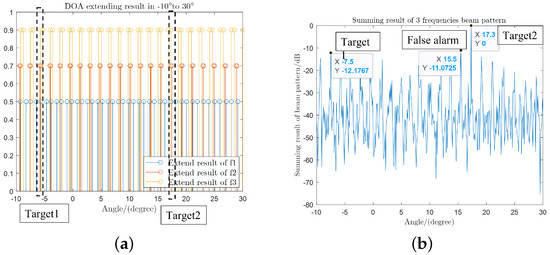
Figure 17.
Comparison of the proposed method and the method of summing DBF results: (a) DOA extending result; and (b) different frequency pattern summing result.
Figure 18 gives the results of using the multiple hypothesis approach for multiple targets. Two targets have two ambiguous DOAs at each frequency, and the number of all possible hypothesis combinations is . The ambiguity solving operation is performed for eight hypotheses; the minimum DOA set factors under eight hypotheses are shown in Figure 18a. It can be seen that the hypothesis factor corresponding to the true target is a minimum of two.
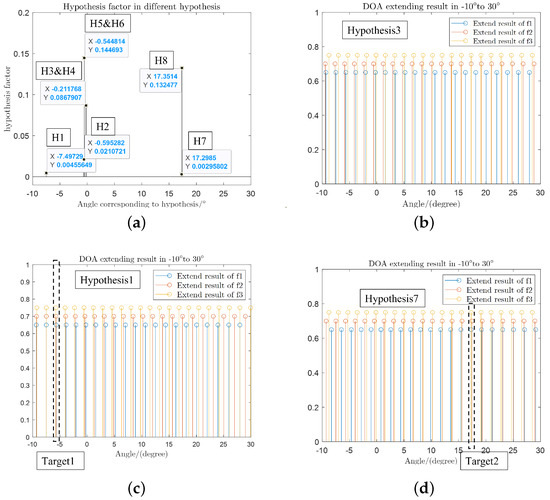
Figure 18.
Multiple hypothesis factor and extension results: (a) DOA set factors of 8 hypotheses; (b) wrong hypothesis result; (c) extension results for target 1; and (d) extension results for target 2.
The period extension results corresponding to a wrong hypothesis are given in Figure 18b, and the periodical extension results for the real hypothesis of the targets are shown in Figure 18c,d. The results for different period extensions also show that the multi-hypothesis approach avoids the situation where two targets are close to each other at the same frequency. Therefore, the accuracy of the multiple hypothesis method for multiple targets estimation will be higher than that of the method that directly performs period extension and sliding window averaging detection for all ambiguous DOAs.
5. Conclusions
DCAR has attracted more and more attention from researchers due to its excellent angular resolution and enhanced detection performance. However, the low target search efficiency of DCAR is a troubling issue. The reason for the inefficiency is that the energy is sparsely dispersed in different grating lobes. Therefore, the inefficiency problem can be alleviated if the grating lobes can be exploited for searching. Based on the accumulation of DCAR projects we worked on, we propose a method that simultaneously allows searching with multiple grating lobes and the main lobe. It is initially feasible to use DCAR to perform search tasks after grating lobe exploitation. The corresponding signal processing method is developed to accomplish the unambiguous detection and estimation of the target searched by the grating lobes. We thoroughly investigate the current methods of multi-frequency DOA disambiguation, and propose a DOA disambiguation method using sliding window clustering. Compared with the discrimination against the main lobe and the grating lobe method, we can achieve a superior performance in the DOA estimate. For the large sparse inter-array spacing, a large amount of energy is diffused into the grating lobes. Detection only using the main lobe is highly inefficient in terms of both energy utilization ratio and search time metrics. Thus, we believe that there is potential for the further study of grating lobes exploitation.
Author Contributions
Conceptualization, J.W.; methodology, J.W. and L.H.; software, J.W. and L.H.; validation, L.H., J.W. and L.Z.; formal analysis, L.H.; investigation, L.H.; resources, J.W. and L.Z.; writing—original draft preparation, L.H.; writing—review and editing, J.W., L.Z. and L.H.; supervision, J.W. and L.Z.; project administration, J.W.; funding acquisition, J.W. and L.Z. All authors have read and agreed to the published version of the manuscript.
Funding
This research was funded in part by the National Natural Science Foundation of China under Grant 61971326, Grant 62101603, in part by the Key Areas of R&D Projects in Guangdong Province under Grant 2019B111101001, in part by the introduced innovative R&D team project of “The Pearl River Talent Recruitment Program” under Grant 2019ZT08X751 and in part by Shenzhen Science and Technology Program under Grant KQTD20190929172704911.
Data Availability Statement
Not applicable.
Acknowledgments
The authors would like to thank the anonymous referees for their suggestions and comments.
Conflicts of Interest
The authors declare no conflict of interest.
Abbreviations
The following abbreviations are used in this manuscript:
| CPI | Coherent Pulse Interval |
| DCAR | Distributed Coherent Aperture Radar |
| DOA | Direction of Arrival |
| GLE | Grating Lobes Exploitation |
| MHT | Multiple Hypothesis Tracking |
| SNR | Signal-to-Noise Ratio |
| TWS | Tracking with Searching |
| ULA | Uniform Linear Array |
Appendix A. Proof of Uniformly Inter-Array Spacing DCAR Grating Lobes Characteristic
Appendix A.1. Invariance of the Grating Lobes Interval Sine Value with Search Angle Bias
As can be concluded from Equation (7), the grating lobes spacing only depends on the inter-array configuration (inter-array beam pattern).
The pattern expression between arrays when there is no scan bias is
The distribution angles of the grating lobes are determined by
The grating lobes are symmetrically distributed about the main lobe on both sides. Based on the absolute value of k, the grating lobes can be called the k- order grating lobe. When k takes a negative value, the grating lobe is located on the left side of the main lobe. In this case, we call it the k- order left grating lobe. When k takes a positive value, the grating lobe is located on the right side of the main lobe. In this case, we call it the k- order right grating lobe. The angular sine of the k- order grating lobes can be solved as
Denote the grating interval as , then can be calculated by
The inter-array pattern when the scan angle bias occurs is
The distribution angles of the grating lobes are determined by
The angular sine of the k- order grating lobes can be solved as
The grating lobes interval sine value is solved to remain as . It can be determined that the grating lobes spacing do not change with the change of scanning angle.
Appendix A.2. Invariance of the Grating Lobes Number with Search Angle Bias
The number of grating lobes is determined by the grating lobes interval and the main lobe width of the subarray pattern.
The pattern expression of the subarray when there is no scan bias is
The sinusoidal boundary on both sides of the main lobe using the half-power broad-band as the bandwidth satisfies
There is no closed form solution for the above equation and we must either use approximations that are good enough for specific requirements, or resort to a numerical simulation method. The approximate solution to the above equation is given by
From 1, the sine of the grating lobe interval is , so the number of grating lobes is
When the scan angle bias occurs, the same half-power bandwidth is used, and the sinusoidal boundaries on both sides of the main lobe at this time satisfy
The boundary values on both sides of the main lobe can be determined as
It can be seen that the sinusoidal width of the main lobe does not change, so the number of grating lobes does not change with the scanning angle.
Appendix A.3. Invariance of the Grating Lobes Interval Sine Value with Search Angle Bias
The gain of the k- order grating lobes when there is no scan bias can be expressed as
When the scan angle bias occurs, the DCAR beam pattern is shifted by in sinusoidal space. At this point, the main lobe is pointing at and k- order grating lobes are pointing at .
The gain of the k-th order grating lobes when the scan angle bias occurs can be expressed as
Therefore, it can be proven that the scan angle bias does not affect the power gain at the grating lobes.
References
- Coutts, S.; Cuomo, K.; McHarg, J.; Robey, F.; Weikle, D. Distributed coherent aperture measurements for next generation BMD radar. In Proceedings of the IEEE Workshop on Sensor Array & Multichannel Processing, Waltham, MA, USA, 12–14 July 2006; pp. 390–393. [Google Scholar]
- Djerf, P.; Tornazakis, I. Development of a Distributed Digital Array Radar. Master’s Thesis, Naval Postgraduate School, Monterey, CA, USA, 2008. [Google Scholar]
- Gao, H.W.; Cao, Z.; Lu, Y.B.; Wang, P.X. Development of distributed aperture coherence-synthetic radar technology. In Proceedings of the IET International Radar Conference, Xi’an, China, 14–16 April 2013; pp. 1–6. [Google Scholar]
- Chen, B.; Yang, M.; Wang, Y.; Dang, X.; Wu, B. The applications and future of synthetic impulse and aperture radar. In Proceedings of the CIE International Conference on Radar, Guangzhou, China, 10–13 October 2016; pp. 1–5. [Google Scholar]
- Silantyev, A.B.; Golubev, A.V.; Fernandu, C.A.G.; Olim, J.S.F.; Timoshenko, A.V. Analysis of Efficiency of Long-Term Multi-Scanning Radar Observation Methods. In Proceedings of the Systems of Signal Synchronization, Generating and Processing in Telecommunications, Svetlogorsk, Russia, 1–3 July 2020; pp. 1–8. [Google Scholar]
- Lin, C. Distributed Subarray Antennas for Multifunction Phased-Array Radar. Master’s Thesis, Naval Postgraduate School, Monterey, CA, USA, 2003. [Google Scholar]
- Noris, G. Wirelessly Networks for Beamforming in Distributed Phased Array Radar. Master’s Thesis, Naval Postgraduate School, Monterey, CA, USA, 2007. [Google Scholar]
- Vincent, J.; Arnold, E. Beamforming sensitivity of airborne distributed arrays to flight tracking and vehicle dynamics. In Proceedings of the IEEE Aerospace Conference, Big Sky, MT, USA, 4–11 March 2017; pp. 1–14. [Google Scholar]
- Ghafi, K.; Ghorashi, A.; Mehrshahi, E. Reconfigurable linear antenna arrays for beam-pattern matching in collocated MIMO radars. IEEE Trans. Aerosp. Electron. Syst. 2021, 57, 2715–2724. [Google Scholar] [CrossRef]
- Miao, Y.; Liu, F.; Liu, H.; Li, H. Clutter Jamming Suppression for Airborne Distributed Coherent Aperture Radar Based on Prior Clutter Subspace Projection. Remote Sens. 2022, 14, 5912. [Google Scholar] [CrossRef]
- Liu, X.; Sun, C.; Xiang, L.; Yang, Y.; Kong, D.; Yao, Y. High-Resolution Sonar Imaging Using Sparse Transmitting and Dense Receiving Arrays. In Proceedings of the Ocean—MTS/IEEE Kobe Techno-Oceans, Kobe, Japan, 28–31 May 2018; pp. 1–6. [Google Scholar]
- Takayama, T.; Sugano, M.; Tokieda, Y.; Sugawara, H. Hybrid SIMO and MIMO sparse array radar. In Proceedings of the European Radar Conference, Nuremberg, Germany, 9–11 October 2013; pp. 25–28. [Google Scholar]
- Wu, J. Research on Robust Beamforming and Distributed Array Coherent Transmission. Master’s Thesis, Xidian University, Xi’an, China, 2020. [Google Scholar]
- Huang, J. Research on Wide-Area Distributed Array Beamforming Technology. Master’s Thesis, University of Electronic Science and Technology of China, Chengdu, China, 2022. [Google Scholar]
- Athley, F.; Engdahl, C.; Sunnergren, P. On radar detection and direction finding using sparse arrays. IEEE Trans. Aerosp. Electron. Syst. 2007, 43, 1319–1333. [Google Scholar] [CrossRef]
- Wilson, J.; Hugh, R. Sparse-periodic hybrid array beamformer. IET Radar Sonar Navig. 2007, 1, 116–123. [Google Scholar] [CrossRef]
- Goudos, S.K.; Moysiadou, V.; Samaras, T.; Siakavara, K.; Sahalos, J.N. Application of a comprehensive learning particle swarm optimizer to unequally spaced linear array synthesis with sidelobe level suppression and null control. IEEE Antennas Wirel. Propag. Lett. 2010, 9, 125–129. [Google Scholar] [CrossRef]
- Nerea, D.; David, M.M.; Maria-Pilar, J.A.; Pedro-Jose, G.; Jose-Luis, B.H.; Javier, R.S. Passive Radar Array Processing with Non-Uniform Linear Arrays for Ground Target’s Detection and Localization. Remote Sens. 2017, 9, 756. [Google Scholar]
- Nannuru, S.; Gerstoft, P.; Koochakzadeh, A.; Pal, P. Sparse Bayesian Learning for DOA Estimation Using Co-Prime and Nested Arrays. In Proceedings of the IEEE 10th Sensor Array and Multichannel Signal Processing Workshop, Sheffield, UK, 8–11 July 2018; pp. 519–523. [Google Scholar]
- He, Z.; Zhao, Z.; Yang, K.; Ouyang, J. Solving ambiguity for sparse array via particle swarm optimization. In Proceedings of the International Conference on Computational Problem-Solving, Chengdu, China, 21–23 October 2011; pp. 316–319. [Google Scholar]
- Liu, A.; Yang, Q.; Zhang, X.; Deng, W. Direction-of-arrival estimation for coprime array using compressive sensing based array interpolation. Int. J. Antennas Propag. 2017, 1, 1–10. [Google Scholar] [CrossRef]
- Weiss, A.; Gavish, M. Direction finding using ESPRIT with interpolated arrays. IEEE Trans. Signal Process. 1991, 39, 1473–1478. [Google Scholar] [CrossRef] [PubMed]
- Li, B.; Xu, B.; Yuan, Y. Preestimation-based array interpolation approach to coherent source localization using multiple sparse subarrays. IEEE Signal Process. Lett. 2009, 16, 81–84. [Google Scholar] [CrossRef]
- Liu, A.; Zhang, X.; Yang, Q.; Wu, X.; Deng, W. Combined root-MUSIC algorithms for multi-carrier MIMO radar with sparse uniform linear arrays. IET Radar Sonar Navig. 2019, 13, 89–97. [Google Scholar] [CrossRef]
- Gu, F.; Chi, L.; Zhang, Q.; Zhu, F. Single snapshot imaging method in multiple-input multiple-output radar with sparse antenna array. IET Radar Sonar Navig. 2013, 7, 535–543. [Google Scholar] [CrossRef]
- Syeda, R.Z.; Savelyev, T.G.; Van Beurden, M.C.; Smolders, A.B. Sparse MIMO Array for Improved 3D mm–Wave Imaging Radar. In Proceedings of the 17th European Radar Conference, Utrecht, The Netherlands, 13–15 January 2021; pp. 342–345. [Google Scholar]
- Zhang, S.; Ahmed, A.; Zhang, Y.D.; Sun, S. Enhanced DOA Estimation Exploiting Multi-Frequency Sparse Array. IEEE Trans. Signal Process. 2021, 69, 5935–5946. [Google Scholar] [CrossRef]
- Shunqiao, S.; Yimin, Z. Four-Dimensional High-Resolution Automotive Radar Imaging Exploiting Joint Sparse-Frequency and Sparse-Array Design. In Proceedings of the IEEE International Conference on Acoustics, Speech, and Signal Processing, Toronto, ON, Canada, 6–11 June 2021; pp. 8413–8417. [Google Scholar]
- Hersey, R.; Culpepper, E. Sub-band processing for grating lobe disambiguation in sparse arrays. In Proceedings of the SPIE Defense + Security, Baltimore, MD, USA, 5–9 May 2014; p. 90930Q. [Google Scholar]
- Huang, J.; Liu, C.; Hu, W.; Liao, K. Design of a Grating Lobes-Free Architecture for Distributed Sensor System with Arbitrary Element Spacing. Remote Sens. 2022, 14, 1356. [Google Scholar] [CrossRef]
- Zuo, Z.; Hao, M.; He, Q. An Unambiguous Angle Estimation Method Based on Multiple Subarray Division in DCAR. In Proceedings of the IEEE 5th Information Technology, Networking, Electronic and Automation Control Conference, Xi’an, China, 15–17 October 2021; pp. 1561–1565. [Google Scholar]
- Yang, X.; Xi, W.; Sun, Y.; Zeng, T.; Long, T.; Sarkar, T.K. Optimization of Subarray Partition for Large Planar Phased Array Radar Based on Weighted K-Means Clustering Method. IEEE J. Sel. Top. Signal Process. 2015, 9, 1460–1468. [Google Scholar] [CrossRef]
- Long, T.; Zhang, H.; Zeng, T.; Liu, Q.; Chen, X.; Zheng, L. High accuracy unambiguous angle estimation using multi-scale combination in distributed coherent aperture radar. IET Radar Sonar Navig. 2017, 11, 1090–1098. [Google Scholar] [CrossRef]
- Liao, K.; Yu, Z.; Xie, N.; Jiang, J. Joint Estimation of Azimuth and Distance for Far-Field Multi Targets Based on Graph Signal Processing. Remote Sens. 2022, 14, 1110. [Google Scholar] [CrossRef]
- He, J.; Shu, T.; Li, L.; Truong, T.K. Mixed near-field and far-field localization and array calibration with partly calibrated arrays. IEEE Trans. Signal Process. 2022, 70, 2105–2118. [Google Scholar] [CrossRef]
- Hansen, C. Phased Array Antennas; John Wiley & Sons Inc.: Hoboken, NJ, USA, 2009; pp. 399–464. [Google Scholar]
- Krivosheev, V.; Alexandr, S. Grating lobe suppression in phased arrays composed of identical or similar subarrays. In Proceedings of the 2010 IEEE International Symposium on Phased Array Systems and Technology, Waltham, MA, USA, 12–15 October 2010; 2010; pp. 724–730. [Google Scholar]
- Baggett, W. Optimization of Aperiodically Spaced Phased Arrays for Wideband Applications. Master’s Thesis, Virginia Polytechnic Institute and State University, Blacksburg, VA, USA, 2011. [Google Scholar]
- Van Trees, H.L. Optimum Array Processing. Part 4 of Detection Estimation and Modulation Theory; John Wiley & Sons Inc.: Hoboken, NJ, USA, 2002; pp. 46–51. [Google Scholar]
- Zou, J.; Yan, S.; Lu, L.; Shi, B.; Xu, S. A Visualization Method for Beam Position Scheduling of Phased Array Radar. In Proceedings of the IEEE 5th Information Technology, Networking, Electronic and Automation Control Conference, Chongqing, China, 12–14 March 2021; pp. 2563–2567. [Google Scholar]
- Mei, J.; Li, Y.; Hu, X. New spatial overlap method of transmitting beam for airborne phased array radar. In Proceedings of the IEEE 2nd International Conference on Signal Processing Systems, Dalian, China, 5–7 July 2010; pp. V1-268–V1-271. [Google Scholar]
- Szalay, Z.; Nagy, L. Target modeling, antenna array design and conventional beamforming algorithms for radar target DOA estimation. In Proceedings of the 17th International Conference on Transparent Optical Networks, Budapest, Hungary, 5–9 July 2015; pp. 1–4. [Google Scholar]
- Bollian, T.; Osmanoglu, B.; Rincon, R.; Lee, S.K.; Fatoyinbo, T. Adaptive Antenna Pattern Notching of Interference in Synthetic Aperture Radar Data Using Digital Beamforming. Remote Sens. 2019, 11, 1346. [Google Scholar] [CrossRef]
- Hong, M.; Xin, L.; Kun, J.; Shaojie, W. Research on delay ambiguity solving method based on Chinese Remainder Theorem. In Proceedings of the 2014 International Conference on Information, Communication Technology and System, Nanjing, China, 15–17 May 2014; pp. 1–4. [Google Scholar]
- Wang, D.; Bao, Q.; Niu, Z.; Chen, Z. Long time coherent integration method for frequency agile radar. In Proceedings of the 44th European Microwave Conference, Rome, Italy, 6–9 October 2014; pp. 1856–1859. [Google Scholar]
- Sathyan, T.; Chin, T.J.; Arulampalam, S.; Suter, D. A Multiple Hypothesis Tracker for Multitarget Tracking With Multiple Simultaneous Measurements. IEEE J. Sel. Top. Signal Process. 2013, 7, 448–460. [Google Scholar] [CrossRef]
Disclaimer/Publisher’s Note: The statements, opinions and data contained in all publications are solely those of the individual author(s) and contributor(s) and not of MDPI and/or the editor(s). MDPI and/or the editor(s) disclaim responsibility for any injury to people or property resulting from any ideas, methods, instructions or products referred to in the content. |
© 2023 by the authors. Licensee MDPI, Basel, Switzerland. This article is an open access article distributed under the terms and conditions of the Creative Commons Attribution (CC BY) license (https://creativecommons.org/licenses/by/4.0/).