1. Introduction
Weather radars have been used to observe clouds and rain since World War II. Since then, clear-air echoes have usually been observed in sunny, cloudless weather conditions. One type of scattering of interest is clear-air Bragg scattering (CABS). Specifically, it was shown that CABS could be used to assist with radar calibration and detecting the height of the convective boundary layer (CBL) because layers of clear-air Bragg scattering are usually present near the top of the CBL [
1,
2,
3]. In some cases, turbulent mixing between cloudy and drier environmental air can produce centimeter-scale variations in refractive index that can lead to strong CABS [
4].
It is known that Bragg scattering is caused by turbulent inhomogeneities with sizes around one-half of a transmitted radar wavelength [
5,
6,
7]. Due to the increase in the inner scale of turbulence with height, it is difficult to observe CABS in the X-band and even more so in the Ka-band due to their short wavelengths, which do not allow for backward scattering. Generally, Bragg scattering is observed as a layer at the top of the CBL and is mostly associated with refractivity and moisture gradients in dynamically unstable regions [
8,
9]. Turbulent mixing, penetrative convection, and detrainment/entrainment are considered the primary generation mechanisms of Bragg scattering [
10,
11].
However, the presence of CABS in the atmosphere has been overlooked for a considerable amount of time. Although turbulence-scattering mechanisms caused by turbulent inhomogeneities and biological scatterers, such as insects and birds, can dominate the scattering process of clear-air echoes, it is widely believed that insects and birds primarily cause most of the echoes [
12]. The phenomenon of insects and birds gathering into layers during flight suggests that the fine layer echo is caused by biological flight. Therefore, CABS is generally considered to occur at the top of the CBL, which limits further research and development.
Unexpectedly, through dual-frequency observations, CABS was also observed above the CBL in the morning. A dual-frequency antenna multiplexing radar system (DFAMRS), which verified the systematic bias through a metal sphere hoisted by an unmanned aerial vehicle (UAV) [
13] detected CABS that was significantly higher than CBL in the morning. Meanwhile, some large organisms were observed to float in these CABS layers. Comparison between CABS and the products of a coherent Doppler lidar (CDL) indicates that wind may be the main cause of CABS. The purpose of this paper is to introduce the relevant phenomena and deepen the understanding of CABS by proposing an expanded set of causes underlying clear-air echoes.
A brief description of DFAMRS used in this article to detect the layers of CABS is given in
Section 2, together with a short introduction to coherent Doppler Lidar (CDL), which is used to obtain the CBL. The description of the observations of CABS (
Section 3) is followed by a brief discussion about the relationship between CABS and wind (
Section 4). Finally,
Section 5 gives a summary and a plan for this work.
2. Materials and Methods
2.1. Materials
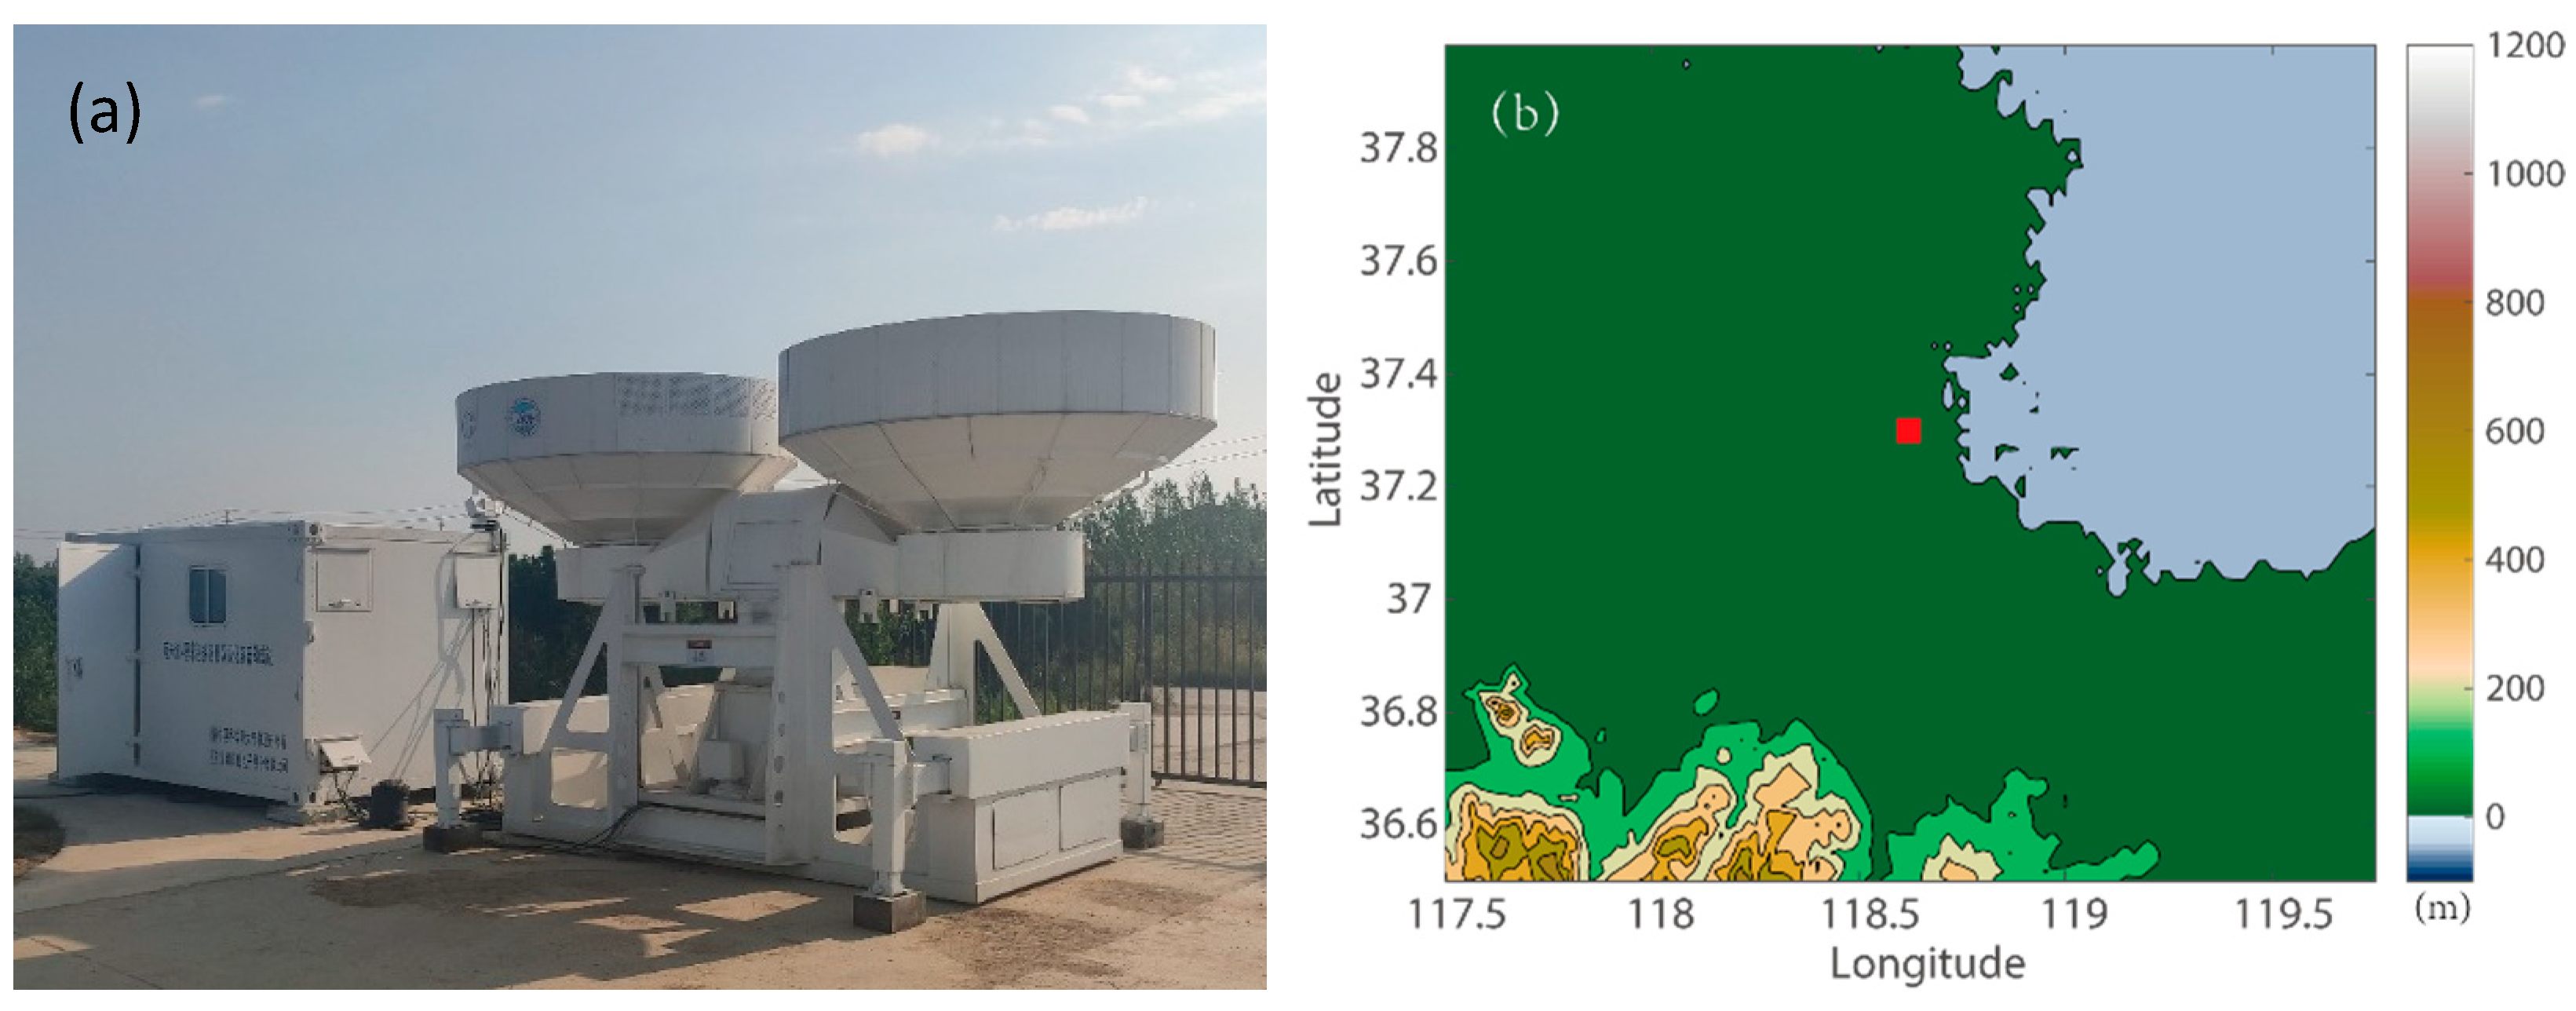
The dual-frequency antenna multiplexing radar system (DFAMRS), which was located in Dongying, Shandong as shown in
Figure 1, was designed and manufactured by Sun Create Electronics Co. and the Institute of Atmospheric Physics, Chinese Academy of Sciences. The system consists of a data-processing center and X-band and Ka-band Doppler radar with antenna multiplexing. The X-band and Ka-band are equipped with all-solid-state transmitters based on frequency-modulated continuous wave (FMCW) technology. The multiplex Cassegrain antenna can ensure the temporal and spatial consistency of radio waves of two frequencies. The detailed system characteristics of the DFAMRS are shown in
Table 1.
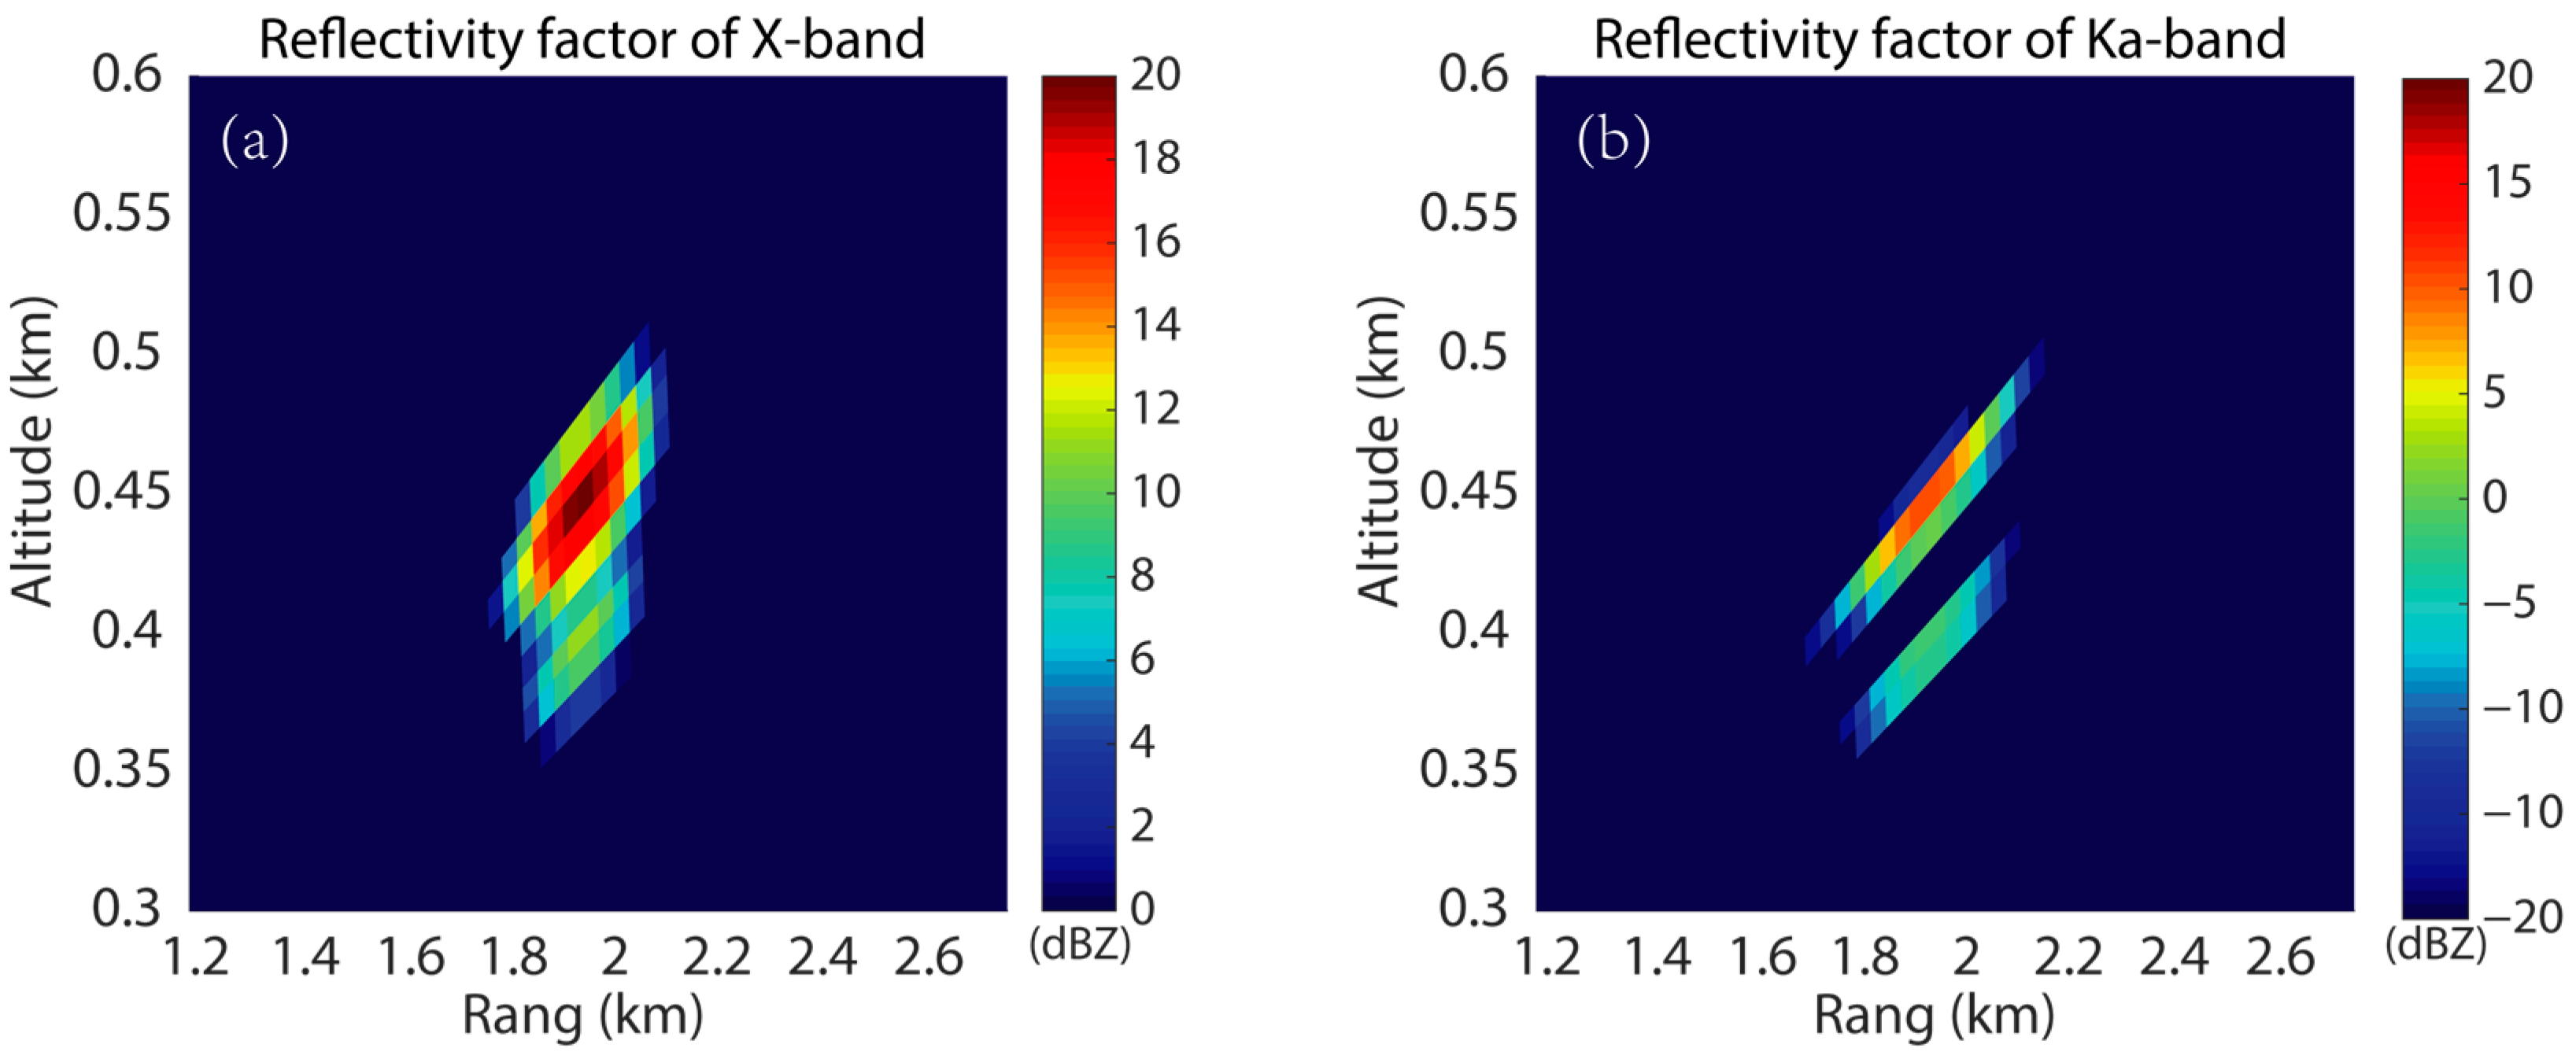
The accuracy of the reflectivity factor plays a crucial role in identifying CABS. For accurate remote-sensing data, a UAV is used to suspend a sphere for calibrating the dual-frequency antenna multiplexing radar system, as shown in
Figure 2.
The position where the maximum reflectivity factor of the Ka-band appears is taken as the position of the metal sphere because the beam width of the Ka-band is smaller than that of the S-band. The average value of seven experiments is taken as the standard value in the calibration experiment.
Figure 2.
Range–height cross-section of the reflectivity factor (unit: dBZ) at the X-band (a) and Ka-band (b) during calibration. The upper point echo is the UAV, and the lower point is the metal sphere.
Figure 2.
Range–height cross-section of the reflectivity factor (unit: dBZ) at the X-band (a) and Ka-band (b) during calibration. The upper point echo is the UAV, and the lower point is the metal sphere.
During observations of CABS, the Wind3D-6000 coherent Doppler Lidar (CDL) is used. This tool is employed in wind-measuring applications because of its high measurement accuracy and spatial resolution. The detailed specifications of the Wind3D-6000 are shown in
Table 2. The distance between the CDL and the DFAMRS was set as 1.5 km.
Lidar can be used to calculate the CBL depth. On the one hand, Lidar can identify the CBL depth as the gradient maximum of the backscattering profile [
14,
15] because the aerosol in the mixing layer is higher than that in the upper layer, which leads to a sharp gradient in the profiles of backscattering near the top of the CBL. On the other hand, vertical velocity variance can provide reliable CBL depths [
16,
17].
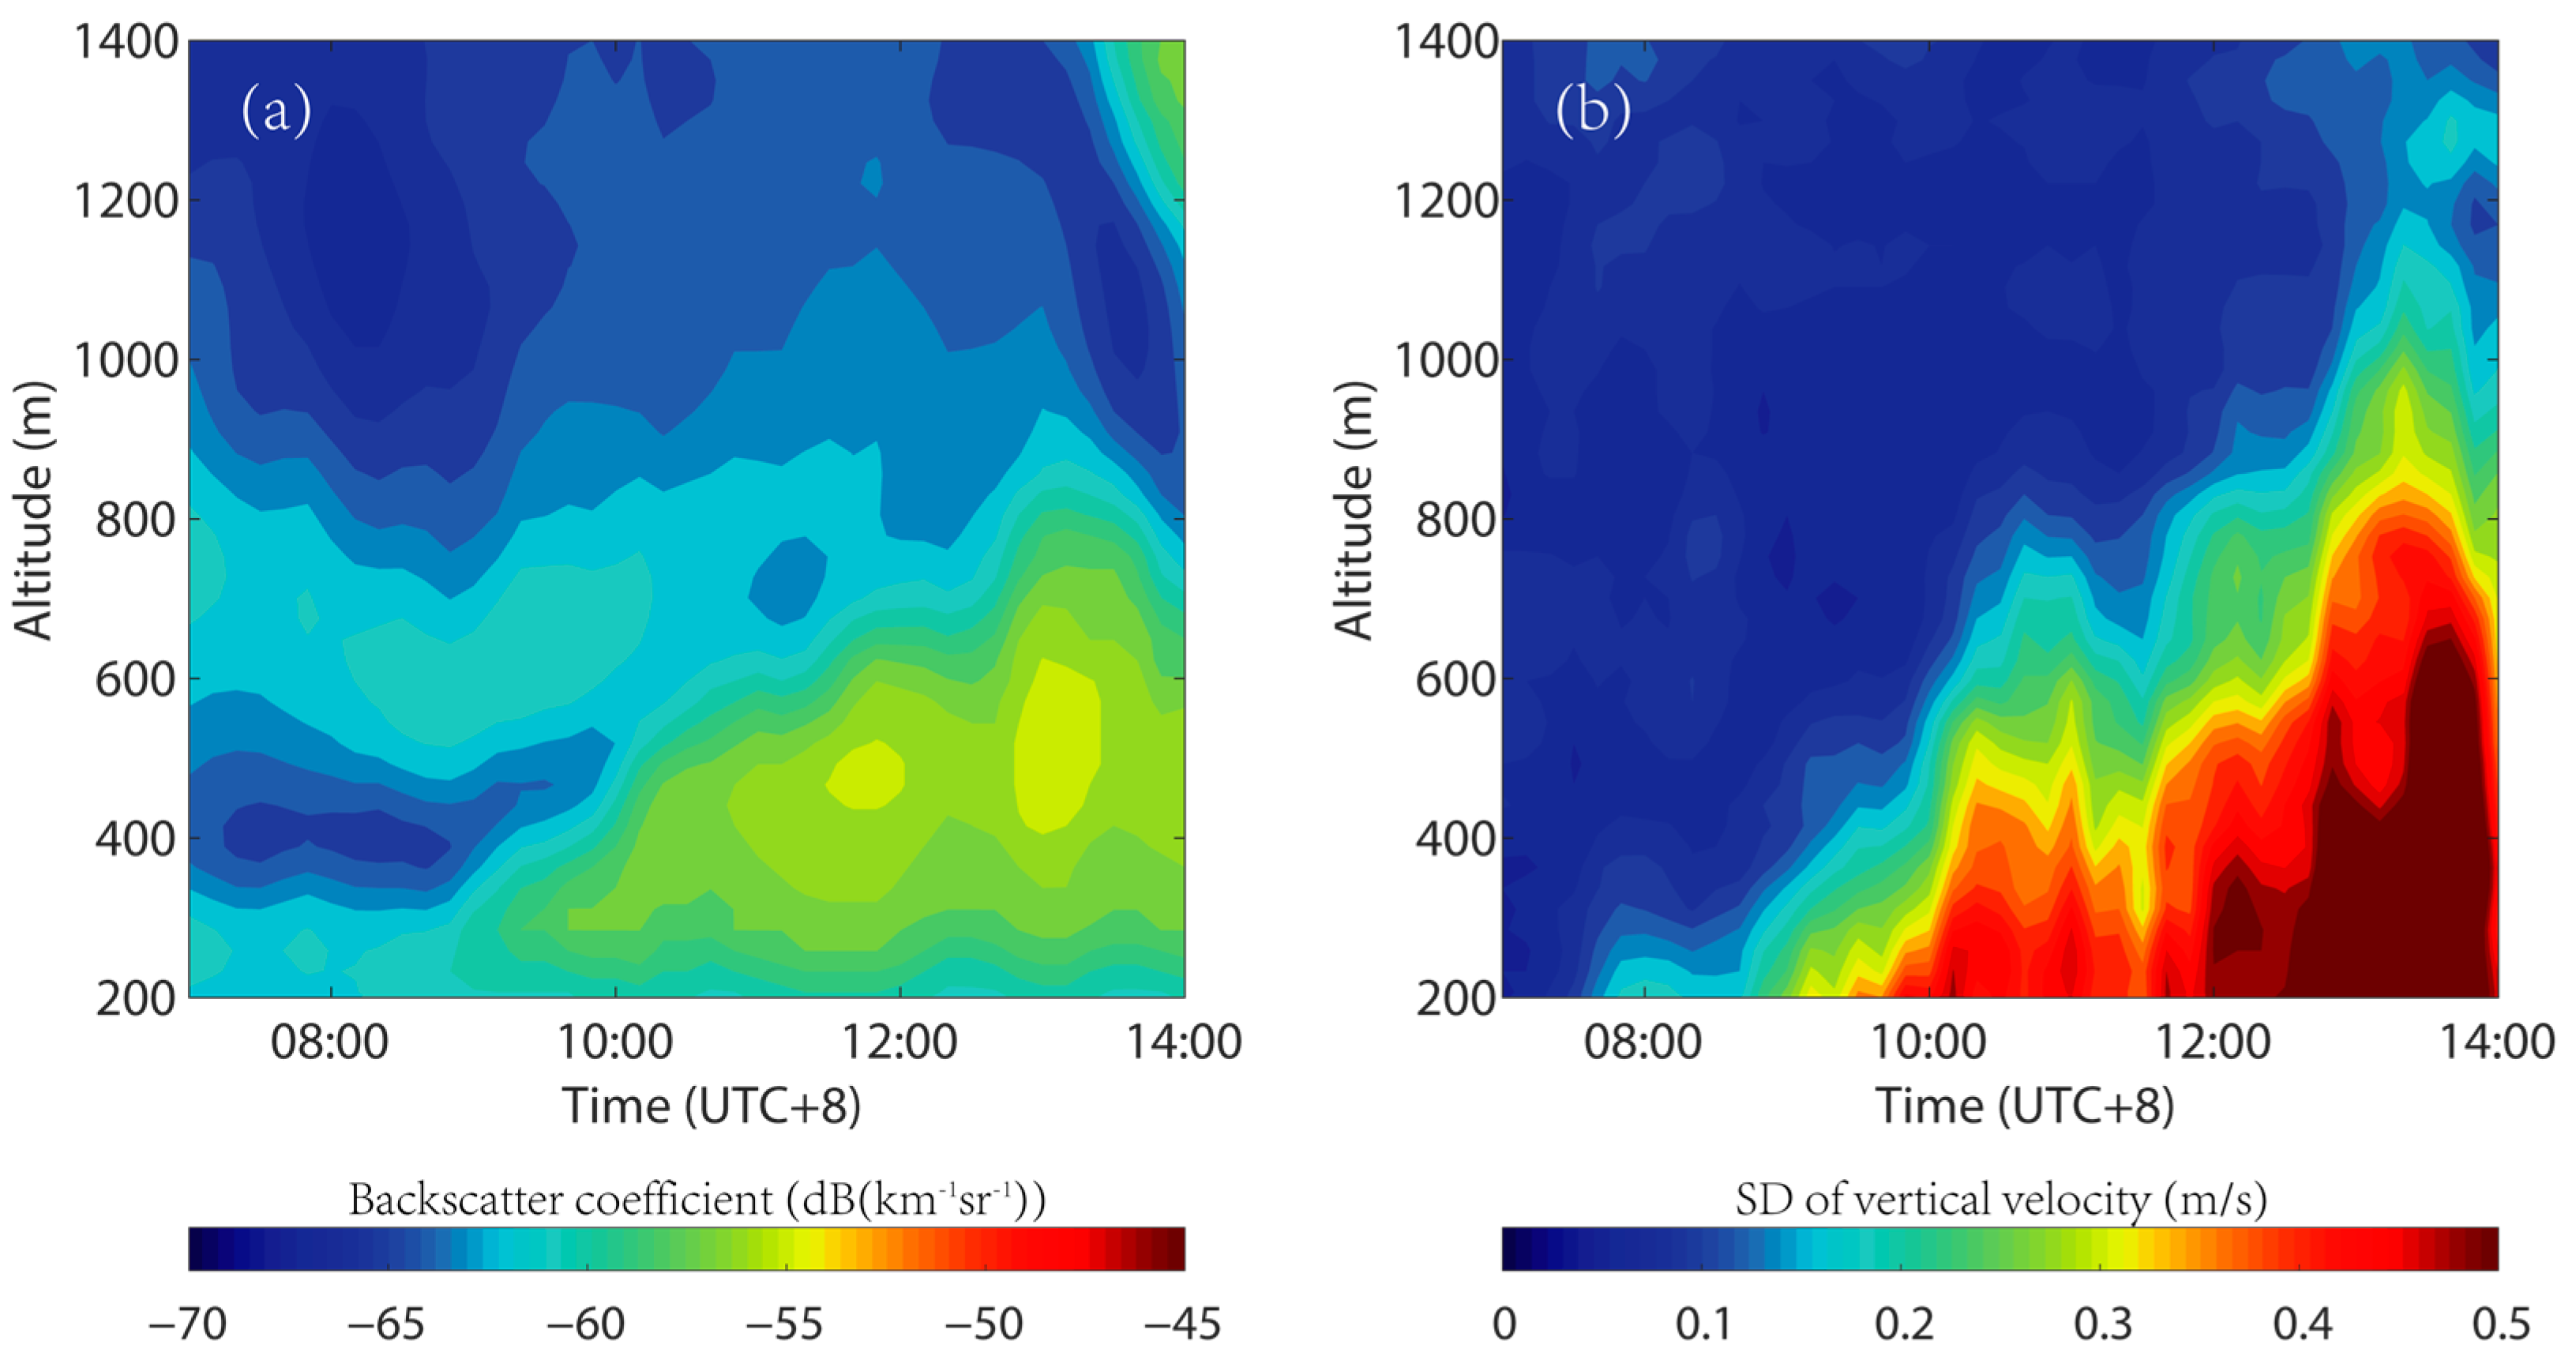
As shown in
Figure 3, the distribution of the aerosol concentration and vertical velocity standard deviation is consistent. Both the backscatter and the standard deviation of vertical velocity (SDVV) indicate the depth of CBL. Since this study is focused on the morning, the SDVV was determined to be a better indicator for the CBL to avoid the influence of aerosol transport.
2.2. Bragg Scattering
Based on the Kolmogorov–Obukhov theory, Ottersten provided CABS reflectivity’s relationship with the atmospheric structure constant of the refractive index
and radar wavelength
[
8]. The radar reflectivity
(or radar cross-section per unit volume) is given in Equation (1):
According to Equation (1), the reflectivity factor
of CABS is given in Equation (2):
where
is a dielectric constant and is often taken to be 0.9 for water and 0.2 for ice, respectively. Thus, the dual-wavelength ratio (DWR) is
It is known that biological scattering and turbulent scattering have different DWR characteristics. The DWR of Bragg scattering is dependent on radar wavelength, as shown in Equation (3). However, the DWR changes in biological scattering are unpredictable due to the complex shapes of biological elements [
6,
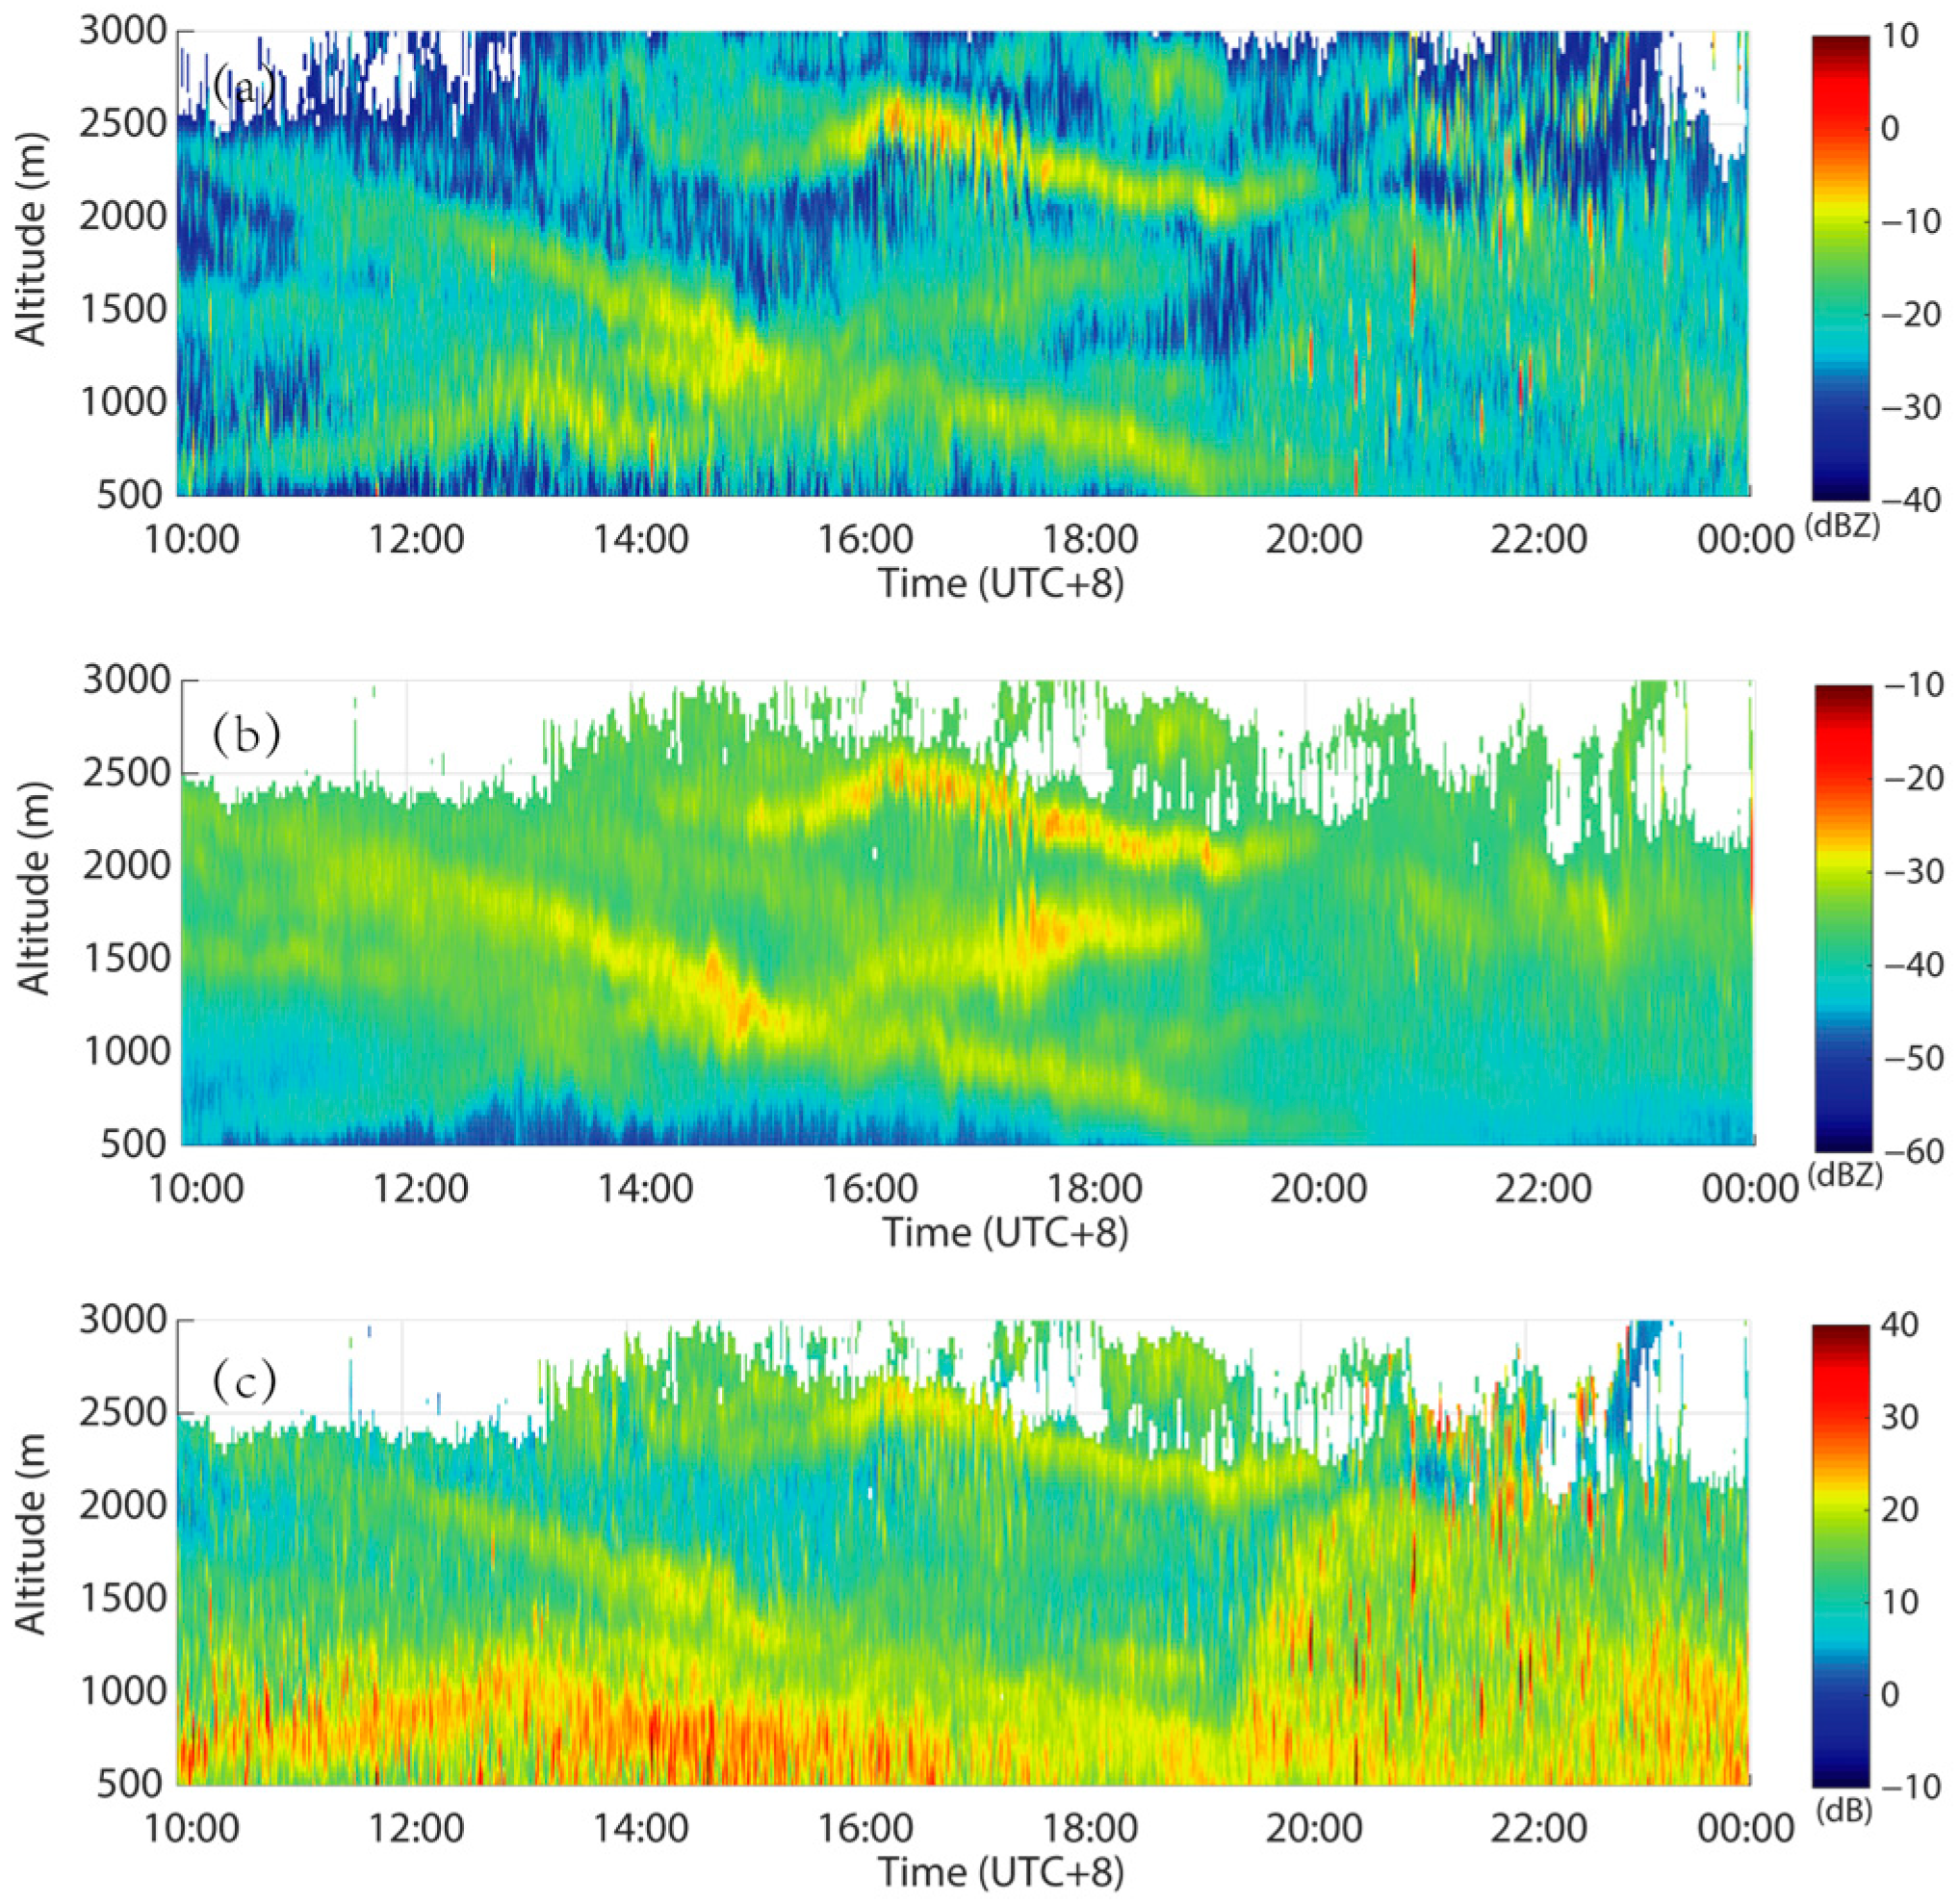
18]. Hence, the CABS can be determined by the DWR. Based on the wavelengths of DFAMRS between the X-band and Ka-band, the theoretical DWR of Bragg scattering is 20.9 dB, which is presented using the yellow pattern in
Figure 4c.
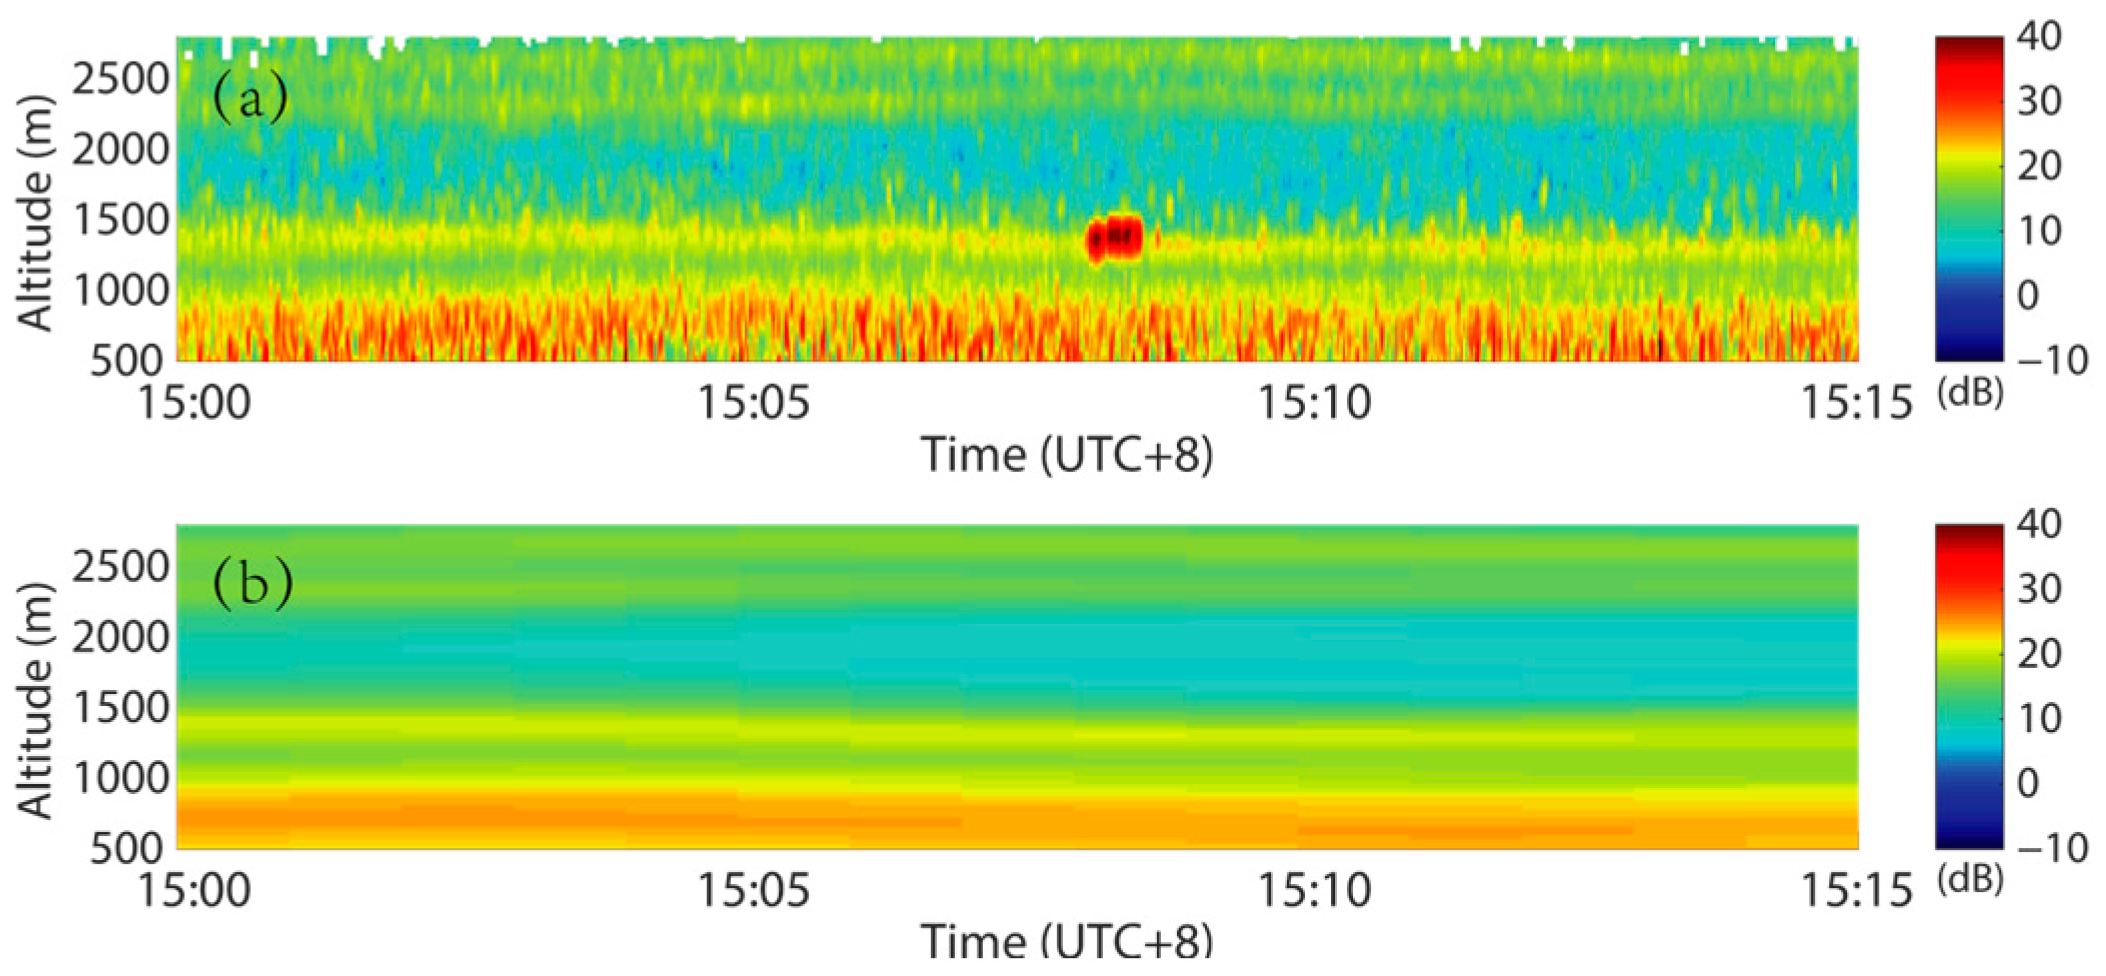
The particle scattering of atmospheric biota will affect the value of DWR, causing errors in the recognition of CABS. Therefore, preprocessing is necessary to filter point noise from organisms. DFAMRS outputs a profile of the reflectivity factor every 10 s. When biological activities are relatively modest, the radar beam cannot be filled by creatures continuously. Thus, the mode of the reflectivity factor values within 5 min is regarded as the signal without point noise because of the slow change in the meteorological signal, as shown in
Figure 5. Notably, intense biological activity will make the preprocessing invalid. Fortunately, there are few creatures above the CBL.
3. Results
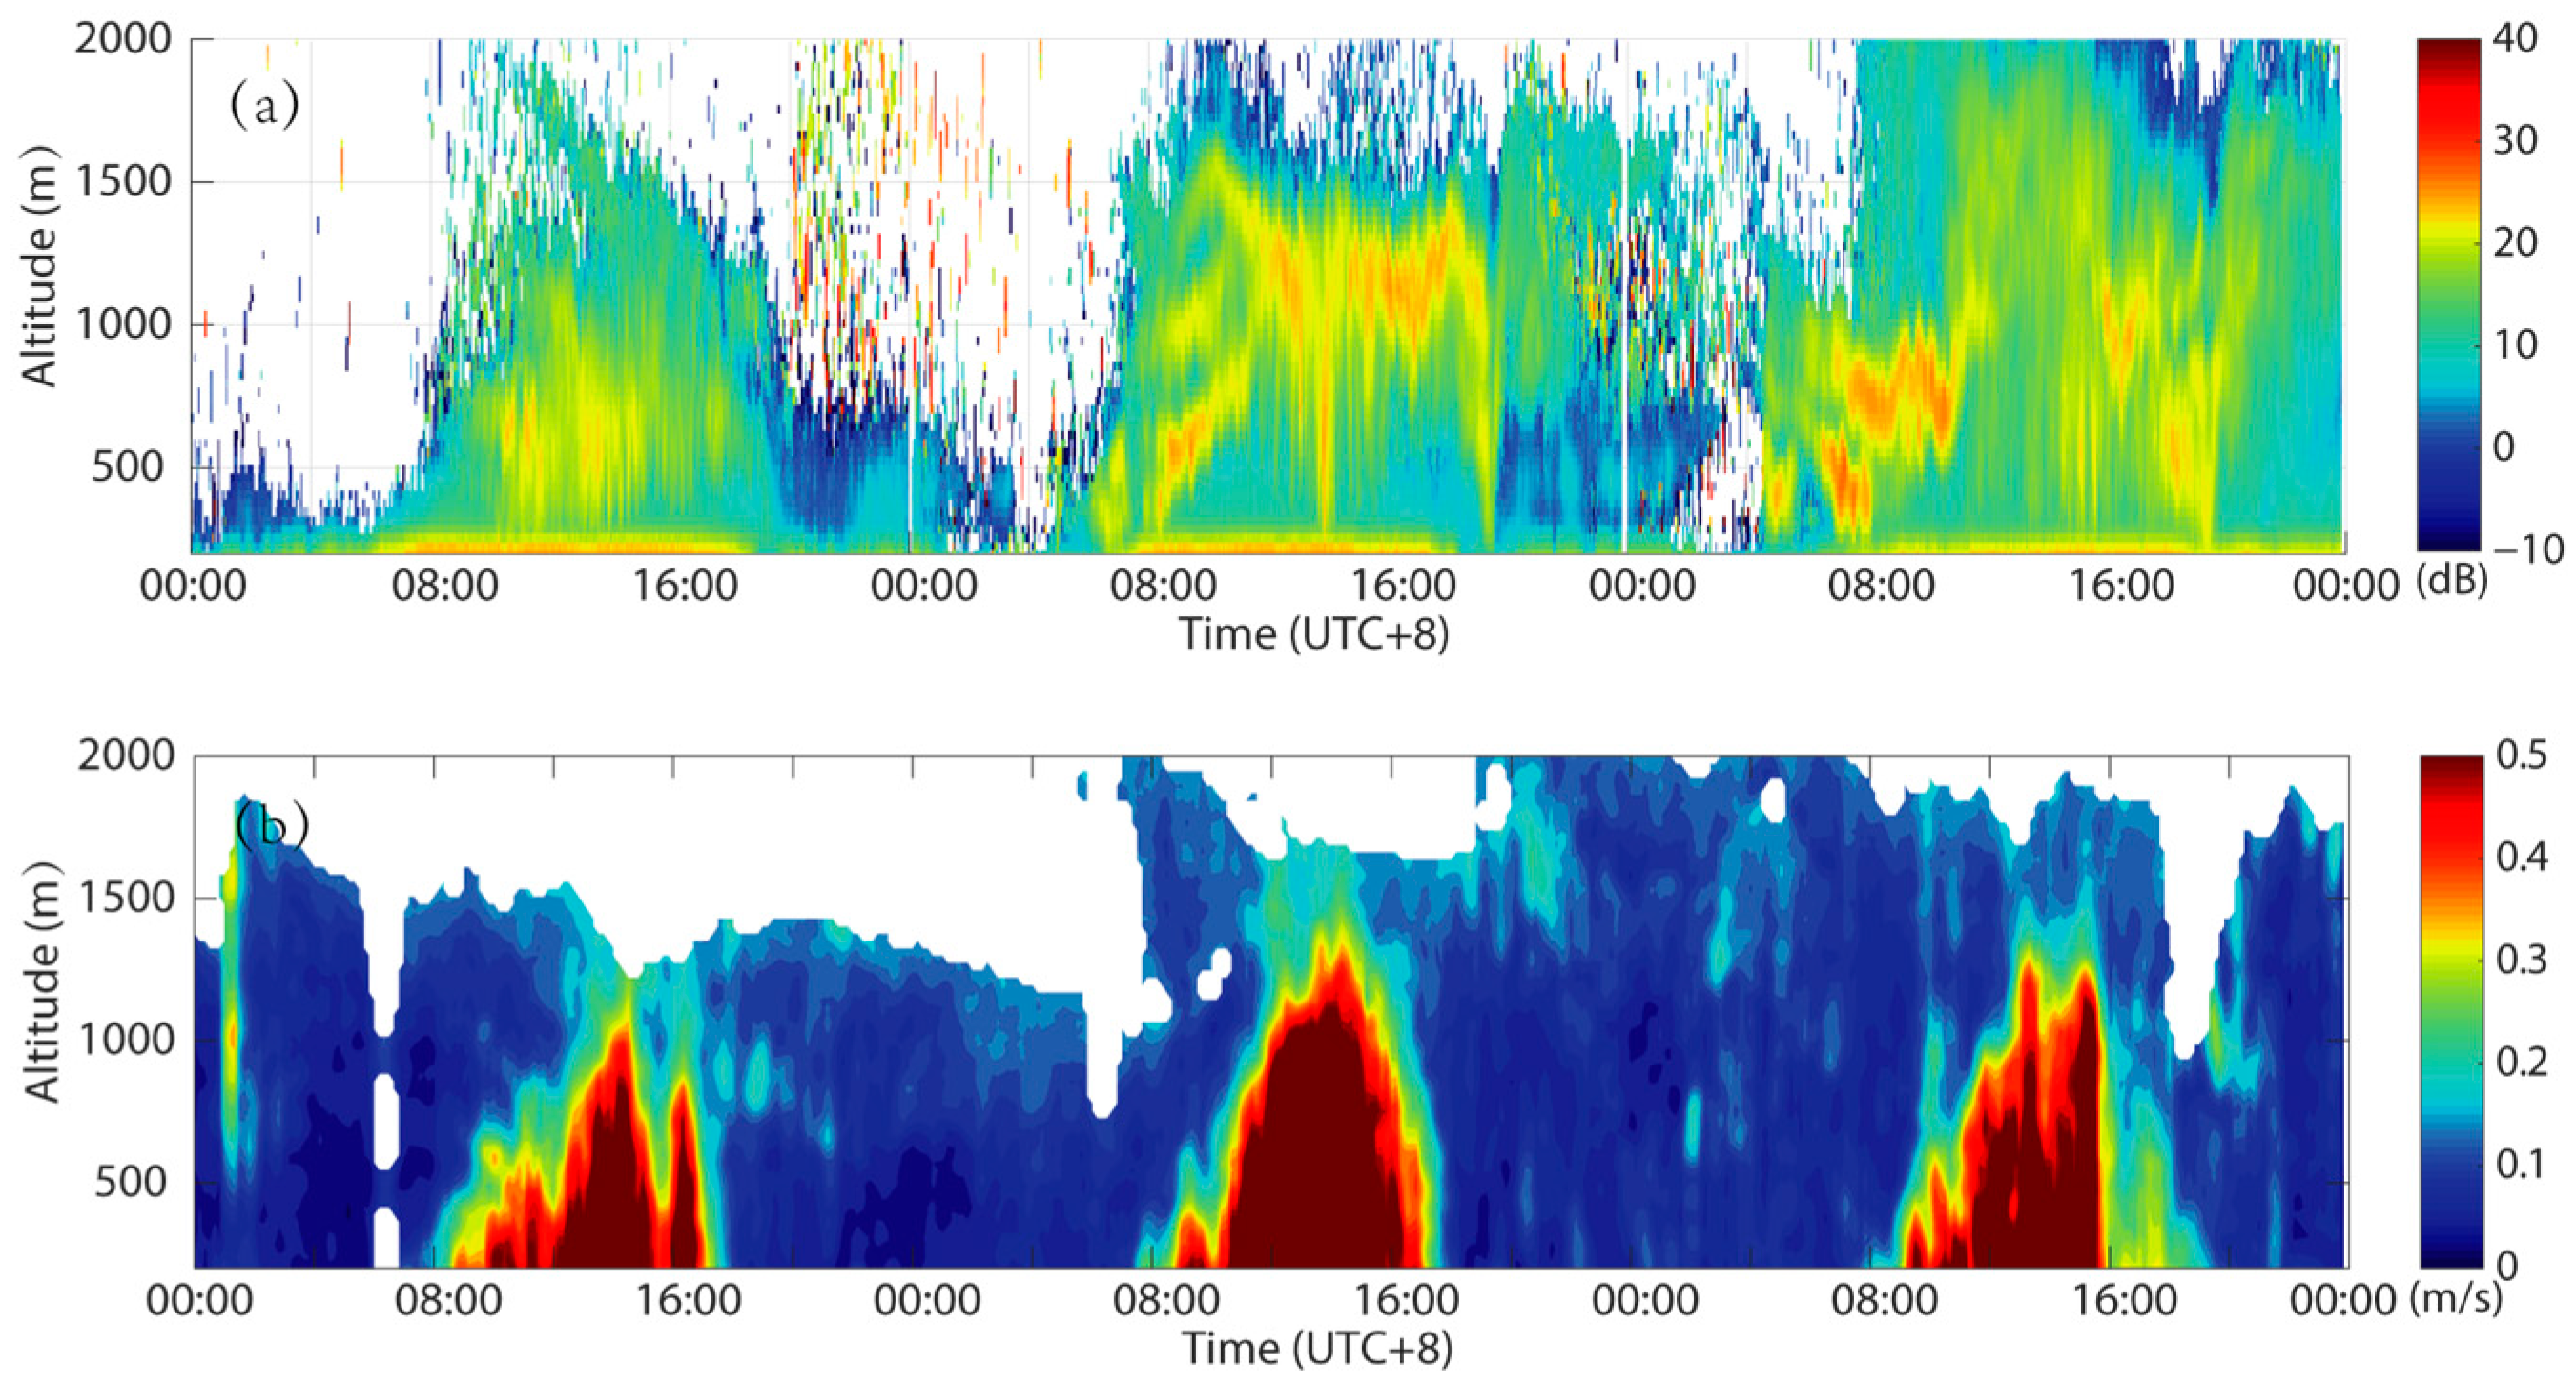
Co-varying with the CBL, the standard deviation of vertical velocity in
Figure 6 also has apparent diurnal variation. The DWR also shows the same variation of CABS. Near the top of the CBL, the layers of CABS can be clearly observed. This result is consistent with other studies [
1,
2,
11,
19]. Interestingly, as shown in
Figure 6, many chaotic point echoes can be observed at night, which can also be seen in
Figure 4. These point echoes are caused by atmospheric biota.
Meanwhile, in the layers of CABS, there are some chaotic points with a large DWR. According to other studies, these points with larger DWR values are common in the biological scattering caused by large flying creatures. It is known that insects, as a means of conserving energy, use turbulent updraughts and downdraughts for transport [
19,
20]. Thus, although turbulence makes people experience bumps on a flight, it is reasonable to infer that these large organisms fly and float with the help of turbulence to save energy and obtain living advantages.
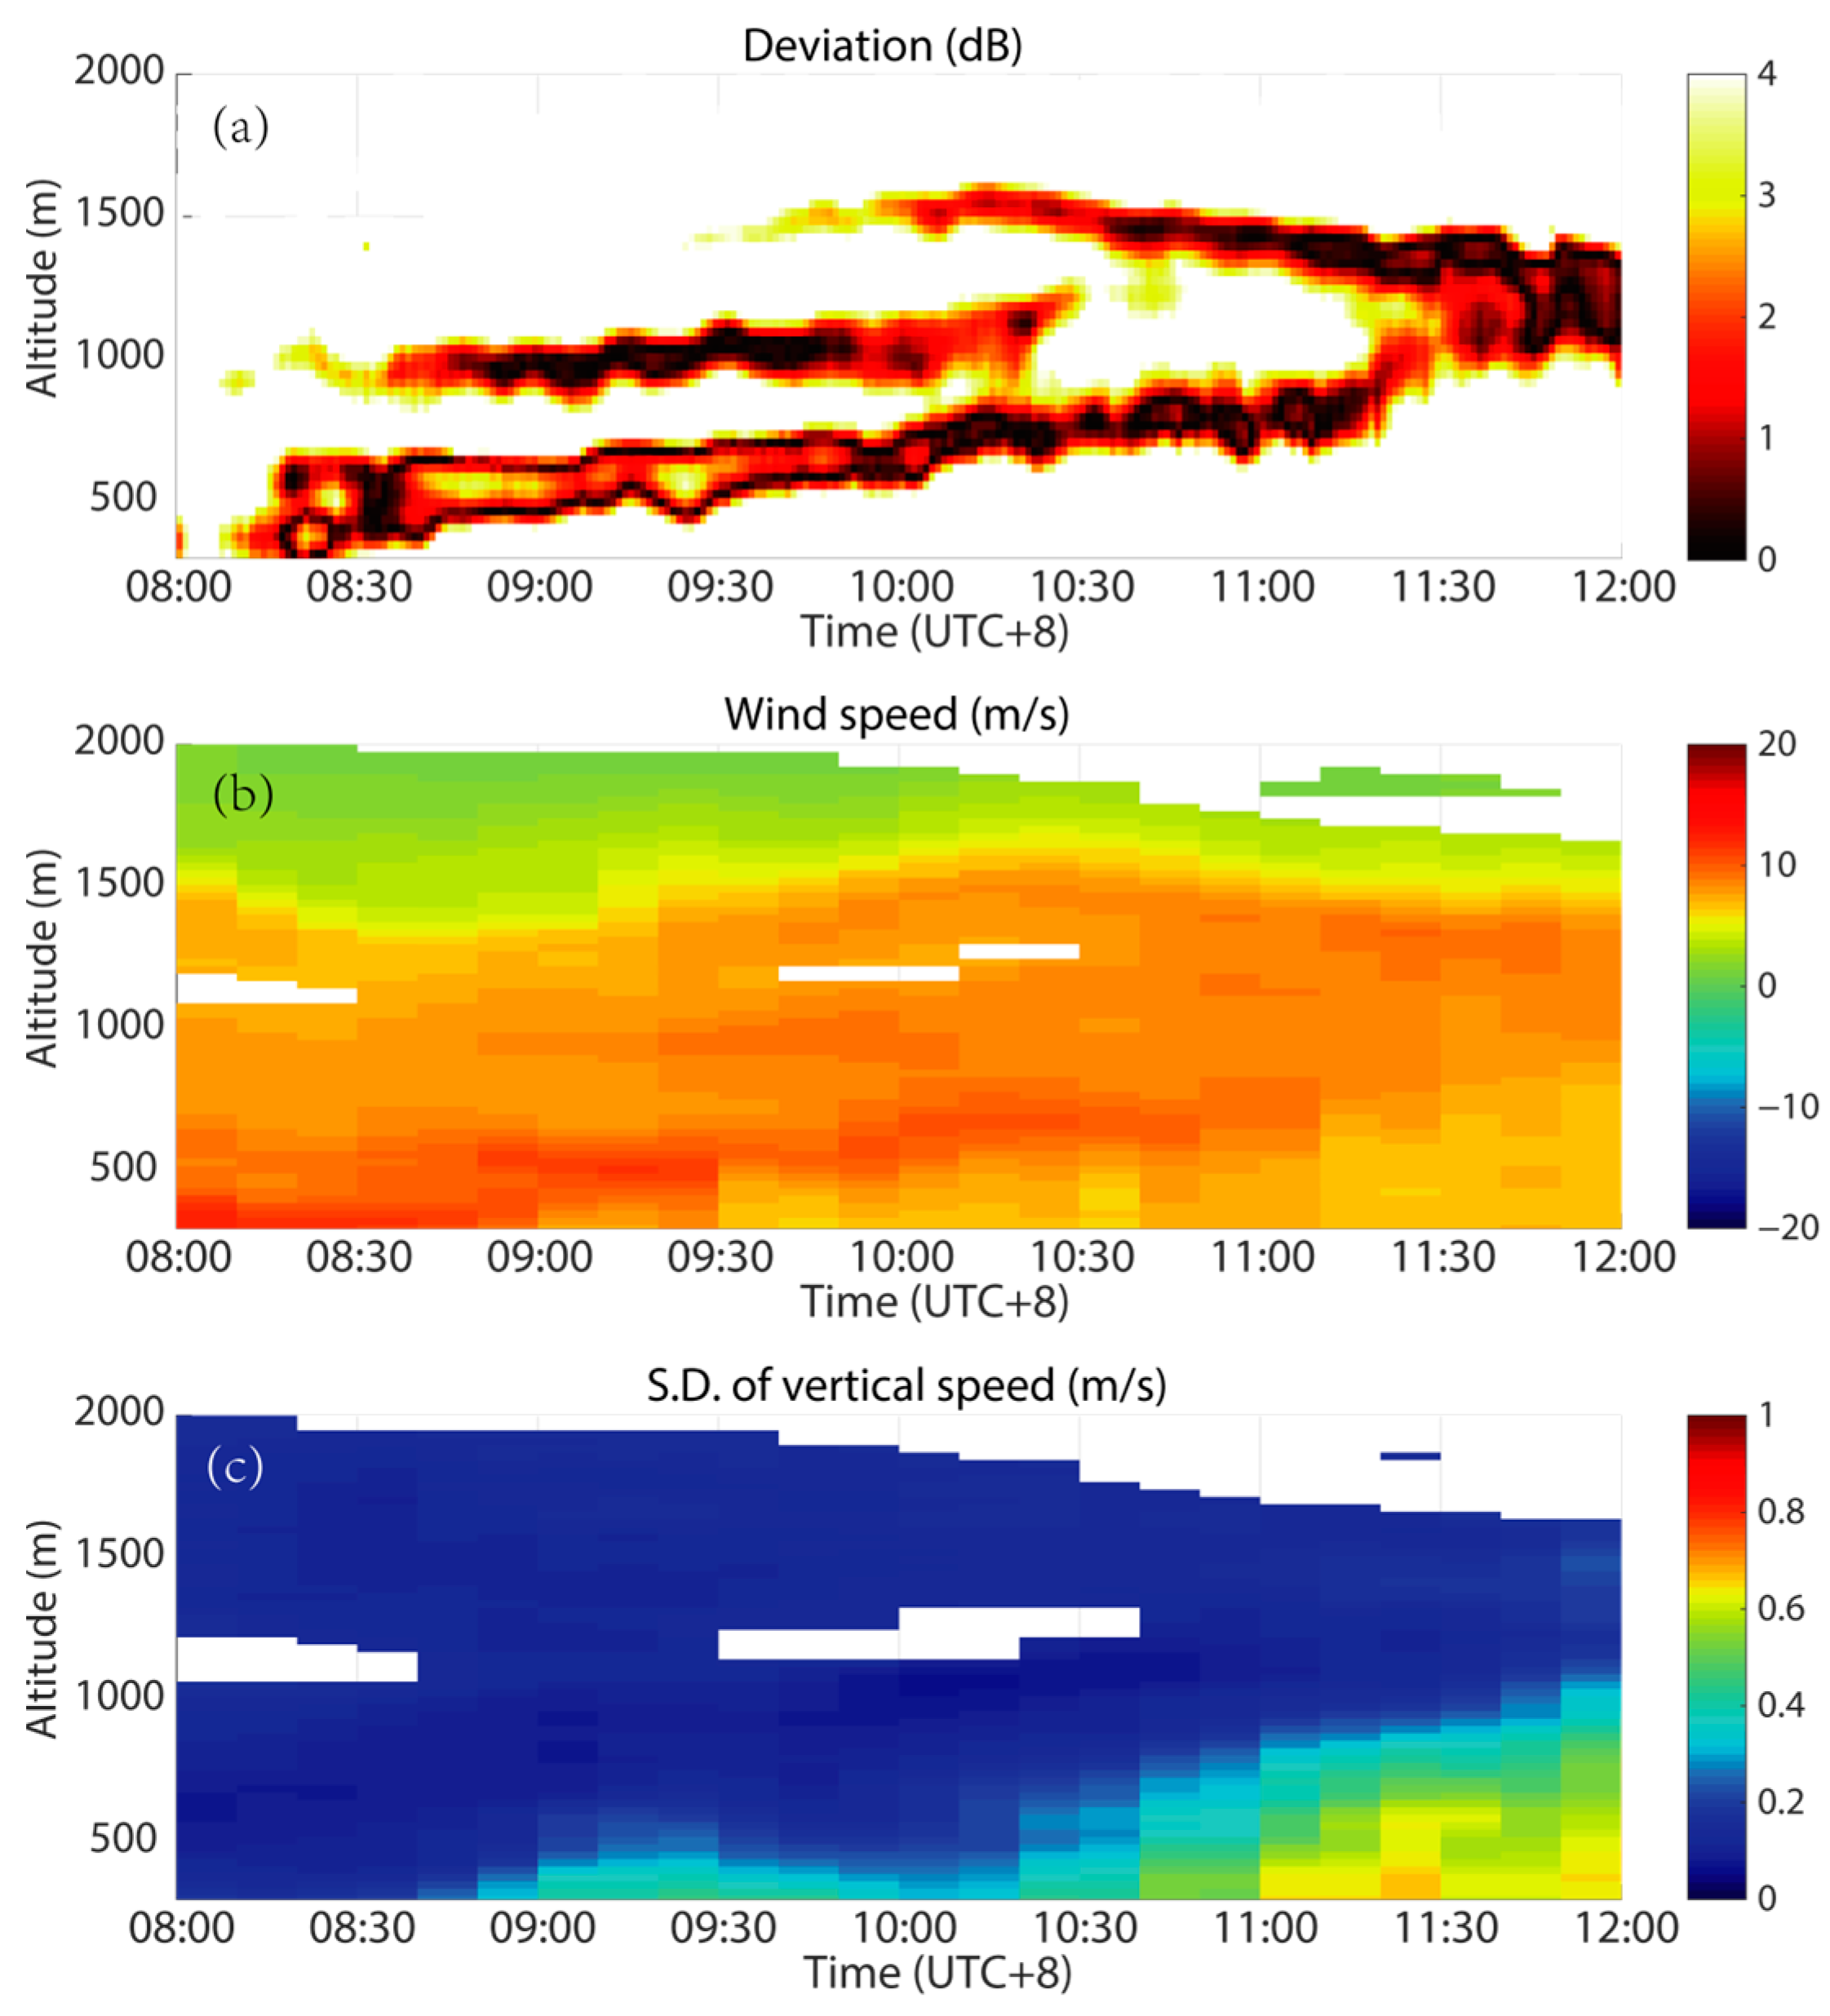
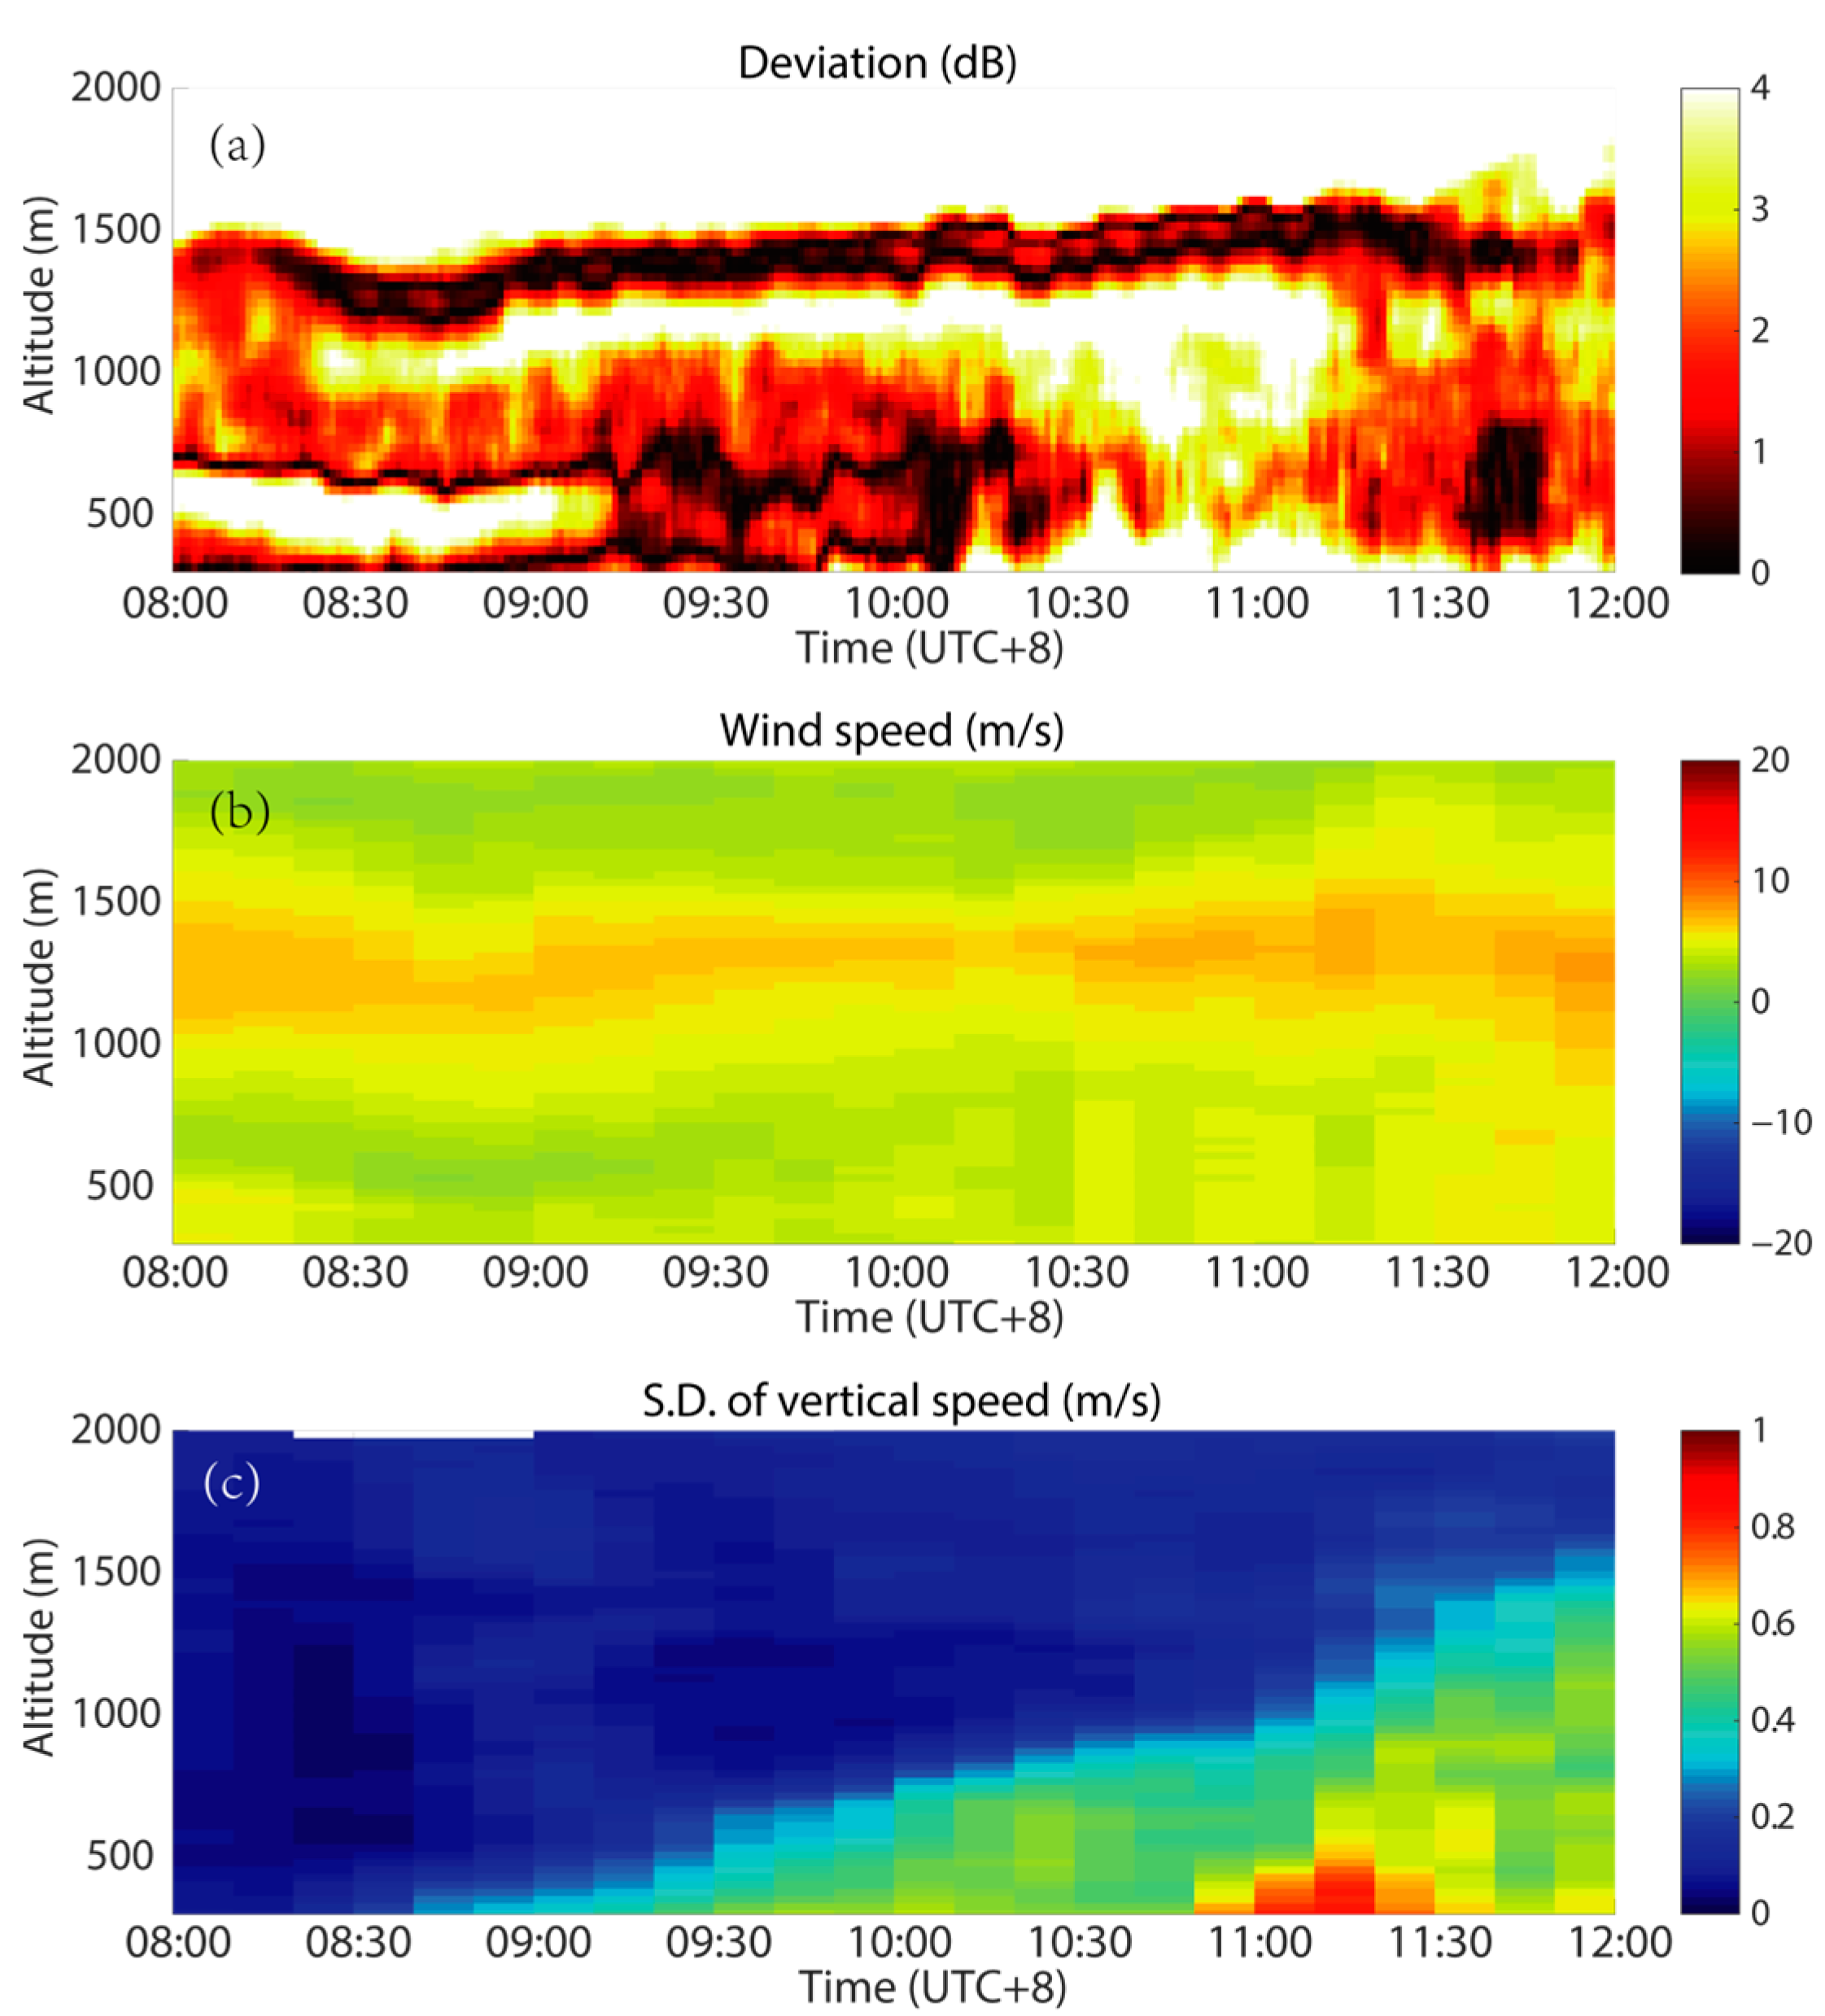
Contrary to expectations, the DFAMRS observed other layers of Bragg scattering above the CBL in the morning on 18 May and 22 May 2021, as shown in
Figure 7 and
Figure 8, respectively. Both layers are flat and near a height of 1.5 km, which is higher than the top of the CBL. The DFAMRS also observed three layers of CABS from 09:00 to 10:30 am on 18 May. This type of CABS typically has a thickness of 200 m and is relatively gentle, with a slower rate of change in the range of the X-band reflectivity factor from −10 to −30 dBZ. Thus, the refractive index structure constant ranges from 10
−11 to 10
−13.
The heights of these layers intuitively have a large horizontal wind speed. However, similar layers of CABS are not always observed on other windy days. The results for 18 May show a thick layer with high wind speed, but the CABS layer is still thin. The wind shear also makes it difficult to explain the middle layer of CABS on 18 May.
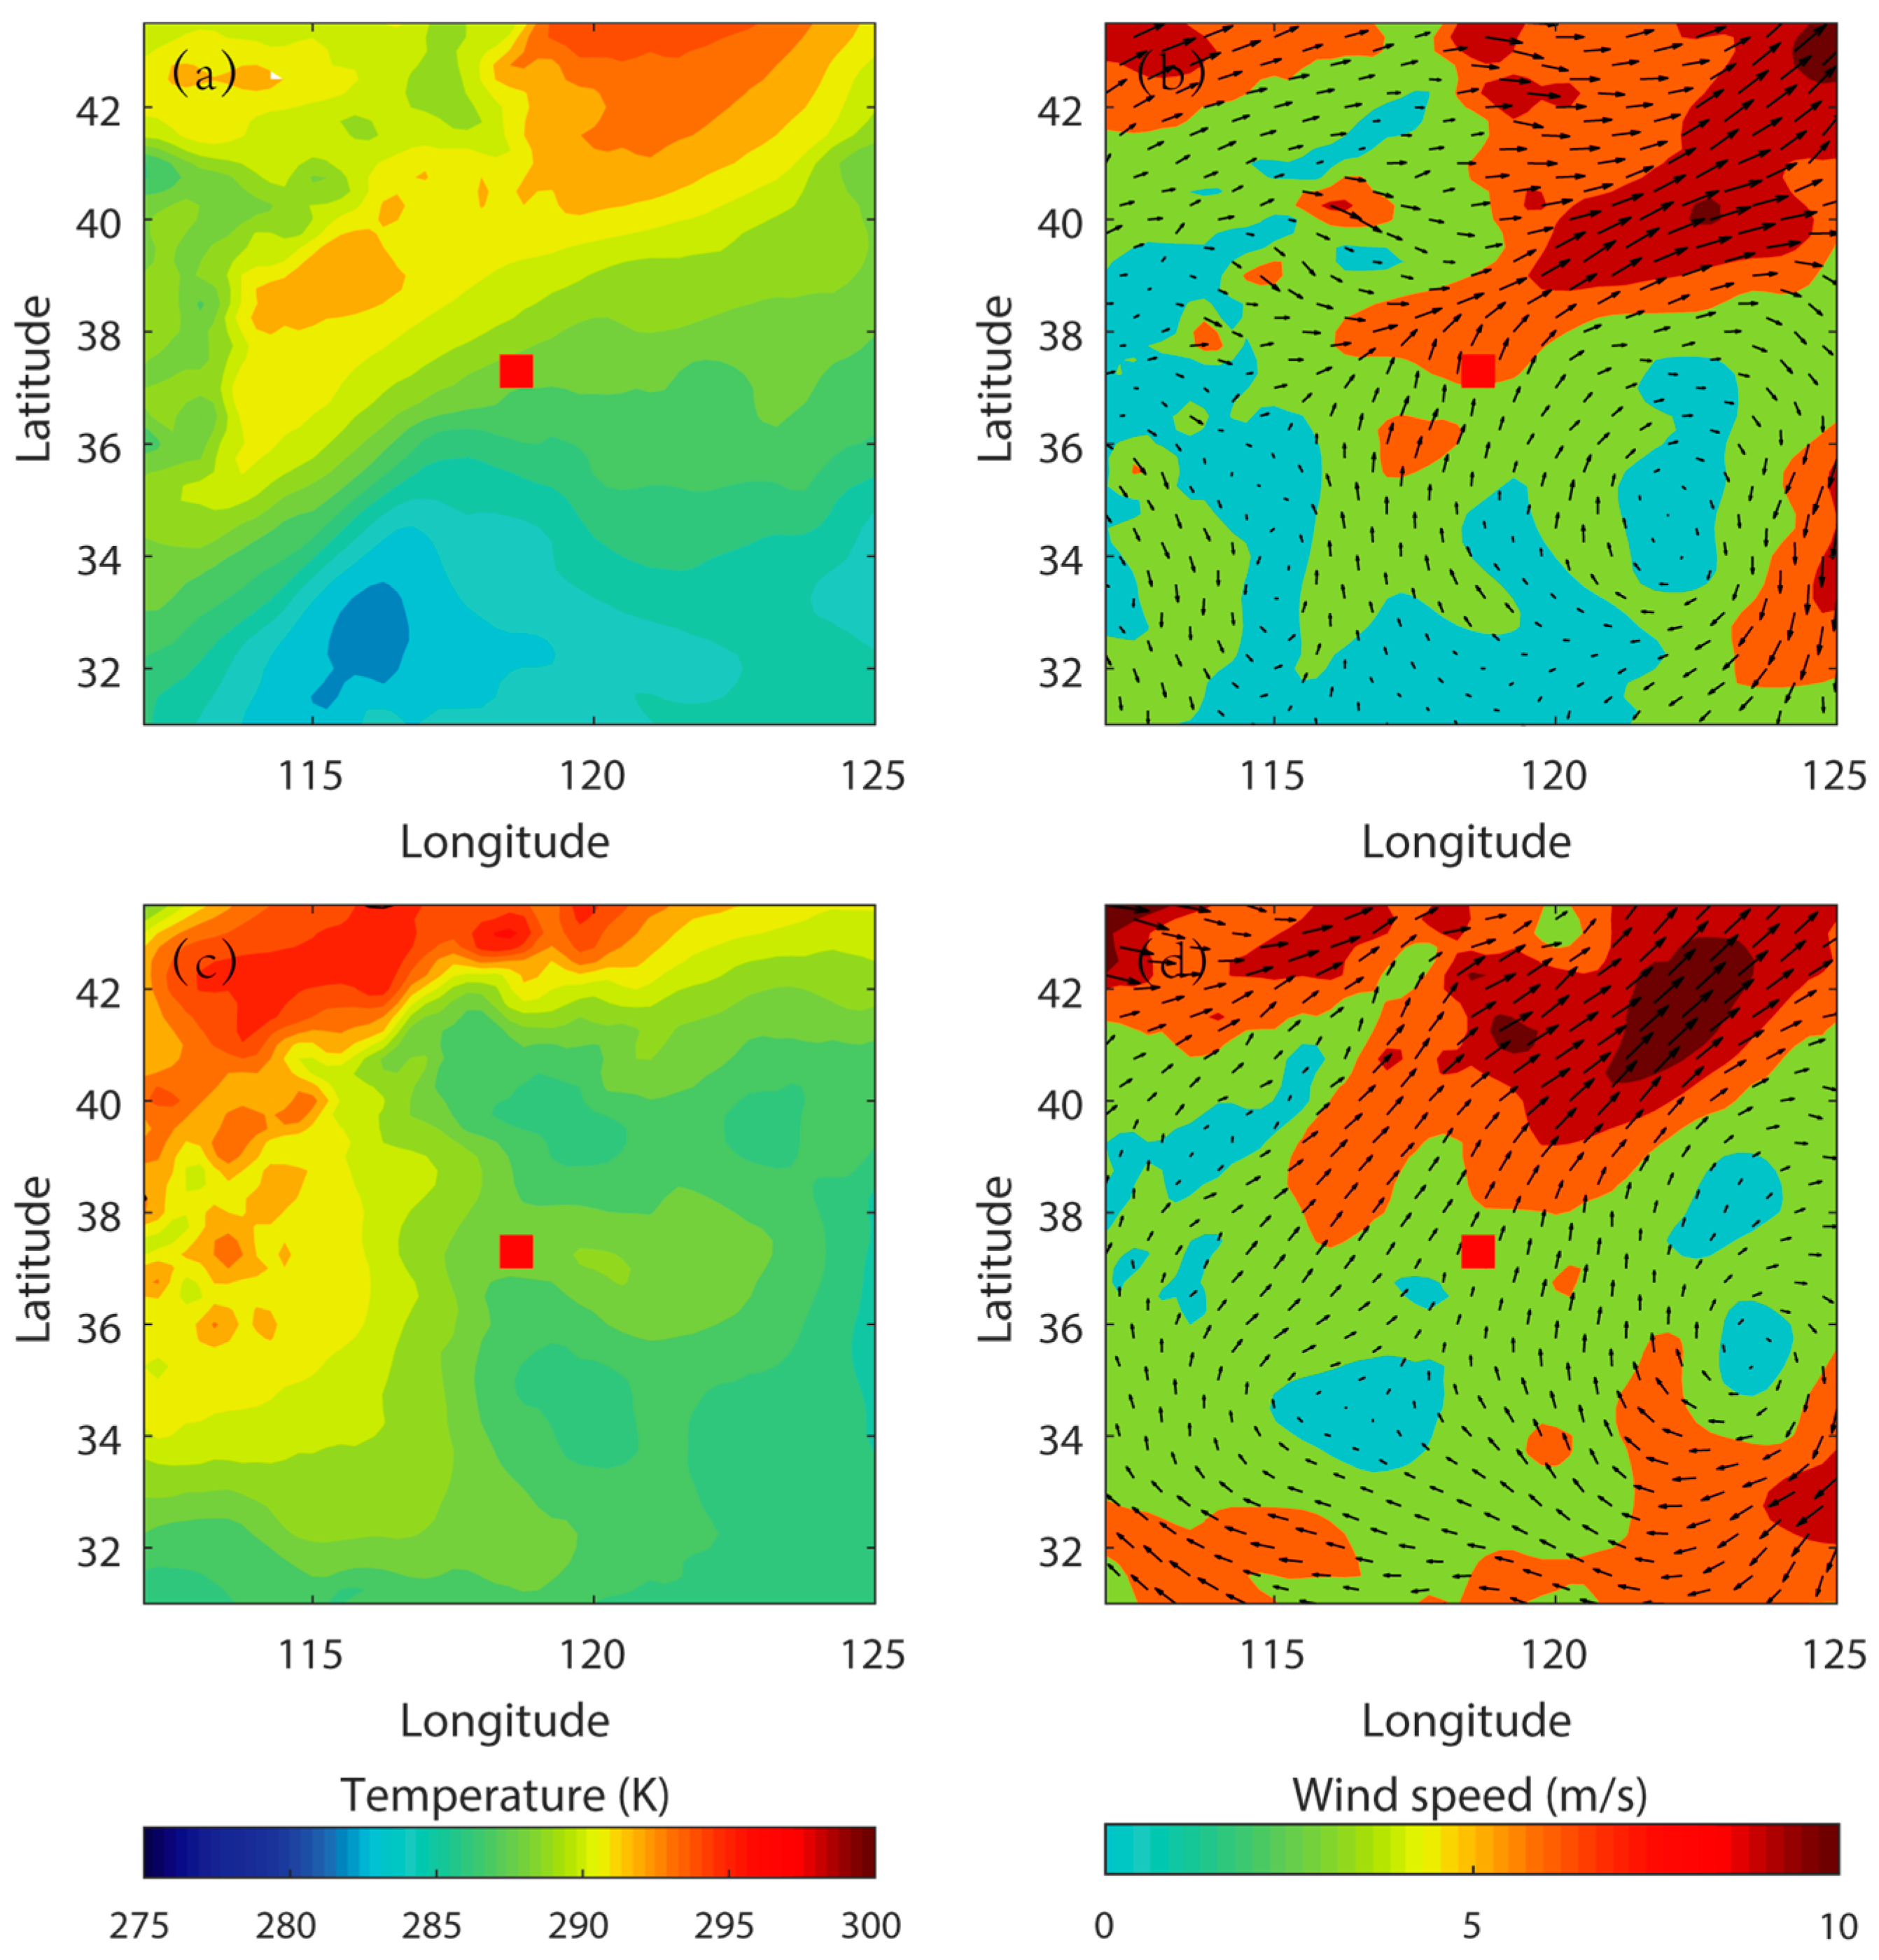
In the reanalysis field, as shown in
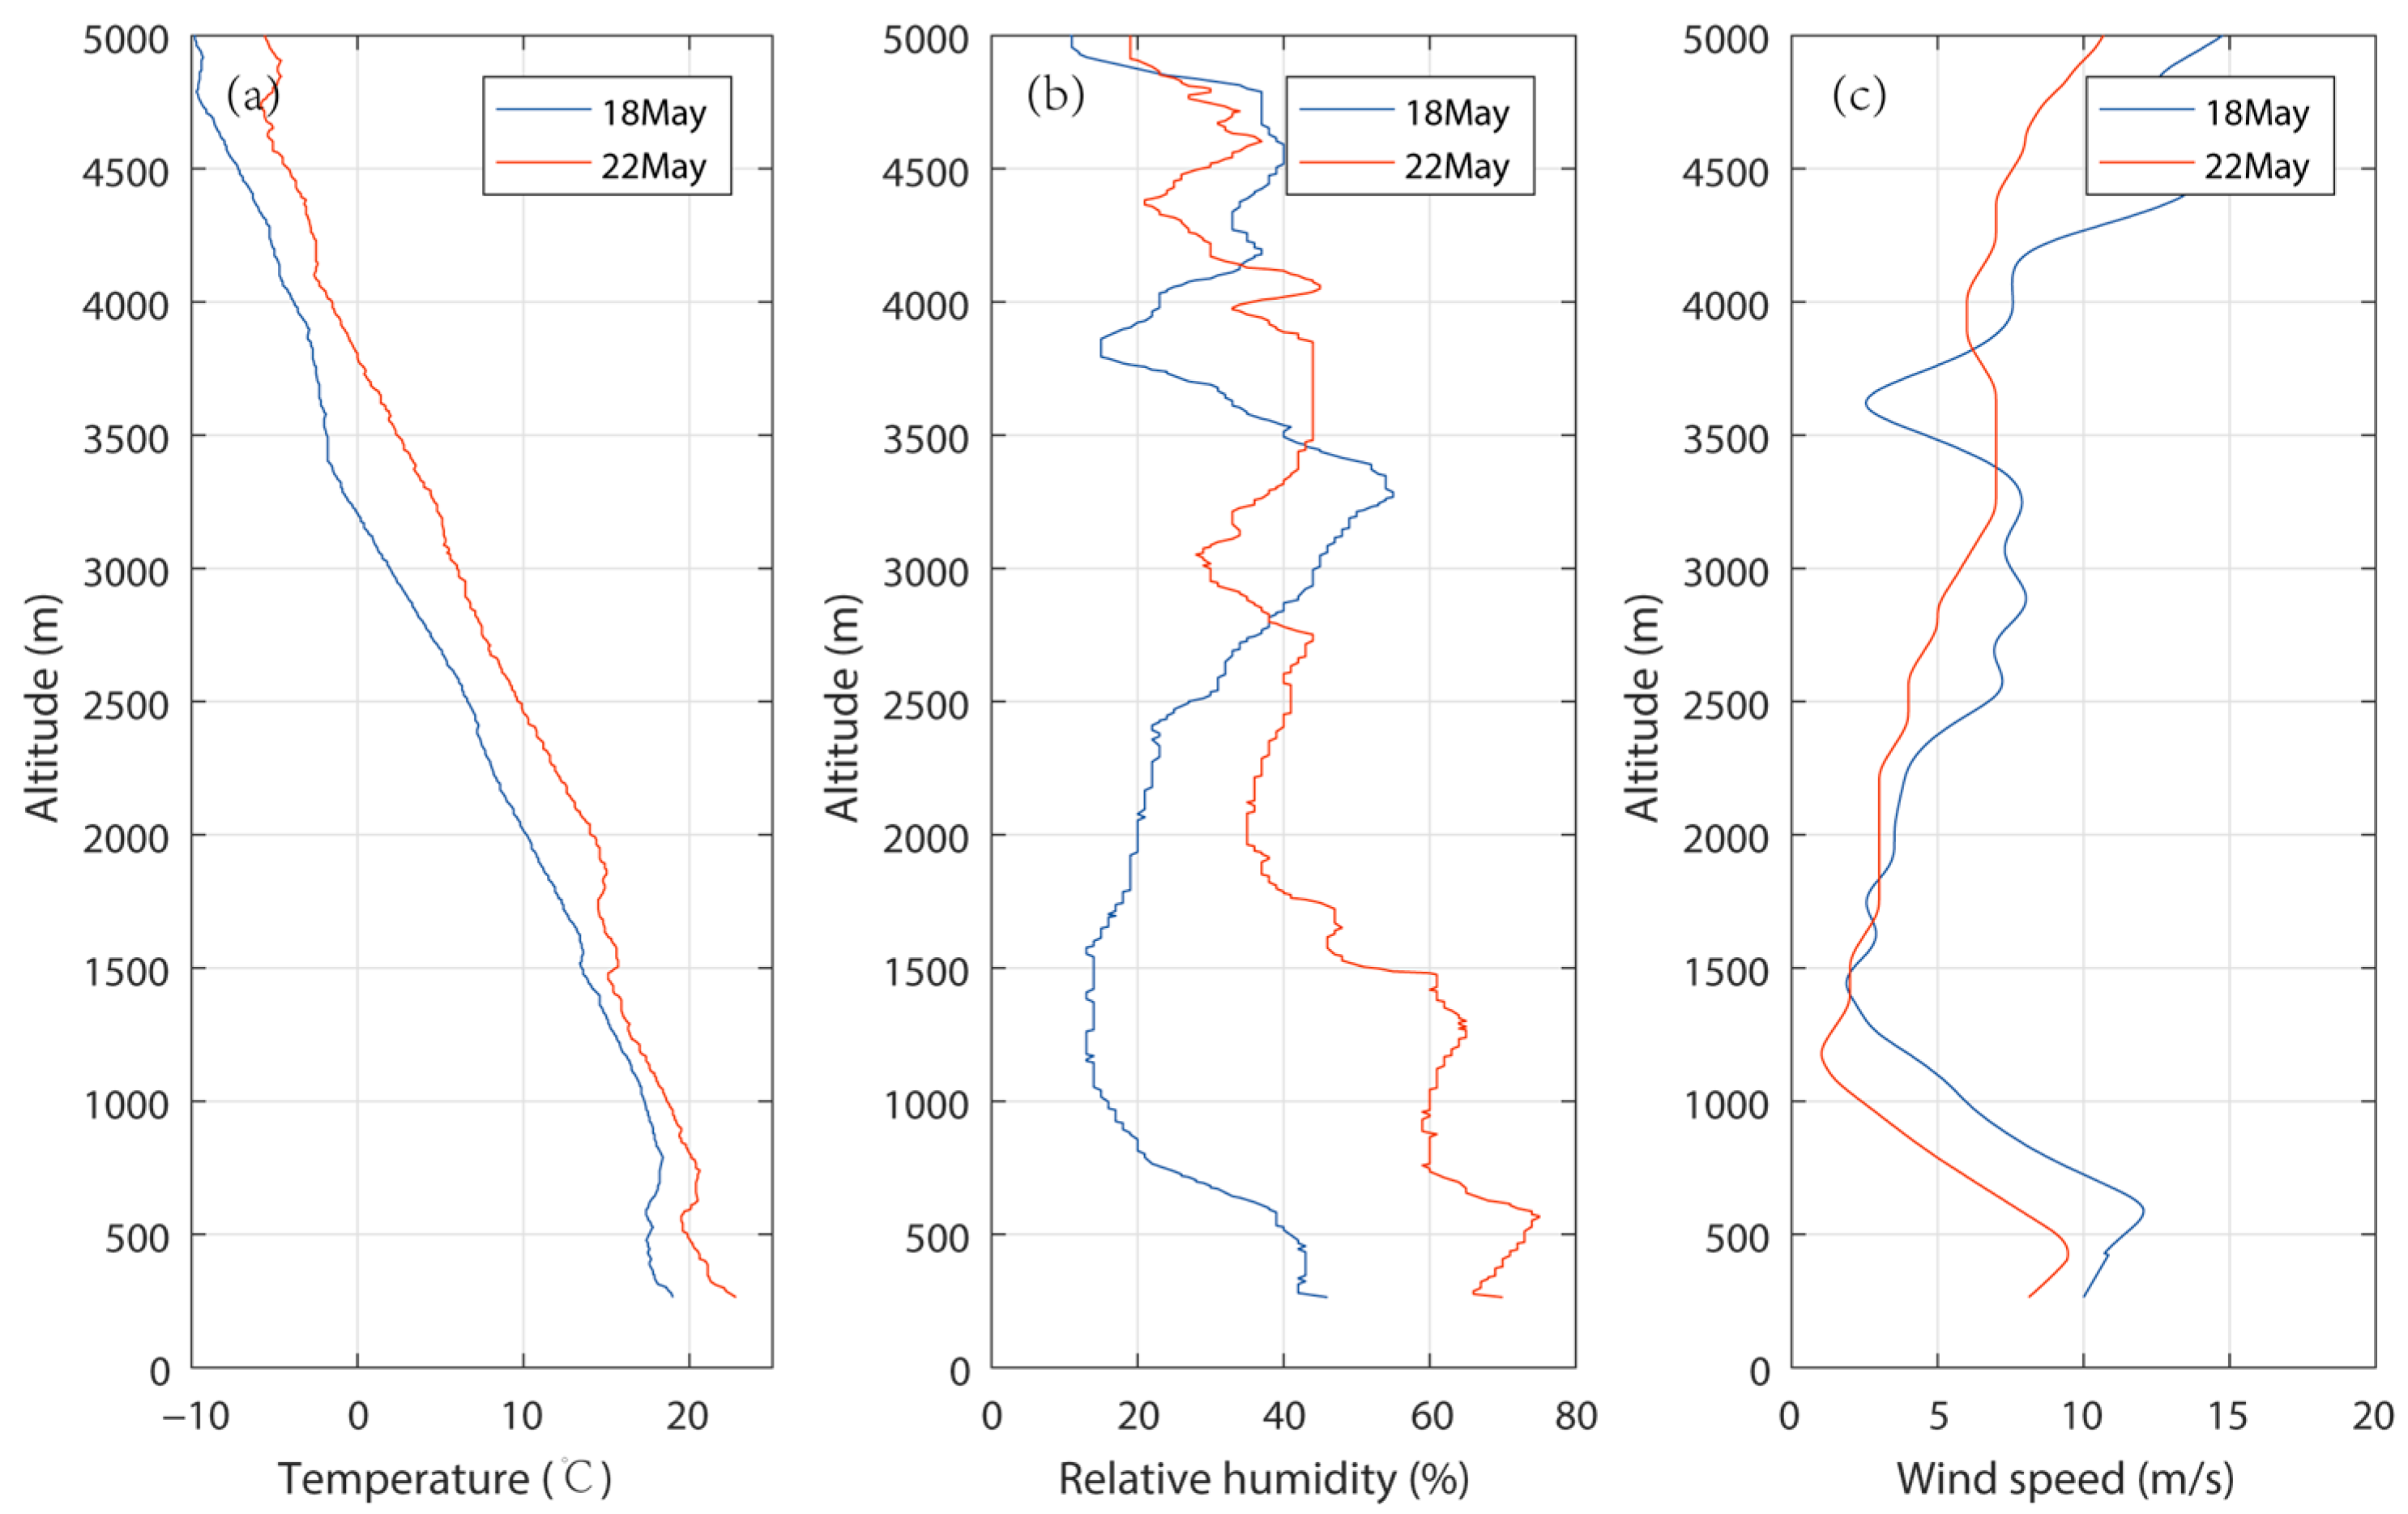
Figure 9, there is no obvious weather process. A weak cyclone structure is present in the eastern part of the radar, but the radar is not located in the low-level jet. The sounding observations in
Figure 10 also demonstrate the absence of low-level jets.
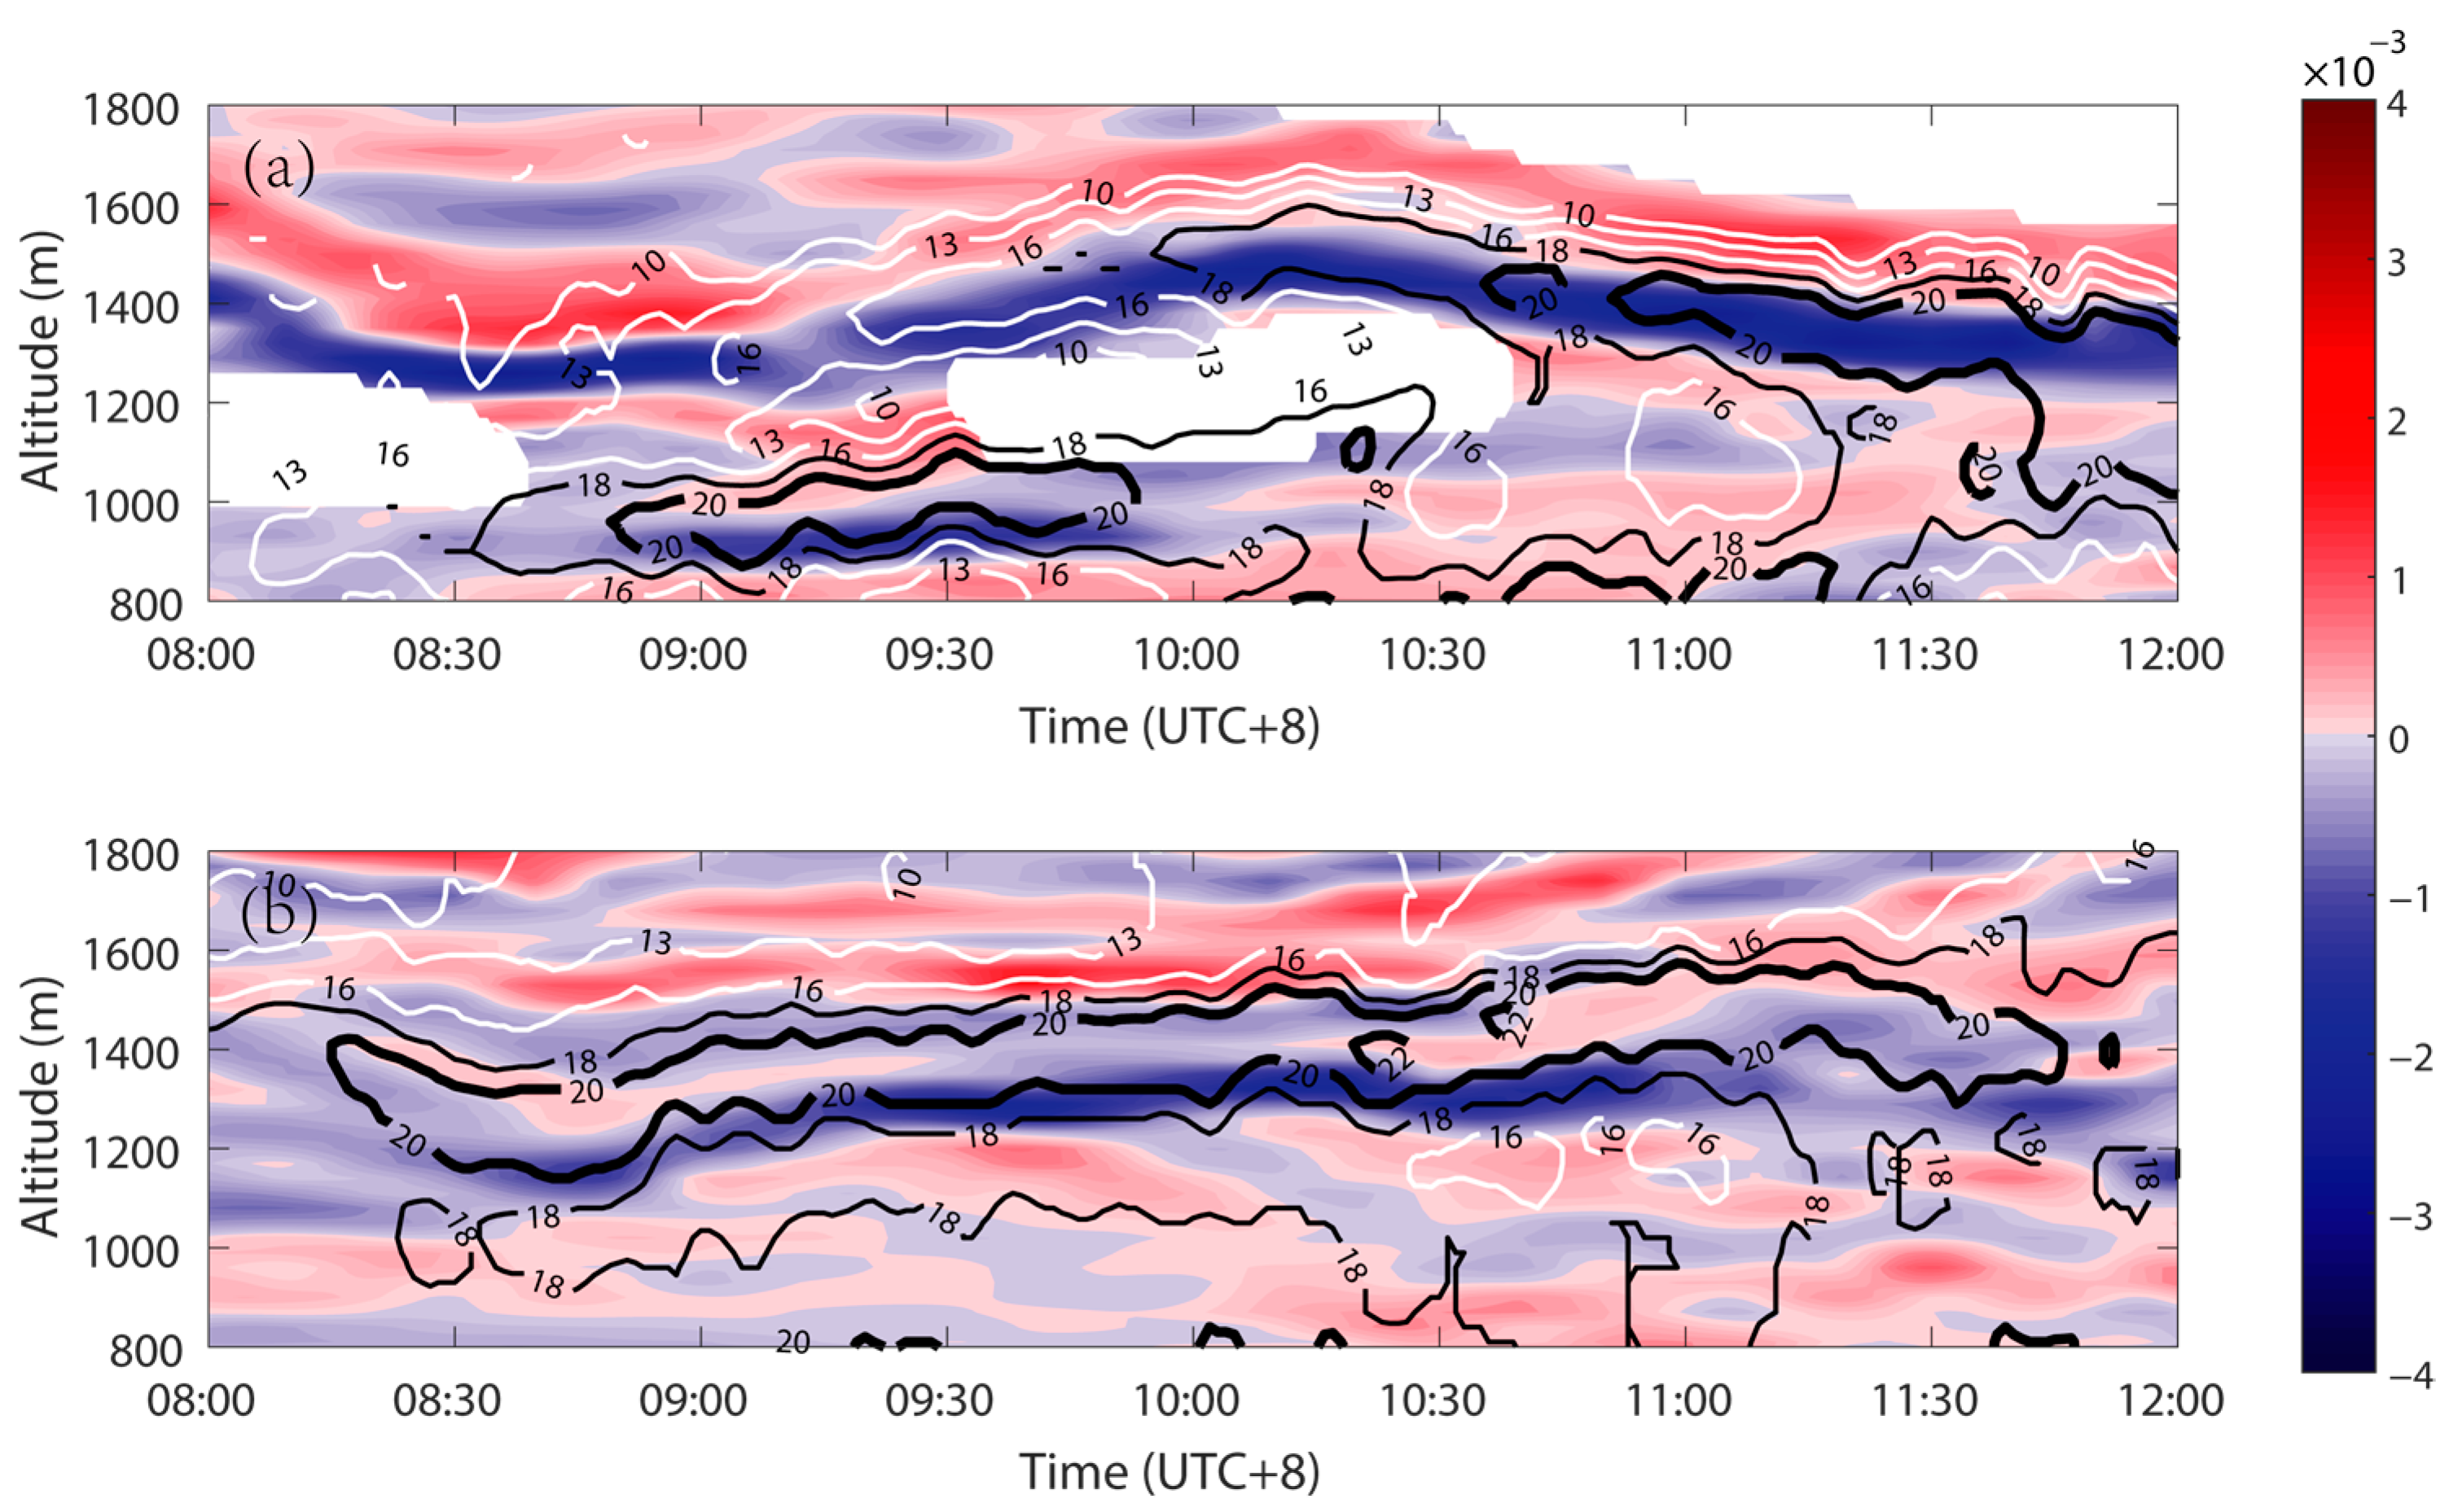
To our surprise, the vertical change rate of horizontal wind shear, which is the second derivative of horizontal wind speed, is more consistent with the height of the CABS layers.
Figure 11 gives the co-varying patterns of the CABS layers and the negative second derivative, and the CABS layers are located in the position of the upper edge above the negative second derivative.
4. Discussion
Reflections from turbulent air are commonly observed on top of the CBL. Because of the penetrative convection and entrainment, thermals reciprocate in the layer [
21]. This reciprocating activity generates turbulence and eventually causes Bragg scattering, but it is rarely directly observed in the echo of CABS above the CBL.
At first, we speculated that the horizontal wind shear caused the shear turbulence as a shear plane, but the corresponding relationship of CABS with the shear is less obvious than that with the negative second derivative of the wind.
Some researchers argue that mechanical energy, which depends on the wind speed gradient, does not cause turbulence, while the gradient of mechanical energy does [
22], and that nonlinear instability is necessary for turbulence, not linear instability. Thus, the negative vertical change rate of horizontal wind shear may be the main factor that creates the layer of CABS. Notably, the relationship between the wind and CABS needs more experimental data to confirm.
Furthermore, an S-band weather radar near the DFAMRS did not observe these layers of CABS, possibly because the scale of turbulence was less than 5 cm and out of the range of Bragg scattering. This type of small-scale turbulence decays quickly above the CBL. Thus, it is normal for the S-band radar to be unable to observe the same CABS layer above the CBL.
5. Conclusions and Future Work
In this study, an antenna multiplexing radar system calibrated by a UAV featuring a metal sphere, with the DWR between the X-band and Ka-band, was used to determine the layers of CABS. We found that the CABS layer not only exists at the top of the CBL but can also be detected above the CBL. Such CABS echoes typically have a thickness of 200 m and exhibit a relatively gentle rate of change. The reflectivity factor of X-band echoes ranges from −10 to −30 dBZ, indicating a refractive index structure constant ranging from 10−11 to 10−13.
This study demonstrated that echoes from the fine layer are not solely attributable to biological activities but can also be caused by meteorological factors above the convective boundary layer. As such, these results underscore the need to expand the range of potential causes of clear-air echoes. These thin layers of CABS above CBL have a relationship with the horizontal wind field. Based on existing data, CABS more closely coexists with a negative second derivative of horizontal wind speed.
However, the existing independent cases cannot support a more detailed analysis. The limited actual measurement range of the CDL causes some CABS cases to be abandoned. Equipment for wind measuring with higher power will be developed in an experiment to be undertaken in 2023. Future studies will also need some other meteorological parameters, such as profiles of the air temperature, relative humidity, and absolute humidity, which could be collected using a microwave radiometer. At the same time, the upgraded DFAMRS has a new dual-polarization detection mode, which could help detect the polarization characteristics of CABS layers above the CBL.
Author Contributions
Conceptualization, Y.T. and S.M.; methodology, Y.T.; software, Y.T.; validation, Y.T.; formal analysis, Y.T.; investigation, Y.T.; resources, H.C. and S.M.; data curation, H.C. and S.M.; writing—original draft preparation, Y.T. and T.L.; writing—review and editing, Y.T. and T.L.; visualization, Y.T. and T.L.; supervision, H.C. and S.M.; project administration, Y.T. and H.C.; funding acquisition, Y.T. All authors have read and agreed to the published version of the manuscript.
Funding
This research was funded by the National Natural Science Foundation of China, grant number 42205145.
Data Availability Statement
Not applicable.
Conflicts of Interest
The authors declare no conflict of interest. The funders had no role in the design of the study; in the collection, analyses, or interpretation of data; in the writing of the manuscript, or in the decision to publish the results.
References
- Banghoff, J.R.; Stensrud, D.J.; Kumjian, M.R. Convective Boundary Layer Depth Estimation from S-Band Dual-Polarization Radar. J. Atmos. Ocean. Technol. 2018, 35, 1723–1733. [Google Scholar] [CrossRef]
- Melnikov, V.M.; Doviak, R.J.; Zrnić, D.S.; Stensrud, D.J. Mapping Bragg Scatter with a Polarimetric WSR-88D. J. Atmos. Ocean. Technol. 2011, 28, 1273–1285. [Google Scholar] [CrossRef]
- Melnikov, V.M.; Doviak, R.J.; Zrnić, D.S.; Stensrud, D.J. Structures of Bragg Scatter Observed with the Polarimetric WSR-88D. J. Atmos. Ocean. Technol. 2013, 30, 1253–1258. [Google Scholar] [CrossRef]
- Knight, C.A.; Miller, L.J. Early radar echoes from small, warm cumulus: Bragg and hydrometeor scattering. J. Atmos. Sci. 1998, 55, 2974–2992. [Google Scholar] [CrossRef]
- Zrnic, D.S.; Ryzhkov, A.V. Observations of insects and birds with a polarimetric radar. IEEE Trans. Geosci. Remote Sens. 1998, 36, 661–668. [Google Scholar] [CrossRef]
- Wilson, J.W.; Weckwerth, T.M.; Vivekanandan, J.; Wakimoto, R.M.; Russell, R.W. Boundary Layer Clear-Air Radar Echoes: Origin of Echoes and Accuracy of Derived Winds. J. Atmos. Ocean. Technol. 1994, 11, 1184–1206. [Google Scholar] [CrossRef]
- Knight, C.A.; Miller, L.J. First Radar Echoes from Cumulus Clouds. Bull. Am. Meteorol. Soc. 1993, 74, 179–188. [Google Scholar] [CrossRef]
- Ottersten, H. Atmospheric Structure and Radar Backscattering in Clear Air. Radio Sci. 1969, 4, 1179–1193. [Google Scholar] [CrossRef]
- Ottersten, H.; Hardy, K.R.; Little, C.G. Radar and sodar probing of waves and turbulence in statically stable clear-air layers. Bound. Layer Meteorol. 1973, 4, 47–89. [Google Scholar] [CrossRef]
- Davison, J.L.; Rauber, R.M.; Di Girolamo, L.; LeMone, M.A. A Revised Conceptual Model of the Tropical Marine Boundary Layer. Part I: Statistical Characterization of the Variability Inherent in the Wintertime Trade Wind Regime over the Western Tropical Atlantic. J. Atmos. Sci. 2013, 70, 3005–3024. [Google Scholar] [CrossRef]
- Richardson, L.M.; Cunningham, J.G.; Zittel, W.D.; Lee, R.R.; Ice, R.L.; Melnikov, V.M.; Hoban, N.P.; Gebauer, J.G. Bragg Scatter Detection by the WSR-88D. Part I: Algorithm Development. J. Atmos. Ocean. Technol. 2017, 34, 465–478. [Google Scholar] [CrossRef]
- Fabry, F. Radar Meteorology: Principles and Practice; Cambridge University Press: Cambridge, UK, 2015. [Google Scholar] [CrossRef]
- Joshil, S.S.; Chandrasekar, C.V. Calibration of D3R Weather Radar Using UAV-Hosted Target. Remote Sens. 2022, 14, 3534. [Google Scholar] [CrossRef]
- Wang, W.; Gong, W.; Mao, F.; Pan, Z. An Improved Iterative Fitting Method to Estimate Nocturnal Residual Layer Height. Atmosphere 2016, 7, 106. [Google Scholar] [CrossRef]
- Hooper, W.P.; Eloranta, E.W. Lidar Measurements of Wind in the Planetary Boundary Layer: The Method, Accuracy and Results from Joint Measurements with Radiosonde and Kytoon. J. Appl. Meteorol. Climatol. 1986, 25, 990–1001. [Google Scholar] [CrossRef]
- Huang, X.; Zhao, Y.; Liu, Y. Using light-level geolocations to monitor incubation behaviour of a cavity-nesting bird Apus apus pekinensis. Avian Res. 2021, 12, 9. [Google Scholar] [CrossRef]
- Zhou, B.W.; Sun, S.W.; Sun, J.N.; Zhu, K.F. The Universality of the Normalized Vertical Velocity Variance in Contrast to the Horizontal Velocity Variance in the Convective Boundary Layer. J. Atmos. Sci. 2019, 76, 1437–1456. [Google Scholar] [CrossRef]
- Martin, W.J.; Shapiro, A. Discrimination of bird and insect radar echoes in clear air using high-resolution radars. J. Atmos. Ocean. Technol. 2007, 24, 1215–1230. [Google Scholar] [CrossRef]
- Franck, A.; Moisseev, D.; Vakkari, V.; Leskinen, M.; Lampilahti, J.; Kerminen, V.M.; O’Connor, E. Evaluation of convective boundary layer height estimates using radars operating at different frequency bands. Atmos. Meas. Tech. 2021, 14, 7341–7353. [Google Scholar] [CrossRef]
- Parry, H.R. Cereal aphid movement: General principles and simulation modelling. Mov. Ecol. 2013, 1, 14. [Google Scholar] [CrossRef] [PubMed]
- Stull, R.B. An Introduction to Boundary Layer Meteorology; Springer Science & Business Media: Berlin/Heidelberg, Germany, 1988. [Google Scholar]
- Dou, H.-S.; Khoo, B.C. Energy gradient method for turbulent transition with consideration of effect of disturbance frequency. J. Hydrodyn. 2010, 22, 23–28. [Google Scholar] [CrossRef]
Figure 1.
Picture of the dual-frequency antenna multiplexing radar system (a) and its installation site (b). In (a), the radar system is located on the left of the picture, and the data processing center is on the right. The red square in (b) shows the location of the DFAMRS site. The transmitting antenna is parallel to the receiving antenna, which is shared by the X-band and Ka-band.
Figure 3.
The profiles of the backscattering coefficient (a) and standard deviation (SD) of vertical velocity (b).
Figure 3.
The profiles of the backscattering coefficient (a) and standard deviation (SD) of vertical velocity (b).
Figure 4.
Time–height cross-section of the reflectivity factor (unit: dBZ) at the X-band (a) and the Ka-band (b); (c) the DWR (unit: dB) between the X-band and the Ka-band. The CABS looks yellow in (c).
Figure 4.
Time–height cross-section of the reflectivity factor (unit: dBZ) at the X-band (a) and the Ka-band (b); (c) the DWR (unit: dB) between the X-band and the Ka-band. The CABS looks yellow in (c).
Figure 5.
Time–height cross-section of the DWR (unit: dB) between the X-band and the Ka-band: (a) data without preprocessing; (b) data after preprocessing.
Figure 5.
Time–height cross-section of the DWR (unit: dB) between the X-band and the Ka-band: (a) data without preprocessing; (b) data after preprocessing.
Figure 6.
Time–height cross-section of the DWR (a) and the standard deviation of vertical velocity (b) from 17–19 May 2021.
Figure 6.
Time–height cross-section of the DWR (a) and the standard deviation of vertical velocity (b) from 17–19 May 2021.
Figure 7.
The DWR deviation from Bragg scattering (a), the horizontal wind speed, (b) and the standard deviation of vertical velocity (c) from 08:00 to 12:00 am on 18 May 2021.
Figure 7.
The DWR deviation from Bragg scattering (a), the horizontal wind speed, (b) and the standard deviation of vertical velocity (c) from 08:00 to 12:00 am on 18 May 2021.
Figure 8.
The DWR deviation from Bragg scattering (a), the horizontal wind speed, (b) and the standard deviation of vertical velocity (c) from 08:00 to 12:00 am on 22 May 2021.
Figure 8.
The DWR deviation from Bragg scattering (a), the horizontal wind speed, (b) and the standard deviation of vertical velocity (c) from 08:00 to 12:00 am on 22 May 2021.
Figure 9.
Temperature (a,c) and wind fields (b,d) of the ERA5 reanalysis; (a,b) reanalysis on May 18th at 9:00 am at an altitude of 875 hPa; (c,d) reanalysis on May 22nd at 10:00 am at an altitude of 850 hPa.
Figure 9.
Temperature (a,c) and wind fields (b,d) of the ERA5 reanalysis; (a,b) reanalysis on May 18th at 9:00 am at an altitude of 875 hPa; (c,d) reanalysis on May 22nd at 10:00 am at an altitude of 850 hPa.
Figure 10.
Observations of sounding balloons at 8:00 am on May 18th and 22nd. The sounding station is located 120 km southwest of the radar. (a–c) are the vertical profiles of temperature, relative humidity and wind speed, respectively.
Figure 10.
Observations of sounding balloons at 8:00 am on May 18th and 22nd. The sounding station is located 120 km southwest of the radar. (a–c) are the vertical profiles of temperature, relative humidity and wind speed, respectively.
Figure 11.
The second derivative of horizontal wind speed (fill color; units: s−1m−1) and the value of the DWR (the isopleths; units: dB) on May 18th (a) and 22nd (b), respectively.
Figure 11.
The second derivative of horizontal wind speed (fill color; units: s−1m−1) and the value of the DWR (the isopleths; units: dB) on May 18th (a) and 22nd (b), respectively.
Table 1.
Specification of the dual-frequency antenna multiplexing radar system.
Table 1.
Specification of the dual-frequency antenna multiplexing radar system.
| Specification | Ka-Band | X-Band |
|---|
| Wavelength | 0.86 cm | 3.2 cm |
Minimum detectable
Reflectivity | ≤−30 dBz@5 km | ≤−20 d Bz@5 km |
| Beam width | ≤0.33° | ≤1.0° |
| Sidelobe level | ≤−23 dB | ≤−28 dB |
| Pulse repetition interval | 833~1667 μs | 833~1667 μs |
| Range resolution | 30 m | 30 m |
Table 2.
Specifications of Wind3D-6000.
Table 2.
Specifications of Wind3D-6000.
| Qualifications | Specifications |
|---|
| Wavelength (um) | 1.55 |
| Pulse repetition (kHz) | 10 |
| Sampling rate (GHz) | 1 |
| Data update rate (Hz) | 4 |
| Pulse width (ns) | 100–400 |
| Pulse energy (μJ) | 150 |
| Range resolution (m) | 15–50 |
| Disclaimer/Publisher’s Note: The statements, opinions and data contained in all publications are solely those of the individual author(s) and contributor(s) and not of MDPI and/or the editor(s). MDPI and/or the editor(s) disclaim responsibility for any injury to people or property resulting from any ideas, methods, instructions or products referred to in the content. |
© 2023 by the authors. Licensee MDPI, Basel, Switzerland. This article is an open access article distributed under the terms and conditions of the Creative Commons Attribution (CC BY) license (https://creativecommons.org/licenses/by/4.0/).
