1. Introduction
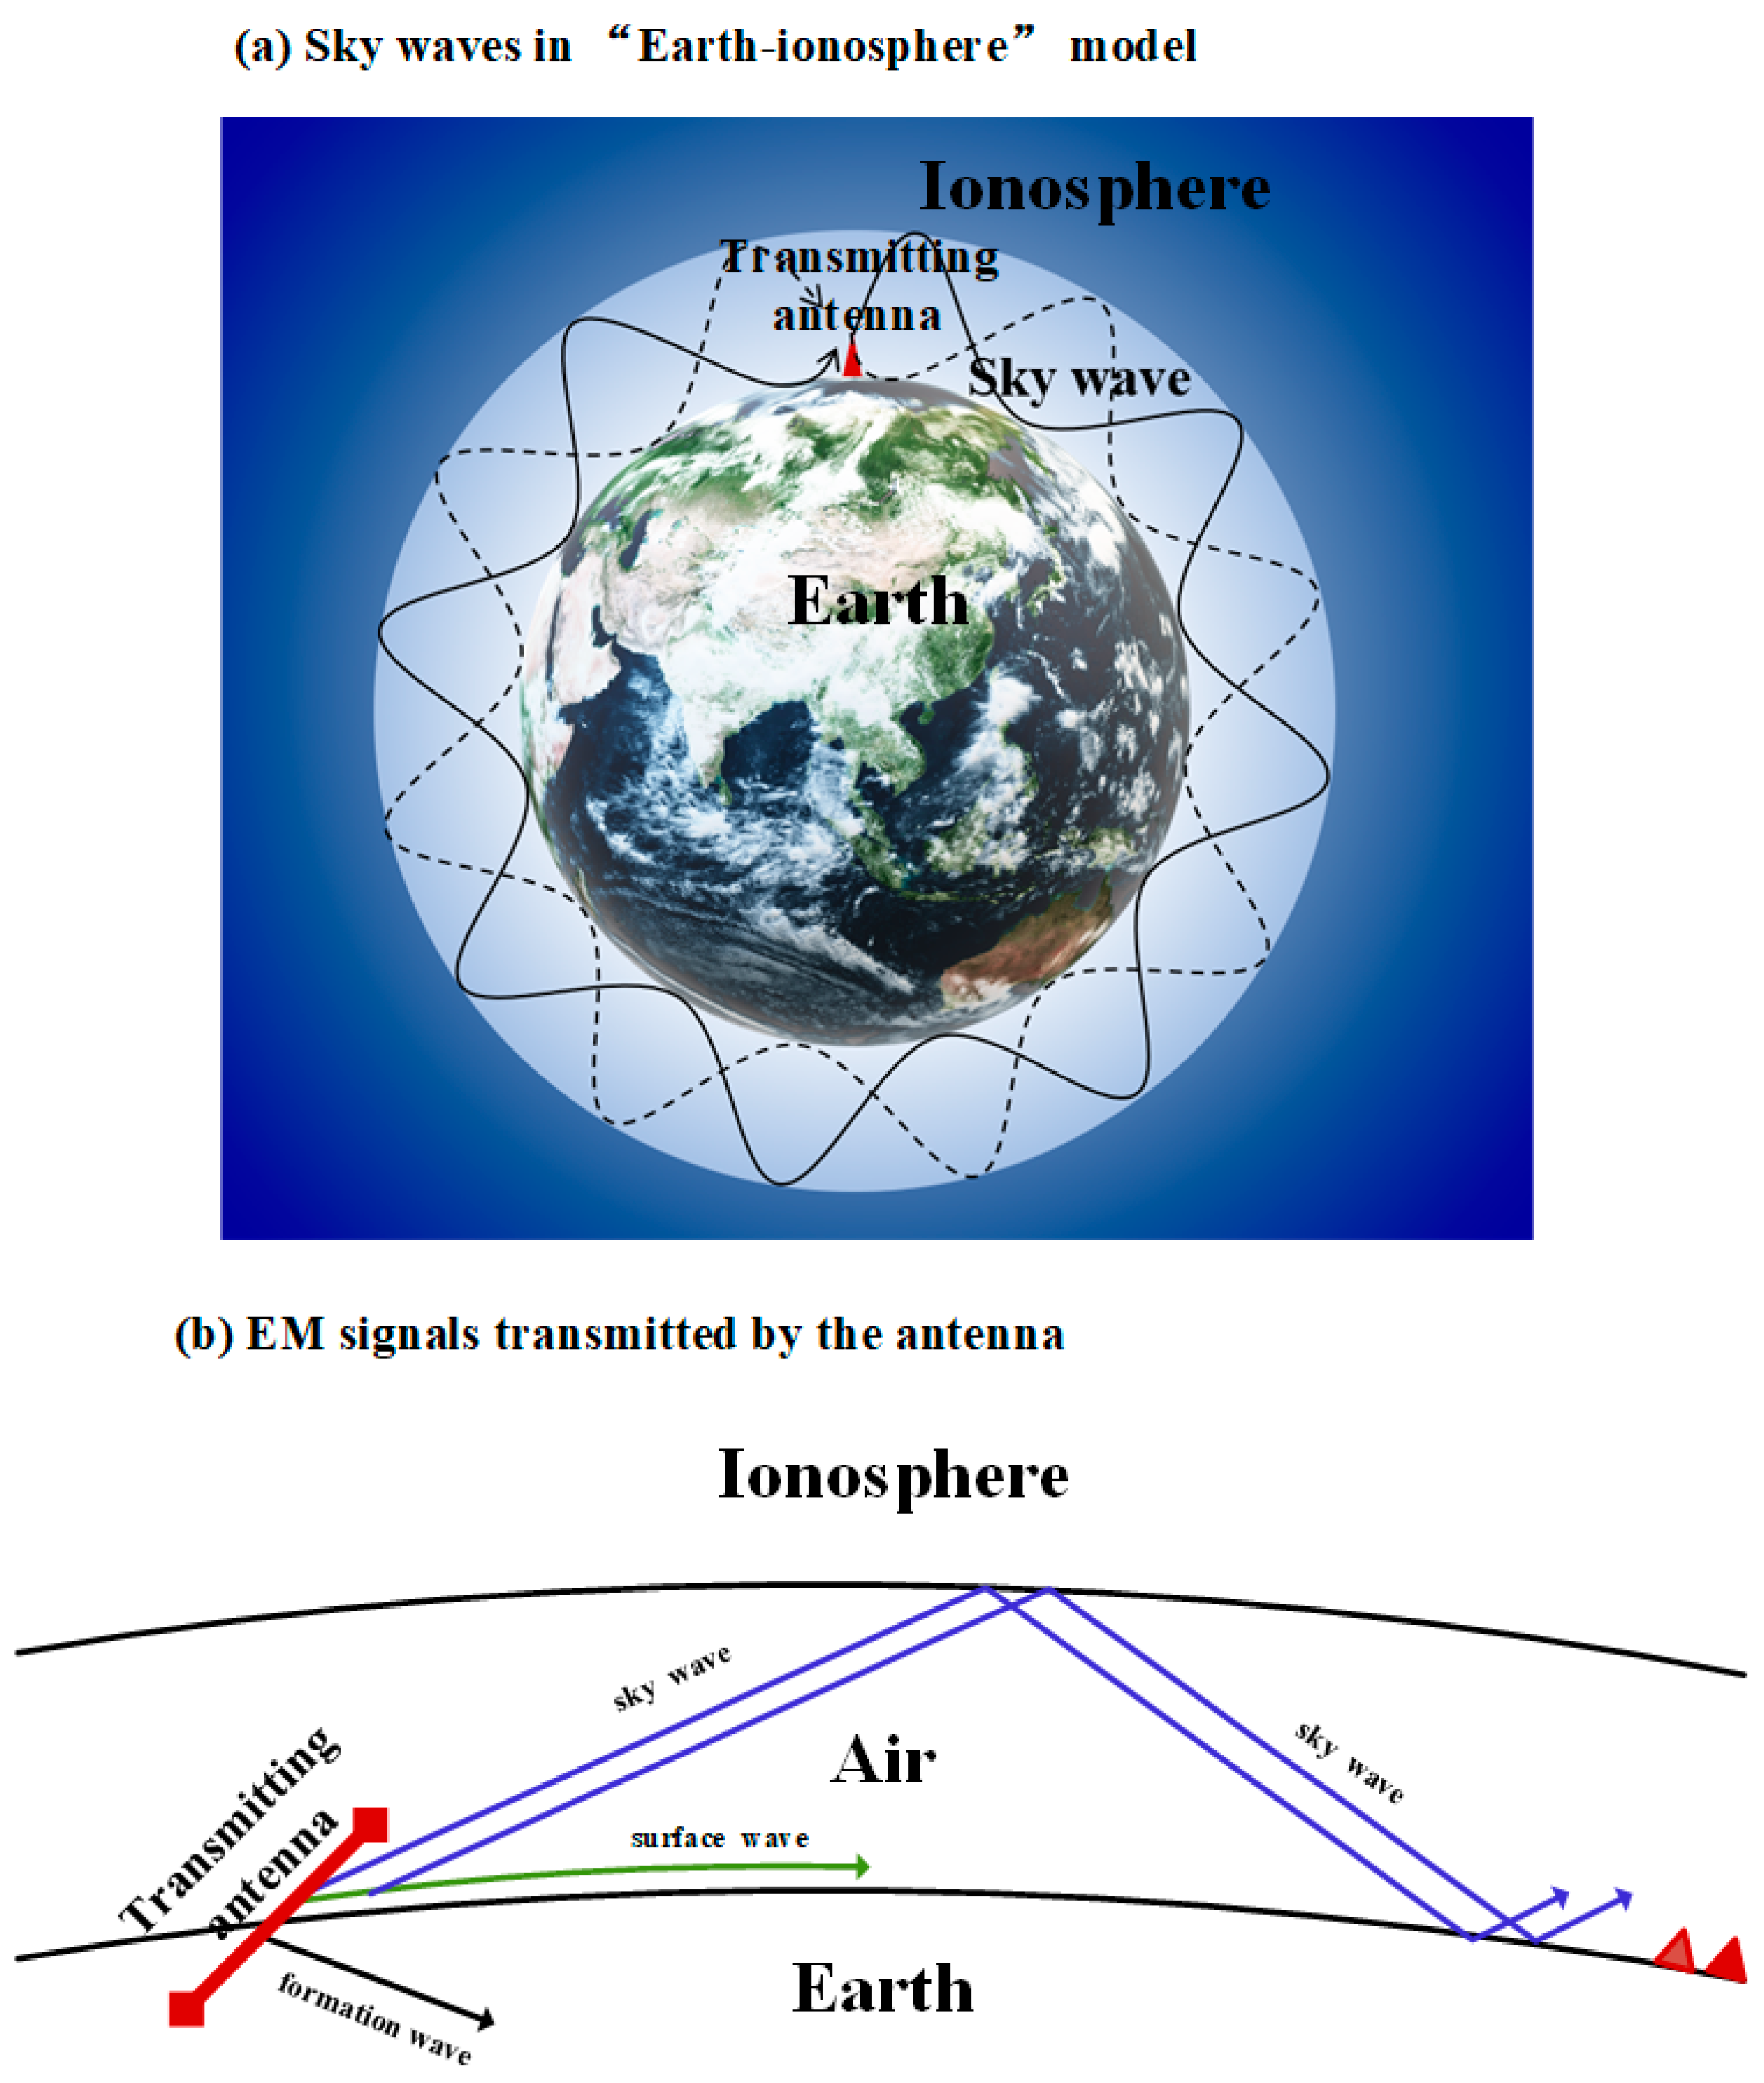
Controlled source is an extremely low-frequency electromagnetic field emitted by a 100-km-long horizontal dipole source with a power output of up to megawatts and a transmission frequency range of 0.1–300 Hz. Electromagnetic waves propagate forward through the spherical air waveguide due to the large electrical resistivity contrast between the Earth and air and between the ionosphere and air, also known as the “skywave”, shown in
Figure 1a. The “Skywave” was first used by researchers in the United States and the Soviet Union for submarine communications and other military purposes. Therefore, they began to study the propagation of skywaves on Earth [
1,
2,
3,
4,
5]. Communication between the ocean and land is challenging due to the high-frequency electromagnetic signals’ rapid attenuation in seawater [
6]. This issue is resolved using low-frequency (3–30 kHz) electromagnetic (VLF-EM) waves emitted by high-voltage wire [
7,
8,
9]. The frequency band in VLF-EM wave propagation theory is naturally extended to super low-frequency (SLF) (300–30 Hz) and extremely low-frequency (ELF) (30–3 Hz) EM propagation to increase the depth of underwater communication [
10,
11,
12,
13,
14,
15,
16]. Since the 1970s, many studies have been on wave propagation in a spherical earth. Here, the Earth is treated as a sphere rather than a planar ground [
17,
18,
19,
20]. In those studies, the internal structures of the Earth are ignored; rather, the Earth is considered a uniform sphere [
21,
22,
23,
24,
25,
26]. Though the simplified earth model lays a fundamental foundation for understanding the CSELF fields, the model does not have much use for geophysical exploration because of the lack of the Earth’s internal structure.
The skywave has a high potential for resource exploration because of its deep penetration into the lithosphere. In order to utilize the skywave to detect underground structures, geophysicists have proposed a new controlled source electromagnetic method: Controlled source extremely low frequency (CSELF) [
27,
28,
29,
30,
31,
32]. CSELF combines the advantages of magnetotellurics (MT) and controlled source audio-frequency magnetotellurics (CSAMT), which have a considerable detection depth and a high signal-to-noise ratio [
31]. Accurate theories and calculation techniques must be developed to interpret the field data. Several pioneers on CSELF established an “Earth-ionosphere” horizontal model that consists of the ionosphere and the Earth’s multilayer to simplify the mathematical complexity of the electromagnetic field in a spherical waveguide [
30,
31,
33]. However, the model does not consider the curvature of the Earth. To overcome these limitations, we consider the Earth’s curvature and include a spherically layered medium in the Earth. The new model establishes a framework for the geophysical purposes of the CSELF method.
The primary goal of this study is to establish an analytical solution for wave propagation by a horizontal electric dipole (HED) source on the surface of the spherical Earth used in the CSELF method. The new solution differs from that of Srivastava [
34] and Gao [
35] for a vertical electric dipole; the latter does not have much use in the CSELF method. In addition, this method is not limited to calculating the electromagnetic field on the Earth’s surface [
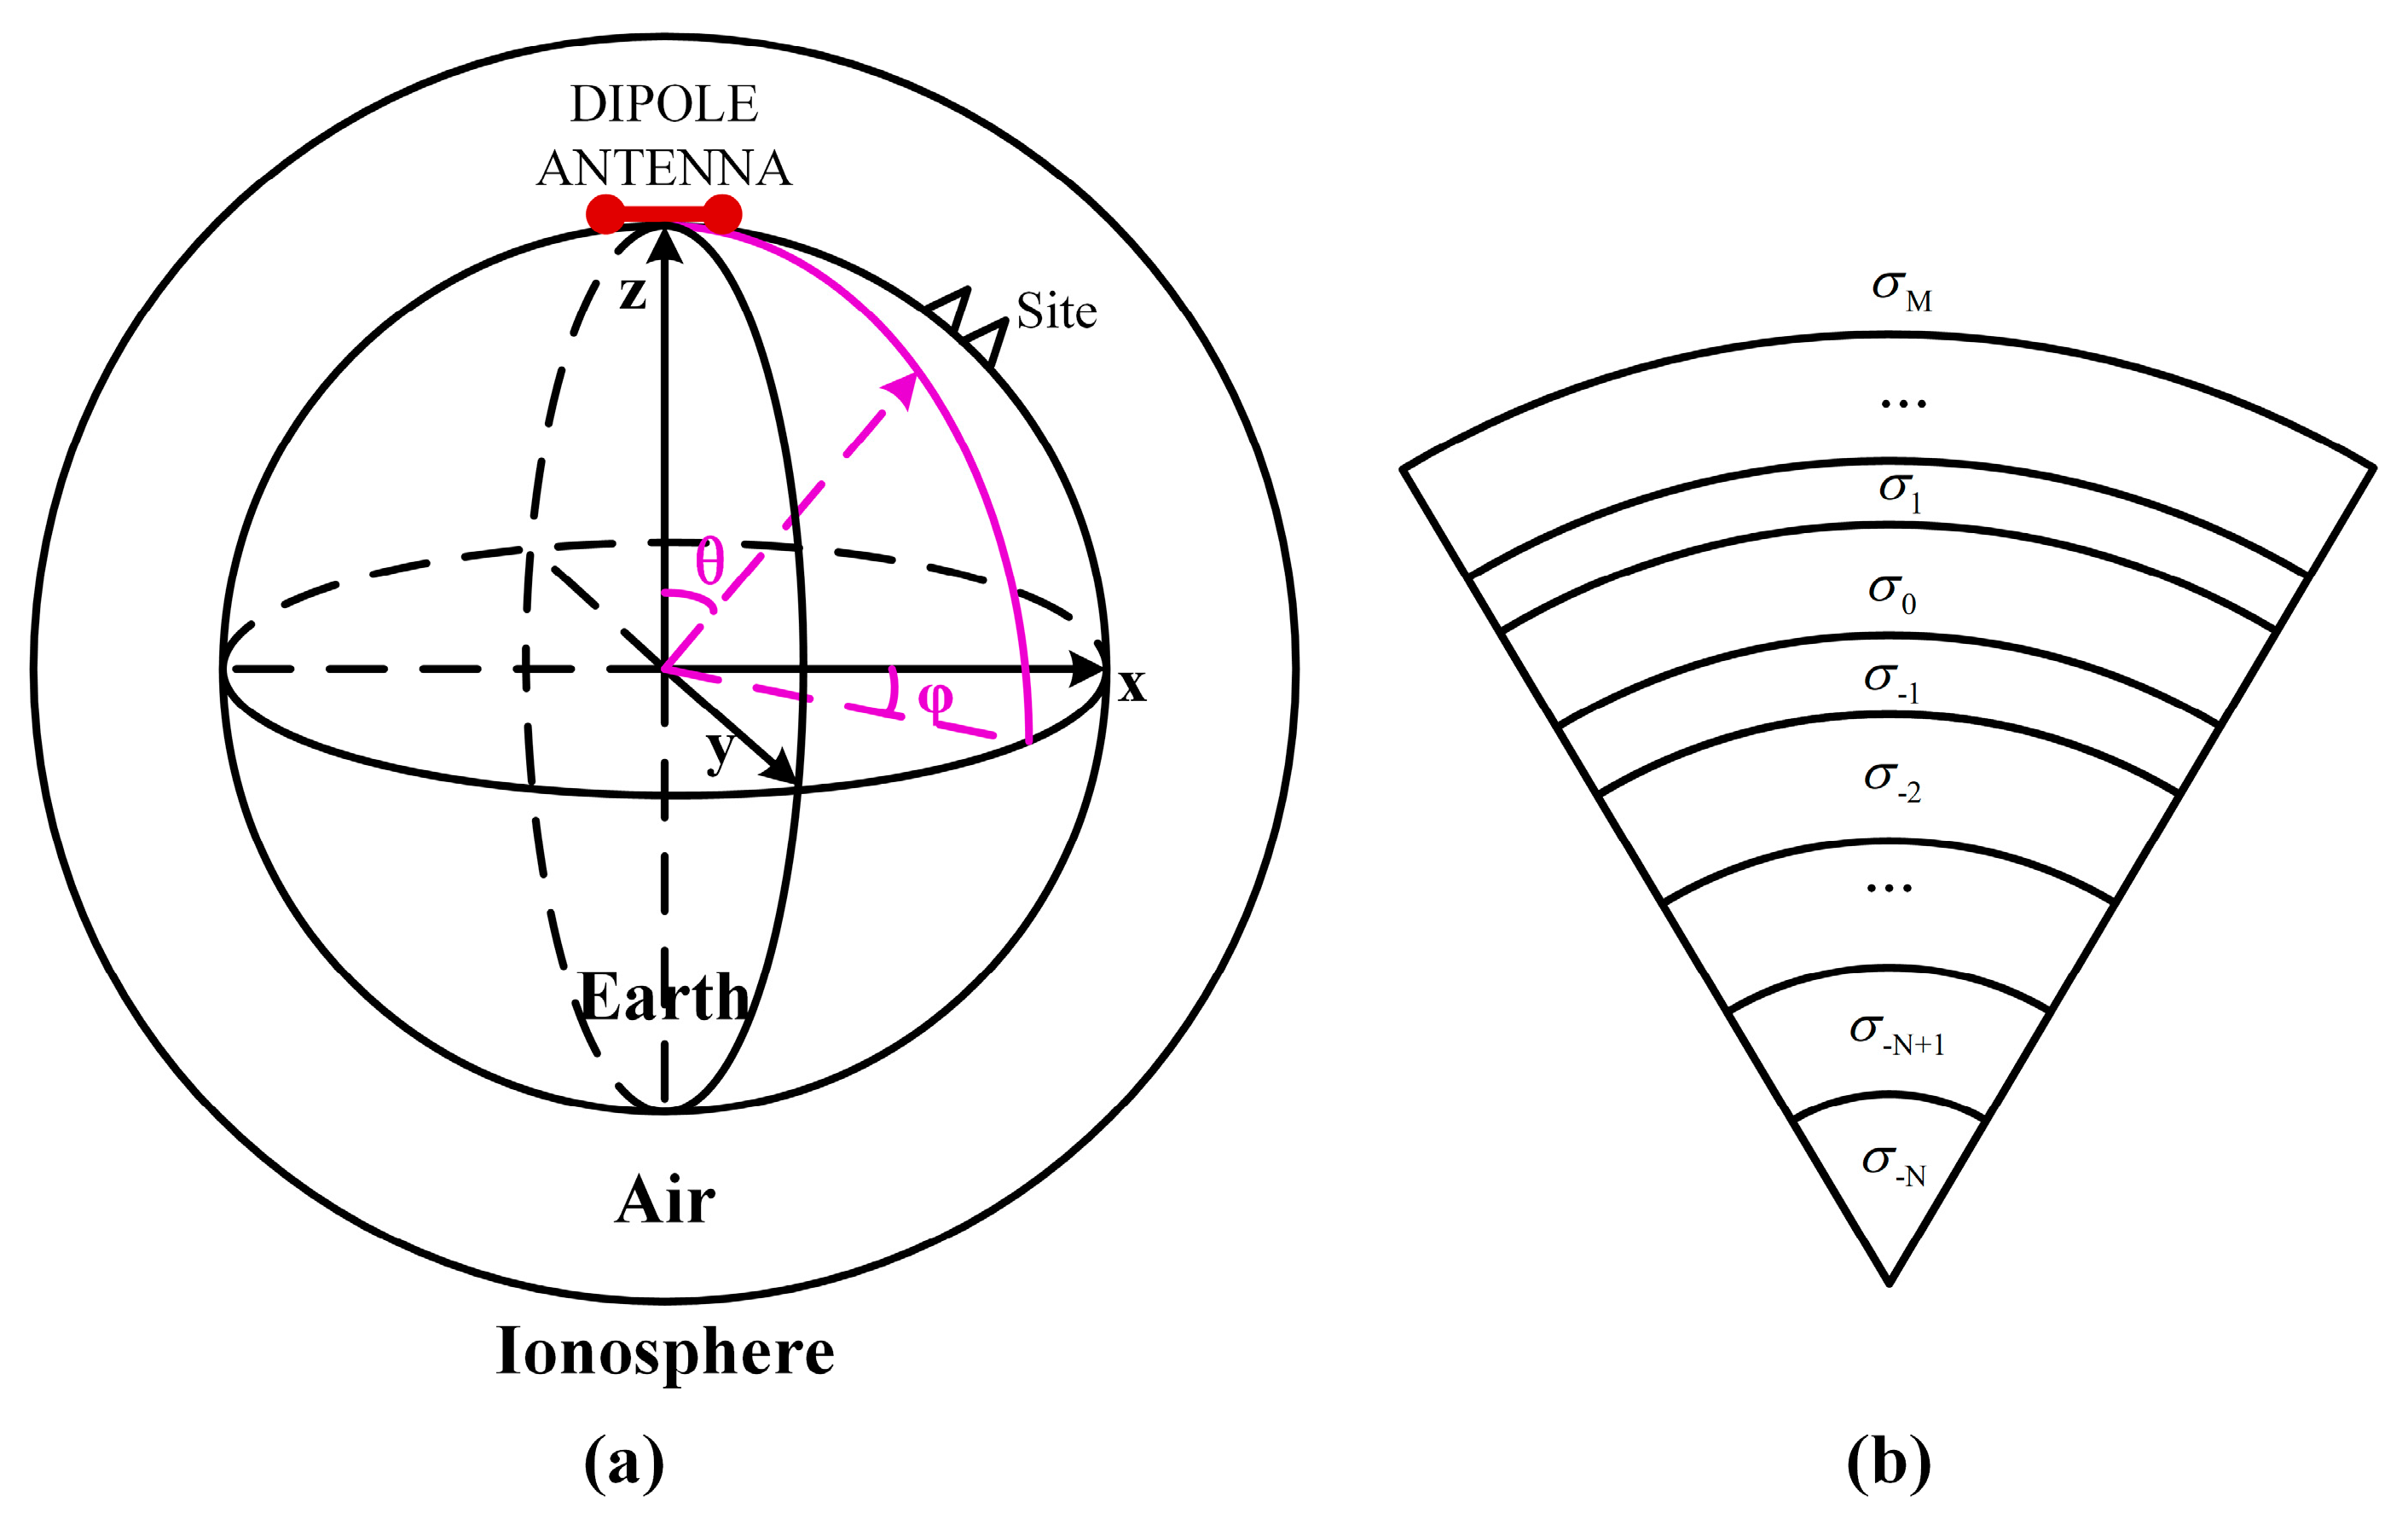
36]; it can also calculate the electromagnetic field inside the Earth, which is very useful for three-dimensional modelling. Taking into account the fact that the actual ionosphere is not a uniform medium, the model utilized in the formula derivation contained ionospheric vertical non-uniformity, as shown in
Figure 2b, which can be used to study the layered structure of the ionosphere. In this work, we introduce three techniques: function combination pair, “addition and subtraction term,” and Padé approximant [
35,
37], to ease the cost and further achieve a performance boost of 1000 times. Based on these results, which are notably different from the planar model, we have studied its physical mechanism and provided theoretical guidance for field data acquisition. We further investigated the influence of the ionospheric structure on electromagnetic fields. At the end of this work, we discussed the application of Cagniard’s apparent resistivity to the CSELF.
2. Materials and Methods
As shown in
Figure 1b, the horizontal antenna will generate formation waves that propagate underground, surface waves that propagate along the Earth’s surface, and sky waves that propagate upward in the air until they are reflected back to the ground through the ionosphere. In CSELF, sky waves are used to study the underground electrical structure. Thus, the source–receiver distance reaches thousands of kilometers [
38].
2.1. Spherical “Earth-Ionosphere” Full-Space Model
In order to deduce the formulas of the electromagnetic field emitted by the CSELF source in the spherical “Earth-ionosphere” model, we simplified the artificial source to a horizontal electric dipole (HED), as shown in
Figure 2. Considering the vertical anisotropic nature of the Earth and ionosphere, our model consists of multilayer media, and all layers in the model are isotropic media as well.
To make the formula, including four curl operators in spherical coordinates [
35], more concise, we introduce a coordinate system with the spherical center as the origin, while the axis of the HED (of dipole moment dl) is oriented in the x direction, and it is assumed to carry a constant current I. In this coordinate, we used the relationship between the magnetic vector potential
A and the electric dipole source (Equations (3)–(5)) to derive the expression of the primary field without curls.
The HED is located at , and the receiver is located at . The axes of the cartesian coordinate pass through , . We denote the medium where the HED is located as the 0th medium. The distance from the top interface of each layer to the center is .
2.2. Derivation of the Formulas
With the time-harmonic factor
,
, and the Debye potential
and
, the electromagnetic wave is divided into TM and TE waves [
39], and the fields are expressed as follows:
where
σ is the conductivity of the medium,
ω is the angular frequency,
ε is the dielectric constant,
µ is the permeability of the medium,
E is the electric vector, and
H is the magnetic vector.
The Green’s function of the uniform space is expressed as follows, to ensure that the time t of the field lags the time of the source:
According to the relationship between the magnetic vector potential
A and the electric dipole source:
Therefore,
where
R is the distance between the receiver and the source,
k is the wave number,
,
is the 0 order spherical Hankel function,
dl is the electric dipole moment,
r> and
r< are the larger and smaller of the radial coordinate of the source and the receiver, respectively, and
is the Legendre function.
The primary field is obtained by transforming the magnetic vector into spherical coordinates:
where
is the n-order spherical Bessel function, and
is the n-order spherical Hankel function.
The Debye potential
and
satisfy the Helmholtz equation. In the spherical coordinate, the basic form of the general solution is obtained by separating variables:
where
a and
b are two-dimensional column vectors, and
is the associated Legendre function.
The reflection and transmission of the primary field of the source generate the electromagnetic field in the passive region. The orthogonality of
and
means that all waves are decoupled. Thus, the general solution of the passive region should be the same as the form of the primary field:
The boundary condition adopted is a general boundary condition where the tangential electromagnetic field is continuous, and the mathematical expression follows:
The definite solution is the general solution plus the special solution. Given the boundary conditions, we derive the formulas of the electromagnetic field at an arbitrary point in the spherical “Earth-ionosphere” model.
where
is the generalized reflection coefficient,
is the generalized transmission coefficient and the influence factor of each layer due to multiple reflections in multilayered media [
35]. See
Appendix A for a detailed expression of the coefficient.
2.3. Numerical Calculation
The formulas include a spherical Bessel function and an associated Legendre function. We defined the electrical size of the model as kr. Since the Earth’s radius is approximately 6370 km, the huge electrical size of the Earth causes the series to converge very slowly [
23]. In the small-scale model, the series can converge with a ten-fold magnitude. On the Earth scale, the series is still difficult to converge within the order of tens of millions. To solve the above numerical problem, we took three techniques. The first technique we used was to change the formula form to relieve the memory demand, where the enormous electrical size makes trouble. For the derivative of the spherical Bessel function, we adopt the recursive formula:
To calculate the brackets values in Equation (10) more efficiently, we follow Equation (11) and extract the multiplication of and , where the reciprocal connection between them eliminates the considerably large value.
Barrick [
23] proposed a fast convergence method that consists of adding and subtracting another series to the solution. The subtracting series is the approximate value of each original series at
n → ∞, and the added term is the sum of all approximate values. Based on this idea, we derived the approximate values and the sum of the approximate values of 10 electromagnetic components in the TM and TE wave modes. This problem’s specific convergence method was provided, and is abbreviated as the “addition and subtraction” convergence method (see
Appendix B).
When using the “addition and subtraction” convergence method, the numerical summation converged when
n was greater than 10
6. We introduced the Padé approximant to accelerate the convergence further [
35,
37]. The series converged when
n took a value of 1000 and greatly improved the complexity of our solution.
3. Results
In this section, a comparison between previous results and data measured in the field was performed to verify the accuracy of the formulas and numerical results. We discussed the electromagnetic characteristics of the spherical “Earth-ionosphere” model, compared it with the results of the planar layered model, and analyzed its physical mechanism. In addition, the global electromagnetic radiation map was also given to guide data acquisition in CSELF exploration.
3.1. Correctness Verification
3.1.1. Comparison of the Theoretical Results
The Earth is considered a uniform sphere. Peng [
25] gave the numerical results of the electromagnetic field in the spherical waveguide of the Earth-ionosphere. Although the model is not particularly useful for geophysical exploration, it can be used to validate our results. The resistivity of air is 10
14 Ω·m, the resistivity of the ionosphere is 10
5 Ω·m, and the resistivity of Earth is 1000 Ω·m, corresponding to 0, 1, and −1, respectively, in
Figure 2b. The height of the ionosphere from the ground is 85 km, the radius of the Earth is 6370 km, and the electric dipole moment is Idl = 1 A·m, as shown in
Figure 2a.
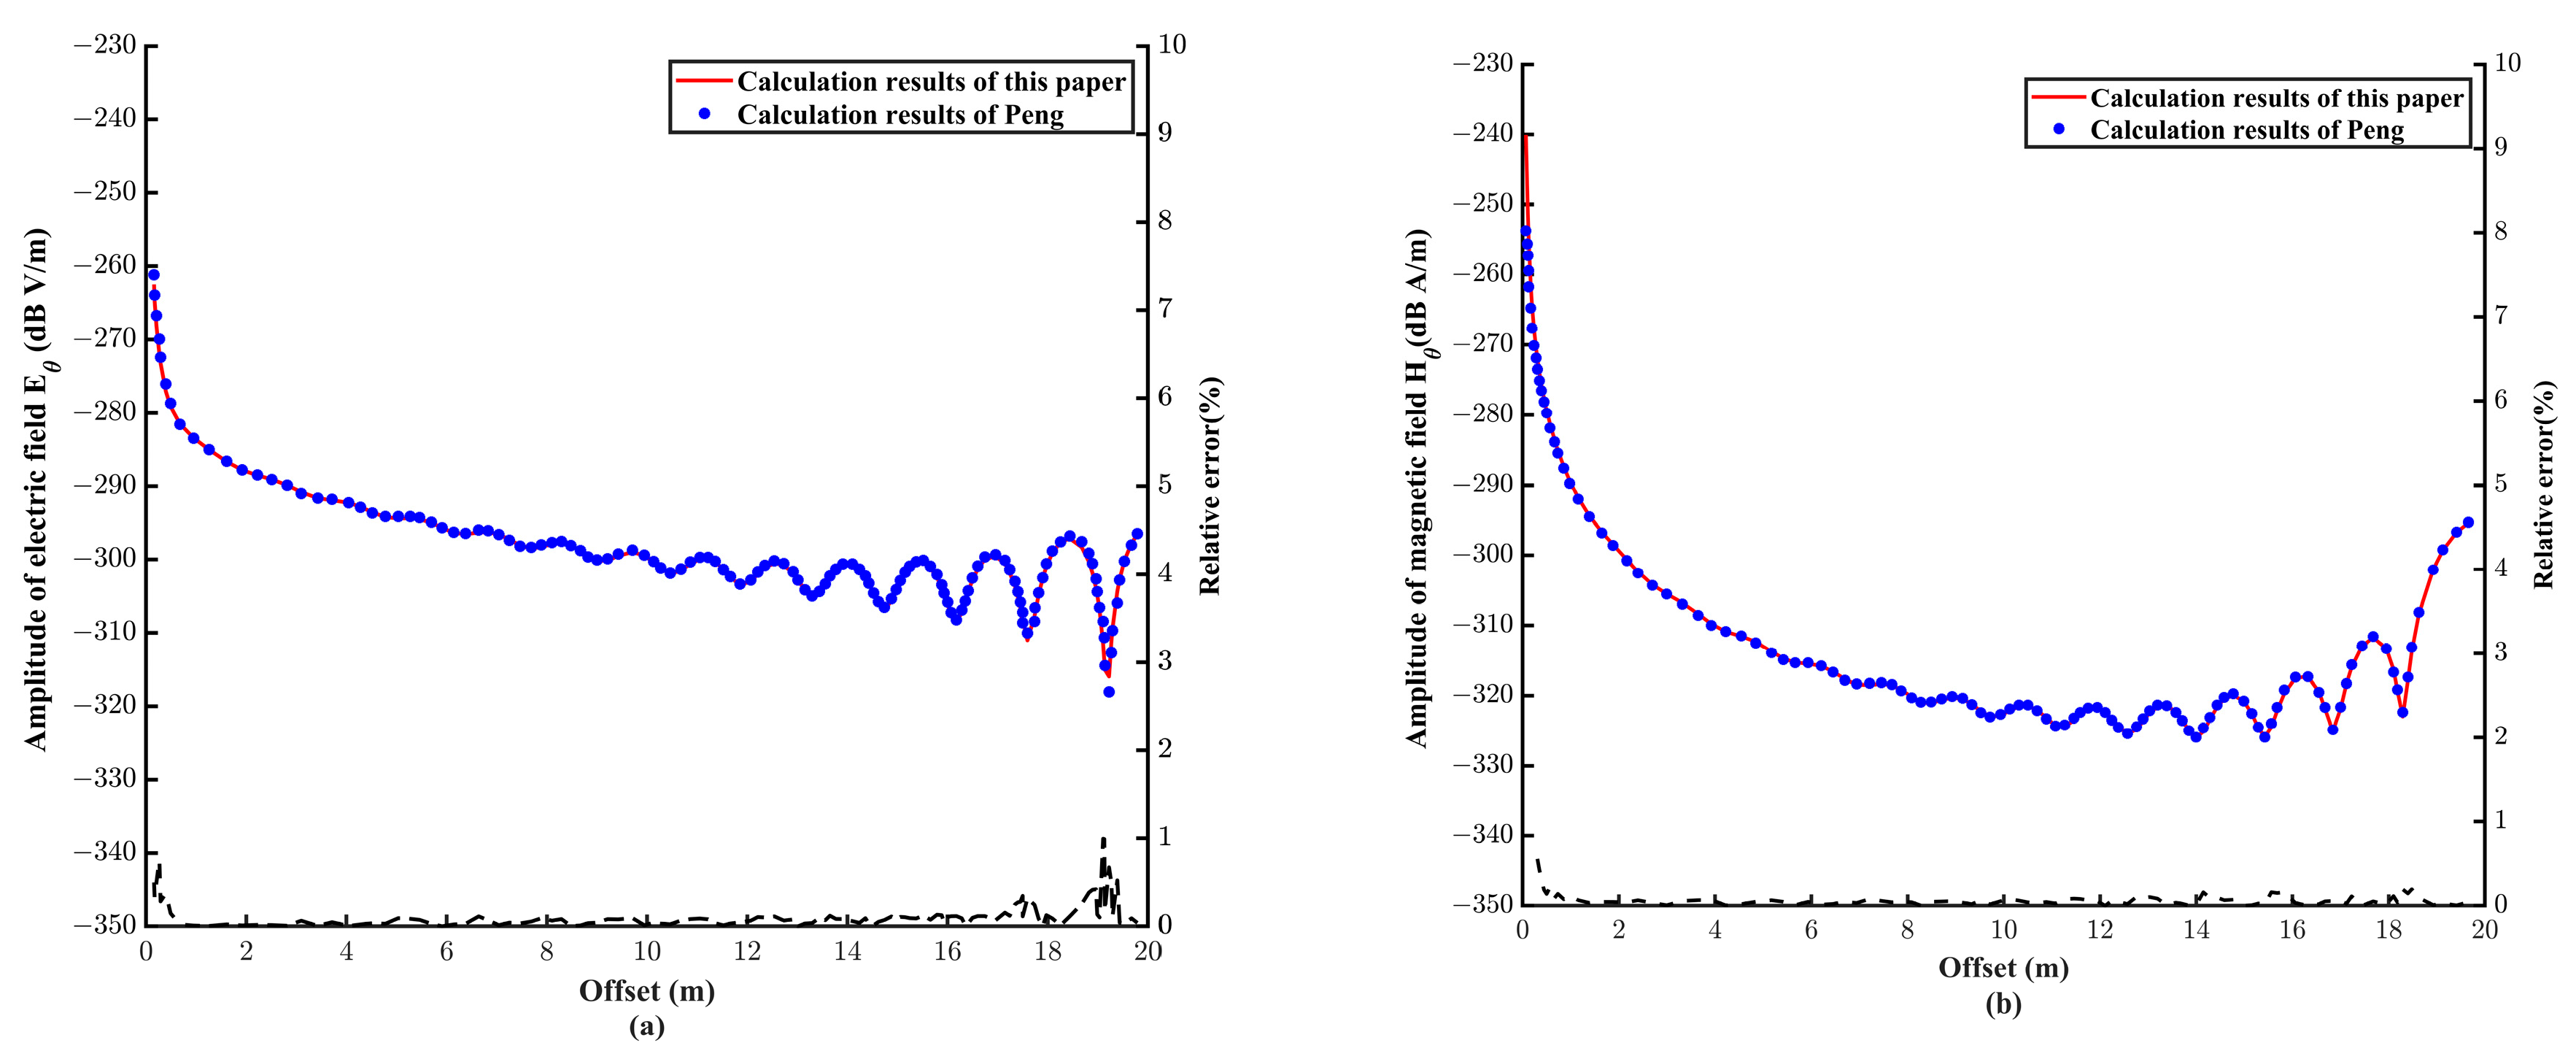
The two results, depicted in
Figure 3, were essentially consistent. We further calculated the relative error between our results and those of Peng. The black dotted line shows that the relative error is less than 1%.
3.1.2. Comparison of Data Measured in the Field
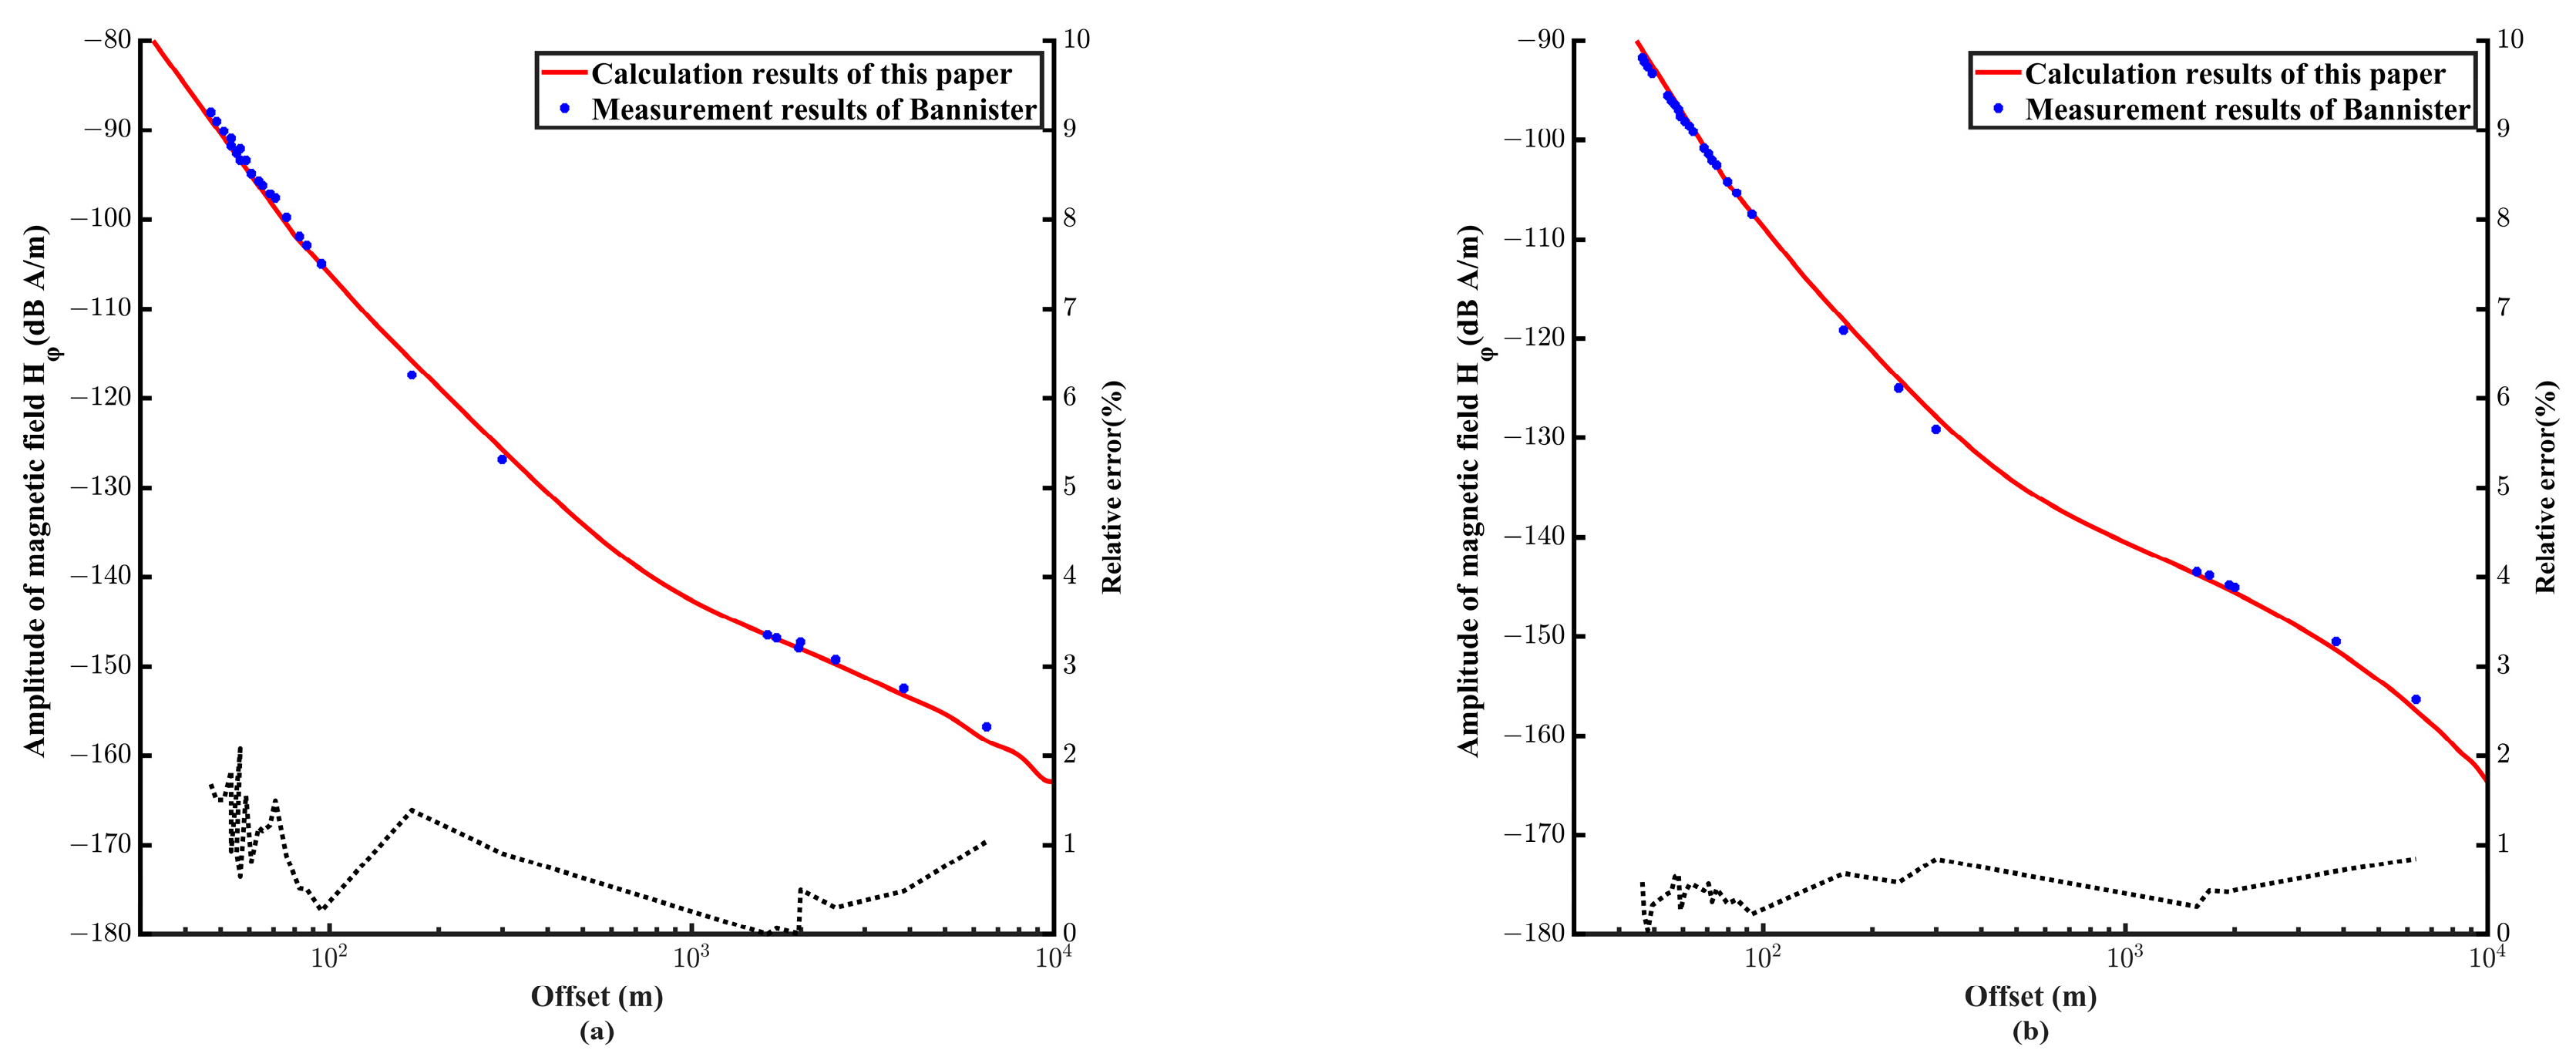
The measurement conditions specified by Bannister (1973) are as follows [
1]: the conductivity of Earth is 2.8 × 10
−4 S/m, the angle between the measuring path and source is 15° at a frequency of 45 Hz; the conductivity of Earth is 3.2 × 10
−4 S/m, the angle between the measuring path and the source is 19° at a frequency of 75 Hz; and the Wisconsin station is an east–west antenna with a length of 22.5 km and current of 300 A. We simulated the electromagnetic field and then compared the results with the data published for the Wisconsin station.
Figure 4 indicates the agreement between the simulation and the data measured in the field, and only a few points have a slight deviation. The relative error between the theoretical and measured values is less than 2%, as shown on the black dotted line. The model we used is an approximation of the ionosphere, and with the spatial disturbance of the ionosphere and measurement error, we believe that the calculation accuracy of this paper is acceptable.
3.2. Analysis of the Electromagnetic Characteristics
3.2.1. Comparison between Planar and Spherical Model
To illustrate the influence of the curvature of the Earth on the electromagnetic field, we compared the calculation results of the planar model [
31] and the spherical model based on the resistivity of air and ionosphere. Earth is 10
14 Ω·m, 10
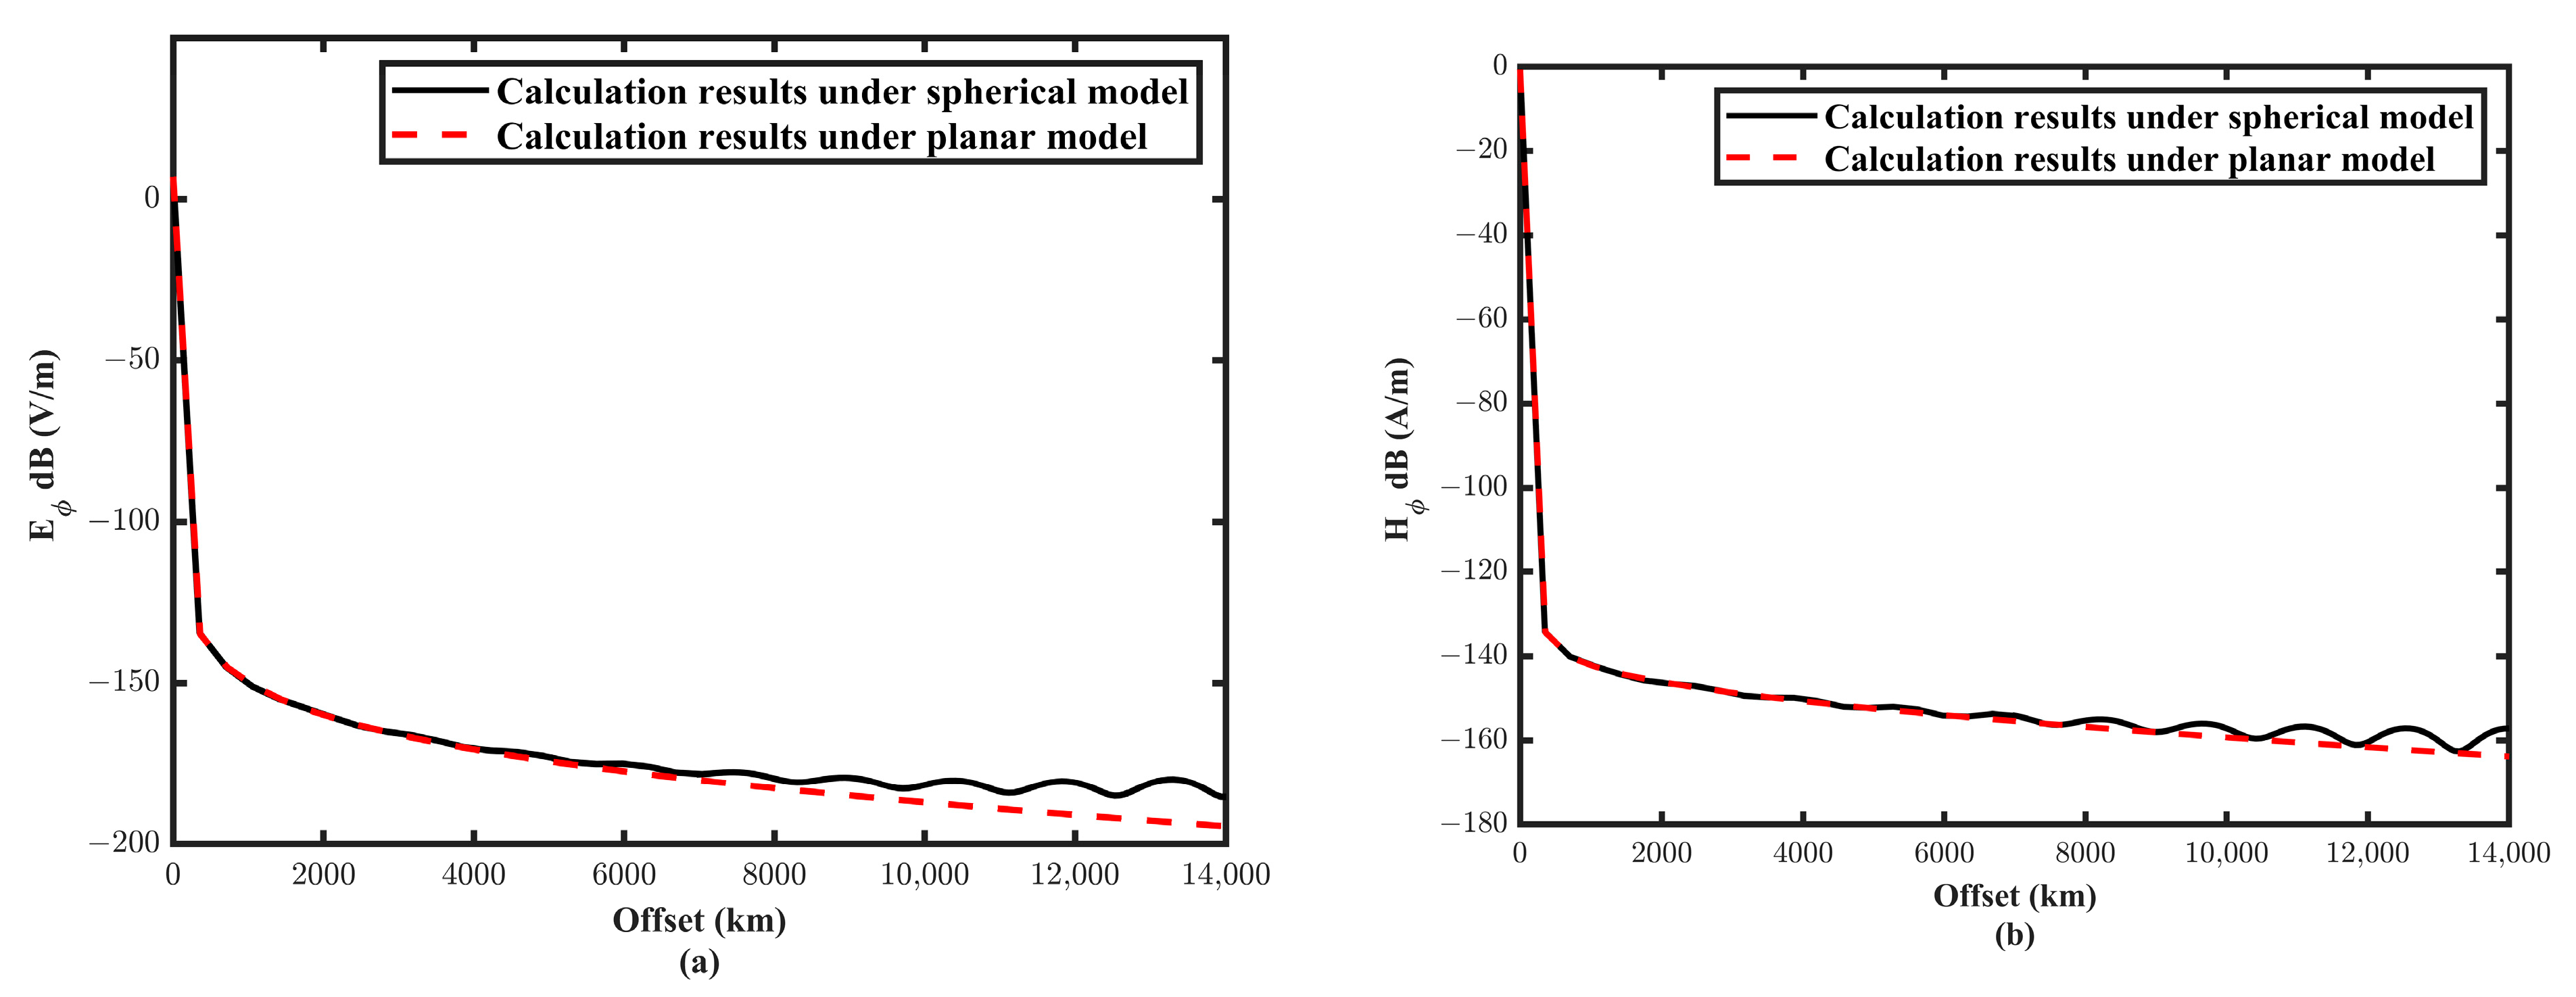
5 Ω·m, and 1000 Ω·m, the height of the ionosphere from the ground is 100 km, the radius of the Earth is 6370 km, and the electric dipole moment is Idl = 250 A × 50 km. When the source–receiver distance is less than half of the Earth’s radius, the influence of the Earth’s curvature is small, and the Earth’s surface can be approximated to a plane.
Figure 5 shows that the calculation results of the two are in good agreement within 3000 km, but the curves diverge with the increase in distance.
It was discovered that the field may oscillate in space with a growing amplitude in the spherical cavity model at greater offset. Contrary to the conventional planar model, the fields on the global scale do not decay with the source–receiver distance. The ionosphere, air, and Earth together make up a horizontal infinite waveguide in a planar layered model; as a result, electromagnetic waves from the source propagate in all directions. In the spherical model, however, the ionosphere, air, and Earth form a closed spherical waveguide. Electromagnetic waves trapped in the waveguide may produce resonance. In the near-field, resonance is absent because the fields directly emitted from the source are dominant and display only geometrical decay.
3.2.2. Curve Characteristic Analysis
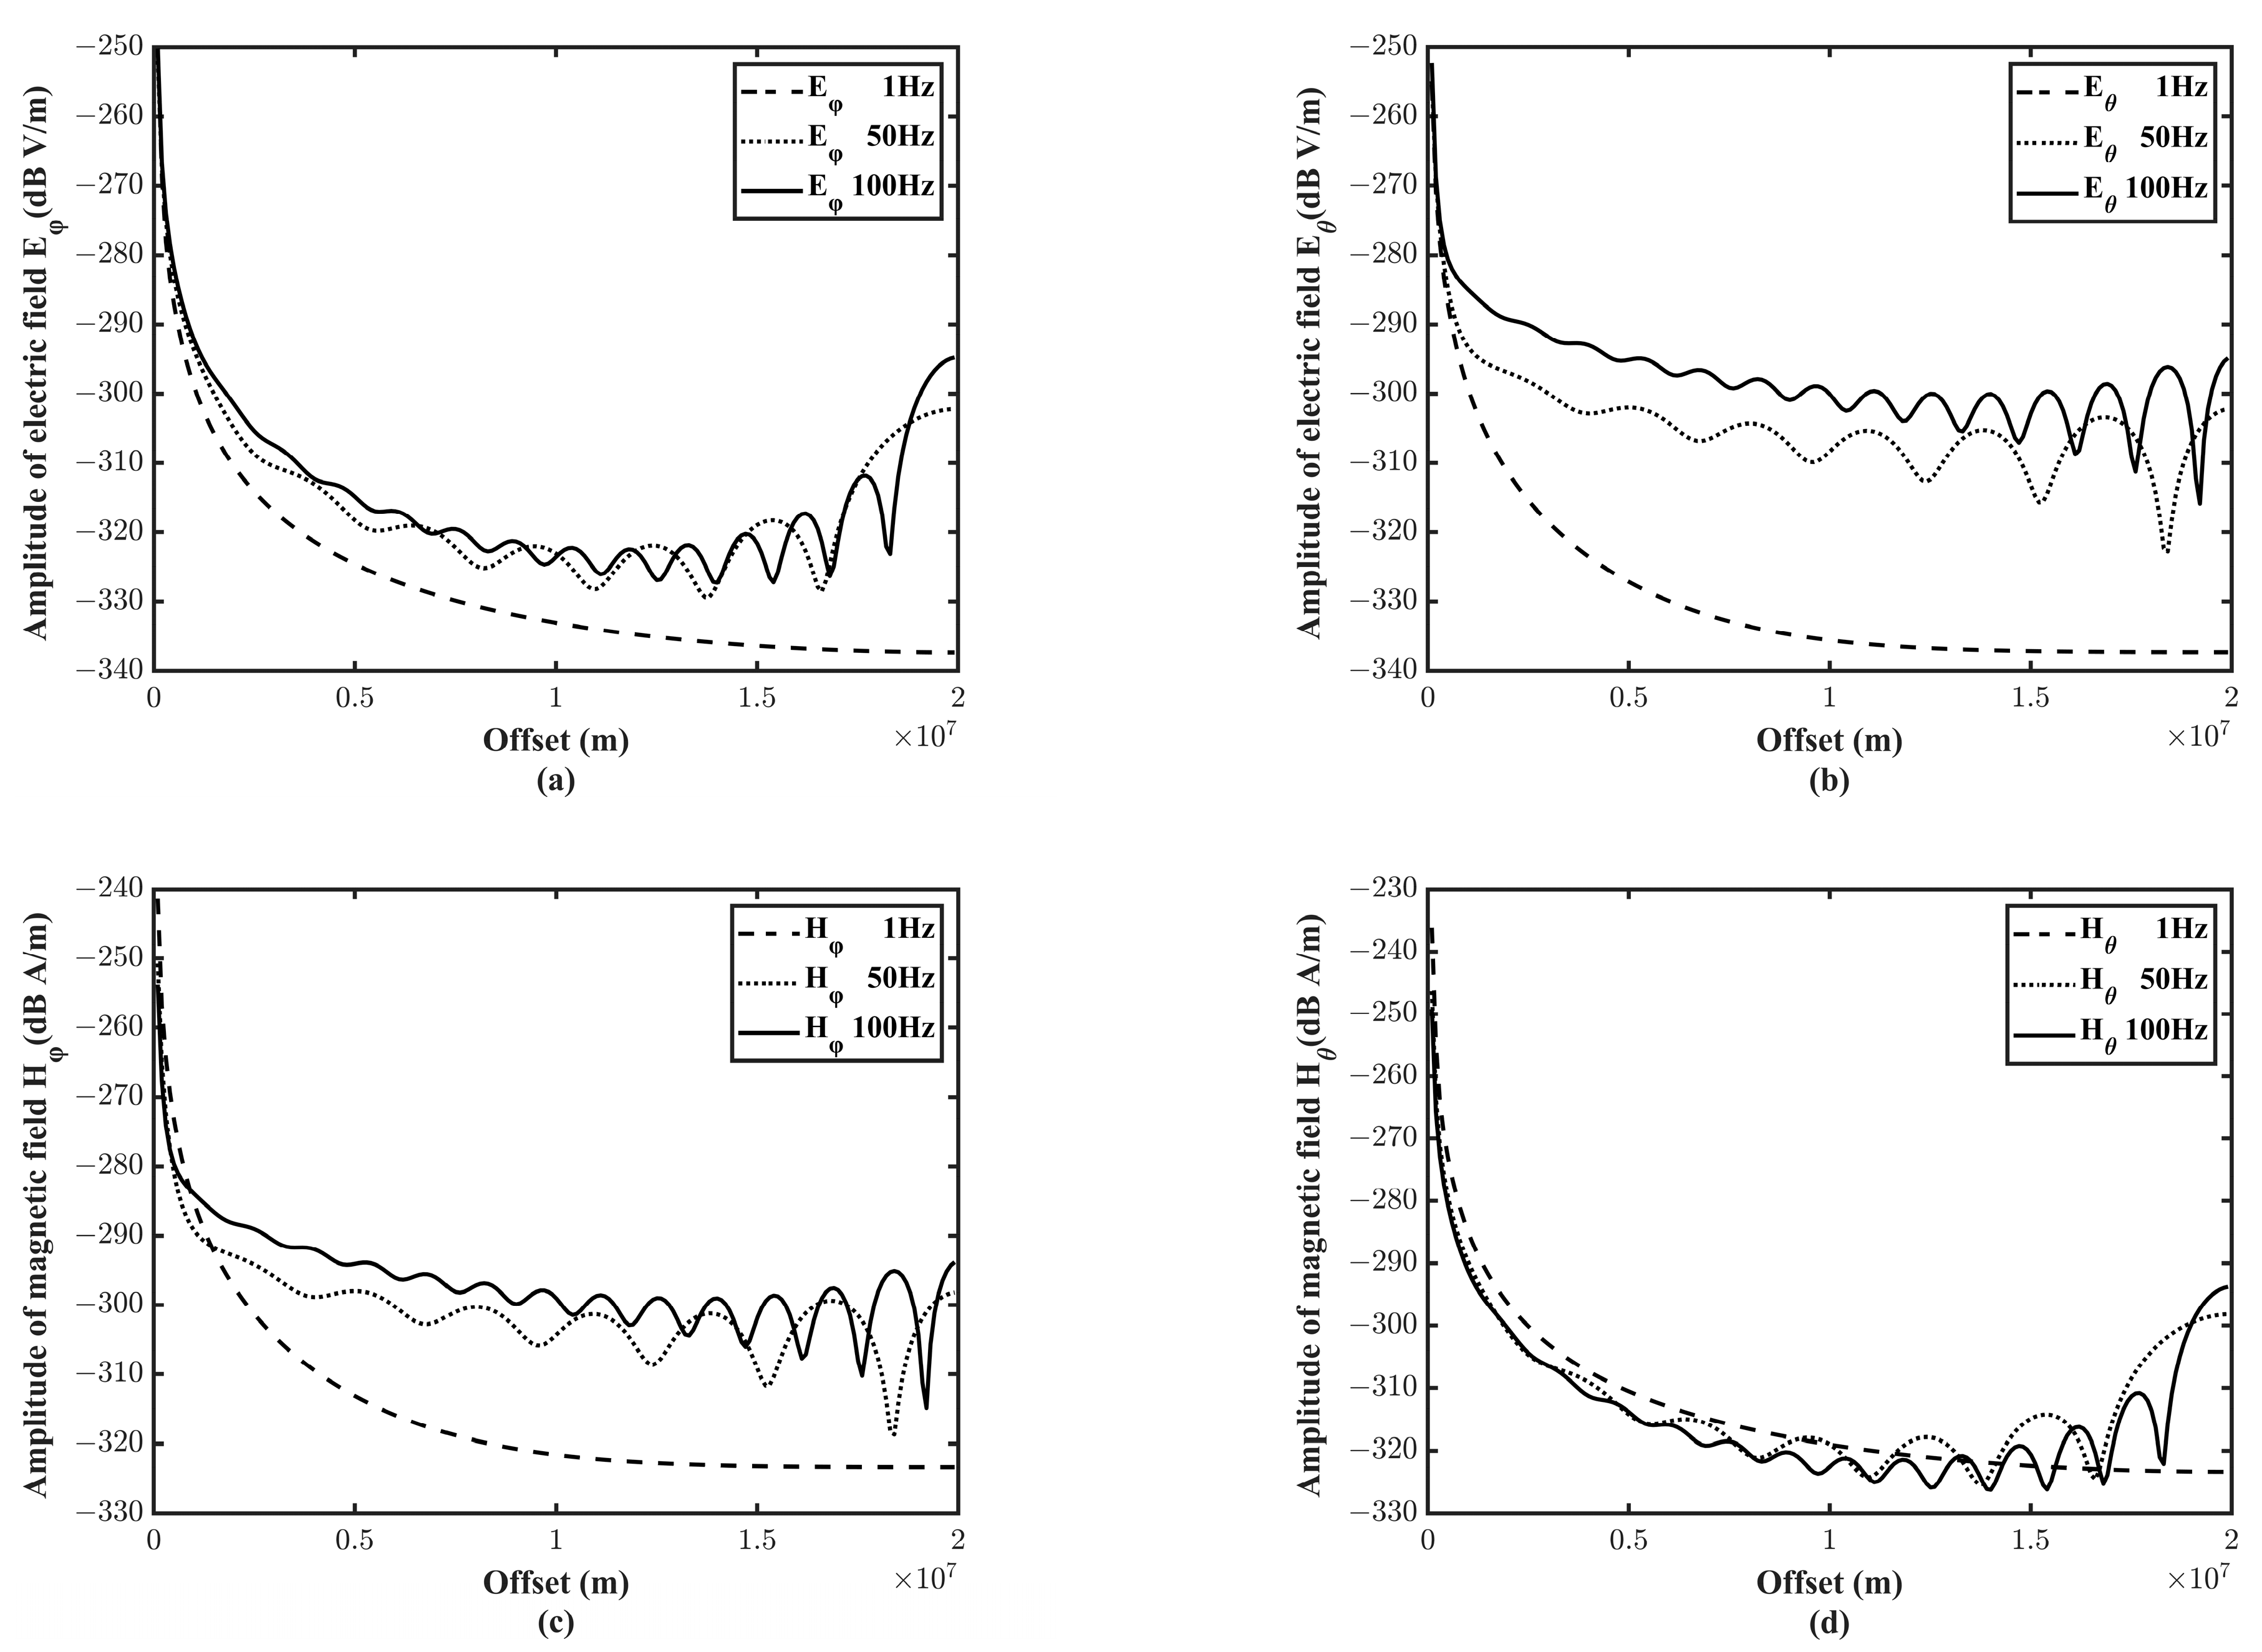
To explain the characteristics of the electromagnetic field under the global spherical “Earth-ionosphere” cavity, we examined the electromagnetic field propagation curves at different frequencies. Under the same model parameters as the previous section, the source was a unit dipole.
Figure 6 illustrates the electromagnetic field propagation rule that the spatial oscillation frequency increases with the temporal frequency. The wavelength is inversely proportional to the frequency. Thus, the higher the frequency, the shorter the wavelength, which results in more antinodes. The fields emitted by the source travel in all directions and arrive in the same phase at the mirror point. As a result, the fields at the mirror point are always the strongest locally.
3.2.3. Radiation Pattern
To further understand the spatial characteristics of the fields emitted by a CSELF source, we investigated the radiation pattern of the fields in 3-D.
Figure 7,
Figure 8,
Figure 9 and
Figure 10 show the
,
,
, and
field patterns at 10 Hz. We observed that the fields attenuated slowly in the spherical waveguide region except in the resonant area. A comparison of
and
shows that in the Northern Hemisphere,
was less affected by the low value region, whereas in the Southern Hemisphere,
was less affected by the low value region. The magnetic field presents similar laws.
Under the influence of the ionosphere, the electromagnetic field emitted by the HED becomes strong in some places and weak in others. Collecting electromagnetic signals in an area with a weakened field strength is bound to be detrimental to studies on underground structures. The electromagnetic waves received on the surface convey both noise and helpful signals carrying underground information. The signal-to-noise ratio will decrease if electromagnetic signals are collected in a region with weak field strength. This further affects the quality of data interpretation. Therefore, drawing electromagnetic field radiation patterns can guide field data acquisition and collect higher-quality signals in strong areas.
3.2.4. The Influence of Ionospheric Structure on Electromagnetic Fields
Although we can equate the ionosphere with a uniform medium with a certain conductivity, its layered structure can also have an impact on the electromagnetic field. The ionosphere serves as a propagation medium for electromagnetic waves, which are refracted, reflected, dispersed, and absorbed, with some energy lost in the process. Therefore, it is necessary to study the influence of ionospheric structure on electromagnetic fields.
We set the conductivity of the ionosphere at 10
−5 S/m as model U (uniform), which corresponds to σ
1 in
Figure 2b. In model G (σ
2 < σ
1), the conductivity of the ionosphere was 10
−5 S/m and 10
−7 S/m, corresponding to σ
−1 and σ
−2. In model D (σ
2 > σ
1), the conductivity of the ionosphere was 10
−5 S/m and 10
−3 S/m, corresponding to σ
−1 and σ
−2. The conductivity of air was 10
−14 S/m, and the conductivity of the Earth was 0.001 S/m, corresponding to σ
0 and σ
1 in
Figure 2b. The height of the ionosphere from the ground is 85 km, the radius of the Earth is 6370 km, and the electric dipole moment is Idl = 1 A·m, as shown in
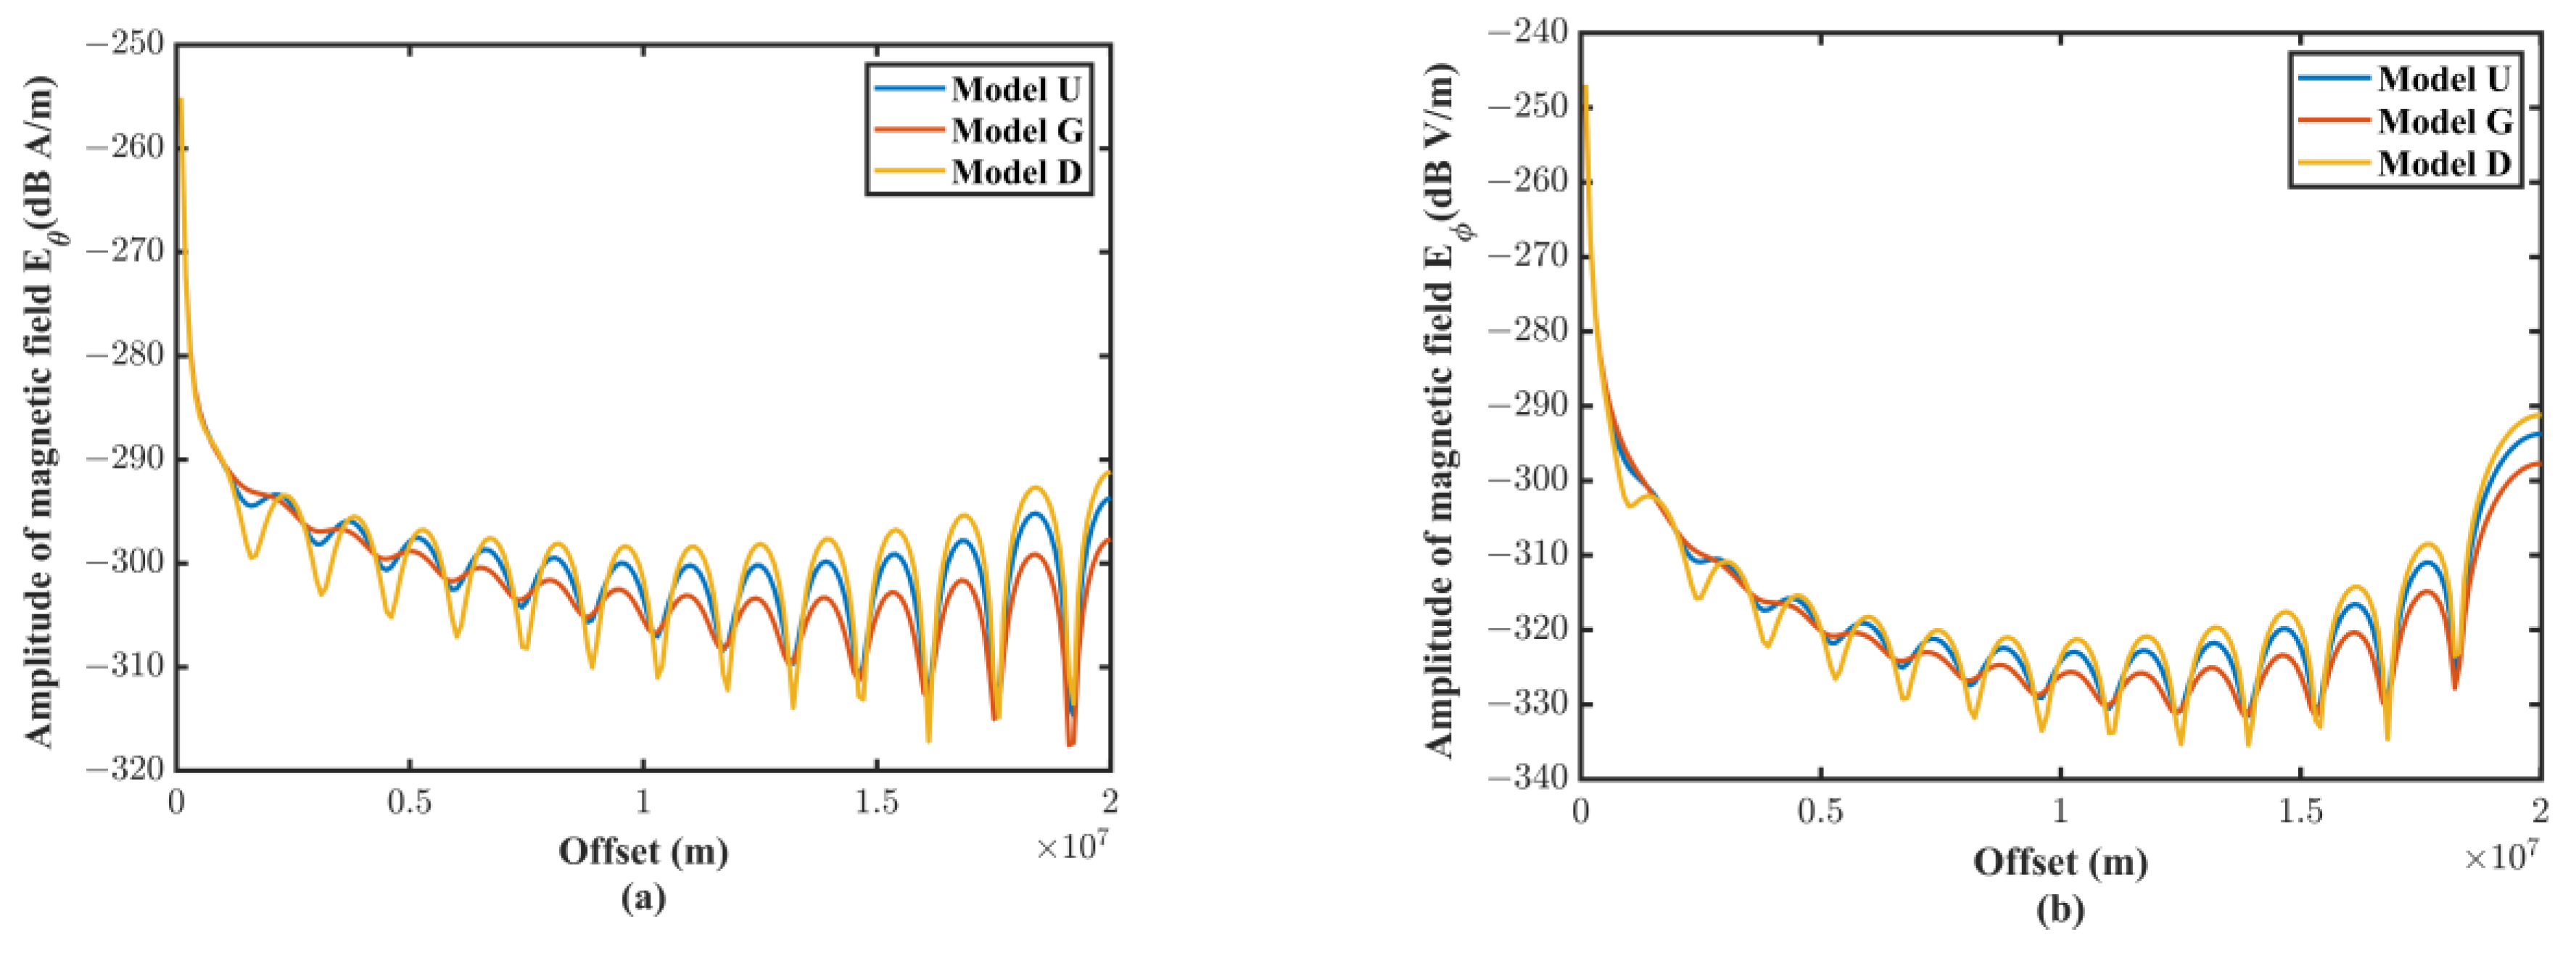
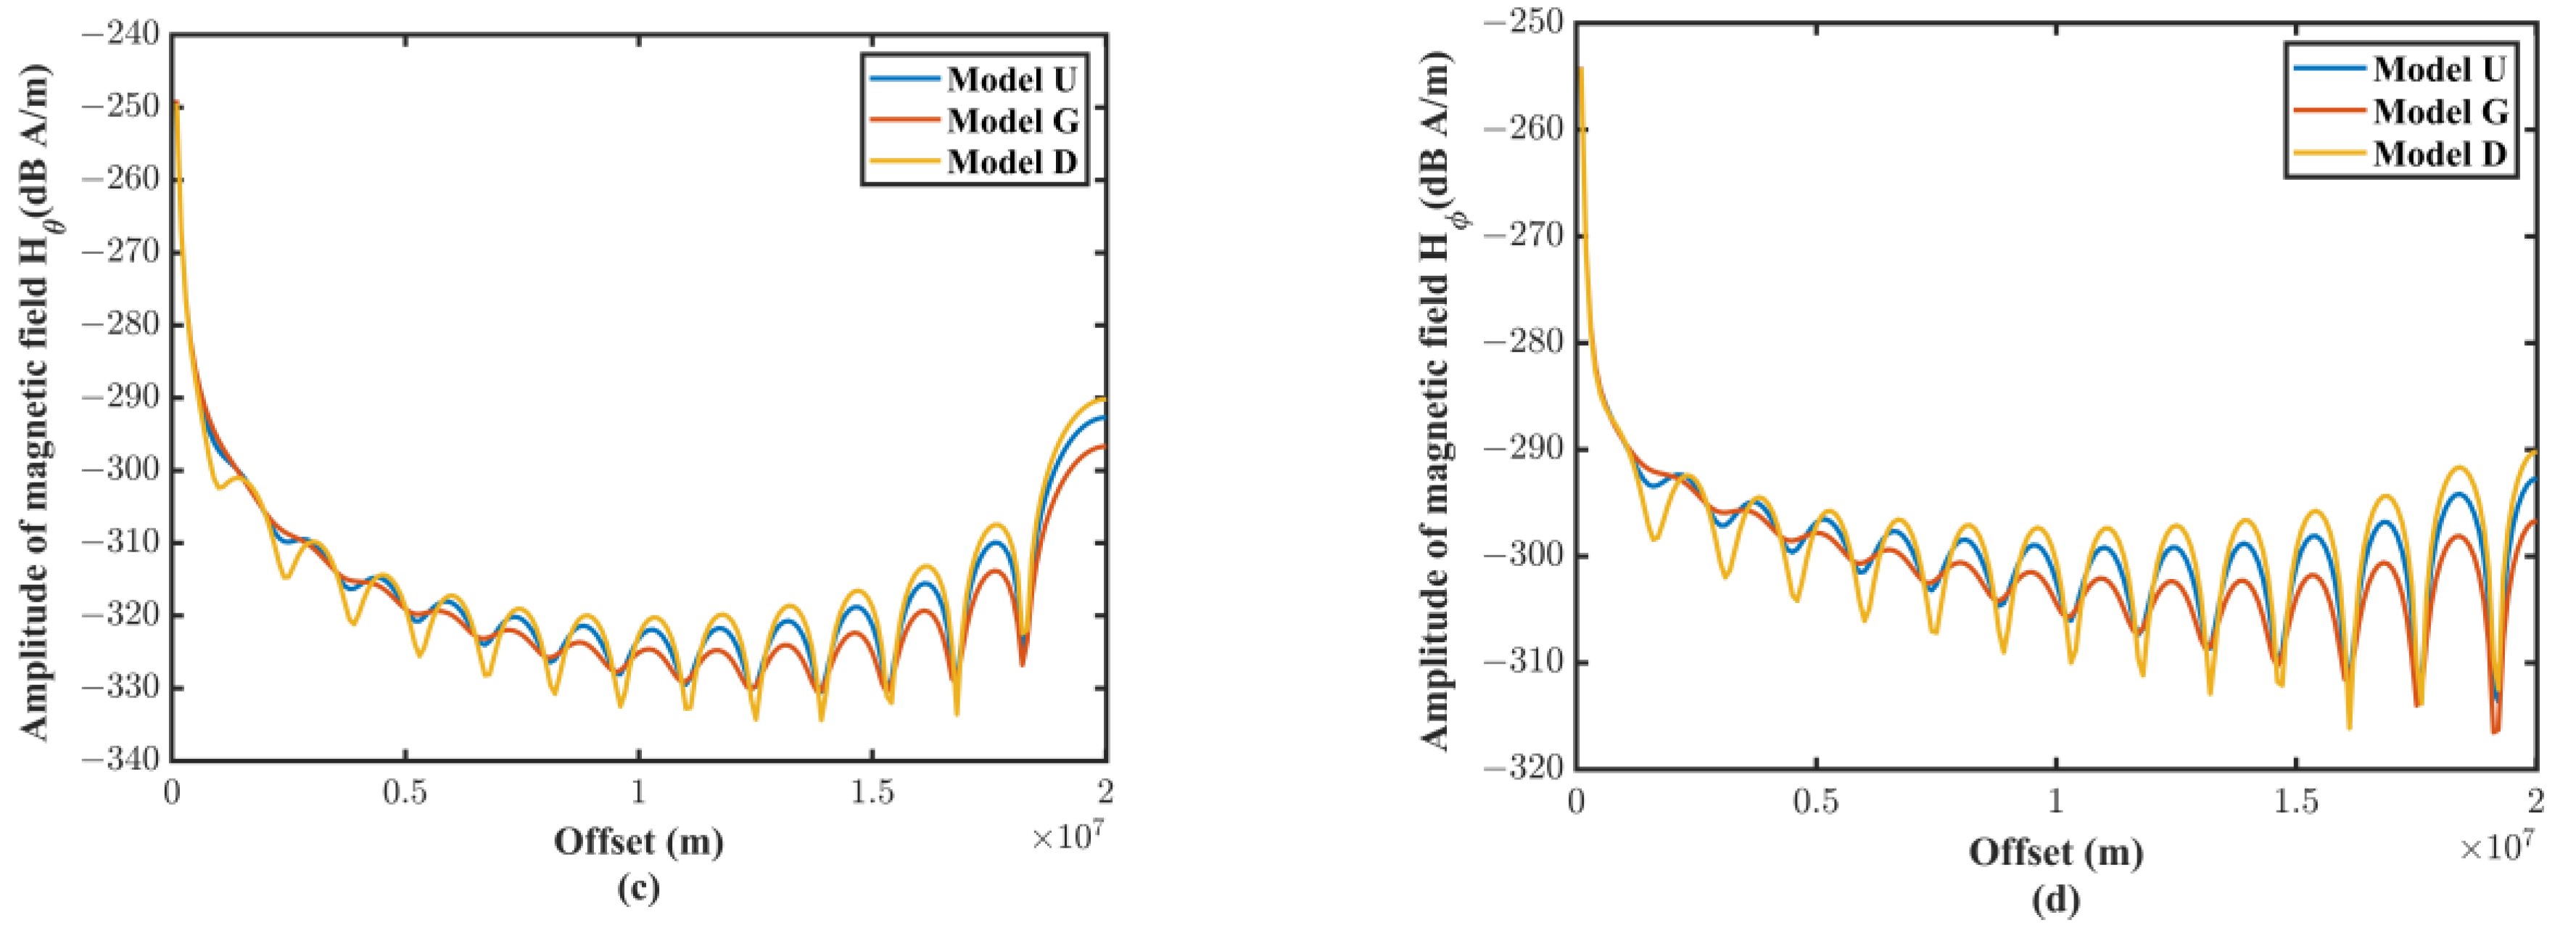
Figure 2a. We calculated the propagation curves of the electromagnetic field under three different models at a frequency of 100 Hz.
Figure 11 illustrates how various ionospheric structures might alter the electromagnetic field’s amplitude. Yet, as the propagation curve’s shape is solely determined by frequency, it will have no impact on that. The three curves overlapped at areas with a short offset (about 700 km), as we discovered at the same time. This demonstrates that the ionosphere’s impact on the electromagnetic field is negligible under a short offset.
4. Discussion
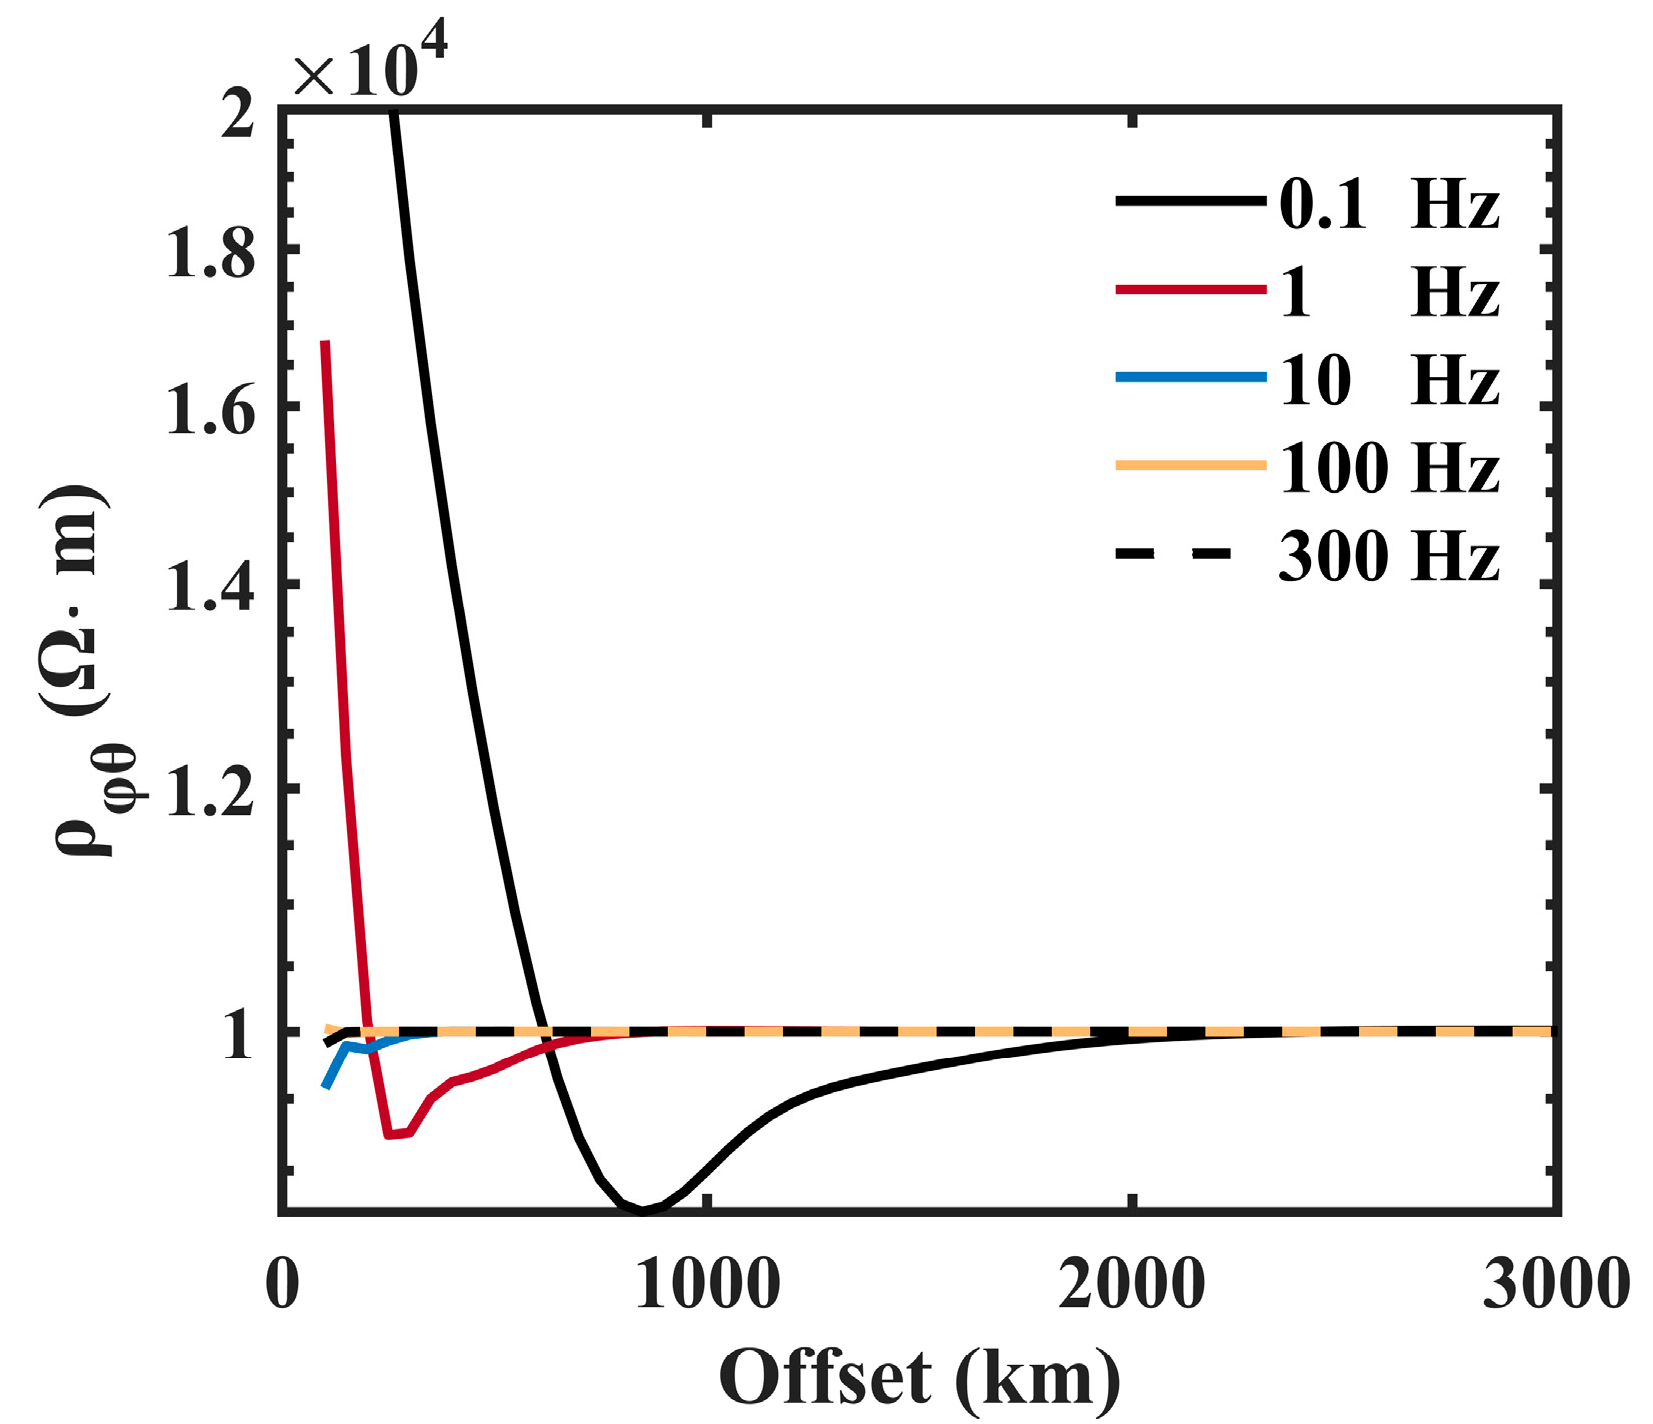
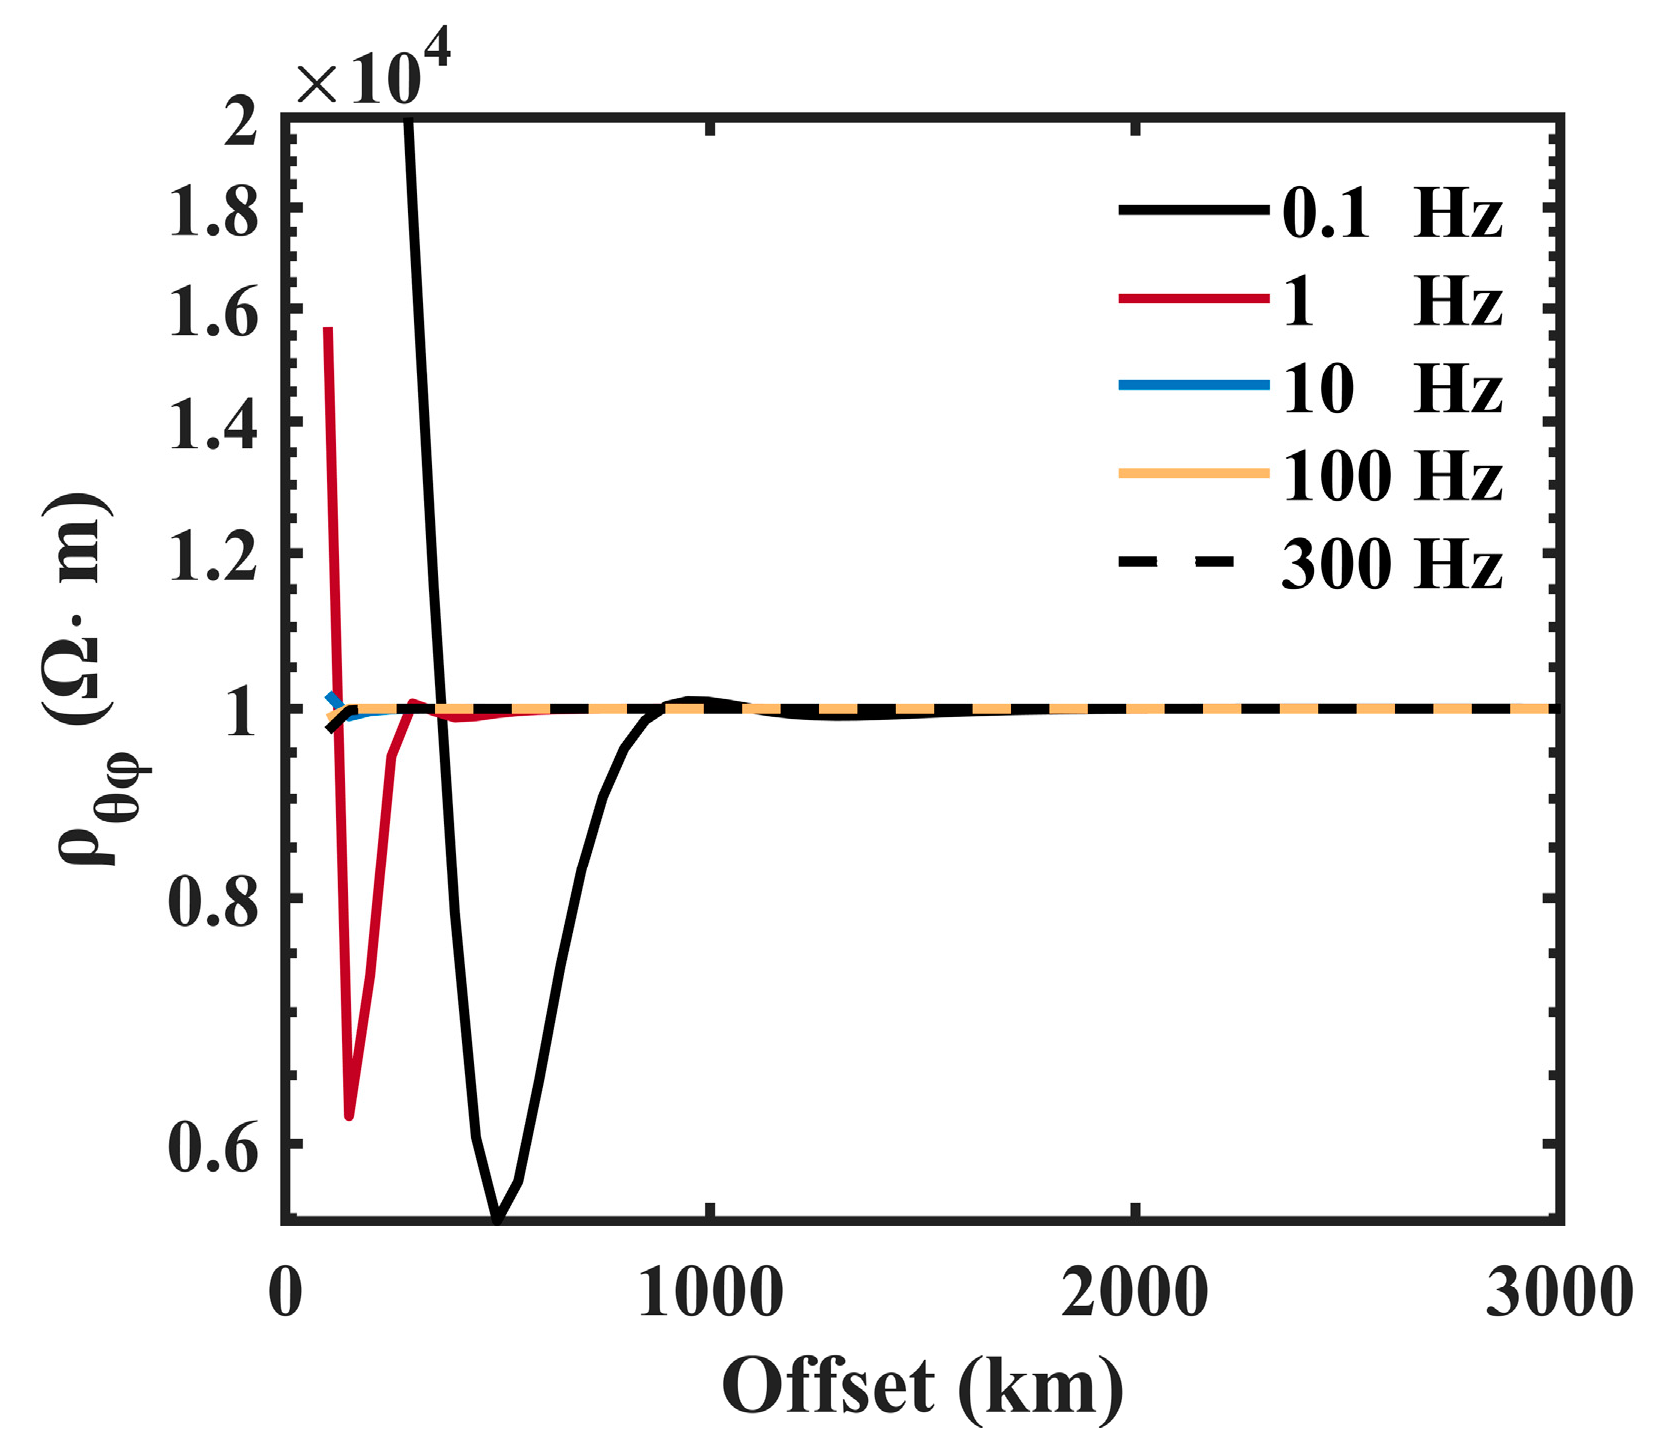
Following the rules of the MT, by observing the orthogonal electric and magnetic field components, the Cagniard apparent resistivity was computed:
For a given frequency, the partition of the near- and far-field regions depends on the Earth’s resistivity value. The lower the Earth’s resistivity, the sooner a wave can reach the far-field region. Thus, the Earth resistivity was assigned a value of 104 Ωm to ensure that the predicted far-field region was valid for any practical applications because the real earth resistivity is generally less than 104 Ω m.
Figure 12 and
Figure 13 clearly shows that
enters the far-field regions sooner. With a frequency of 0.1 Hz,
converges to the true resistivity value at 2000 km, while
converges at 1500 km. Therefore, we suggest adopting the data acquisition method of apparent resistivity
.
5. Conclusions
The present research aimed to study the electromagnetic field emitted by CSELF and present the exact formulas for a horizontal electric dipole (HED) in a spherical “Earth-ionosphere” space model to expand the coverage of CSELF. We established a new spherical “Earth-ionosphere” full-space model for CSELF. Using the general boundary condition of the electromagnetic field, we obtained an accurate expression in the sum of the series of the spherical Bessel function and the Legendre function through the separation of variables method. This research can also calculate the electromagnetic field under the layered medium.
We assessed three techniques: function combination pairs, addition and subtraction terms, and Padé approximants, to handle slowly converging numerical calculations and achieve a performance boost of 1000 times. The new solution was consistent with the previous numerical results and data measured in the field.
The most prominent finding is that the electromagnetic fields emitted by HED render geometrical attenuation with the source–receiver distance in the near-field regions. However, in the far-field regions, the fields demonstrate resonance, a pattern different from the traditional planar layer model. Finally, we discussed the application conditions of Cagniard’s apparent resistivity in CSELF. One of the interesting findings is that the apparent resistivity, , enter the far-field regions sooner than .
A limitation of this study is that we did not consider the actual length and current variation of the transmitting antenna. For the following work, the results in this paper can be used as Green’s functions to simulate the electromagnetic field of actual antennas and 3-D models.
Author Contributions
Conceptualization, Q.-Y.D. and Y.G.; methodology, Y.G.; validation, Y.G. and C.-M.F.; writing—original draft preparation, Y.G.; writing—review and editing, Y.-L.Z.; All authors have read and agreed to the published version of the manuscript.
Funding
This research was funded by the National Key R&D Program of China (Grant No. 2022YFF0706200), the Strategic Priority Research Program of the Chinese Academy of Sciences (XDA14050300), and the National Natural Science Foundation of China (NSFC: # 41874088).
Data Availability Statement
If you are interested in the results in the article and wish to obtain simulation data, you can contact the first author:
gaoya@mail.iggcas.ac.cn (Y.G.).
Acknowledgments
The authors thank the anonymous reviewers and editors for their valuable suggestions.
Conflicts of Interest
The authors declare no conflict of interest.
Appendix A
The expression of the coefficients:
where we take
and a is height of interface.
Appendix B
Approximate value of each electromagnetic component and their sum.
For TE polarized waves:
For TE polarized waves:
Among , , and .
Note: The symbol A(n) represents the approximate value, and SA represents the series sum of infinite term approximate value. Lower subscript 1 represents the underground medium parameters, and lower subscript 2 represents the air layer parameters.
References
- Wait, J.R. On the theory of mixed-path ground-wave propagation on a spherical earth. J. Res. Natl. Bur. Stand. Sect. D Radio Propag. 1961, 65, 401. [Google Scholar] [CrossRef]
- Wait, J.R. Transmission and reflection of electromagnetic waves in the presence of stratified media. J. Res. Natl. Bur. Stand. 1958, 61, 205–232. [Google Scholar] [CrossRef]
- Galejs, J. Terrestrial Propagation of Long Electromagnetic Waves; Pergamon Press: Oxford, UK, 1972. [Google Scholar]
- Galejs, J. Horizontally oriented antennas in the presence of an anisotropic ground. Radio Sci. 1969, 4, 1047–1059. [Google Scholar] [CrossRef]
- Wagner, L.S.; Goldstein, J.A.; Rupar, M.A.; Kennedy, E.J. Delay, Doppler, and amplitude characteristics of HF signals received over a 1300-km transauroral sky wave channel. Radio Sci. 2016, 30, 659–676. [Google Scholar] [CrossRef]
- Burrows, M.; Niessen, C. ELF communication system design. In Proceedings of the Ocean 72—IEEE International Conference on Engineering in the Ocean Environment, Newport, RI, USA, 13–15 September 1972; pp. 95–109. [Google Scholar] [CrossRef]
- Lu, J.X. Very Low Frequency and Ultra Low Frequency Radio Technology; Harbin Engineering University Press: Harbin, China, 2012. [Google Scholar]
- Barr, R.; Jones, D.L.; Rodger, C.J. ELF and VLF radio waves. J. Atmos. Sol.-Terr. Phys. 2000, 62, 1689–1718. [Google Scholar] [CrossRef]
- Witvliet, B.A.; Alsina-Pages, R.M. Radio communication via Near Vertical Incidence sky-wave propagation: An overview. Elecommun. Syst. 2017, 66, 295–309. [Google Scholar] [CrossRef]
- Bannister, P.R.; Wolkoff, E.A.; Katan, J.R.; Williams, F.J. Far-field, extremely-low-frequency propagation measurements. Radio Sci. 1973, 8, 623–631. [Google Scholar] [CrossRef]
- Bannister, P.R.; Katan, J.R.; Wolkoff, E.A.; Kraimer, W.A. Farfield extremely low frequency propagation measurements, May 1972. In Farfield Extremely Low Frequency Propagation Measurements; Naval Underwater Systems Center New London Conn New London Lab: London, UK, 1974. [Google Scholar]
- Bannister, P. ELF propagation update. IEEE J. Ocean. Eng. 1984, 9, 179–188. [Google Scholar] [CrossRef]
- Bernstein, S.L.; Burrows, M.L.; Evans, J.E.; Griffiths, A.S.; McNeill, D.A.; Niessen, C.W.; Richer, I.; White, D.P.; Willim, D.K. Long-range communications at extremely low frequencies. Proc. IEEE 1974, 62, 292–312. [Google Scholar] [CrossRef]
- Bernstein, S.; McNeill, D.; Richer, I. A signaling scheme and experimental receiver for extremely low frequency (ELF) communication. IEEE Trans. Commun. 1974, 22, 508–528. [Google Scholar] [CrossRef]
- Galejs, J. A further note on terrestrial extremely low-frequency propagation in the presence of an isotropic ionosphere with an exponential conductivity-height profile. J. Geophys. Res. 1962, 67, 2715–2728. [Google Scholar] [CrossRef]
- Rowe, H.E. Extremely low frequency (ELF) communication to submarines. IEEE Trans. Commun. 1974, 22, 371–385. [Google Scholar] [CrossRef]
- Goldstein, M.A.; Strangway, D.W. Audio-frequency magnetotellurics with a grounded electric dipole source. Geophysics 1975, 40, 669–683. [Google Scholar] [CrossRef]
- Field, E.C. Propagation of ELF waves under normal and naturally disturbed conditions. J. Geophys. Res. 1969, 74, 3639–3650. [Google Scholar] [CrossRef]
- Shellman, C.H. A model for propagation of ELF waves throughout the lateral extent of the inhomogeneous Earth-ionosphere wave guide. Radio Sci. 1989, 24, 35–46. [Google Scholar] [CrossRef]
- Fock, V. Diffraction of Radio Waves Around the Earth’s Surface; Defence Research Information Centre Orpington: Salisbury, UK, 1945; Volume 15, pp. 479–496. [Google Scholar]
- Mushtak, V.C.; Williams, E.R. ELF propagation parameters for uniform models of the Earth–ionosphere wave guide. J. Atmos. Sol.-Terr. Phys. 2002, 64, 1989–2001. [Google Scholar] [CrossRef]
- Cummer, S.A. Modeling electromagnetic propagation in the earth-ionosphere wave guide. IEEE Trans. Antennas Propag. 2000, 48, 1420–1429. [Google Scholar] [CrossRef]
- Barrick, D.E. Exact ULF/ELF dipole field strengths in the Earth-ionosphere cavity over the Schumann resonance region: Idealized boundaries. Radio Sci. 1999, 34, 209–227. [Google Scholar] [CrossRef]
- Tao, W.; Pan, W.Y.; Guo, L.X. Numerical integral method for ELF fields excited by vertical electric dipole in asymmetric earth-ionosphere cavity. Dianbo Kexue Xuebao Chin. J. Radio Sci. 2012, 22, 333–338. [Google Scholar]
- Peng, H.Y.; Pan, W.Y.; Guo, L.X. Legendre function series method for ELF fields excited by horizontal electric dipole in earth-ionosphere cavity. Chin. J. Radio Sci. 2013, 28, 853–858. [Google Scholar] [CrossRef]
- Pan, W.; Li, K. Propagation of SLF/ELF Electromagnetic Waves; Zhejiang University Press: Hangzhou, China, 2013. [Google Scholar]
- Pilipenko, V.A.; Parrot, M.; Fedorov, E.N.; Mazur, N.G. Electromagnetic field in the upper ionosphere from ELF ground-based transmitter. J. Geophys. Res. A. Space Phys. JGR 2019, 124, 8066–8080. [Google Scholar] [CrossRef]
- Di, Q.; Zhu, R.; Xue, G.; Yin, C.; Li, X. New development of the Electromagnetic (EM) methods for deep exploration. Chin. J. Geophys. 2019, 62, 2128–2138. [Google Scholar] [CrossRef]
- Di, Q.; Xue, G.; Yin, C.; Li, X. New methods of controlled-source electromagnetic detection in China. Sci. China Earth Sci. 2020, 63, 1268–1277. [Google Scholar] [CrossRef]
- Di, Q.; Fu, C.; Xue, G.; Wang, M.; An, Z.; Wang, R.; Wang, Z.; Lei, D.; Zhuo, X. Insight into sky-wave theory and breakthrough applications in resource exploration. Natl. Sci. Rev. 2021, 8, nwab046. [Google Scholar] [CrossRef]
- Li, D.; Di, Q.; Wang, M.; Nobes, D. ‘Earth–ionosphere’ mode controlled source electromagnetic method. Geophys. J. Int. 2015, 202, 1848–1858. [Google Scholar] [CrossRef]
- Velikhov, E.P.; Zhamaletdinov, A.A.; Shevtsov, A.N.; Tokarev, A.D.; Kononov, Y.M.; Pesin, L.B.; Kadyshevich, G.M.; Pertel, M.I.; Veshchev, A.V. Deep electromagnetic studies with the use of powerful ELF radio installations. Izv. Phys. Solid Earth C/C Fiz. Zemli-Ross. Akad. Nauk. 1998, 34, 615–632. [Google Scholar]
- Fu, C.M.; Di, Q.Y.; Wang, M.Y. Calculate electromagnetic fields in stratified medium with layer-matrix method. Chin. J. Geophys. 2010, 53, 177–188. [Google Scholar]
- Srivastava, S.P. Theory of the magnetotelluric method for a spherical conductor. Geophys. J. Int. 1966, 11, 373–387. [Google Scholar] [CrossRef]
- Gao, Y.; Di, Q.; Wang, R.; Fu, C.; Liang, P.; Zheng, F. Strength of the electric dipole source field in multilayer spherical media. IEEE Trans. Geosci. Remote Sens. 2021, 60, 5902612. [Google Scholar] [CrossRef]
- Zheng, F.; Di, Q.; Fu, C. A Spherical “Earth–Ionosphere” Model for Deep Resource Exploration Using Artificial ELF-EM Field. Remote Sens. 2022, 14, 3088. [Google Scholar] [CrossRef]
- Baker, G.A.; Baker, G.A., Jr.; Baker, G.; Graves-Morris, P.; Baker, S.S. Pade Approximants: Encyclopedia of Mathematics and It’s Applications; Cambridge University Press: Cambridge, UK, 1996; Volume 59. [Google Scholar]
- Ginsberg, L. Extremely low frequency (ELF) propagation measurements along a 4900-km path. IEEE Trans. Commun. 1974, 22, 452–457. [Google Scholar] [CrossRef]
- Chew, W.C. Waves and Fields in Inhomogeneous Media; IEEE Press: New York, NY, USA, 1995. [Google Scholar]
Figure 1.
Electromagnetic field in the spherical “Earth-ionosphere” full space model (a) Sky waves in the “Earth-ionosphere” model: Solid and dashed lines represent sky waves propagating through different paths in a waveguide. (b) EM signals transmitted by the antenna: artificial sources generate three types of electromagnetic waves throughout full space: the sky wave, surface wave, and formation wave.
Figure 2.
Geometric model diagram of HED in spherical coordinates. (a) Simplified spherical “Earth-ionosphere” full space model; (b) Multilayer medium inside the Earth or ionosphere: the subscript 0 indicates the medium where the source is located.
Figure 2.
Geometric model diagram of HED in spherical coordinates. (a) Simplified spherical “Earth-ionosphere” full space model; (b) Multilayer medium inside the Earth or ionosphere: the subscript 0 indicates the medium where the source is located.
Figure 3.
Comparison diagram of the electromagnetic field results. The red curve represents our result. The blue dot represents the results of Peng. The black dotted line is the relative error. (a) Tangential electric field propagation curve. (b) Tangential magnetic field propagation curve.
Figure 3.
Comparison diagram of the electromagnetic field results. The red curve represents our result. The blue dot represents the results of Peng. The black dotted line is the relative error. (a) Tangential electric field propagation curve. (b) Tangential magnetic field propagation curve.
Figure 4.
Comparison between the measured in the field and theoretical values. The blue dot represents the data given by Bannister. The red curve represents our calculation result. The black dotted line is the relative error. (a) Magnetic field results at a frequency of 45 Hz. (b) Magnetic field results at a frequency of 75 Hz.
Figure 5.
Comparison of electromagnetic fields at a frequency of 100 Hz under the spherical–planar model (a,b).
Figure 5.
Comparison of electromagnetic fields at a frequency of 100 Hz under the spherical–planar model (a,b).
Figure 6.
Propagation curve of the electromagnetic field in the waveguide region at 1 Hz, 50 Hz, and 100 Hz,. (a) Propagation curve of . (b) Propagation curve of . (c) Propagation curve of . (d) Propagation curve of .
Figure 6.
Propagation curve of the electromagnetic field in the waveguide region at 1 Hz, 50 Hz, and 100 Hz,. (a) Propagation curve of . (b) Propagation curve of . (c) Propagation curve of . (d) Propagation curve of .
Figure 7.
Radiation pattern of .
Figure 7.
Radiation pattern of .
Figure 8.
Radiation pattern of .
Figure 8.
Radiation pattern of .
Figure 9.
Radiation pattern of .
Figure 9.
Radiation pattern of .
Figure 10.
Radiation pattern of .
Figure 10.
Radiation pattern of .
Figure 11.
Propagation curve of the electromagnetic field in the waveguide region at 100 Hz: The blue, red, and orange lines represent the electromagnetic fields in the U, G, and D models, respectively. (a) Propagation curve of Eθ. (b) Propagation curve of Eφ. (c) Propagation curve of Hθ. (d) Propagation curve of Hφ.
Figure 12.
Cagniard apparent resistivity . The black, red, blue, orange, and black dotted lines are the apparent resistivities at 0.1, 1, 10, 100, and 300 Hz, respectively.
Figure 12.
Cagniard apparent resistivity . The black, red, blue, orange, and black dotted lines are the apparent resistivities at 0.1, 1, 10, 100, and 300 Hz, respectively.
Figure 13.
Cagniard’s apparent resistivity . The black, red, blue, orange, and black dotted lines are the apparent resistivities at 0.1, 1, 10, 100, and 300 Hz, respectively.
Figure 13.
Cagniard’s apparent resistivity . The black, red, blue, orange, and black dotted lines are the apparent resistivities at 0.1, 1, 10, 100, and 300 Hz, respectively.
| Disclaimer/Publisher’s Note: The statements, opinions and data contained in all publications are solely those of the individual author(s) and contributor(s) and not of MDPI and/or the editor(s). MDPI and/or the editor(s) disclaim responsibility for any injury to people or property resulting from any ideas, methods, instructions or products referred to in the content. |
© 2023 by the authors. Licensee MDPI, Basel, Switzerland. This article is an open access article distributed under the terms and conditions of the Creative Commons Attribution (CC BY) license (https://creativecommons.org/licenses/by/4.0/).
