
Different-Classification-Scheme-Based Machine Learning Model of Building Seismic Resilience Assessment in a Mountainous Region

Abstract
1. Introduction
2. Study Area and Earthquake-Damaged Building Inventory
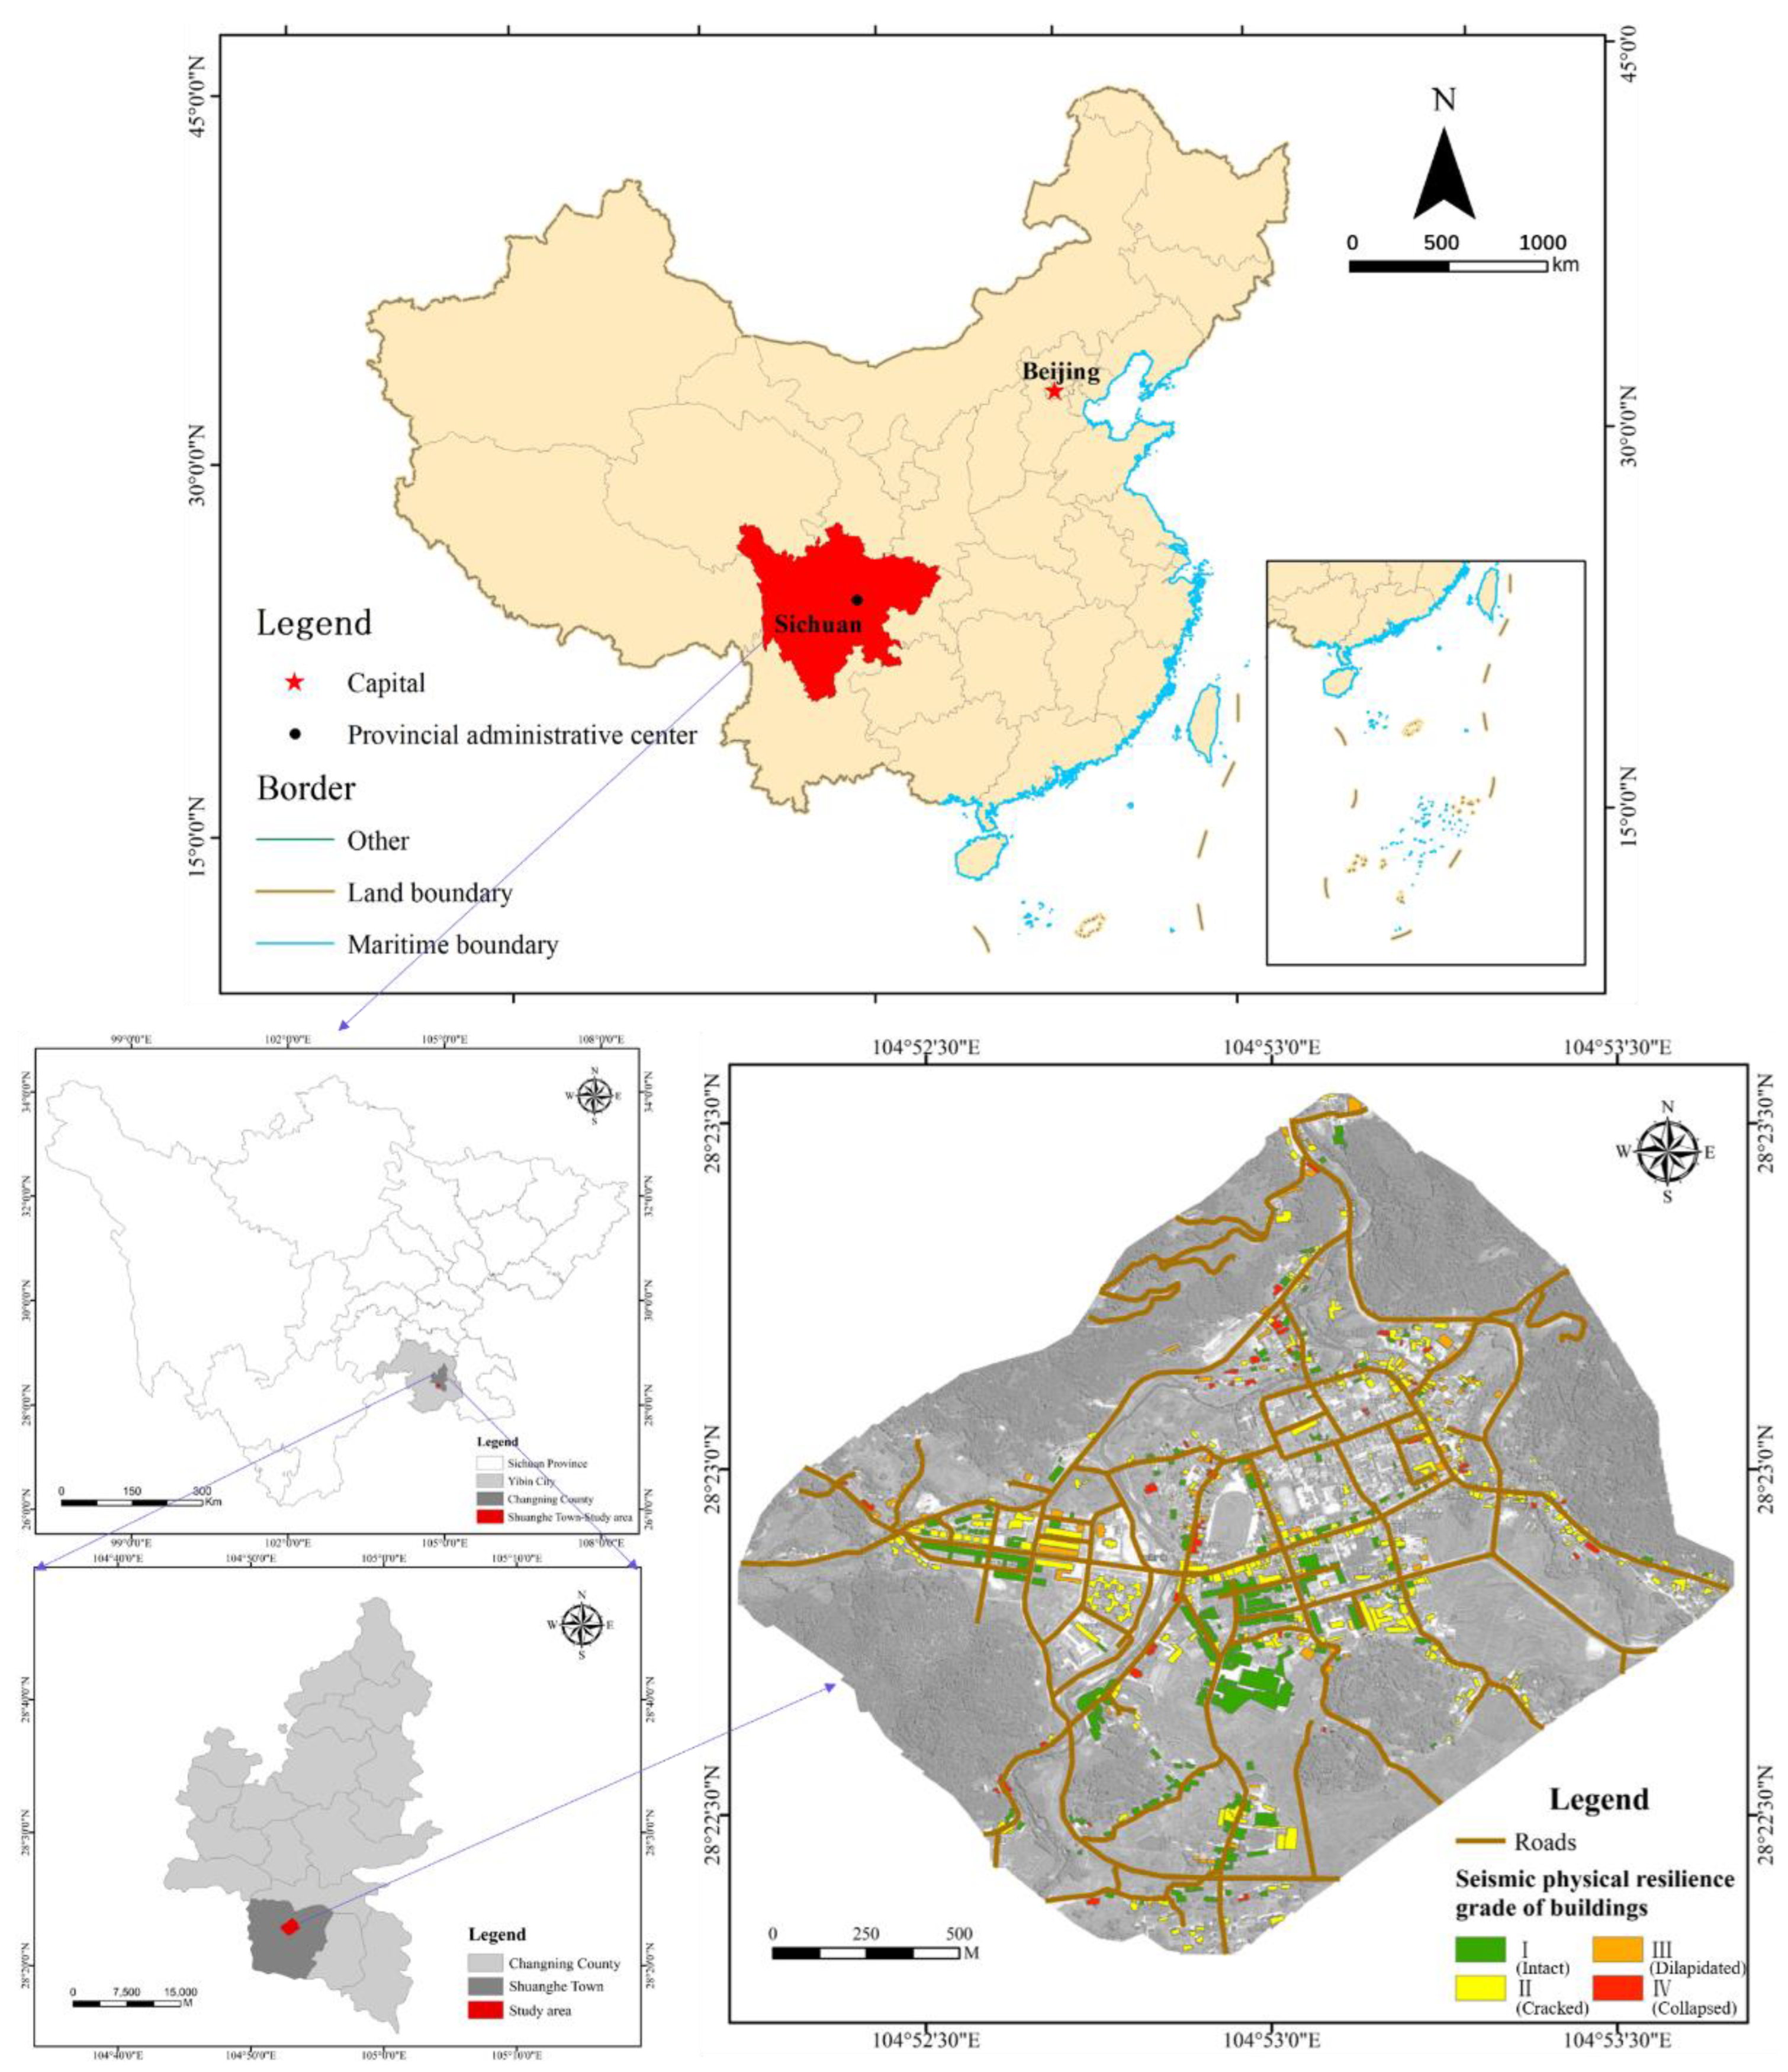
2.1. Study Area
2.2. Earthquake-Damaged Building Inventory and BSR Classification Schemes
3. Data and Methods
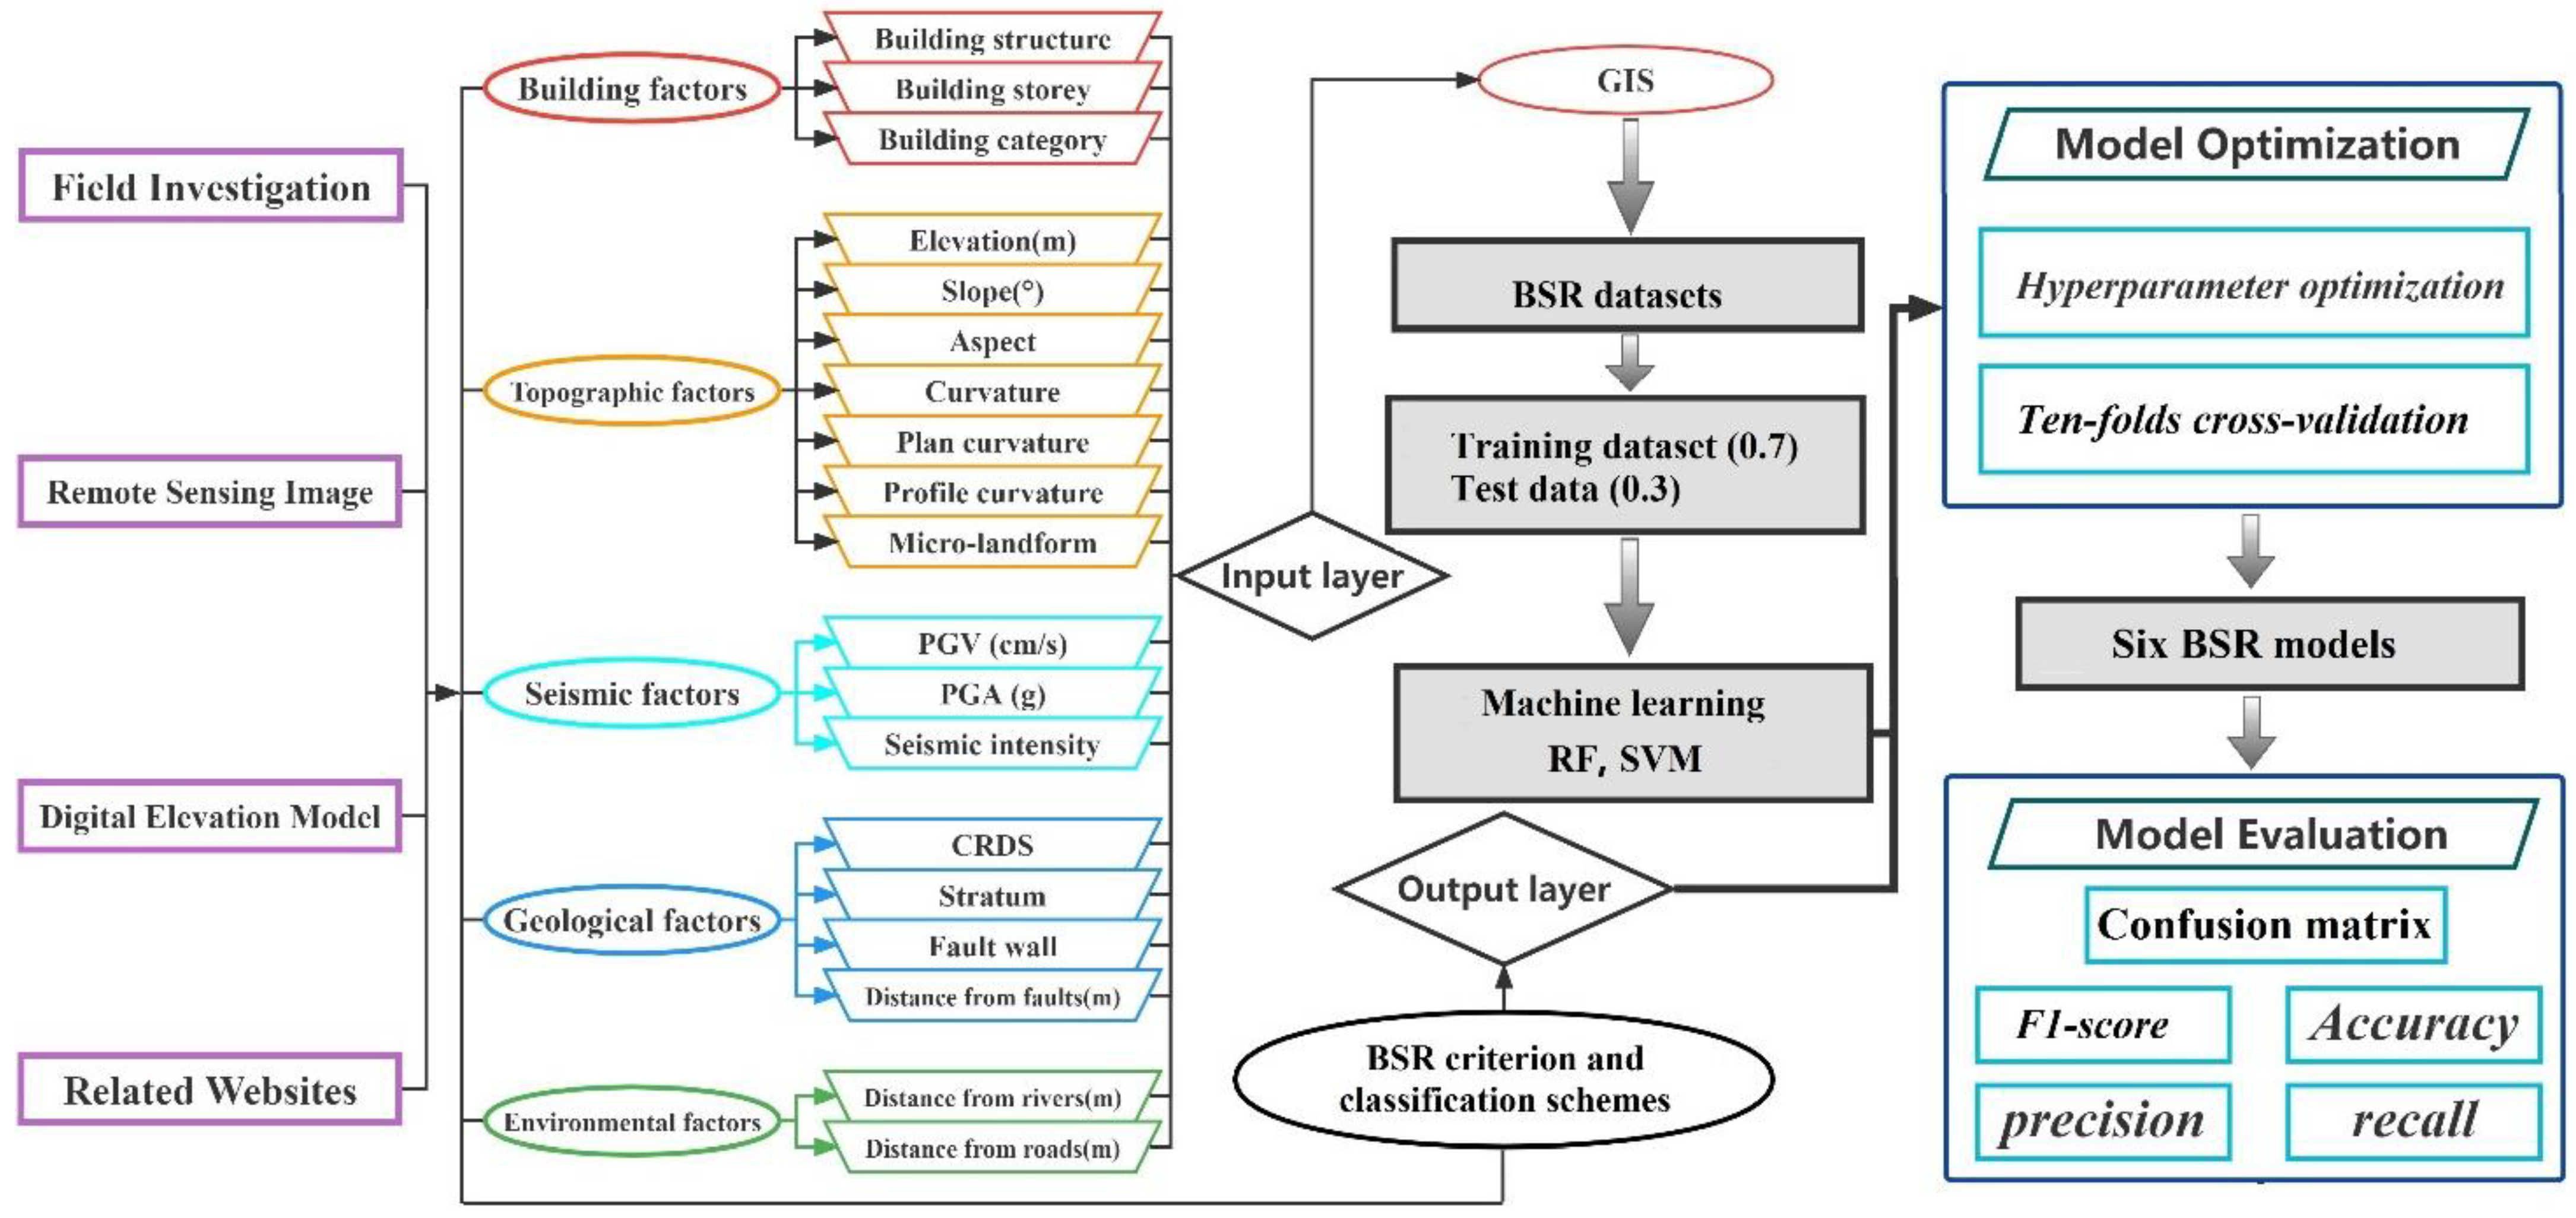
3.1. Data
3.2. Methods
3.2.1. Random Forest
3.2.2. Support Vector Machine
3.2.3. Model Evaluation Method
4. Results
4.1. Optimization of Models via Hyperparameter Tuning
4.2. Results of the Different BSR Classification Schemes
4.3. Model Performance
4.3.1. Accuracy Analysis
- (1)
- The small overall sample size: Under the limitations of few investigators, a short research period, and occasional poor communication, the team collected 855 buildings of Shuanghe Town. The overall samples collected are relatively small, which specifically impacts the prediction performance of the MLM.
- (2)
- Classification scheme: The classification algorithm was used initially to study the binary classification problem. This study concerns different BSR classification schemes of two to four levels. The C3 and C4 schemes are not a simple accumulation of the data from the binary classification, which leads to misclassification or indivisibility and affects the prediction accuracy for BSR to a certain extent.
- (3)
- Unbalanced nature of the data: When data are highly unbalanced, the performance of an MLM will decrease due to the C4 scheme, the proportions of buildings with four BSR levels (I, II, III, and IV) in the total sample are unequal. In RF, the characteristics of a small number of categories will be regarded as noise, which is usually ignored. In an SVM, the classification hyperplane tends to correspond to level III and level IV minority classification datasets, so some support vectors are divided into level II and level I majority classification datasets. Due to the unbalanced nature of the sample dataset, the predicted results based on the two different MLMs (RF and SVM) all show that the results obtained by the classification algorithm should be biased towards a large number of classifications.
4.3.2. Precision Analysis
- (1)
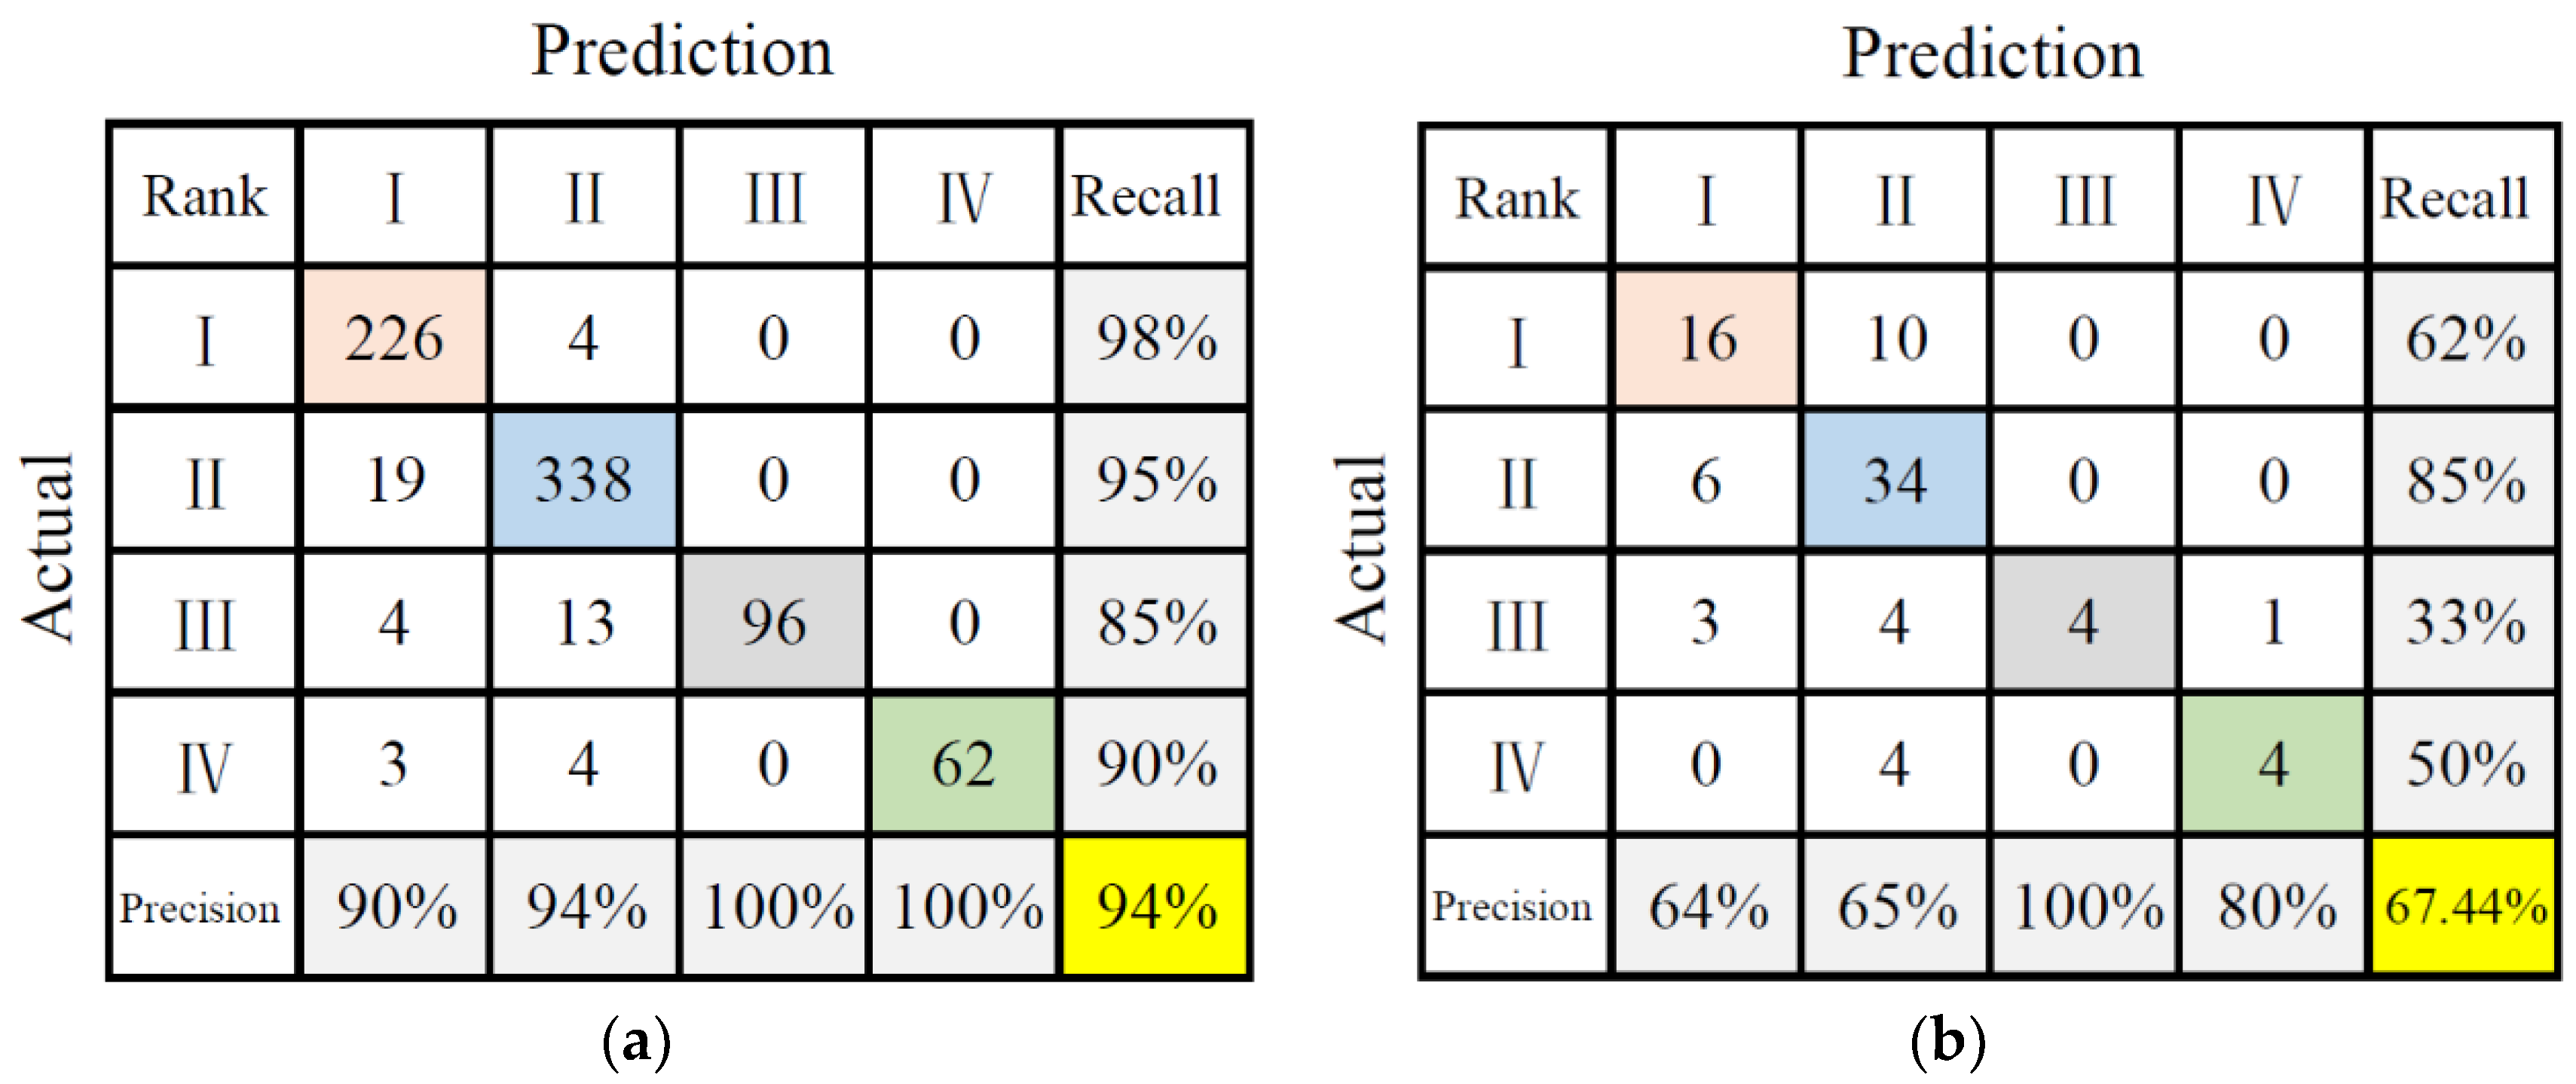
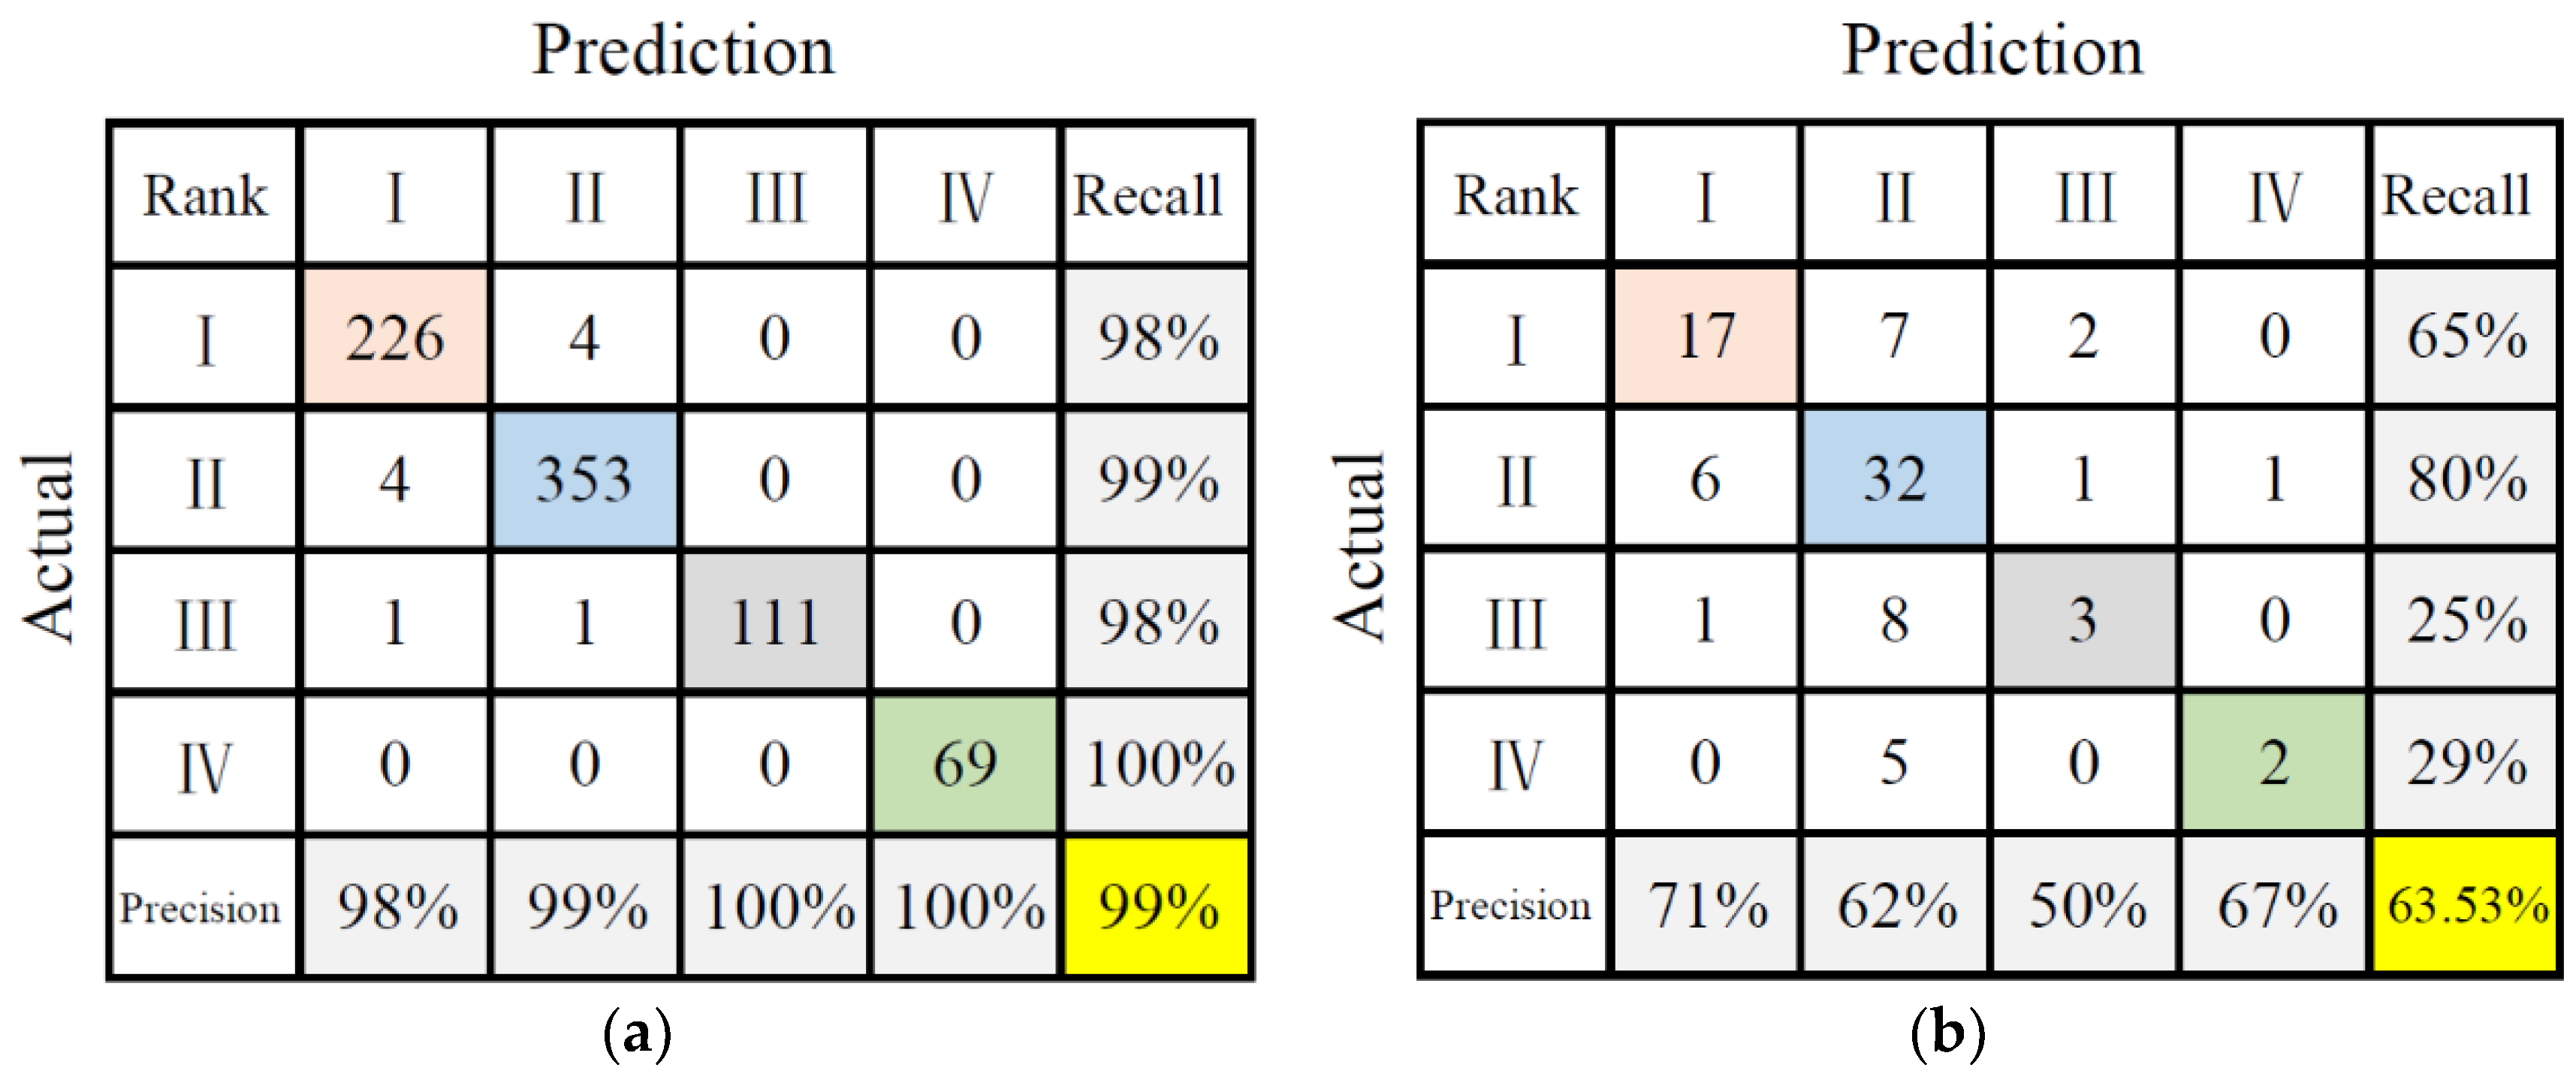
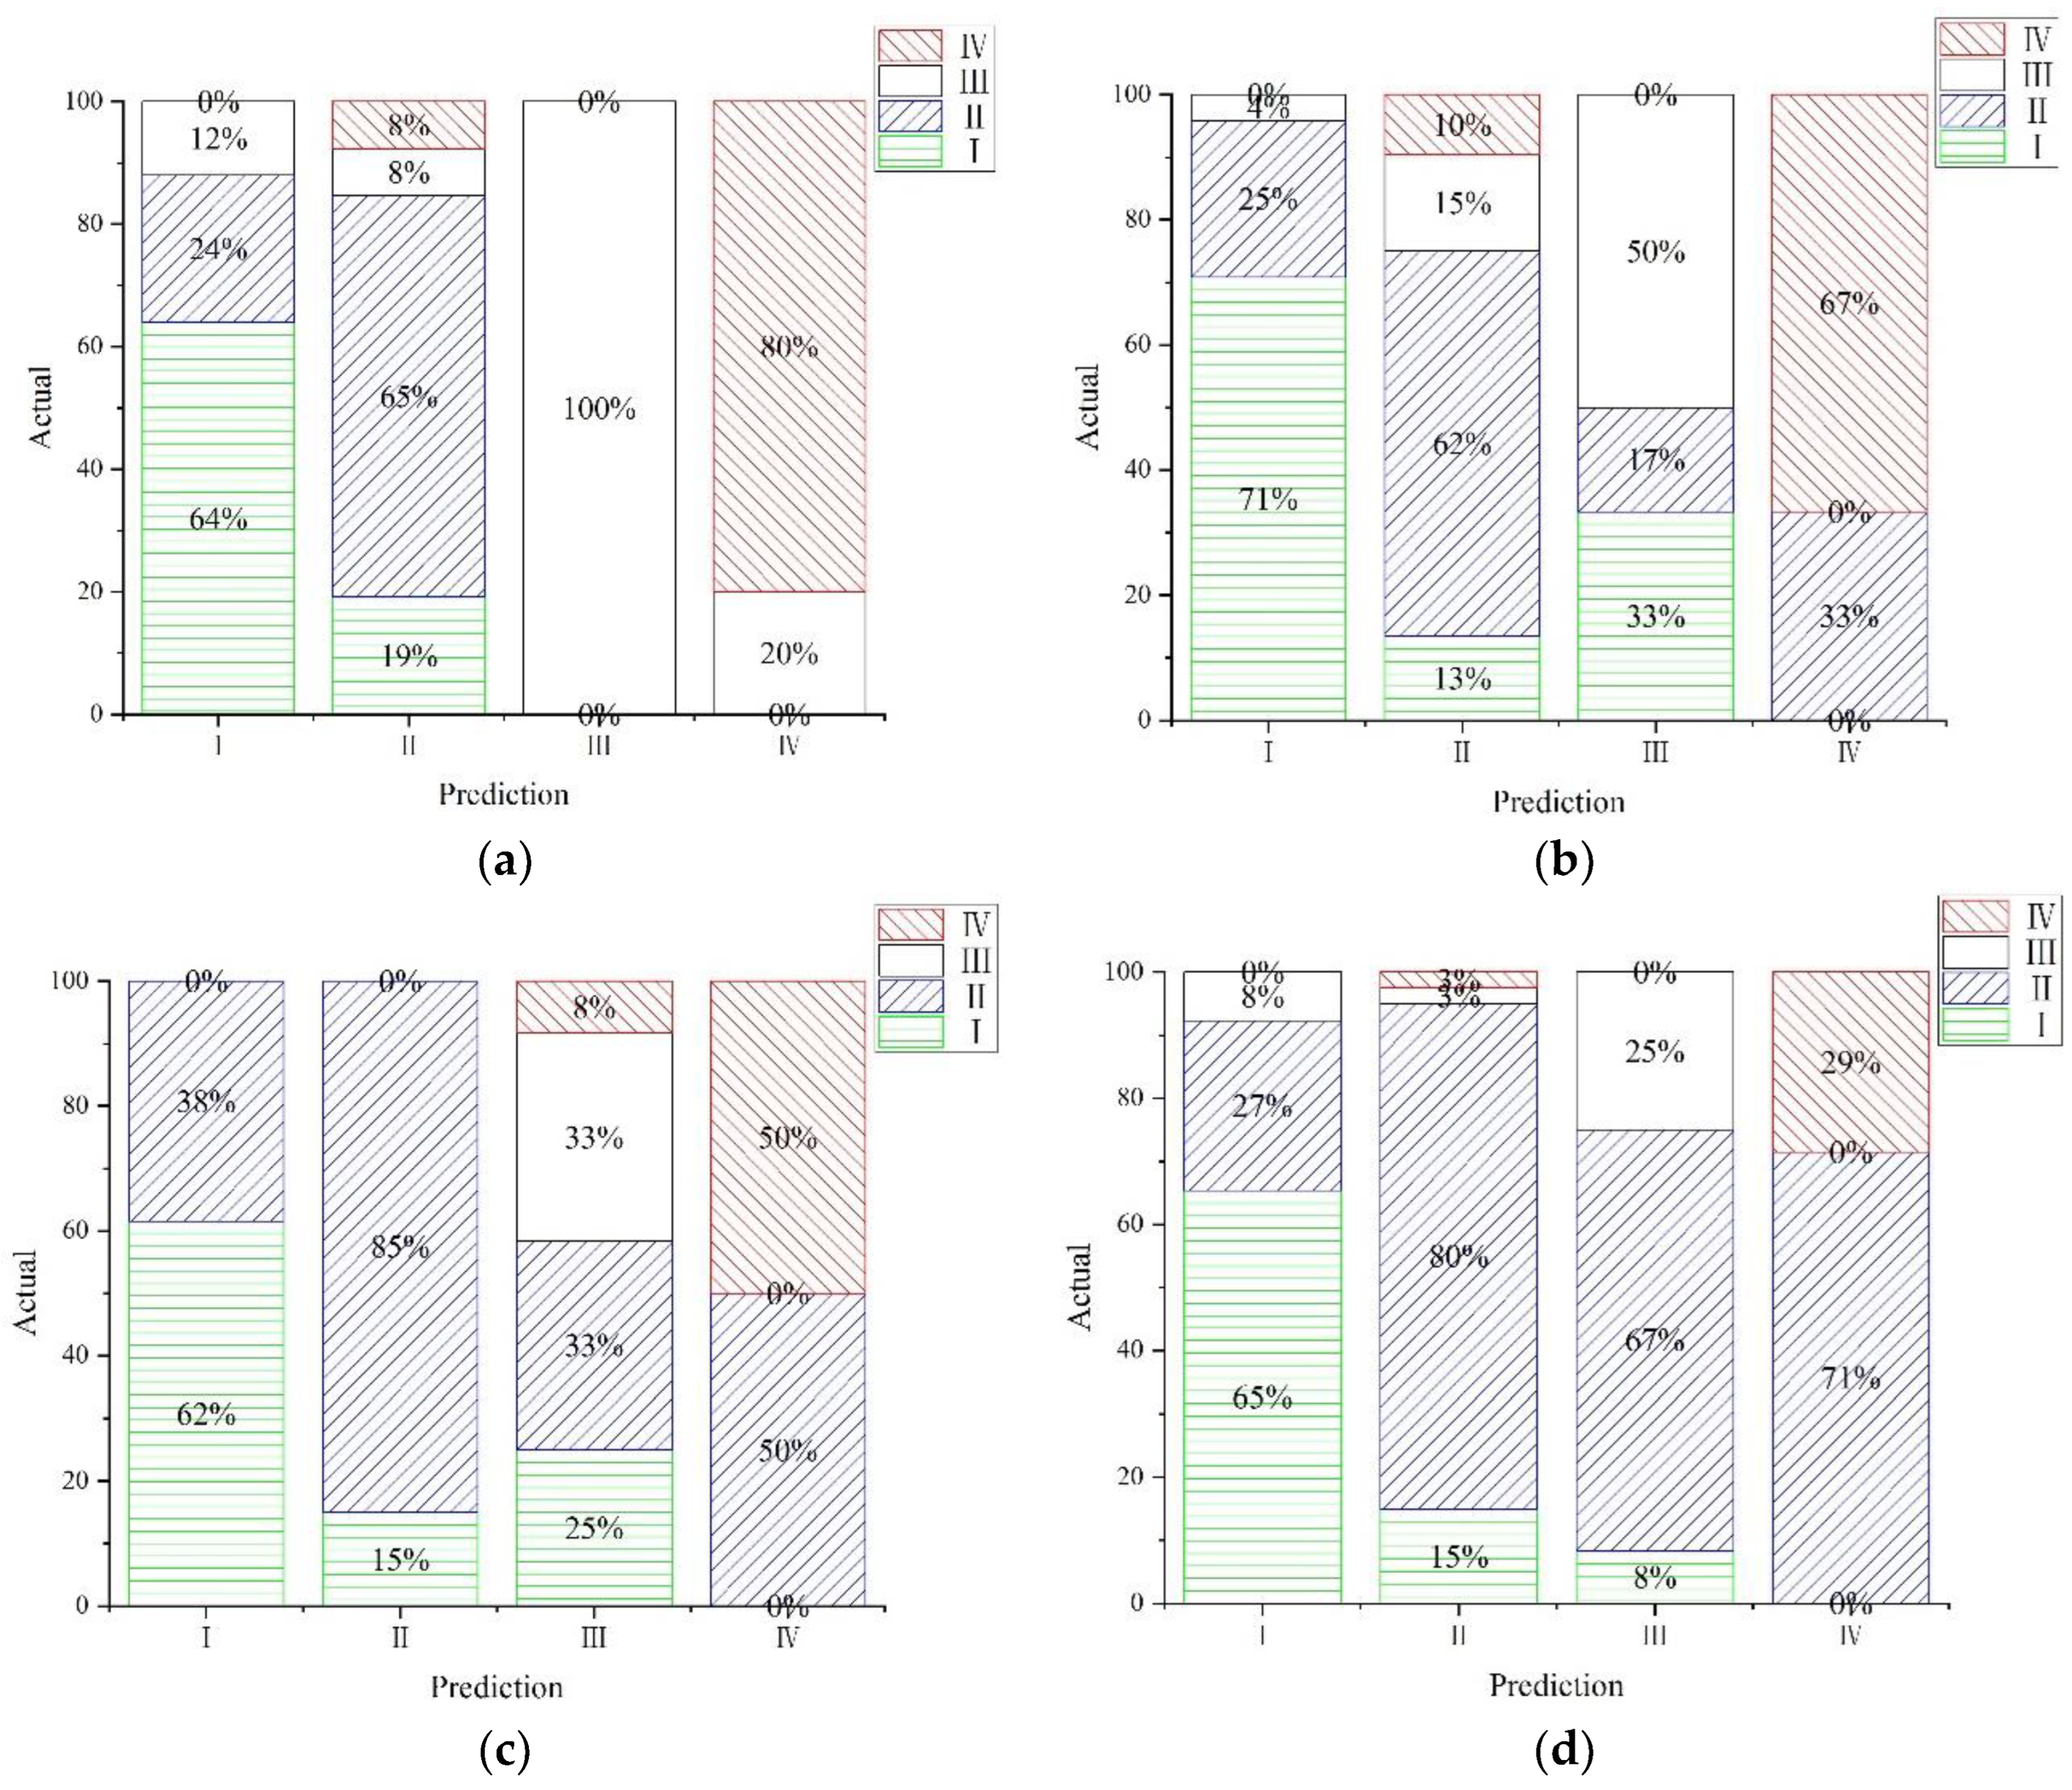
- For the RF-based model, the precision values are 0.64, 0.65, 1.00, and 0.80 for BSR levels I, II, III, and IV, respectively (Figure 7a). For the SVM-based model, the precision values are 0.71, 0.62, 0.50, and 0.67 for levels I, II, III, and IV, respectively (Figure 7b). As a whole, the precision values of the RF-based model are higher than those of the SVM-based model. From among the 1-Pre values, the highest number of error judgments were made in reference to level I, followed by level II.
- (2)
- For the RF-based model, the recall values are 0.62, 0.85, 0.33, and 0.50 for BSR level I, II, III, and IV, respectively (Figure 7c); for the SVM-based model, the precision values are 0.65, 0.80, 0.25, and 0.29 for level I, II, III, and IV, respectively (Figure 7d). As a whole, the recall values of the RF-based model are higher than those of the SVM-based model. From among the 1-Rec values, the highest number of missing judgments were made in reference to level III, followed by level IV.
5. Discussion
5.1. Analysis of BSR Models’ Performance Differences
5.2. BSR Model Recommendation and Performance Improvement
6. Conclusions
- (1)
- For machine learning models, the performance of identifying whether or not buildings have suffered earthquake-induced damage is better than that for identifying different degrees of earthquake-induced damage.
- (2)
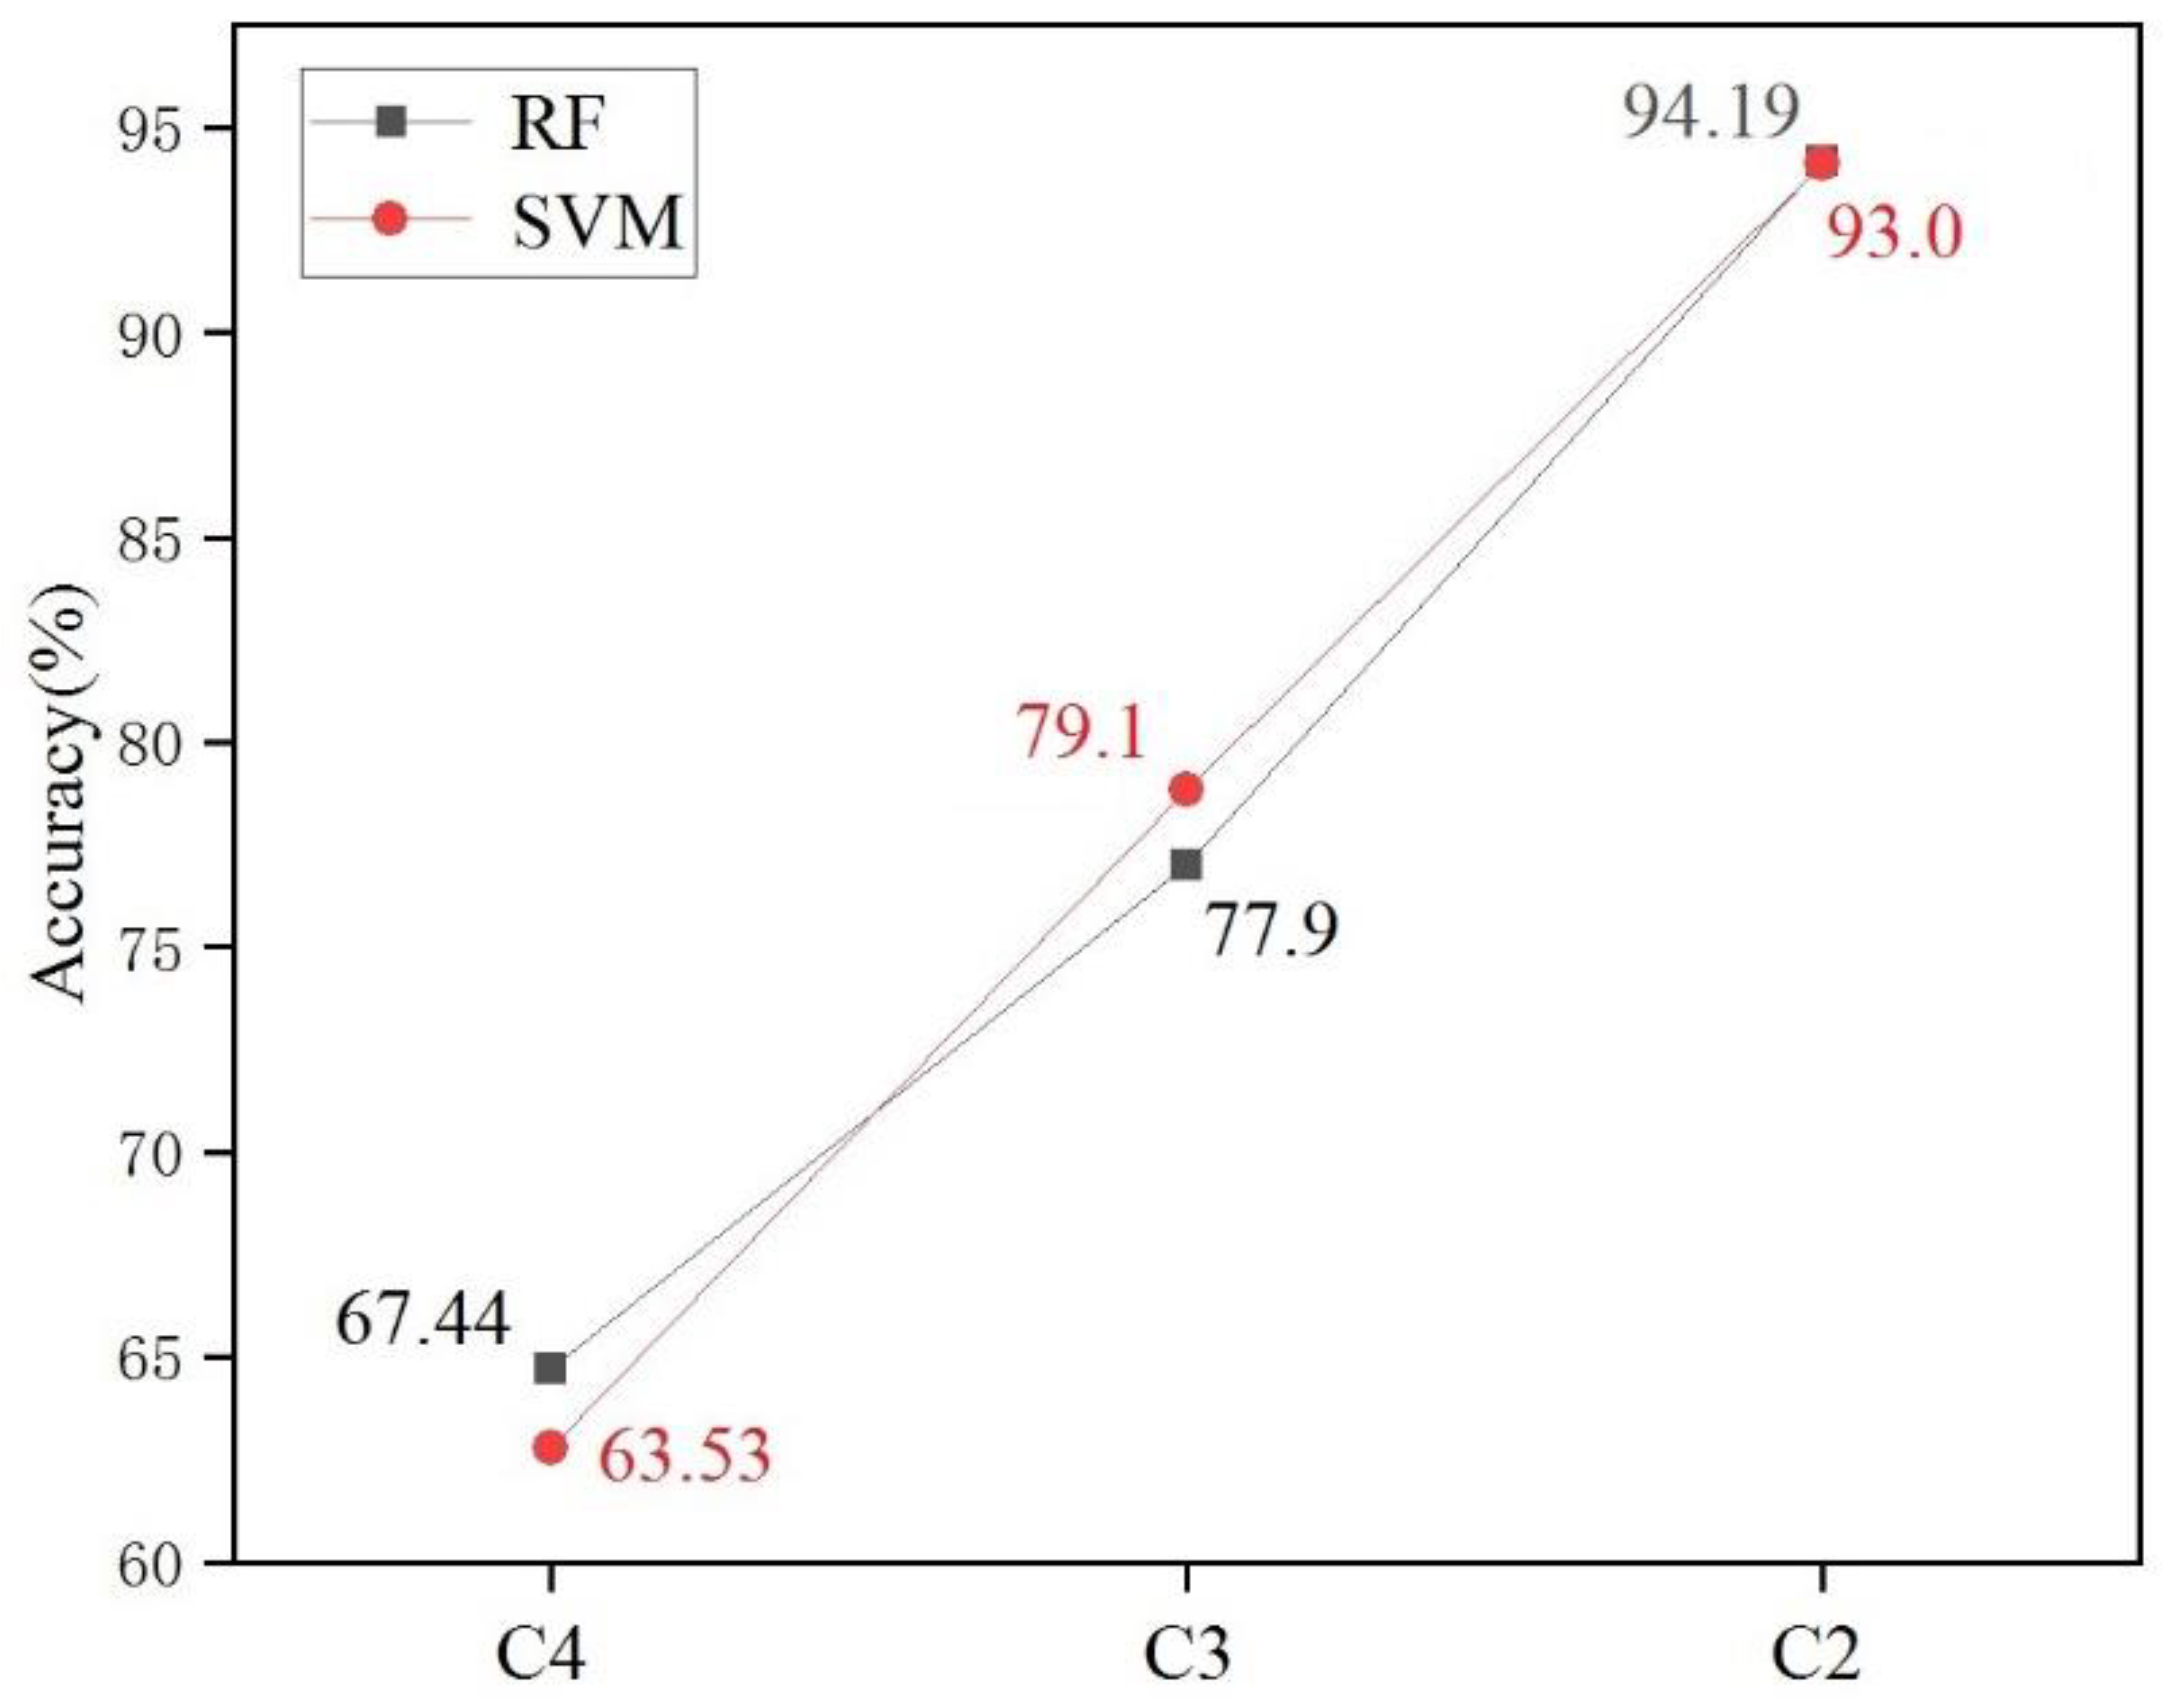
- The C2 scheme has the highest Acc value, while the C4 scheme’s performance is more dependent on practicality with regard to BSR assessment. That is to say, the BSR assessment models’ performance was affected by the small number of total samples, the classification scheme used, and the unbalanced nature of the data.
- (3)
- The RF-based model, with a slightly higher Acc and lower overfitting, offers better performance than that of the SVM-based BSR model, which can provide a reference for BSR assessment in mountainous areas.
Author Contributions
Funding
Data Availability Statement
Acknowledgments
Conflicts of Interest
References
- Kahandawa, K.A.R.V.; Domingo, N.D.; Park, K.S.; Uma, S.R. Earthquake damage estimation systems: Literature review. Procedia Eng. 2018, 212, 622–628. [Google Scholar] [CrossRef]
- Cimellaro, G.P.; Reinhorn, A.M.; Bruneau, M. Framework for analytical quantification of disaster resilience. Eng. Struct. 2010, 32, 3639–3649. [Google Scholar] [CrossRef]
- Holling, C.S. Resilience and stability of ecological systems. Annu. Rev. Ecol. Syst. 1973, 4, 1–23. [Google Scholar] [CrossRef]
- Wildavsky, A.B. Searching for Safety. J. Risk Insur. 1988, 57, 564. [Google Scholar] [CrossRef]
- Zhou, Y.; Lu, X. State-of-the-art on rocking and self-centering structures. J. Build. Struct. 2011, 32, 1–10. [Google Scholar] [CrossRef]
- Adger, W.N. Social and ecological resilience: Are they related? Prog. Hum. Geogr. 2000, 24, 347–364. [Google Scholar] [CrossRef]
- Folke, C. Resilience: The emergence of a perspective for social–ecological systems analyses. Glob. Environ. Chang. 2006, 16, 253–267. [Google Scholar] [CrossRef]
- Zhang, C.; Wen, H.-J.; Liao, M.-Y.; Lin, Y.; Wu, Y.; Zhang, H. Study on Machine Learning Models for Building Resilience Evaluation in Mountainous Area: A Case Study of Banan District, Chongqing, China. Sensors 2022, 22, 1163. [Google Scholar] [CrossRef]
- Li, X.; Yu, H.; Liu, P. Resilience-based seismic performance concept, assessment methodology and engineering application. Build. Struct. 2018, 48, 1–7. [Google Scholar] [CrossRef]
- Bozza, A.; Asprone, D.; Manfredi, G. Developing an integrated framework to quantify resilience of urban systems against disasters. Nat. Hazards 2015, 78, 1729–1748. [Google Scholar] [CrossRef]
- Gian Paolo Cimellaro, A.M.A.; Renschler, C.; Andrei, M.; Reinhorn, F.A.; Arendt, A.L. PEOPLES: A Framework for Evaluating Resilience. J. Struct. Eng. 2016, 142, 4016063. [Google Scholar] [CrossRef]
- Lu, X.; Liao, W.; Fang, D.; Lin, K.; Tian, Y.; Zhang, C.; Zheng, Z.; Zhao, P. Quantification of disaster resilience in civil engineering: A review. J. Saf. Sci. Resil. 2020, 1, 19–30. [Google Scholar] [CrossRef]
- Marasco, S.; Cardoni, A.; Zamani Noori, A.; Kammouh, O.; Domaneschi, M.; Cimellaro, G.P. Integrated platform to assess seismic resilience at the community level. Sustain. Cities Soc. 2021, 64, 102506. [Google Scholar] [CrossRef]
- You, T.; Wang, W.; Chen, Y. A framework to link community long-term resilience goals to seismic performance of individual buildings using network-based recovery modeling method. Soil Dyn. Earthq. Eng. 2021, 147, 106788. [Google Scholar] [CrossRef]
- Gizzi, F.; Masini, N.; Potenza, M.R.; Zotta, C.; Tilio, L.; Danese, M.; Murgante, B. Assessing Macroseismic Data Reliability through Rough Set Theory: Application on Vulture Area (Basilicata, Southern Italy). In Advances in Intelligent Decision Technologies, Smart Innovation, Systems and Technologies; Phillips-Wren, G., Jain, L.C., Nakamatsu, K., Howlett, R.J., Eds.; Springer: Berlin, Germany, 2010; Volume 4, VII, pp. 279–288. [Google Scholar] [CrossRef]
- Gizzi, F.; Masini, N.; Potenza, M.R.; Zotta, C.; Tilio, L.; Danese, M.; Murgante, B. Assessing Macroseismic Data Reliability through Rough Set Theory: The Case of Rapolla (Basilicata, Southern Italy). In Lecture Notes in Computer Science; Springer: Berlin, Germany, 2010; Volume 6016, pp. 320–330. ISSN 0302-9743. [Google Scholar] [CrossRef]
- Dong, Y.; Wang, X.; Yang, S.; Zhou, X.; Long, S.; Lv, L. Total probability seismic performance evaluation based on next generation performance-based design. World Earthq. Eng. 2020, 36, 12–20. [Google Scholar]
- Lu, X.; Wu, D.; Zhou, Y. State-of-the-art of earthquake resilient structures [State-of-the-art of earthquake resilient structures]. J. Build. Struct. 2019, 40, 1–15. [Google Scholar] [CrossRef]
- Porter, K.A.; Kiremidjian, A.S.; Legrue, J.S. Assembly-Based Vulnerability of Buildings and Its Use in Performance Evaluation. Earthq. Spectra 2001, 17, 291–312. [Google Scholar] [CrossRef]
- Dong, Y.; Frangopol, D.M. Performance-based seismic assessment of conventional and base-isolated steel buildings including environmental impact and resilience. Earthq. Eng. Struct. Dyn. 2006, 45, 739–756. [Google Scholar] [CrossRef]
- Andrić, J.M.; Lu, D. Fuzzy methods for prediction of seismic resilience of bridges. Int. J. Disaster Risk Reduct. 2017, 22, 458–468. [Google Scholar] [CrossRef]
- Shang, Q.; Wang, T.; Li, J. A Quantitative Framework to Evaluate the Seismic Resilience of Hospital Systems. J. Earthq. Eng. JEE 2020, 26, 3364–3388. [Google Scholar] [CrossRef]
- Hassan, E.M.; Mahmoud, H. Full functionality and recovery assessment framework for a hospital subjected to a scenario earthquake event. Eng. Struct. 2019, 188, 165–177. [Google Scholar] [CrossRef]
- Ren, J.; Pan, P.; Wang, T.; Zhou, Y.; Wang, H.; Shan, M. Interpretation of GB/T 38591—2020 ‘Standard for seismic resilience assessment of buildings’. J. Build. Struct. 2021, 42, 48–56. [Google Scholar] [CrossRef]
- Agency, F.; Hamburger, R.; Bachman, R.; Heintz, J.; Whittaker, A. Seismic Performance Assessment of Buildings; FEMA: Washington, DC, USA, 2012; Volume Methodology, p. 1. [Google Scholar]
- Almufti, I.; Willford, M. REDi Rating System: Resilience-based Earthquake Design Initiative for the Next Generation of Buildings. Arup Co 2013. [Google Scholar] [CrossRef]
- Reis, E.; Mayes, R.L. The U.S. Resiliency Council (USRC) and the Building Rating System. Improv. Seism. Perform. Exist. Build. Other Struct. 2015, 54, 764. [Google Scholar] [CrossRef]
- Xiao, Y.; Zhou, Y.; Wu, H.; Pan, P.; Wang, T. Comparative study on GB/T 38591—2020 ‘Standard for seismic resilience assessment of buildings’ and relevant international standards. J. Build. Struct. 2021, 42, 194–202. [Google Scholar] [CrossRef]
- GB/T 38591-2020; Standard for Seismic Resilience Assessment of Buildings. State Administration for Market Regulation: Beijing, China, 2020.
- Zhang, X.; Song, J.; Peng, J.; Wu, J. Landslides-oriented urban disaster resilience assessment—A case study in ShenZhen, China. Sci. Total Environ. 2019, 661, 95–106. [Google Scholar] [CrossRef]
- Wen, H.J.; Wu, J.N.; Zhang, C.; Zhou, X.Z.; Liao, M.Y.; Xu, J.H. Hybrid optimized RF model of seismic resilience of buildings in mountainous region based on hyperparameter tuning and SMOTE. J. Build. Eng. 2023, 62, 106488. [Google Scholar] [CrossRef]
- Chen, W.; Zhang, L. Resilience assessment of regional areas against earthquakes using multi-source information fusion. Reliab. Eng. Syst. Saf. 2021, 215, 107833. [Google Scholar] [CrossRef]
- Al Rifat, S.A.; Liu, W. Measuring community disaster resilience in the conterminous coastal United States. ISPRS Int. J. Geo-Inf. 2020, 9, 469. [Google Scholar] [CrossRef]
- Lu, X.; Xu, Y.; Tian, Y.; Cetiner, B.; Taciroglu, E. A deep learning approach to rapid regional post-event seismic damage assessment using time-frequency distributions of ground motions. Earthq. Eng. Struct. Dyn. 2021, 50, 1612–1627. [Google Scholar] [CrossRef]
- Li, D.; Zhan, Y.; Ding, Z.; Gao, J.; Wu, P.; Meng, L.; Sun, X.; Zhang, X. Upper crustal velocity and seismogenic environment of the Changning MS6. 0 earthquake region in Sichuan, China. Chin. J. Geophys. 2021, 64, 18–35. [Google Scholar] [CrossRef]
- Wang, W.; Chen, H.; Jiang, X.; Ma, L.; Xu, Y.; Qu, M. Lessons from the casualties caused by the Changning Ms 6.0 earthquake in China. Nat. Hazards Res. 2021, 1, 81–87. [Google Scholar] [CrossRef]
- Zhang, J.; Ma, X.; Zhang, J.; Sun, D.; Zhou, X.; Mi, C.; Wen, H. Insights into geospatial heterogeneity of landslide susceptibility based on the SHAP-XGBoost model. J. Environ. Manag. 2023, 332, 117357. [Google Scholar] [CrossRef] [PubMed]
- Narjabadifam, P.; Hoseinpour, R.; Noori, M.; Altabey, W. Practical seismic resilience evaluation and crisis management planning through GIS-based vulnerability assessment of buildings. Earthq. Eng. Eng. Vib. 2021, 20, 25–37. [Google Scholar] [CrossRef]
- Wen, H.-J.; Xie, P.; Xiao, P.; Hu, D.-P. Rapid susceptibility mapping of earthquake-triggered slope geohazards in Lushan County by combining romote sensing and the AHP model developed for the Wenchuan earthquake. Bull. Eng. Geol. Environ. 2017, 76, 909–921. [Google Scholar] [CrossRef]
- Wen, H.; Wu, S.; Wang, G.; Xie, P.; Li, Y.; Zhang, C. A Vulnerability Assessment Method of Buildings Affected by Earthquake Based on Data Mining No. CN201811259565.6). Available online: https://d.wanfangdata.com.cn/patent/ChJQYXRlbnROZXdTMjAyMTAxMDkSEENOMjAxODExMjU5NTY1LjYaCDRuYXJubm5j (accessed on 19 June 2019).
- Wang, Y.; Wen, H.; Sun, D.; Li, Y. Quantitative Assessment of Landslide Risk Based on Susceptibility Mapping Using Random Forest and GeoDetector. Remote Sens. 2021, 13, 2625. [Google Scholar] [CrossRef]
- Sun, D.; Wen, H.; Zhang, Y.; Xue, M. An optimal sample selection-based logistic regression model of slope physical resistance against rainfall-induced landslide. Nat. Hazards 2020, 105, 1255–1279. [Google Scholar] [CrossRef]
- Deng, W.; Zhou, J. Approach for feature weighted support vector machine and its application in flood disaster evaluation. Disaster Adv. 2013, 6, 51–58. [Google Scholar]
- Liu, D.; Fan, Z.; Fu, Q.; Li, M.; Faiz, M.-A.; Ali, S.; Li, T.; Zhang, L.; Khan, M.-I. Random forest regression evaluation model of regional flood disaster resilience based on the whale optimization algorithm. J. Clean. Prod. 2020, 250, 119468. [Google Scholar] [CrossRef]
- Motta, M.; de Castro Neto, M.; Sarmento, P. A mixed approach for urban flood prediction using Machine Learning and GIS. Int. J. Disaster Risk Reduct. 2021, 56, 102154. [Google Scholar] [CrossRef]
- Stumpf, A.; Kerle, N. Object-oriented mapping of landslides using Random Forests. Remote Sens. Environ. 2011, 115, 2564–2577. [Google Scholar] [CrossRef]
- Liuzzi, M.; Aravena Pelizari, P.; Geiß, C.; Masi, A.; Tramutoli, V.; Taubenböck, H. A transferable remote sensing approach to classify building structural types for seismic risk analyses: The case of Val d’Agri area (Italy). Bull. Earthq. Eng. 2019, 17, 4825–4853. [Google Scholar] [CrossRef]
- Mangalathu, S.; Sun, H.; Nweke, C.C.; Yi, Z.; Burton, H.V. Classifying earthquake damage to buildings using machine learning. Earthq. Spectra 2020, 36, 183–208. [Google Scholar] [CrossRef]
- Mangalathu, S.; Burton, H.V. Deep learning-based classification of earthquake-impacted buildings using textual damage descriptions. Int. J. Disaster Risk Reduct. 2019, 36, 101111. [Google Scholar] [CrossRef]
- Taalab, K.; Cheng, T.; Zhang, Y. Mapping landslide susceptibility and types using Random Forest. Big Earth Data 2018, 2, 159–178. [Google Scholar] [CrossRef]
- Zhou, X.-Z.; Wen, H.-J.; Zhang, Y.-L.; Xu, J.-H.; Zhang, W.-G. Landslide susceptibility mapping using hybrid random forest with GeoDetector and RFE for factor optimization. Geosci. Front. 2021, 12, 101211. [Google Scholar] [CrossRef]
- El-Tawil, S.; Ibrahim, A.; Eltawil, A. Stick-Slip Classification Based on Machine Learning Techniques for Building Damage Assessment. J. Earthq. Eng. JEE 2021, 26, 5848–5865. [Google Scholar] [CrossRef]
- Mahmoudi, S.N.; Chouinard, L. Seismic fragility assessment of highway bridges using support vector machines. Bull. Earthq. Eng. 2016, 14, 1571–1587. [Google Scholar] [CrossRef]
- Deng, X.; Liu, Q.; Deng, Y.; Mahadevan, S. An improved method to construct basic probability assignment based on the confusion matrix for classification problem. Inf. Sci. 2016, 340–341, 250–261. [Google Scholar] [CrossRef]
- Sun, D.-L.; Shi, S.-X.; Wen, H.-J.; Xue, J.-H.; Zhou, X.-Z.; Wu, J.-P. A Hybrid Optimization Method of Factor Screening Predicated on GeoDetector and Random Forest for Landslide Susceptibility Mapping. Geomorphology 2021, 363, 107623. [Google Scholar] [CrossRef]


| C2 | C3 | C4 | Initial Earthquake-Damaged Degrees | Description | Field Photos | UAV Images |
|---|---|---|---|---|---|---|
| 1~2 | A~C | I~IV | ||||
| 1: Repairable, including levels I, II, and III | A: Intact | I | Intact | The building’s structure is basically intact and meets the requirements for safe use. |  |  |
| B: Damaged, including levels II and III | II | Cracked | Individual structural members are cracked or slightly inclined, the main structure is safe, or the damage can be repaired, basically meeting the requirements for safe use. |  |  | |
| III | Dilapidated | Many structural members of the building are cracked or seriously inclined. Some load-bearing buildings are unsafe because they cannot be restored once damage prevents them from meeting the standards for safe usage. |  |  | ||
| 2: Non repairable | C: Collapsed | IV | Collapsed | Load-bearing structure does not meet the safety requirements as the building has collapsed. |  |  |
| Classification Schemes | C2 | C3 | C4 | ||||||
|---|---|---|---|---|---|---|---|---|---|
| C21 | C22 | C3A | C3B | C3C | C4I | C4II | C4III | C4IV | |
| Number of Buildings | 778 | 77 | 256 | 522 | 77 | 256 | 397 | 125 | 77 |
| Category | Influence Factors | Description |
|---|---|---|
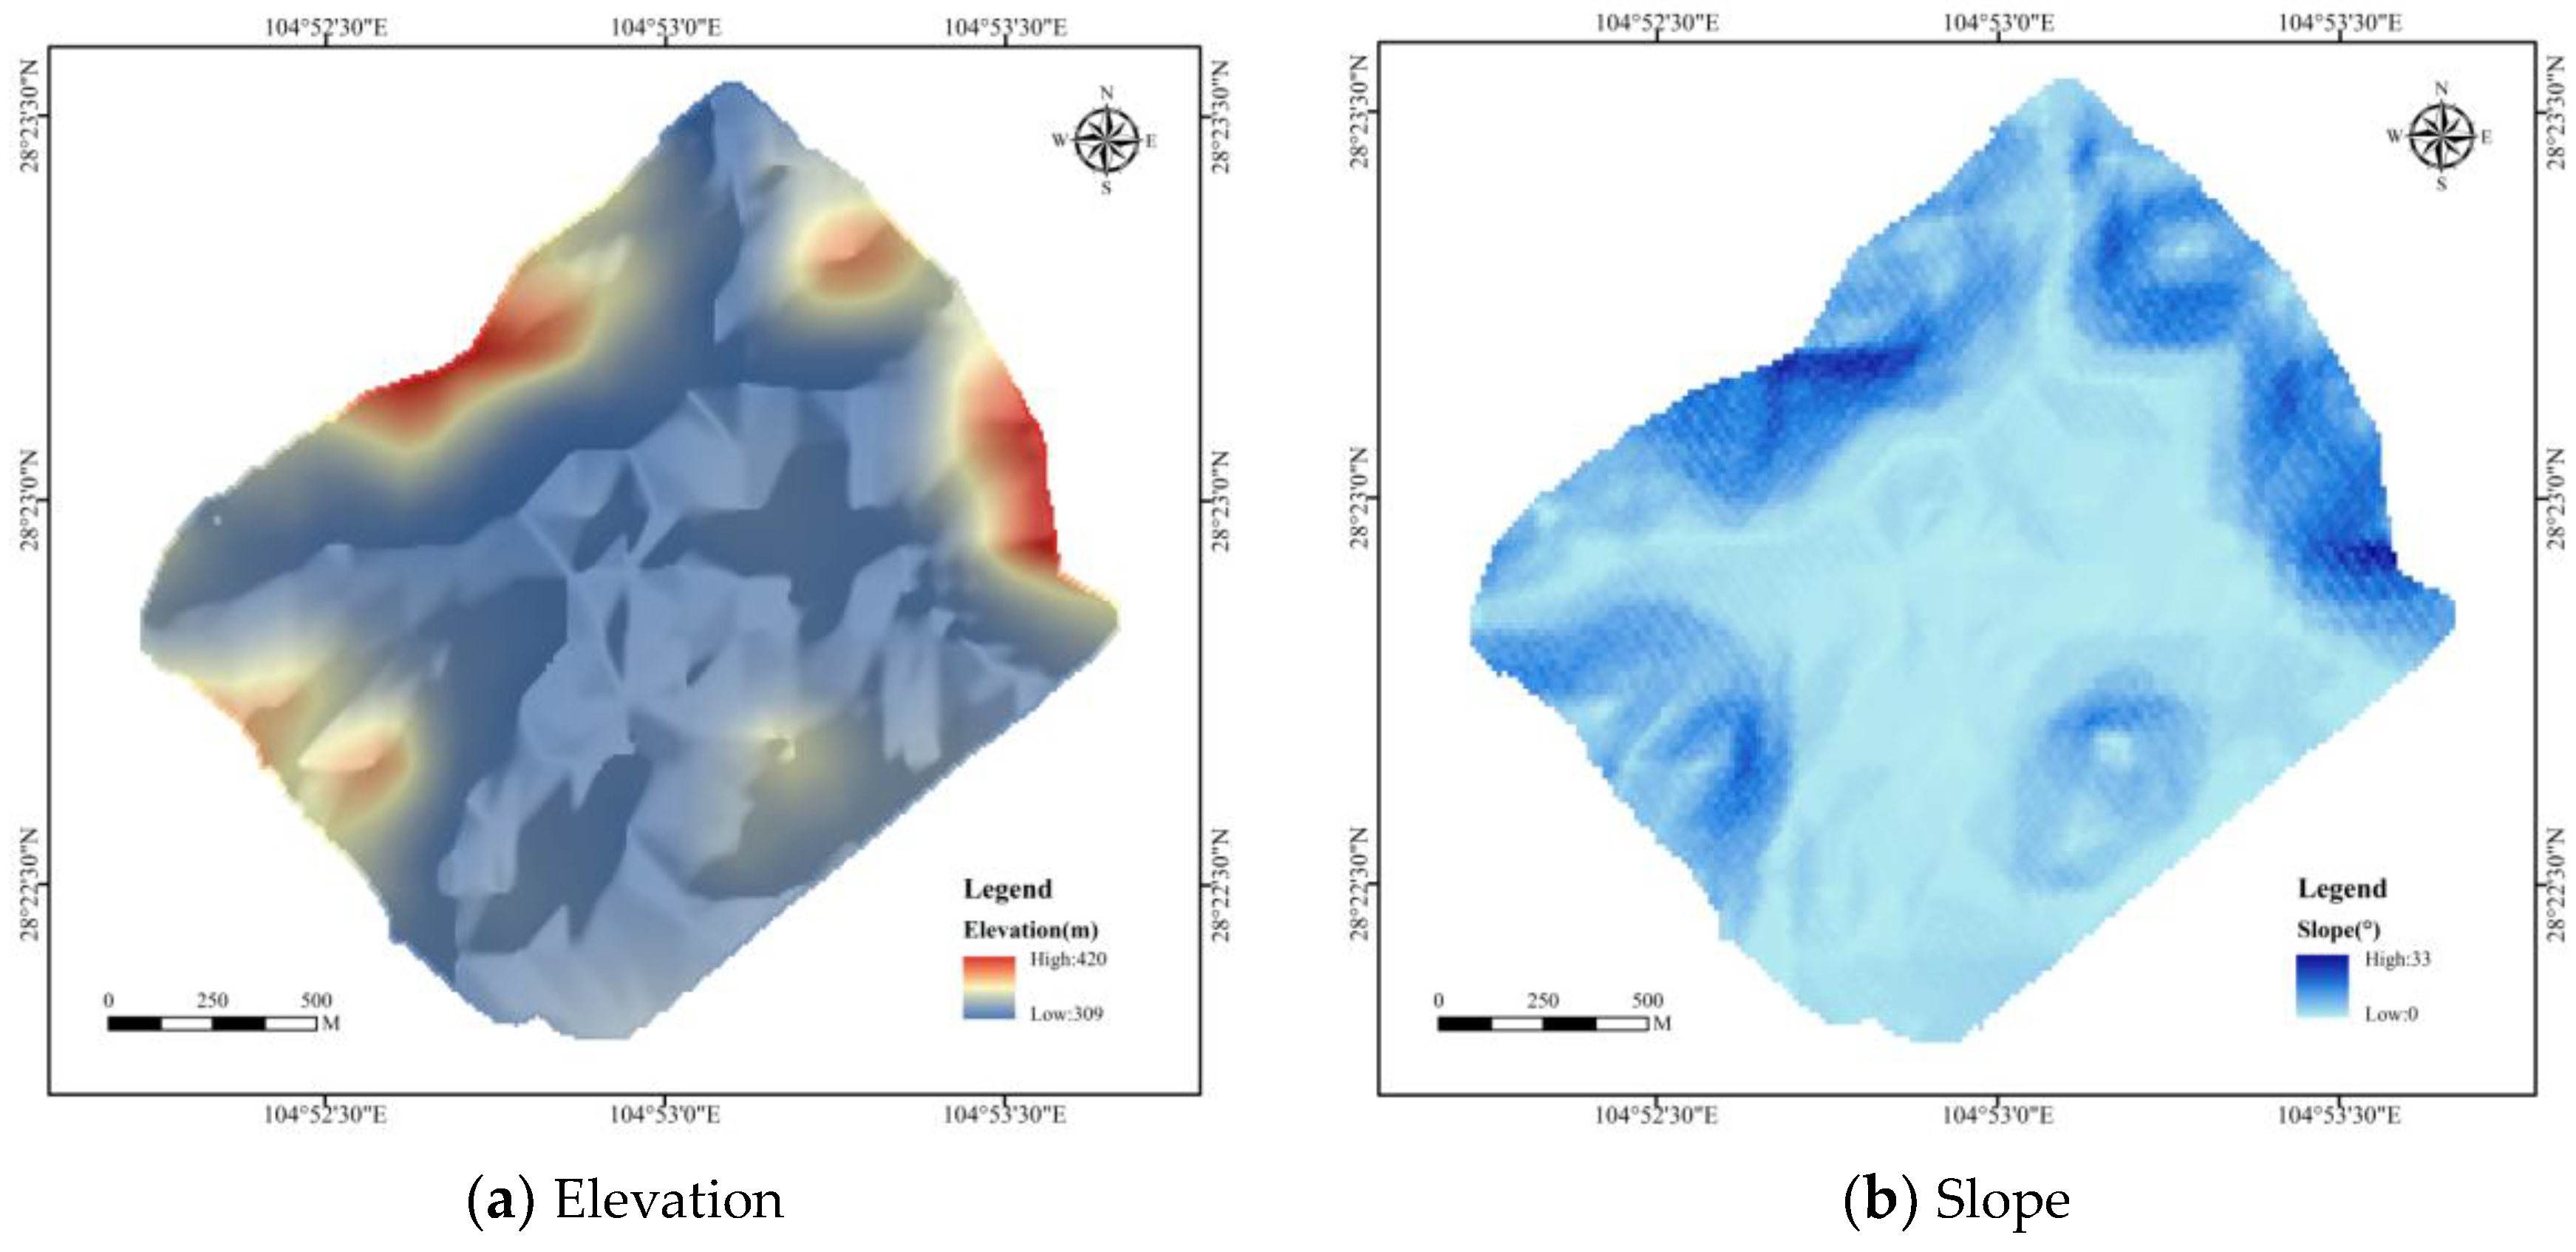
| Topographic factors | Elevation | Elevation directly reflects the level of terrain and determines the extraction of other slope factors. Different elevations affect different land, vegetation, and climatic factors and human activities. |
| Slope | Slope is the proportion in distance of horizontal to vertical height. The stress distribution in different slopes is different. | |
| Aspect | The slope’s aspect is the direction of projection. In a mountainous environment, aspect has a significant impact on precipitation and has an impact on hydrogeology. | |
| Curvature | Curvature is the second-order derivative of the surface, affecting the erosion of soil via water flow. | |
| Plan curvature | Plan curvature refers to the change rate of surface aspect. The essence is to extract the aspect of DEM and then extract the slope of this aspect. | |
| Profile curvature | Profile curvature refers to the change rate of the surface slope. In essence, the idea is to extract the aspect of the DEM twice. | |
| Micro-landform | Micro-landform is a small undulation with complex surface on a large landform, which is mainly formed by erosion and accumulation under weathering. The strength of rock and soil in different micro-landform units are different. | |
| Geological factors | CRDS | CRDS refers to the reclassification of both stratum dip direction and slope aspect. Different combination types have different slope stability values. |
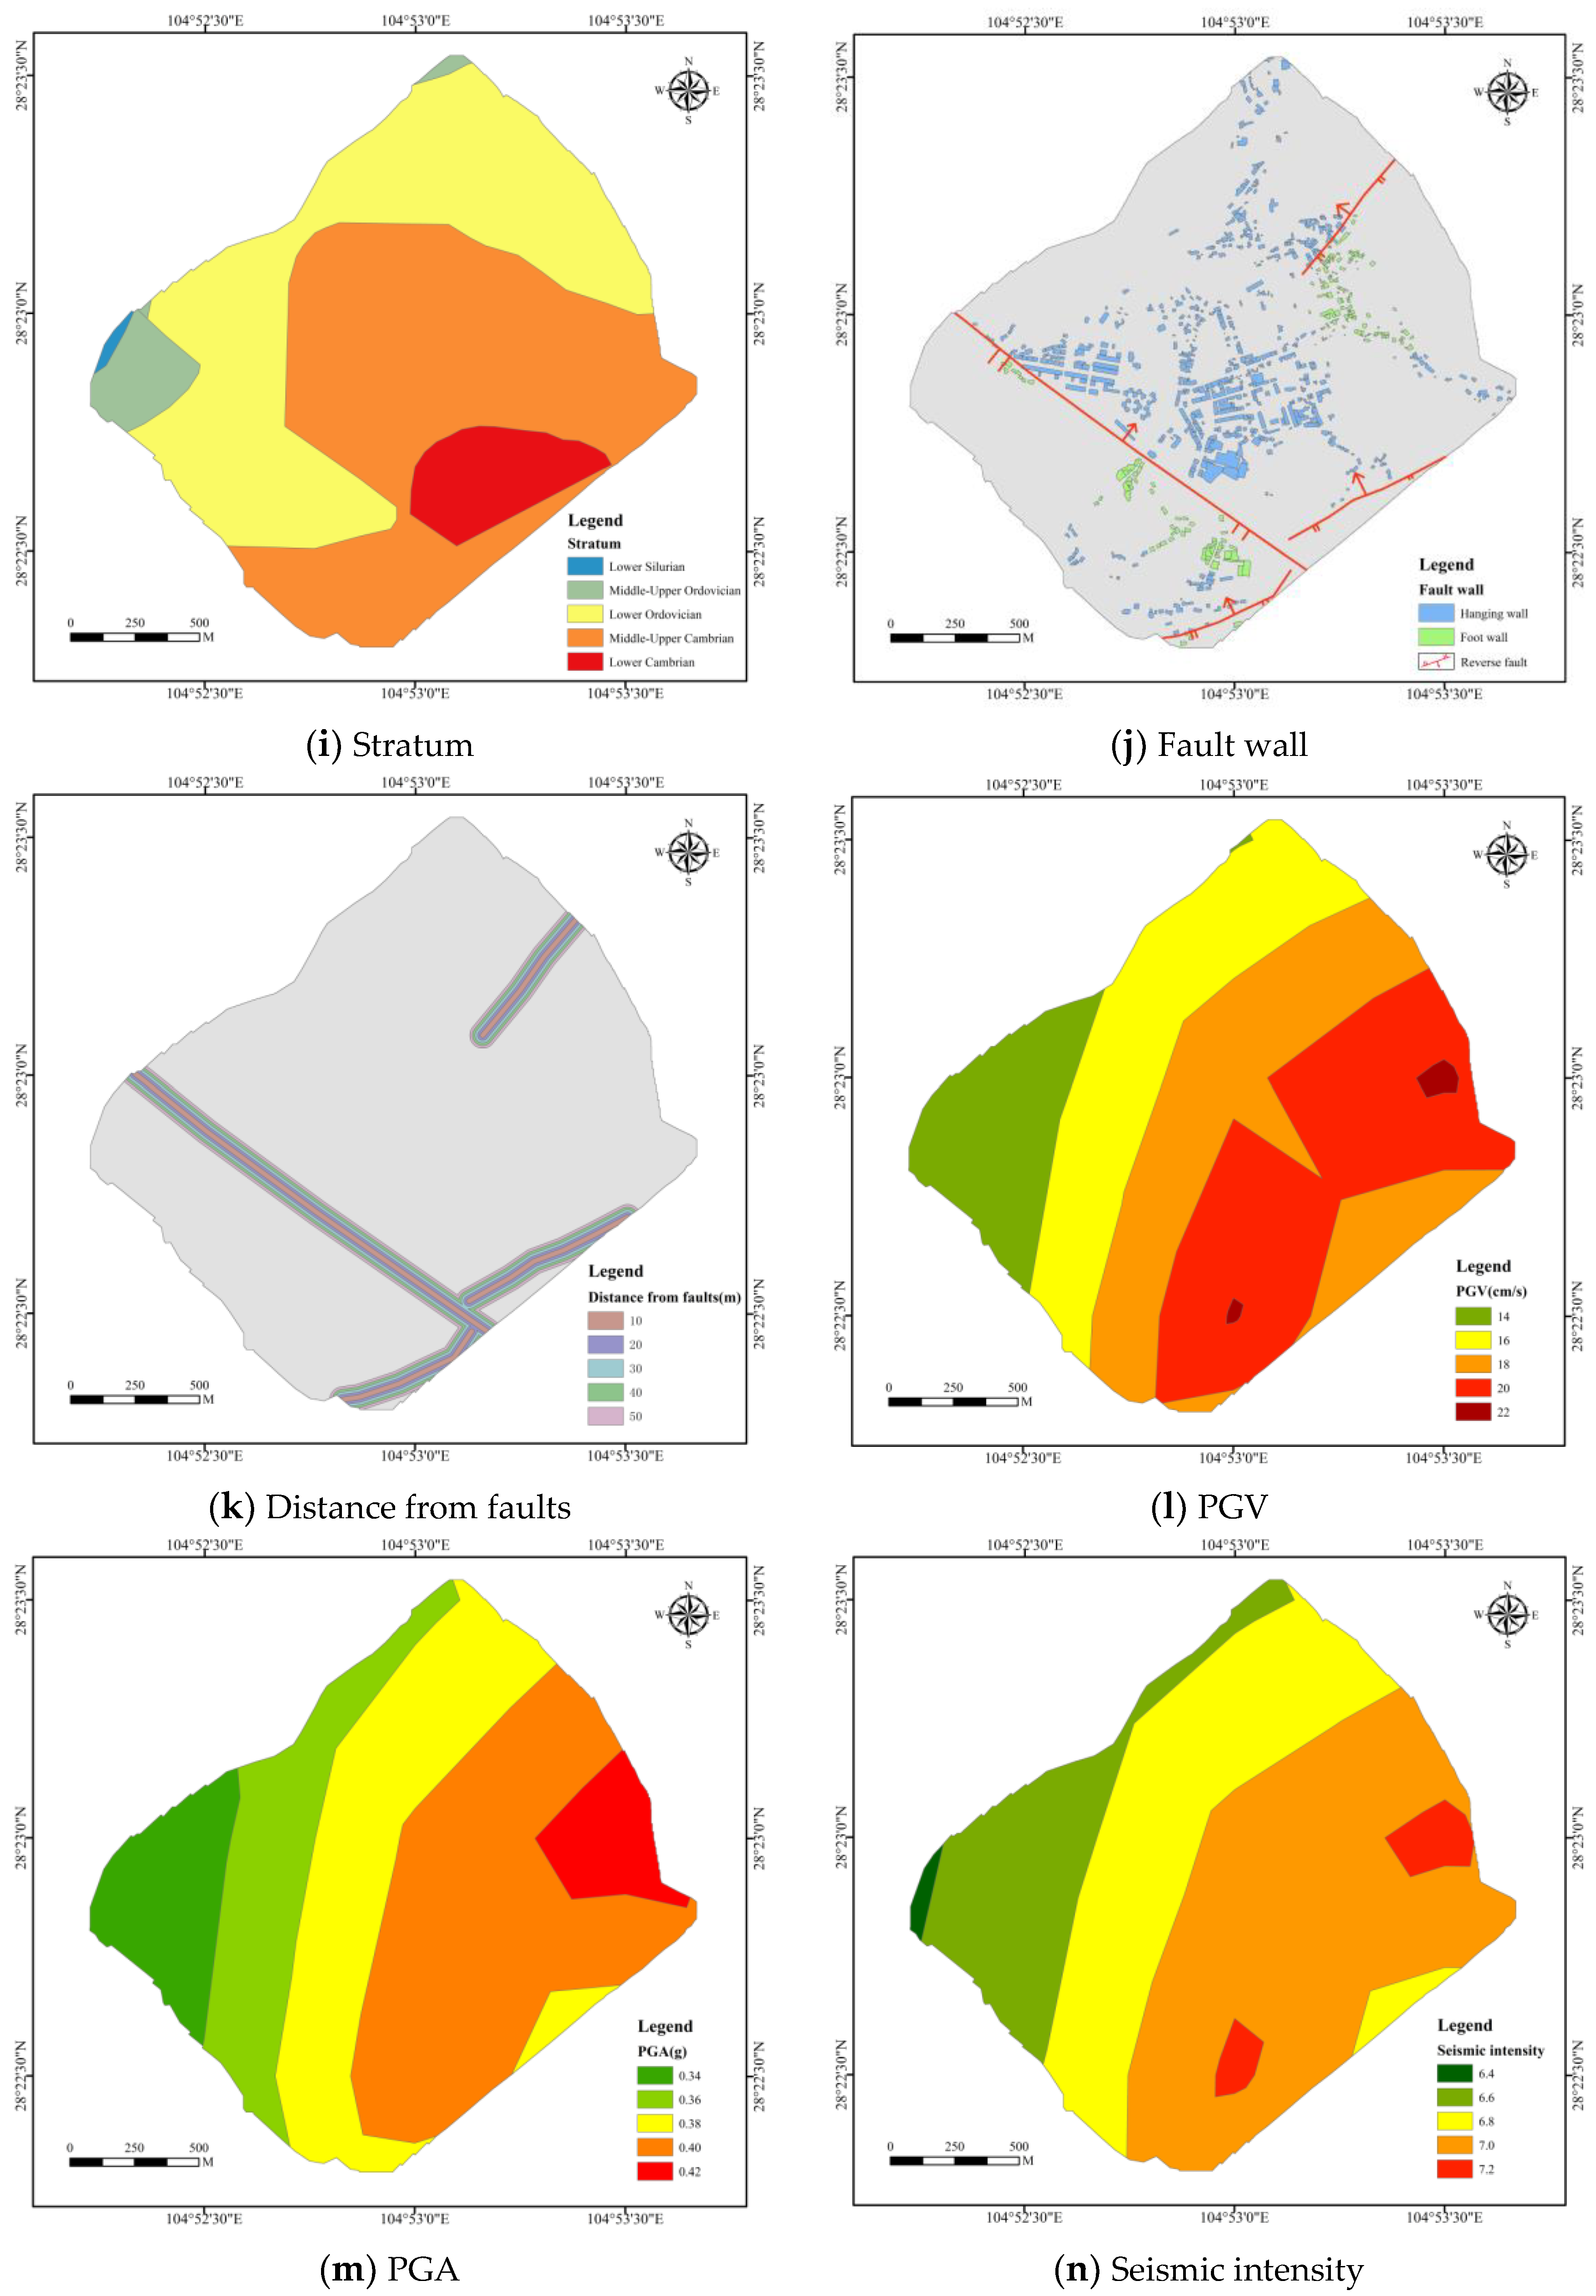
| Stratum | The formation time and weathering degree are different; the bearing capacity and lithology of stratum is different. | |
| Fault wall | The ground motion amplitude of the hanging wall is greater than the foot wall. | |
| Distance from faults | Within a specific range, the closer the fault, the looser the soil, and the more sensitive a building is to earthquake damage. | |
| Seismic factors | PGV | The maximum absolute value of surface particle velocity during earthquake motion. |
| PGA | The maximum absolute value of surface particle acceleration during earthquake motion. | |
| Seismic intensity | The influence of earthquake on the surface and the structural properties of buildings. | |
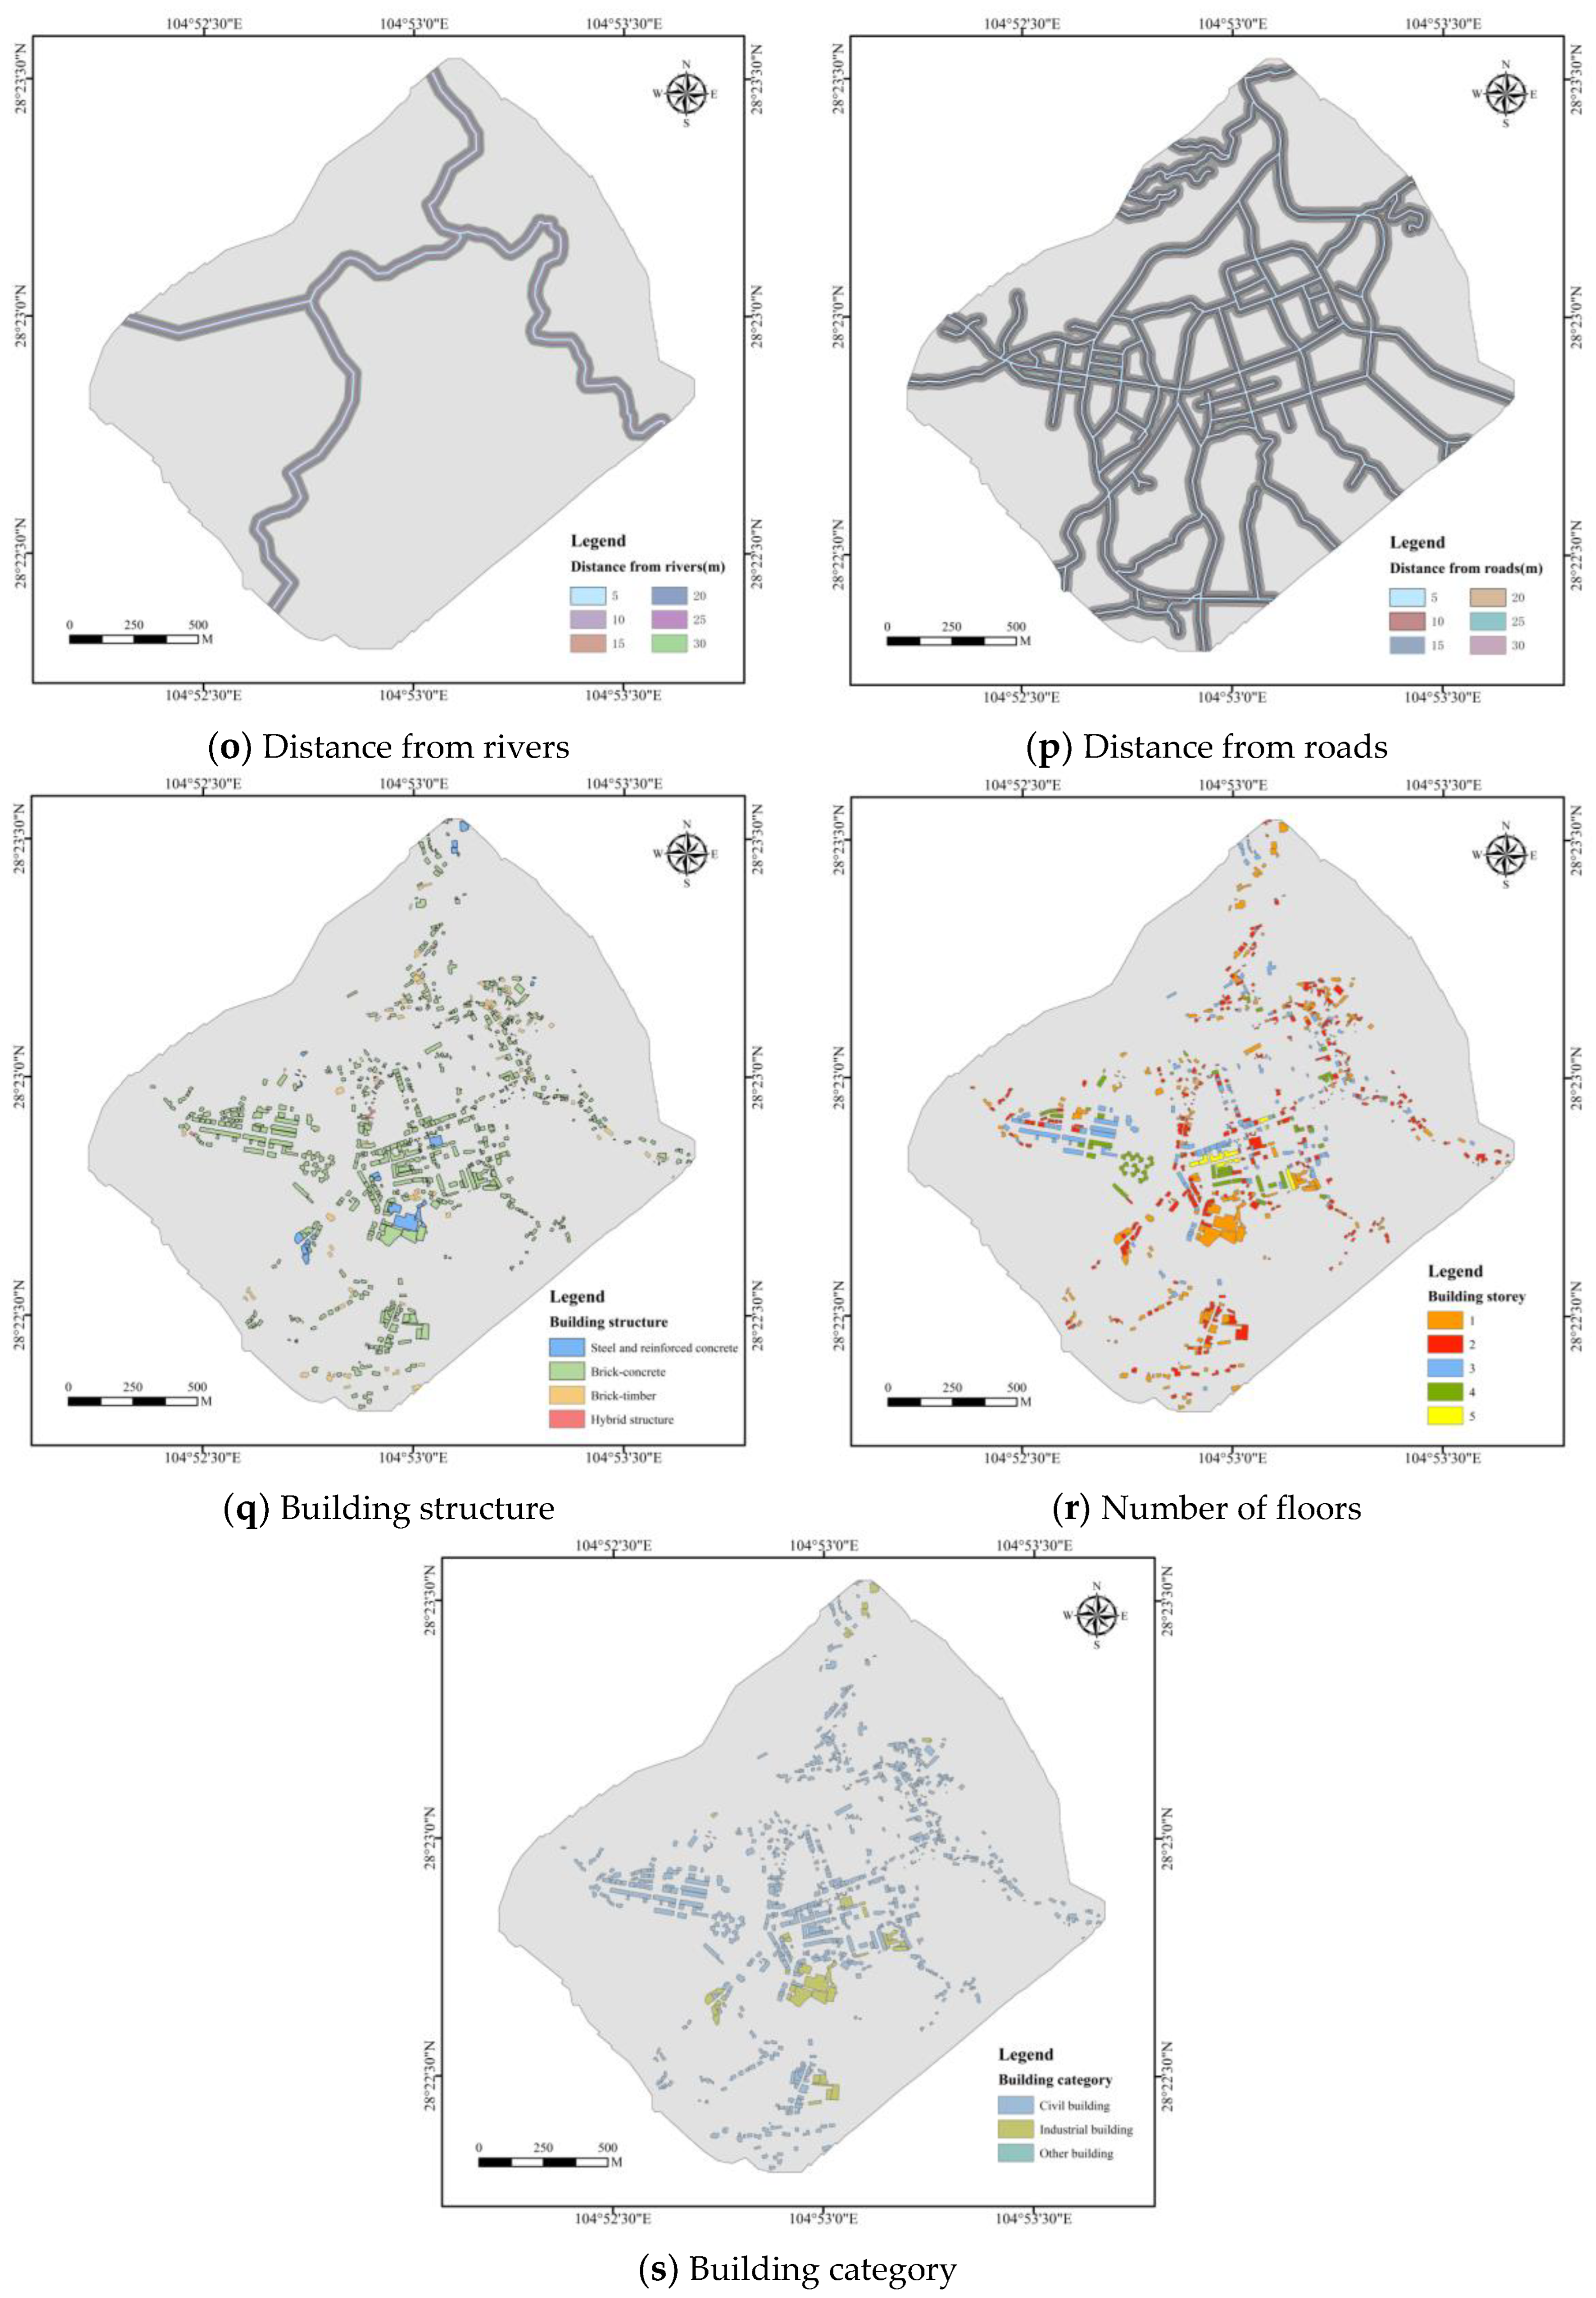
| Environmental factors | Distance from rivers | Within a certain range, the closer a region is to a river, the higher the water content of soil layer; this relationship affects an area’s hydrogeological conditions and foundation bearing capacity. |
| Distance from roads | Within a certain range, the road construction leads to the stress redistribution of the original rocky soil. The closer an area is to a road, the greater the impact. | |
| Building factors | Building structure | The earthquake damage degrees of different structures are different, as are their BSR levels different. |
| Number of floors | Building height is different, weight is different. | |
| Building category | The design principles and materials of buildings with different use categories, such as industrial and civil use, are different. |
| Prediction Level (j) | |||||
|---|---|---|---|---|---|
| I | II | III | IV | ||
| Actual level (i) | I | N11 | N12 | N13 | N14 |
| II | N21 | N22 | N23 | N24 | |
| III | N31 | N32 | N33 | N34 | |
| IV | N41 | N42 | N43 | N44 | |
| RF | SVM | ||
|---|---|---|---|
| mtry | ntree | Sigma | C |
| 3 | 1500 | 0.300 | 15 |
| Classification Schemes | C2 | C3 | C4 | |||||||
|---|---|---|---|---|---|---|---|---|---|---|
| C21 | C22 | C3A | C3B | C3C | C4I | C4II | C4III | C4IV | ||
| RF | Pre | 0.94 | 1.00 | 0.88 | 0.75 | 1.00 | 0.64 | 0.65 | 1.00 | 0.8 |
| Rec | 1.00 | 0.38 | 0.58 | 0.98 | 0.13 | 0.62 | 0.85 | 0.33 | 0.50 | |
| F1 | 0.97 | 0.55 | 0.7 | 0.85 | 0.22 | 0.63 | 0.74 | 0.50 | 0.62 | |
| SVM | Pre | 0.94 | 0.5 | 0.80 | 0.78 | 1.00 | 0.71 | 0.62 | 0.50 | 0.67 |
| Rec | 0.99 | 0.38 | 0.62 | 0.94 | 0.38 | 0.65 | 0.80 | 0.25 | 0.29 | |
| F1 | 0.96 | 0.5 | 0.80 | 0.85 | 0.55 | 0.68 | 0.70 | 0.33 | 0.40 | |
Disclaimer/Publisher’s Note: The statements, opinions and data contained in all publications are solely those of the individual author(s) and contributor(s) and not of MDPI and/or the editor(s). MDPI and/or the editor(s) disclaim responsibility for any injury to people or property resulting from any ideas, methods, instructions or products referred to in the content. |
© 2023 by the authors. Licensee MDPI, Basel, Switzerland. This article is an open access article distributed under the terms and conditions of the Creative Commons Attribution (CC BY) license (https://creativecommons.org/licenses/by/4.0/).
Share and Cite
Wen, H.; Zhou, X.; Zhang, C.; Liao, M.; Xiao, J. Different-Classification-Scheme-Based Machine Learning Model of Building Seismic Resilience Assessment in a Mountainous Region. Remote Sens. 2023, 15, 2226. https://doi.org/10.3390/rs15092226
Wen H, Zhou X, Zhang C, Liao M, Xiao J. Different-Classification-Scheme-Based Machine Learning Model of Building Seismic Resilience Assessment in a Mountainous Region. Remote Sensing. 2023; 15(9):2226. https://doi.org/10.3390/rs15092226
Chicago/Turabian StyleWen, Haijia, Xinzhi Zhou, Chi Zhang, Mingyong Liao, and Jiafeng Xiao. 2023. "Different-Classification-Scheme-Based Machine Learning Model of Building Seismic Resilience Assessment in a Mountainous Region" Remote Sensing 15, no. 9: 2226. https://doi.org/10.3390/rs15092226
APA StyleWen, H., Zhou, X., Zhang, C., Liao, M., & Xiao, J. (2023). Different-Classification-Scheme-Based Machine Learning Model of Building Seismic Resilience Assessment in a Mountainous Region. Remote Sensing, 15(9), 2226. https://doi.org/10.3390/rs15092226