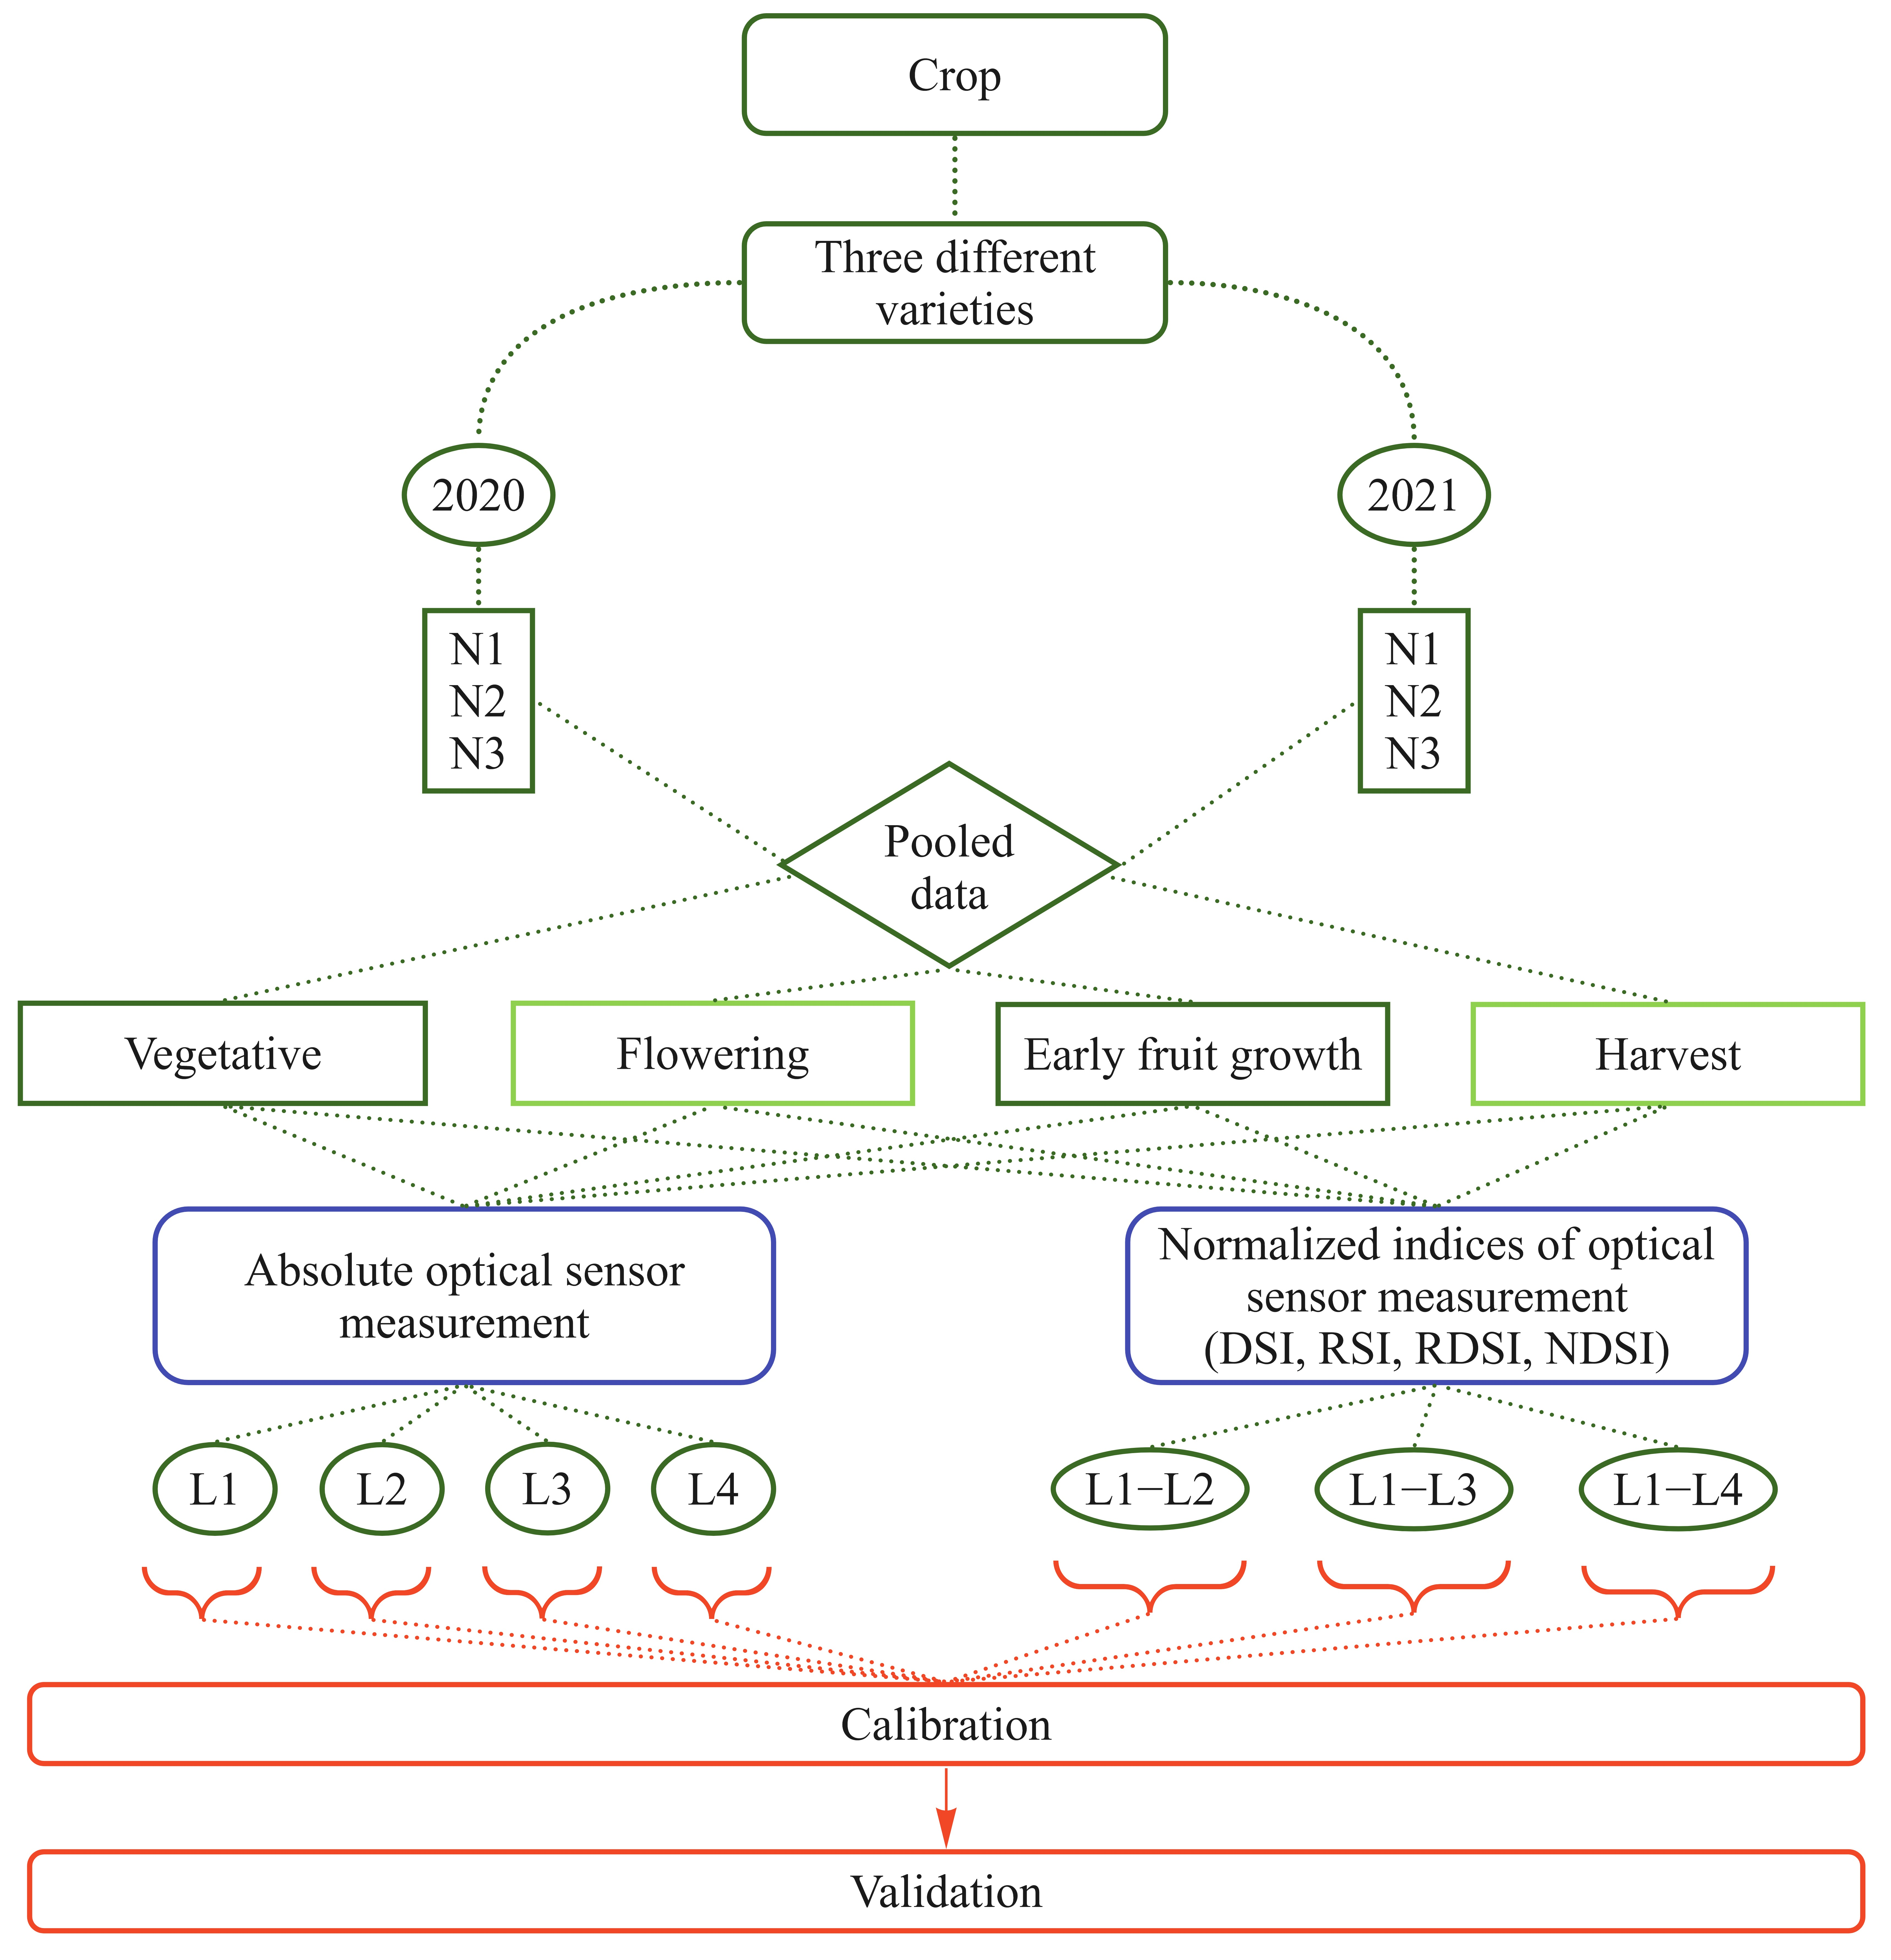
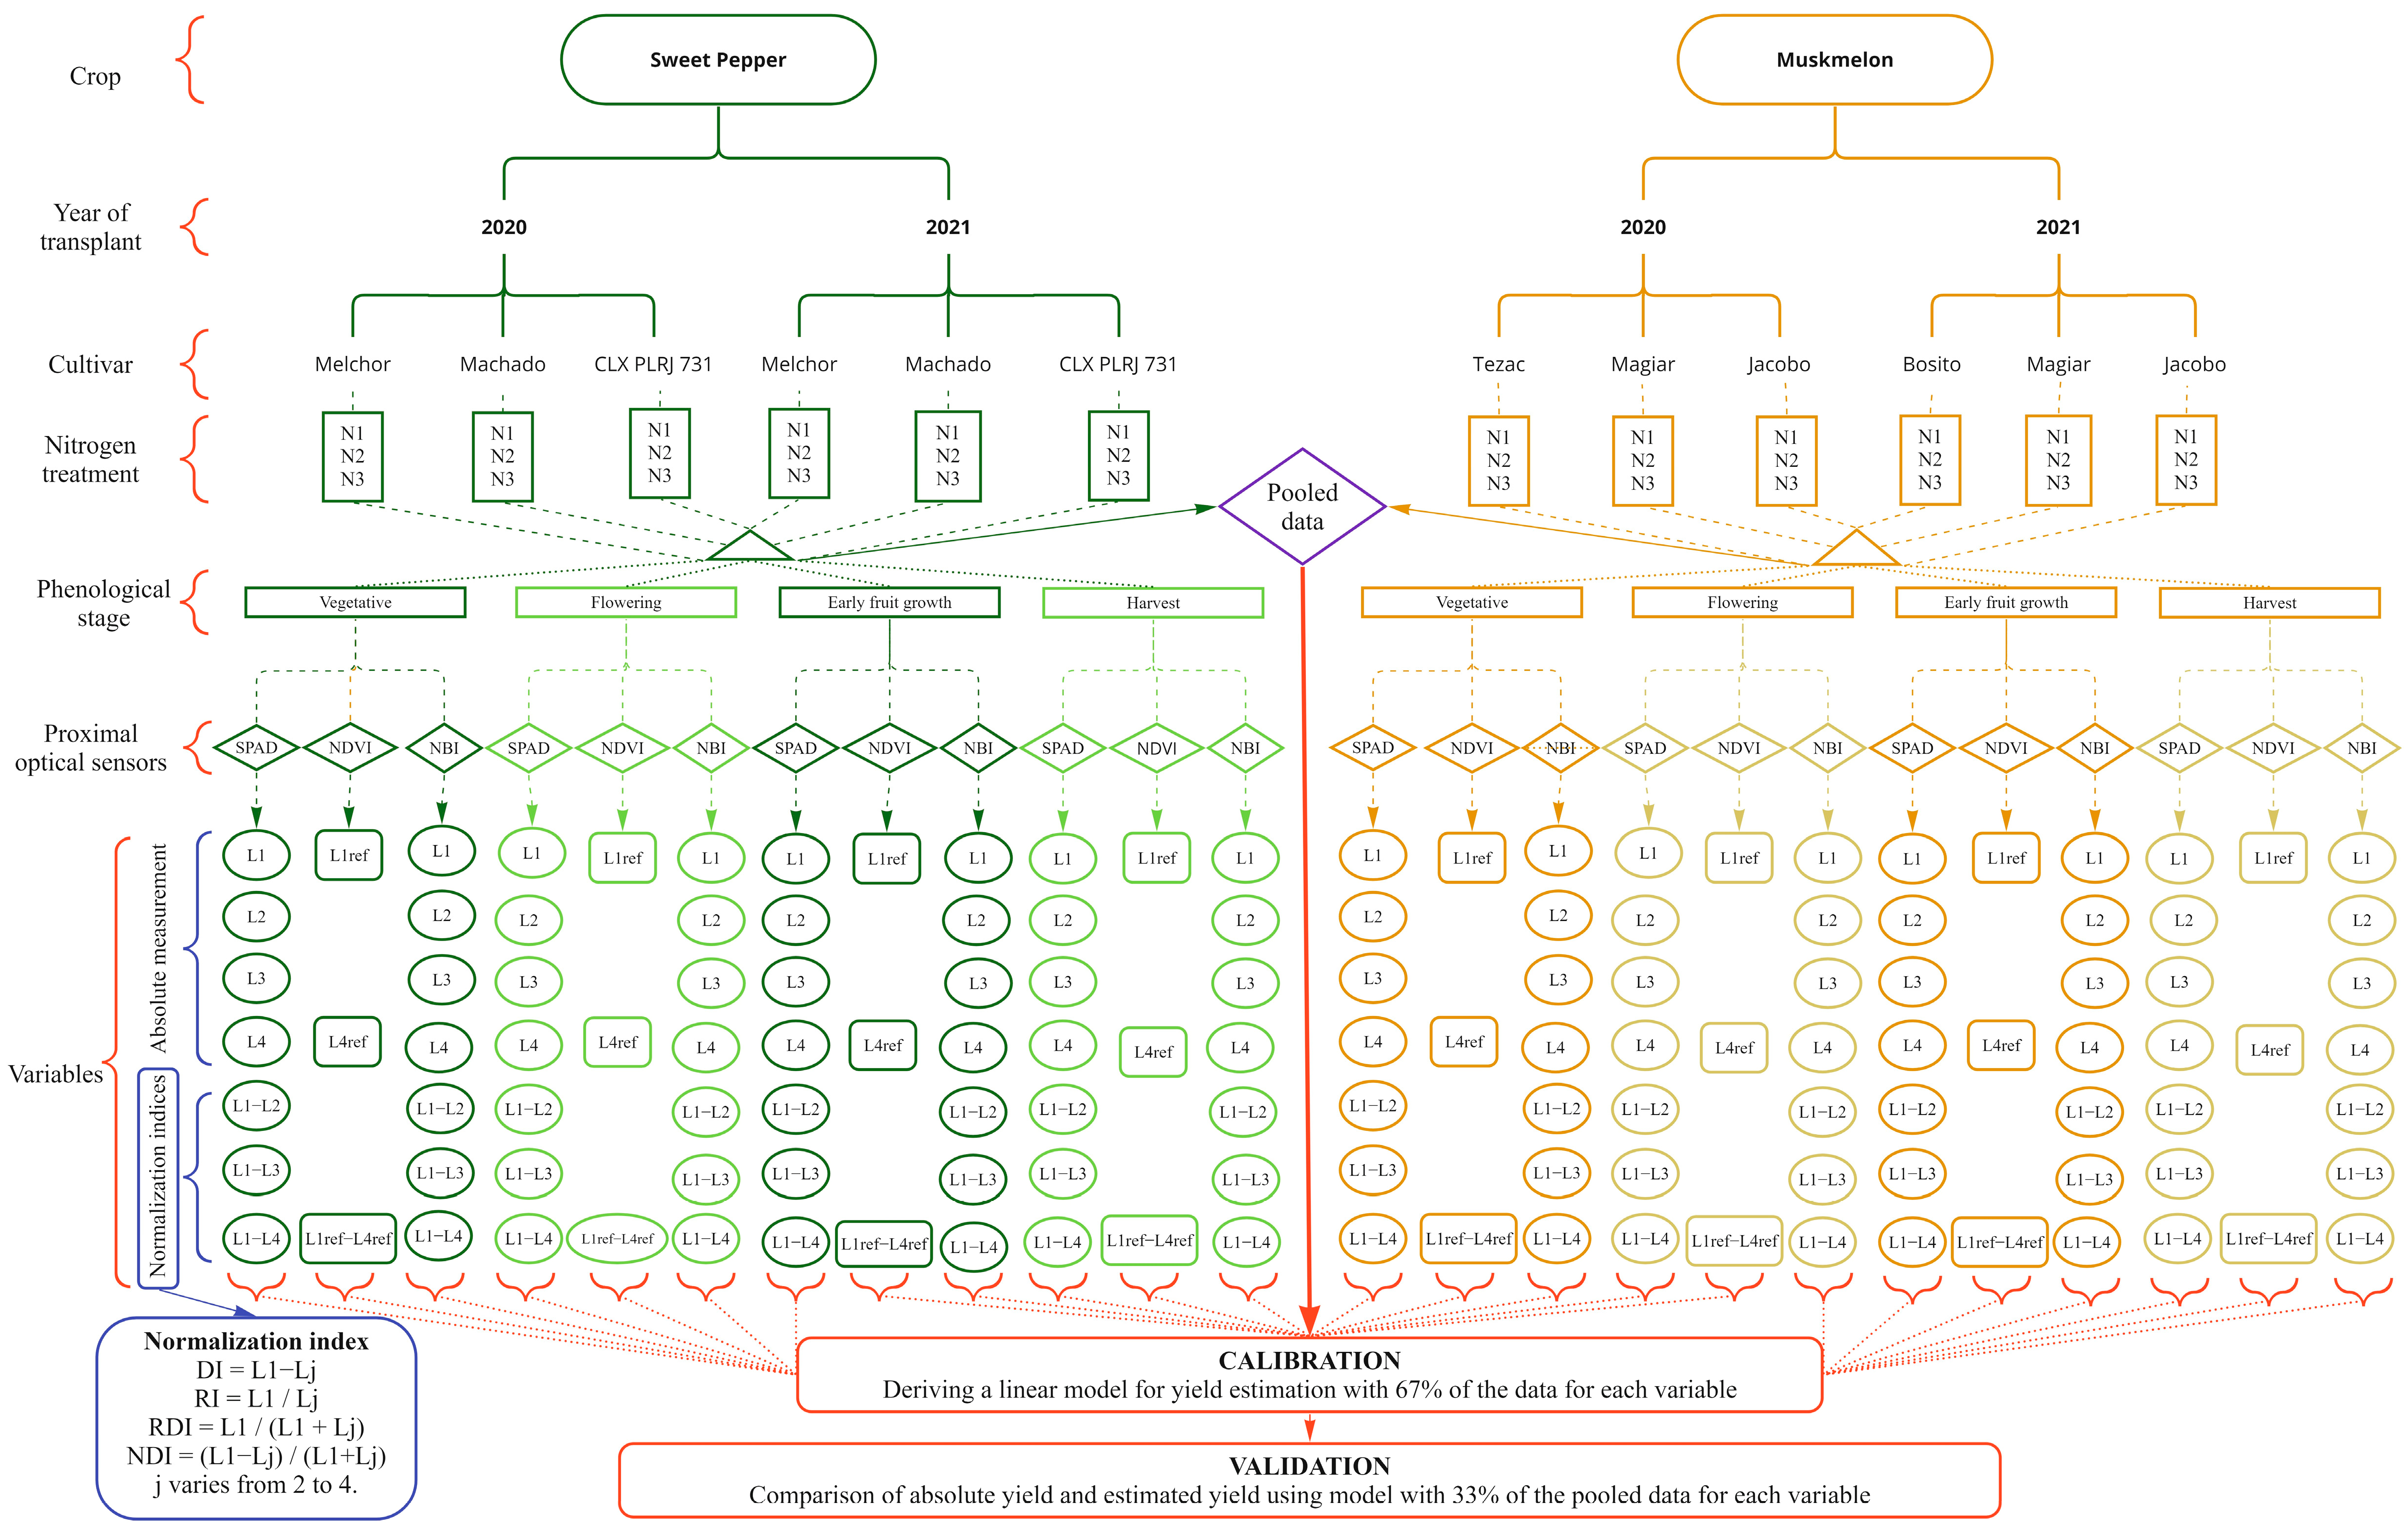
Figure 1.
Research diagram including the independent variables, dependent variables, calibration, and validation information. N1 is the very deficient N treatment, N2 is the deficient N treatment, and N3 is the conventional N treatment. L1 (L1ref), L2, L3 and L4 (L4ref), refer to the latest (most recent) second, third and fourth fully expanded leafs, respectively.
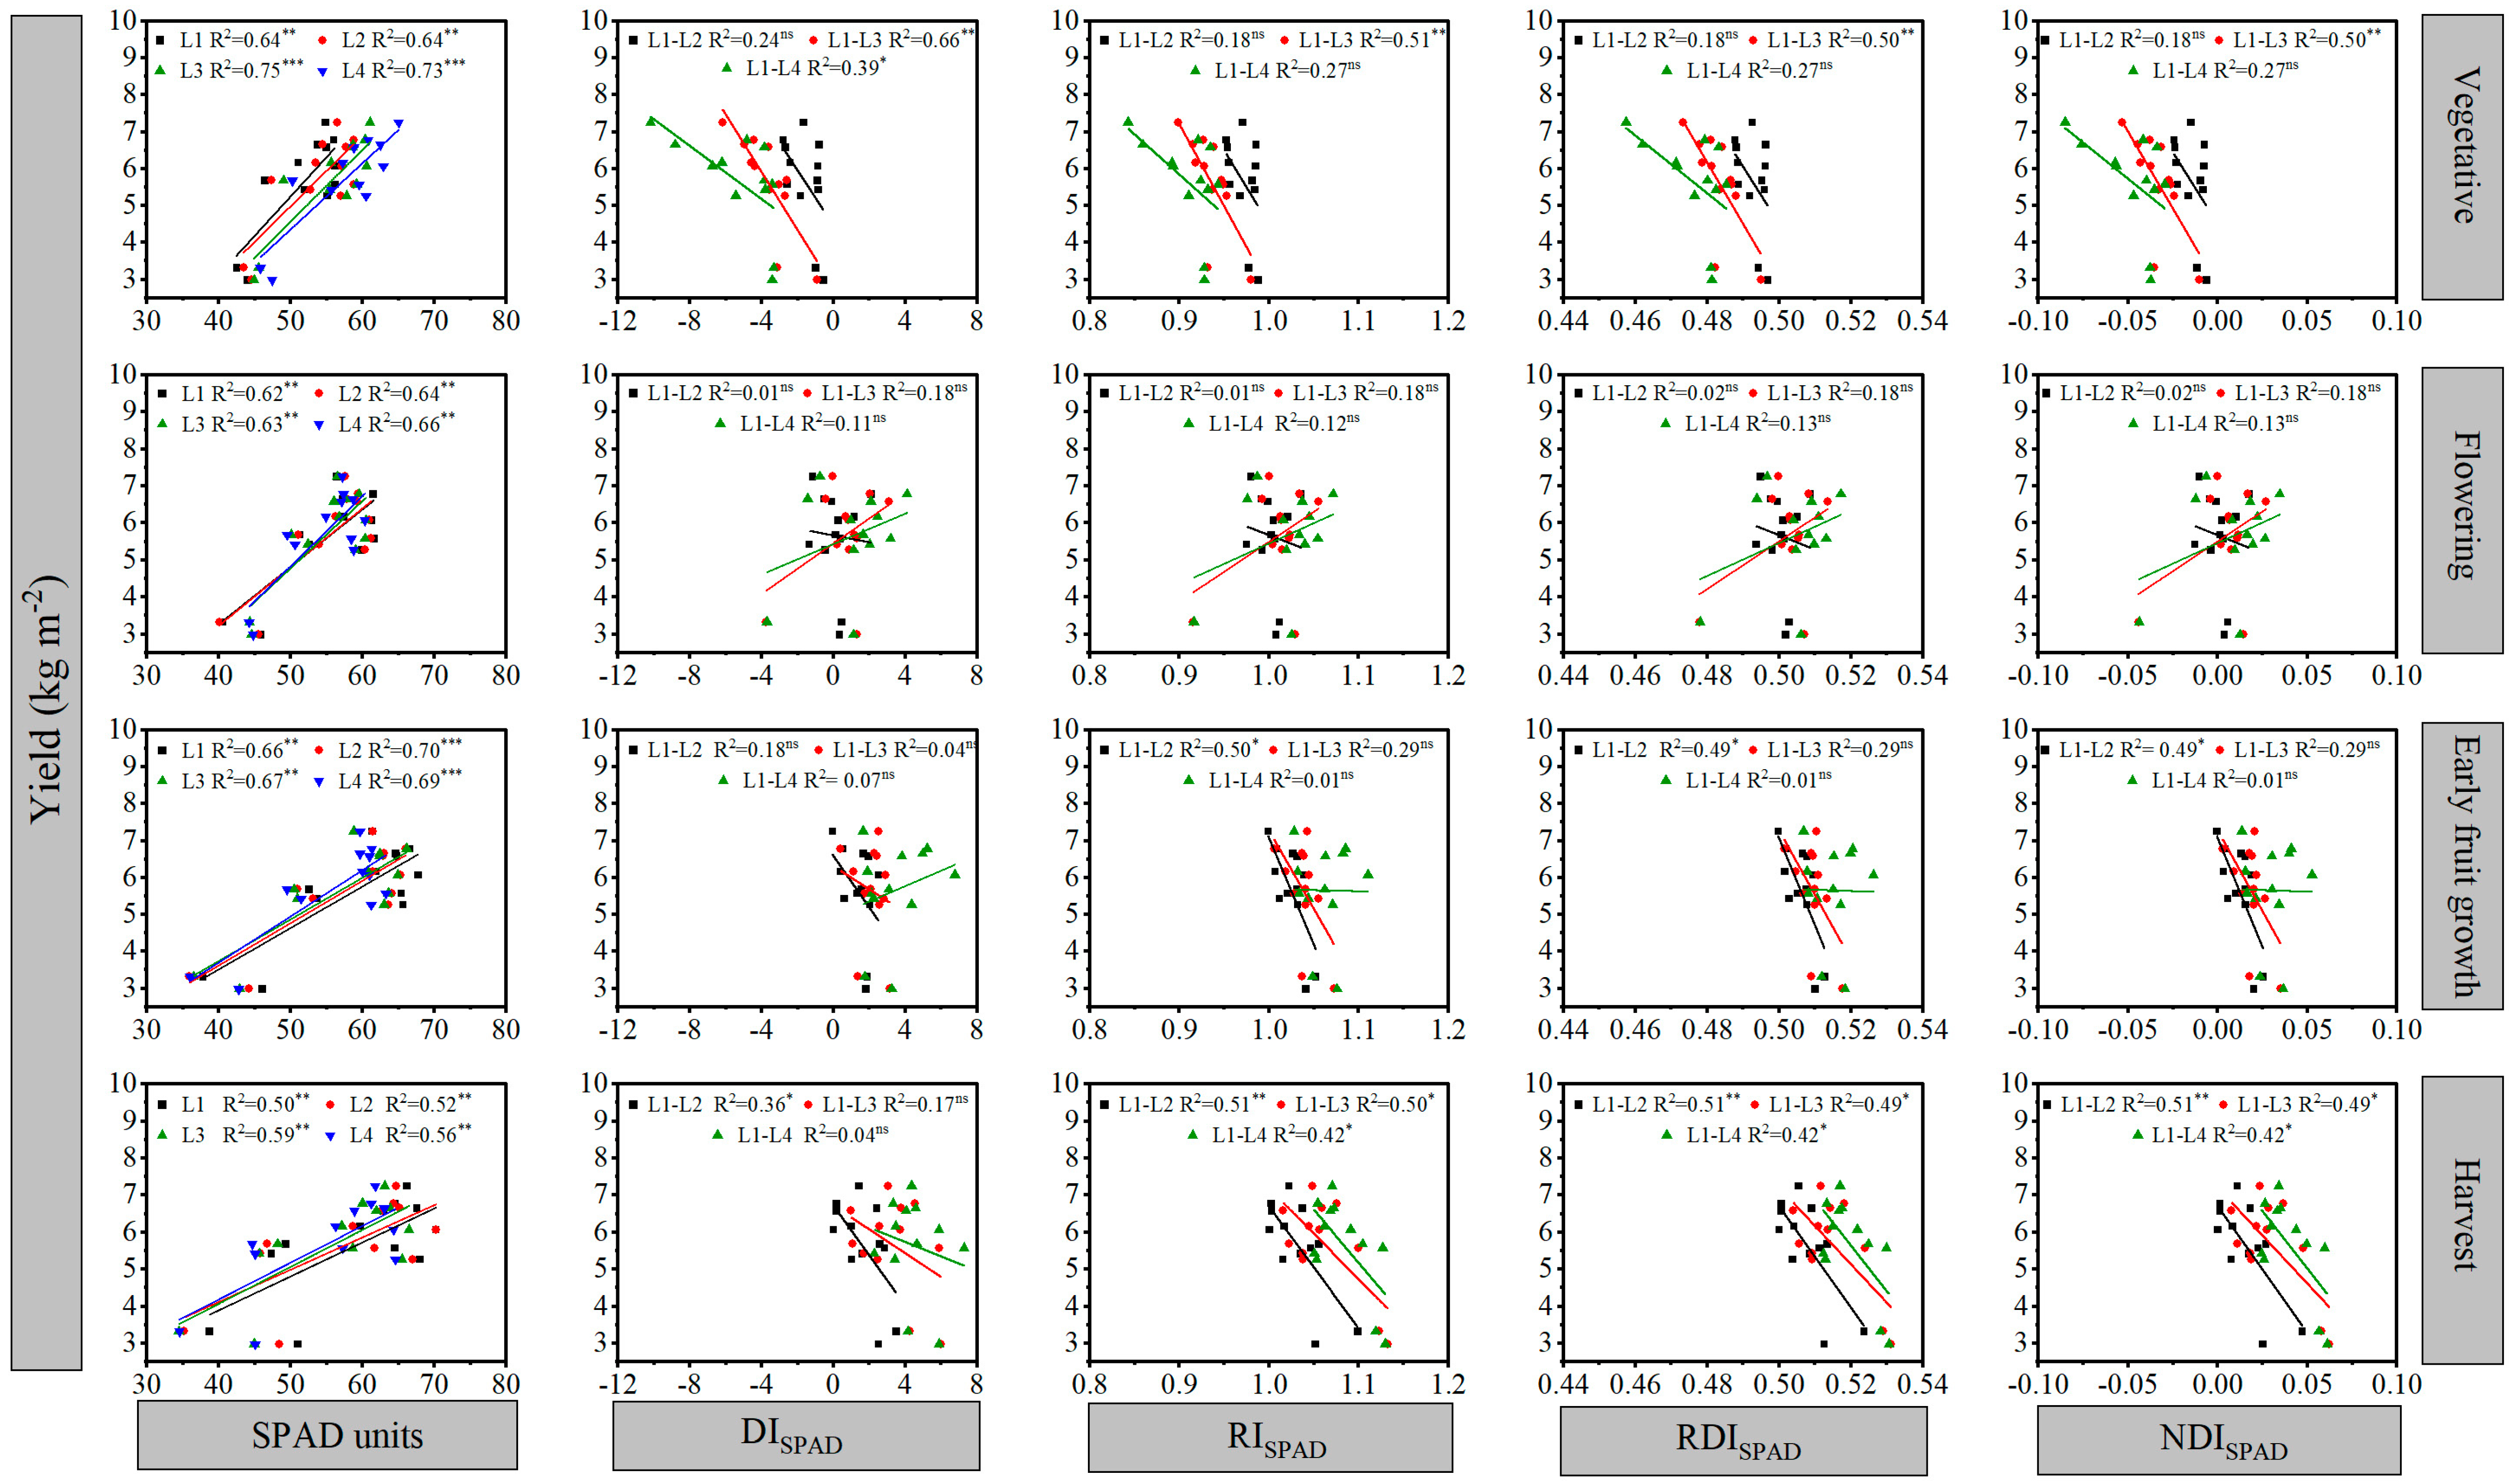
Figure 2.
The relationships between absolute SPAD measurements and several normalized SPAD indices (DI, RI, RDS, NDI) with total fruit yield (kg m−2) at different phenological stages of sweet pepper, for calibration data. L1, L2, L3 and L4, refer to the latest (most recent), second, third and fourth fully expanded leaf, respectively. Asterisks show significance of regressions: ***, p < 0.001; **, p < 0.01; *, p < 0.05; ns, p > 0.05.
Figure 3.
The relationships between absolute SPAD measurements and several normalized SPAD indices (DI, RI, RDI, NDI) with total fruit yield (kg m−2) at different phenological stages of muskmelon, for calibration data. L1, L2, L3 and L4, refer to the latest (most recent) second, third and fourth fully expanded leaf, respectively. Asterisks show significance of regressions: ***, p < 0.001; **, p < 0.01; *, p < 0.05; ns, p > 0.05.
Figure 4.
The relationships between absolute NBI measurements and several normalized NBI indices (DI, RI, RDS, NDI) with total fruit yield (kg m−2) at different phenological stages of sweet pepper, for calibration data. L1, L2, L3 and L4, refer to the latest (most recent), second, third and fourth fully expanded leaf, respectively. Asterisks show significance of regressions: ***, p < 0.001; **, p < 0.01; *, p < 0.05; ns, p > 0.05.
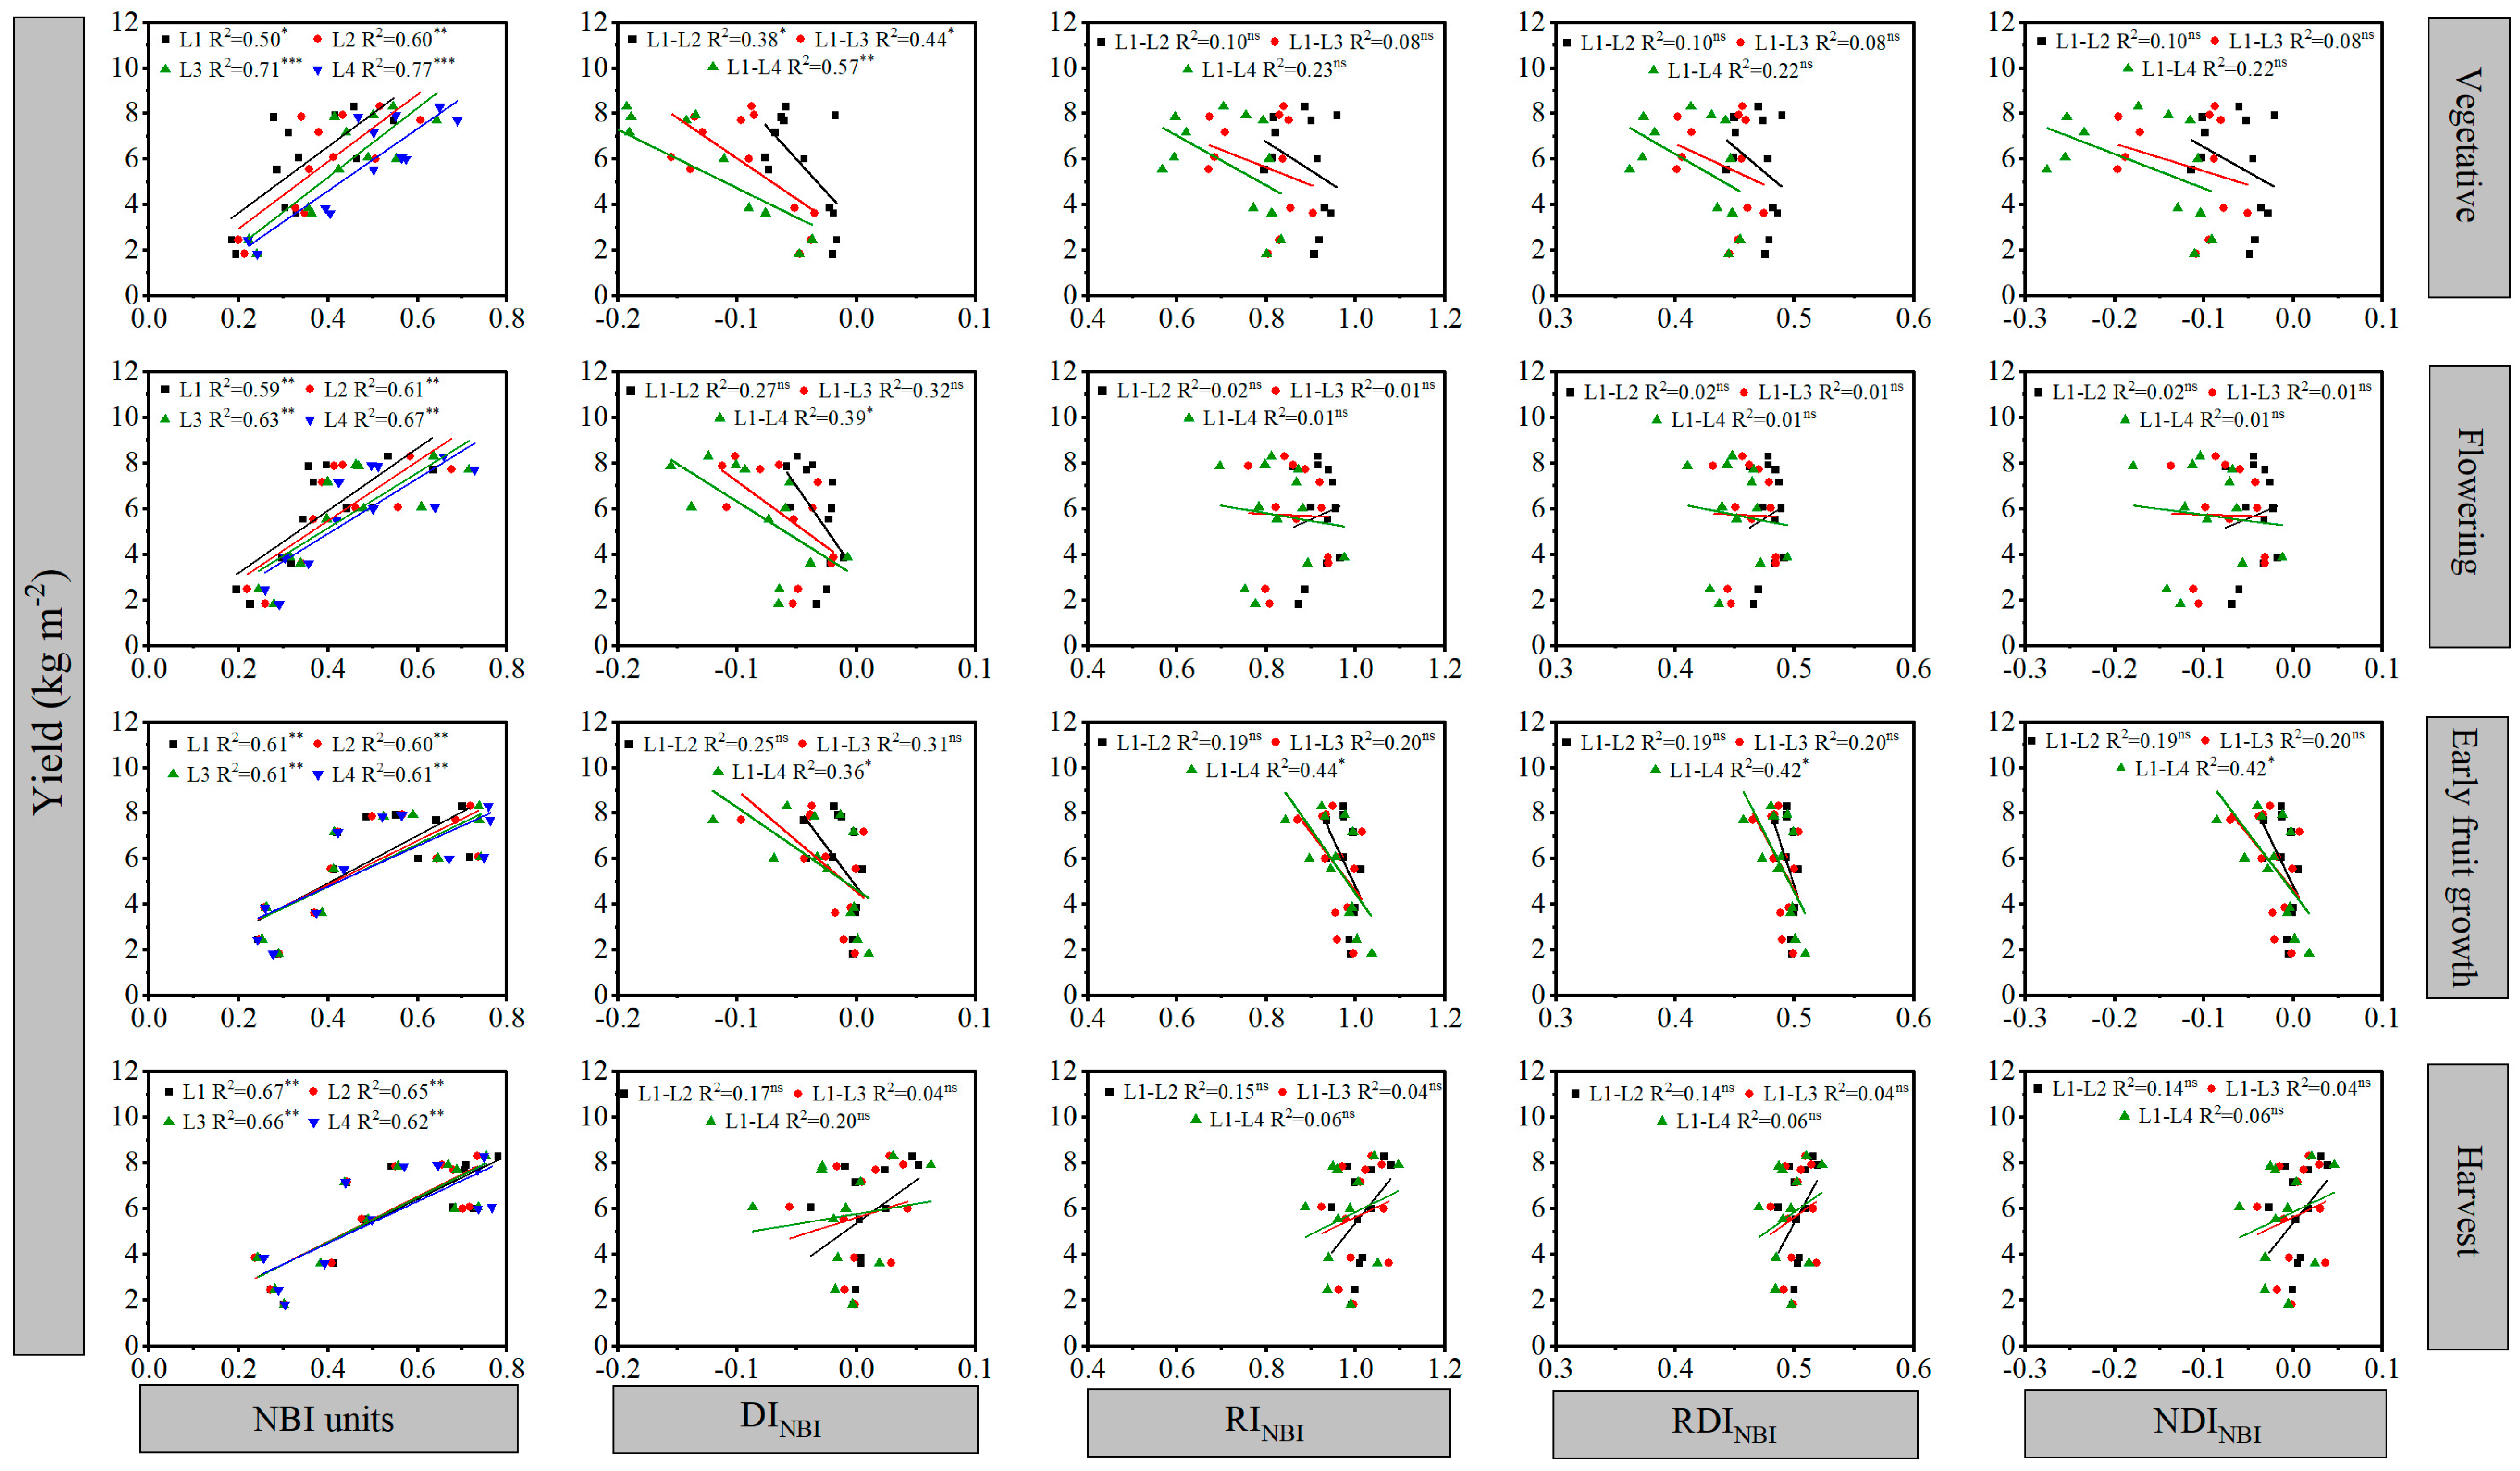
Figure 5.
The relationships between absolute NBI measurements and several normalized NBI indices (DI, RI, RDI, NDI) with total fruit yield (kg m−2) at different phenological stages of muskmelon, for calibration data. L1, L2, L3 and L4, refer to the latest (most recent) second, third and fourth fully expanded leaf, respectively. Asterisks show significance of regressions: ***, p < 0.001; **, p < 0.01; *, p < 0.05; ns, p > 0.05.
Figure 6.
The relationships between absolute NDVI measurements and several normalized NDVI indices (DI, RI, RDS, NDI) with total fruit yield (kg m−2) at different phenological stages of sweet pepper, for calibration data. L1, L2, L3 and L4, refer to the latest (most recent), second, third and fourth fully expanded leaf, respectively. Asterisks show significance of regressions: ***, p < 0.001; **, p < 0.01; *, p < 0.05; ns, p > 0.05.
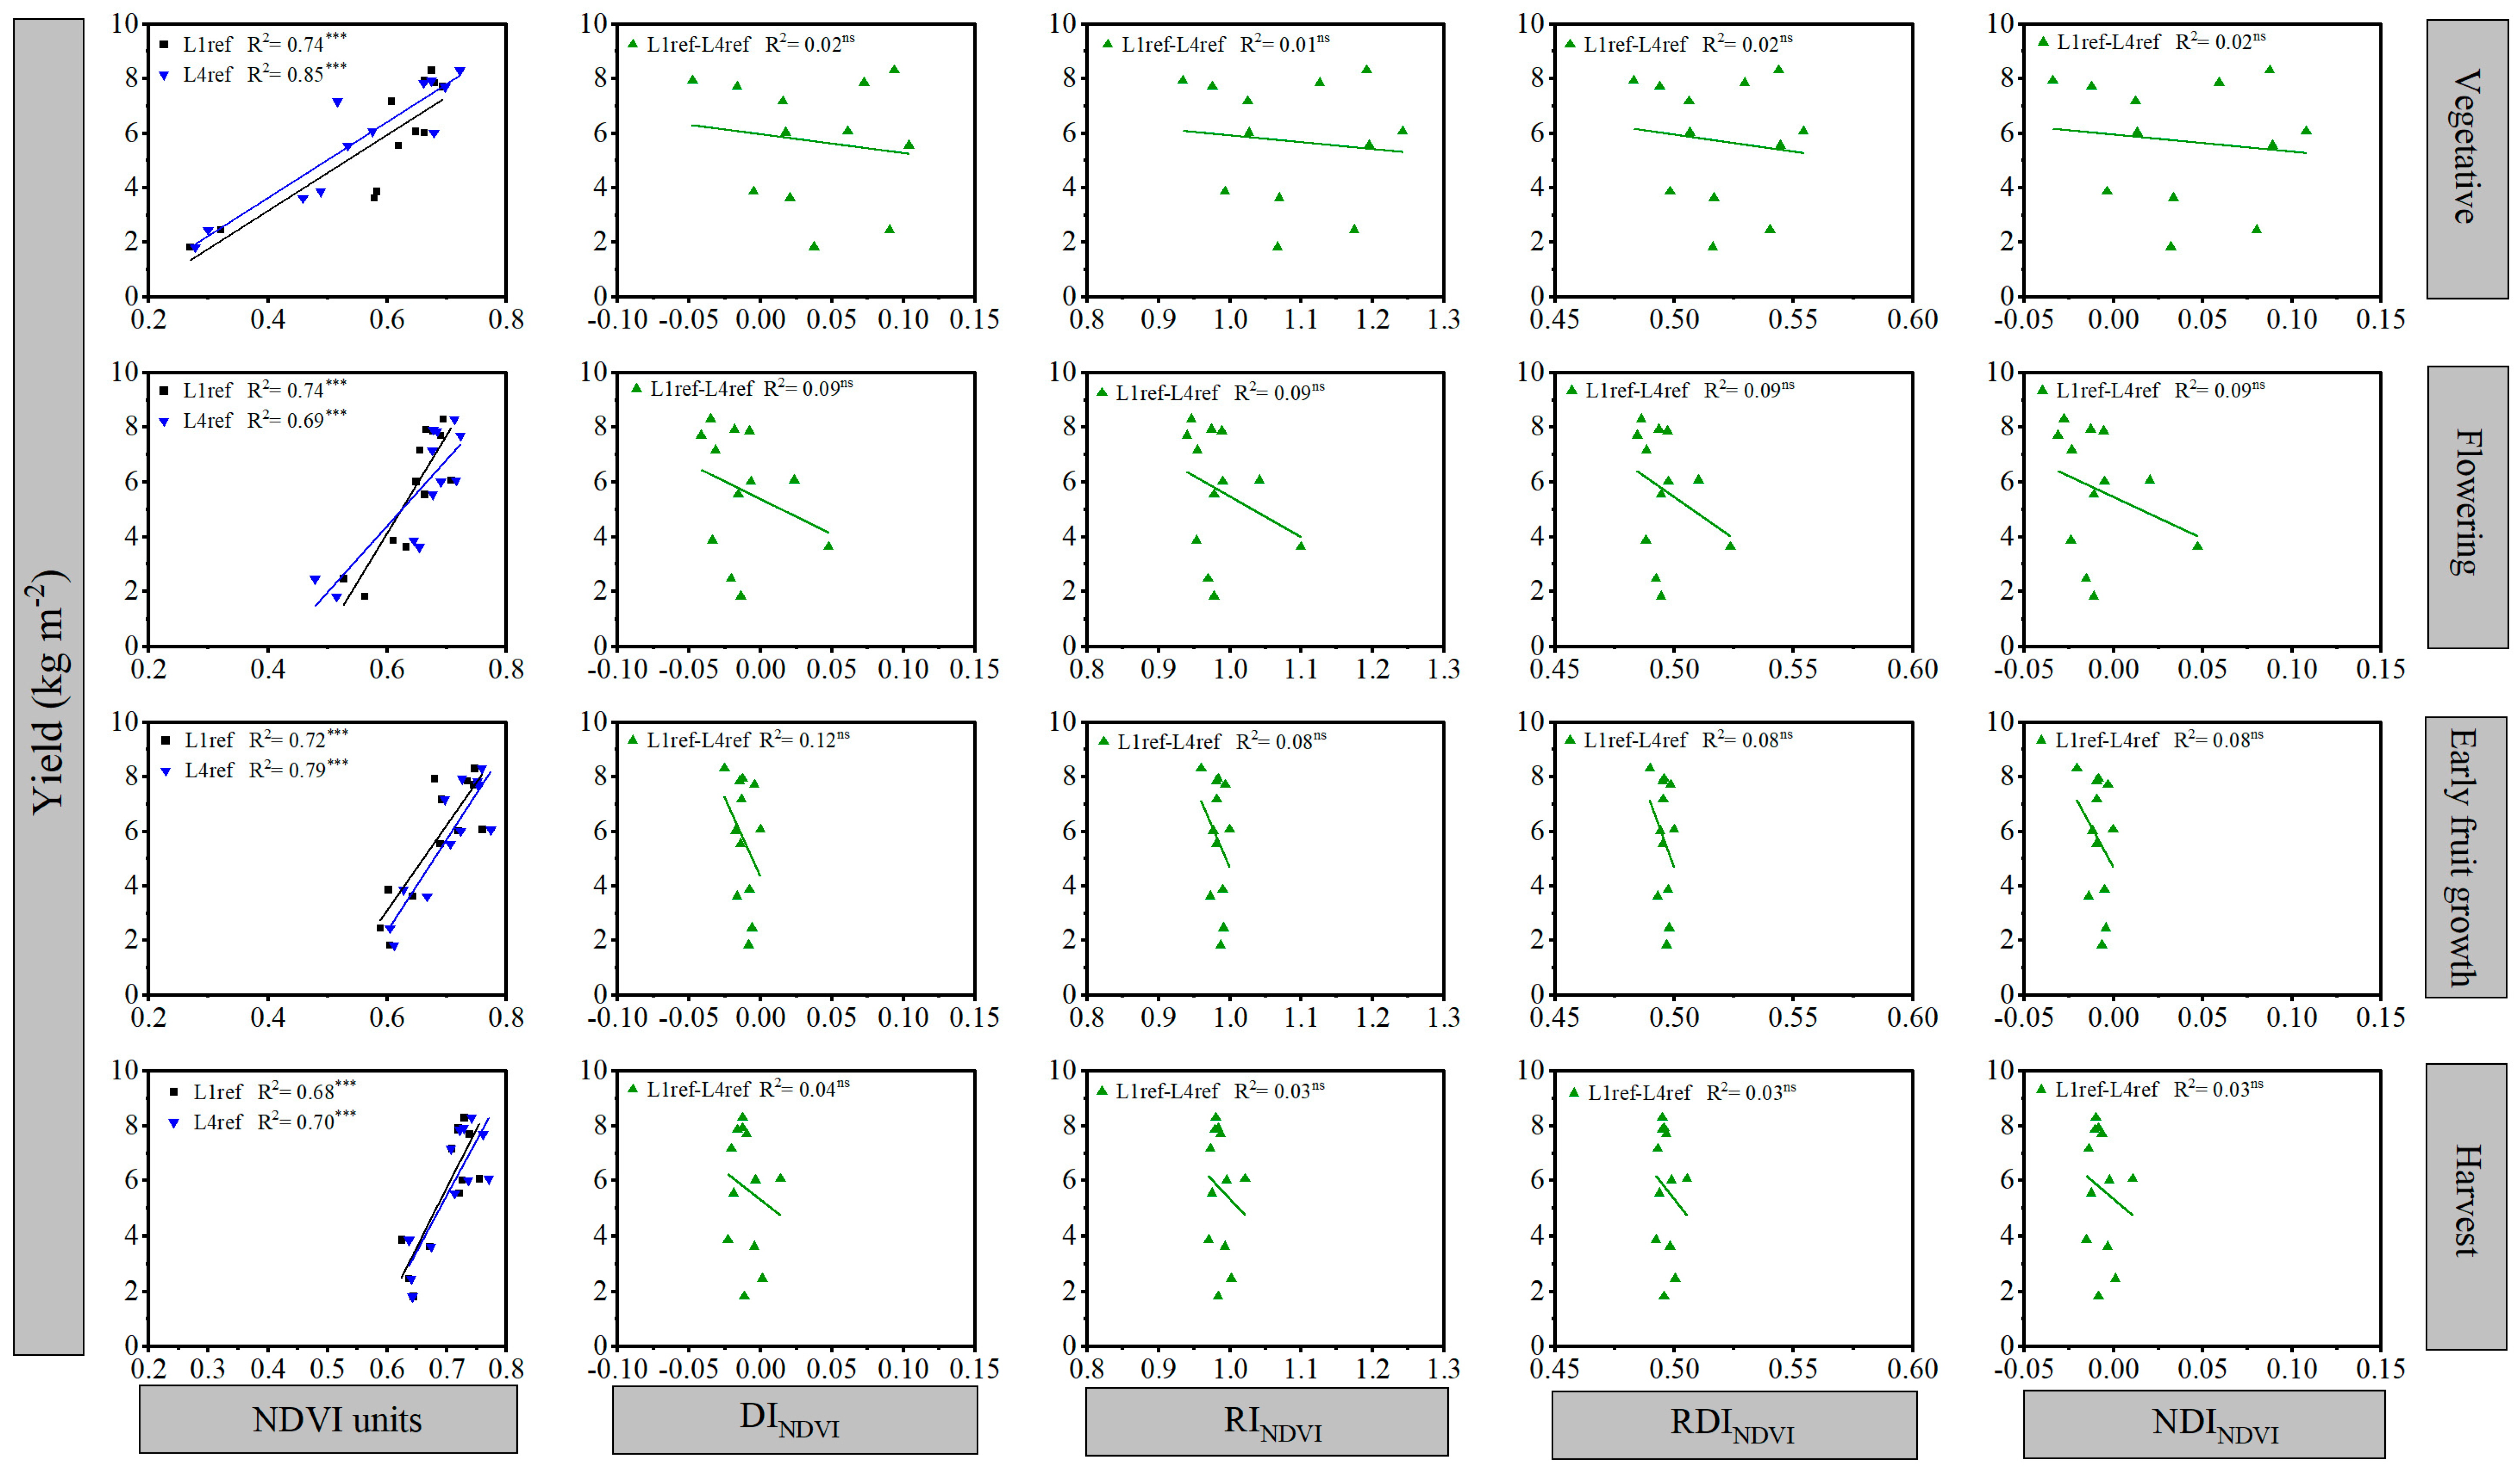
Figure 7.
The relationships between absolute NDVI measurements and several normalized NDVI indices (DI, RI, RDI, NDI) with total fruit yield (kg m−2) at different phenological stages of muskmelon, for calibration data. L1, L2, L3 and L4, refer to the latest (most recent) second, third and fourth fully expanded leaf, respectively. Asterisks show significance of regressions: ***, p < 0.001; ns, p > 0.05.
Table 1.
Mineral N (NO3−–N + NH4+–N) in the soil (0–0.4 m depth) at the beginning of each crop and year, N concentration in the applied nutrient solution, and amount of mineral N applied in fertilization.
Table 1.
Mineral N (NO3−–N + NH4+–N) in the soil (0–0.4 m depth) at the beginning of each crop and year, N concentration in the applied nutrient solution, and amount of mineral N applied in fertilization.
| Crop | Greenhouse Number | Year of Transplant | N Treatment | Mineral N at Planting (kg N ha−1) | N Concentration in Nutrient Solution (mmol L−1) | N Amount Applied
(kg N ha−1) |
|---|
| Sweet pepper | U13 | 2020 | Very deficient (N1) | 31 | 2.2 | 66 |
| Deficient (N2) | 18 | 8.4 | 428 |
| Conventional (N3) | 42 | 14.2 | 704 |
| U14 | 2021 | Very deficient (N1) | 340 | 1.9 | 70 |
| Deficient (N2) | 346 | 8.2 | 337 |
| Conventional (N3) | 290 | 14.2 | 615 |
| Muskmelon | U13 | 2020 | Very deficient (N1) | 63 | 2.7 | 61 |
| Deficient (N2) | 50 | 8.3 | 302 |
| Conventional (N3) | 38 | 14.0 | 582 |
| U13 | 2021 | Very deficient (N1) | 13 | 2.7 | 57 |
| Deficient (N2) | 77 | 8.0 | 228 |
| Conventional (N3) | 79 | 14.6 | 515 |
Table 2.
Measurement dates of proximal optical sensors based on the day after transplanting (DAT).
Table 2.
Measurement dates of proximal optical sensors based on the day after transplanting (DAT).
| Crop | Year of Transplant | Phenological Stage (DAT) |
|---|
| Vegetative | Flowering | Early Fruit Growth | Harvest |
|---|
| Sweet pepper | 2020 | 42 | 70 | 99 | 127 |
| 2021 | 41 | 69 | 98 | 125 |
| Muskmelon | 2020 | 35 | 49 | 63 | 78 |
| 2021 | 32 | 46 | 60 | 74 |
Table 3.
Equations of normalized indices calculated for different proximal optical sensors. L1 is the latest fully expanded leaf. Lj is the leaf position and varies from 2 to 4.
Table 3.
Equations of normalized indices calculated for different proximal optical sensors. L1 is the latest fully expanded leaf. Lj is the leaf position and varies from 2 to 4.
| Normalized Index | Equation |
|---|
| Difference Index | |
| Relative Index | |
| Relative Difference Index | |
| Normalized Difference Index | |
Table 4.
Statistical parameters used to evaluate yield models from optical sensor measurements. R2 and RMSE were used for calibration analyses. R2, RMSE, RE, MBE, and d, were used for validation analyses. Xi, Yi, , and represent sensor measurements, yield values, mean sensor measurements, and mean yield values, respectively, in the calibration stage. In the validation stage, Xi, Yi, , and represent observed yield, estimated yield, mean observed yield, and mean estimated yield. n is the number of observations.
| Parameter | Calculation |
|---|
| Coefficient of Determination | |
| Root Mean Square Error | |
| Relative Error | |
| Mean Bias Error | |
| Willmott Index | |
Table 5.
Results of the validation analysis of the estimated fruit yield (kg m−2) from SPAD measurements and several normalized SPAD indices (DI, RI, RDI, NDI), at different phenological stages of sweet pepper. DI, Difference Index; RI, Relative Index; RDI, Relative Difference Index; NDI, Normalized Difference Index, R2, coefficient of determination; RMSE, root mean square error; RE, relative error; MBE, mean bias error; d, Willmott Index. L1, L2, L3 and L4, refer to the latest (most recent), second, third and fourth fully expanded leaf, respectively.
| Index | Vegetative | Flowering | Early Fruit Growth | Harvest |
|---|
| R2 | p Value | RMSE | MBE | RE | d | R2 | p Value | RMSE | MBE | RE | d | R2 | p Value | RMSE | MBE | RE | d | R2 | p Value | RMSE | MBE | RE | d |
|---|
| SPADL1 | 0.69 | 0.042 | 0.83 | −0.14 | 0.15 | 0.85 | 0.78 | 0.020 | 0.72 | −0.08 | 0.13 | 0.89 | 0.85 | 0.009 | 0.57 | 0.00 | 0.10 | 0.94 | 0.86 | 0.008 | 0.63 | 0.04 | 0.12 | 0.92 |
| SPADL2 | 0.62 | 0.044 | 0.91 | −0.31 | 0.16 | 0.84 | 0.83 | 0.011 | 0.66 | −0.09 | 0.12 | 0.91 | 0.92 | 0.003 | 0.47 | 0.02 | 0.09 | 0.96 | 0.89 | 0.004 | 0.58 | 0.00 | 0.10 | 0.94 |
| SPADL3 | 0.67 | 0.045 | 0.85 | −0.35 | 0.15 | 0.87 | 0.82 | 0.013 | 0.61 | 0.04 | 0.11 | 0.93 | 0.91 | 0.003 | 0.48 | −0.08 | 0.09 | 0.96 | 0.96 | <0.001 | 0.43 | 0.03 | 0.08 | 0.97 |
| SPADL4 | 0.71 | 0.035 | 0.77 | −0.23 | 0.13 | 0.90 | 0.90 | 0.004 | 0.47 | −0.14 | 0.08 | 0.96 | 0.85 | 0.009 | 0.58 | −0.19 | 0.10 | 0.94 | 0.89 | 0.005 | 0.57 | −0.01 | 0.10 | 0.94 |
| DIL1–L2 | 0.31 | 0.248 | 1.38 | −0.79 | 0.22 | 0.60 | 0.11 | 0.529 | 1.36 | −0.15 | 0.24 | 0.04 | 0.03 | 0.750 | 1.51 | −0.02 | 0.27 | 0.32 | 0.33 | 0.237 | 1.22 | −0.40 | 0.21 | 0.71 |
| DIL1–L3 | 0.42 | 0.162 | 1.69 | −0.99 | 0.26 | 0.69 | 0.03 | 0.760 | 1.46 | −0.32 | 0.25 | 0.03 | 0.05 | 0.677 | 2.06 | −1.22 | 0.31 | 0.19 | 0.09 | 0.564 | 1.38 | −0.24 | 0.24 | 0.44 |
| DIL1–L4 | 0.39 | 0.184 | 1.19 | −0.34 | 0.20 | 0.75 | 0.22 | 0.353 | 1.55 | −0.06 | 0.28 | 0.04 | 0.01 | 0.860 | 1.40 | 0.19 | 0.26 | 0.24 | 0.01 | 0.885 | 1.53 | −0.27 | 0.26 | 0.06 |
| RIL1–L2 | 0.30 | 0.263 | 1.36 | −0.74 | 0.22 | 0.55 | 0.12 | 0.496 | 1.35 | −0.16 | 0.24 | 0.08 | 0.22 | 0.351 | 1.45 | 0.05 | 0.27 | 0.65 | 0.61 | 0.066 | 0.91 | −0.31 | 0.16 | 0.87 |
| RIL1–L3 | 0.43 | 0.160 | 1.44 | −0.87 | 0.23 | 0.71 | 0.12 | 0.503 | 1.48 | −0.33 | 0.25 | 0.00 | 0.21 | 0.367 | 1.82 | −0.62 | 0.30 | 0.64 | 0.37 | 0.198 | 1.21 | −0.18 | 0.21 | 0.76 |
| RIL1–L4 | 0.37 | 0.199 | 1.14 | −0.27 | 0.20 | 0.73 | 0.32 | 0.242 | 1.57 | −0.09 | 0.28 | 0.03 | 0.03 | 0.757 | 1.37 | −0.16 | 0.24 | 0.02 | 0.05 | 0.657 | 1.85 | −0.45 | 0.31 | 0.45 |
| RDIL1–L2 | 0.29 | 0.266 | 1.37 | −0.74 | 0.22 | 0.55 | 0.12 | 0.494 | 1.35 | −0.15 | 0.24 | 0.08 | 0.21 | 0.358 | 1.46 | 0.04 | 0.27 | 0.65 | 0.60 | 0.070 | 0.93 | −0.32 | 0.16 | 0.86 |
| RDIL1–L3 | 0.42 | 0.167 | 1.48 | −0.89 | 0.23 | 0.70 | 0.12 | 0.501 | 1.48 | −0.34 | 0.25 | 0.00 | 0.19 | 0.382 | 1.87 | −0.65 | 0.30 | 0.63 | 0.35 | 0.212 | 1.24 | −0.19 | 0.22 | 0.75 |
| RDIL1–L4 | 0.37 | 0.203 | 1.15 | −0.29 | 0.20 | 0.73 | 0.32 | 0.241 | 1.57 | −0.09 | 0.28 | 0.03 | 0.03 | 0.762 | 1.37 | −0.16 | 0.24 | 0.03 | 0.06 | 0.652 | 1.86 | −0.48 | 0.31 | 0.46 |
| NDIL1–L2 | 0.29 | 0.266 | 1.37 | −0.74 | 0.22 | 0.55 | 0.12 | 0.494 | 1.35 | −0.15 | 0.24 | 0.08 | 0.21 | 0.358 | 1.46 | 0.04 | 0.27 | 0.65 | 0.60 | 0.070 | 0.93 | −0.32 | 0.16 | 0.86 |
| NDIL1–L3 | 0.42 | 0.167 | 1.48 | −0.89 | 0.23 | 0.70 | 0.12 | 0.501 | 1.48 | −0.34 | 0.25 | 0.00 | 0.19 | 0.382 | 1.87 | −0.65 | 0.30 | 0.63 | 0.35 | 0.212 | 1.24 | −0.20 | 0.22 | 0.75 |
| NDIL1–L4 | 0.37 | 0.203 | 1.15 | −0.29 | 0.20 | 0.73 | 0.32 | 0.241 | 1.57 | −0.09 | 0.28 | 0.03 | 0.03 | 0.762 | 1.37 | −0.16 | 0.24 | 0.03 | 0.06 | 0.652 | 1.86 | −0.48 | 0.31 | 0.46 |
Table 6.
Results of the validation analysis of the estimated fruit yield (kg m−2) from SPAD measurements and several normalized SPAD indices (DI, RI, RDI, NDI), at different phenological stages of muskmelon. DI, Difference Index; RI, Relative Index; RDI, Relative Difference Index; NDI, Normalized Difference Index, R2, coefficient of determination; RMSE, root mean square error; RE, relative error; MBE, mean bias error; d, Willmott Index. L1, L2, L3 and L4, refer to the latest (most recent), second, third and fourth fully expanded leaf, respectively.
| Index | Vegetative | Flowering | Early Fruit Growth | Harvest |
|---|
| R2 | p Value | RMSE | MBE | RE | d | R2 | p Value | RMSE | MBE | RE | d | R2 | p Value | RMSE | MBE | RE | d | R2 | p Value | RMSE | MBE | RE | d |
|---|
| SPADL1 | 0.30 | 0.256 | 1.58 | 0.02 | 0.28 | 0.61 | 0.16 | 0.437 | 1.78 | 0.18 | 0.32 | 0.57 | 0.16 | 0.427 | 1.91 | −0.12 | 0.32 | 0.61 | 0.15 | 0.442 | 1.86 | 0.13 | 0.33 | 0.59 |
| SPADL2 | 0.33 | 0.237 | 1.54 | −0.11 | 0.26 | 0.69 | 0.27 | 0.291 | 1.64 | 0.19 | 0.30 | 0.68 | 0.13 | 0.476 | 1.93 | −0.01 | 0.34 | 0.57 | 0.18 | 0.395 | 1.83 | 0.06 | 0.32 | 0.63 |
| SPADL3 | 0.42 | 0.164 | 1.43 | 0.12 | 0.25 | 0.75 | 0.23 | 0.336 | 1.75 | 0.04 | 0.31 | 0.67 | 0.12 | 0.496 | 1.88 | −0.08 | 0.32 | 0.54 | 0.23 | 0.336 | 1.69 | 0.24 | 0.31 | 0.65 |
| SPADL4 | 0.41 | 0.168 | 1.43 | 0.08 | 0.25 | 0.77 | 0.20 | 0.379 | 1.86 | 0.05 | 0.33 | 0.64 | 0.27 | 0.294 | 1.68 | 0.15 | 0.30 | 0.69 | 0.22 | 0.347 | 1.69 | 0.10 | 0.30 | 0.64 |
| DIL1–L2 | 0.45 | 0.145 | 1.67 | −0.76 | 0.26 | 0.56 | 0.49 | 0.121 | 1.68 | 0.07 | 0.30 | 0.37 | 0.14 | 0.472 | 1.82 | −0.06 | 0.31 | 0.15 | 0.01 | 0.867 | 2.01 | 0.21 | 0.36 | 0.30 |
| DIL1–L3 | 0.55 | 0.090 | 1.51 | 0.76 | 0.30 | 0.83 | 0.43 | 0.158 | 1.89 | 0.06 | 0.33 | 0.00 | 0.06 | 0.648 | 1.98 | 0.03 | 0.35 | 0.51 | 0.02 | 0.788 | 2.07 | −0.15 | 0.35 | 0.29 |
| DIL1–L4 | 0.49 | 0.120 | 1.40 | 0.30 | 0.26 | 0.81 | 0.26 | 0.296 | 1.85 | 0.04 | 0.32 | 0.03 | 0.15 | 0.441 | 3.15 | −1.06 | 0.46 | 0.02 | 0.01 | 0.880 | 2.15 | 0.15 | 0.38 | 0.29 |
| RIL1–L2 | 0.39 | 0.184 | 1.79 | −0.67 | 0.28 | 0.35 | 0.51 | 0.109 | 1.79 | 0.06 | 0.31 | 0.17 | 0.21 | 0.366 | 1.79 | −0.10 | 0.31 | 0.19 | 0.01 | 0.853 | 2.00 | 0.22 | 0.36 | 0.31 |
| RIL1–L3 | 0.56 | 0.089 | 1.55 | 0.86 | 0.32 | 0.82 | 0.49 | 0.123 | 2.14 | 0.18 | 0.38 | 0.04 | 0.09 | 0.561 | 2.01 | −0.05 | 0.35 | 0.58 | 0.02 | 0.813 | 2.07 | −0.12 | 0.35 | 0.25 |
| RIL1–L4 | 0.44 | 0.152 | 1.46 | 0.34 | 0.27 | 0.77 | 0.35 | 0.219 | 2.11 | 0.13 | 0.38 | 0.03 | 0.15 | 0.454 | 3.23 | −1.20 | 0.46 | 0.03 | 0.01 | 0.870 | 2.21 | 0.21 | 0.40 | 0.28 |
| RDIL1–L2 | 0.39 | 0.184 | 1.79 | −0.68 | 0.28 | 0.36 | 0.51 | 0.113 | 1.79 | 0.06 | 0.31 | 0.17 | 0.21 | 0.367 | 1.79 | −0.12 | 0.31 | 0.20 | 0.01 | 0.857 | 2.00 | 0.22 | 0.36 | 0.31 |
| RDIL1–L3 | 0.55 | 0.091 | 1.56 | 0.86 | 0.32 | 0.82 | 0.48 | 0.125 | 2.14 | 0.18 | 0.38 | 0.04 | 0.09 | 0.555 | 2.01 | −0.05 | 0.35 | 0.58 | 0.02 | 0.813 | 2.05 | −0.12 | 0.35 | 0.24 |
| RDIL1–L4 | 0.44 | 0.149 | 1.46 | 0.36 | 0.27 | 0.78 | 0.34 | 0.226 | 2.13 | 0.13 | 0.38 | 0.03 | 0.15 | 0.447 | 3.20 | −1.19 | 0.46 | 0.03 | 0.01 | 0.873 | 2.20 | 0.21 | 0.40 | 0.28 |
| NDIL1–L2 | 0.39 | 0.184 | 1.79 | −0.67 | 0.28 | 0.36 | 0.51 | 0.113 | 1.79 | 0.06 | 0.31 | 0.17 | 0.21 | 0.367 | 1.79 | −0.12 | 0.31 | 0.20 | 0.01 | 0.857 | 2.00 | 0.22 | 0.36 | 0.31 |
| NDIL1–L3 | 0.55 | 0.091 | 1.56 | 0.87 | 0.32 | 0.82 | 0.48 | 0.125 | 2.14 | 0.18 | 0.38 | 0.04 | 0.09 | 0.555 | 2.01 | −0.05 | 0.35 | 0.58 | 0.02 | 0.813 | 2.05 | −0.12 | 0.35 | 0.24 |
| NDIL1–L4 | 0.44 | 0.149 | 1.46 | 0.36 | 0.27 | 0.78 | 0.34 | 0.226 | 2.13 | 0.14 | 0.38 | 0.03 | 0.15 | 0.447 | 3.20 | −1.19 | 0.46 | 0.03 | 0.01 | 0.873 | 2.20 | 0.21 | 0.40 | 0.28 |
Table 7.
Results of the validation analysis of the estimated fruit yield (kg m−2) from NBI measurements and several normalized NBI indices (DI, RI, RDI, NDI), at different phenological stages of sweet pepper. DI, Difference Index; RI, Relative Index; RDI, Relative Difference Index; NDI, Normalized Difference Index, R2, coefficient of determination; RMSE, root mean square error; RE, relative error; MBE, mean bias error; d, Willmott Index. L1, L2, L3 and L4, refer to the latest (most recent), second, third and fourth fully expanded leaf, respectively.
| Index | Vegetative | Flowering | Early Fruit Growth | Harvest |
|---|
| R2 | p Value | RMSE | MBE | RE | d | R2 | p Value | RMSE | MBE | RE | d | R2 | p Value | RMSE | MBE | RE | d | R2 | p Value | RMSE | MBE | RE | d |
|---|
| NBIL1 | 0.87 | 0.007 | 0.57 | −0.18 | 0.10 | 0.94 | 0.97 | <0.001 | 0.40 | −0.06 | 0.07 | 0.97 | 0.71 | 0.035 | 0.73 | 0.01 | 0.13 | 0.91 | 0.62 | 0.061 | 0.88 | −0.05 | 0.16 | 0.82 |
| NBIL2 | 0.87 | 0.007 | 0.54 | −0.11 | 0.10 | 0.95 | 0.94 | 0.001 | 0.47 | −0.12 | 0.08 | 0.96 | 0.76 | 0.024 | 0.67 | 0.02 | 0.12 | 0.92 | 0.60 | 0.070 | 0.88 | −0.13 | 0.16 | 0.84 |
| NBIL3 | 0.88 | 0.006 | 0.59 | −0.14 | 0.10 | 0.93 | 0.92 | 0.002 | 0.44 | −0.11 | 0.08 | 0.97 | 0.82 | 0.012 | 0.60 | 0.00 | 0.11 | 0.94 | 0.66 | 0.048 | 0.84 | −0.03 | 0.15 | 0.84 |
| NBIL4 | 0.87 | 0.007 | 0.62 | −0.28 | 0.11 | 0.93 | 0.98 | <0.001 | 0.33 | −0.20 | 0.06 | 0.98 | 0.86 | 0.008 | 0.55 | 0.06 | 0.10 | 0.95 | 0.65 | 0.051 | 0.84 | −0.13 | 0.15 | 0.85 |
| DIL1–L2 | 0.03 | 0.725 | 1.38 | −0.13 | 0.24 | 0.02 | 0.33 | 0.231 | 1.30 | −0.18 | 0.23 | 0.21 | 0.84 | 0.010 | 0.99 | −0.09 | 0.18 | 0.69 | 0.32 | 0.245 | 1.41 | −0.62 | 0.23 | 0.68 |
| DIL1–L3 | 0.00 | 0.942 | 1.42 | −0.10 | 0.25 | 0.23 | 0.35 | 0.219 | 3.92 | 3.53 | 1.98 | 0.11 | 0.75 | 0.025 | 0.88 | −0.10 | 0.16 | 0.80 | 0.47 | 0.132 | 1.04 | −0.03 | 0.19 | 0.69 |
| DIL1–L4 | 0.02 | 0.765 | 1.40 | −0.25 | 0.24 | 0.26 | 0.91 | 0.003 | 1.24 | −0.21 | 0.22 | 0.33 | 0.76 | 0.024 | 0.75 | 0.08 | 0.14 | 0.88 | 0.50 | 0.116 | 1.04 | −0.40 | 0.18 | 0.79 |
| RIL1–L2 | 0.45 | 0.144 | 1.08 | −0.29 | 0.19 | 0.69 | 0.83 | 0.012 | 0.74 | 0.05 | 0.13 | 0.88 | 0.55 | 0.094 | 0.96 | −0.06 | 0.17 | 0.76 | 0.47 | 0.130 | 1.04 | 0.33 | 0.20 | 0.79 |
| RIL1–L3 | 0.22 | 0.353 | 1.29 | −0.15 | 0.23 | 0.29 | 0.78 | 0.020 | 0.67 | −0.01 | 0.12 | 0.91 | 0.63 | 0.060 | 0.85 | 0.11 | 0.16 | 0.88 | 0.40 | 0.175 | 1.09 | −0.07 | 0.20 | 0.77 |
| RIL1–L4 | 0.13 | 0.491 | 1.32 | −0.11 | 0.24 | 0.19 | 0.96 | <0.001 | 0.53 | 0.12 | 0.10 | 0.94 | 0.59 | 0.075 | 0.88 | 0.00 | 0.16 | 0.86 | 0.58 | 0.077 | 0.90 | 0.20 | 0.17 | 0.85 |
| RDIL1–L2 | 0.48 | 0.127 | 1.06 | −0.29 | 0.18 | 0.70 | 0.85 | 0.009 | 0.73 | 0.02 | 0.13 | 0.88 | 0.55 | 0.090 | 0.97 | −0.09 | 0.17 | 0.75 | 0.50 | 0.117 | 1.05 | 0.40 | 0.21 | 0.81 |
| RDIL1–L3 | 0.25 | 0.315 | 1.28 | −0.14 | 0.23 | 0.30 | 0.81 | 0.014 | 0.65 | −0.03 | 0.12 | 0.92 | 0.65 | 0.052 | 0.84 | 0.14 | 0.16 | 0.89 | 0.39 | 0.187 | 1.12 | −0.03 | 0.20 | 0.77 |
| RDIL1–L4 | 0.14 | 0.457 | 1.32 | −0.11 | 0.24 | 0.18 | 0.97 | <0.001 | 0.50 | 0.08 | 0.09 | 0.95 | 0.61 | 0.067 | 0.86 | 0.03 | 0.16 | 0.87 | 0.59 | 0.108 | 0.91 | 0.23 | 0.17 | 0.86 |
| NDIL1–L2 | 0.48 | 0.127 | 1.07 | −0.29 | 0.18 | 0.70 | 0.85 | 0.009 | 0.73 | 0.02 | 0.13 | 0.88 | 0.55 | 0.090 | 0.97 | −0.09 | 0.17 | 0.75 | 0.50 | 0.117 | 1.05 | 0.40 | 0.21 | 0.81 |
| NDIL1–L3 | 0.25 | 0.315 | 1.28 | −0.14 | 0.23 | 0.30 | 0.81 | 0.014 | 0.65 | −0.03 | 0.12 | 0.92 | 0.65 | 0.052 | 0.84 | 0.14 | 0.16 | 0.89 | 0.39 | 0.187 | 1.12 | −0.03 | 0.20 | 0.77 |
| NDIL1–L4 | 0.14 | 0.457 | 1.32 | −0.11 | 0.24 | 0.18 | 0.97 | <0.001 | 0.50 | 0.08 | 0.09 | 0.95 | 0.61 | 0.067 | 0.86 | 0.03 | 0.16 | 0.87 | 0.59 | 0.108 | 0.91 | 0.23 | 0.17 | 0.86 |
Table 8.
Results of the validation analysis of the estimated fruit yield (kg m−2) from NBI measurements and several normalized NBI indices (DI, RI, RDI, NDI), at different phenological stages of muskmelon. DI, Difference Index; RI, Relative Index; RDI, Relative Difference Index; NDI, Normalized Difference Index, R2, coefficient of determination; RMSE, root mean square error; RE, relative error; MBE, mean bias error; d, Willmott Index. L1, L2, L3 and L4, refer to the latest (most recent), second, third and fourth fully expanded leaf, respectively.
| Index | Vegetative | Flowering | Early Fruit Growth | Harvest |
|---|
| R2 | p Value | RMSE | MBE | RE | d | R2 | p Value | RMSE | MBE | RE | d | R2 | p Value | RMSE | MBE | RE | d | R2 | p Value | RMSE | MBE | RE | d |
|---|
| NBIL1 | 0.22 | 0.352 | 1.85 | −0.07 | 0.32 | 0.67 | 0.21 | 0.355 | 2.09 | −0.16 | 0.35 | 0.67 | 0.27 | 0.287 | 1.88 | −0.12 | 0.32 | 0.71 | 0.24 | 0.319 | 1.82 | 0.07 | 0.32 | 0.70 |
| NBIL2 | 0.27 | 0.287 | 1.79 | −0.10 | 0.31 | 0.71 | 0.24 | 0.321 | 1.98 | −0.10 | 0.34 | 0.70 | 0.24 | 0.321 | 1.96 | −0.07 | 0.34 | 0.69 | 0.24 | 0.319 | 1.82 | 0.04 | 0.32 | 0.70 |
| NBIL3 | 0.39 | 0.182 | 1.66 | −0.14 | 0.28 | 0.78 | 0.26 | 0.300 | 1.96 | −0.11 | 0.33 | 0.71 | 0.22 | 0.347 | 2.03 | −0.02 | 0.35 | 0.67 | 0.22 | 0.343 | 1.88 | −0.03 | 0.32 | 0.68 |
| NBIL4 | 0.46 | 0.136 | 1.52 | −0.16 | 0.26 | 0.82 | 0.30 | 0.262 | 1.84 | −0.03 | 0.32 | 0.73 | 0.24 | 0.325 | 1.99 | −0.11 | 0.34 | 0.68 | 0.20 | 0.368 | 1.99 | −0.13 | 0.34 | 0.65 |
| DIL1–L2 | 0.17 | 0.421 | 1.80 | −0.04 | 0.31 | 0.62 | 0.06 | 0.654 | 2.25 | 0.34 | 0.42 | 0.49 | 0.03 | 0.758 | 2.34 | 0.26 | 0.43 | 0.47 | 0.02 | 0.779 | 1.94 | 0.16 | 0.35 | 0.41 |
| DIL1–L3 | 0.57 | 0.083 | 1.24 | −0.09 | 0.21 | 0.83 | 0.22 | 0.346 | 1.69 | 0.12 | 0.30 | 0.63 | 0.02 | 0.803 | 2.31 | 0.40 | 0.43 | 0.41 | 0.22 | 0.345 | 1.82 | 0.22 | 0.33 | 0.16 |
| DIL1–L4 | 0.64 | 0.054 | 1.13 | −0.13 | 0.19 | 0.87 | 0.19 | 0.844 | 1.81 | 0.32 | 0.33 | 0.61 | 0.10 | 0.545 | 2.03 | −0.03 | 0.35 | 0.54 | 0.01 | 0.824 | 1.95 | 0.24 | 0.35 | 0.07 |
| RIL1–L2 | 0.01 | 0.826 | 1.91 | −0.02 | 0.33 | 0.28 | 0.01 | 0.835 | 1.87 | −0.01 | 0.32 | 0.26 | 0.03 | 0.750 | 2.32 | 0.58 | 0.45 | 0.51 | 0.06 | 0.637 | 1.88 | 0.17 | 0.34 | 0.49 |
| RIL1–L3 | 0.17 | 0.410 | 1.72 | −0.01 | 0.30 | 0.43 | 0.01 | 0.828 | 1.86 | 0.05 | 0.33 | 0.04 | 0.01 | 0.999 | 2.37 | 0.72 | 0.47 | 0.34 | 0.45 | 0.144 | 1.77 | 0.24 | 0.32 | 0.25 |
| RIL1–L4 | 0.23 | 0.340 | 1.65 | −0.13 | 0.28 | 0.60 | 0.01 | 0.901 | 1.87 | 0.09 | 0.33 | 0.16 | 0.15 | 0.452 | 1.84 | 0.14 | 0.33 | 0.60 | 0.01 | 0.894 | 1.94 | 0.32 | 0.36 | 0.26 |
| RDIL1–L2 | 0.02 | 0.798 | 1.89 | −0.02 | 0.33 | 0.29 | 0.01 | 0.842 | 1.87 | −0.01 | 0.32 | 0.26 | 0.03 | 0.744 | 2.29 | 0.56 | 0.44 | 0.51 | 0.06 | 0.642 | 1.87 | 0.17 | 0.34 | 0.49 |
| RDIL1–L3 | 0.18 | 0.396 | 1.71 | 0.00 | 0.30 | 0.43 | 0.02 | 0.812 | 1.86 | 0.05 | 0.33 | 0.03 | 0.01 | 0.983 | 2.33 | 0.69 | 0.46 | 0.34 | 0.46 | 0.138 | 1.76 | 0.23 | 0.32 | 0.25 |
| RDIL1–L4 | 0.23 | 0.332 | 1.64 | −0.10 | 0.28 | 0.60 | 0.01 | 0.881 | 1.87 | 0.08 | 0.33 | 0.15 | 0.14 | 0.463 | 1.85 | 0.14 | 0.33 | 0.59 | 0.01 | 0.889 | 1.93 | 0.32 | 0.36 | 0.26 |
| NDIL1–L2 | 0.02 | 0.798 | 1.89 | −0.02 | 0.33 | 0.29 | 0.01 | 0.842 | 1.87 | −0.01 | 0.32 | 0.26 | 0.03 | 0.744 | 2.29 | 0.55 | 0.44 | 0.51 | 0.06 | 0.642 | 1.87 | 0.17 | 0.34 | 0.49 |
| NDIL1–L3 | 0.18 | 0.396 | 1.71 | 0.00 | 0.30 | 0.43 | 0.02 | 0.812 | 1.86 | 0.05 | 0.33 | 0.03 | 0.01 | 0.983 | 2.33 | 0.69 | 0.46 | 0.34 | 0.46 | 0.138 | 1.76 | 0.23 | 0.32 | 0.25 |
| NDIL1–L4 | 0.23 | 0.332 | 1.64 | −0.10 | 0.28 | 0.60 | 0.01 | 0.881 | 1.87 | 0.08 | 0.33 | 0.15 | 0.14 | 0.463 | 1.85 | 0.14 | 0.33 | 0.59 | 0.01 | 0.889 | 1.93 | 0.32 | 0.36 | 0.26 |
Table 9.
Results of the validation analysis of the estimated fruit yield (kg m−2) from NDVI measurements and several normalized NDVI indices (DI, RI, RDI, NDI), at different phenological stages of sweet pepper. DI, Difference Index; RI, Relative Index; RDI, Relative Difference Index; NDI, Normalized Difference Index, R2, coefficient of determination; RMSE, root mean square error; RE, relative error; MBE, mean bias error; d, Willmott Index. L1ref and L4ref, refer to the latest (most recent) and fourth fully expanded leaf, respectively.
| Index | Vegetative | Flowering | Early Fruit Growth | Harvest |
|---|
| R2 | p Value | RMSE | MBE | RE | d | R2 | p Value | RMSE | MBE | RE | d | R2 | p Value | RMSE | MBE | RE | d | R2 | p Value | RMSE | MBE | RE | d |
|---|
| NDVI L1ref | 0.40 | 0.175 | 1.10 | −0.23 | 0.19 | 0.65 | 0.87 | 0.007 | 0.57 | −0.10 | 0.10 | 0.94 | 0.60 | 0.072 | 0.87 | −0.09 | 0.16 | 0.84 | 0.84 | 0.010 | 0.58 | −0.13 | 0.10 | 0.94 |
| NDVI L4ref | 0.93 | 0.002 | 0.74 | −0.30 | 0.13 | 0.88 | 0.87 | 0.006 | 0.57 | −0.08 | 0.10 | 0.94 | 0.70 | 0.038 | 0.77 | −0.07 | 0.14 | 0.88 | 0.83 | 0.012 | 0.57 | −0.03 | 0.10 | 0.95 |
| DIL1ref–L4ref | 0.92 | 0.003 | 0.73 | −0.31 | 0.13 | 0.88 | 0.13 | 0.483 | 1.34 | −0.15 | 0.24 | 0.13 | 0.28 | 0.278 | 1.52 | −0.13 | 0.27 | 0.00 | 0.14 | 0.464 | 1.39 | −0.17 | 0.25 | 0.00 |
| RIL1ref–L4ref | 0.94 | 0.002 | 0.74 | −0.34 | 0.13 | 0.88 | 0.19 | 0.395 | 1.28 | −0.16 | 0.23 | 0.32 | 0.30 | 0.257 | 1.50 | −0.14 | 0.26 | 0.00 | 0.18 | 0.404 | 1.40 | −0.18 | 0.25 | 0.00 |
| RDIL1ref–L4ref | 0.94 | 0.002 | 0.73 | −0.33 | 0.13 | 0.88 | 0.19 | 0.393 | 1.28 | −0.15 | 0.23 | 0.32 | 0.30 | 0.260 | 1.50 | −0.14 | 0.27 | 0.00 | 0.18 | 0.401 | 1.40 | −0.18 | 0.25 | 0.00 |
| NDIL1ref–L4ref | 0.94 | 0.002 | 0.73 | −0.33 | 0.13 | 0.88 | 0.19 | 0.393 | 1.28 | −0.15 | 0.23 | 0.32 | 0.30 | 0.260 | 1.50 | −0.14 | 0.27 | 0.00 | 0.18 | 0.401 | 1.40 | −0.18 | 0.25 | 0.00 |
Table 10.
Results of the validation analysis of the estimated fruit yield (kg m−2) from NDVI measurements and several normalized NDVI indices (DI, RI, RDI, NDI), at different phenological stages of muskmelon. DI, Difference Index; RI, Relative Index; RDI, Relative Difference Index; NDI, Normalized Difference Index, R2, coefficient of determination; RMSE, root mean square error; RE, relative error; MBE, mean bias error; d, Willmott Index. L1ref and L4ref, refer to the latest (most recent) and fourth fully expanded leaf, respectively.
| Index | Vegetative | Flowering | Early Fruit Growth | Harvest |
|---|
| R2 | p Value | RMSE | MBE | RE | d | R2 | p Value | RMSE | MBE | RE | d | R2 | p Value | RMSE | MBE | RE | d | R2 | p Value | RMSE | MBE | RE | d |
|---|
| NDVI L1ref | 0.84 | 0.010 | 0.75 | 0.14 | 0.13 | 0.95 | 0.53 | 0.100 | 1.30 | −0.22 | 0.22 | 0.83 | 0.32 | 0.241 | 1.60 | −0.20 | 0.27 | 0.72 | 0.37 | 0.204 | 1.54 | −0.14 | 0.26 | 0.75 |
| NDVI L4ref | 0.54 | 0.095 | 1.46 | 0.45 | 0.28 | 0.85 | 0.71 | 0.035 | 1.06 | −0.20 | 0.18 | 0.88 | 0.41 | 0.174 | 1.50 | 0.07 | 0.26 | 0.79 | 0.49 | 0.119 | 1.44 | −0.27 | 0.24 | 0.83 |
| DIL1red–L4ref | 0.21 | 0.364 | 1.72 | 0.14 | 0.31 | 0.42 | 0.01 | 0.921 | 2.01 | 0.21 | 0.36 | 0.20 | 0.01 | 0.973 | 2.62 | −0.67 | 0.41 | 0.32 | 0.01 | 0.890 | 1.89 | 0.25 | 0.34 | 0.20 |
| RIL1ref–L4ref | 0.24 | 0.329 | 1.73 | 0.11 | 0.31 | 0.36 | 0.01 | 0.888 | 2.03 | 0.19 | 0.37 | 0.19 | 0.01 | 0.976 | 2.30 | −0.49 | 0.37 | 0.30 | 0.01 | 0.930 | 1.90 | 0.24 | 0.34 | 0.17 |
| RDIL1ref–L4ref | 0.22 | 0.349 | 1.73 | 0.10 | 0.31 | 0.38 | 0.01 | 0.892 | 2.03 | 0.22 | 0.37 | 0.19 | 0.01 | 0.976 | 2.31 | −0.51 | 0.37 | 0.30 | 0.01 | 0.924 | 4.20 | −3.75 | 0.44 | 0.07 |
| NDIL1ref–L4ref | 0.22 | 0.349 | 1.73 | 0.10 | 0.31 | 0.38 | 0.01 | 0.892 | 2.03 | 0.20 | 0.37 | 0.19 | 0.01 | 0.976 | 2.31 | −0.51 | 0.37 | 0.30 | 0.01 | 0.924 | 1.90 | 0.24 | 0.34 | 0.18 |


 ,
, 


