Abstract
Ionospheric observations along with CHAMP/STAR neutral gas density measurements were used to retrieve thermospheric parameters and to check whether the equinox transition season exists separately from the December solstice and June solstice seasons. Juliusruh and Boulder ionosonde stations located in “far-from-pole” and “near-pole” longitudinal sectors were analyzed during deep solar minimum in 2008–2009. The results were compared to GOLD column O/N2 ratio observations. The retrieved thermospheric parameters have shown that equinoctial transition period exists separately from the winter one at Juliusruh, while column O/N2 ratios, exospheric temperatures Tex, and vertical plasma drifts related to thermospheric winds retrieved at Boulder for the winter season do not significantly differ from vernal values. This means that the December solstice season just does not exist as it merges with the vernal season in the “near-pole” longitudinal sector. The obtained results indicate that two longitudinal sectors manifest different seasonal variations both in thermospheric circulation and neutral composition.
1. Introduction
According to ionospheric F2-layer observations at middle latitudes, there are two types of foF2 diurnal variations: winter and summer firstly mentioned by [1,2,3,4]. Using Millstone Hill incoherent scatter radar (ISR), observations specified winter and summer F2-layer variations as the following:
- (1)
- Large diurnal NmF2 variations in winter (up to an order of magnitude), while in summer the NmF2 day/night ratio is only about factor of 2;
- (2)
- Maximum in the diurnal NmF2 variations takes place around 13 LT in winter, while in summer it shifts towards 18–20 LT, a morning peak may frequently occur;
- (3)
- Summer daytime hmF2 values are higher by about 20 km than winter ones and in summer the layer is broader than in winter for the same geophysical conditions.
The transition in NmF2 and hmF2 diurnal variations of from one type to the other is very rapid and occurs during a couple of weeks around equinoxes. The differences mentioned above are supposed to manifest strong changes of thermospheric winds and neutral composition during the transition periods.
Global modelling of the thermosphere by Fuller-Rowell and Rees [5] confirmed seasonal changes of neutral composition caused by global circulation in the thermosphere. Rishbeth and Müller-Wodarg [6], using a 3D model of the thermosphere, confirmed that seasonal changes take place very quickly around equinoxes. Shepherd et al. [7] using ground-based and optical satellite observations revealed strong variations in the integrated emission rate of the oxygen airglow during the springtime transition period.
The analysis [8] based on ground-based ionosonde and ISR observations have shown the following: The average transition from one type of diurnal NmF2 variation to another takes 20–25 days, but cases of very fast (6–10 days) transitions are observed as well. The summer-type diurnal NmF2 variation is characterized by decreased atomic oxygen concentration [O] and a small equatorward thermospheric wind compared to winter-type days with strong poleward wind and increased [O]. Molecular N2 and O2 concentrations remain practically unchanged during seasonal transitions. The main cause of the F2-layer variations during the transition periods is a change of atomic oxygen abundance in the thermosphere related to changes of global thermospheric circulation.
New interesting observations on seasonal variations of thermospheric composition using column number density O/N2 ratio were obtained by the NASA Global Observations of Limb and Disk (GOLD) mission from low–mid to mid–high latitudes [9]. Among many interesting results concerning spatial and temporal variations of column O/N2 ratio, the timing of seasonal transition looks to be the most challenging one:
- (1)
- The December solstice season is much shorter than the June one. The average durations for the December solstice season and the June solstice season during this period (October 2018–the end of 2021) are 122 days and 243 days, respectively;
- (2)
- As far as column O/N2 ratio is concerned, there is only the December solstice season or June solstice season, and the transition between two seasons, the equinox transition, has a time scale of the order of one day.
The most striking difference with previous results manifests the duration of the equinoctial transition—the order of one day compared to two–three weeks revealed earlier. It should be noted that the method for how the seasons were specified was by Qian et al. [9]. The authors found the difference in O/N2 annual variations at same latitudes in the two hemispheres: “We define the time period when the ΣO/N2 difference is positive as “the December solstice season”, the period when it is negative as “the June solstice season”, and the transition between the two as the “equinox transition”. Formally, such a method may be applied to specify the season but there is a hemispheric asymmetry in the seasonal variations related to the interaction of three components—annual, semiannual, and non-seasonal [10]. There are objective reasons for the hemispheric asymmetry: different configuration of the geomagnetic field [11], different auroral electrojet indices [12], and a persistent difference in the auroral hemispheric power [13]. All these should inevitably result in different thermospheric circulation and different neutral composition.
On the other hand, the method based on the analysis of NmF2 = 1.24 × 10⁴(foF2)2 diurnal variations also has its own peculiarities; therefore, two methods may give different results. Although daytime mid-latitude F2-layer manifests the state of the surrounding thermosphere, NmF2 is not directly related to the column O/N2 number density [14]. Further, NmF2 depends on vertical plasma drift related to thermospheric winds (mainly meridional Vnx component is important during noontime hours) and this drift in its turn depends on the intensity of auroral heating. Therefore, auroral activity changing the type of NmF2 diurnal variation (winter/summer) may strongly affect the duration of the equinoctial transition estimated from NmF2 diurnal variations as this was stressed by Mikhailov and Schlegel [8].
The difference in two estimates is a principle question for physics of the thermosphere and this issue requires a special analysis. Such an attempt is undertaken in the present paper. We use as earlier diurnal foF2 variations observed at mid-latitude stations but under deep solar minimum in 2008–2009 when geomagnetic activity was at the lowest level. In this case, one may hope that observed foF2 diurnal variations manifest the intrinsic state of the thermosphere (neutral composition, temperature, and solar-driven winds). Previous analyses [15,16,17] have shown that under deep solar minimum, even small splashes of auroral activity with Ap = 7–10 nT may strongly perturb foF2 diurnal variations. Therefore, we analyzed only days with daily Ap < 7 nT. Our recently proposed method [18], along with CHAMP/STAR (ftp://anonymous@thermosphere.tudelft.nl/version_01/CHAMP_data/, accessed on 16 March 2023) neutral gas density observations, was applied to infer a consistent set of aeronomic parameters (neutral composition and temperature, vertical plasma drift, total solar EUV flux) responsible for the formation of daytime mid-latitude F2-layer. The retrieved solar EUV flux with λ ≤ 1050 Å may be controlled by available EUV observations [19]. Such a set of aeronomic parameters obtained for the periods of equinox transition will give us a complete picture of the thermospheric state for each particular day, and we will be able to specify the exact dates of seasonal transitions related to the internal processes in the thermosphere. This will allow us to check the results obtained with GOLD observations.
The aims of our paper may be formulated as follows:
- To analyze ionosonde annual foF2 observations at two mid-latitude stations, Juliusruh and Boulder, located at close magnetic latitudes but in different “near-pole” (Boulder) and “far-from-pole” (Juliusruh) longitudinal sectors under deep solar minimum in 2008–2009 with an accent on seasonal transitions.
- To retrieve thermospheric parameters (neutral composition, temperature, vertical plasma drift) from the ionospheric and CHAMP/STAR neutral density observations for the analyzed periods to specify the periods of equinoctial transitions in thermospheric parameters.
- To discuss mechanisms responsible for the revealed seasonal transitions.
2. Observations and the Method of Analysis
The period from July 2008 to June 2009 which includes the autumnal equinox (September–October) of 2008 and the vernal equinox (March–April) of 2009 was taken for our analysis. That was the deepest solar minimum for the whole history of ionospheric observations with monthly F10.7 = 67.1–69.7 and Ap = 4.4–6.8 nT. Moreover, all days with daily Ap > 7 nT were removed from our analysis. Under such conditions, one may hope to follow seasonal transitions solely related to the intrinsic processes in the thermosphere resulted from solar heating while the effects of auroral heating are supposed to be negligible. The separation of observed diurnal foF2 variations into winter, equinox, and summer was made in accordance with the features also used in our earlier analysis [8]. Figure 1 gives three well-pronounced different types (winter, summer, and equinox) of foF2 diurnal variations observed at Juliusruh in 2008–2009.
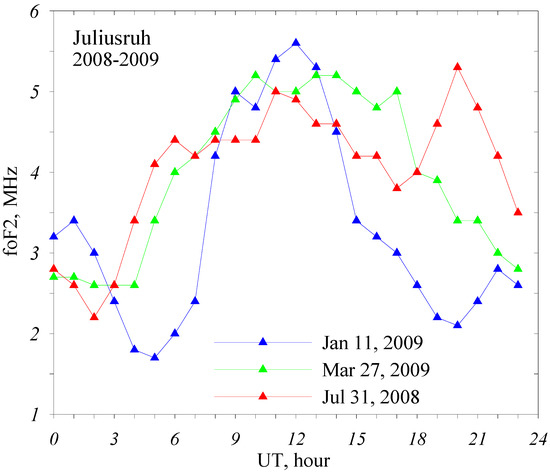
Figure 1.
Well-pronounced foF2 diurnal variations for three seasons at Juliusruh.
The winter type of foF2 variation is characterized by one near noontime foF2 peak, a large (2–3 times) midday/pre-sunrise foF2 difference, and a narrow half-width of foF2 variation during daytime hours. The equinoctial type is characterized by a broad plateau-like foF2 during variation during daytime hours. The summer type is characterized by a well-pronounced evening and a morning-noontime foF2 peaks and a ‘bite-out’ between them. The summer type may be also presented by a plateau-like foF2 variation during daytime hours but the evening maximum always exists, the noon/pre-sunrise foF2 difference being <2 times. Such noon/pre-sunrise differences are observed under deep solar minimum in question, for solar maximum the differences are larger [8] but we do not consider solar maximum to avoid the auroral heating effects. In reality, seasonal differences may not be well-expressed for individual days so sometimes this is not that easy to attribute the observed foF2 variation to one or another type even for magnetically quite periods. Nevertheless, monthly median foF2 variations well manifest these seasonal differences.
Figure 2 gives a monthly median foF2 variations at Juliusruh (54.6°N, 13.4°E) and Boulder (40.0°N, 254.7°E) for 12 months of 2008–2009. These two mid-latitude stations are located in the longitudinal sector covered by GOLD observations made at (120°W–20°E) longitudes [9]. Boulder is located in the “near-pole” and Juliusruh in the “far-from-pole” longitudinal sectors [10] where the thermospheric circulation responsible for seasonal transitions may be different and one may expect different seasonal transition patterns. In general, two stations manifest a similar monthly median foF2 diurnal variations. January and December exhibit the winter type while May–August the summer type. Other months demonstrate interim type of foF2 variations due to some days in the month possibly manifesting winter features while others summer ones. It is seen that March, September, and October belong to the transitional period as this is manifested in the monthly median foF2 variations, however individual days may belong to winter or summer types (see later). This tells us that the equinoctial transition is a prolonged process occupying a period of the order of a month and this does not agree with Qian et al.’s [9] results. Therefore, neutral composition should be specified for the analyzed (2008–2009) period to provide a correct comparison with GOLD observations also made under solar minimum in October 2018—the end of 2021 [9].
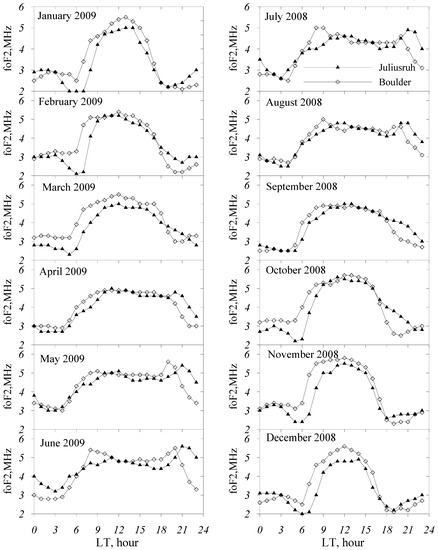
Figure 2.
Monthly median foF2 diurnal variations at Juliusruh and Boulder in 2008–2009.
Our method [18] to retrieve thermospheric parameters from ionospheric observations was applied to the selected dates in 2008 and 2009. The method utilizes observed noontime foF2, plasma frequencies at 180 km height, f180 for (10, 11, 12, 13, 14) LT, both observations may be taken from SAO files [20] at the stations where DPS-4 are installed. The method also uses neutral gas density as a fitted parameter. CHAMP/STAR (https://isdc.gfz-potsdam.de/champ-isdc/, accessed on 15 March 2023) observations were used in the present analysis. Daytime neutral density observed in the vicinity of ionosonde station was reduced to 12 LT and the location of ionosonde using the MSISE00 thermospheric model [21].
3. Results
Figure 3 gives the seasonal distribution of days at Juliusruh after the application of the above-mentioned criteria to observed foF2 diurnal variations during July–December 2008 and January–June 2009. The duration of the winter season is ~172 days while the summer season lasts ~145 days; the vernal equinox lasts ~36 days while the autumnal only ~12 days, i.e., the summer to winter transition is much shorter. This coincides with the earlier obtained results [8] where it was shown that the vernal transition lasts a little longer than the autumnal one and the vernal transition starts close to the equinox while the autumnal one starts earlier. This does not agree with the results by Qian et al. [9] who found that the December solstice season lasted for 122 days and the June solstice season 243 days, while the equinoctial period was totally absent. However, it should be stressed once again that the estimates by Qian et al. [9] are based on the column O/N2 ratio seasonal variations while foF2 depends on thermospheric neutral composition, temperature, and winds which strongly vary with season.
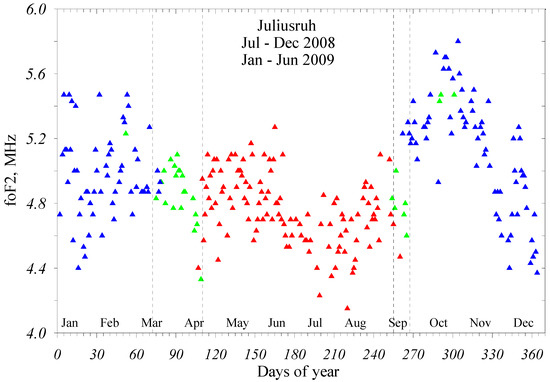
Figure 3.
Seasonal distribution of days with three types of foF2 diurnal variation at Juliusruh during July–December 2008 and January–June 2009. Noontime foF2 values are given. Blue triangles—days with winter type of foF2 diurnal variation, red triangles—summer type, and green triangles—equinoctial type. Vertical dashed lines confine the periods of equinoctial transition.
Figure 4 gives same results but for Boulder. The seasonal distribution looks differently compared to Juliusruh. The winter season is much shorter—only ~60 days. The length of vernal transition is hard to estimate as winter and equinoctial types of foF2 diurnal variation are mixed and the total duration of this period is ~85 days. The autumnal transition period is less contaminated with neighboring seasons and its duration is ~80 days. The duration of summer season is similar to the Juliusruh one ~140 days. One may note some interesting results: (i) a short winter season; (ii) a long vernal transition period strongly contaminated with winter days; and (iii) a prolonged autumnal transition period in a comparison with the Juliusruh one. These peculiarities may be related to the Boulder location in the “near pole” longitudinal sector with specific seasonal variations of neutral composition [14,22].
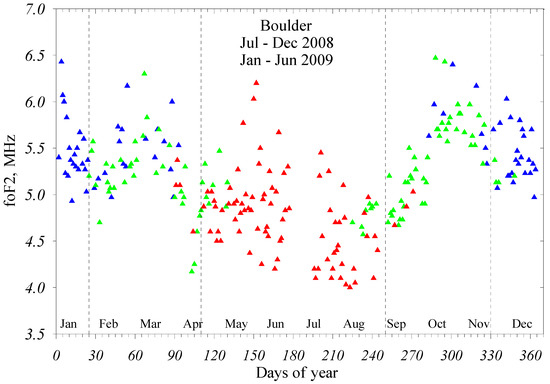
Figure 4.
Same as Figure 3 but for Boulder.
Dates with well-pronounced seasonal difference in foF2 diurnal variations observed at Juliusruh were developed with our method [18] to retrieve noontime thermospheric parameters. Among them, column [O], [N2], and the column O/N2 ratio (Figure 5) were calculated above the height with N2 column density of 1017 cm−2 [23] to compare with the GOLD [9] results. The retrieved vertical plasma drift W mainly related to the meridional Vnx neutral wind component is also given in Figure 5 (top panel). It is seen that column O/N2 ratio variations are practically totally due to atomic oxygen, while column [N2] variations are very small, within ~6–7% throughout the year.
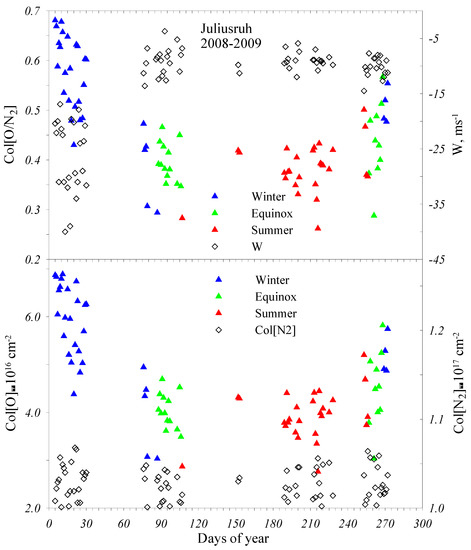
Figure 5.
Seasonal variations of noontime column O/N2 ratio at Juliusruh for days with well-pronounced winter, summer, and equinox foF2 diurnal variations along with retrieved vertical plasma drifts, W (top panel). Bottom panel gives separately column [O] and [N2] for the same dates.
Table 1 gives average retrieved column O/N2, exospheric temperature (Tex), and W for dates with winter, equinox, and summer type of foF2 diurnal variations.

Table 1.
Average along with ± SD retrieved at Juliusruh col(O/N2), Tex, and W over the dates with three types of foF2 diurnal variations.
The application of t-criterion to column O/N2 ratio, Tex, and W data given in Table 1 and Figure 5 indicates that winter/summer and winter/equinox differences are significant at >99.9% confidence level while the summer/equinox difference is significant only at ~95% level for column O/N2 ratio and is insignificant for W. Thus, the equinoctial period should be considered as different from the winter one while a 95% confidence level may be not sufficient to distinguish equinoctial and summer periods analyzing column O/N2 ratio seasonal variations. This confirms the results by Qian et al. [9] who found that the winter season was much shorter than the summer one if the summer and equinoctial periods are considered together. Seasonal variations of vertical plasma drift W also manifest a significant difference between winter and two other seasons while this difference is insignificant considering equinox and summer. This also tells us that summer and equinoctial periods may be considered together at Juliusruh bearing in mind daytime thermospheric parameter seasonal variations.
However, one may expect different results at Boulder where the vernal equinoctial period is strongly contaminated with winter days (Figure 4). We have also retrieved thermospheric parameters for days with winter and equinoctial type of foF2 diurnal variations in February–April 2009 in a comparison to days with purely winter type of foF2 variations in December 2008–January 2009. Figure 6 gives retrieved noontime column O/N2 ratio at Boulder and vertical plasma drifts for the selected days while Table 2 gives retrieved thermospheric parameters for the analyzed days along with MSIS-86 model [24] Tex, column O/N2 ratio, and column [O] values given for a comparison. The gap during the end of December 2008–the beginning of January 2009 is due to absence of CHAMP neutral gas density observations at Boulder during this period.
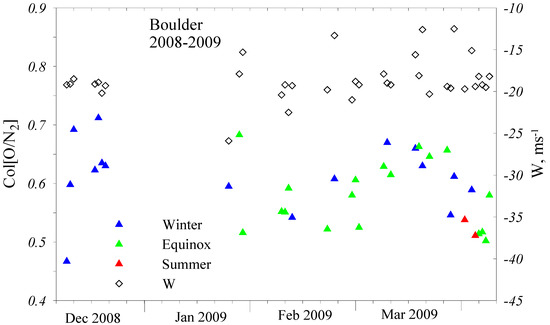
Figure 6.
Retrieved noontime column O/N2 ratio and vertical plasma drift W at Boulder for days with winter and vernal equinox foF2 diurnal variations.

Table 2.
Retrieved thermospheric parameters for winter and vernal periods at Boulder. Numbers in brackets—MSIS86 model values.
Figure 6 and Table 2 show that unlike Juliusruh (Figure 5), where winter (December/January) column O/N2 ratios and column [O] are significantly larger than vernal equinoctial values, at Boulder they are practically undistinguished, and the application of t-criterion confirms that the difference is statistically insignificant. The retrieved vertical plasma drift W related to thermospheric winds also does not manifest any seasonal differences contrary the W variations at Juliusruh (Figure 5, top panel). Vertical drift W considered over the whole period is −18.5 ± 2 m/s at Boulder but it is −9.3 ± 2 m/s during equinox/summer and −21.5 ± 5 m/s in winter at Juliusruh. The retrieved Tex also does not manifest any significant difference at Boulder for the two periods (Table 2). Unlike the retrieved column O/N2 ratio and column [O], MSIS-86 model values indicate that these seasonal differences are significant. Problems with MSIS atomic oxygen longitudinal variations under solar minimum in the American longitudinal sector were discussed earlier by Mikhailov and Perrone [14].The undertaken analysis tells us that two longitudinal sectors manifest different seasonal variations both in thermospheric circulation and neutral composition. Boulder is located in the “near-pole” and Juliusruh in the “far-from-pole” longitudinal sectors [10]. In fact, the vernal transition period lasts for two months at Boulder i.e., much longer than at Juliusruh. Although GOLD observations cover both longitudinal sectors (120°W–20°E), the authors [9] did not mention this difference.
4. Discussion
Initially, ionospheric F2-layer observations [1,2,3,4,8] were used to analyze seasonal variations in the thermosphere, bearing in mind that NmF2 manifests the state of the surrounding thermosphere. However, NmF2 depends on many aeronomic parameters and the duration of winter, summer, and equinoctial seasons based on NmF2 observations should be considered only as an estimate. NASA Global Observations of Limb and Disk (GOLD) mission [25,26] (and Global Ultraviolet Imager (GUVI) limb measurements [27] gave direct global-scale column O/N2 ratio observations during prolonged periods and such observations could be efficiently used for analyses of seasonal transitions in the thermosphere. Such an analysis was undertaken by Qian et al. [9] who have revealed that there is only the December solstice season or June solstice season, and the transition between two seasons, the equinox transition, has a time scale of the order of one day.
Seasonal changing of global thermospheric circulation and corresponding changing in neutral composition is not a one-day act. These changes mainly reflect seasonal changes of solar illumination and the intensity of auroral heating as was earlier noted by Mikhailov and Schlegel [8]. We have specially selected in our analysis the period of deep solar minimum in 2008–2009 to exclude as much as possible the effects of auroral heating, however, even in this case European (“far-from-pole”) and American (“near-pole”) longitudinal sectors manifest different patterns of thermospheric parameter seasonal variations as was demonstrated in our analysis.
The definitions “far-from-pole” and “near-pole” were introduced by Rishbeth and Müller-Wodarg, (2006) to specify the position of a station with respect to a magnetic pole. Stations in the American longitudinal sector compared to European and Asian ones have larger magnetic latitudes (under same geographic latitudes) and this is a well-known fact. However, our analysis has shown that the difference between two sectors is more principle and does not come down to the difference in magnetic and geographic coordinates. We selected stations in the two sectors with close magnetic coordinates but they nevertheless manifest different seasonal variations in neutral composition and winds. This issue needs a special analysis that goes beyond the scope of this paper, devoted to providing the existence of equinoctial transition periods in seasonal variations of neutral composition.
Our recently developed method [18] to retrieve a consistent set of main aeronomic parameters responsible for the mid-latitude daytime F-layer formation was used to find Tex, [O], [N2], and W seasonal variations at Boulder and Juliusruh. The method is based on direct ionosonde and in situ satellite neutral gas density observations in the vicinity of the ionosonde station and describes the noontime state of the thermosphere for given geophysical conditions. GOLD observations cover a latitude range from 60°S to 60°N and a longitude range from 120°W to 20°E which includes Juliusruh and Boulder locations. The subsatellite longitude of GOLD is at 47.5°W, therefore Qian et al. [9] focused on examining the seasonal variation of ΣO/N2 at 45°W and local noon. The analyzed GOLD observations were mainly conducted at low level of solar activity from October 2018 to the end of 2021. Therefore, our retrieved column O/N2 ratios may be compared to GOLD observations used by Qian et al. [9].
Figure 5 shows that in the European (“far-from-pole”) longitudinal sector there is at least a two-week vernal equinoctial period which is free of the contamination by neighboring seasons.
The autumnal equinoctial period is shorter ~10 days. Earlier in our paper it was mentioned that all equinoctial column O/N2 ratio data do not statistically differ from summer ones and this is so comparing vernal to summer dates. However, the same comparison of autumnal dates to summer ones gives a significant difference at the 97% confidence level. Of course, all retrieved equinox O/N2 data are significantly different from winter ones (see earlier). This tells us that both foF2 and column O/N2 data manifest the existence of equinoctial periods which are separated from winter and summer ones and the duration of these periods are larger than a day found by Qian et al. [9].
Results for Boulder located in the “near-pole” longitudinal sector are even more interesting.
Figure 4 with foF2 seasonal variations manifests a prolonged (February–April) vernal transition period which is strongly contaminated with dates typical of the winter season. The autumnal transition period is also very prolonged and includes September–November dates. Unlike Juliusruh, the retrieved winter column O/N2 ratios do not significantly differ from vernal ones. The retrieved Tex also does not manifest any significant difference for the two periods (Table 2). Retrieved vertical plasma drift W related to thermospheric winds also does not demonstrate any seasonal differences contrary W variations at Juliusruh. This means that “the December solstice season” using the terminology by Qian et al. [9] just does not exist as it merges with the vernal season. The autumnal transition period requires a special analysis not done in this paper.
The revealed peculiarities in thermospheric and ionospheric seasonal variations may be related to persistent auroral heating in the “near-pole” American longitudinal sector. The mechanism of longitudinal/UT variations of neutral composition has been always associated with high latitude heating and the displacement between the geomagnetic and geographic poles [28,29,30]. Due to Joule and particle precipitation heating of the auroral zone which takes place even under magnetically quiet conditions [16,17], the upper atmosphere expands and this upwelling results in a decrease of the atomic oxygen abundance in the auroral zone. Heating of the auroral thermosphere creates a pressure gradient and an equatorward wind which competes with solar-driven wind. This mechanism has been much discussed in the literature [6,31,32]. Normally, the solar-driven circulation transfers atomic oxygen from summer (more heated) to winter (more cold) hemisphere, increasing the atomic oxygen abundance in the winter hemisphere. We have such a situation at middle latitudes in the “far-from-pole” longitudinal sector. In the “near-pole” sector, the solar-driven circulation is damped by a high-latitude gradient during winter and the vernal equinox leaving the atomic oxygen abundance at a relatively low level at middle latitudes. The day-to-day variation of the intensity of auroral heating results in day-to-day variations of the atomic oxygen abundance at middle latitude as this was shown in [15]. This is seen as a contamination of the vernal transition period with winter days (Figure 4 and Figure 6). During the second part of the year, the direction of aurorally induced circulation coincides with solar-driven circulation (from the summer to winter hemisphere) resulting in a decrease of atomic oxygen abundance at middle latitudes. This decrease of [O] is seen in low foF2 observed by the end of August (Figure 4) unlike Juliusruh when minimal foF2 are observed in the end of July (Figure 3). This is due to a different pattern of meridional circulation in the two longitudinal sectors. Low starting [O] values in the beginning of the autumnal equinox result in a prolonged transition period (Figure 4) not contaminated with winter-type of foF2 diurnal variations which normally are associated with large atomic oxygen concentration.
5. Conclusions
Ionospheric observations along with CHAMP/STAR neutral gas density measurements were used to retrieve thermospheric parameters and to specify seasonal transitions in the European (“far-from-pole”) and American (“near-pole”) longitudinal sectors. The results were compared to GOLD column O/N2 ratio observations by Qian et al. [9] The obtained results may be formulated as follows.
- The analysis of foF2 diurnal variations during July–December 2008 and January–June 2009 at Juliusruh located in the “far-from-pole” longitudinal sector gave the duration of the winter season ~172 days, summer season ~145 days, the vernal equinox ~36 days, and the autumnal one ~12 days, i.e., the summer to winter transition is much shorter. Boulder located in the “near-pole” longitudinal sectors manifests different results. The winter season is much shorter-only ~60 days, the vernal period is strongly contaminated with days typical of winter foF2 variation and the total duration of this period is ~85 days, the autumnal period is less contaminated with neighboring seasons and its duration is ~80 days, and the duration of the summer season is similar to the Juliusruh one at ~140 days. Therefore, mid-latitude foF2 seasonal variations which reflect the state of the surrounding thermosphere manifest the existence of prolonged equinoctial periods oppositely to the results obtained by Qian et al. [9].
- Retrieved thermospheric parameters (neutral composition, temperature, and vertical plasma drift W related to thermospheric winds) were used to specify seasonal differences. In particular, column O/N2 ratios were compared to GOLD observations. At Juliusruh, winter/summer and winter/equinox differences in column O/N2 and W are significant at >99.9% confidence level while the summer/equinox difference is significant at ~95% confidence level for column O/N2 ratio and is insignificant for W. Thus, the equinoctial period should be considered as different from the winter one while a 95% confidence level may be not sufficient to distinguish equinoctial and summer periods analyzing column O/N2 ratio seasonal variations. This confirms the results by Qian et al. [9] who found that the winter season was much shorter than the summer one if the summer and equinoctial periods are considered together.
- Retrieved at Boulder column O/N2 ratios, Tex and vertical plasma drifts for the winter season (December–January) do not significantly differ from vernal values according to t-criterion.
This means that “the December solstice season” just does not exist as it merges with the vernal season in the “near-pole” longitudinal sector. Vertical drift W considered over winter and vernal periods is −18.5 ± 2 m/s at Boulder but it is −9.3 ± 2 m/s during equinox/summer and −21.5 ± 5 m/s in winter at Juliusruh. This means that two longitudinal sectors manifest different seasonal variations both in thermospheric circulation and neutral composition.
Author Contributions
Conceptualization, L.P. and A.V.M.; methodology, A.V.M. and L.P.; software, L.P. and A.V.M.; data preparation, L.P. and A.V.M.; writing, A.V.M. and L.P. All authors have read and agreed to the published version of the manuscript.
Funding
This research was carried within the INGV Pianeta Dinamico Project (CUP D53J19000170001), The Solar wind-Earth’s magnetosphere Relationships and their Effects on ioNosphere and upper and lower Atmosphere (SERENA)-2021, funded by MUR (law 145/2018).
Data Availability Statement
The Juliuruh and Boulder ionosonde data are available across the GIRO ionospheric database at https://giro.uml.edu/.
Acknowledgments
The authors thank GFZ German Research Center for CHAMP data https://isdc.gfz-potsdam.de/champ-isdc/, and Woods for EUV observations (http://lasp.colorado.edu/lisird/) as well as the Lowell DIDBase through GIRO for ionosonde data (http://spase.info/SMWG/Observatory/GIRO) and this paper uses data from the Juliusruh Ionosonde which is owned by the Leibniz Institute of Atmospheric Physics Kuehlungsborn. The responsible Operations Manager is Jens Mielich.
Conflicts of Interest
The authors declare no conflict of interest.
References
- Yonezawa, T. On the seasonal and non-seasonal annual variations and the semi-annual variation in the noon and midnight electron density of the F2-layer in middle latitudes. J. Radio Res. Labs. 1959, 6, 651–668. [Google Scholar]
- Evans, J. Millstone Hill Thomson scatter results for 1965. Planet. Space Sci. 1970, 18, 1225–1253. [Google Scholar] [CrossRef]
- Evans, J. Millstone Hill Thomson scatter results for 1966 and 1967. Planet. Space Sci. 1973, 21, 763–792. [Google Scholar] [CrossRef]
- Evans, J.V. Millstone-Hill Thomson Scatter Results for 1969; Lincoln Lab., M.I.I.: Lexington, KY, USA, 1974. [Google Scholar]
- Fuller-Rowell, T.; Rees, D. Derivation of a conservation equation for mean molecular weight for a two-constituent gas within a three-dimensional, time-dependent model of the thermosphere. Planet. Space Sci. 1983, 31, 1209–1222. [Google Scholar] [CrossRef]
- Rishbeth, H.; Müller-Wodarg, I.C.F. Vertical circulation and thermospheric composition: A modelling study. Ann. Geophysicae. 1999, 17, 794–805. [Google Scholar] [CrossRef]
- Shepherd, G.G.; Stegman, J.; Espy, P.; McLandress, C.; Thuillier, G.; Wiens, R.H. Springtime transition in lower thermospheric atomic oxygen. J. Geophys. Res. Atmos. 1999, 104, 213–223. [Google Scholar] [CrossRef]
- Mikhailov, A.V.; Schlegel, K. Equinoctial transitions in the ionosphere and thermosphere. Ann. Geophys. 2001, 19, 783–796. [Google Scholar] [CrossRef]
- Qian, L.; Gan, Q.; Wang, W.; Cai, X.; Eastes, R.; Yue, J. Seasonal variation of thermospheric composition observed by NASA GOLD. J. Geophys. Res. Space Phys. 2022, 127, e2022JA030496. [Google Scholar] [CrossRef]
- Rishbeth, H.; Müller-Wodarg, I.C.F. Why is there more ionosphere in January than in July? The annual asymmetry in the F2-layer. Ann. Geophys. 2006, 24, 3293–3311. [Google Scholar] [CrossRef]
- Förster, M.; Cnossen, I. Upper atmosphere differences between northern and southern high latitudes: The role of magnetic field asymmetry. J. Geophys. Res. Space Phys. 2013, 118, 5951–5966. [Google Scholar] [CrossRef]
- Weygand, J.M.; Zesta, E. Comparison of auroral electrojet indices in the Northern and Southern Hemispheres. J. Geophys. Res. Atmos. 2008, 113, A08202. [Google Scholar] [CrossRef]
- Luan, X.; Wang, W.; Burns, A.; Solomon, S.; Zhang, Y.; Paxton, L. Seasonal and hemispheric variations of the total auroral precipitation energy flux from TIMED/GUVI. J. Geophys. Res. Atmos. 2010, 115, A11304. [Google Scholar] [CrossRef]
- Mikhailov, A.V.; Perrone, L. Longitudinal variations in thermospheric parameters under summer noontime conditions inferred from ionospheric observations: A comparison with empirical models. Sci. Rep. 2019, 9, 1–8. [Google Scholar] [CrossRef] [PubMed]
- Mikhailov, A.; Perrone, L.; Nusinov, A. Mid-Latitude Daytime F2-Layer Disturbance Mechanism under Extremely Low Solar and Geomagnetic Activity in 2008–2009. Remote Sens. 2021, 13, 1514. [Google Scholar] [CrossRef]
- Cai, X.; Burns, A.G.; Wang, W.; Qian, L.; Solomon, S.C.; Eastes, R.W.; Pedatella, N.; Daniell, R.E.; McClintock, W.E. The Two-Dimensional Evolution of Thermospheric ∑O/N2 Response to Weak Geomagnetic Activity During Solar-Minimum Observed by GOLD. Geophys. Res. Lett. 2020, 47, e2020GL088838. [Google Scholar] [CrossRef]
- Cai, X.; Burns, A.G.; Wang, W.; Qian, L.; Pedatella, N.; Coster, A.; Zhang, S.; Solomon, S.C.; Eastes, R.W.; Daniell, R.E.; et al. Variations in Thermosphere Composition and Ionosphere Total Electron Content Under “Geomagnetically Quiet” Conditions at Solar-Minimum. Geophys. Res. Lett. 2021, 48, e2021GL093300. [Google Scholar] [CrossRef]
- Perrone, L.; Mikhailov, A.V. A New Method to Retrieve Thermospheric Parameters from Daytime Bottom-Side Ne(h) Observations. J. Geophys. Res. Space Phys. 2018, 123, 10200–10212. [Google Scholar] [CrossRef]
- Woods, T.N.; Eparvier, F.G.; Harder, J.; Snow, M. Decoupling Solar Variability and Instrument Trends Using the Multiple Same-Irradiance-Level (MuSIL) Analysis Technique. Sol. Phys. 2018, 293, 1–21. [Google Scholar] [CrossRef]
- Reinisch, B.; Galkin, I.A.; Khmyrov, G.; Kozlov, A.; Kitrosser, D. Automated collection and dissemination of ionospheric data from the digisonde network. Adv. Radio Sci. 2005, 2, 241–247. [Google Scholar] [CrossRef]
- Picone, J.M.; Hedin, A.E.; Drob, D.P.; Aikin, A.C. NRLMSISE-00 empirical model of the atmosphere: Statistical comparisons and scientific issues. J. Geophys. Res. 2002, 107, 1468. [Google Scholar] [CrossRef]
- Regi, M.; Perrone, L.; Del Corpo, A.; Spogli, L.; Sabbagh, D.; Cesaroni, C.; Alfonsi, L.; Bagiacchi, P.; Cafarella, L.; Carnevale, G.; et al. Space Weather Effects Observed in the Northern Hemisphere during November 2021 Geomagnetic Storm: The Impacts on Plasmasphere, Ionosphere and Thermosphere Systems. Remote Sens. 2022, 14, 5765. [Google Scholar] [CrossRef]
- Strickland, D.J.; Evans, J.S.; Paxton, L.J. Satellite remote sensing of thermospheric O/N2 and solar EUV 1. Theory. J. Geophys. Res. 1995, 100, 12217–12226. [Google Scholar] [CrossRef]
- Hedin, A.E. MSIS-86 Thermospheric Model. J. Geophys. Res. Atmos. 1987, 92, 4649–4662. [Google Scholar] [CrossRef]
- Eastes, R.W.; McClintock, W.E.; Burns, A.G.; Anderson, D.N.; Andersson, L.; Aryal, S.; Budzien, S.A.; Cai, X.; Codrescu, M.V.; Correira, J.T.; et al. Initial Observations by the GOLD Mission. J. Geophys. Res. Space Phys. 2020, 125, e2020JA027823. [Google Scholar] [CrossRef]
- Correira, J.; Evans, J.S.; Lumpe, J.D.; Krywonos, A.; Daniell, R.; Veibell, V.; McClintock, W.E.; Eastes, R.W. Thermospheric Composition and Solar EUV Flux from the Global-Scale Observations of the Limb and Disk (GOLD) Mission. J. Geophys. Res. Space Phys. 2021, 126, e2021JA029517. [Google Scholar] [CrossRef]
- Zhang, Y.; Paxton, L.J.; Morrison, D.; Wolven, B.; Kil, H.; Meng, C.; Mende, S.B.; Immel, T.J. O/N2changes during 1–4 October 2002 storms: IMAGE SI-13 and TIMED/GUVI observations. J. Geophys. Res. Atmos. 2004, 109, A10308. [Google Scholar] [CrossRef]
- Laux, U.; Von Zahn, U. Longitudinal variations in thermospheric composition under geomagnetically quiet conditions. J. Geophys. Res. Atmos. 1979, 84, 1942. [Google Scholar] [CrossRef]
- Hedin, A.E.; Reber, C.A. Longitudinal variations of thermospheric composition indicating magnetic control of polar heat input. J. Geophys. Res. Atmos. 1972, 77, 2871–2879. [Google Scholar] [CrossRef]
- Reber, C.A.; Hedin, A.E. Heating of the high-latitude thermosphere during magnetically quiet periods. J. Geophys. Res. Atmos. 1974, 79, 2457–2461. [Google Scholar] [CrossRef]
- Prölss, G.W. Ionospheric F-region storms. In Handbook of Atmospheric Electrodynamics; CRC Press: Boca Raton, FL, USA, 1995; pp. 195–248. [Google Scholar]
- Rishbeth, H. How the thermospheric circulation affects the ionospheric F2-layer. J. Atmospheric Solar-Terrestrial Phys. 1998, 60, 1385–1402. [Google Scholar] [CrossRef]
Disclaimer/Publisher’s Note: The statements, opinions and data contained in all publications are solely those of the individual author(s) and contributor(s) and not of MDPI and/or the editor(s). MDPI and/or the editor(s) disclaim responsibility for any injury to people or property resulting from any ideas, methods, instructions or products referred to in the content. |
© 2023 by the authors. Licensee MDPI, Basel, Switzerland. This article is an open access article distributed under the terms and conditions of the Creative Commons Attribution (CC BY) license (https://creativecommons.org/licenses/by/4.0/).