Article

Estimation of Root-Zone Soil Moisture in Semi-Arid Areas Based on Remotely Sensed Data

1
College of Hydrology and Water Resources, Hohai University, Nanjing 210024, China
2
International Institute for Earth System Science, Nanjing University, Nanjing 210023, China
*
Author to whom correspondence should be addressed.
Remote Sens. 2023, 15(8), 2003; https://doi.org/10.3390/rs15082003
Submission received: 3 March 2023 / Revised: 25 March 2023 / Accepted: 6 April 2023 / Published: 10 April 2023

Abstract

:
Soil moisture (SM) is a bridge between the atmosphere, vegetation and soil, and its dynamics reflect the energy exchange and transformation between the three. Among SM at different soil profiles, root zone soil moisture (RZSM) plays a significant role in vegetation growth. Therefore, reliable estimation of RZSM at the regional scale is of great importance for drought warning, agricultural yield estimation, forest fire monitoring, etc. Many satellite products provide surface soil moisture (SSM) at the thin top layer of the soil, approximately 2 cm from the surface. However, the acquisition of RZSM at the regional scale is still a tough issue to solve, especially in the semi-arid areas with a lack of in situ observations. Linking the dynamics of SSM and RZSM is promising to solve this issue. The soil moisture analytical relationship (SMAR) model can relate RZSM to SSM based on a simplified soil water balance equation, which is suitable for the simulation of soil moisture mechanisms in semi-arid areas. In this study, the Xiliaohe River Basin is the study area. The SMAR model at the pixels where in situ sites were located is established, and parameters (a, b, sw2, sc1) at these pixels are calibrated by a genetic algorithm (GA). Then the spatial parameters are estimated by the random forest (RF) regression method with the soil, meteorological and vegetation characteristics of the study area as explanatory variables. In addition, the importance of soil, climatic and vegetation characteristics for predicting SMAR parameters is analyzed. Finally, the spatial RZSM in the Xiliaohe River Basin is estimated by the SMAR model at the regional scale with the predicted spatial parameters, and the variation of the regional SMAR model performance is discussed. A comparison of estimated RZSM and in-situ RZSM showed that the SMAR model at the point and regional scales can both meet the RMSE benchmark from NASA of 0.06 cm3·cm−3, indicating that the method this study proposed could effectively estimate RZSM in semi-arid areas based on remotely sensed SSM data.

Graphical Abstract

1. Introduction

Soil moisture (SM) is a bridge between the atmosphere, vegetation and soil, exerting an effect on ecological and hydrological processes such as vegetation growth, climate change and groundwater flow [1]. Among SM at different soil profiles, root zone soil moisture (RZSM) plays a significant role in vegetation growth. Therefore, a reliable estimation of RZSM at the regional scale can support research in a wide range of applications [2,3,4], such as forecasting agricultural productivities [5], providing a more precise representation of evapotranspiration (ET) feedbacks for climate change projections [6], implementing trafficability assessments [7], improving flood and drought predictions [8] and predicting the severity of forest fires [9]. Traditional site measurements of RZSM could not meet the need for spatial continuity, especially in the semi-arid area where the risk of desertification is increasing [10] with a lack of in situ sites [11]. In contrast, sensors mounted on satellites can acquire large-scale information about the physical characteristics of the land surface by observing a wide range of electromagnetic waves from the earth’s surface. Among the different wavelengths of electromagnetic waves, microwaves can penetrate a certain depth into the land surface to capture the changes in soil dielectric properties caused by changes in soil water content, which makes microwave remote sensing the most promising means for accurately observing soil moisture over a large area. There are many microwave remote sensing soil moisture products that are confirmed to be strongly correlated with the ground-measured data and have been widely applied to scientific research and applications [12,13,14,15]. However, the microwave sensors on board the satellites can only penetrate the soil layer about two centimeters below the surface and cannot obtain soil moisture information at a deeper level [16]. There is still a gap in terms of obtaining root zone soil moisture (RZSM) within the top one meter of soil, which is also useful for simulating and predicting processes such as drought development [17], plant growth [18] and chemical transport through soil [19].
In order to address the microwave satellite soil moisture product’s vertical limitation and estimate soil moisture in the root zone reliably, varied indices and models have been developed to estimate RZSM by linking SSM time series to RZSM. Wagner et al. [20] developed an index, termed the soil water index (SWI), to calculate RZSM on the basis of the SSM series. This approach evaluates RZSM using a convolution of SSM time series and simplifies the hydrological processes between SSM and RZSM with a time length parameter T. This model has been used to estimate spatial RZSM with remote-sensed spatial SSM as input and has been validated to be reliable in multiple studies [19,20].
The soil moisture analytical relationship (SMAR) model [21] is built upon the SWI. Instead of simply relating the RZSM to the SSM series the way the SWI does, SMAR estimates the RZSM by calculating the water income and expenditure in the root zone.
The SMAR model simulates moisture diffusion from the near-surface to the root zone and root zone water loss without considering the processes of lateral flow and capillary rise of water in the soil layer. The process of water loss in the root zone in the SMAR model is considered to be solely determined by the average amount of leakage and evapotranspiration in the root zone at a constant rate, called the ‘water loss coefficient’. The neglect of partial hydrological processes and the linear assumption for the root zone water loss make the SMAR model more suitable for arid or semi-arid areas. The validity of the SMAR model at the regional scale has been confirmed in many studies. Some studies have used soil properties to predict SMAR parameters to operate the SMAR model on the regional scale and obtain accurate estimates of the RZSM. It is worth noting that ET, which plays an important role in the SMAR model, is not only determined by soil properties, but other factors, such as topography, vegetation and atmospheric conditions, can also have an important impact on it, even the robustness and accuracy of the SMAR model.
The objective of this paper was to regionalize the parameters of the SMAR model and estimate the RZSM in semi-arid areas using the SMAR method. Due to the lack of in-situ measurements in semi-arid areas and the applicability of the SMAR model, the Xiliaohe River Basin in the semi-arid areas has been selected as the study area for this research. SM data collected from different depths (ranging from 10 to 100 cm) at SM sites distributed in the study area were used. The structure of this paper is outlined as follows: Section 2 describes the study area, data and methodology; Section 3 illustrates the results; and Section 4 and Section 5 present the discussion and conclusions, respectively.

2. Materials and Methods
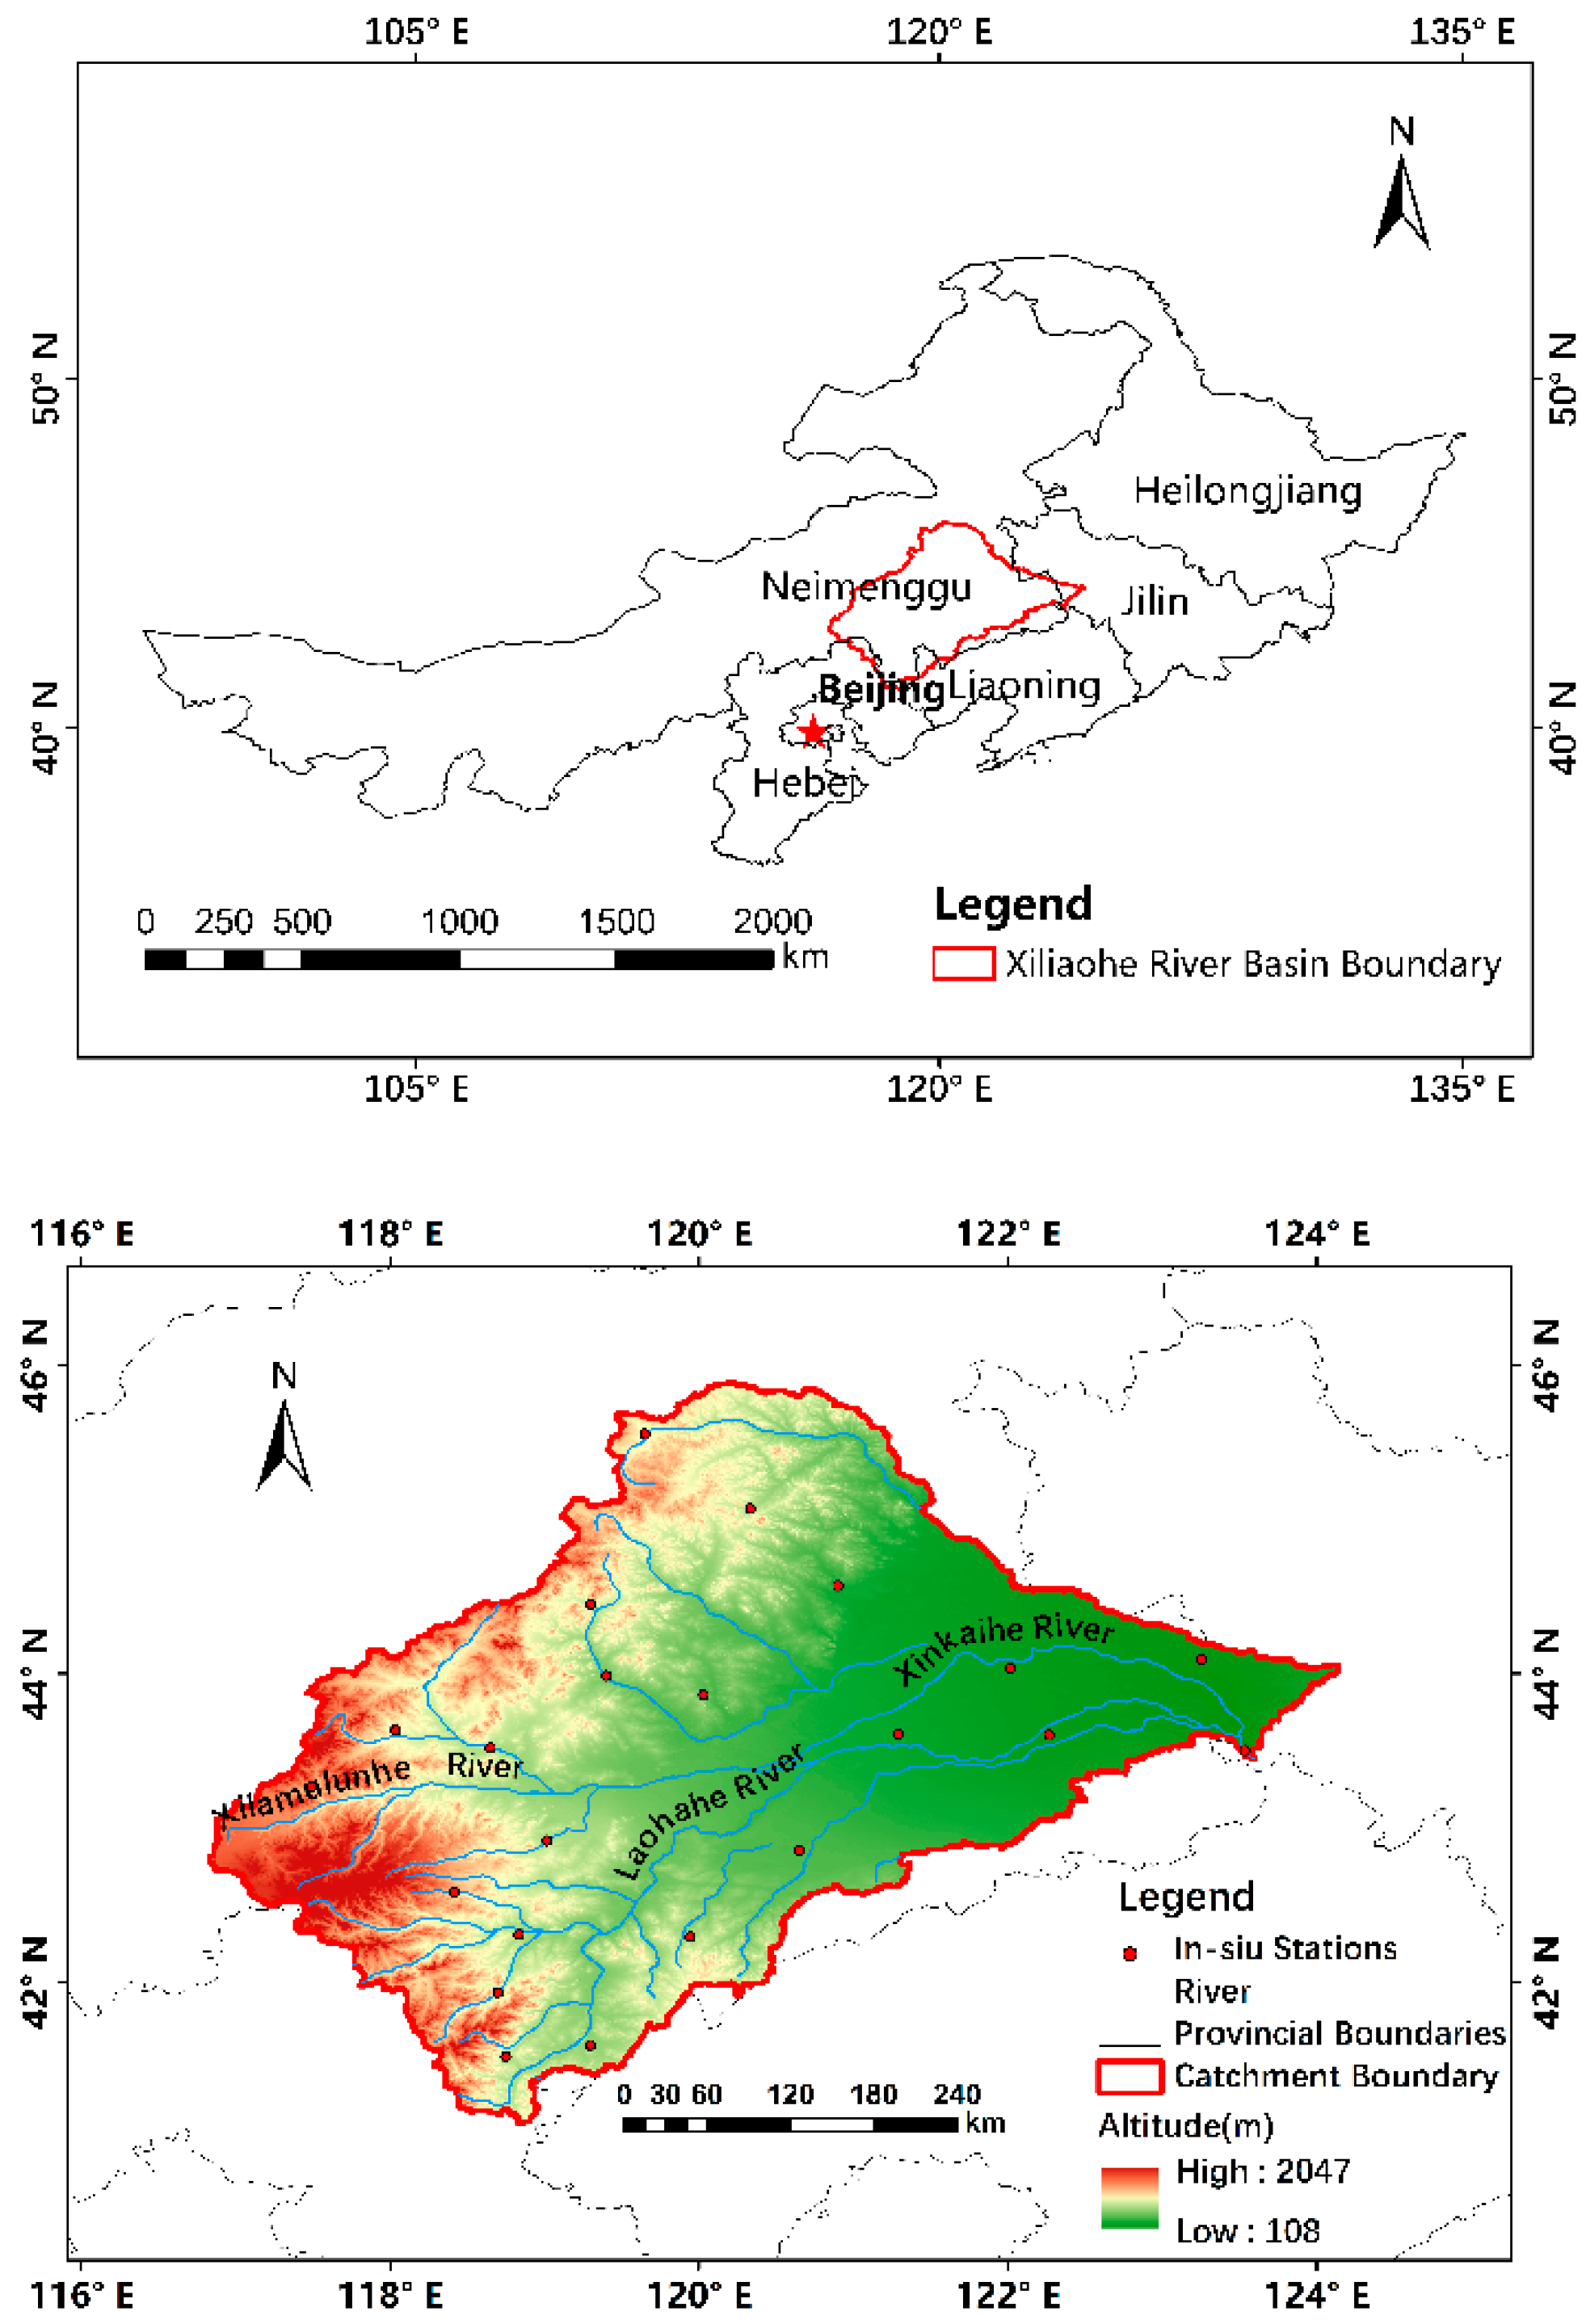
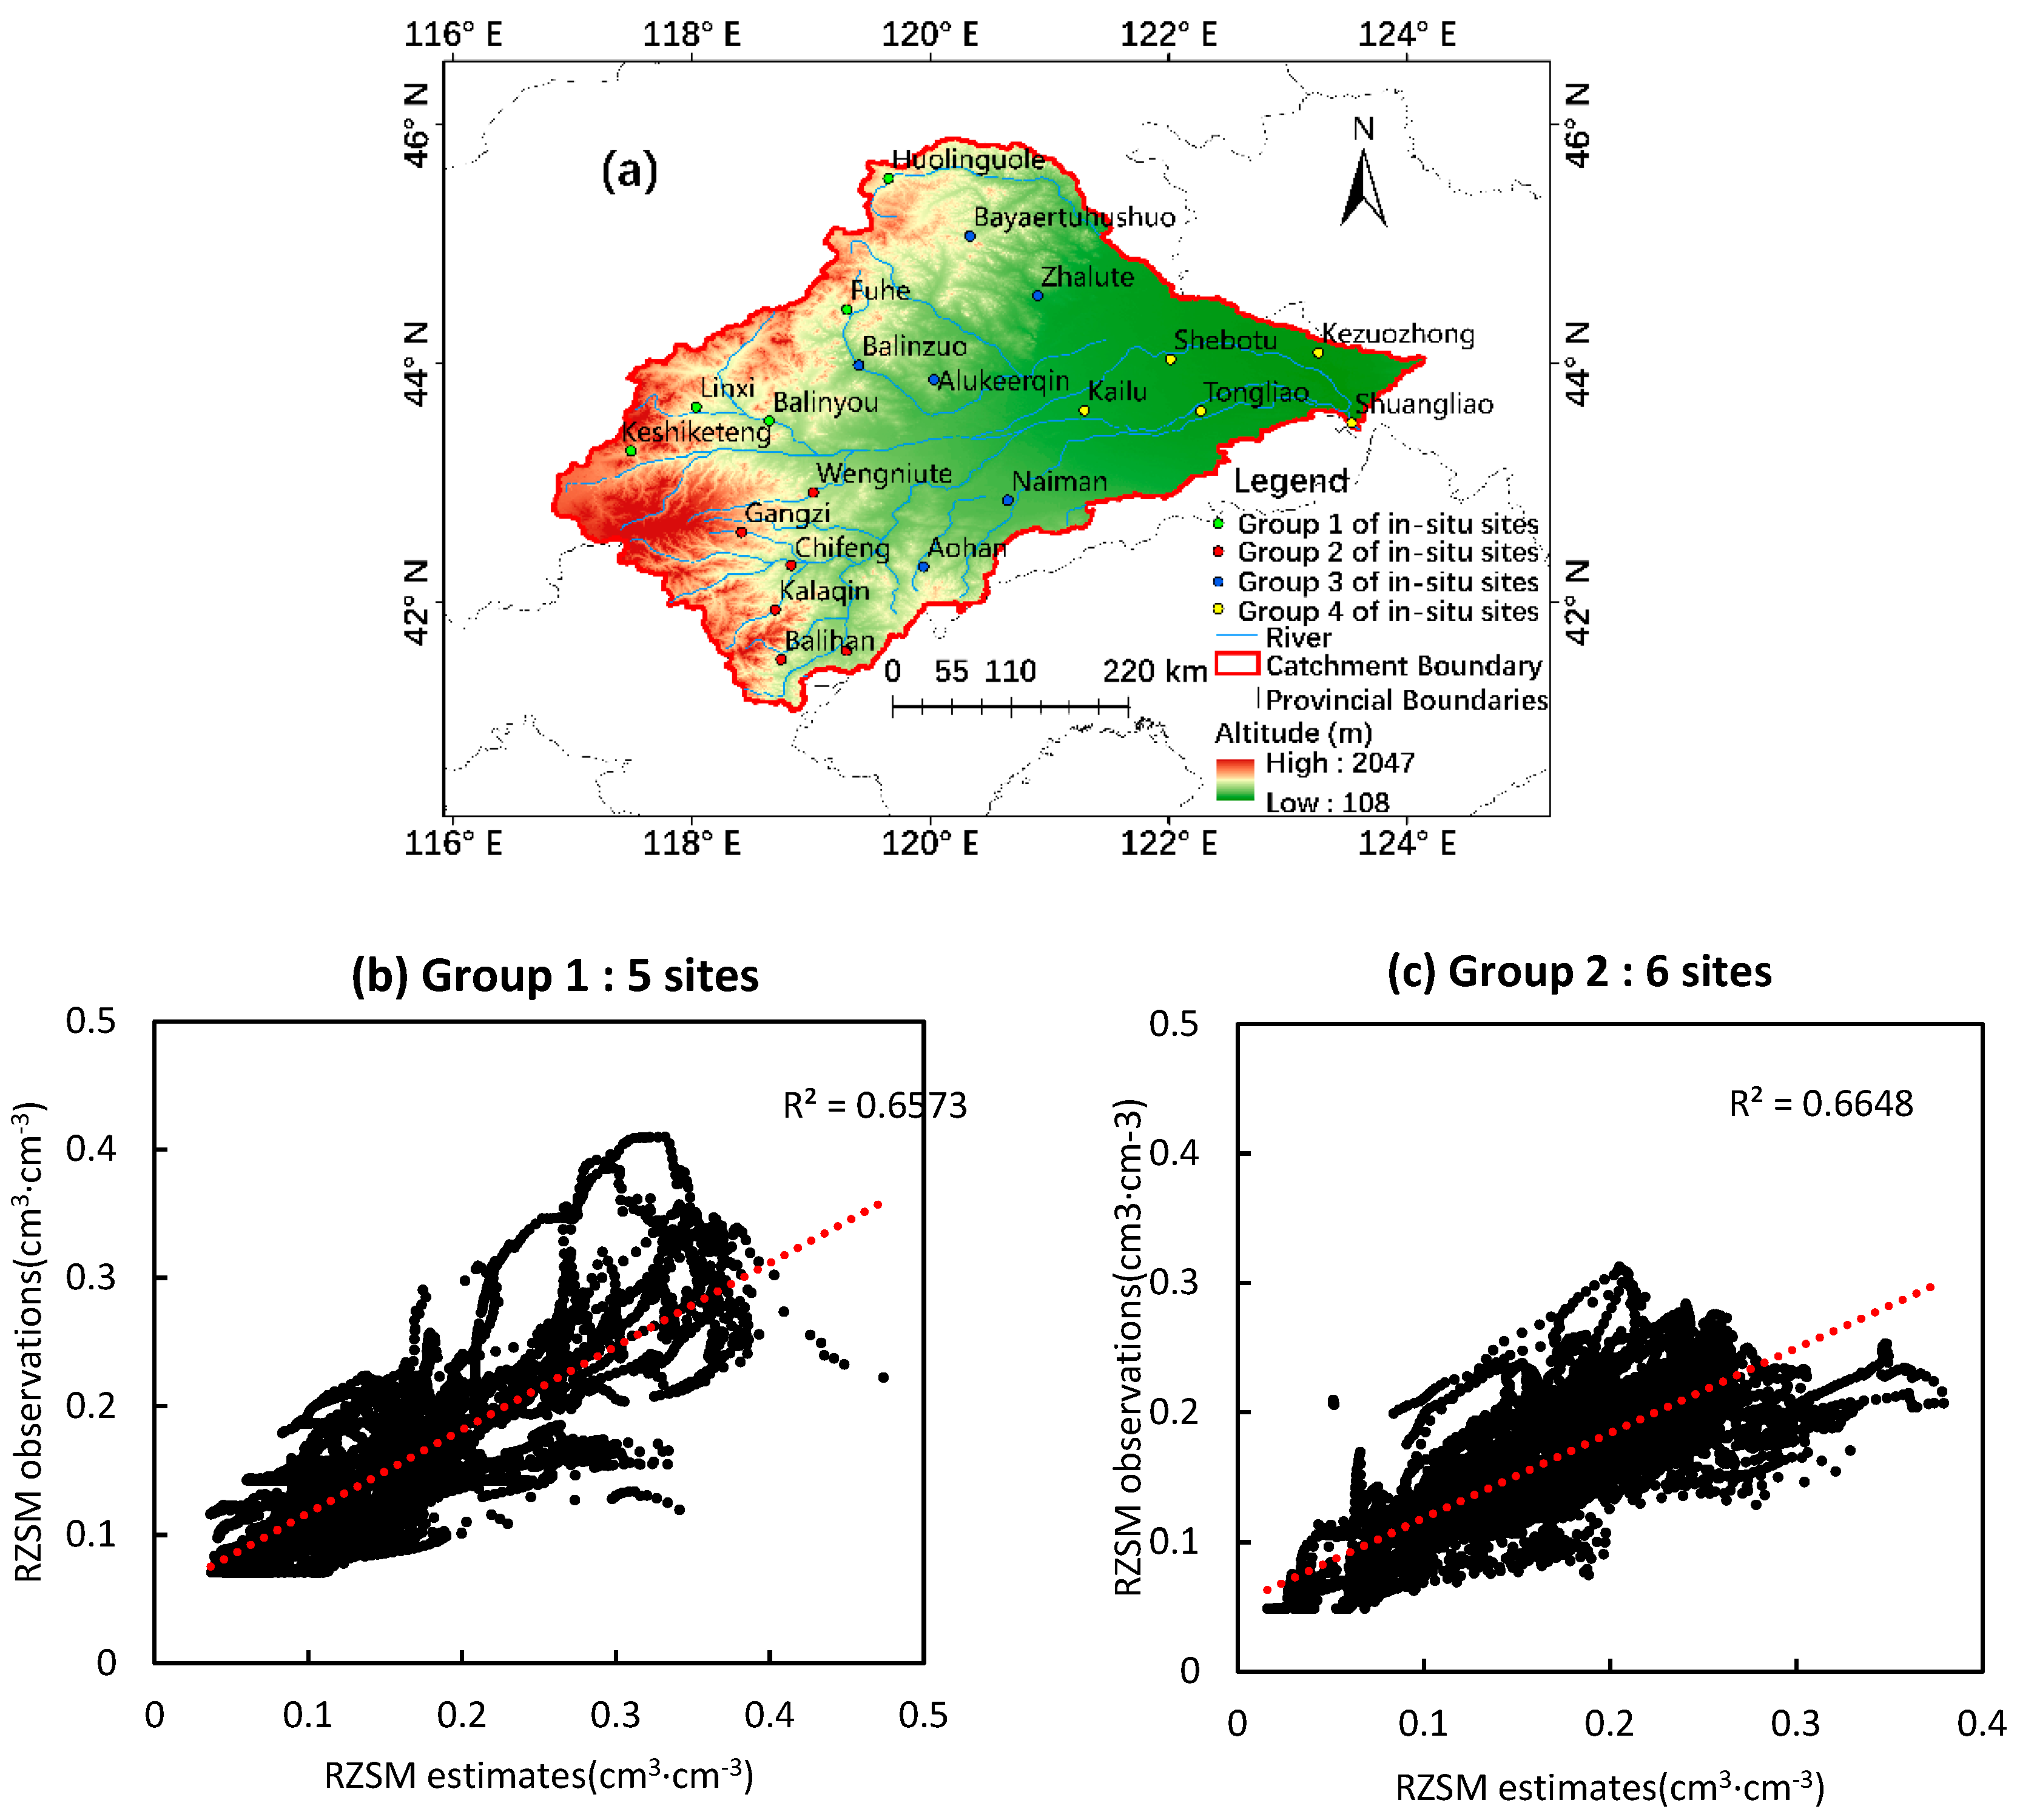
2.1. Study Area

The Xiliaohe River Basin lies in the northeastern part of China, located between latitudes 41°05′ and 45°13′N and longitudes 116°32′ and 123°30′E (Figure 1). It has an area of 13.6 × 10⁴ km2 and an average elevation of 800 m (around 476–2150 m). The main stream and tributaries in the basin include the Xiliao River, Xinkai River, Laoha River, Xilamulun River and so on (Figure 1). The river flows from west to east and finally into the Liaohe River. The basin is an arid and semi-arid region with an average annual precipitation of less than 400 mm, mostly concentrated in June, July and August. Generally, the growing and nongrowing seasons of the Xiliaohe River Basin are from April to October and from November to March, respectively.

2.2. In Situ Soil Moisture Data

Volumetric soil water content data observed at 22 soil moisture sites (Figure 1) across the Xiliaohe River Basin from 2015 to 2020 were obtained from the China Meteorological Administration (CMA). The data were measured every hour at five depths: 10 cm, 20 cm, 30 cm, 40 cm, 50 cm and 60 cm. To align the temporal resolution and depth of the data with the SMAR model, the hourly data was averaged arithmetically for the daily data, and the initial soil water contents at depths of 20 cm, 30 cm, 40 cm, 50 cm and 60 cm were averaged arithmetically to represent the soil moisture in the root-zone soil layer.

2.3. Remote Sensing Soil Moisture Data

The soil moisture dataset produced by the Climate Change Initiative (CCI) of the European Space Agency (ESA) (ESA CCI SM) was used in this study as the surface soil moisture that was input into the SMAR model. ESA CCI SM data products are integrated with microwave sensor data products from different sources, thus integrating the advantages of both active (radar) and passive (radiometer) microwave remote sensing sensor data products. There are three clusters of soil moisture products, including the merged active (ESA CCI SM A), the merged passive (ESA CCI SM P) and the combined microwave product (ESA CCI SM C). The combined version 06.1 SM dataset with a 0.25° (~25 km) resolution and volumetric measurement unit of m3/m3 was used in this study. The temporal range of the daily SM was from 2013 to 2020. Data gaps in the original ESA CCI SM dataset were filled with the ODCT-PLS method [22].

2.4. Soil, Meteorological and Vegetation Datasets

Previous studies have confirmed that soil textural fractions, bulk density, porosity, elevation and slope are relevant to soil water movement properties and can be used to deduce SMAR model parameters [16]. Nevertheless, meteorological conditions, vegetation cover and potential evapotranspiration (PET) are also of great importance for predicting regional SMAR parameters by influencing root zone water loss and infiltration. Therefore, in this study, soil, meteorological and vegetation characteristics in the study area were used to predict the spatial SMAR parameters.
Soil parameters include soil texture (sand, silt and clay fractions) with the unit of g/kg; porosity (por), field capacity (fc), wilting point (pw) water content, saturated water content (ths) and residual water content (thr) with the unit of cm3/cm3; saturated hydraulic conductivity (ks) with the unit of cmd−1; and bulk density (bd) with the unit of g/cm3. The sand in the soil is defined as soil particles whose diameters are between 0.05 mm and 2 mm, the silt is defined as soil particles whose diameters are between 0.002 mm and 0.05 mm and the clay is defined as soil particles whose diameters are less than 0.002 mm. The original data included the soil properties of soil layers at depths of 0–5 cm, 5–15 cm, 15–30 cm, 30–60 cm, 60–100 cm and 100–200 cm. The data from the 0–5 cm depth were utilized to represent the ‘near-surface’ soil property, and the data from the 5–15 cm, 15–30 cm, 30–60 cm and 60–100 cm depths were averaged to represent the ‘root zone’ soil property.
The climatology characteristic data was from the National Earth System Science Data Center (http://www.geodata.cn/), including the daily precipitation (prec), with the unit of mm/d; the daily maximum temperature (maxt), with the unit of °C; the daily minimum temperature (mint), with the unit of °C; the daily average cloud cover (cld), with the unit of %; the daily relative humidity (rh), with the unit of %; the daily sunshine duration (ssh), with the unit of hour; and the daily wind speed (wnd), with the unit of m/s. The original daily data were averaged into mean annual climatology characteristic data. In addition, the mean annual potential evapotranspiration (pet) was calculated using the Penman equation [23] to reflect the mean annual water loss of the root layer.
The normalized difference vegetation index (NDVI) was also included as a predictor. It was calculated using the surface reflectance in the red band and near-infrared band from the moderate-resolution imaging spectroradiometer (MODIS) product MOD09GA, with a spatial resolution of 500 m. The NDVI calculation formula is as follows:
N D V I = N I R R N I R + R
where NIR and R are the reflectance values in the near-infrared band and red band, respectively.

2.5. Soil Moisture Analytical Relationship (SMAR) Model

The SMAR model hypothesized that the soil is composed of a surface layer with a depth of 0–5 cm and a root zone layer with a depth of 5–100 cm, and estimated RZSM from SSM by linking them on the basis of the soil water balance equation in the root zone layer; the specific formulas can be found in previous studies [11,16,24,25]. It is a general assumption that satellite-based soil moisture, which is a few centimeters below the land surface, can be representative of SSM in the SMAR model [21]. There are four parameters that control the surface soil water infiltration and root layer soil water loss processes hypothesized by the SMAR model that need to be calibrated to estimate RZSM, including the relative saturation of the root zone layer’s wilting water content ( s w 2 ), the relative saturation of the surface layer’s field capacity ( s c 1 ), the ‘water loss efficiency’ in the root zone layer ( a ) and the ‘diffusion efficiency’ from the surface layer to the root zone layer ( b ) [16]. Parameters s w 2 , s c 1 , a and b can be obtained by optimization or estimated from the soil texture, the soil depth and the soil water losses.

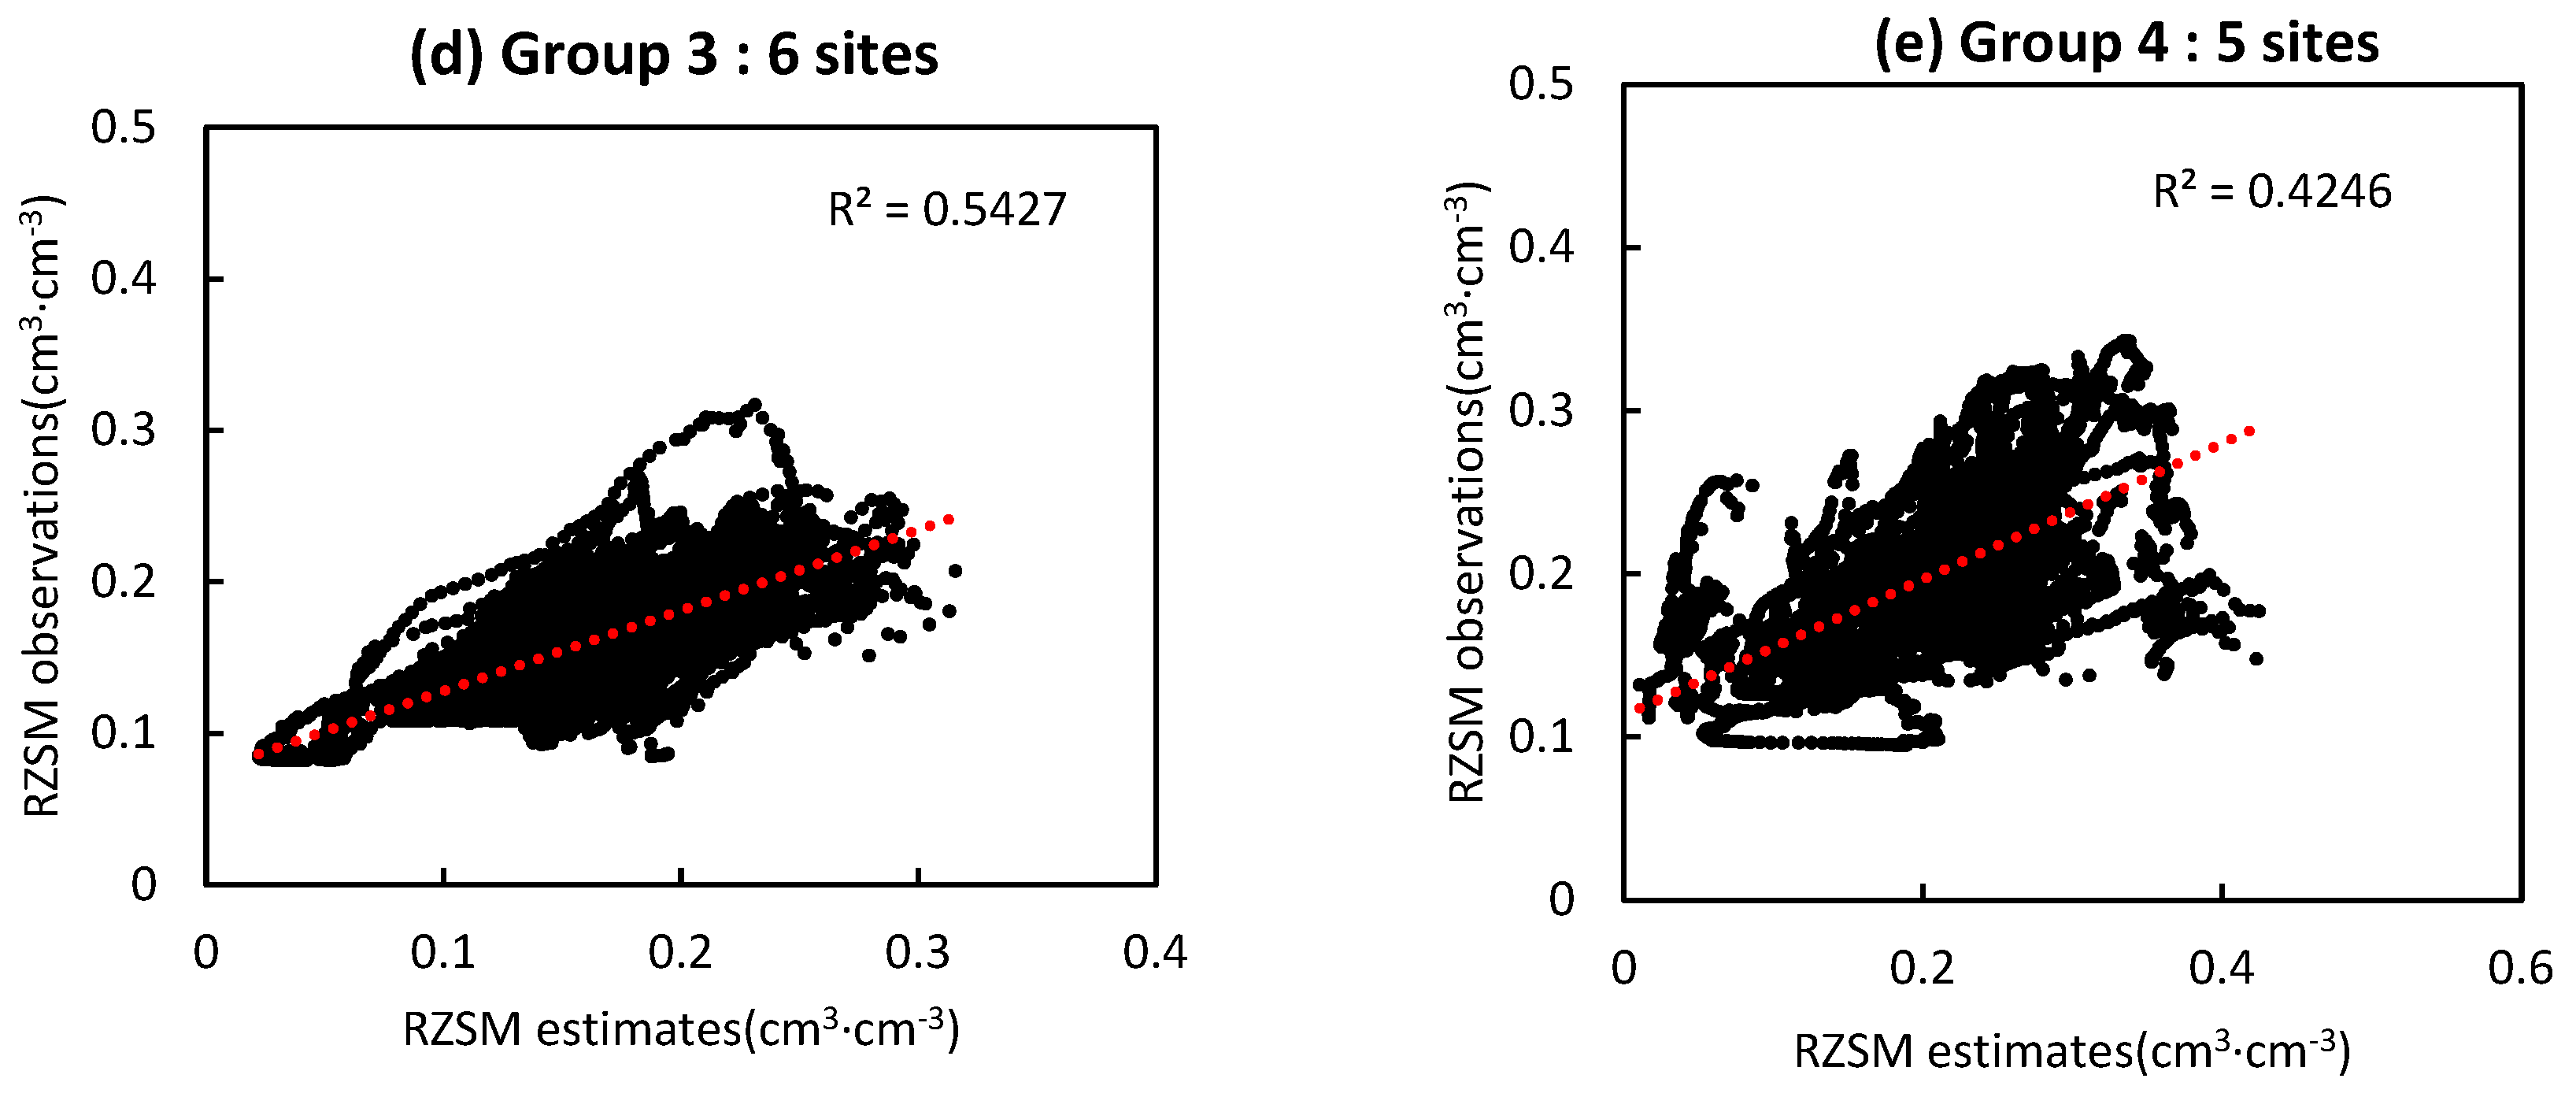
2.6. Calibration and Validation of the SMAR Model

In this study, the genetic algorithm (GA) was utilized for SMAR calibration, with satellite SSM and in situ RZSM involved as input data and output results, respectively. The GA is a global optimization algorithm based on the law of survival of the fittest. The main idea of the GA is as follows: use the randomly initialized population to represent the solution space of the problem to be optimized; use the fitness of individual chromosomes in the population to represent the objective function value of the solution; generate new individuals to form the offspring through selection, crossover and mutation; keep repeating the previous step until the fitness of the population changes less than a threshold or reaches the maximum number of iterations; then the individual in the population with the greatest fitness is considered the optimal solution to the problem.
In this study, there are four parameters (a, b, sw2, sc1) that need to be optimized, of which sw2 and sc1 are related not only to the input (SSM) and output (RZSM) data of the SMAR model but also to the corresponding in situ values, sw2_o and sc1_o. In addition, experiments have shown that the variation in b has a significant effect on the regional SMAR performance. Given that, the fitness function of the GA to be minimized is as follows:
F a , b , s w 2 , s c 1 = i = 1 n y i S M A R i a , b , s w 2 , s c 1 2 + λ s w 2 s w 2 _ o 2 + λ s c 1 s c 1 _ o 2 + λ b 2
This fitness function contains the root mean square error between the in situ RZSM and the estimated RZSM, the sum of squares of the residuals of s w 2 and s c 1 and the L2 norm of b . In Equation (2), n is the number of days at each station when the in situ RZSM and estimated RZSM are both available, and i is the serial number of the time series. y i is the ith RZSM in situ, and S M A R i is the ith RZSM estimated by the SMAR. a , b , s w 2 , s c 1 are the SMAR parameters that need to be optimized. s w 2 _ o and s c 1 _ o are in situ physical values of s w 2 and s c 1 . λ is a hyperparameter that determines to what extent s w 2   and   s c 1 are influenced by the corresponding in situ physical values ( s w 2 _ o   a n d   s c 1 _ o ), and b is penalized for being too large. An upper bound of 1 and a lower bound of 0 were applied to a and b according to the practical meaning of these parameters. Time-series data at all stations was used for the calibration and validation of the SMAR model.
The root mean square error (RMSE), correlation coefficient (R) and bias were used to quantitatively evaluate the performance of the RZSM estimates. These indices were calculated using the following equations:
R M S E = i = 1 n P i O i 2 n
R = i = 1 n P i P ˉ O i O ˉ i = 1 n P i P ˉ 2 i = 1 n O i O ˉ 2
b i a s = O ¯ i = 1 n P i n
where P i and O i are the predicted and observed daily RZSM at time step i, respectively, and P ¯ and O ¯ are the means of the predicted and observed daily RZSM, respectively. n is the total number of predictions. If the SMAR model underestimates the RZSM on average, the result of Equation (4) will be positive, and it will be negative if the SMAR model overestimates the RZSM on average. We evaluated the RMSE for model performance across the whole year and evaluated the bias for the whole year, the growing season (April to October) and the nongrowing season (November to March of the following year) of the study area.

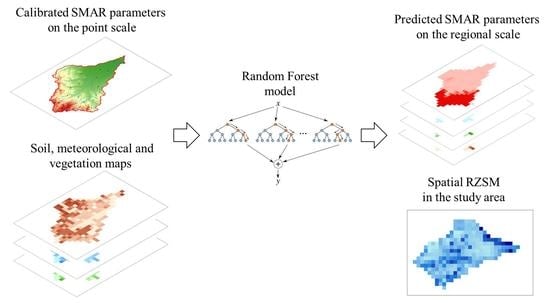
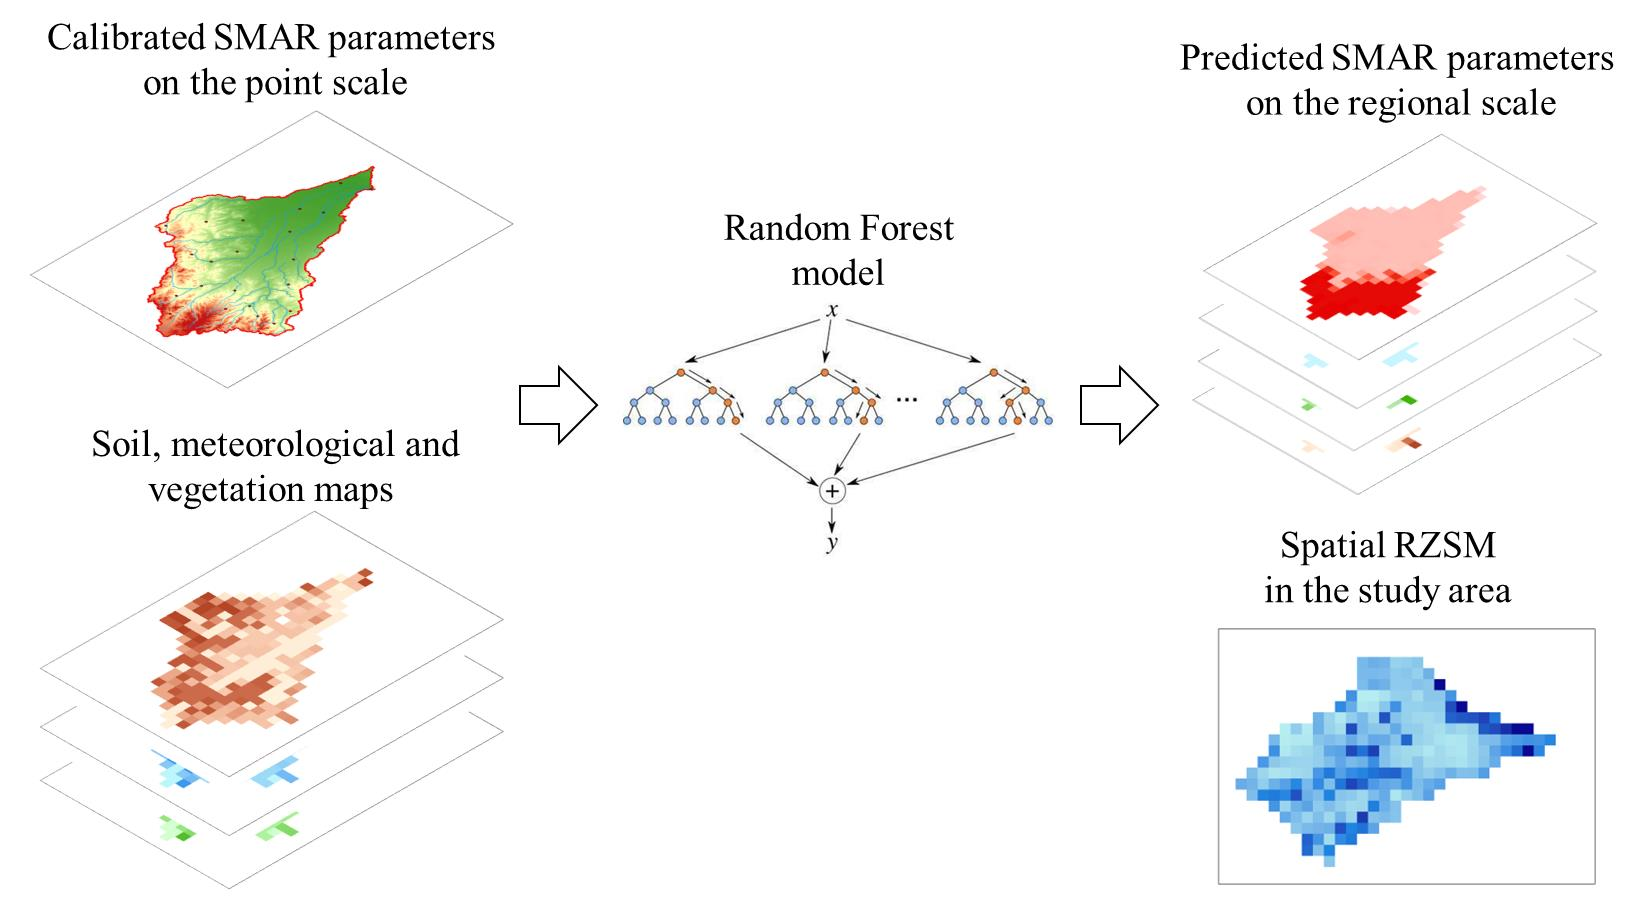
2.7. Regionalizing SMAR Model Parameters with the Random Forest Method

In this study, the random forest (RF) regression model is established to regionalize SMAR parameters based on soil, meteorological and vegetation maps. RF is an ensemble method that grows a collection of decision trees and takes the average value of all trees as the final result. The ‘random’ means that the subsamples for training are bootstrapped from the original samples and that predictors are randomly selected when splitting each node in a decision tree, which largely reduces the probability of overfitting [26]. Moreover, it provides an analysis of the importance of each predictor variable. Therefore, in this study, we used the RF method to regionalize the SMAR parameters.
The RF regression model was established using the SMAR parameters (a, b, sw2, sc1) and the soil, climatic and vegetation characteristics of the 22 sites. Correspondingly, the importance of each predictor was calculated, and the model was re-established by eliminating the predictors that showed negative importance until all predictors showed positive importance. Finally, with the established regression model and resampled 25 km spatial resolution maps of the soil, climatic and vegetation variables covering the XLH River Basin, the SMAR parameters were predicted at each grid cell, and four maps of the SMAR parameters with a 25 km resolution were obtained.

3. Results

3.1. Calibration of SMAR Parameters with a Genetic Algorithm

SMAR parameters at pixels where in-situ sites were located, including a, b, sw2 and sc1, were optimized and calibrated using a GA by searching for the minimum value of the fitness function (Formula (2)) with satellite remote sensing SSM observations as known inputs and in-situ RZSM measurements as known outputs. The parameters optimized by the GA (Table 1) are used as the calibrated SMAR parameters on the pixel scale. As the RMSE and correlation R between the RZSM measurements and the RZSM estimated by the calibrated SMAR model (Figure 2) showed, SMAR on the pixel scale can obtain effective estimations of RZSM. There were 21 pixels out of 22 where the RZSM estimations met the RMSE benchmark from NASA of 0.06 cm3·cm−3, and 18 pixels where the correlation R between measurements and estimates was more than 0.5, indicating relatively close agreement between estimations and measurements.
Figure 3a–c reveals the measured and estimated RZSM at 3 in-situ sites, including the Shebotu site, the Huolinguole site and the Wengniute site. It is shown that the model could capture the variation tendency of time series of RZSM with RMSE < 0.06 cm3·cm−3 but tended to miss some extremely dry and wet events or conditions of RZSM, especially at the Shebotu site and the Wengniute site. At the Huolinguole site, SMAR tended to underestimate the RZSM during wet periods and to overestimate the RZSM during dry periods throughout the whole year.

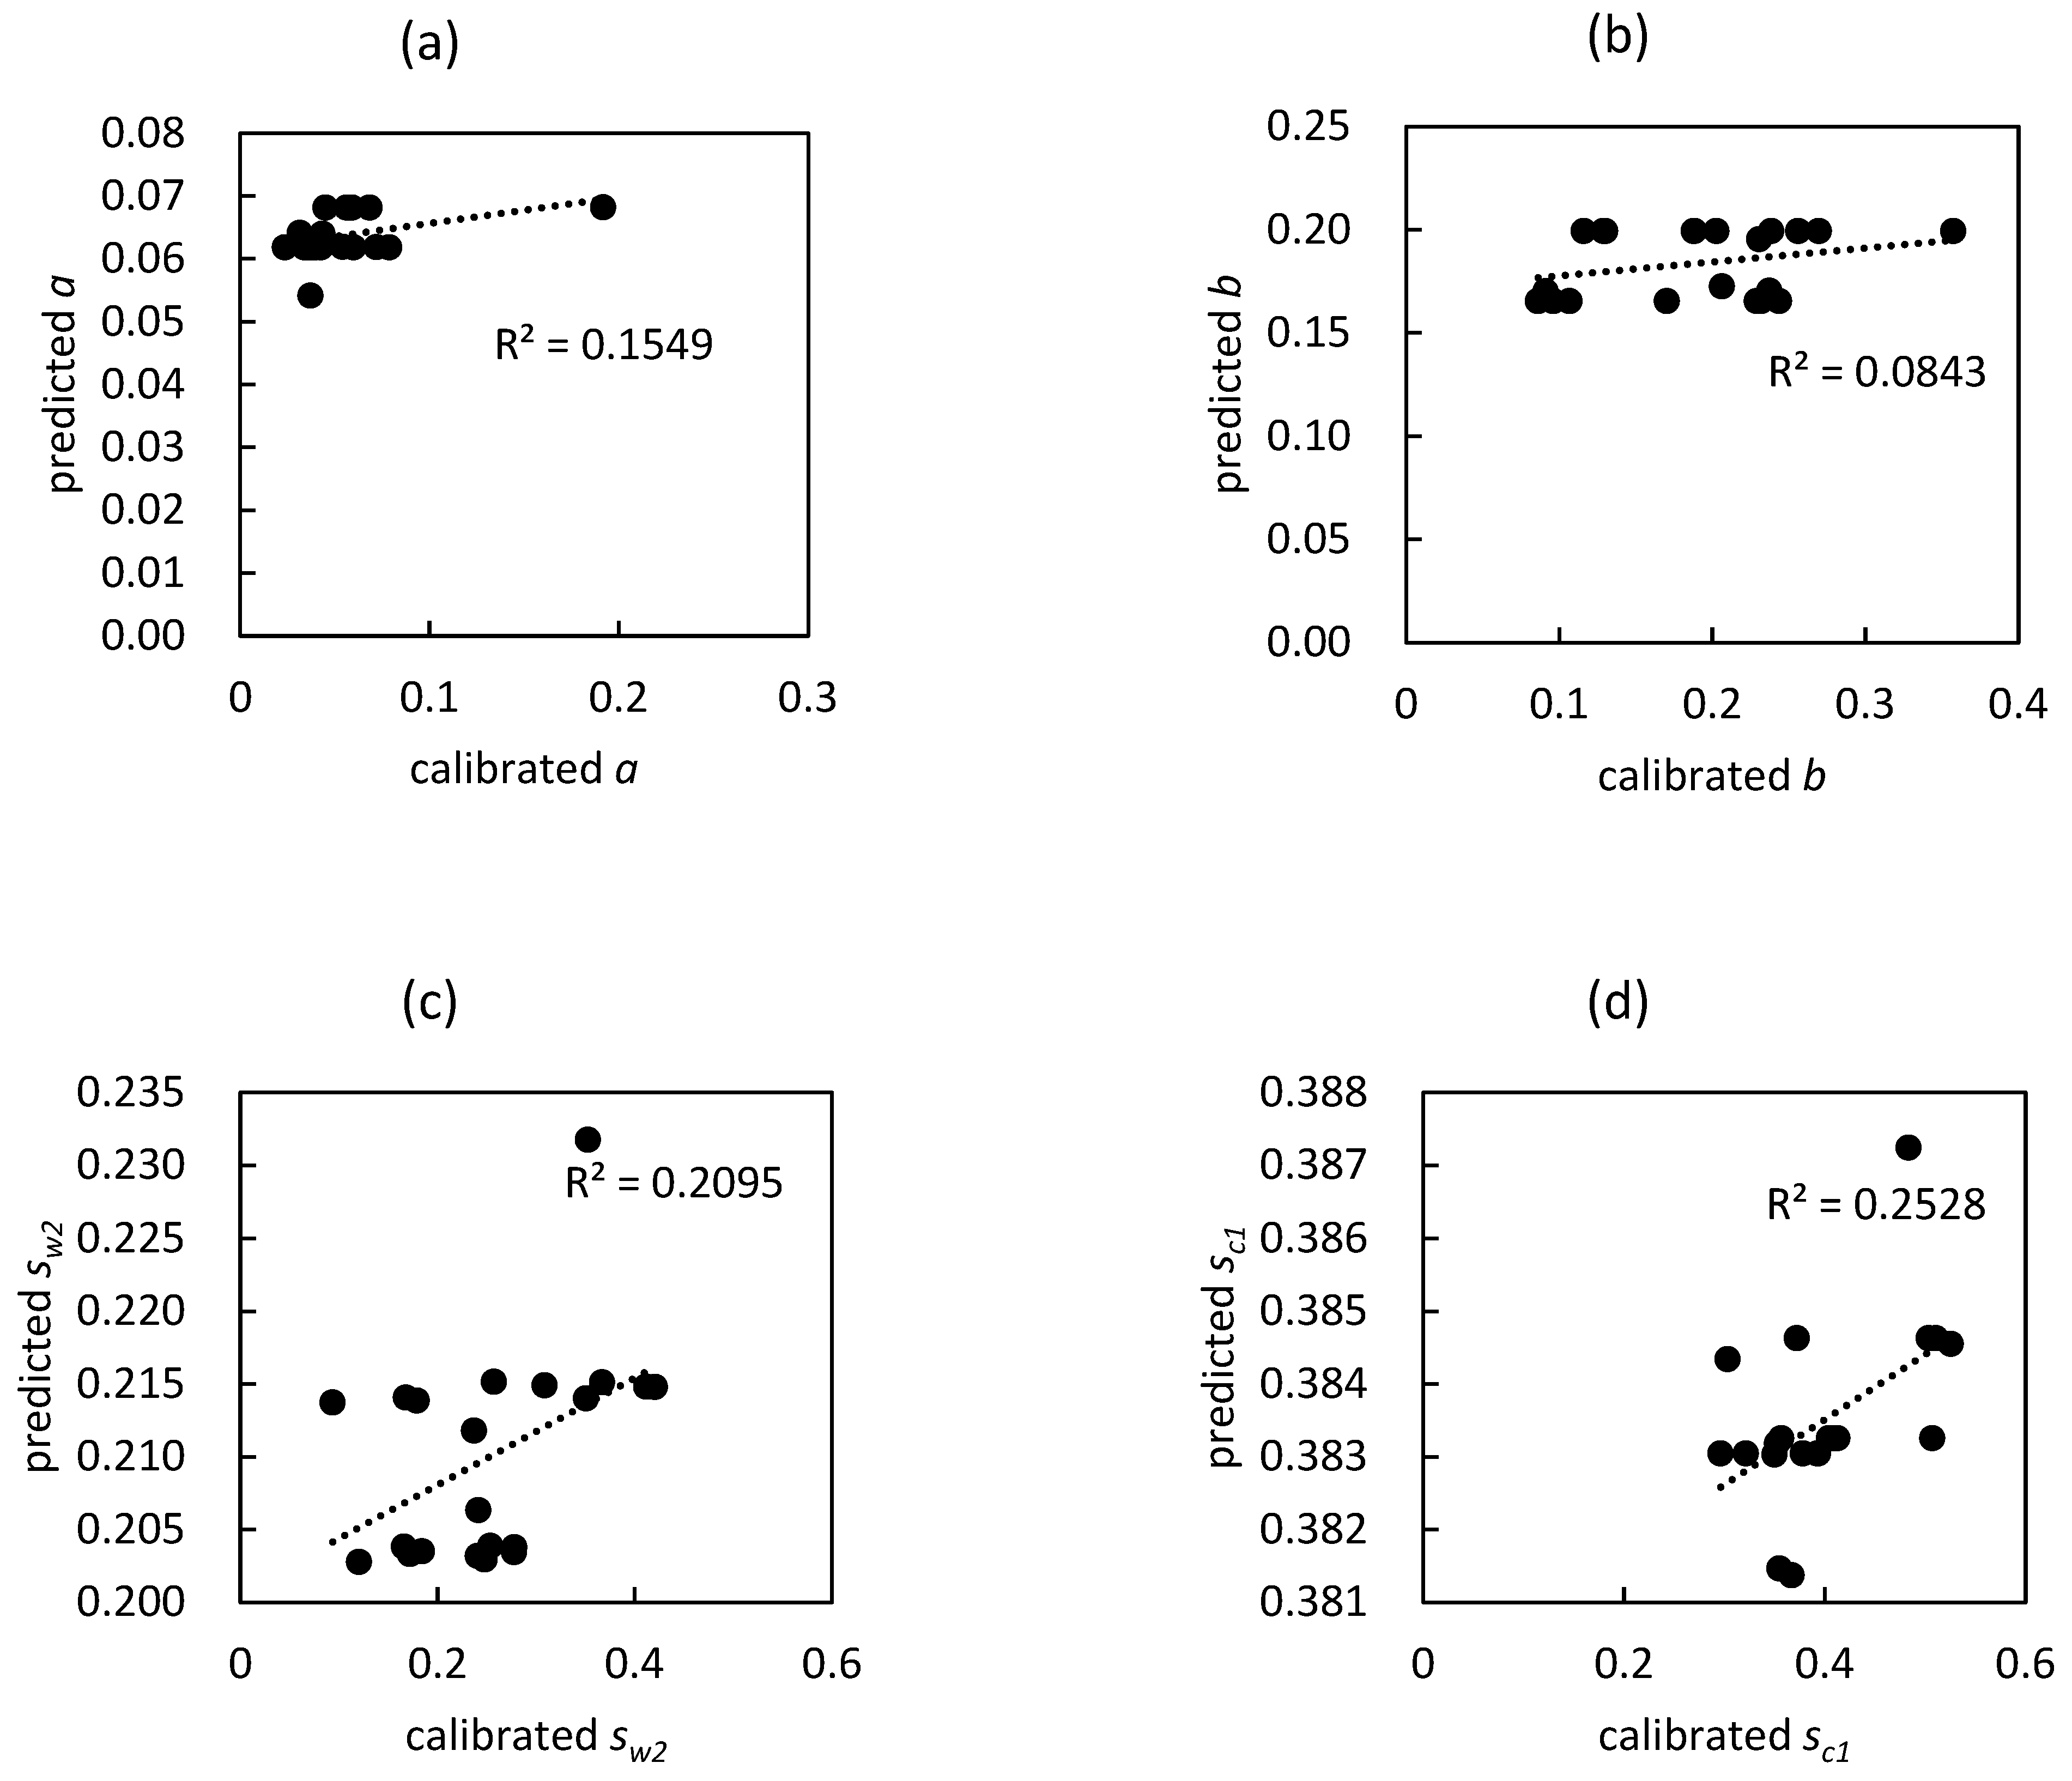
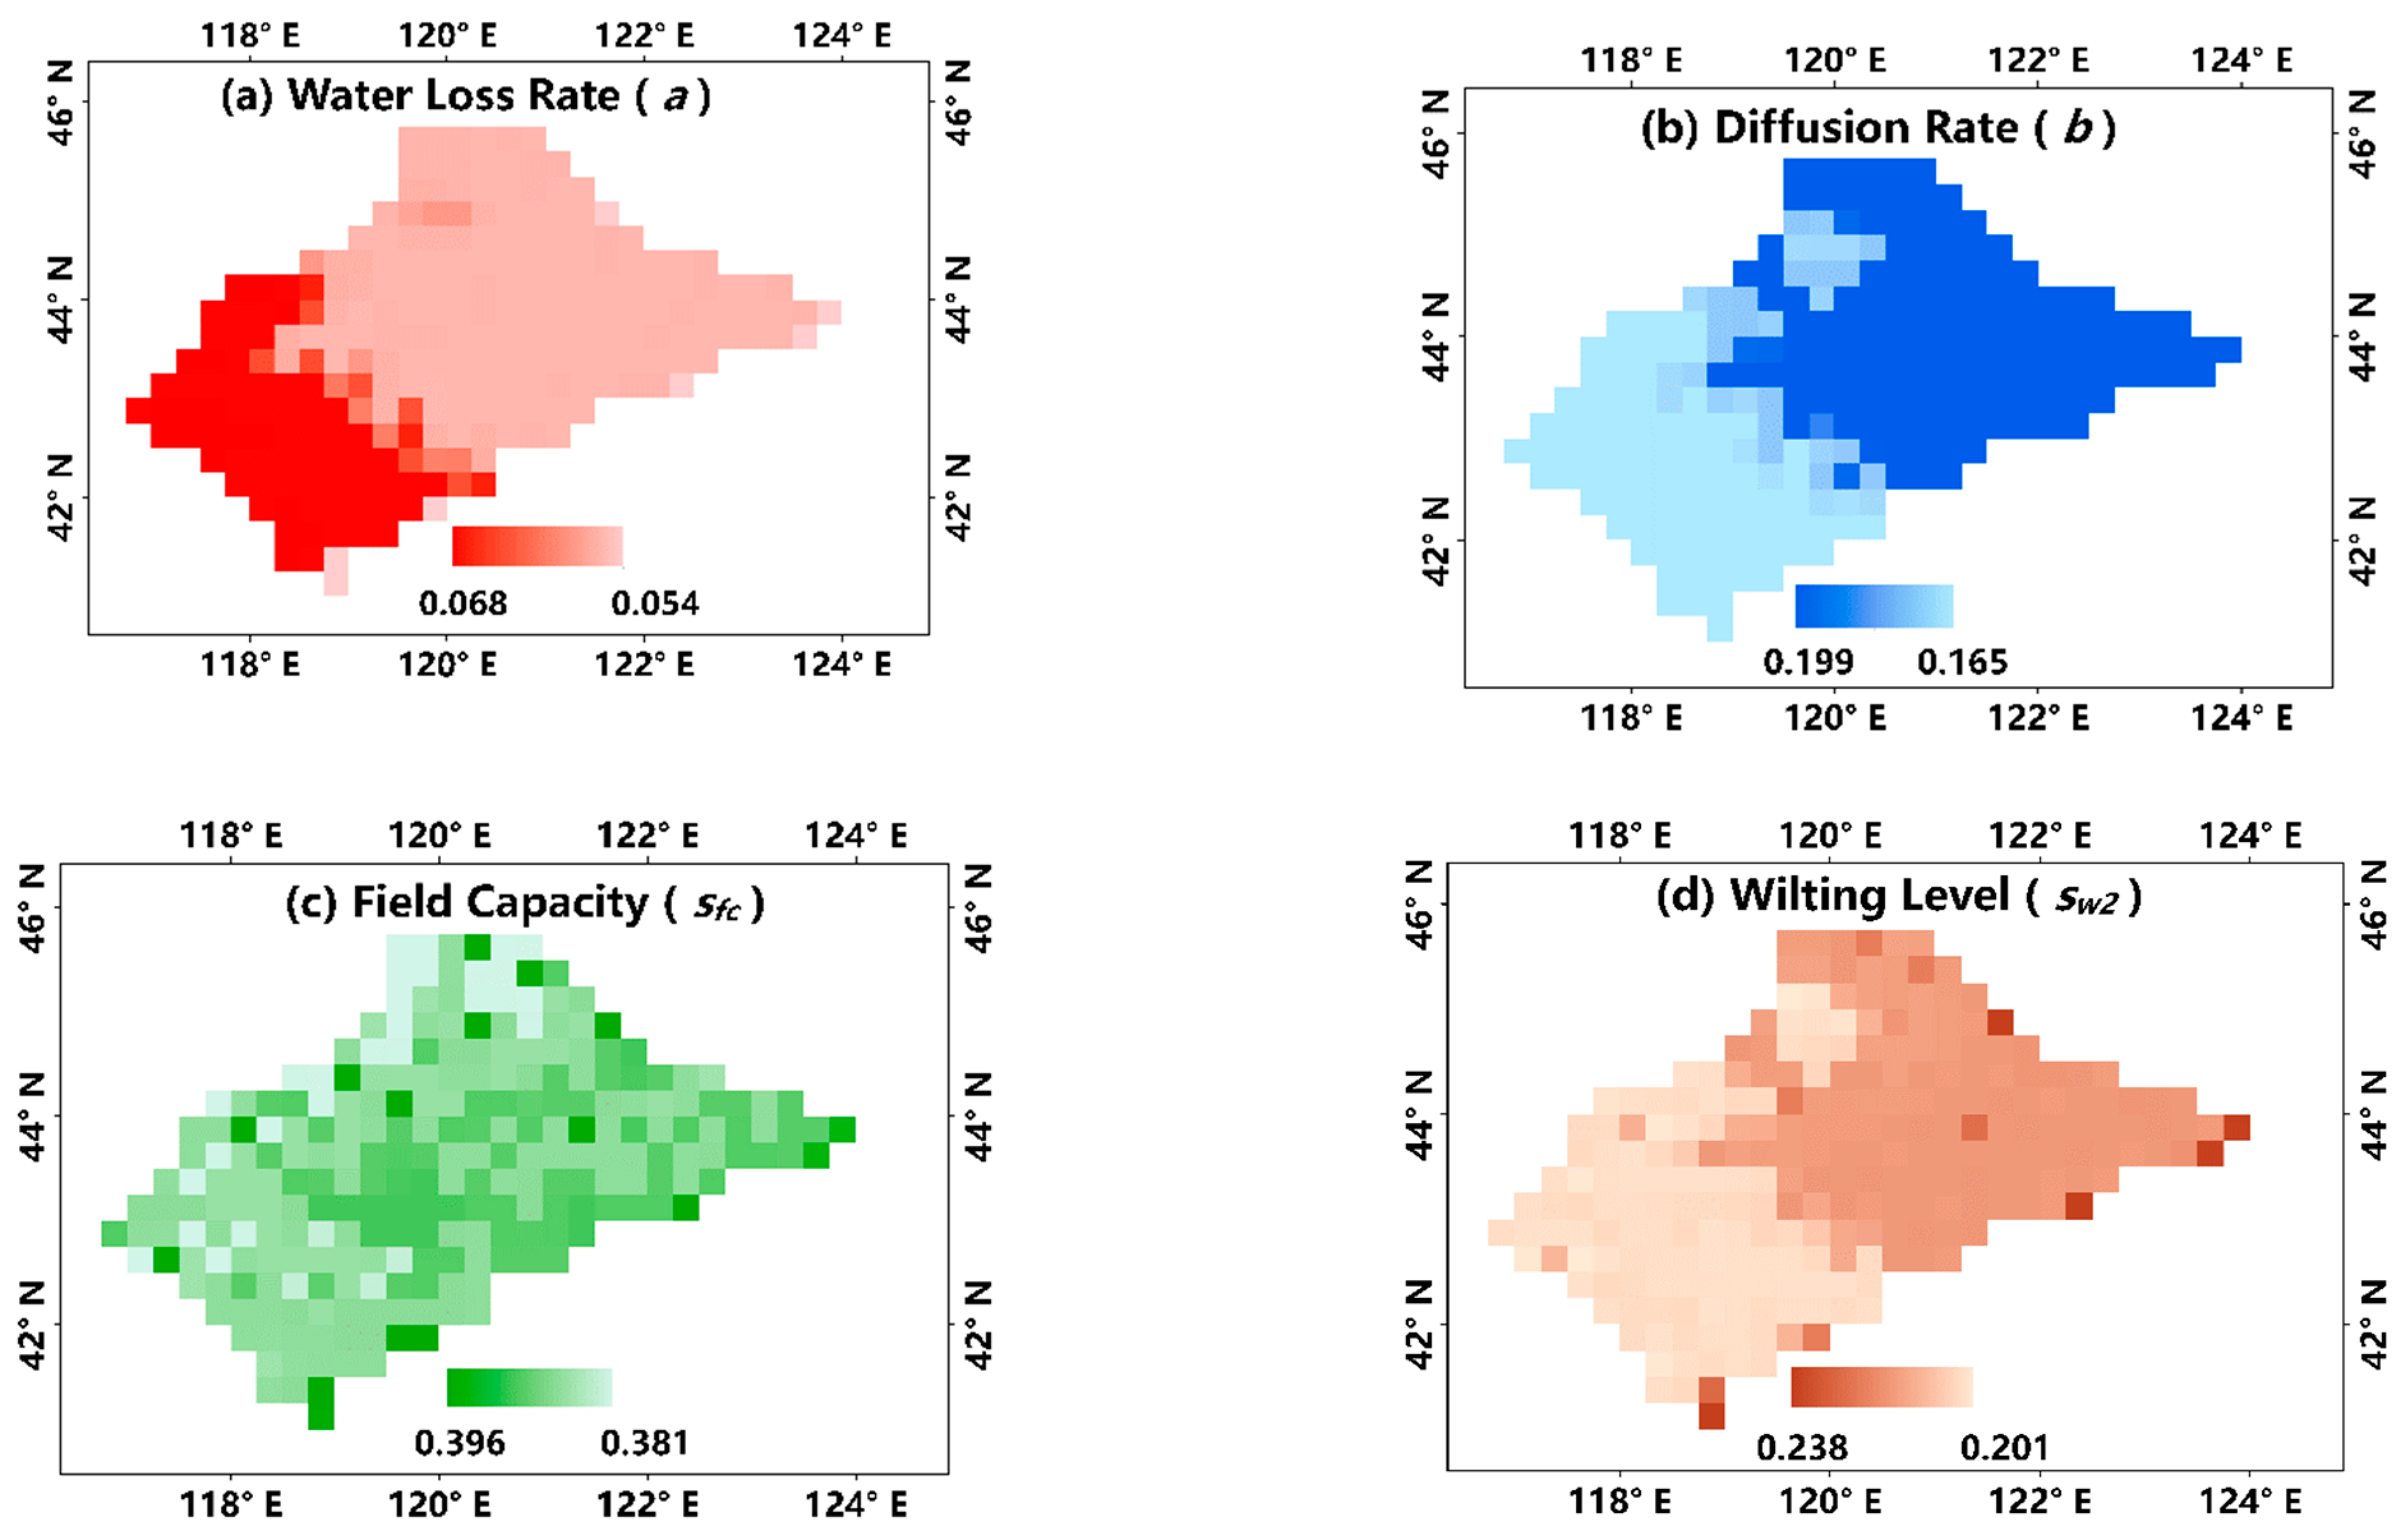
3.2. Regionalization of SMAR Parameters with the Random Forest Method

After obtaining the calibrated SMAR parameters at pixels where in-situ stations are located, SMAR parameters at all pixels in the study area are estimated by the RF regression method with the use of soil, climate and vegetation variables. Samples from 21 sites were used to train the RF model, with the exception of the Kailu site, which exceeded NASA’s baseline (0.06 cm3·cm−3).
Figure 4 shows the comparison of the calibrated parameters and the predicted parameters from the RF model. It seems that the RF model tended to “homogenize” the parameters, and the predicted parameters were generally around the median value of the calibrated parameters. Notably, the effectiveness of the RF model was determined mainly by the accuracy of the SMAR model with the predicted parameters, which will be indicated in Section 3.3.
The regional SMAR parameter maps derived from the RF model revealed some special patterns for a, b, sc1 and sw2 (Figure 5a–d). The water loss rate (a) tended to be high in the southwest part of the region, covering the overlay area of high altitude and relatively high saturated water content in root-zone soil. The diffusion rate (b) and relative wilting level (sw2) values were consistently high in the central and eastern areas of the region where the pronounced soil in the root zone is loam, sandy loam and sandy soil, and relatively low in the southwestern part of the region where the pronounced soil in the root zone is silty loam. The distribution of b is consistent with previous research results, i.e., the soil infiltration rate in typical desert areas of China gradually decreases from east to west and from semi-arid areas to arid areas [27]. The relative near-surface field capacity (sc1) showed no obvious spatial heterogeneity. Generally, the rougher the texture of the near-surface soil is, the higher the near-surface field capacity (sc1) will be.

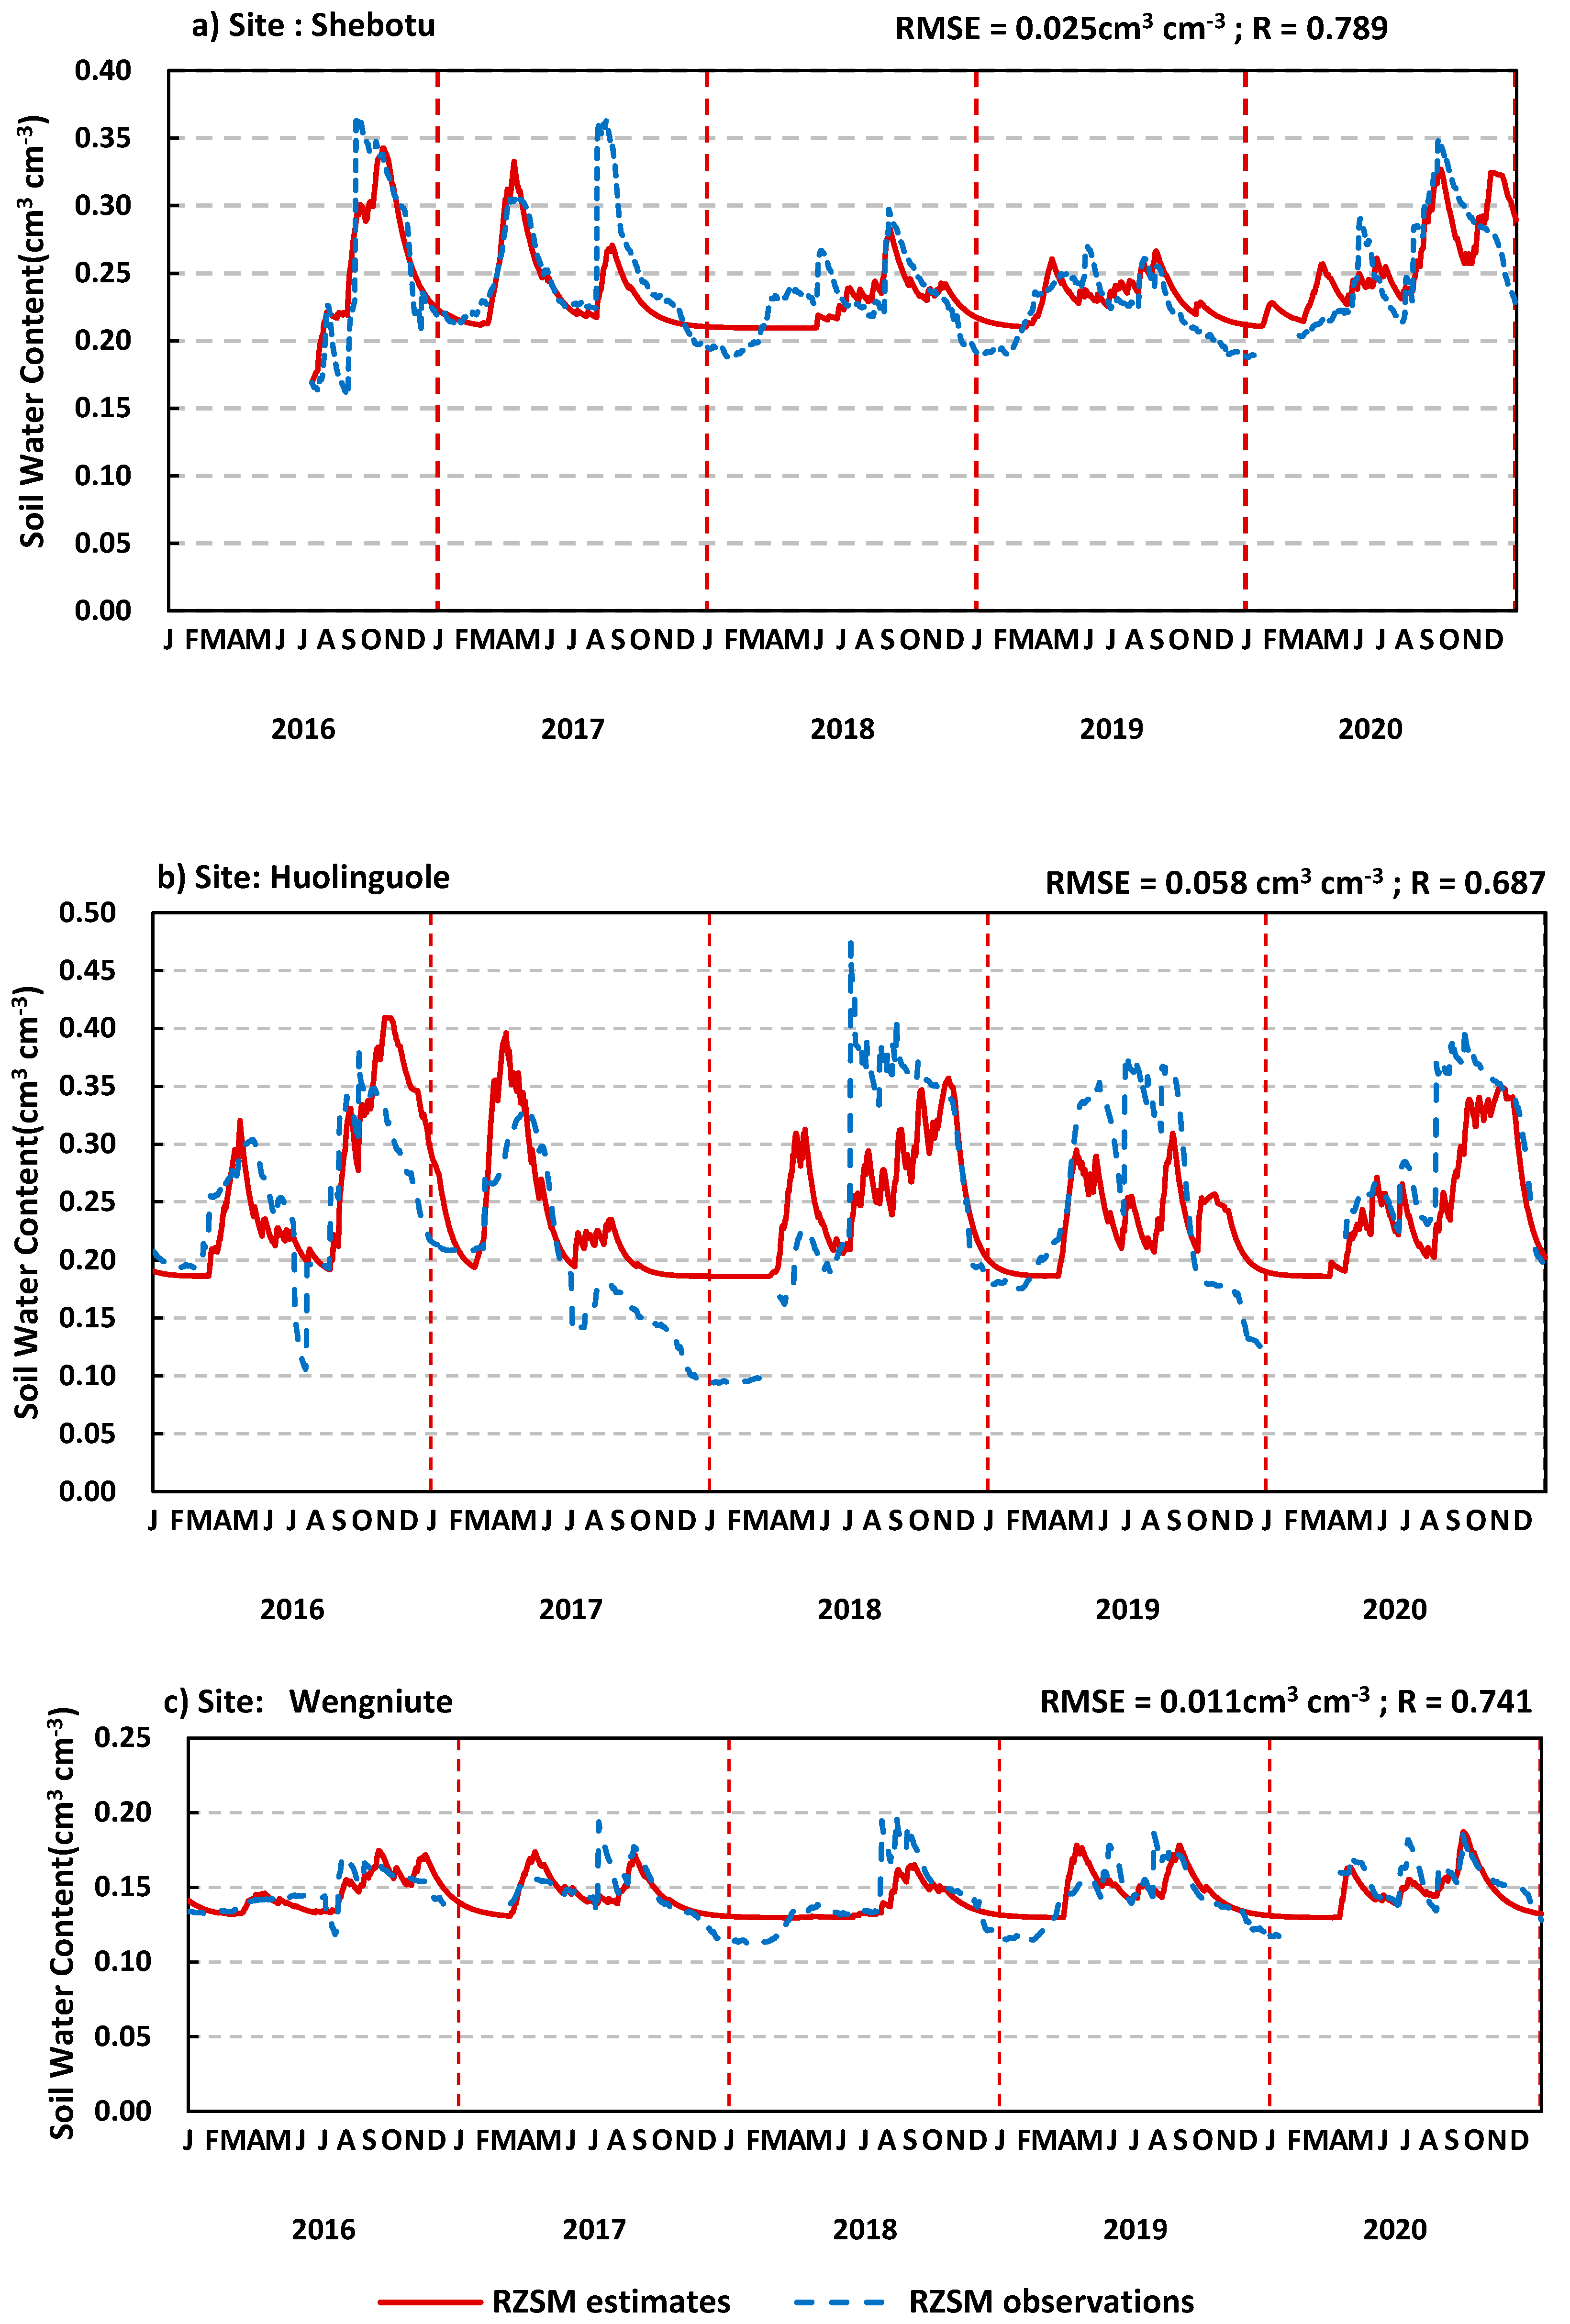
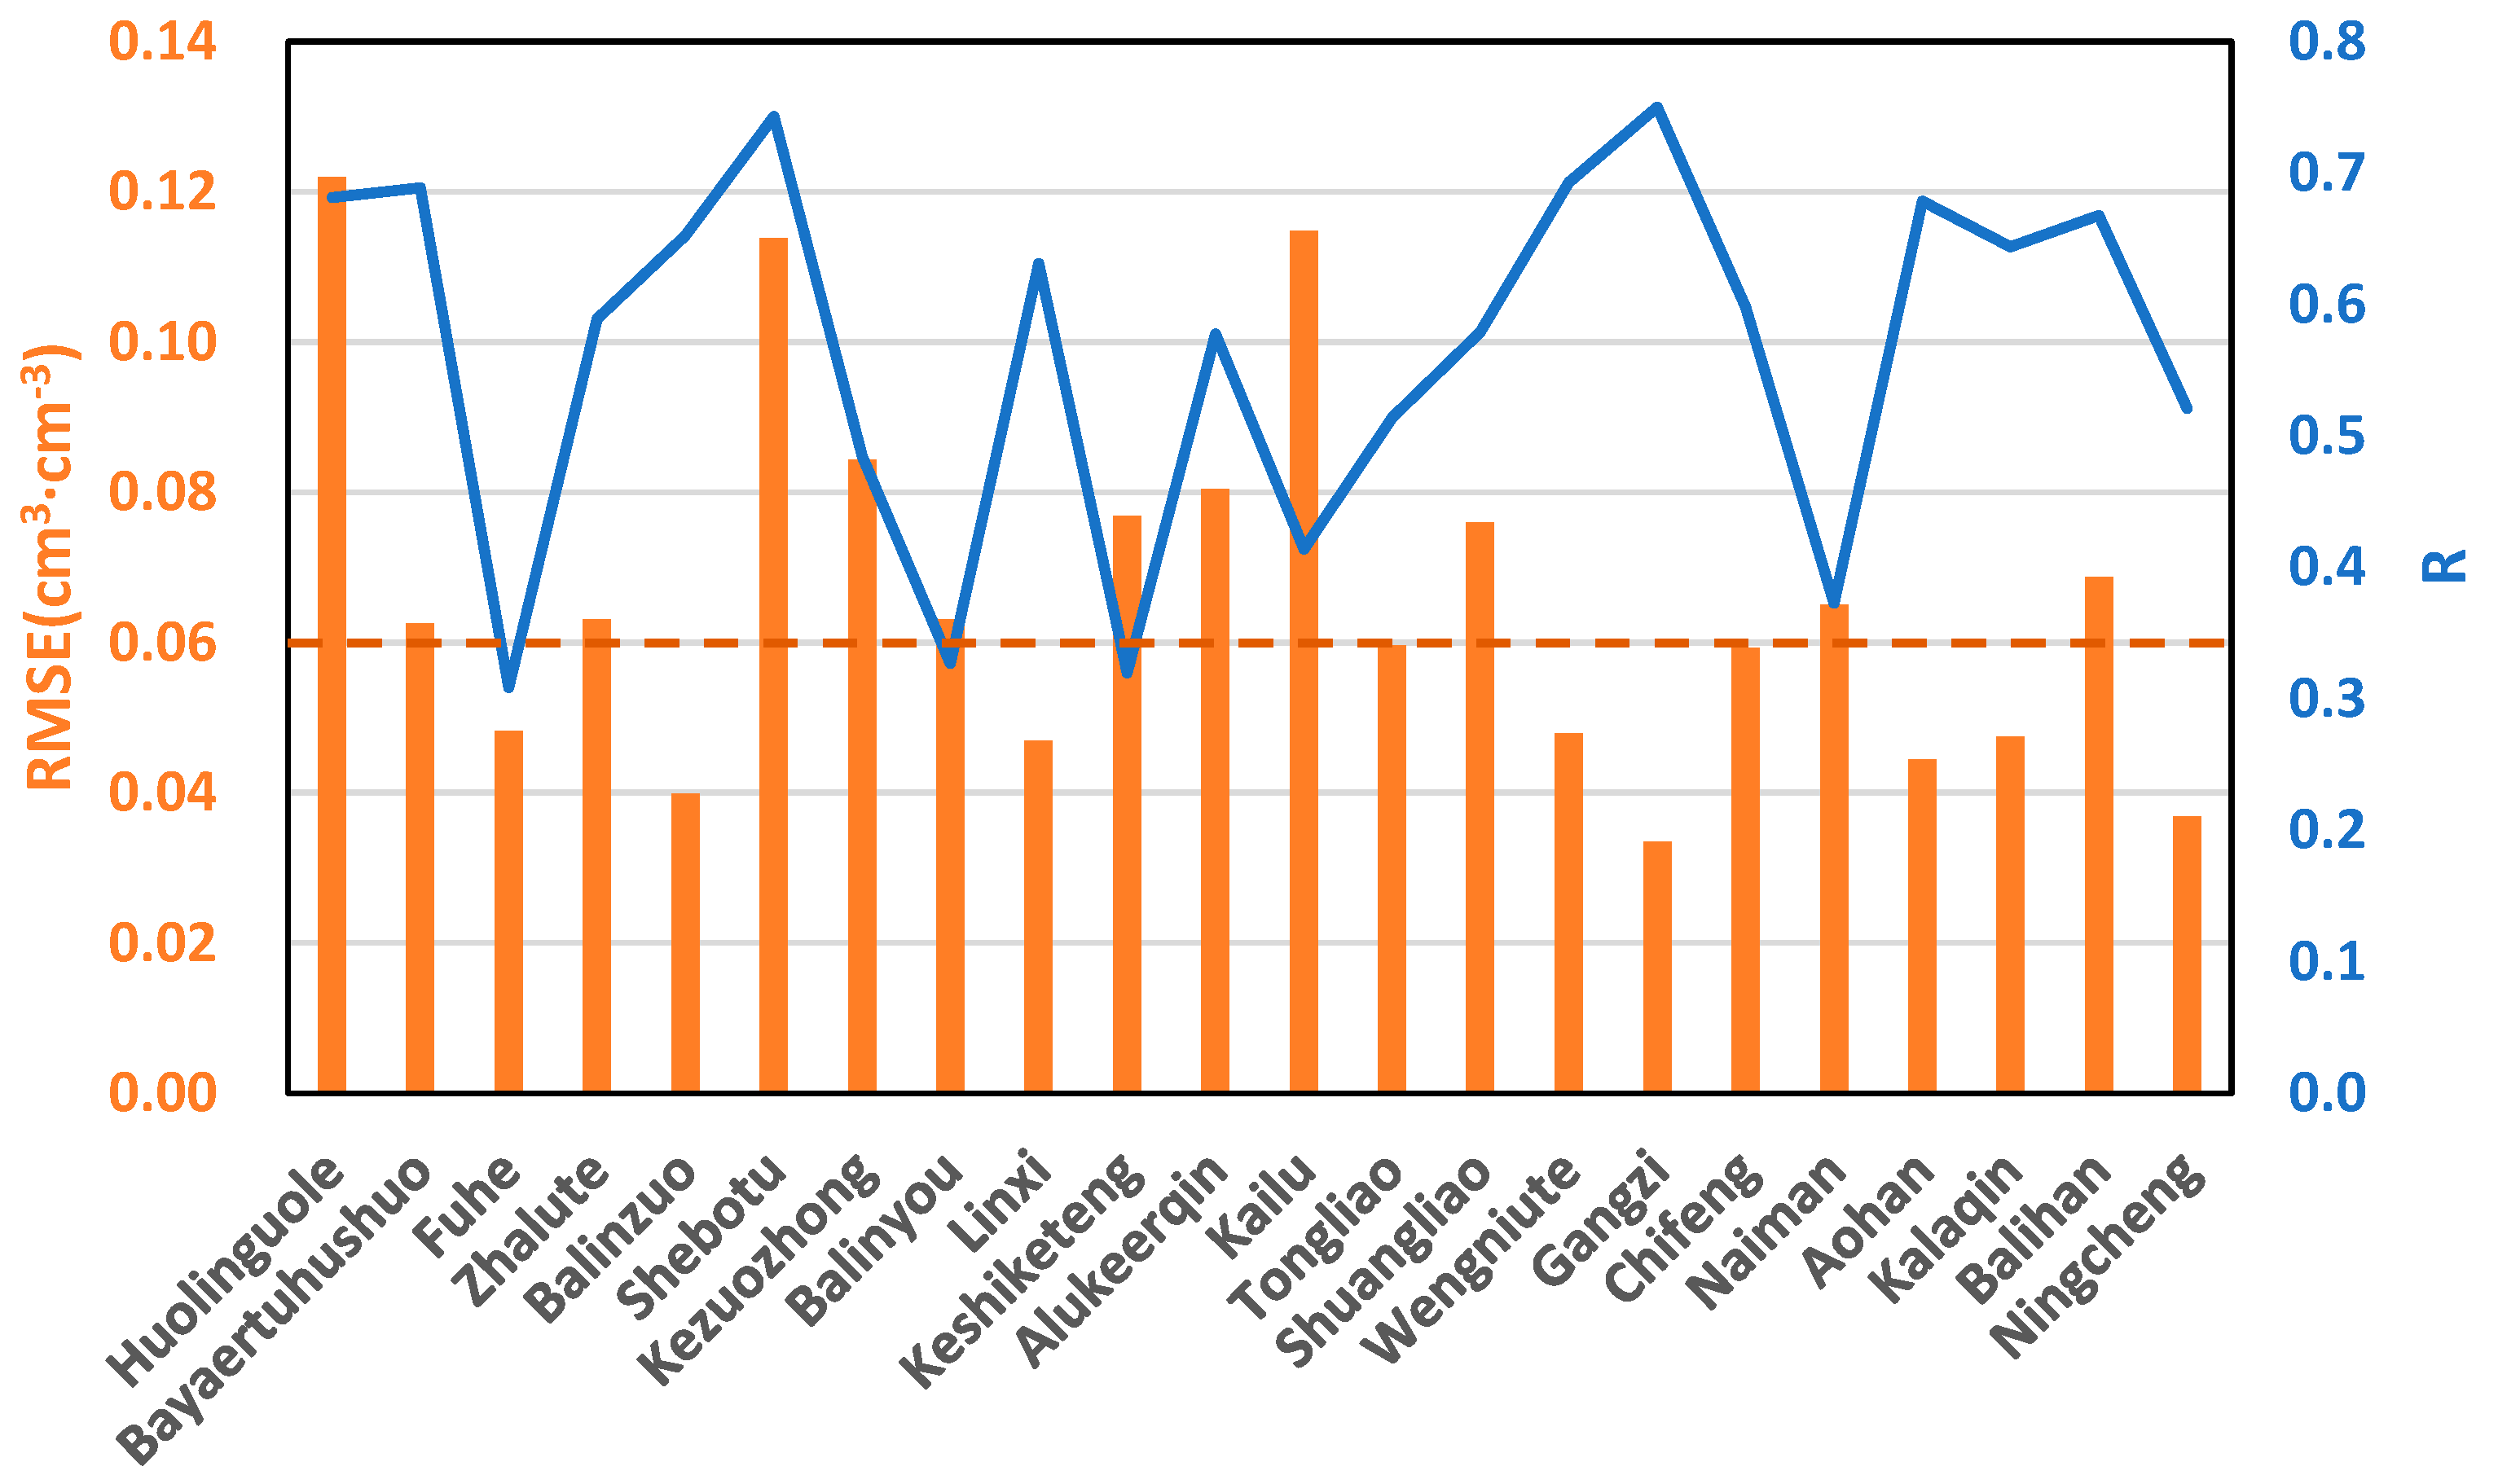
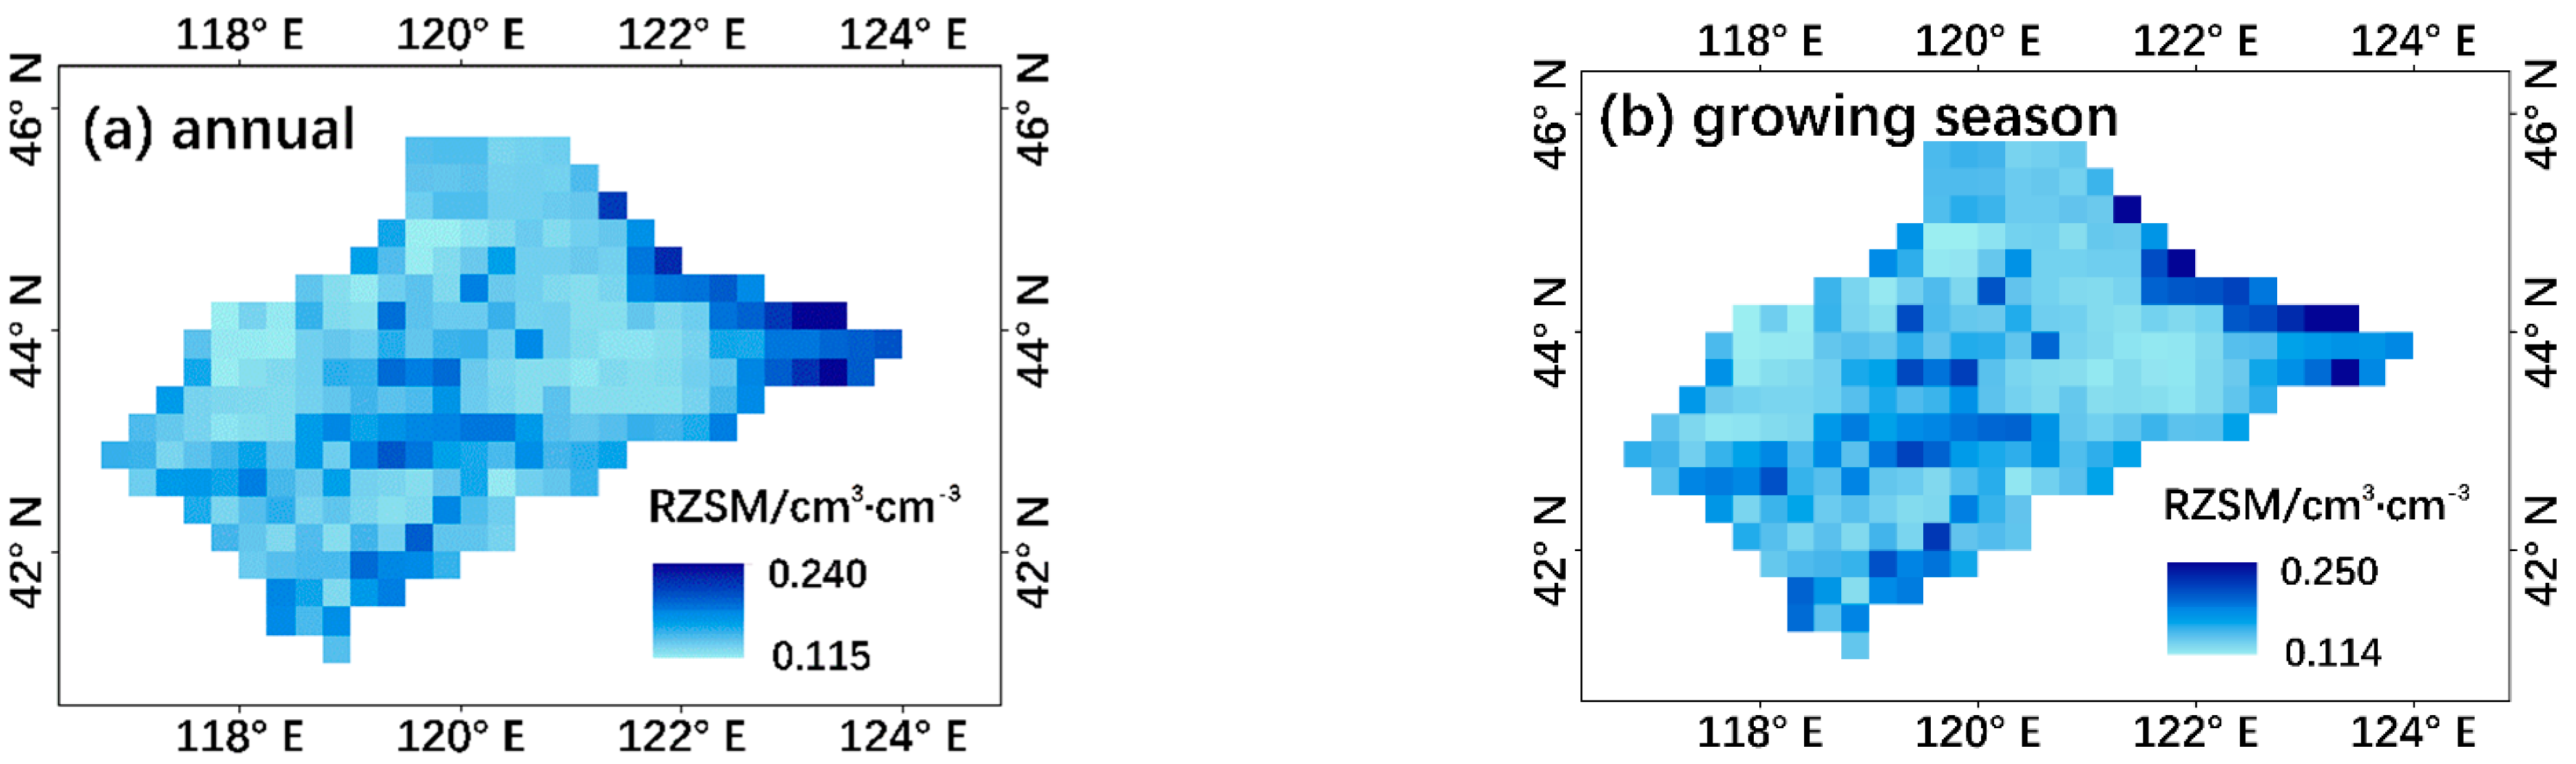
3.3. Root-Zone Soil Moisture Estimated by Regional SMAR

Figure 6 shows the RZSM and correlation R between the root-zone soil moisture estimated by the regional SMAR model and the in-situ root-zone soil moisture measurements at each pixel where in situ sites were located. There were 14 sites where the RMSE was less than or close to 0.06 cm3·cm−3 and 14 sites where R was greater than 0.5, indicating that the regional SMAR model performed relatively well at many sites. However, compared to the performance of the SMAR model at the point scale (Figure 2), the variation in the performance of the regional SMAR model among different sites was larger, perhaps due to the “homogenization” tendency of the RF model in predicting the SMAR parameters.
The mean of RZSM and growing-season RZSM from 2013 to 2020 in the Xiliaohe River Basin estimated by the regional SMAR model are shown in Figure 7a,b, respectively. It is shown that the RZSM of the Xiliaohe River Basin showed relatively drastic spatial variation, with high values in the northeastern edge of the basin and low values in the northern part of the basin. The average RZSM during the growing season was slightly higher than that during the whole year, especially in the central, western and southern parts of the region.

4. Discussion

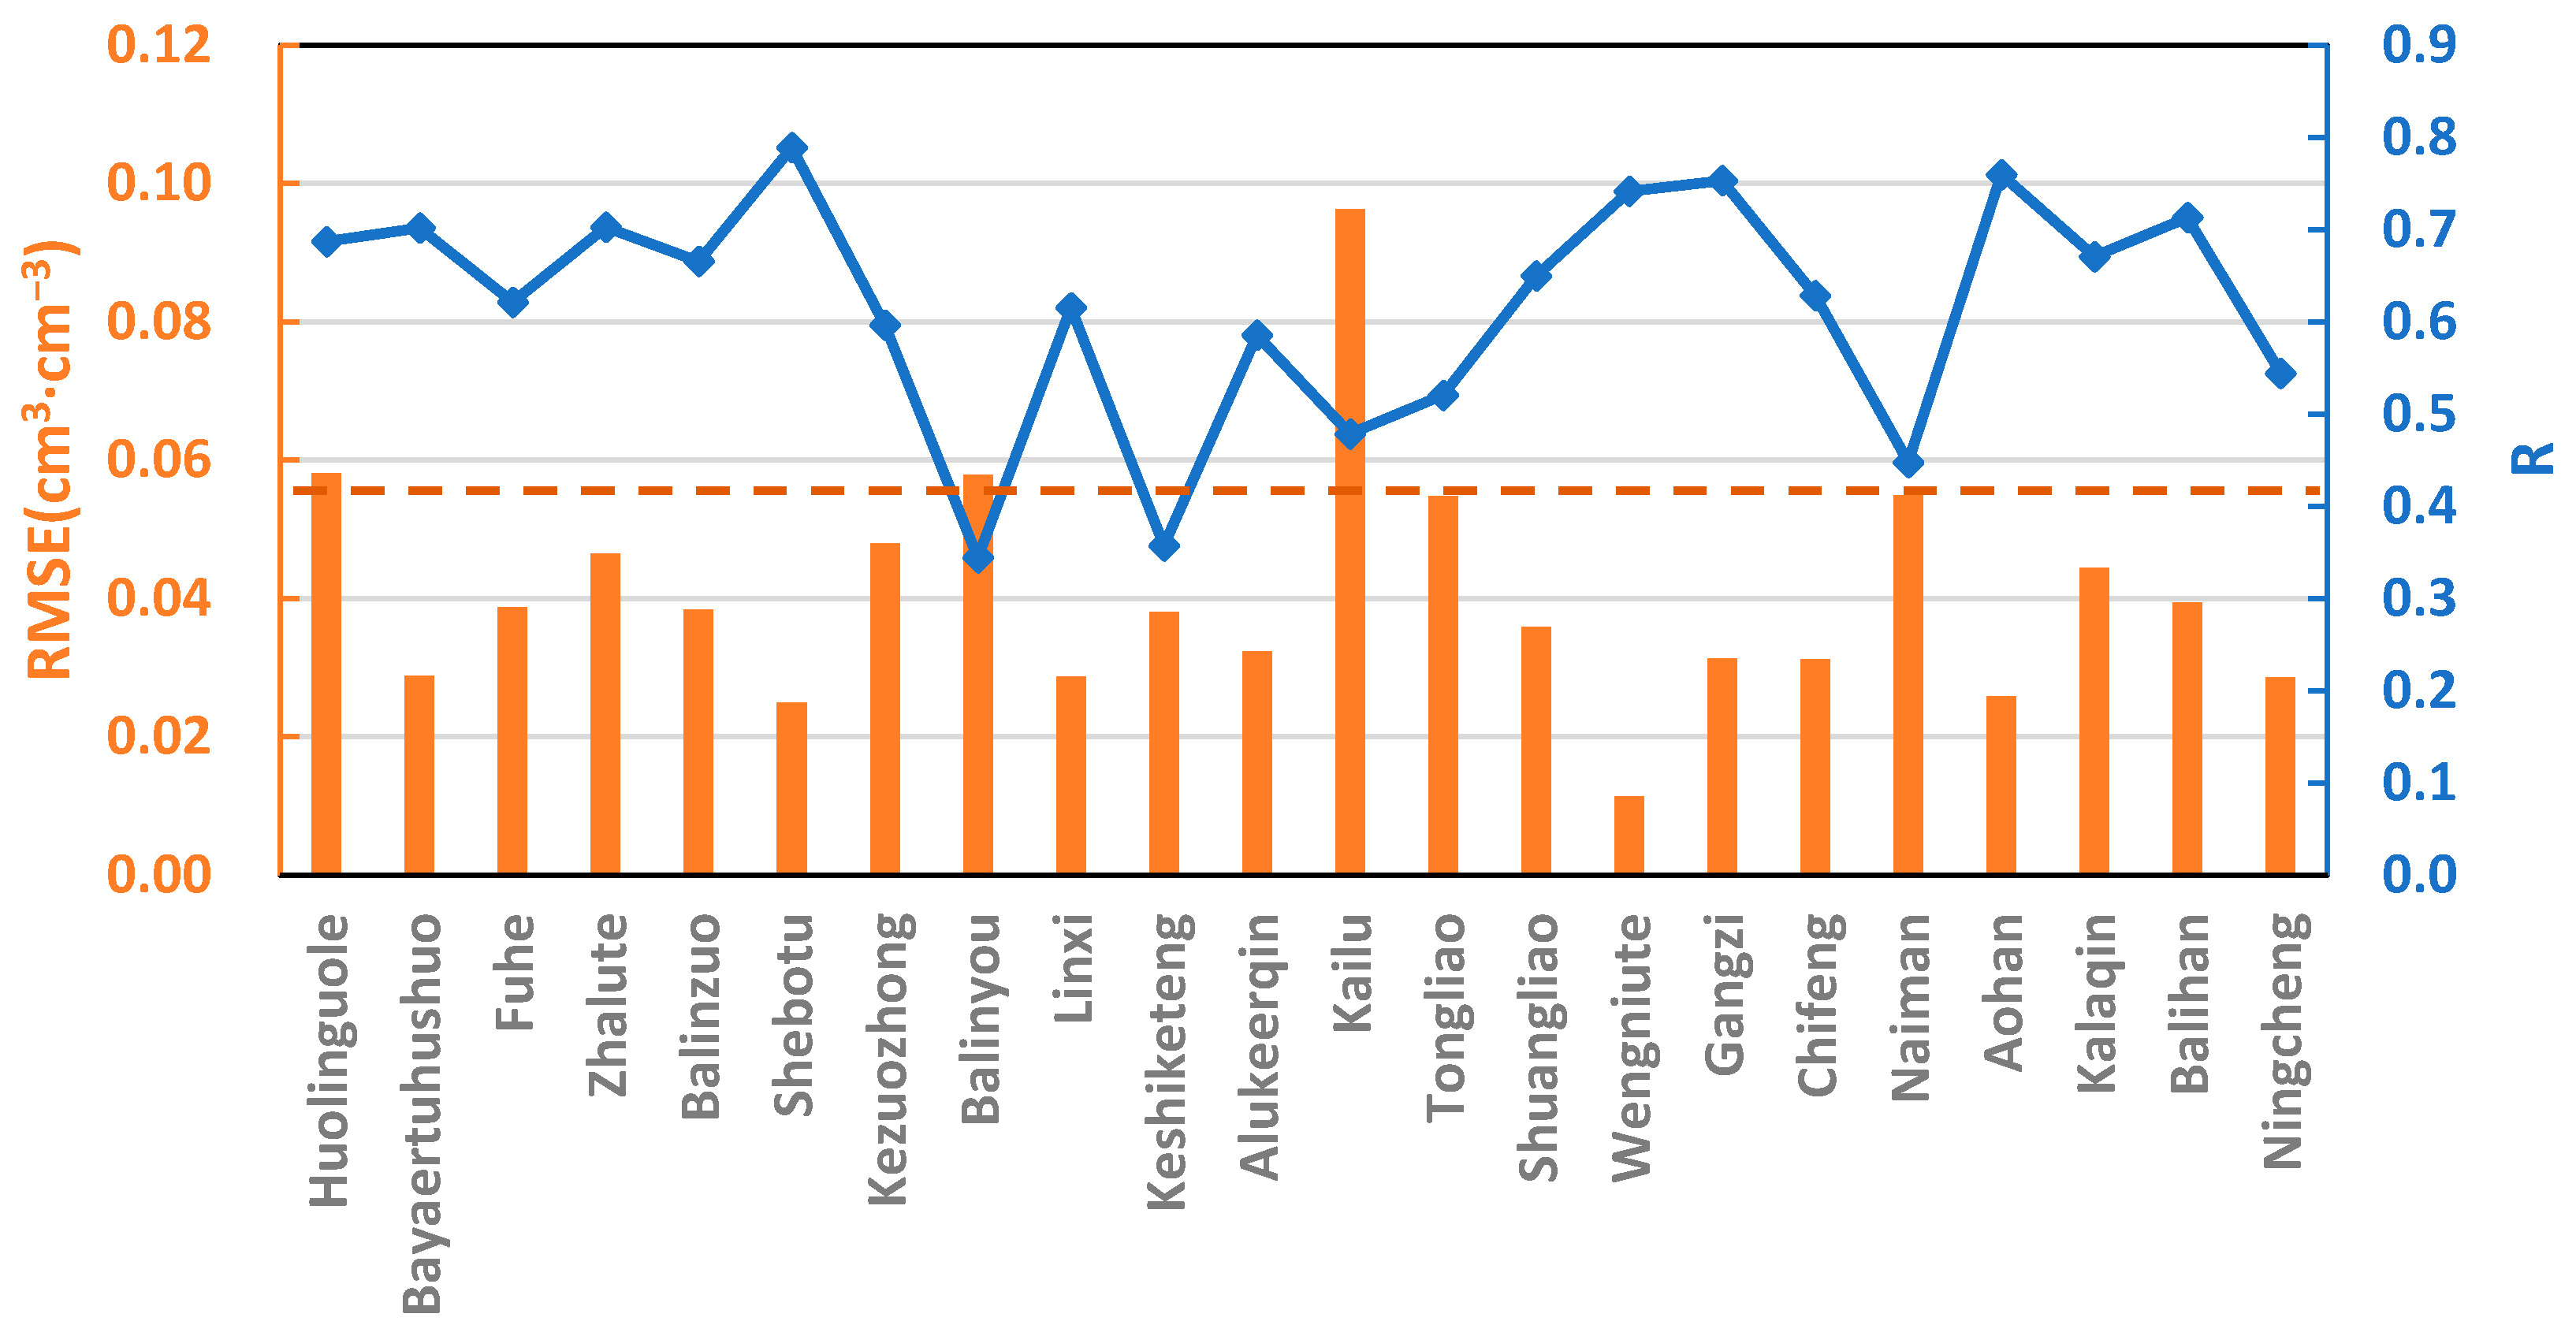
4.1. Spatial and Temporal Heterogeneity of the Performance of the SMAR Model

The in-situ sites were divided into four groups according to their location and altitude (Figure 8a). Comparisons between RZSM observations and estimates for the four groups were summarized in the form of scatterplots (Figure 8b–e). Good agreement was obtained in groups 1, 2 and 3, with R2 > 0.5, and the agreement in group 4 was relatively worse, suggesting that the point-scale SMAR model was more effective in the central and western subregions than in the eastern subregion of the Xiliaohe River Basin. As explained above, the SMAR model neglects the underground lateral water flow and the capillary rise movement. Therefore, it is expected that accuracy will decline in areas with convergent sub-surface lateral water flows and areas with seasonally high water tables that result in capillary rise movement [16]. Statistics comparisons among the four groups with varied altitude and underground water conditions showed that the high agreement occurred with contrasting terrain and the low agreement with low altitude, indicating that the performance of the SMAR model in the Xiliaohe River Basin is independent of the terrain contrast and the consequent lateral flow. Data shows that the buried depth of the groundwater table at the Kezuozhong site (group 4) is less than that at the Zhalute site (group 3). Therefore, it is reasonable to suppose that the low accuracy of the SMAR in the eastern basin is a result of the capillary rise movement due to the relatively high underground water level or seasonally high water tables.
According to the time series of the estimated and observed RZSM (Figure 3a,b), the SMAR model tended to underestimate or overestimate the RZSM in different time periods during the whole year. In other words, the bias between the estimated RZSM and the observed RZSM seemed to show seasonality or periodicity. The RMSE and bias between the SMAR predictions and observations during different periods (annual, growing season and nongrowing season) are shown in Table 2. The bias tended to be positive in the growing season and negative in the nongrowing season, indicating that the SMAR tended to underestimate the RZSM in the growing season and overestimate the RZSM in the nongrowing season, which was consistent with the fluctuations in the time series of the RZSM observations and estimations (Figure 3a–c). The infiltration flux in the SMAR model varies with the seasons depending on the surface soil moisture, but the soil water loss in the root zone is described by a constant coefficient. Therefore, we suppose that the overestimation or underestimation of the SMAR model in different seasons is related to the constant water loss coefficient in the model, indirectly indicating that it is not reasonable to use a constant as the soil water loss in the root zone for the whole year.

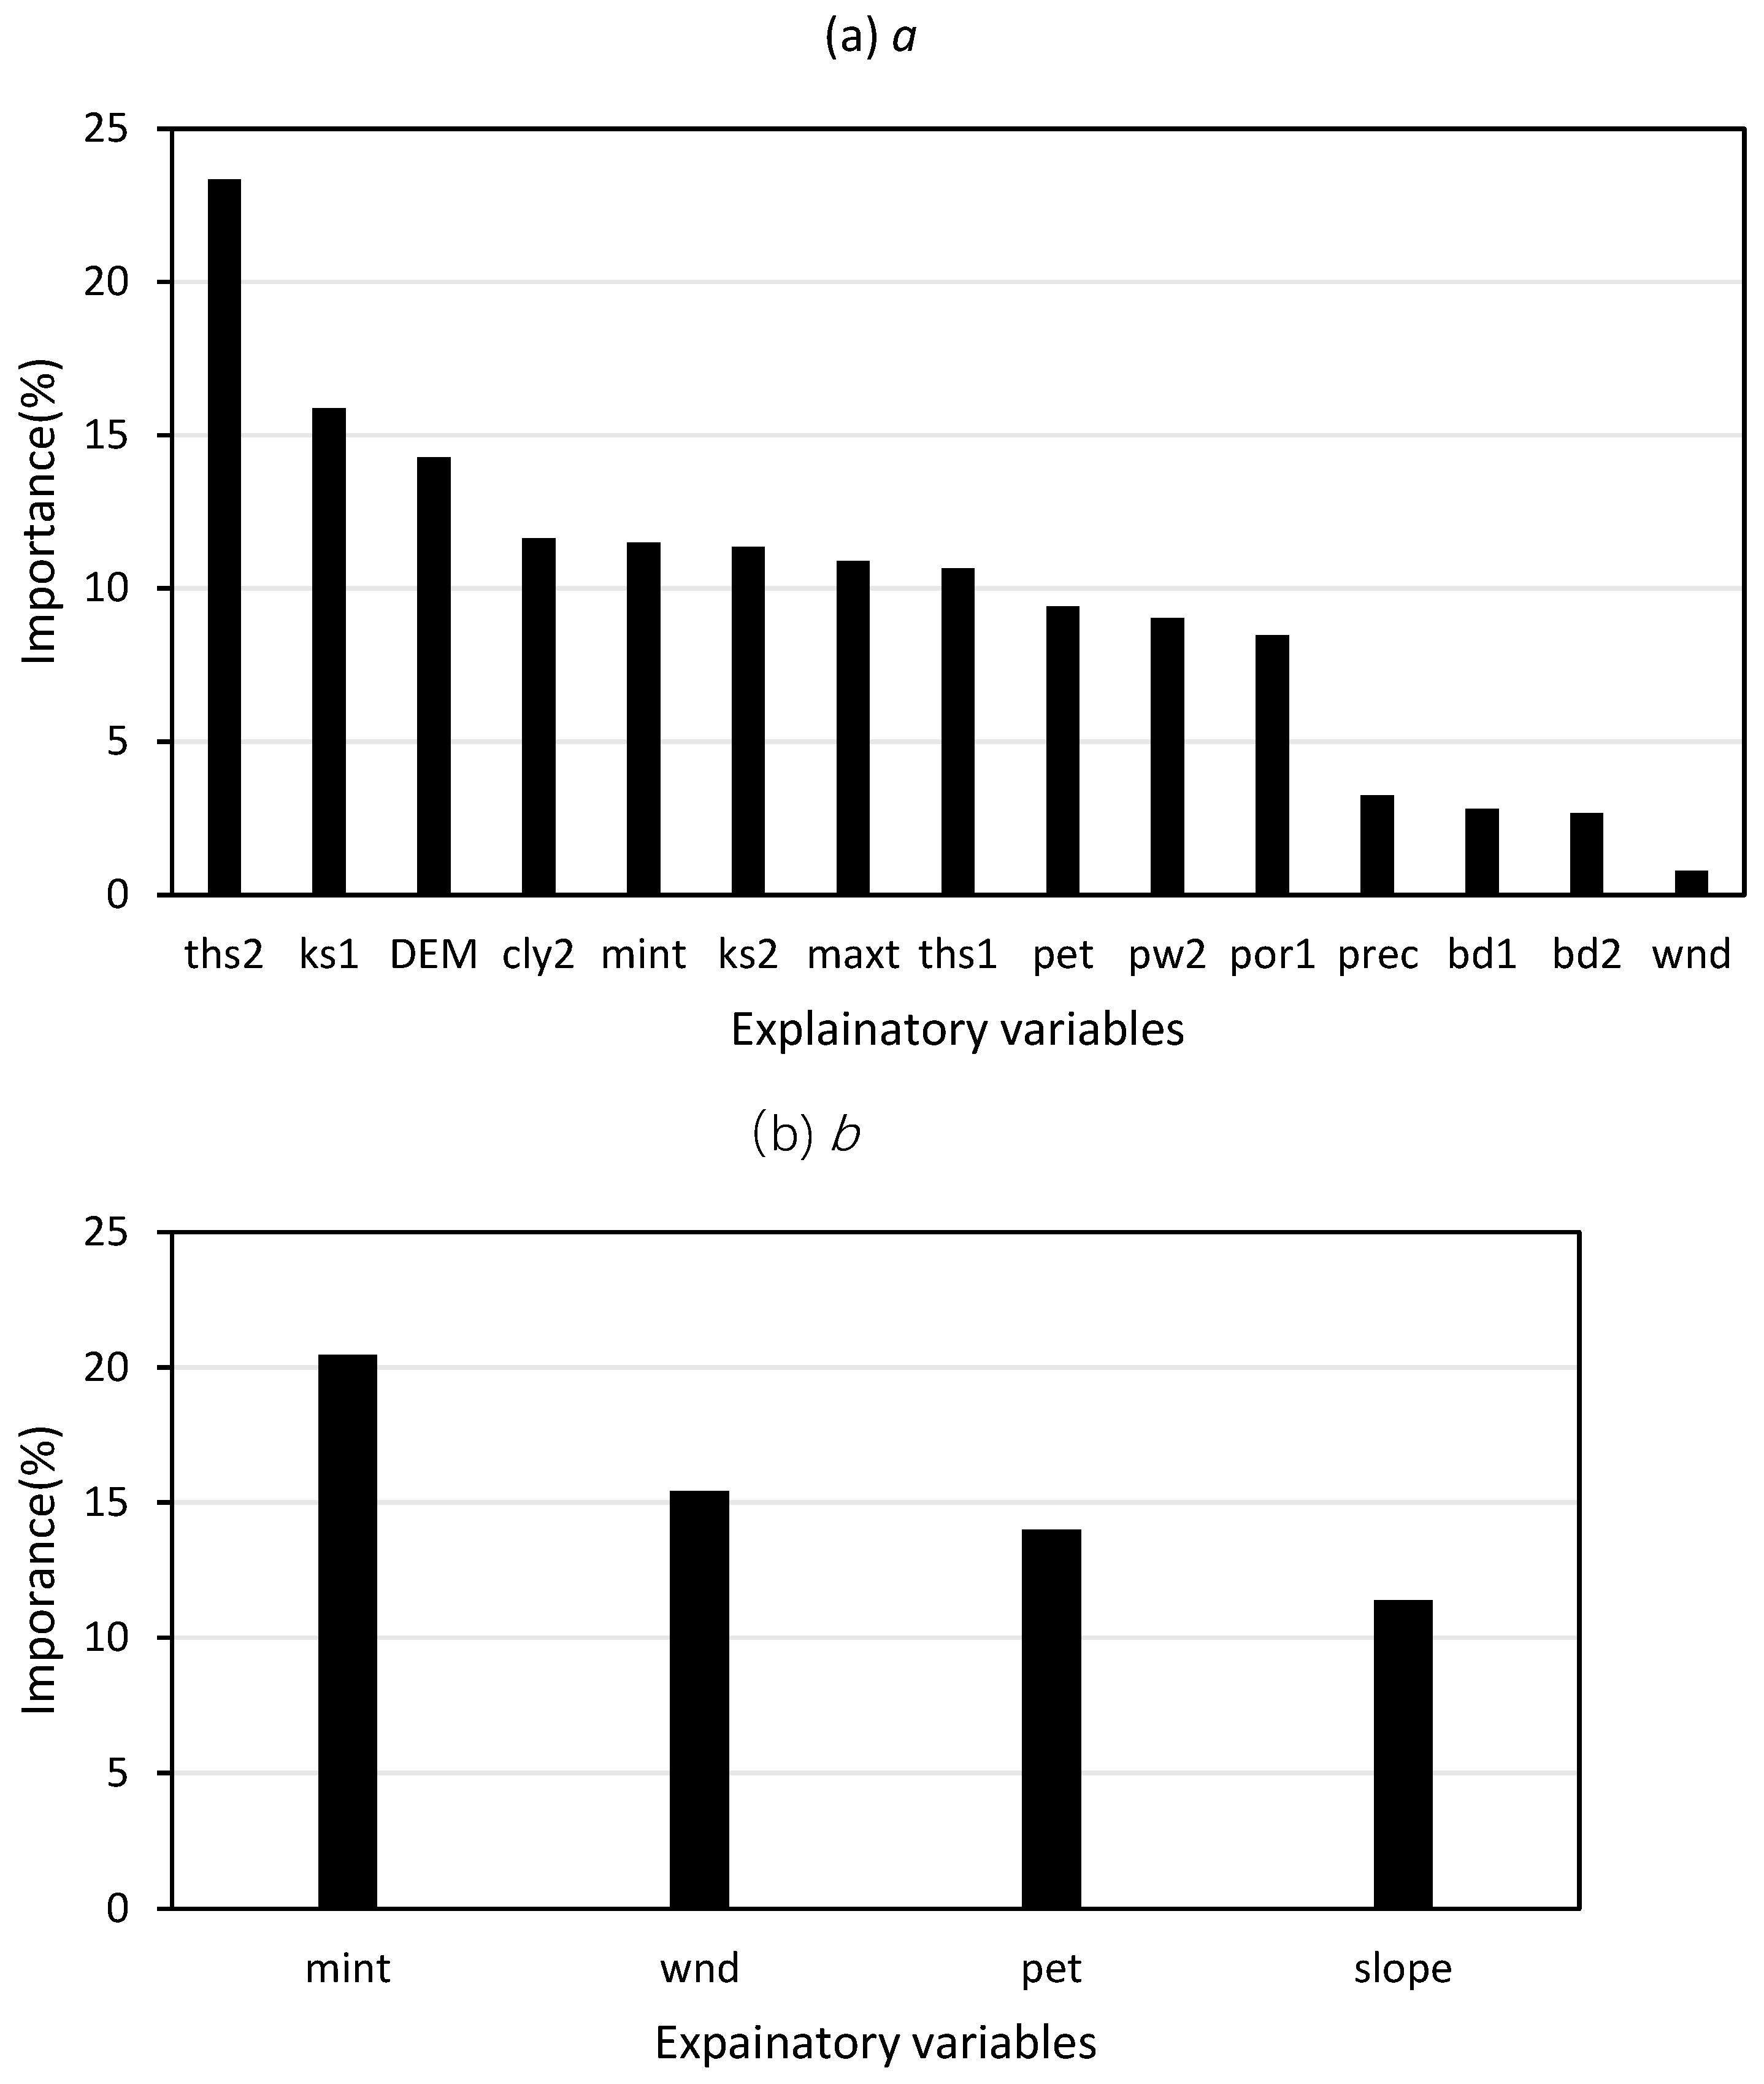
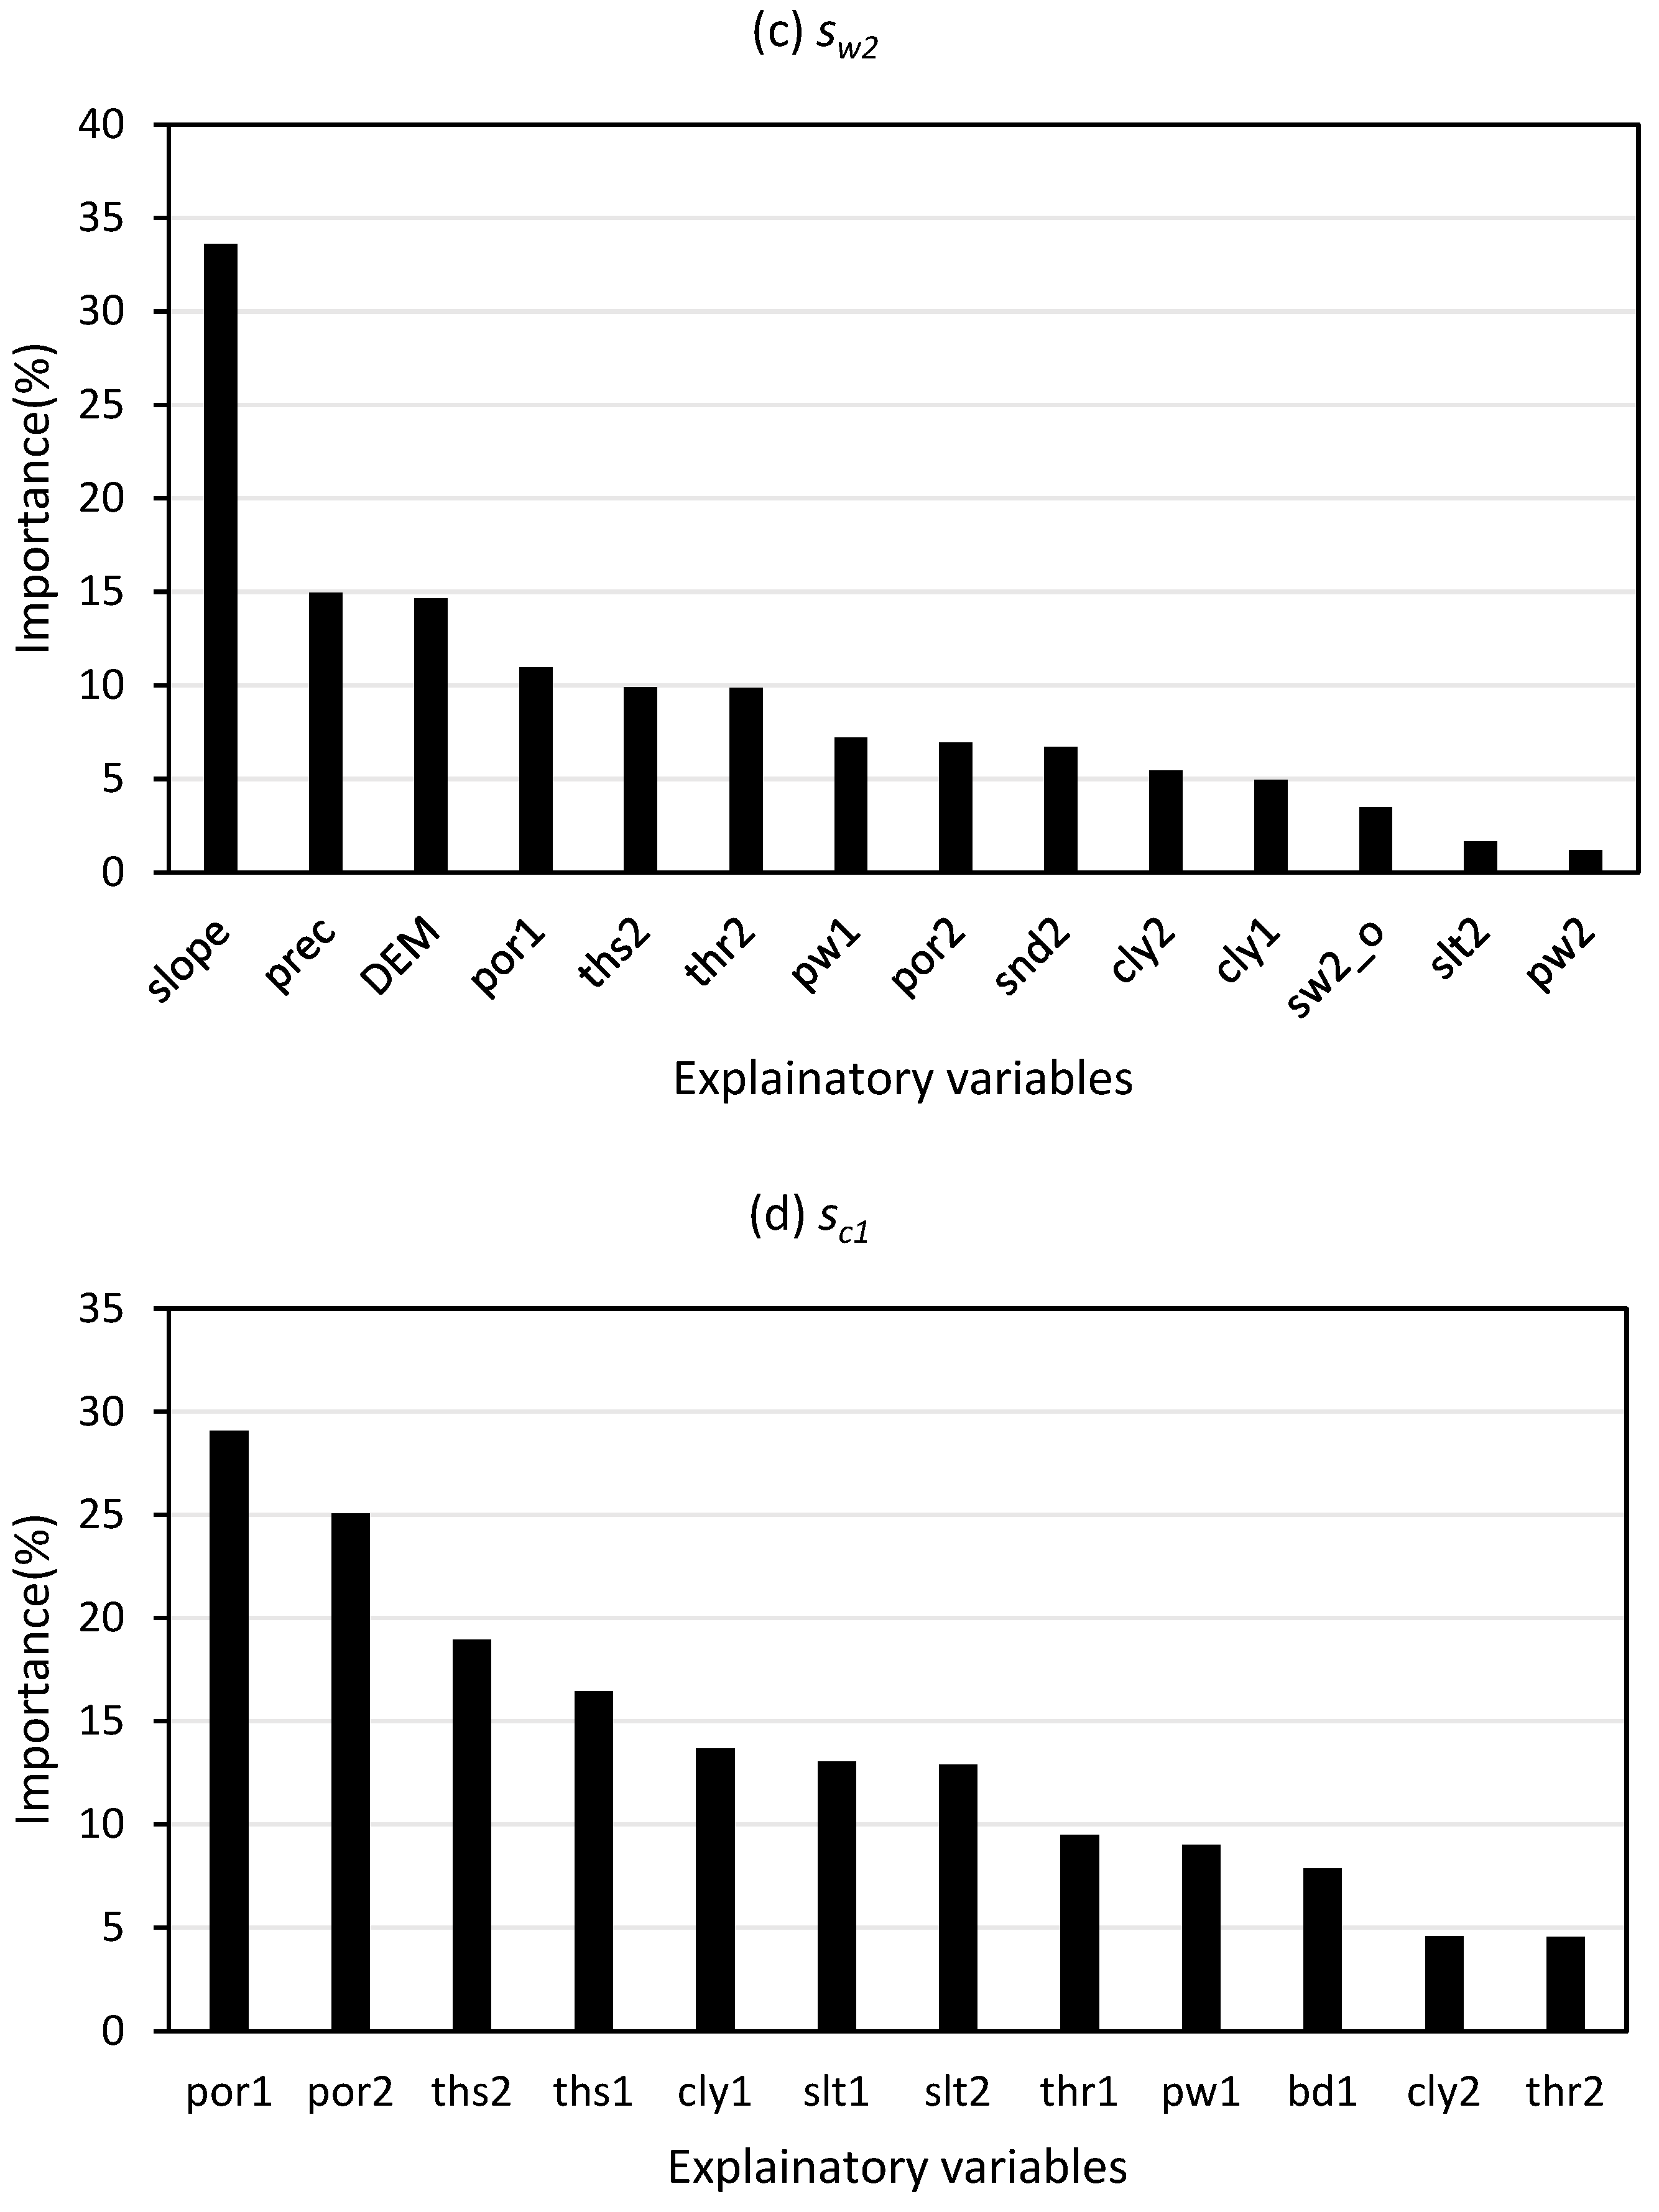
4.2. Importance of Soil, Climatic and Vegetation Characteristics for Predicting SMAR Parameters

Although the RF model tended to weaken the variation of the SMAR parameters, the relative importance (%) of the explanatory variables in the RF model (Figure 9a–d) still provided a reference to some extent. The water loss efficiency (a) was largely dependent on the saturated water content in the root-zone soil layer (ths2), followed by the saturated hydraulic conductivity in the near-surface soil layer (ks1), which can be explained by the infiltration process of the subsoil. The mean daily minimum temperature (mint), wind speed (wnd), potential transpiration (pet) and slope exerted almost equal influences on the diffusion rate (b). A previous study [28] on the infiltration rate of grassland in arid areas of China showed that soil infiltration rate was negatively correlated with SM and positively correlated with subsurface biomass, which was spatially manifested as a higher infiltration rate in the eastern part of the basin than in the western part of the basin (Figure 5b). Similarly, the mint was higher in the eastern part of the basin than in the western part. Therefore, we guess that mint is not a physical factor that affects soil infiltration rate, and the large influence of mint on infiltration rate b is perhaps due to the spatial similarity between b and mint. For the relative wilting level of root-zone soil (sw2), the slope provided the most importance among all the variables. For the relative field capacity at the near-surface soil layer (sc1), the porosity (por) and saturated water content (ths) in the near-surface and root-zone soil layers were important, with some physical rationality.

5. Conclusions

This study explored the feasibility of regionalizing the SMAR model with the RF regression method and discussed the importance of explanatory variables. In this study, a SMAR model at the point scale was established with parameters calibrated by a GA and validated by in situ root-zone soil moisture. Then, the regional SMAR parameters were predicted by a RF model with soil, climatic and vegetation characteristics as explanatory variables, and the importance of these explanatory variables was discussed. Finally, the performance of the regional SMAR model for estimating RZSM was validated.
The point-scale SMAR model obtained reliable RZSM and captured its fluctuations at most sites, with RMSE less than 0.06 cm3·cm−3 and correlation R greater than 0.5. Spatially, the SMAR model obtained more accurate RZSM in the central and western parts of the region. Temporally, the SMAR model tended to underestimate the RZSM during the growing season and overestimate the RZSM during the nongrowing season, and we suppose that it is related to the constant water loss efficiency for the whole year.
The RF model tended to weaken the variation in the SMAR parameters, leading to uncertainty in the regional SMAR model. However, validation analysis showed that the spatial SMAR model met NASA’s program benchmark of a 0.06 cm3·cm−3 RMSE at more than half of the operation sites, suggesting that the RF model could obtain a satisfactory effect in predicting or extrapolating the SMAR parameters. According to the importance of independent variables in the RF model, the dominant explanatory variables were different for the four SMAR parameters: for the prediction of water loss rate a, the saturated water content in the root-zone soil layer was the most important variable; for the diffusion efficiency b, climatic variables, such as the minimum daily temperature (mint), were the most important, which we concluded that is due to the consistent distribution of b and mint in the basin; for the wilting level at the root-zone soil layer sw2, slope was the most important; and for the near-surface field capacity sc1, porosity provided the largest importance.
The regional SMAR model obtained relatively reliable estimates of RZSM, but there are still some uncertainties that the RF method may generate. The root-zone soil moisture was higher in the central, southern and northeastern edges of the Xiliaohe River Basin, and the RZSM in the growing season was slightly greater than that in the nongrowing season.
In summary, we proposed a method for estimating SMAR parameters and building SMAR models on a regional scale. The results show that this method is effective in semi-arid areas. At the same time, the analysis of the importance of explanatory variables on estimations of parameters and the spatio-temporal heterogeneity of SMAR model performance can provide a scientific basis for the application, analysis and improvement of the SMAR model.

Author Contributions

Methodology, X.G. and X.F.; Validation, X.G.; Formal analysis, X.G.; Data curation, X.F., Q.Z. and S.J.; Writing—original draft, X.G.; Writing—review & editing, X.F.; Supervision, Q.Z., S.J., J.T., Q.T. and J.J.; Project administration, X.F.; Funding acquisition, X.F. All authors have read and agreed to the published version of the manuscript.

Funding

This research was funded by the National Natural Science of China grant number [No. 42071040 and No. U2243203] And the National Key Research and Development Program of China was funded by [No. 2019YFC1510601].

Data Availability Statement

Not applicable.

Acknowledgments

We are grateful for the financial support provided by the National Natural Science of China [No. 42071040 and No. U2243203] and the National Key Research and Development Program of China [No. 2019YFC1510601].

Conflicts of Interest

The authors declare no conflict of interest.

References

  1. Tian, J.; Zhang, Y.; Guo, J.; Zhang, X.; Ma, N.; Wei, H.; Tang, Z. Predicting root zone soil moisture using observations at 2121 sites across China. Sci. Total Environ. 2022, 847, 157425. [Google Scholar] [CrossRef]
  2. Band, L.E.; Patterson, P.; Nemani, R.; Running, S.W. Forest ecosystem processes at the watershed scale-incorporating hillslope hydrology. Agric. For. Meteorol. 1993, 63, 93–126. [Google Scholar] [CrossRef] [Green Version]
  3. Pauwels, V.R.N.; Hoeben, R.; Verhoest, N.E.C.; De Troch, F.P. The importance of the spatial patterns of remotely sensed soil moisture in the improvement of discharge predictions for small-scale basins through data assimilation. J. Hydrol. 2001, 251, 88–102. [Google Scholar] [CrossRef]
  4. Yu, X.; Duffy, C.; Baldwin, D.C.; Lin, H. The role of macropores and multi-resolution soil survey datasets for distributed surface-subsurface flow modeling. J. Hydrol. 2014, 516, 97–106. [Google Scholar] [CrossRef]
  5. Bolten, J.D.; Crow, W.T.; Zhan, X.W.; Jackson, T.J.; Reynolds, C.A. Evaluating the utility of remotely sensed soil moisture retrievals for operational agricultural drought monitoring. IEEE J. Sel. Top. Appl. Earth Obs. Remote Sens. 2010, 3, 57–66. [Google Scholar] [CrossRef] [Green Version]
  6. Bernai, R.R. Managing the risks of extreme events and disasters to advance climate change adaptation. Econ. Energy Environ. Policy 2013, 2, 101–112. [Google Scholar]
  7. Flores, A.N.; Entekhabi, D.; Bras, R.L. Application of a hillslope-scale soil moisture data assimilation system to military trafficability assessment. J. Terramechanics 2014, 51, 53–66. [Google Scholar] [CrossRef] [Green Version]
  8. Bindlish, R.; Crow, W.T.; Jackson, T.J. Potential role of passive microwave remote sensing in improving flood forecasts. In Proceedings of the International Geoscience and Remote Sensing Symposium, Anchorage, AK, USA, 20–24 September 2004. [Google Scholar]
  9. Bartsch, A.; Balzter, H.; George, C. The influence of regional surface soil moisture anomalies on forest fires in Siberia observed from satellites. Environ. Res. Lett. 2009, 4, 940–941. [Google Scholar] [CrossRef] [Green Version]
  10. Huang, J.P.; Ma, J.R.; Guan, X.D.; Li, Y.; He, Y.L. Progress in Semi-arid Climate Change Studies in China. Adv. Atmos. Sci. 2019, 36, 922–937. [Google Scholar] [CrossRef]
  11. Gheybi, F.; Paridad, P.; Faridani, F.; Farid, A.; Pizarro, A.; Fiorentino, M.; Manfreda, S. Soil moisture monitoring in Iran by implementing satellite data into the root-zone SMAR model. Hydrology 2019, 6, 44. [Google Scholar] [CrossRef] [Green Version]
  12. Kerr, Y.H. The SMOS soil moisture retrieval algorithm. IEEE Trans. Geosci. Remote Sens. 2012, 50, 1384–1403. [Google Scholar] [CrossRef]
  13. Owe, M.; de Jeu, R.; Walker, J. A methodology for surface soil moisture and vegetation optical depth retrieval using the microwave polarization difference index. IEEE Trans. Geosci. Remote Sens. 2001, 39, 1643–1654. [Google Scholar] [CrossRef] [Green Version]
  14. Dorigo, W.; Wagner, W.; Albergel, C.; Albrecht, F.; Balsamo, G.; Brocca, L.; Chung, D.; Ertl, M.; Forkel, M.; Gruber, A.; et al. ESA CCI Soil Moisture for improved Earth system understanding: State-of-the art and future directions. Remote Sens. Environ. 2017, 203, 185–215. [Google Scholar] [CrossRef]
  15. Reichle, R.H.; De Lannoy, G.J.M.; Liu, Q.; Koster, R.D.; Kimball, S.J.; Crow, W.T.; Ardizzone, J.V.; Chakraborty, P.; Collins, D.W.; Conaty, A.L.; et al. Global assessment of the SMAP Level-4 surface and Root-Zone Soil Moisture product using assimilation diagnostics. J. Hydrometeorol. 2017, 18, 3217–3237. [Google Scholar] [CrossRef]
  16. Baldwin, D.; Manfreda, S.; Lin, H.; Smithwick, E.A.H. Estimating root zone Soil Moisture across the Eastern United States with passive microwave satellite data and a simple hydrologic model. Remote Sens. 2019, 11, 2013. [Google Scholar] [CrossRef] [Green Version]
  17. Narasimhan, B.; Srinivasan, R. Development and evaluation of Soil Moisture Deficit Index (SMDI) and Evapotranspiration Deficit Index (ETDI) for agricultural drought monitoring. Agric. For. Meteorol. 2005, 133, 69–88. [Google Scholar] [CrossRef]
  18. Denmead, O.T.; Shaw, R.H. Availability of soil water to plants as affected by Soil Moisture content and meteorological conditions 1. Agron. J. 1962, 54, 385–390. [Google Scholar] [CrossRef]
  19. Malone, R.W.; Ahuja, L.R.; Ma, L.; Wauchope, R.D.; Ma, Q.; Rojas, K.W. Application of the Root Zone Water Quality Model (RZWQM) to pesticide fate and transport: An overview. Pest Manag. Sci. 2010, 60, 205–221. [Google Scholar] [CrossRef]
  20. Wolfgang, W.; Guido, L.; Helmut, R. A Method for Estimating the Profile Soil Moisture Content from ERS Scatterometer and Soil Data. Remote Sens. Environ. 1999, 70, 191–207. [Google Scholar]
  21. Manfreda, S.; Fiorentino, M.; Samela, C.; Margiotta, M.R.; Moramarco, T. A physically based approach for the estimation of root-zone soil moisture from surface measurements: Application on the AMMA database. Hydrol. Earth Syst. Sci. 2014, 18, 1199–1212. [Google Scholar] [CrossRef] [Green Version]
  22. Guo, X.; Fang, X.; Cao, Y.; Yang, L.; Ren, L.; Chen, Y.; Zhang, X. Reconstruction of ESA CCI soil moisture based on DCT-PLS and in situ soil moisture. Hydrol. Res. 2022, 53, 1221–1236. [Google Scholar] [CrossRef]
  23. Penman, H.L. Natural evaporation from open water, bare soil and grass. Proc. R. Soc. Lond. Ser. A-Math. Phys. Sci. 1948, 193, 120–145. [Google Scholar] [CrossRef] [Green Version]
  24. Farokhi, M.; Faridani, F.; Lasaponara, R.; Ansari, H.; Faridhosseini, A. Enhanced estimation of root zone soil moisture at 1 km resolution using SMAR model and MODIS-based downscaled AMSR2 soil moisture data. Sensors 2021, 21, 5211. [Google Scholar] [CrossRef]
  25. Faridani, F.; Farid, A.; Ansari, H.; Manfreda, S. Estimation of the root-zone soil moisture using passive microwave remote sensing and SMAR model. J. Irrig. Drain. Eng. 2017, 143, 9. [Google Scholar] [CrossRef]
  26. Breiman, L. Random forests. Mach. Learn. 2001, 45, 5–32. [Google Scholar] [CrossRef] [Green Version]
  27. Yang, W.B.; Tang, J.N.; Liang, H.R.; Dang, H.Z.; Li, W. Deep soil water infiltration and its dynamic variation in the shifting sandy land of typical deserts in China. Sci. China-Earth Sci. 2014, 57, 1816–1824. [Google Scholar] [CrossRef]
  28. Liu, Y.; Cui, Z.; Huang, Z.; López-Vicente, W.; Wu, G.-L. Influence of soil moisture and plant roots on the soil infiltration capacity at different stages in arid grasslands of China. Catena 2019, 182, 104147. [Google Scholar] [CrossRef]
Figure 1. Location, topography and rivers of the study area.
Remotesensing 15 02003 g001
Figure 2. RMSE (cm3·cm−3) and correlation R between root-zone soil moisture estimated by the SMAR model and in situ measurements at pixels where in-situ sites were located. The dashed line represents NASA’s quality benchmark (0.06 cm3·cm−3) for soil moisture predictions using satellite observations.
Remotesensing 15 02003 g002
Figure 3. Time series of root-zone soil moisture (cm3·cm−3) from 2016 to 2020 at the (a) Shebotu site, (b) Huolinguole site and (c) Wengniute site. Red solid lines indicate root-zone soil moisture measurements at in-situ stations, and blue dotted lines indicate root-zone soil moisture predictions from the calibrated SMAR model at the point scale, where the ESA CCI near-surface soil moisture data are used for model forcing.
Remotesensing 15 02003 g003
Figure 4. Scatterplots between the calibrated SMAR parameters and the predicted SMAR parameters from the random forest model and independent variables. The parameters are (a) a, (b) b, (c) sw2 and (d) sc1.
Remotesensing 15 02003 g004
Figure 5. Regional maps of the SMAR parameters predicted by the RF model, including (a) water loss rate a, (b) diffusion rate b, (c) relative field capacity sc1 and (d) relative wilting level sw2.
Remotesensing 15 02003 g005
Figure 6. RMSE (cm3·cm−3) and correlation R between the root-zone soil moisture estimates by the regional SMAR and the in-situ root-zone soil moisture measurements at each pixel where in situ sites were located. The dashed line represents NASA’s quality benchmark (0.06 cm3·cm−3) for soil moisture predictions using satellite observations.
Remotesensing 15 02003 g006
Figure 7. Average RZSM produced by the regional SMAR model from 2013 to 2020 during (a) the whole year and (b) the growing season (April to October). The relative RZSM is transformed to volumetric root-zone soil content (cm3·cm−3) with root-zone porosity data.
Remotesensing 15 02003 g007
Figure 8. Scatterplots of the root-zone soil moisture observations and estimates during the calibration periods (2016–2020) at each of the four groups of in situ sites in the Xiliaohe River Basin. (a) Locations of the four groups of in situ sites, (b) Group 1, (c) Group 2, (d) Group 3 and (e) Group 4.
Remotesensing 15 02003 g008aRemotesensing 15 02003 g008b
Figure 9. Relative importance (%) of soil, climatic and vegetation characteristics to (a) a, (b) b, (c) sw2 and (d) sc1 from the random forest model, sorted from largest to smallest. Suffix 1 represents the near-surface soil layer (0–5 cm), and suffix 2 represents the root-zone soil layer (5–100 cm).
Remotesensing 15 02003 g009aRemotesensing 15 02003 g009b
Table 1. Calibrated SMAR parameters at pixels where in-situ sites were located.
Siteabsw2sc1
Huolinguole0.0540.3570.3510.367
Bayaertuhushuo0.0790.1880.0930.355
Fuhe0.0380.1160.1680.296
Zhalute0.0360.2390.1790.322
Balinzuo0.0720.2310.2370.411
Shebotu0.0340.2030.4210.378
Kezuozhong0.0410.1880.3090.526
Balinyou0.0390.2060.2420.393
Linxi0.0570.2320.1200.350
Keshiketeng0.1920.0960.1720.352
Alukeerqin0.0600.1300.4120.372
Kailu0.0190.1280.1890.340
Tongliao0.0430.2700.2570.412
Shuangliao0.0370.1290.3530.483
Wengniute0.0320.0910.2780.507
Gangzi0.0590.2440.1840.393
Chifeng0.0690.1070.2410.303
Naiman0.0240.2560.3670.503
Aohan0.0440.2370.2480.511
Kalaqin0.0560.2290.1660.404
Balihan0.0450.1700.2540.357
Ningcheng0.0560.0860.2780.408
Table 2. RMSE and bias from the SMAR predictions compared to observations at in situ sites during the whole year, growing season and nongrowing season.
StationAnnualGrowing SeasonNongrowing Season
RMSEBiasRMSEBiasRMSEBias
Huolinguole0.1220.1040.1400.1250.0860.070
Bayaertuhushuo0.063−0.0550.059−0.0490.068−0.065
Fuhe0.0480.0110.0540.0300.037−0.019
Zhalute0.0630.0150.0720.0330.045−0.015
Balinzuo0.040−0.0030.0390.0160.041−0.030
Shebotu0.1140.1100.1210.1180.1010.099
Kezuozhong0.084−0.0540.067−0.0300.106−0.092
Balinyou0.0630.0240.0750.0570.040−0.022
Linxi0.047−0.0330.037−0.0200.060−0.056
Keshiketeng0.077−0.0590.051−0.0370.105−0.093
Alukeerqin0.0800.0710.0930.0840.0560.051
Kailu0.1150.0500.1310.0700.0820.017
Tongliao0.0600.0220.0710.0360.0330.000
Shuangliao0.076−0.0490.073−0.0380.081−0.067
Wengniute0.048−0.0310.048−0.0330.047−0.028
Gangzi0.0340.0000.0340.0160.032−0.027
Chifeng0.0590.0500.0670.0620.0420.029
Naiman0.0650.0250.0720.0450.050−0.008
Aohan0.044−0.0300.042−0.0240.049−0.040
Kalaqin0.048−0.0060.0380.0240.059−0.052
Balihan0.0690.0530.0830.0740.0360.018
Ningcheng0.037−0.0100.037−0.0050.037−0.017
Disclaimer/Publisher’s Note: The statements, opinions and data contained in all publications are solely those of the individual author(s) and contributor(s) and not of MDPI and/or the editor(s). MDPI and/or the editor(s) disclaim responsibility for any injury to people or property resulting from any ideas, methods, instructions or products referred to in the content.

