Abstract
Understanding crust–atmosphere interactions on Venus is fundamentally important to interpretations of Venus’ surface spectroscopic data. Olivine, in basaltic crust, is oxidized under a heated CO2 atmosphere. However, the oxidation rates, product assemblages and spectral characteristics of olivine samples with different Fa# values remain largely unclear. Herein, we investigated the oxidation of olivine with different Fa# values (Fa09, Fa29 and Fa71) under CO2 atmosphere at 470 °C and 900 °C and characterized the oxidation products (both microscopically and macroscopically), conversion rates and VNIR spectra. The results showed that the oxidation of olivine produced magnesioferrite, magnetite, laihunite, hematite and maghemite at 470 °C and hematite, magnetite, magnesioferrite and amorphous SiO2 at 900 °C. Both high temperature and high Fa# values accelerated the oxidation rates. The production of oxide coatings on olivine grains (74 μm in size) was estimated to be completed within tens to hundreds of years at 470 °C in natural settings, with even shorter periods under higher temperatures. Thus, CO2 oxidation would quickly eliminate olivine spectral characteristics, and spectral parameters at 850 and 1020 nm, as well as other relevant spectral windows (considering shifts induced by the elevated temperature), could be used to trace olivine oxidation processes. This work presented a case study connecting microscopic features to spectral characteristics for Venus’ surface–atmosphere interactions. Further studies considering more realistic Venus’ surface–atmosphere conditions will be essential to better interpret the measured spectroscopic data and determine the origins of the high emissivity detected on elevated terrain on Venus.
1. Introduction
Venus was the first terrestrial planet explored by human beings, but due to its dense atmosphere and hostile surface conditions [1,2], the extent of exploration and measurements have been limited, compared to those of Mars and the Moon, in recent decades. Venus has been called the twin sister of Earth because of the planets’ similar sizes and densities, and the composition of Venus has been speculated to be similar to that of Earth [3]. Because of the challenges in exploring the surface of Venus, compositional data on Venus’ surface and interiors are extremely limited. Although plain composition has been constrained from in situ data (e.g., Venera 13, 14 and Vega 2; [4,5,6,7,8]), orbital radar imaging and dielectric property data (e.g., Venera 15 and 16, Pioneer Venus and Magellan; [9,10,11]), the precise compositions of different geological units (such as highlands, lowlands and tessera units) remain largely unconstrained.
There are a few spectral windows of approximately 1 μm in the near-infrared (NIR) band that can be used to peek through the dense atmosphere and attempt to determine Venus’ surface compositions. A past mission, involving the Galileo spacecraft, equipped with a near-infrared mapping spectrometer (NIMS), was able to evaluate the spatial variation of the 1.18 μm emissivity on the Venusian surface and found that most of the lowlands had higher emissivity than the highlands. This led to speculation of a compositional contrast between the highlands (felsic) and lowlands (basaltic) [12]. The Venus Express orbiter observed the Venusian surface using a visible and infrared thermal imaging spectrometer (VIRTIS) and detected several hotspots with high infrared emissivity. These were speculated to be fresh lava flows, with slight weathering and an estimated age younger than 2.5 million years (or even younger, perhaps 250,000 years or less) [13]. In planned future missions, the Venus Spectroscopy Suite (VenSpec) of the EnVision mission and Venus Emissivity Mapper (VEM) of the VERITAS mission will probe the surface of Venus using six bands: 0.86, 0.91, 0.99, 1.02, 1.11, and 1.18 μm. The Venus Imaging System for Observational Reconnaissance (VISOR, 930–1030 μm) and Venus Descent Imager (VenDI, 740–1040 nm) carried by the DAVINCI+, will perform infrared imaging of the Venusian surface during flyby and descent, respectively [14,15,16,17,18,19,20]. Previous studies suggested that the thermal radiation of the spectral window was correlated with the surface composition after calibration, making it possible to probe the composition of the Venus surface remotely [21,22,23]. However, it was unclear whether the detected emissivity dichotomy was due to differences in the primitive compositions of the geological units or whether it reflected surface weathering characteristics due to different elevations and temperatures on the Venusian surface [2,12]. In addition, it remains uncertain whether volcanic activity is active on Venus or if weathering processes may efficiently reduce the emissivity of lava flows. Interpretations of spectral anomalies on Venus require further studies, particularly experimental simulations.
Using data from the Venusian atmosphere and in situ analyses of landing sites, thermodynamic simulations can provide us with potential mineral information relating to the surface of Venus. In the relevant gas–solid oxidation thermodynamic simulation calculations, the reaction equilibrium between igneous rocks and the atmosphere of CO2, CO, and H2O produced minerals containing Fe3+, such as magnetite [24]. Magnetite may be further oxidized to produce hematite [25]. Under Venusian conditions, CO2 can oxidize Fe2+ in silicate minerals [25]. Silicate minerals that may exist in the basaltic Venusian crust, such as Fe-bearing olivine and pyroxene, may be unstable under Venusian conditions, producing magnesian olivine, enstatite, quartz, hematite, magnetite and pyrite [25]. At higher elevations, more abundant iron-rich olivine or pyroxene may be stable [26]. Venus’ modal radius is close to the conditions of equilibrium between enstatite, calcite and quartz [26,27,28,29,30,31]. At a certain temperature and pressure, silicate materials will undergo carbonation reactions [32], but under the high-temperature conditions of Venus, carbonates may be unstable [33,34]. When calcium silicates are exposed to CO2 gas containing SO2, they become unstable and form calcium sulfate [35]. However, actual results will still be limited by uncertainties relating to the mineral composition of the Venusian surface and the planet’s atmospheric composition. Variations in the starting materials and environmental conditions will, therefore, result in different products. Experiments are still needed to explore the secondary minerals formed by the oxidation of different materials under Venusian conditions, as well as the reaction rates and mechanisms involved.
Understanding the weathering processes of surface materials under a hot atmosphere is fundamental to interpreting spectroscopic data obtained by previous and future missions [36]. In the basaltic crust of Venus, olivine ((Mg, Fe)2SiO4) is one of the rock-forming minerals that is subject to fast oxidation and sulfatization [25], which may greatly contribute to spectral characteristics on the Venus surface. Under a heated and oxidizing CO2 atmosphere, oxidation products of olivine with different Fa# values (Fa# represents Fe mol% in the solid solutions) at equilibrium have been predicted thermodynamically [25]. However, the oxidation rates, product assemblages and spectral characteristics, at different oxidizing stages, will require further study. Fegley et al., in 1995, studied the oxidation of basalt under a heated CO-CO2 atmosphere and found that Fe3+ was produced in the oxidized basalt—and that the red color observed at several Venus landing sites was due to the oxidation product hematite [37]. Studies in recent years by Filiberto et al. (2020) [38] and Cutler et al. (2020) [39] conducted high-temperature oxidation experiments on magnesian olivine, pyroxene and alkaline basalt, respectively, under a heated Earth atmosphere. They found that the spectral features of primitive basalts and rock-forming minerals would be altered quickly due to oxidation and argued for active volcanism on present-day Venus. However, these experiments used the more oxidizing Earth atmosphere, rather than the analogous Venusian atmosphere, which could have resulted in different oxidation rates and products. More recently, Teffeteller et al., in 2022, simulated the oxidation of basalt at 470 °C and 700 °C and pressures of ~90–92 bars under a pure CO2 atmosphere. They reported an enrichment of divalent cation species at the altered zone toward the basalt surface, of which Ca2+ was enriched by ~5 wt% and Fe2+ was enriched by ~1–2 wt%. This work limited the age of basalts on Venus to 268–1900 years [40]. Santos et al., in 2023, exposed 13 minerals and basalt samples to a complex synthetic Venus atmosphere using the NASA Glenn Extreme Environments Rig (GEER). They found that secondary minerals were formed primarily by the reaction of iron and calcium with solid samples with sulfur in atmospheric gases [41]. These new studies are of great significance to efforts to elucidate rock–atmosphere interactions on the Venusian surface. However, the oxidized basalt, produced under CO2 or within the GEER, was not analyzed in detail, particularly with respect to microscopic structures or spectral information. Thus, the unmeasured fugacity of O2, as found within the GEER, and the lack of observable reactions in many minerals during the short experimental period (i.e., tens of days) made it difficult to constrain the oxidation processes. In addition, although Venus has been presumed to be Earth-like, it is presently unclear whether Fe-rich olivine (Fa# > 20) is present on Venus or how the oxidation of Fe-rich olivine under heated CO2 might differ from magnesian olivine. Additional oxidation experiments on olivine with different Fa# values under heated CO2 were necessary to elucidate oxidation rates and products, as well as the corresponding spectral variations.
In this study, we experimentally investigated the high-temperature oxidation of olivine types with different Fa# values (Fa09, Fa29, and Fa71) under a heated CO2 atmosphere (470 °C and 900 °C) to determine their influence on spectral characteristics. The oxidation products (including both microscopic and macroscopic features), olivine conversion rates and spectral characteristics of different types of olivine were compared, providing new insights into atmosphere–surface interactions on the Venusian surface.
2. Materials and Methods
2.1. Preparation of Initial Olivine Samples
Three types of olivine with different Fa# values (Fa09, Fa29, and Fa71) were used in this study. Fa09 was natural olivine, collected from Damaping, Hebei Province, China. Fa29 and Fa71 were produced by mixing San Carlos olivine (Fa10) and synthetic fayalite (Fa100) in varying ratios; the synthetic fayalite was obtained by combining Fe2O3 and SiO2 powders in a molar ratio of 1:1002 and synthesizing them in a furnace under controlled oxygen buffer. The resulting mixture was then ground to under 10 μm and annealed at 1670 K for 16 h in a CO and CO2 mixture, which buffered the fO2 at 10−5 Pa. The nonstoichiometric ratio was used to ensure that samples were buffered by enstatite instead of an iron oxide phase [42]. The prepared initial Fa29 and Fa71 were first checked for purity with powder X-ray diffraction (XRD) and then analyzed for chemical composition after digestion with an inductively-coupled plasma emission spectrometer (ICP735-ES). The chemical composition of the initial olivine is shown in Table 1. Since the synthetic Fa29 and Fa71 samples were clasts with various sizes, for experimental considerations, all initial olivine samples were ground and sieved to ~74 μm. The choice of the grain size of 74 μm was an effort to balance homogeneous size (to use in different experiments) and to minimize sample waste during the grinding and sieving processes. The olivine powders were oven-dried for 24 h at 60 °C before the oxidation experiments.

Table 1.
Chemical composition of initial olivine samples used in this study.
2.2. Olivine Oxidation Experiment
The olivine oxidation experiments were conducted in a vacuum atmosphere chamber furnace (Figure 1). The chamber was composed of an alumina polycrystalline fiber material with a volume of 300 × 200 × 200 mm. For each set of experiments, approximately 1 g of initial olivine powder was added to a corundum crucible, and then placed in a one-atmosphere furnace. The temperatures (T) were set at 470 °C (simulating the average lowlands T of Venus) and 900 °C (simulating the T of cooling lava flow, as well as longer durations). During the experiments, the furnace was filled with high-purity CO2 (99.99%) at a rate of 0.5 L/min, and the pressure inside the furnace was maintained at 1 bar. The experimental durations lasted 12 h to 24 days at 470 °C and 1 h to 3 days at 900 °C. All three types of olivine (Fa09, Fa29, and Fa71) were placed in the furnace at the same time under each experimental condition (T and durations) to minimize the experimental errors caused by different batches. Due to safety concerns, it was necessary to stop heating the furnace every 6 days and wait until it cooled to room temperature before beginning another heating cycle. This procedure applied to all the experiments that lasted longer than 6 days. In the end, the final products were removed from the furnace after the furnace cooled to room temperature (for an additional 11 h).
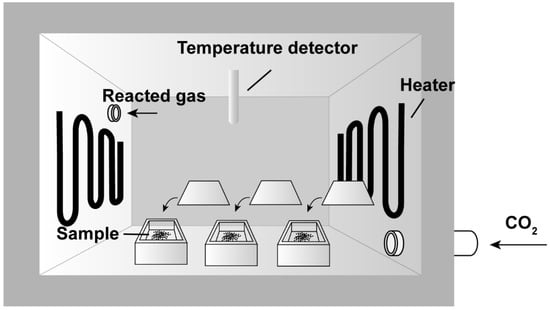
Figure 1.
Experimental settings of the CO2 oxidation experiments. The furnace is heated with a temperature detector, monitoring temperature and facilitating constant high-temperature conditions. During the experiments, high-purity CO2 gas flows into the furnace at a rate of 0.5 L/min, and the pressure inside the furnace is maintained at 1 bar. Reacted gas is then out-flowed to the furnace from the outlet. The olivine powders are placed in corundum crucibles inside the furnace.
2.3. Sample Analysis
The chemical compositions of the initial olivine were analyzed after acid digestion and determined by an inductively-coupled plasma emission spectrometer (ICP735-ES).
The purity of the initial olivine and the mineralogy of the final products were analyzed by powder XRD. The powder XRD data were collected using a Panalytical Empyrean diffractometer at 40 kV and 40 mA with Cu–Ka radiation (λ = 1.5419 Å). The XRD data were collected between 10°~60° 2θ, with a scan step of 0.0263° and 36.465 s of counting time per step. The detection limit of mineralogical phases was 5.0 wt%.
The Fe-bearing phases in a select of final products were analyzed by the Mössbauer method at the Center for Advanced Mössbauer Spectroscopy of the Dalian Institute of Chemical Physics, Chinese Academy of Sciences. Room-temperature (at 298 K) 57Fe Mössbauer spectra were collected for all samples using a Japanese Topologic 500 A (MFD-500AV) Mössbauer spectrometer and 57Co(Rh) radiation source. A few samples were subjected to additional analysis for low-temperature (at 6.2 K) 57Fe Mössbauer spectroscopy using a WissEl low-temperature closed-cycle 57Fe Mössbauer spectrometer (SLD-500/SHI-850-5). The detector used a proportional counter, the Doppler velocity was calibrated with a standard α-Fe foil and the absorption thickness of the sample was adjusted to 10 mg Fe/cm2. The test lasted 6–7 h for room-temperature analysis and 1–3 days for low-temperature analysis. The acquired Mössbauer spectra were fitted using the Lorentz absorption curve with MossWinn 3.0i software. Qualitative analyses of the oxidized phases in the samples were conducted by fitting the Mössbauer parameters, including isomer shift (IS), quadrupole splitting (QS), absorption linewidth (LW) and hyperfine magnetic field (B) parameters. The fractions of different Fe-bearing species in each sample were determined by integrating the absorption peak area of each subspectrum.
The initial olivine and final products were also analyzed by an InVia-532 Raman spectrometer. The laser source was 532 nm with a spectral resolution of 1.3 cm−1 in the wavenumber range of 400–1500 cm−1. A total of 10 to 15 analysis points were randomly selected under microscopy to be representative of the entire sample. Spectral data were matched using the RRUFF database [43]. For data not included in the RRUFF database (e.g., maghemite (γ-Fe2O3) and magnesioferrite (MgFe2O4)), Raman activity peak positions were obtained from references.
The microcharacteristics of the initial olivine and final products were analyzed by scanning electron microscopy (SEM) and energy dispersive X-ray spectrometry (EDS) at the Institute of Geochemistry, Chinese Academy of Sciences. SEM images and EDS of the samples were collected using an FEI Scios. Prior to analysis, the samples were made into polished sections, after which high-resolution backscattered electron images were obtained at an accelerating voltage of 20 kV and a current of 1.4 nA. The smaller target mineral phases in the samples were analyzed with an accelerating voltage of 20 kV and a current of 0.4 nA. For nanophase minerals requiring higher resolution analysis, focused ion beam (FIB) sections less than 100 nm thick were prepared with the focused ion beam from SEM. The prepared FIB sections were analyzed by field emission transmission electron microscopy (TEM) (model Tecnai G2 F20 S-Twin) at the State Key Laboratory of Environmental Geochemistry, Institute of Geochemistry, Chinese Academy of Sciences, in order to obtain high-resolution images and electron diffraction patterns of the nanophases. The EDS of the nanophases was analyzed by a configured X-ray energy dispersive spectrometer (EDX).
The visible near-infrared spectral characteristics of the initial olivine and final products were measured using the FieldSpec-4 ASD high-resolution spectrometer in the Key Laboratory of Earth and Planetary Physics, Institute of Geology and Geophysics, Chinese Academy of Sciences. The field of view of the spectrometer was set to 1 mm. The spectra were measured in dark conditions with a light source incidence of 30°, a detection angle of 0° and a step size of 1°. The spectra of each sample were collected three times and averaged. The spectra ranged from 350 nm to 2500 nm, with a spectral resolution of 1 nm.
3. Results
3.1. Characterization of Initial Olivine
The color of the initial olivine powder changed from off-white to brownish-green with increasing Fa# (Figure 2A–C). The XRD pattern of the natural Fa09 samples was primarily composed of olivine with a small amount of enstatite (Figure A1). In comparison, the two synthetic Fa29 and Fa71 were pure olivine samples (Figure 3 and Figure A2). SEM-EDS analysis of the initial olivine showed that natural Fa09 also contained trace impurities such as Fe oxide and chromite (FeCr2O4) (Figure A3). In the synthetic olivine, due to the excess of initial SiO2 induced in the synthesis of Fa100, slight SiO2 residuals were inherited in the Fa29 and Fa71 samples, present in the interior of the olivine grains (Figure 4). The chemical compositions of the initial olivine samples are shown in Table 1.
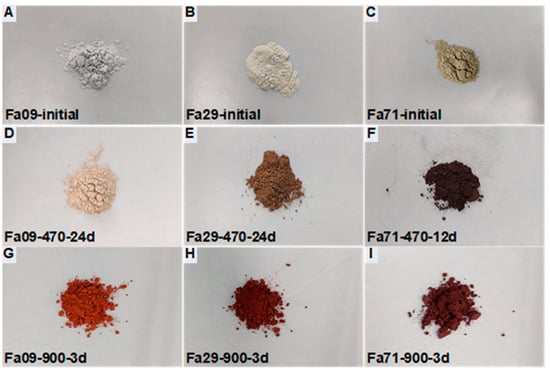
Figure 2.
Color variations of initial olivine samples to final oxidation products at 470 °C and 900 °C. (A) initial Fa09; (B) initial Fa29; (C) initial Fa71. The colors of the initial olivine powders change from off-white (A) to brownish-green (C) as the Fa# values increase. (D–F) The final products of Fa09 to Fa71, oxidized at 470 °C for the longest oxidation times (24 days for Fa09 and Fa29; 12 days for Fa71). The colors vary from light yellow (D) to brown (E) and dark brown (F). (G–I) The final products of Fa09 to Fa71, oxidized at 900 °C for the longest oxidation times (3 days). The products show substantial color change and red tone overall, varying from red to dark red with increasing Fa# values.
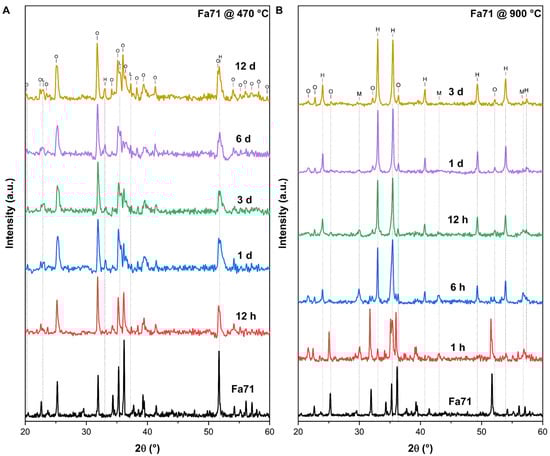
Figure 3.
XRD patterns of the initial Fa71 and its final oxidation products at 470 °C and 900 °C. (A) Under 470 °C. (B) Under 900 °C. O = olivine; H = hematite; M = magnetite; L = laihunite.
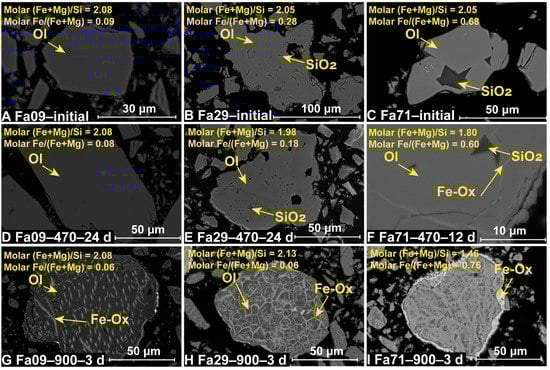
Figure 4.
SEM-EDS analysis of the initial and final oxidized samples. (A–C) The initial olivine of Fa09, Fa29 and Fa71, respectively. (D–F) The final products of Fa09 through Fa71, oxidized at 470 °C for the longest oxidation times (24 days for Fa09 and Fa29; 12 days for Fa71). (G–I) The final products of Fa09 through Fa71, oxidized at 900 °C for the longest oxidation times (3 days). Excess SiO2 is induced via the synthesis processes and found in the interior of synthetic Fa29 and Fa71. After oxidation at 470 °C, Fa09 (D) and Fa29 (E) show no substantial differences in morphology from their initial states, and Fa71 (F) produces Fe-oxides along the interior cracks within the olivine particles. After oxidation at 900 °C, Fe oxides are ubiquitously formed in all three types of olivine on the rim of olivine and along the dislocations and cracks in the interior of olivine. The altered olivine shows various morphologies depending on different Fa# values, with Fa09 (G) in the form of spots and Fa29 (H) and Fa71 (I) in gridded patterns. Ol = Olivine; Fe-Ox = Fe Oxide.
3.2. Color and Compositional Changes after Oxidation under CO2
3.2.1. Color Changes after Oxidation
The oxidation products of olivine showed different colors depending on the initial Fa# values, oxidation temperature and oxidation duration (Figure 2). At 470 °C, the final products of olivine Fa09, Fa29 and Fa71 after oxidation were light yellow, brown and dark brown, respectively (Figure 2D–F). At 900 °C, the final products of olivine Fa09, Fa29 and Fa71 showed substantial color changes—to red tones overall, varying from red to dark red with increasing Fa# values (Figure 2G–I).
3.2.2. Mineralogical Composition of the Oxidation Products
The mineralogical compositions of the oxidation products, as determined by XRD, Mössbauer and Raman, are summarized in Table 2.
Table 2.
Mineralogical compositions of final products in the olivine oxidation experiments.
At 470 °C, the XRD patterns of the final oxidation products of Fa09, Fa29 and Fa71 were composed mainly of initial mineral phases, with minor weak peaks of secondary minerals appearing. In Fa09, the final sample consisted of olivine and enstatite peaks with new weak peaks of magnesium ferrous oxide and quartz (Figure A1A). In Fa29, no new peaks of any oxidation products were detected (Figure A2A). In Fa71, peaks of hematite (α-Fe2O3) (2θ = 33.0°) and laihunite (, 2θ = 35.5° and 37.3°) were found in the oxidation products (Figure 3).
At 900 °C, Fa09 started to produce hematite and quartz after 1 h of oxidation, and the XRD peaks of the final products were dominated by olivine (Figure A1B). In Fa29, hematite started to appear after 1 h of oxidation, and a mineral phase bearing a spinel-type structure (magnetite or magnesioferrite) started to appear after 6 h of oxidation (Figure A2B). The XRD peaks of the final products in Fa29 were dominated by olivine. In Fa71, hematite and magnetite started to appear after 1 h of oxidation, and the final products were dominated by hematite instead of olivine (Figure 3B).
Mössbauer spectroscopy provided quantitative proportion information on the Fe-bearing phases in the final products. In the 470 °C experiments, the room-temperature Mössbauer spectra of Fa09 and Fa29 were fitted with two doublets, of which one belonged to olivine bearing Fe2+; the other small doublet was fitted to laihunite () [44] (Figure A4A,C). Further analysis by low-temperature Mössbauer spectroscopy of the final products of Fa29 showed that the small doublet in the room-temperature Mössbauer spectra was generated by a joint contribution of magnetite and laihunite (Figure A4E); thus, we assigned the small doublet as Mag-Lh. The Fa71 spectra were fitted with two doublets and one sextet (Figure A4F). The doublets were the same as those found in the Fa09 and Fa29 products: olivine and Mag-Lh, respectively. The parameters of the sextet corresponded to hematite [45]. In the final products of Fa09, Fa29 and Fa71, the Fe(II) phases, as olivine, remained at 91.0%, 92.7% and 67.3% of the total Fe-bearing phases, respectively (Figure A5; Table A1). The extent of Fe oxidation was substantially higher in Fa71 than in Fa09 and Fa29.
In the 900 °C experiments, three sextets were fitted in all three final products of the Fa09, Fa29 and Fa71 experiments (Figure A4B,D,G). The first sextet was attributed to hematite Fe3+ (IS: 0.37 mm/s, QS: −0.20 mm/s, B = 51.27 T), while the second and third sextets corresponded to tetrahedral Fe (IS: 0.50 mm/s, QS: −0.10 mm/s, B = 47.55 T) and octahedral Fe (IS: 0.35 mm/s, QS: −0.10 mm/s, B = 50.00 T) of magnetite [45] (Table A1). Under the same experimental conditions, the proportions of hematite in the final products gradually increased as the Fa# values increased. Olivine was found to remain only in the final products of Fa09 (12.8%); it was completely converted to magnetite and hematite in the Fa29 and Fa71 experiments. Additional analyses of samples from the Fa71 experiment at 900 °C showed that magnetite and hematite were present in the sample within 1 h of oxidation. Additionally, magnetite was produced in higher amounts than hematite, suggesting the conversion of intermediate magnetite to hematite as oxidation proceeded.
The Raman results were consistent with the findings in XRD and Mössbauer spectroscopy (Figure A5). Being oxidized at 470 °C, hematite was present in all oxidized samples. Magnesioferrite (MgFe2O4, 479 cm−1) was identified in the Fa09 and Fa29 experiments, and magnetite (665 cm−1) and maghemite (711 cm−1) [46] were found in the Fa29 and Fa71 experiments. In the 900 °C experiments, hematite was commonly present in all samples. Olivine bands were still clearly present in the final product of the Fa09 experiments, but were weak in the Fa29 experiments and absent in the Fa71 experiments (Figure A5). Magnesioferrite (211.4, 327.9, 480.7, 553.0 and 703.4 cm−1) [47] was identified in the Raman spectra of the final products of Fa09 and Fa29, consistent with the black particles observed microscopically in the samples. Magnetite and maghemite were present in substantial amounts in the early stage of oxidation (1–6 h) in the Fa29 and Fa71 experiments and then were gradually converted to hematite as oxidation proceeded.
3.3. Microscopic Features of the Oxidation Products
At 470 °C, there were no obvious secondary phases or morphological changes found by SEM in the final products of Fa09 (Fa09–470–24 d) or Fa29 (Fa29–470–24 d), as compared to their initial states (Figure 4A,B,D,F). In Fa71, the molar fraction of Fe in the altered olivine was decreased, and Fe oxides formed along the cracks inside the olivine particles (Figure 4C,F). We chose samples of Fa71–470–12 d, Fa29–900–3 d and Fa71–900–3 d to perform further TEM analysis (Figure A6). During preparation of the FIB foil of sample Fa71–470–12 d, the ion beam probe shifted due to the presence of magnetic materials within the sample, consistent with the detection of maghemite, magnetite or laihunite. TEM analysis of Fa71–470–12 d found that hematite was formed on the grain surface (Figure 5A), while laihunite was produced in the relative interior layer beneath the hematite layer (Figure 5B). Additionally, Fe oxides were present on the cracks (Figure 5A). Disordered folds formed in the altered olivine close to the grain rim, and the (Fe+Mg)/Si molar ratio was slightly lower than that of primitive olivine. Electron diffraction patterns of TEM of those disordered folds suggested an olivine-type structure, such as altered olivine or laihunite (Figure 5B).
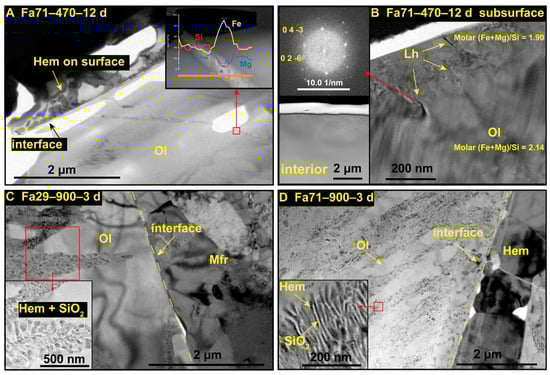
Figure 5.
TEM-EDS analysis of oxidized Fa29 and Fa71 samples. (A,B) Fa71 at 470 °C for 12 days. (A) The hematite layer is generated on the olivine surface, with the inset showing that Fe oxides are generated on the cracks. (B) The folds near the subsurface of olivine particles produced by the oxidation reaction. The upper inset shows the electron diffraction pattern near the fold, which is consistent with the laihunite; the lower inset shows the TEM images of the interior of altered olivine, which shows no obvious changes. (C,D) Fa29 and Fa71 oxidized at 900 °C for 3 days, respectively. The altered olivine produces intergrown hematite and amorphous silica, as the enlarged images show in the insets of (C,D), respectively. Interfaces separating the intergrown features and the single-phase layer are identified in these two samples. In Fa29, the single-phase layer consists primarily of magnesioferrite, and in Fa71, the single-phase layer consists mainly of hematite. Ol = olivine; Hem = hematite; Mfr = magnesioferrite.
After being oxidized at 900 °C, substantial morphological changes were observed by SEM in all three types of olivine. Bright oxidation products were present as coatings on the olivine rim and filled along the dislocations and cracks in the olivine interior (Figure 4G–I). Morphologies of newly-produced phases varied depending on different Fa# values. On the olivine surface, oxides were present as thick coatings in the final products of Fa29 and Fa71 (Figure 4C,D). In the interior of olivine, the newly-formed phases were distributed as dots in Fa09 (Figure 4G) and as gridded patterns across the whole grain in both Fa29 and Fa71 (Figure 4H,I). TEM analysis of Fa29–900–3 d and Fa71–900–3 d found that hematite and amorphous SiO2 intergrowth formed in the dislocation (Figure 5C,D).
3.4. VNIR Spectroscopy of the Oxidation Products
The initial olivine showed diagnostic absorption, primarily at approximately 630 nm, 850 nm (M1 site), 1020 nm (M2 site) and 1300 nm (M1 site) in the VNIR range (Figure 6A) [48,49]. The diagnostic absorption of olivine at the M2 site (1020 nm) was the most significant, and the absorption at the M1 site (850 nm) was the weakest. The infrared spectra of natural olivine (Fa09) and synthetic olivine (Fa29 and Fa71) had similar profiles. With increasing Fa# values, the depth of the diagnostic absorption band near 1020 nm gradually deepened, and the diagnostic absorption center moved toward the longer wavelength. In addition, the absorption band grew broader as the Fa# values increased.

Figure 6.
Comparison of visible and near-infrared spectra (VINR) of initial olivine (Fa09, Fa29 and Fa71) and their oxidation products. (A) Initial olivine of Fa09, Fa29 and Fa71. The arrows point to the diagnostic absorption center of initial olivine, in which the M2 position shifts toward longer wavelengths with increasing Fa# values. The band depth of the diagnostic absorption also gradually deepens with increasing Fa# values in the initial olivine. (B) Spectral comparisons of the oxidation products of Fa09, Fa29 and Fa71 at 470 °C for 12 days. (C) Spectral comparisons of the oxidation products of Fa09, Fa29 and Fa71 at 900 °C for 3 days. The alterations in the reflectance of Fa09, Fa29 and Fa71 under oxidizing conditions show gradual changes, consistent with those of the initial olivine.
The oxidation products at 470 °C showed substantial changes in reflectance within the visible band and 1 μm diagnostic absorption of olivine across the three types of olivine (Figure 7B). In each olivine, as the oxidation proceeded, the spectral change occurred most substantially in the early stages of oxidation (e.g., 3 days for Fa09 and Fa29 and 12 h for Fa71), after which the spectra showed relatively minor changes (Figure 7A–C). The oxidized samples in the Fa09 and Fa29 experiments still demonstrated olivine diagnostic absorption at approximately 1 μm (Figure 7A,B), with reflectance in the 400–900 nm range generally decreasing and diagnostic absorption at 630 nm disappearing. The band depth of the 1 μm olivine diagnostic absorption band remained, but grew shallower in Fa09 and Fa29, as compared to the initial olivine (Figure 7A,B). In the oxidized Fa71, the 1 μm olivine diagnostic absorption disappeared (Figure 7C), while a substantial fraction of olivine (67.3%) was still present in the sample. In addition, after oxidation, the spectra substantially darkened in the visible band range, and the spectral profile flattened. No characteristic absorption of newly-produced phases appeared in the spectra.
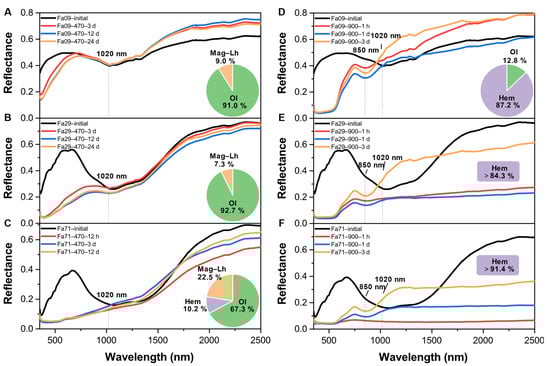
Figure 7.
VNIR spectroscopy of oxidized products and their corresponding Fe-bearing phase compositions. The pie charts are of the final products in each experiment, and the Fe-bearing phase compositions are determined by Mössbauer. (A–C) Gradual changes in the VNIR of Fa09, Fa29 and Fa71 oxidized at 470 °C, from initial to 24 days in (A,B) and from initial to 12 days in (C). After oxidation, the diagnostic absorption band depth BD(λc) of Fa09 and Fa29 olivine attenuates (and disappears, in the case of Fa71). (D–F) Gradual changes in the VNIR of Fa09, Fa29 and Fa71 oxidized at 900 °C from start to 3 days. The diagnostic absorption band of olivine disappears in the final products, and the hematite diagnostic absorption at 850 nm becomes predominant in the spectra. The proportion of hematite in the final product increases as the Fa# values increase. Olivine is completely transformed into hematite in the Fa29 and Fa71 experiments, and a small fraction of olivine remains in the Fa09 experiments. The diagnostic hematite absorption band appears most quickly in Fa09 and most slowly in Fa71. Mag-Lh = magnetite and laihunite; Ol = olivine; Hem = hematite.
At 900 °C, due to substantial phase changes in the oxidized products, from olivine to hematite, the reflectance of the oxidized samples was altered accordingly, demonstrating the absence of olivine diagnostic absorption bands at 1020 nm and the occurrence of hematite diagnostic absorption at 850 nm (Figure 7D–F). The band depth of 850 nm, representing hematite, increased with increasing oxidation duration. Considering the influence of the initial Fa# values of olivine, the hematite diagnostic absorption band appeared earlier in Fa09 and relatively late in Fa71.
Since nightside thermal emissions of Venus at 1.02 and 1.18 microns have been converted into emissivity to analyze the Venusian surface [12,13], we compared the changing trends of reflectivity, at 1020 nm and 1180 nm (i.e., R1020 and R1180), between our oxidation products and their initial counterparts, at 470 °C and 900 °C, along the oxidation durations (Figure 8). The final products of Fa09, being oxidized at 470 °C or 900 °C, produced consistently higher R1020 and R1180 values than those of the initial Fe09. Final products of Fa29, being oxidized at 470 °C, showed decreasing trends of R1020 and R1180 compared to the initial Fa29. After oxidation at 900 °C, R1020 and R1180 of the Fa29 products first decreased to lower than the initial Fa29 and then reversed. The final R1020 and R1180 were substantially higher than those of the initial Fa29. The final products of Fa71 at 470 °C showed a decreasing trend of R1020 and a generally increasing trend of R1180. Being oxidized at 900 °C, the variation trends were similar to those of Fa29.
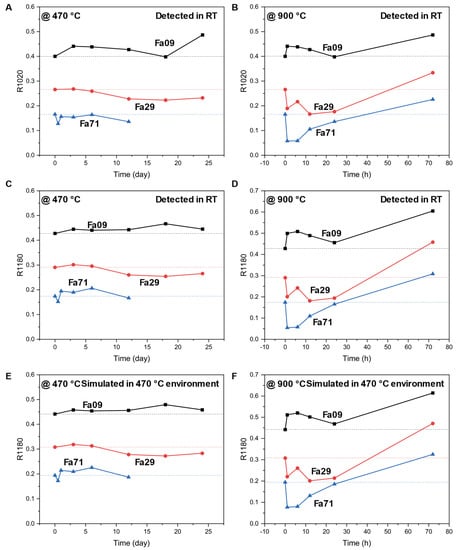
Figure 8.
Variations in R1020 and R1180 for Fa09, Fa29 and Fa71 with increasing oxidation time. (A) and (B) are the measured R1020 of three olivine samples oxidized at 470 °C and 900 °C, respectively. (C) and (D) are the measured R1180 of three olivine samples oxidized at 470 °C and 900 °C, respectively. (E,F) are the simulated R1180 of samples—the same as those presented in (C,D)—considering the influence of thermal radiance at 470 °C, within which the spectral measurements are conducted. The dashed lines represent the spectral parameters of initial olivine. The final products of Fa09, being oxidized at 470 °C or 900 °C, produce consistently higher R1020 and R1180 values than those of the initial Fe09. Final products of Fa29, being oxidized at 470 °C, show decreasing trends of R1020 and R1180 compared to the initial Fa29. After oxidation at 900 °C, the R1020 and R1180 of the Fa29 products first decrease to lower than the initial Fa29 and then reverse to increase; the final R1020 and R1180 are substantially higher than those of the initial Fa29. The final products of Fa71 at 470 °C show a decreasing trend of R1020 and a generally increasing trend of R1180. Being oxidized at 900 °C, the variation trend is similar to that of Fa29. Simulated spectral parameters, considering high environmental temperature in the spectral measurements, show similar patterns to the measured spectral parameters. RT = room temperature.
Because the high temperature on the Venusian surface can affect the infrared spectrum of the surface [50,51], we evaluated the influence of the environmental temperature from which the spectra were obtained (i.e., 470 °C for the Venus surface). By assuming the surface target to be an ideal black body, we constructed the ideal spectral radiance as a function of wavelength (between 0.8 and 1.6 μm) using the Planck function (Figure A8). The Plank function suggested that the emissivity at 470 °C was minor at wavelengths of 1020 and 1180 nm (absolute deviation of reflectivity was 0.009~0.023); therefore, the spectra received by the infrared detector at the two wavelengths were primarily contributed from the reflectance rather than the emissivity. Therefore, the VNIR spectra measured at room temperature were representative of those measured under high-temperature Venus surface conditions (Figure A9). Consistently, the simulated spectral parameters, considering the 470 °C high temperature, influenced the spectral results, leading to patterns similar to the measured spectral parameters (Figure 7C–F).
4. Discussion
4.1. Oxidation Products of Olivine under High-Temperature CO2
The mineralogical compositions of the final oxidation products are summarized in Table 2. The formation of these oxides was consistent with previous experimental results and thermodynamic modeling predictions, i.e., the reaction of basalt or silicate minerals, under oxidizing gases, producing secondary iron oxides [25,36,37,38,39,40,41,52,53]. However, we also found additional mineral phases that were not observed in previous experiments and thermodynamic modeling works, such as magnesioferrite, laihunite, and SiO2—the latter of which was amorphous, not quartz. The main effect of pure CO2 was oxidation, which differing from the effects of complex gases, which showed both sulfatization and oxidation [41]. In general, the primary oxidation products of olivine (Fa09, Fa29 and Fa71) under CO2 at 470 °C are magnesioferrite, magnetite, laihunite, hematite and maghemite; at 900 °C, the primary oxidation products were hematite, magnetite, magnesioferrite and amorphous SiO2. Primary oxidation pathways converted Fe(II) in fayalite to Fe(III) either as Fe-silicate or Fe-oxides. Minerals with mixed Fe valance, such as magnesioferrite, magnetite, and laihunite, were substantially produced during the oxidation processes.
Magnetic minerals, such as magnetite, laihunite and maghemite, are important components, both as oxidation intermediates and final products. Previous work has confirmed that magnetite and hematite formed after olivine oxidation will convert the magnetic property from paramagnetic to ferromagnetic [52]. The products of our experiment were consistent with those works, and we also found additional magnetic minerals, specifically maghemite and laihunite. Maghemite is generally produced via oxidation below 300 °C [54]; we inferred that the maghemite found in some samples of the Fa29 and Fa71 experiments was formed during the cooling processes in our experiment, rather than during oxidation at 470 °C. Nevertheless, oxidized olivine carries strong and stable permanent magnetization [55], and the presence of substantial magnetic minerals on the subsurface and interiors of the olivine grains would have an important influence on the magnetic features and remanence on the ground of Venus. In particular, magnetic minerals, if formed in the interior of olivine grains (e.g., in cracks and dislocations), might be subject to relatively lagged conversion times and preserved for longer time periods on the Venus surface.
The formation of laihunite in our experiments (for Fa09, Fa29 and Fa71) at 470 °C was consistent with previous studies, suggesting that laihunite can be produced by the oxidation of fayalite in the Earth atmosphere at 700 °C [56]. Fegley et al., in 1992, inferred that laihunite could potentially be present on the surface of Venus [57], but there was a lack of experimental support to show whether laihunite could be produced under CO2 oxidation by a solid solution of olivine at that time. The detection of laihunite in the final oxidation products of the Fa29 and Fa71 experiments indicated that the forsterite-fayalite solid solution could produce laihunite under a CO2-dominant atmosphere at the Venus ground surface. Laihunite decomposes at temperatures greater than 850 °C [58], but there is no evidence suggesting that laihunite decomposes at lower temperatures. Consistently, our results showed that laihunite formed in the final products of all three types of olivine at 470 °C but not at 900 °C. Whether laihunite could be stable for a long period time on the surface of Venus remains controversial. Since our experiments fell short of reaching equilibrium, it remains unclear whether laihunite would have converted to other phases as oxidation proceeded.
Mössbauer spectroscopy showed that the magnetite in the final products at 900 °C had octahedral Fe (i.e., Fe(O)) to tetrahedral Fe (i.e., Fe(T)) molar ratios of 1 in the Fa09 experiment and 0.5 in the Fa29 and Fa71 experiments. These were abnormal compared to the normative Fe(O)/Fe(T) ratio of 2 in magnetite. We inferred that the abnormality was induced by hematite, which substantially contributed to the tetrahedral Fe in the process of hematite particle growth [59].
Fe oxides at 900 °C formed within the dislocations, and cracks were mainly Mg free, potentially due to the faster migration of Fe compared to Mg under high-temperature conditions [60]. As Fe preferentially migrated to dislocations and the interface of the olivine–atmosphere interactions, Fe oxides were first produced collectively at these dislocations and cracks to form iron oxides. Mg migrates slower than Fe and was thus involved in producing magnesioferrite, later than Fe oxides, at the olivine–atmosphere interfaces. This explained why magnesioferrite was only produced in the late oxidation stage of Fa09 and Fa29. In addition, the compositions of the produced oxidation coating differed, with different Fa# values in the initial olivine. For example, the oxidation coatings produced on Fa71 grains were mainly composed of hematite, with a small amount of magnesioferrite, and the coatings were mainly composed of magnesioferrite on Fa29 grains. The availability of Mg in the initial olivine and the oxidation rates could both account for determining the compositions of the oxidation rims. Since the Fa# values of the Venusian crust remain largely unconstrained and may be inhomogeneous globally, a variety of oxides are likely present.
In addition, although Mg-pyroxene was predicted to present thermodynamically by the interaction of produced SiO2 with forsterite under a CO2 atmosphere [25], we did not observe newly-produced Mg-pyroxene in the oxidation products by XRD, Raman, SEM or TEM analysis. Pyroxene and quartz, present in the Fa09 experiment, were impurities in the initial samples. Pyroxene was not observed, potentially due to its small grain size, if it was present. Alternately, the reaction conditions of forsterite and amorphous SiO2 to Mg-pyroxene may not have been reached. Previous work has shown that quartz disappears above 1000 °C, after olivine is calcined [61]; however, our experimental temperature was lower.
4.2. Olivine Conversion Rates and Influencing Factors
We compared the conversion rates of different olivine types using the fractions of newly-formed secondary phases under the same oxidation duration. Such an estimate could provide a first-order observation of the oxidation process and elucidate the speed at which initial olivine would convert to new phases in different Fa# olivines at different temperatures. It is worth noting that the conversion rates and oxidation rates of the olivine types were not uniform, as indicated by the spectra. Oxidation could, therefore, be fast in the early stages and then slow down in later stages as new phases coat on the olivine surface.
At 470 °C, the conversion fractions of Fa09 and Fa29 in the final products, after 24 days, were 9.0% and 7.3%, and the conversion fraction of Fa71 in the final products, after 12 days, was 32.8% (Table A1). Accordingly, the average conversion rates of Fa09, Fa29 and Fa71 at 470 °C were 0.38%, 0.30% and 2.73% per day, respectively. The average conversion rates of Fa09 and Fa29 were comparable and both were slower than that of Fa71. The conversion rate of Fa71 was approximately 9 times faster than those of Fa09 and Fa29 at 470 °C. At 900 °C, after 3 days, Fa29 and Fa71 were completely converted to Fe oxides; thus, their conversion rates should have. been higher than 33.33% per day. Using the Mössbauer data, we found that the conversion fraction of Fa09 at the end of 3 days was 87.2% (i.e., average conversion rate 29.07% per day, equivalent to 1.21% per hour), and the conversion fraction of Fa71 after 1 h was 45.7% (i.e., average conversion rate of 45.70% per hour). The conversion rate of Fa71 was approximately 38 times faster than that of Fa09 at 900 °C. Therefore, the conversion rate of Fe-dominant Fa71 was substantially faster than that of Mg-dominant Fa09 at both 470 °C and 900 °C.
In addition to the Fe contents in the initial olivine, the conversion rates were also substantially faster with higher oxidation temperatures. For Fa09, the conversion rate at 900 °C (29.07% per day) was about 77 times faster than that at 470 °C (0.38% per day). For Fa71, the conversion rate at 900 °C (45.70% per hour) was about 415 times faster than that at 470 °C (0.11% per hour).
The high temperature conditions facilitated the Fe oxidation processes, aiding in inducing high diffusion activation energy (i.e., the formation energy and migration energy of point defects) [62], and the number of vacancies determined the diffusion coefficient (i.e., the oxidization rate of olivine). In addition, the transition metal concentration (e.g., initial Fe contents in olivine) was another factor affecting the oxidation rate. Fe atoms in olivine vibrate around the equilibrium point all the time. Due to the fluctuation of thermal vibration, atoms with more energy deviate from the equilibrium position and move to other positions [63]. Therefore, if the initial Fe content is high, the number of Fe atoms out of the equilibrium position will be greater, producing more vacancies and allowing the reaction to proceed faster.
Note that the oxidation rates of the olivine were controlled by a variety of factors in an experimental setting. These include the grain size of olivine (e.g., larger crystals of olivine in basaltic rocks (0.3–5 mm; [64,65]) versus 74 μm-sized olivine powders used in this study), the atmospheric pressure (e.g., ~90 bars versus 1 bar) and the fO2 in the simulated atmosphere (e.g., Earthy atmosphere, pure SO2, pure CO2 or complex, mixed simulated Venusian atmosphere). In our case, the small grains and pure CO2 used in our experiments substantially increased the oxidation rates compared to actual Venusian conditions and could have potentially compensated for the low pressure (e.g., 1 bar) used in our study. Therefore, in recognizing the differences between experimental conditions and actual Venusian conditions, the results of our experiments primarily demonstrated the effects of Fa# on the oxidation rates and products, whereas the direct application of the experiment-yielded oxidation rates to Venus would not be appropriate.
4.3. Characterization of Oxidation Processes with VNIR Spectroscopy
Two notable spectral features were found in the oxidation experiments at 470 °C (Figure 7). The first was that the diagnostic absorption features substantially weakened, or even disappeared, in the early stages of oxidation (e.g., 3 days for Fa09 and Fa29 and 12 h for Fa71), while spectral changes were relatively minor in the later stage. This observation could indicate that the oxidation rates of olivine were faster in the early stages and relatively slower in the subsequent stages. Newly-produced phases, as coatings, are more resistant to weathering [66] and could have act as a barrier, further hindering atmosphere–olivine interactions. It also indicated that the VNIR spectra responded in a timely manner to olivine oxidation. Second, the weakening and absence of olivine diagnostic features occurred long before the complete conversion of olivine. For Fa09 and Fa29, whose characteristic spectral features were significantly weakened, the fraction of olivine remained above 90%. For Fa71, whose diagnostic spectral features disappeared, approximately 67.3% olivine remained in the sample. Therefore, CO2 oxidation at Venusian surface temperatures would quickly eliminate the spectral characteristics of olivine.
According to Kirchhoff’s law (emissivity = 1 − reflectivity), the reflectivity and emissivity can convert with each other at the same temperature, assuming an ideal black body at thermal equilibrium. Previous studies have suggested that the oxidation of basalt and pyroxene leads to an increase in reflectivity (i.e., a decrease in emissivity) [39]. We found that our Fa09 experiments were consistent with the oxidation of basalt and pyroxene at both 470 °C and 900 °C; the reflectance at 1020 nm and 1180 nm were higher compared to the initial Fa09 (Figure 8). However, in the Fa29 experiments, both R1020 and R1180 showed a decrease in reflectance compared to the initial Fa29 at 470 °C. At 900 °C, as the hematite proportion continuously increased, the reflectance at R1020 and R1180 reversed from decreasing to increasing, and in the final products, the reflectivity was substantially higher. The Fa71 experiments generally showed trends similar to those of the Fa29 experiments. Therefore, increasing the Fe content in the initial olivine (Fa29 vs. Fa09) might influence the reflectivity and potentially result in higher thermal radiance after oxidation.
The spectral parameters, the spectral slope of the (R1020-R850)/(1020-850) and the R1020/R850 band ratio were exponentially correlated with the oxidation duration at 900 °C (Figure 9) and could therefore be used to characterize the extent of olivine weathering. In contrast, due to the relatively low extent of oxidation at 470 °C (in particular, to the minor spectral changes after the first three days), the spectral parameters did not correlate with the entire spence of the oxidation. However, our experiment had a short duration, and the variations in spectral parameters observed over the first three days were similar to those observed at 900 °C. Therefore, a better correlation might be achieved with a longer time period. The spectral parameters at 850 nm and 1020 nm could be used to trace olivine oxidation on the Venusian surface. Note that, under elevated temperatures, such as those found on Venus’ surface, the band center would shift. Further studies will be needed to determine the altered band centers required for choosing the appropriate spectral window.
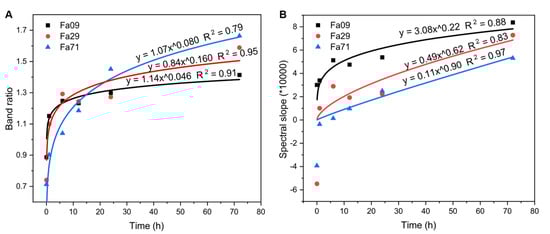
Figure 9.
Spectral parameters of the R1020/R850 band ratio and spectral slopes of (R1020-R850)/(1020-850), with increasing oxidation durations, for Fa09, Fa29 and Fa71 at 900 °C. (A) Correlation between the band ratio of R1020/R850 and the oxidation duration. (B) Correlation between the spectral slope and the oxidation duration. Spectral slopes are calculated using the formula (R1020-R850)/(1020-850). These two spectral parameters correlate well with the oxidation duration and can be used to characterize the extent of olivine weathering.
Due to the discrepancies between the experimental settings and actual conditions on Venus, limitations were unavoidable when applying experiment-derived spectral data to data measured by the Venus probe. First, the pure CO2, used in our experiments as the reaction gas, could have led to higher oxidation potential than the actual CO2-CO-SO2 Venusian atmosphere. In addition, thermodynamic studies suggest that the CO2 fugacity of Venus is in the M-H buffer [67,68,69], permitting hematite, magnetite, quartz and pyroxene can coexist in equilibrium [25]. Therefore, the relatively lower oxidation potential of the actual Venusian atmosphere could result in higher magnetite abundance than observed in our experiments during olivine oxidation. This could, in turn, further reduce reflectivity [70]. Meanwhile, the lack of sulfur-bearing gases in our initial experimental setting resulted in a lack of sulfatization products, which are essential and can compete with oxidation on the Venusian surface [35,36,41]. Second, the grain sizes of rocks and minerals are important factors that impact the IR spectra. Reduced particle size generally increases reflectivity [71,72]. Due to the slow wind speed on the Venusian surface, physical weathering due to aeolian processes is not as significant as that observed on Mars [73,74]. As a result, Venusian surface rocks are mostly plate-like [75,76]. The plate-like material would show a lower reflectivity (i.e., a higher emissivity) than grained material of the same composition [72]. Third, the olivine fractions and Fe contents of Venusian basalts are currently unclear. Oxidation rates of basalt and pyroxene can be one order of magnitude faster than that of olivine [39], resulting in an increase in reflectivity (i.e., a decrease in emissivity) compared to the initial material due to the formation of hematite on the initial Fe-bearing phases [36,39,41]. Therefore, with low or no olivine content in the basalts, the oxidation rates of the basaltic materials would be slower. As such, a longer period of decrease in emissivity would be expected.
5. Implications for Venus
Our experiments showed that the oxidation products of olivine (Fa09, Fa29 and Fa71) under a CO2 atmosphere included magnesioferrite, magnetite, laihunite, hematite and maghemite at 470 °C, and hematite, magnetite, magnesioferrite and amorphous SiO2 at 900 °C. On one hand, several newly-formed secondary magnetic minerals were produced. The presence of magnetic minerals, produced via the interaction of CO2 and olivine in Venusian basalt, would have an important impact on remanence and magnetic properties on the Venusian surface, as suggested for the Earth interior [52]. On the other hand, laihunite was found only at 470 °C and not at 900 °C. The NIR spectral signature acquired by the Venera 9 and 10 missions was dark overall, but the reflectivity increased 2 to 3 times at wavelengths greater than 0.7 μm [77]. We speculated that one of the reasons for the substantial increase in reflectivity in the NIR could have been due to the contribution of opaque minerals, such as laihunite [78]. In our experiments, the VNIR spectra of the final products of Fa71 at 470 °C were darkened and flattened, similar to those detected by Venera 9 and 10 at the landing sites. Currently, the VNIR spectra of laihunite are not available, and the measurements at Venera 9 and 10 contained relatively large errors. Further studies on laihunite, in terms of its stability, spectral characteristics and magnetic properties, are needed.
The oxidation rates of olivine were faster at higher temperatures and with higher Fa# olivine. For our powder samples, the time required for complete conversion of olivine at 470 °C ranged from tens to hundreds of Earth days, totaling less than one Earth year. At higher temperatures, i.e., 900 °C, the conversion rate for olivine was only a few hours or a few days. If the conversion rates in the natural environment were assumed to be two orders of magnitude slower than the experimental rates [79], the conversion of olivine to the oxide coating on the Venus surface (470 °C) could be completed in a range anywhere from tens to hundreds of years. At higher temperatures—such as those found in an active lava flow (900 °C) before it undergoes cooling to average ground temperatures—olivine could undergo an even faster conversion to Fe-oxides once in contact with the Venusian atmosphere. In particular, if the olivine has a higher Fa# value than Fa09, the oxidation rate will be several times—or dozens of times—faster than that of Fa09. Note that these estimations should be considered an upper limit for the observed spectral alterations, because the weakening (or absence) of the diagnostic spectral features of olivine occurred early in the oxidation process, and the spectral features would have substantially altered before complete conversion of olivine to oxides. Our experiments generally agreed with the previous suggestion that the oxidation of olivine under a heated atmosphere could be fast, and our estimations, ranging from years to hundreds of years, were even shorter than previous estimations [13]. If olivine was relatively Fe-rich, compared to the ubiquitous San Carlos olivine on Earth, its lifetime should be substantially shorter than magnesian olivine.
Previous studies concluded that mafic rocks with large amounts of mafic minerals have a relatively high emissivity (around 1 μm), and that felsic rocks with small amounts of mafic minerals have a low emissivity (around 1 μm) at Venusian temperatures [12,74]. Therefore, Venus’ highlands, with their high emissivity, could represent felsic crust [12,74], while the hotspots (high emissivity region) detected on the Venusian surface are young and fresh volcanic materials [13,38]. Based on our experiments, substantial production of hematite could efficiently decrease the emissivity and produce diagnostic features at 850 nm. Oxidation of Fa29 at 470 °C produced magnesioferrite and laihunite, with minor hematite amounts, and led to an increase in emissivity. Note that the emissivity was a function of surface temperature, grain size and mineral composition, and that the spectral diagnostic features at Venusian temperatures would be different. Direct application of our experimental results to the measured data would not be appropriate. However, our work revealed another possible origin of the high emissivity of the basaltic terrain, i.e., oxidation of Fe-Mg olivine with a relatively high Fe fraction. Since the Venusian surface was resurfaced with global volcanic activities around 300 Ma–1 Ga [80], it has yet to be determined whether the younger magma, widely distributed on present-day Venus, is Fe-rich, and whether Fe-rich olivine or pyroxene are present. In addition, further studies on the Venusian surface (470 °C for lowlands or lower T for high elevations) would be necessary to determine whether the altered phases (such as magnesioferrite and laihunite) could be preserved during prolonged oxidation, particularly under a more Venus-like atmosphere. This would have important implications for study of variation in emissivity on Venus’ surface.
6. Conclusions
In this study, we experimentally investigated the high-temperature oxidation of olivine types with different Fa# values (Fa09, Fa29, Fa71) under a heated CO2 atmosphere (at 470 °C and 900 °C). Our results revealed oxidation products (including both microscopic and macroscopic features), VNIR spectra and olivine conversion rates during oxidation processes, as well as their implications for Venusian atmosphere–surface interactions. Findings were summarized as follows:
- The oxidation products of olivine (Fa09, Fa29 and Fa71) included magnesioferrite, magnetite, laihunite, hematite and maghemite at 470 °C, and hematite, magnetite, magnesioferrite and amorphous SiO2 at 900 °C. The presence of magnetic minerals, produced via the interaction of CO2 and olivine in Venusian basalts, could have powerful impacts on remanence and magnetic properties on the Venusian surface.
- Both high temperature and high Fa# values greatly accelerated the oxidation of olivine under a CO2 atmosphere; temperature was the more important factor. Assuming that conversion rates in the natural Venusian environment would be two orders of magnitude slower than our experimental rates, the conversion of olivine to oxide coating at 470 °C would occur within tens to hundreds of Earth years; at 900 °C, the olivine present on the lava surface could undergo a faster conversion to Fe-oxides once in contact with the Venus atmosphere. If the olivine on Venus is relatively Fe-rich compared to the ubiquitous San Carlos olivine on Earth, its lifetime should be substantially shorter than magnesian olivine.
- CO2 oxidation at Venusian ground temperatures would quickly eliminate the spectral characteristics of olivine. The diagnostic absorption features substantially weakened or even disappeared in the early stages of oxidation, and the spectral changes were relatively minor in the later stage. The spectral parameters at 850 nm and 1020 nm, as well as other relevant spectral windows (considering shifts induced by the elevated temperature), could be used to trace olivine oxidation on the Venus surface.
- Our work revealed a new possible origin of the high emissivity of the basaltic terrain on Venus: the oxidation of Fe-Mg olivine with a relatively high Fe fraction. Oxidation of Fa29 at 470 °C produced magnesioferrite and laihunite, with minor amounts of hematite, and showed an increase in emissivity of 1180 nm, contrary to Fa09. Emissivity is a function of surface temperature, grain size, and mineral composition, and direct application of our experimental results to measured data would not be appropriate. Further study of the oxidation of Fe-Mg olivine with a relatively high Fe fraction on the Venusian surface (470 °C for lowlands or lower T for high elevations) would be necessary to determine whether the altered phases, such as magnesioferrite and laihunite, could be preserved during prolonged oxidation.
Author Contributions
Conceptualization, Y.-Y.S.Z., X.L. and J.L.; investigation, S.-S.Z., H.L., R.C., J.W., B.M., Y.W. and W.Y.; resources, C.Q.; writing—original draft preparation, S.-S.Z. and Y.-Y.S.Z.; writing—review and editing, S.-S.Z., Y.-Y.S.Z., H.L., R.C., C.Q., J.W., D.-S.Z., X.-W.Y., X.L. and J.L.; visualization, S.-S.Z.; supervision, Y.-Y.S.Z., X.L. and J.L.; funding acquisition, Y.-Y.S.Z., H.L., J.W., Y.W. and J.L. All authors have read and agreed to the published version of the manuscript.
Funding
This research was funded by the B-type Strategic Priority Program of the Chinese Academy of Sciences (No. XDB41000000), Pre-research project on Civil Aerospace Technologies funded by China National Space Administration (CNSA) (No. D020102), Key Research Program of the Chinese Academy of Sciences (ZDBS-SSW-TLC001), the Key Research Program of the Institute of Geology & Geophysics CAS (No. IGGCAS-201905), Young Elite Scientists Sponsorship Program by CAST (2021QNRC001), the International Partnership Program of Chinese Academy of Sciences (121421KYSB20170020), Guizhou Province Science and Technology Fund ([2020] 1Z035), National Key Research and Development Program of China (2022YFF0503100), and Beijing Municipal Science and Technology Commission (No. Z181100002918003).
Data Availability Statement
The data presented in this study are openly available in Science Data Bank at [https://doi.org/10.57760/sciencedb.07898], reference number [81].
Acknowledgments
The authors greatly appreciate the three anonymous reviewers for their constructive suggestions to help us improve this manuscript.
Conflicts of Interest
The authors declare no conflict of interest.
Appendix A
This supporting information includes nine figures (Figure A1, Figure A2, Figure A3, Figure A4, Figure A5, Figure A6, Figure A7, Figure A8 and Figure A9) and three tables (Table A1 and Table A2). Figure A1 and Figure A2 are XRD patterns of Fa09 and Fa29, throughout the oxidation experiments, respectively. Figure A3 shows SEM images of natural olivine Fa09. Figure A4 shows the Mössbauer spectra of the final products. Figure A5 shows the Raman spectra of Fa09, Fa29 and Fa71 throughout the oxidation experiments. Figure A6 shows the FIB sampling sites and the FIB foils. Figure A7 shows the SEM-EDS results of sample Fa71–900–3 d. Figure A8 shows the ideal spectral radiance of a black body at 470 °C between the wavelengths 0.8 μm and 1.6 μm. Figure A9 compares the measured VNIR spectra at room temperature with the simulated high-T VNIR spectra at 470 °C.

Figure A1.
XRD patterns of the initial Fa09 and its final oxidation products at 470 °C and 900 °C. (A) Under 470 °C; (B) Under 900 °C. O = olivine; H = hematite; FeMg-Ox = magnesium ferrous oxide; E = enstatite; Q = quartz.


Figure A2.
XRD patterns of the initial Fa29 and its final oxidation products at 470 °C and 900 °C. (A) Under 470 °C; (B) Under 900 °C. O = olivine; H = hematite; S = spinel-type structure (magnetite or magnesioferrite).


Figure A3.
SEM images of initial natural olivine Fa09, showing impurities as Fe oxides and chromite interior of the olivine grains before oxidation experiments.


Figure A4.
Mössbauer spectra and the fitted curve of the final oxidation products. (A,C,F) are the room-temperature (298 K) Mössbauer spectra of the final oxidation products in the Fa09, Fa29 and Fa71 experiments at 470 °C. Magnetite-laihunite is found in all three experiments, and hematite is found only in the Fa71 experiments. (B,D,G) are the room-temperature (298 K) Mössbauer spectra of the final oxidation products in the Fa09, Fa29 and Fa71 experiments at 900 °C. “Mag(O)” represents octahedral Fe in magnetite, and “Mag(T)” represents tetrahedral Fe in magnetite. All the magnetite samples produced at 900 °C have octahedral Fe to tetrahedral Fe molar ratios abnormally less than 2. The proportion of Fe-bearing olivine was preserved only in the Fa09 experiments, while the Fa29 and Fa71 experiments completely converted to hematite and magnetite. (E) Low-temperature (6.2 K) Mössbauer spectra of Fa29–470–24 d. Two olivine fitting curves represent olivine, which might bear different Mg/Fe ratios. The doublets are consistent with the presence of laihunite and magnetite. (H) Room-temperature (298 K) Mössbauer spectra Fa71-900-1 h show that substantial Fe oxides (magnetite and hematite) were formed after only 1 h of oxidation at 900 °C, of which magnetite was more abundant than hematite. Two olivine fitting curves represent olivine, which might bear different Mg/Fe ratios.


Figure A5.
Raman spectra of initial olivine and final oxidation products at 470 °C and 900 °C. (A–C) Fa09, Fa29 and Fa71 at 470 °C, respectively. (D–F) Fa09, Fa29 and Fa71 at 900 °C. (F) The signs “(1)” and “(2)” represent different phases in one sample. Hematite is ubiquitously present in all final products of the three types of olivine at 470 °C and 900 °C. Magnesioferrite is also present in the later stage of Fa09 and Fa29 oxidation at 470 °C and 900 °C. O = olivine; H = hematite; Mag = magnetite; Mgh = maghemite; Mfr = magnesioferrite.


Figure A6.
FIB sampling position and prepared FIB foils. (A,B) Fa71–470–12 d; (C,D) Fa29–900–3 d; (E,F) Fa71–900–3 d. (A) In Fa71–470–12 d, due to the magnetic materials in the sample, the FIB foil was prepared after the olivine particle was fixed in resin. The image shows the sample surface of the resin-fixed olivine grain.


Figure A7.
SEM-EDS results of sample Fa71–900–3 d. A small amount of magnesioferrite was produced on the surface of the olivine particle after oxidation.


Figure A8.
The ideal emissivity of a black body at 470 °C between wavelengths from 0.8 to 1.6 μm yielded using the Planck function. The plot shows that the thermal radiance at wavelengths of 1020 and 1180 nm at 470 °C is not obvious, and therefore, the spectra received by the infrared detector at the two wavelengths are primarily contributed by the reflectance rather than the emissivity.


Figure A9.
Comparison of measured VNIR spectra at room temperature with numerically simulated VNIR spectra under 470 °C high-temperature conditions for all sets of experiments in this study. (A–C) Fa09–Fa71 oxidized under 470 °C respectively. (D–F) Fa09–Fa71 oxidized under 900 °C respectively. In each subfigure, the solid lines are the measured infrared spectra at room temperature, and the dashed lines are the modeled infrared spectra under 470 °C environmental conditions. The high-temperature conditions show almost no effect on the reflectivity at wavelengths <1020 nm and a minor influence on reflectivity at approximately 1180 nm (absolute deviation of 0.009~0.023). Therefore, the measured VNIR spectra at room temperature are representative of those measured under high-temperature conditions simulating the Venus surface condition.

Table A1.
The parameters of Mössbauer spectroscopy measured at 298 K and 6.2 K.
Table A2.
Sample reflectance in six spectrum windows in Venus.
References
- Mahieux, A.; Vandaele, A.C.; Robert, S.; Wilquet, V.; Drummond, R.; Montmessin, F.; Bertaux, J.L. Densities and temperatures in the Venus mesosphere and lower thermosphere retrieved from SOIR on board Venus Express: Carbon dioxide measurements at the Venus terminator. J. Geophys. Res. Planets 2012, 117, E7. [Google Scholar] [CrossRef]
- Seiff, A.; Schofield, J.; Kliore, A.; Taylor, F.; Limaye, S.; Revercomb, H.; Sromovsky, L.; Kerzhanovich, V.; Moroz, V.; Marov, M.Y. Models of the structure of the atmosphere of Venus from the surface to 100 kilometers altitude. Adv. Space Res. 1985, 5, 3–58. [Google Scholar] [CrossRef]
- Taylor, S.R.; McLennan, S. Planetary Crusts: Their Composition, Origin and Evolution; Cambridge University Press: Cambridge, UK, 2009; Volume 10, pp. 1–402. [Google Scholar]
- Barsukov, V.; Borunov, S.; Volkov, V.; Dorofeeva, V.; Zolotov, M.I. Analysis of the Mineral Composition of Soil at the Landing Sites of the Venera-13, Venera-14, and Vega-2 Landers on the Basis of Thermodynamic Calculations; Akademiia Nauk SSSR Doklady: Moskva, Russia, 1986; Volume 287, pp. 415–417. [Google Scholar]
- Barsukov, V.; Surkov, I.A.; Dmitriev, L.; Khodakovskii, I. Geochemical studies of Venus by Vega-1 and Vega-2 landers. Geokhimiia 1986, 3, 275–288. [Google Scholar]
- Barsukov, V.L.; Borunov, S.P.; Volkov, V.P.; Dorofeeva, V.A.; Zolotov, M.I.; Parotkin, S.V.; Semenov, I.V.; Sidorov, Y.I.; Khodakovskii, I.L.; Shapkin, A.I. Estimate of the mineral-composition of Venus soil at Venera-13, Venera-14 and Vega-2 landing sites (thermodynamic calculations). Dokl. Akad. Nauk Sssr 1986, 287, 415–418. [Google Scholar]
- Barsukov, V.L.; Surkov, Y.A.; Moskaleva, L.P.; Shcheglov, O.P.; Kharyukova, V.P.; Manvelyan, O.S.; Perminov, V.G. Geochemical study of the surface of Venus by the Venera-13 and Venera-14 space probes. Geochemistry 1982, 7, 899–920. [Google Scholar]
- Surkov, Y.A.; Barsukov, V.L.; Moskalyeva, L.P.; Kharyukova, V.P.; Kemurdzhian, A.L. New data on the composition, structure, and properties of Venus rock obtained by Venera 13 and Venera 14. J. Geophys. Res. Solid Earth 1984, 89, B393–B402. [Google Scholar] [CrossRef]
- Barsukov, V.L.; Basilevsky, A.T.; Burba, G.A.; Bobinna, N.N.; Kryuchkov, V.P.; Kuzmin, R.O.; Nikolaeva, O.V.; Pronin, A.A.; Ronca, L.B.; Chernaya, I.M.; et al. The geology and geomorphology of the Venus surface as revealed by the radar images obtained by Veneras 15 and 16. J. Geophys. Res. Solid Earth 1986, 91, 378–398. [Google Scholar] [CrossRef]
- Campbell, B.A. Merging Magellan Emissivity and SAR Data for Analysis of Venus Surface Dielectric Properties. Icarus 1994, 112, 187–203. [Google Scholar] [CrossRef]
- Pettengill, G.H.; Ford, P.G.; Chapman, B.D. Venus: Surface electromagnetic properties. J. Geophys. Res. Solid Earth 1988, 93, 14881–14892. [Google Scholar] [CrossRef]
- Hashimoto, G.L.; Roos-Serote, M.; Sugita, S.; Gilmore, M.S.; Kamp, L.W.; Carlson, R.W.; Baines, K.H. Felsic highland crust on Venus suggested by Galileo Near-Infrared Mapping Spectrometer data. J. Geophys. Res. Planets 2008, 113, E5. [Google Scholar] [CrossRef]
- Smrekar, S.E.; Stofan, E.R.; Mueller, N.; Treiman, A.; Elkins-Tanton, L.; Helbert, J.; Piccioni, G.; Drossart, P. Recent Hotspot Volcanism on Venus from VIRTIS Emissivity Data. Science 2010, 328, 605–608. [Google Scholar] [CrossRef] [PubMed]
- Dyar, M.D.; Helbert, J.; Maturilli, A.; Muller, N.T.; Kappel, D. Probing Venus surface iron contents with six-band visible near-infrared spectroscopy from orbit. Geophys. Res. Lett. 2020, 47, e2020GL090497. [Google Scholar] [CrossRef]
- Garvin, J.B.; Getty, S.A.; Arney, G.N.; Johnson, N.M.; Kohler, E.; Schwer, K.O.; Sekerak, M.; Bartels, A.; Saylor, R.S.; Elliott, V.E. Revealing the mysteries of Venus: The DAVINCI mission. Planet. Sci. J. 2022, 3, 117. [Google Scholar] [CrossRef]
- Smrekar, S.; Dyar, M.; Hensley, S.; Helbert, J.; Team, V.S. VERITAS (Venus Emissivity, Radio Science, InSAR, Topography and Spectroscopy): A Proposed Discovery Mission; AAS/Division for Planetary Sciences Meeting Abstracts: Pasadena, CA, USA, 2016; Volume 48, p. 216.07. [Google Scholar]
- Smrekar, S.; Hensley, S.; Nybakken, R.; Wallace, M.S.; Perkovic-Martin, D.; You, T.-H.; Nunes, D.; Brophy, J.; Ely, T.; Burt, E. VERITAS (Venus Emissivity, Radio Science, InSAR, Topography, and Spectroscopy): A Discovery Mission. In Proceedings of the 2022 IEEE Aerospace Conference (AERO), Big Sky, MT, USA, 5–12 March 2022; pp. 1–20. [Google Scholar]
- Smrekar, S.E.; Hensley, S.; Dyar, M.; Helbert, J.; Andrews-Hanna, J.; Breuer, D.; Buczkowski, D.; Campbell, B.; Davaille, A.; DiAchille, G. VERITAS (Venus Emissivity, Radio Science, InSAR, Topography, and Spectroscopy): A proposed Discovery mission. In Proceedings of the 51st Lunar and Planetary Science Conference, The Woodlands, TX, USA, 16–20 March 2020; Volume 2132, p. 1449. [Google Scholar]
- Helbert, J.; Vandaele, A.C.; Marcq, E.; Robert, S.; Ryan, C.; Guignan, G.; Rosas-Ortiz, Y.; Neefs, E.; Thomas, I.; Arnold, G. The VenSpec suite on the ESA EnVision mission to Venus. In Proceedings of the Infrared Remote Sensing and Instrumentation XXVII, San Diego, CA, USA, 12–14 August 2019; Volume 11128, pp. 18–32. [Google Scholar]
- Widemann, T.; Ghail, R.; Wilson, C.F.; Titov, D.V. EnVision: Europe’s proposed mission to Venus. In Proceedings of the AGU Fall Meeting Abstracts, San Francisco, CA, USA, 1–17 December 2020; Volume 2020, p. P022-02. [Google Scholar]
- Baines, K.H.; Atreya, S.; Carlson, R.W.; Crisp, D.; Drossart, P.; Formisano, V.; Limaye, S.S.; Markiewicz, W.J.; Piccioni, G. To the depths of Venus: Exploring the deep atmosphere and surface of our sister world with Venus Express. Planet. Space Sci. 2006, 54, 1263–1278. [Google Scholar] [CrossRef]
- Hashimoto, G.L.; Sugita, S. On observing the compositional variability of the surface of Venus using nightside near-infrared thermal radiation. J. Geophys. Res. Planets 2003, 108, 5109. [Google Scholar] [CrossRef]
- Lecacheux, J.; Drossart, P.; Laques, P.; Deladerriere, F.; Colas, F. Detection of the surface of Venus at 1.0 μm from ground-based observations. Planet. Space Sci. 1993, 41, 543–549. [Google Scholar] [CrossRef]
- Khodakovsky, I.; Volkov, V.; Sidorov, Y.I.; Borisov, M.; Lomonosov, M. Venus: Preliminary prediction of the mineral composition of surface rocks. Icarus 1979, 39, 352–363. [Google Scholar] [CrossRef]
- Zolotov, M.Y. Gas-Solid Interactions on Venus and other Solar System Bodies. Rev. Mineral. Geochem. 2018, 84, 351–392. [Google Scholar] [CrossRef]
- Fegley Jr., B.; Treiman, A.H. Chemistry of atmosphere-surface interactions on Venus and Mars. Wash. DC Am. Geophys. Union Geophys. Monogr. Ser. 1992, 66, 7–71. [Google Scholar]
- Vinogradov, A.; Volkov, V. On the wallastonite equilibrium as a mechanism determining Venus’ atmospheric composition. Geochem. Int. 1971, 8, 463–467. [Google Scholar]
- Mueller, R.F.; Kridelbaugh, S.J. Kinetics of CO2 production on Venus. Icarus 1973, 19, 531–541. [Google Scholar] [CrossRef]
- Nozette, S.; Lewis, J.S. Venus: Chemical weathering of igneous rocks and buffering of atmospheric composition. Science 1982, 216, 181–183. [Google Scholar] [CrossRef] [PubMed]
- Lewis, J.S.; Prinn, R.G. Planets and Their Atmospheres: Origins and Evolution; Academic Press: Orlando, FL, USA, 1984. [Google Scholar]
- Fegley, B.; Treiman, A.H.; Sharpton, V.L. Venus surface mineralogy: Observational and theoretical constraints. In Proceedings of the Lunar and Planetary Science, Houston, TX, USA, 16–20 March 1992; 1992; Volume 22. [Google Scholar]
- Mueller, R.F. A chemical model for the lower atmosphere of Venus. Icarus 1964, 3, 285–298. [Google Scholar] [CrossRef]
- Hashimoto, G.L.; Abe, Y.; Sasaki, S. CO2 amount on Venus constrained by a criterion of topographic-greenhouse instability. Geophys. Res. Lett. 1997, 24, 289–292. [Google Scholar] [CrossRef]
- Treiman, A.H.; Bullock, M.A. Mineral reaction buffering of Venus’ atmosphere: A thermochemical constraint and implications for Venus-like planets. Icarus 2012, 217, 534–541. [Google Scholar] [CrossRef]
- Zolotov, M.Y. Sulfur-containing gases in the Venus atmosphere and stability of carbonates. In Proceedings of the Lunar and Planetary Science Conference, Houston, TX, USA, 11–15 March 1985; Volume 16, pp. 942–943. [Google Scholar]
- Berger, G.; Cathala, A.; Fabre, S.; Borisova, A.Y.; Pages, A.; Aigouy, T.; Esvan, J.; Pinet, P. Experimental exploration of volcanic rocks-atmosphere interaction under Venus surface conditions. Icarus 2019, 329, 8–23. [Google Scholar] [CrossRef]
- Fegley, B.; Klingelhofer, G.; Brackett, R.A.; Izenberg, N.; Kremser, D.T.; Lodders, K. Basalt oxidation and the formation of hematite on the surface of Venus. Icarus 1995, 118, 373–383. [Google Scholar] [CrossRef]
- Filiberto, J.; Trang, D.; Treiman, A.H.; Gilmore, M.S. Present-day volcanism on Venus as evidenced from weathering rates of olivine. Sci. Adv. 2020, 6, eaax7445. [Google Scholar] [CrossRef]
- Cutler, K.S.; Filiberto, J.; Treiman, A.H.; Trang, D. Experimental Investigation of Oxidation of Pyroxene and Basalt: Implications for Spectroscopic Analyses of the Surface of Venus and the Ages of Lava Flows. Planet. Sci. J. 2020, 1, 21. [Google Scholar] [CrossRef]
- Teffeteller, H.; Filiberto, J.; McCanta, M.C.; Treiman, A.H.; Keller, L.; Cherniak, D.; Rutherford, M.; Cooper, R.F. An experimental study of the alteration of basalt on the surface of Venus. Icarus 2022, 384, 115085. [Google Scholar] [CrossRef]
- Santos, A.R.; Gilmore, M.S.; Greenwood, J.P.; Nakley, L.M.; Phillips, K.; Kremic, T.; Lopez, X. Experimental Weathering of Rocks and Minerals at Venus Conditions in the Glenn Extreme Environments Rig (GEER). J. Geophys. Res.: Planets 2023, 128, e2022JE007423. [Google Scholar] [CrossRef]
- Qi, C.; Zhao, Y.H.; Zimmerman, M.E.; Kim, D.; Kohlstedt, D.L. Evolution of microstructural properties in sheared iron-rich olivine. J. Geophys. Res. Solid Earth 2021, 126, e2020JB019629. [Google Scholar] [CrossRef]
- Lafuente, B.; Downs, R.; Yang, H.; Stone, N. The power of databases: The RRUFF project. In Highlights in Mineralogical Crystallography; Armbruster, T., Danisi, R.M., Eds.; W. De Gruyter: Berlin, Germany, 2015; Volume 1, p. 30. [Google Scholar]
- Kan, X.; Coey, J. Mössbauer spectra, magnetic and electrical properties of laihunite, a mixed valence iron olivine mineral. Am. Mineral. 1985, 70, 576–580. [Google Scholar]
- Dyar, M.D.; Agresti, D.G.; Schaefer, M.W.; Grant, C.A.; Sklute, E.C. Mössbauer spectroscopy of earth and planetary materials. Annu. Rev. Earth Planet. Sci. 2006, 34, 83–125. [Google Scholar] [CrossRef]
- Gehring, A.; Fischer, H.; Louvel, M.; Kunze, K.; Weidler, P. High temperature stability of natural maghemite: A magnetic and spectroscopic study. Geophys. J. Int. 2009, 179, 1361–1371. [Google Scholar] [CrossRef]
- Osereme, E.-E.C.; Iserom, I.B.; Joshua, I.E.E. Synthesis, microstructure and magnetic properties of nanocrystalline MgFe2O4 particles: Effect of mixture of fuels and sintering temperature. Sci. Sinter. 2016, 48, 221–235. [Google Scholar] [CrossRef]
- Bartels, K.; Burns, R. Oxidized olivines on Mars: Spectroscopic investigations of heat-induced aerial oxidation products. In Proceedings of the Lunar and Planetary Science Conference, Houston, TX, USA, 13–17 March 1989; Volume 20, p. 44. [Google Scholar]
- Isaacson, P.J.; Klima, R.L.; Sunshine, J.M.; Cheek, L.C.; Pieters, C.M.; Hiroi, T.; Dyar, M.D.; Lane, M.; Bishop, J. Visible to near-infrared optical properties of pure synthetic olivine across the olivine solid solution. Am. Mineral. 2014, 99, 467–478. [Google Scholar] [CrossRef]
- Pieters, C.M.; Head, J.W.; Pratt, S.; Patterson, W.; Garvin, J.; Barsukov, V.L.; Basilevsky, A.T.; Khodakovsky, I.L.; Selivanov, A.S.; Panfilov, A.S.; et al. The color of the surface of Venus. Science 1986, 234, 1379–1383. [Google Scholar] [CrossRef]
- Treiman, A.H.; Filiberto, J.; Vander Kaaden, K.E. Near-infrared reflectance of rocks at high temperature: Preliminary results and implications for near-infrared emissivity of Venus’s surface. Planet. Sci. J. 2021, 2, 43. [Google Scholar] [CrossRef]
- Knafelc, J.; Filiberto, J.; Ferré, E.C.; Conder, J.A.; Costello, L.; Crandall, J.R.; Dyar, M.D.; Friedman, S.A.; Hummer, D.R.; Schwenzer, S.P. The effect of oxidation on the mineralogy and magnetic properties of olivine. Am. Mineral. 2019, 104, 694–702. [Google Scholar] [CrossRef]
- Zolotov, M.Y. Chemical weathering of olivines and ferromagnesian pyroxenes on the surface of Venus. In Proceedings of the Lunar and Planetary Science Conference, Houston, TX, USA, 18–22 March 1991; Volume 22, p. 1567. [Google Scholar]
- Cornell, R.M.; Schwertmann, U. The Iron Oxides: Structure, Properties, Reactions, Occurrences, and Uses; Wiley-vch Weinheim: Berlin, Germany, 2003; Volume 664, p. 493. [Google Scholar]
- Hoye, G.; Evans, M. Remanent magnetizations in oxidized olivine. Geophys. J. Int. 1975, 41, 139–150. [Google Scholar] [CrossRef]
- Kondoh, S.; Kitamura, M.; Morimoto, N. Synthetic laihunite (☐xFe2−3x2+Fe2x3+SiO4), an oxidation product of olivine. Am. Mineral. 1985, 70, 737–746. [Google Scholar]
- Fegley, B.; Treiman, A.H.; Sharpton, V.L. Venus surface mineralogy—Observational and theoretical constraints. Proc. Lunar Planet. Sci. 1992, 22, 3–19. [Google Scholar]
- Keller, L.P.; Thomas, K.L.; McKay, D.S. Mineralogical Changes in IDPs Resulting from Atmospheric Entry Heating. In International Astronomical Union Colloquium; Cambridge University Press: Cambridge, UK, 1996; Volume 150, pp. 295–298. [Google Scholar]
- Lemine, O.M.; Sajieddine, M.; Bououdina, M.; Msalam, R.; Mufti, S.; Alyamani, A. Rietveld analysis and Mössbauer spectroscopy studies of nanocrystalline hematite α-Fe2O3. J. Alloys Compd. 2010, 502, 279–282. [Google Scholar] [CrossRef]
- Dyar, M.D.; Helbert, J.; Cooper, R.F.; Sklute, E.C.; Maturilli, A.; Mueller, N.T.; Kappel, D.; Smrekar, S.E. Surface weathering on Venus: Constraints from kinetic, spectroscopic, and geochemical data. Icarus 2021, 358, 114139. [Google Scholar] [CrossRef]
- Michel, R.; Ammar, M.R.; Poirier, J.; Simon, P. Phase transformation characterization of olivine subjected to high temperature in air. Ceram. Int. 2013, 39, 5287–5294. [Google Scholar] [CrossRef]
- Chakraborty, S. Rates and mechanisms of Fe-Mg interdiffusion in olivine at 980 °C–1300 °C. J. Geophys. Res. Solid Earth 1997, 102, 12317–12331. [Google Scholar] [CrossRef]
- Li, Z.; Cai, N. Principle of Gas-Solid Reaction; Science Press: Beijing, China, 2020; pp. 274–287. [Google Scholar]
- Barrat, J.A.; Jambon, A.; Gillet, P.H.; Sautter, V.; Göpel, C.; Lesourd, M.; Keller, F. Petrology and chemistry of the Picritic Shergottite North West Africa 1068 (NWA 1068). Geochim. Cosmochim. 2002, 66, 3505–3518. [Google Scholar] [CrossRef]
- Vinet, N.; Higgins, M.D. What can crystal size distributions and olivine compositions tell us about magma solidification processes inside Kilauea Iki lava lake, Hawaii? J. Volcanol. Geotherm. Res. 2011, 208, 136–162. [Google Scholar] [CrossRef]
- Banfield, J.F.; Veblen, D.R.; Jones, B.F. Transmission electron microscopy of subsolidus oxidation and weathering of olivine. Contrib. Mineral. Petrol. 1990, 106, 110–123. [Google Scholar] [CrossRef]
- Fegley, B.; Zolotov, M.Y.; Lodders, K. The oxidation state of the lower atmosphere and surface of Venus. Icarus 1997, 125, 416–439. [Google Scholar] [CrossRef]
- Zolotov, M.Y. Pyrite-magnetite or magnetite-hematite mineral assemblages as a possible buffer of the composition of the Venus atmosphere. In Proceedings of the Lunar and Planetary Science Conference, Houston, TX, USA, 16–20 March 1992; Volume 23, p. 1591. [Google Scholar]
- Zolotov, M.Y. A model for the thermal equilibrium of the surface venusian atmosphere. Geochem. Int. 1996, 33, 80–100. [Google Scholar]
- Gilmore, M.; Treiman, A.; Helbert, J.; Smrekar, S. Venus surface composition constrained by observation and experiment. Space Sci. Rev. 2017, 212, 1511–1540. [Google Scholar] [CrossRef]
- Myers, T.L.; Brauer, C.S.; Su, Y.-F.; Blake, T.A.; Tonkyn, R.G.; Ertel, A.B.; Johnson, T.J.; Richardson, R.L. Quantitative reflectance spectra of solid powders as a function of particle size. Appl. Opt. 2015, 54, 4863–4875. [Google Scholar] [CrossRef] [PubMed]
- Hapke, B. Bidirectional reflectance spectroscopy: 1. Theory 1981, 86, 3039–3054. [Google Scholar]
- Weitz, C.M.; Plaut, J.J.; Greeley, R.; Saunders, R.S. Dunes and microdunes on Venus: Why were so few found in the Magellan data? Icarus 1994, 112, 282–295. [Google Scholar] [CrossRef]
- Helbert, J.; Maturilli, A.; Dyar, M.D.; Alemanno, G. Deriving iron contents from past and future Venus surface spectra with new high-temperature laboratory emissivity data. Sci. Adv. 2021, 7, eaba9428. [Google Scholar] [CrossRef]
- Florensky, C.P.; Basilevsky, A.T.; Kryuchkov, V.P.; Kusmin, R.O.; Nikolaeva, O.V.; Pronin, A.A.; Chernaya, I.M.; Tyuflin, Y.S.; Selivanov, A.S.; Naraeva, M.K.; et al. Venera 13 and Venera 14: Sedimentary rocks on Venus? Science 1983, 221, 57–59. [Google Scholar] [CrossRef]
- Keldysh, M. Venus exploration with the Venera 9 and Venera 10 spacecraft. Icarus 1977, 30, 605–625. [Google Scholar] [CrossRef]
- Pieters, C.; Patterson, W.; Pratt, S.; Head, J.; Garvin, J. Oxidized basalts on the surface of Venus: Compositional implications of measured spectral properties. In Proceedings of the Lunar and Planetary Science Conference, Houston, TX, USA, 17–21 March 1986; Volume 17, pp. 662–663. [Google Scholar]
- Sueno, S.; Matsuura, S.; Prewiit, C. Fe–deficient olivine structure type minerals from Colorado, USA and Japan. Mineral. J. 1985, 12, 376–392. [Google Scholar] [CrossRef]
- Olsen, A.A.; Rimstidt, J.D. Using a mineral lifetime diagram to evaluate the persistence of olivine on Mars. Am. Mineral. 2007, 92, 598–602. [Google Scholar] [CrossRef]
- Brossier, J.F.; Gilmore, M.S.; Toner, K. Low radar emissivity signatures on Venus volcanoes and coronae: New insights on relative composition and age. Icarus 2020, 343, 113693. [Google Scholar] [CrossRef] [PubMed]
- Zhong, S.-S.; Chinese Academy of Sciences, Beijing, China. Experimental Data of High-Temperature Oxidation of Magnesium- and Iron-Rich Olivine under a CO2 Atmosphere. 2013; to be submitted. [Google Scholar]


Disclaimer/Publisher’s Note: The statements, opinions and data contained in all publications are solely those of the individual author(s) and contributor(s) and not of MDPI and/or the editor(s). MDPI and/or the editor(s) disclaim responsibility for any injury to people or property resulting from any ideas, methods, instructions or products referred to in the content. |
© 2023 by the authors. Licensee MDPI, Basel, Switzerland. This article is an open access article distributed under the terms and conditions of the Creative Commons Attribution (CC BY) license (https://creativecommons.org/licenses/by/4.0/).