Abstract
The Weather Radar Center (WRC) of the Korea Meteorological Administration (KMA) has been providing three-dimensional radar wind fields based on the “WInd Synthesis System using Doppler Measurements (WISSDOM)” in real time since February 2019. Its accuracy is significantly affected by the quality of the Doppler velocity, such as velocity aliasing. For the de-aliasing of Doppler velocity, the dual-pulse repetition frequency (dual-PRF) technique is commonly utilized for commercial Doppler weather radar. The Doppler weather radars of the KMA have extended their Nyquist velocity up to 132 m s−1 using a dual PRF of 5:4. However, the dual-PRF technique produces significant noise and loss of radial velocity. Therefore, we developed a technique for noise cancelation and recovery of radial velocity to improve the quality of WISSDOM wind fields. The proposed approach identifies and removes speckles of abnormal radial velocity by comparing the sign of the median radial velocity with the surrounding radar bins. We then recovered the eliminated radial velocity using median interpolation. To recover the losses of radial velocity over a wide area using the dual-PRF technique, we used the Velocity Azimuth Display curve-fitting technique. These techniques are straightforward, preserve spatial gradients, and suppress local extrema. We tested this technique, verified its performance, and applied it to the operational radar quality control system of the WRC from August 2021. We concluded that the process helps improve the quality of the radial velocity and the accuracy of the WISSDOM wind fields.
1. Introduction
Three-dimensional precipitation and wind information with high spatiotemporal resolution based on nationwide weather radar networks is essential for real-time monitoring and dynamic analysis of mesoscale severe weather. For a more detailed analysis and routine weather forecasts, the Weather Radar Center (WRC) of the Korea Meteorological Administration (KMA) has provided three-dimensional wind fields, including wind vectors, convergence/divergence, vorticity, and storm relative helicity, at a horizontal resolution of 1 km over the entire Korean Peninsula since February 2019. The 3D wind fields are produced every 5 min by real-time implementation of the “WInd Synthesis System using Doppler Measurements (WISSDOM),” which is developed by National Central University (NCU) in Taiwan, on a supercomputer system [1,2]. In producing radar wind fields, radial velocity data are an important factor affecting the quality of wind data as input data for wind calculations.
Aliasing (or velocity folding) is one of the quality problems with radar radial velocity for the use of radial winds from Doppler weather radars. Previous studies have corrected aliased Doppler radar velocity data [3,4,5,6,7,8,9,10]. For the de-aliasing of Doppler velocity, the dual-pulse repetition frequency (dual-PRF) technique is commonly utilized for commercial Doppler Weather radar [11,12]. The Doppler weather radars operated by KMA also use a dual PRF of 5:4, which were all upgraded to dual-polarization radar from 2014 to 2019. In addition, the observational variables (such as reflectivity and radial velocity) are generated by applying signal processing algorithms using raw signal data before passing through the signal processor, thresholds, and signal quality filters optimized by the observation strategy. Thus, the Nyquist velocity has been extended up to 132 m s−1, which provides stable information without velocity folding in the event of severe weather phenomena, such as typhoons. However, the dual-PRF technique produces significant noise and widely spaced gates that have no radial velocity data but still contain valid radar reflectivity data, owing to the limited number of pulse samples used. Therefore, the Doppler weather radars of the KMA require a quality control process of radial velocity to improve the accuracy of radar wind.
Holleman and Beekhuis [13] developed a post-processing algorithm for dual-PRF velocity data, which included comparing each velocity data point of the azimuth scan with the median velocity calculated from the data point itself and the surrounding data point to eliminate noise. Joe and May [14] proposed the Laplacian technique to handle dual-PRF errors and compared it with the median filtering technique. Median filtering is straightforward and preserves gradients, whereas the Laplacian technique is a detection-correction scheme that attempts to detect and correct errors. The Laplacian filter is preferred because it preserves local peaks, whereas the median filter may have problems when the velocity data straddle the extended Nyquist velocity. Both techniques are robust to missing and sparse data. Hengstebeck et al. [15] used a Laplacian filter based on Joe and May [14] within the quality assurance module for the mesocyclone detection algorithm of the German weather radar network. Park and Lee [16] compared the radial velocity of a given gate with the mean value of the radial velocity of a 15 × 7 area of neighboring gates to reduce speckles due to dual PRF velocity errors as pre-processing for radar wind retrieval. Altube et al. [17] proposed a novel method that uses circular statistics in the phase space rather than the velocity space to identify and correct dual-PRF errors. This method improves the past dual-PRF correction method that has been used to improve the accuracy of radial velocity, and it is able to accurately detect and correct dual-RPF errors even in the presence of severe aliasing. It relies on the continuity of the local field but uses circular statistics and does not require prior global dealiasing. However, this technique is limited to dealing with outliers caused by aliasing. It is not suitable for other causes of outliers, such as errors in the range or velocity measurements. Additionally, the technique is limited to dual-frequency pulse-Doppler radar and is not suitable for other types of radar, such as single-frequency pulse-Doppler or chirp radar.
In this study, we propose techniques for noise correction of the observed radial velocity field and restoration of the lost radial velocity to improve the quality of WISSDOM wind fields. These techniques are straightforward, preserve spatial gradients, and suppress local extrema. The remainder of the paper is structured as follows: Section 2 describes the KMA operational radar network; Section 3 introduces the radial velocity quality control technique; Section 4 describes the results of the application of this technique are described and validated the quality-controlled radial velocity using wind profiler data; and finally, Section 5 presents the summary and conclusions.
2. Data
We utilized KMA’s ten S-band Doppler weather radar data. Figure 1 shows the S-band dual-polarization weather radar network and domain for WISSDOM. WISSDOM was used to compare the wind fields calculated with radial velocity before and after quality control. KMA established a homogeneous S-band dual-polarization network with the same specifications. Table 1 presents a list of radar observation characteristics. All strategies consisted of nine elevation angles for volume scanning and were performed every 5 min. The radar transmits a long pulse width of 2 at low elevation angles (less than 3°) to enhance the detectability of weak low-level echoes, such as winter snowstorms, whereas a short pulse of 1 pulse width is used at higher elevation angles (>3°) to increase the Nyquist velocity using a high PRF. In addition, the WRC developed CLEANER [18] for the quality control algorithm of radar observation data, which classifies precipitation and non-precipitation echoes using dual polarization parameters, and removes non-precipitation (such as ground clutter, Anomalous Propagation, second trip, and chaff echoes). CLEANER also removes non-precipitation areas from the radial velocity field.
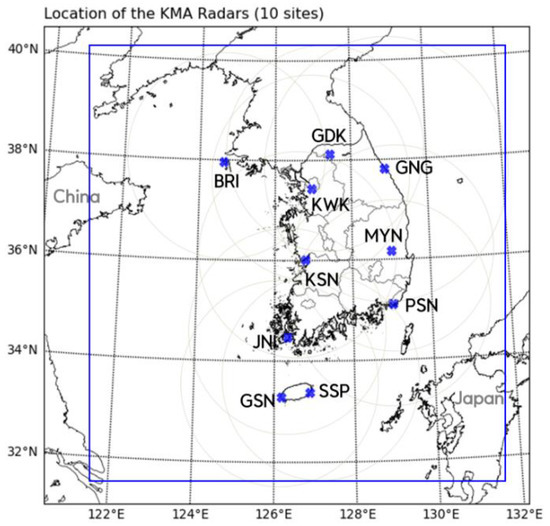
Figure 1.
Operational S-band Doppler weather radar network of the KMA. The blue marks and gray circles represent the locations of individual radars and their observational ranges, respectively. The blue box stands for the domain of WISSDOM.

Table 1.
Characteristics of the KMA’s S-band radar.
All elevation angles used the 5:4 dual-PRF mode to increase the Nyquist velocity to mitigate velocity aliasing. However, this technique not only generates noise in the process of receiving data but also loses radial velocity observations compared to reflectivity observations. Figure 2 shows the ratio of radial velocity observations to reflectivity observations for one month (August 2020) on 10 weather radars operated by the KMA. Here, it was possible to determine the lost radial velocity for each radar site. The radial velocity relative to the reflectivity was observed to be at least 50–80%, on average, at all elevation angles, indicating that the radial velocity observations relative to the reflectivity observations were lost from at least 20% to up to 50%. In particular, even though strong reflectivity values were observed owing to the influx of a strong precipitation system, the wind calculated from the radial velocity could be underestimated or a discontinuous wind distribution could appear in the area where the observed radial velocity is lost.
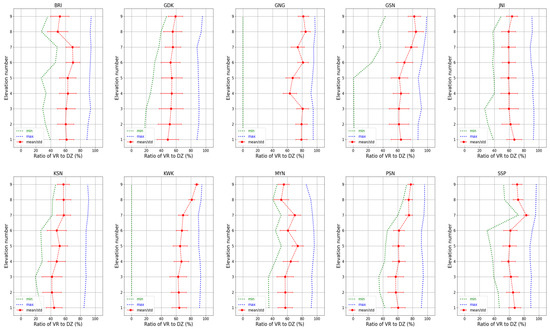
Figure 2.
Ratio of radar bins with radial velocity (VR) observation to radar reflectivity (DZ) observation as a function of elevation angles for August 2020 from KMA’s ten weather radars (BRI, GDK, GNG, GSN, JNI, KSN, KWK, MYN, PSN, and SSP). The red dots and bars represent the average ratio and standard deviations, respectively. The blue and green dotted lines indicate the maximum and minimum ratios at each elevation angle, respectively.
3. Quality Control of Radial Velocity
The entire process for quality control of the radar radial velocity is shown in Figure 3. The proposed approach identifies and removes speckles of abnormal radial velocity by comparing the sign of the median radial velocity with the surrounding radar bins. We then recovered the eliminated radial velocity using the median interpolation technique. To recover the losses of radial velocity over a wide area using the dual-PRF technique, we used the Velocity Azimuth Display (VAD) [19] curve-fitting technique for radial velocity.
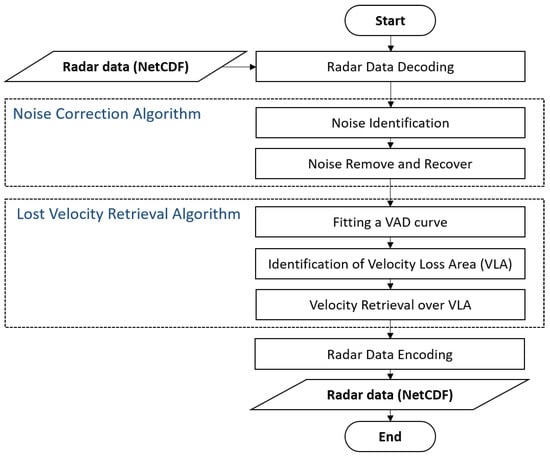
Figure 3.
Flowchart for a quality control algorithm for radial velocity.
3.1. Noise Elimination and Correction
We developed a noise filter that utilizes the sign and median values of radial velocity observations to detect and correct radial velocity noise. For an easier understanding, an example of the noise detection conditions and restoration process concepts is presented in Figure 4, along with a flowchart. An example of this concept assumes that the window size is three gates × three rays. Preferentially, in step 1, it is examined regardless of whether the radial velocity at the center of the window is valid (a value other than NaN). If it is NaN, it moves to the following azimuth scan. Otherwise, the noise is determined according to the following three steps: step 2) if the ratio of the valid radial velocity in the window is less than the threshold, it would be replaced by the NaN. Conversely, when the ratio is larger than the threshold, the median value is calculated using the radial velocity in the window, excluding the value at the centroid of the window. If the sign of the median value is not identical to the sign of the center radial velocity in the window. In that case, the center radial velocity is identified as noise, and the median value replaces it in step 3. If the sign of the center radial velocity is equal to the median sign, the noise is identified by the difference between the radial velocity and the median value in step 4. The median value replaces the radial velocity if its difference is larger than the threshold (e.g., 20 m s−1).
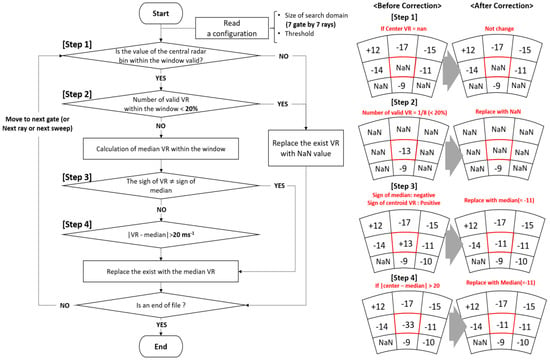
Figure 4.
Flowchart for noise correction and conceptual diagram for noise correction based on the sign of median radial velocity.
We conducted a sensitivity experiment to optimize the thresholds for each step. The thresholds for each condition were determined empirically based on noise cancelation performance and computational times for real-time implementation. The calculation time was mainly proportional to the window size. As the window size increased, the misidentification of normal echoes increased; however, the noise was not eliminated for a small window. The window size was set to seven gates × seven rays in consideration of the calculation time and noise correction rate. The ratio of the valid radial velocity in the window was set to 20% or less. The larger the threshold of the ratio, the higher the probability that a reasonable radial velocity, not a noise, will be removed. The absolute value of the difference between the median value and the center radial velocity in the window was set to 20 m s−1. We found that the number of eliminated noises was reduced dramatically if the threshold of the absolute value was set to a value larger than 20 m s−1.
3.2. Restoration Lost Radial Velocity
In this study, to restore the lost radial velocity, we utilized the VAD curve fitting function, which is the mean Doppler velocity of precipitation particles observed along the radar antenna rotated through a 360° azimuth scan as a function of the azimuth angle at a constant elevation angle of the Doppler radar. A flowchart of the restoration of the lost radial velocity is shown in Figure 5. First, we combined several adjacent azimuth scans to obtain a more reasonably fitted VAD curve and calculated the average radial velocity of radar bins within a given range along the radial direction across the azimuth scans. Based on the empirical experiments, ten azimuth scans were selected around the corresponding azimuth scan. Thus, the average for twenty-one azimuth scans, including the corresponding azimuth, was calculated. The number of azimuth scans used may be set differently depending on radar scan strategies, weather phenomena, etc.
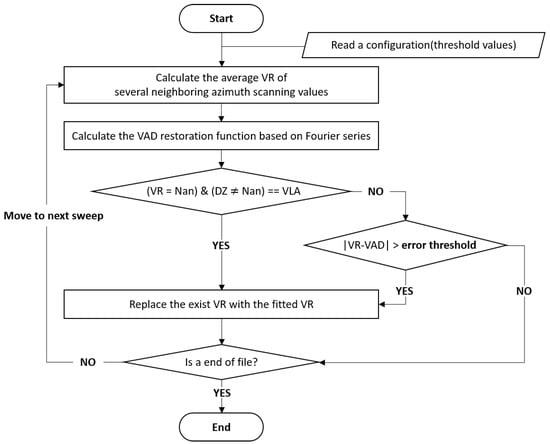
Figure 5.
Flowchart of a retrieval algorithm for lost radial velocity.
The VAD restoration function of the averaged values was then calculated based on a Fourier series. Next, to determine the lost radial velocity area (VLA), it was compared with the radar reflectivity observation field. If the radial velocity observation value did not exist in the area where the reflectivity observation value exists, it was replaced by the value of the restoration function. Then, among the observed radial velocities, a value with a large difference from the restoration function was determined as an outlier. Outliers were discriminated using the multiples () of the standard deviation and the average () of the difference between the radial velocity value and the restoration function value. The outlier value was converted into the value of the restoration function. The threshold values of each condition for restoring the loss region of the radial velocity were empirically optimized through sensitivity experiments.
Figure 6 shows why the average value of the radial velocity of several adjacent azimuth scans is used when calculating the VAD fitting function. Figure 6a shows an example of the lost radial velocity region of KWK at 0400 LST on 24 July 2020. In particular, when restoring by calculating each VAD fitting function from all azimuth scans, the texture of the entire radial velocity field appeared to be unnaturally restored, as shown in Figure 6b. To prevent discontinuous restoration of the radial velocity in this manner, the VAD fitting function calculated from the average value of the peripheral radial velocities was used to restore the radial velocity with continuity, as shown in Figure 6c.

Figure 6.
Example of restoring the radial velocity of the KWK radar site at 0400 local standard time (LST) on 24 July 2020. (a) Before restoring radial velocity. (b) Restoration using each VAD fitting function calculated from all azimuth scans. (c) Restoration using a VAD fitting function calculated from the mean of several neighboring azimuth scans. The two black lines indicate range lines at the radius of 150 km and 200 km from the radar, respectively.
To express the radial velocity as a Fourier series, the radial velocity in the spherical coordinate system is expressed by Equation (1) [19]. Here, represents the azimuth angle; represents the elevation angle; and , , and represent the east-west, north-south, and vertical components of the particle, respectively. In addition, if the radial velocity at the center of the radar at a given altitude is expressed as a component of the linear wind field, Equation (2) can be obtained, where r is the distance from the center and and are the velocity components in the east-west and north-south directions from the center, respectively.
The radial velocity, expressed as a linear wind field component, can be expressed as a quadratic Fourier series, as shown in Equation (3). Compared to the right side of Equation (2) and the right side of Equation (3), each Fourier coefficient is equal to Equations (4)–(8).
Equation (2) can be re-expressed as Equation (9) according to the coefficients, and the coefficients to are calculated by solving the Fourier series using numerical analysis. According to Equation (9), the radial velocity obtained by fitting each azimuth (VAD fitting) can be calculated.
It cannot be considered an outlier in all cases where a positive(negative) area is observed in the negative (positive) area of the radial velocity. Thus, we considered the effect on the observed value of the radial velocity due to small-scale meteorological phenomena, such as downbursts and tornadoes. As shown in Equation (10), if the observed radial velocity () is within the range of the error threshold () from the VAD fitting curve, VR is not an outlier value. Otherwise, the negative value of the observed radial velocity () is checked within the range of the error threshold from the VAD fitting curve. represents the average difference between the radial velocity and the restoration function value in an azimuth scan, denotes the standard deviation for each azimuth scan, and the value is 3, which is a value determined through optimization. Figure 7 shows an example of determining outliers in the azimuth scans. The observed radial velocity () shown by the blue circle in Figure 7a remains the same because the negative values () are within the range of determining the outliers. Figure 7b shows that the observed and negative values were determined as outliers because they were all outside the range.
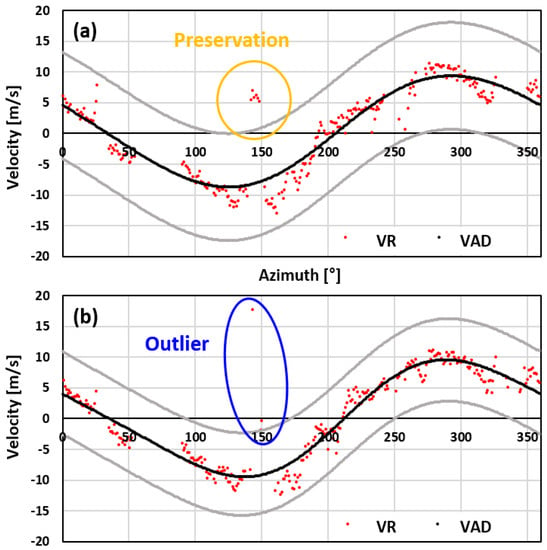
Figure 7.
Examples of identifying outliers of radial velocity using VAD fits. (a) A case for not an outlier (in the orange circle). (b) A case for an outlier (in the blue circle). The red dots indicate individual radial velocities. The black and gray lines represent the VAD and error curves, respectively.
4. Results and Verification
4.1. Quality Control Results
4.1.1. Noise Elimination and Correction
Figure 8 and Figure 9 show the results of the noise-removed and corrected radial velocity fields using the noise filter, with the sign and median of the observed radial velocity values developed in this study. Figure 8 shows the radial velocity fields observed by the KWK radar at 1200 LST on 28 February 2020. The noise correction technique was applied to all elevation angles of the radar observations, and the results are shown for elevation angles of −0.2°, 1.5°, and 4.4°. In this case, a precipitation echo was observed in most of the radar observation areas, and noise was spread in all directions. As a result of applying the noise filter, the noise was removed, and the radial velocity was corrected to the median value. Figure 9 shows the radial velocity fields observed using the MYN radar at 1610 LST on 6 June 2020. In this case, it can be confirmed that the radial velocity was corrected after removing only the noise of the radial velocity while maintaining the precipitation echo, even in the radial velocity of the small cell area. After removing and correcting the noise, spatially continuous radial velocity fields are obtained.
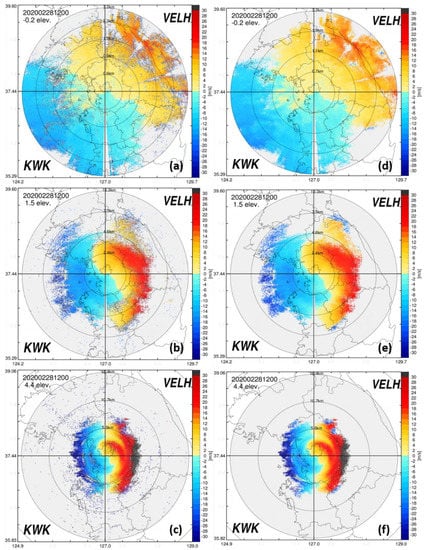
Figure 8.
PPIs of radial velocity (a–c) before and (d–f) after quality control at elevation angles of −0.2°, 1.5°, and 4.4° for KWK at 1200 LST on 28 February 2020.
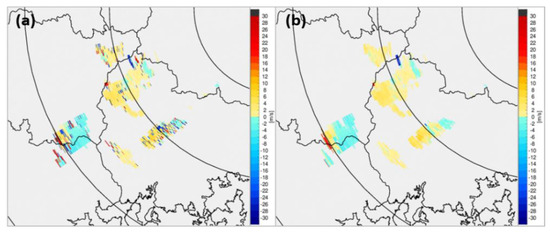
Figure 9.
PPIs of radial velocity (a) before and (b) after noise correction at an elevation angle of −0.8° for MYN at 1610 LST on 6 June 2020.
4.1.2. Restoration of Lost Radial Velocity
In this study, the VAD restoration function based on the Fourier series was calculated to restore the lost radial velocity compared to reflectivity. Figure 10 shows the results of applying the quality control technique step-by-step in the case of the radial velocity observed by the KWK radar at 0400 LST on 24 July 2020. Figure 10a shows the reflectivity field, showing strong reflectivity in the western region of the radar. Figure 10b, which presents the radial velocity field before quality control, shows that the radial velocity is lost over a wide area, including the strong reflectivity area. Figure 10c shows the result of applying the noise filter, and Figure 10d shows the result of restoring the lost radial velocity compared with the reflectivity observation using the VAD restoration function after applying the noise filter. By applying the restoration method based on the VAD, it was possible to obtain a spatially continuous radial velocity because it was completely restored even in areas where the radial velocity was widely lost.
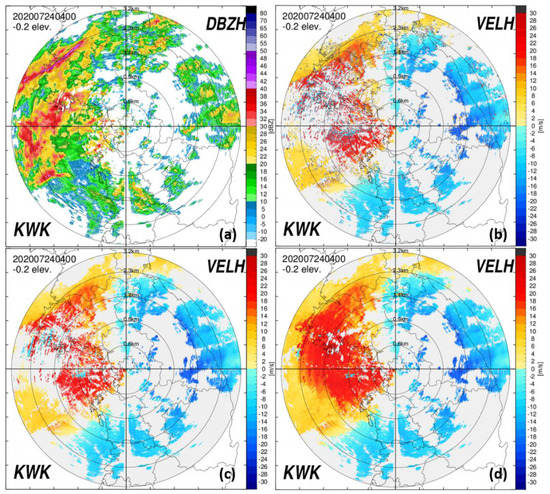
Figure 10.
PPIs at the elevation angle of −0.2° of KWK at 0400 LST on 24 July 2020; (a) radar reflectivity, (b) raw radial velocity, (c) radial velocity field after noise correction, and (d) radial velocity after noise correction and restoration of lost radial velocity.
Figure 11 shows a case in which a positive area was observed in the negative area of the radial velocity of the KWK radar site at 0400 LST on 24 July 2020. Figure 11a shows that a wide positive area of the radial velocity was observed, with outliers in the negative area of the radial velocity. Then, the positive radial velocity area shown in Figure 11b was preserved, as is, and only outliers were determined and corrected to the value of the VAD fitting function.
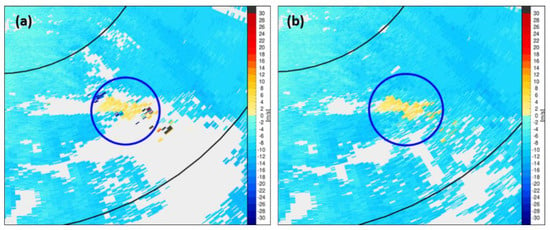
Figure 11.
Examples of (a) before and (b) after outlier correction and retrieval of radial velocity using VAD fits at an elevation angle of −0.2° for KWK at 0400 LST on 24 July 2020.
4.1.3. Utilization of Quality-Controlled Radial Velocity
To confirm the effect of the quality control technique on the radar radial velocity developed in this study, we compared the results of the WISSDOM wind calculated using the radial velocity before quality control and the radial velocity after quality control as input data. Figure 12 shows the reflectivity fields, raw radial velocity fields, and quality-controlled radial velocity fields on the BRI and GDK radar at 2100 LST on 3 July 2021. In the region where the echo of the reflectivity fields was observed, the loss of radial velocity in the radial velocity fields was seen, as marked by the blue dotted line. As for the quality-controlled radial velocity, the noise was clearly removed, and the lost area was restored, as shown in Figure 12c,f. When the BRI and GDK radars were synthesized to calculate the WISSDOM wind, the area where the radial velocity was lost in the BRI and GDK radars overlapped, as shown in Figure 12g.
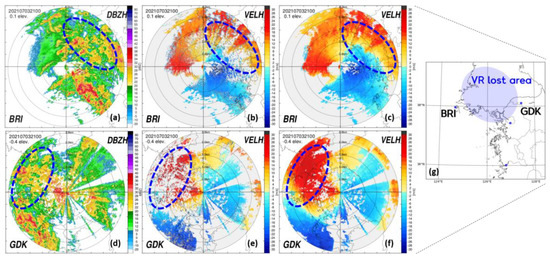
Figure 12.
PPIs at the lowest elevation angles of (top) BRI and (bottom) GDK at 2100 LST on July 2021; (a,d) radar reflectivity, (b,e) raw radial velocity, (c,f) radial velocity after quality control, and (g) the simultaneously lost area of the radial velocities at both BRI and GDK.
Figure 13 shows the wind speed and wind direction calculated using the BRI radar data and the GDK radar data as input data for WISSDOM, depending on whether the radial velocity quality is managed. Figure 13a,c show the wind speed and direction of WISSDOM calculated using the radial velocity before quality control as input data, and Figure 13b,d show the wind speed and direction of WISSDOM calculated using the radial velocity after quality control as input data. The wind field before quality control, as shown in Figure 13a,c, showed a spatially discontinuous distribution owing to the influence of noise and irregularly lost radial velocity. After quality control, the wind field showed a spatially continuous distribution, as shown in Figure 13b,d, and the wind speed in the lost radial velocity area was stronger in areas with strong reflectivity. The WISSDOM wind fields mainly changed depending on the presence or absence of restoration in the radial velocity loss area, and more spatially continuous WISSDOM wind fields could be calculated through the quality control technique of the radar radial velocity developed in this study.
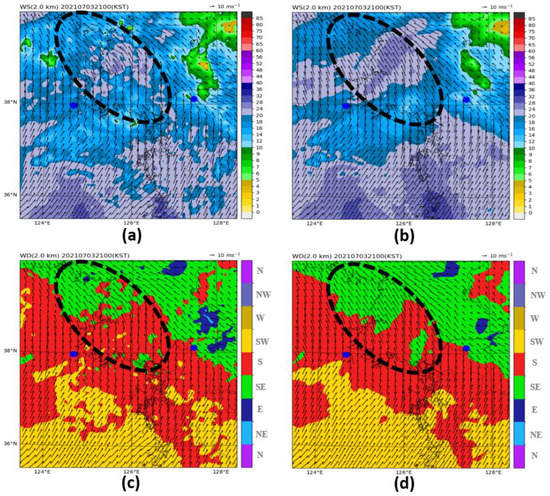
Figure 13.
Comparison of (top) wind speed and (bottom) wind direction at an altitude of 2 km derived from WISSDOM at 2100 LST on 3 July 2021; (a,c) using raw radial velocity and (b,d) using quality-controlled radial velocity.
4.2. Verification
4.2.1. Data and Method
The quality-controlled radial velocity was quantitatively verified using observational data from a wind profiler. To compare the wind elements (u, v, w) observed by the wind profiler with the radar radial velocity, they were converted to the radial velocity in the direction observed by the radar [20]. The left side of Figure 14 shows the method for comparing the radial velocity of the radar and wind profiler data, where d represents the distance between the radar and wind profiler, r is the range from the radar to the point of interest [11], is the elevation angle of the radar beam measured upward from the horizontal plane through the radar, and is the azimuth angle of the radar beam measured clockwise from north. Five radars at KWK, GDK, KSN, MYN, and PSN and seven wind profilers at 47099, 47095, 47114, 47229, 47135, 47130, and 47155 points were used for verification, and their locations are shown on the right side of Figure 14. Considering the distance between the radar and the wind profilers and the radar observation radius, a comparative verification was performed with ten pairs of radars and wind profilers, as shown in Table 2.
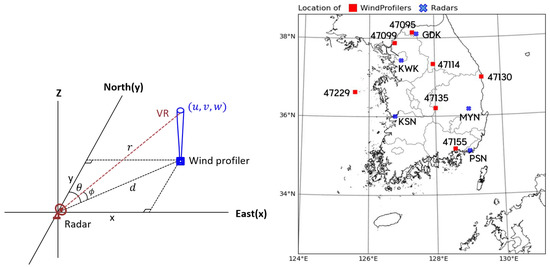
Figure 14.
(left) Conceptual diagram of geometrical matching for radial velocity comparison between radar and wind profilers and (right) deployment of weather radars and wind profilers in Korea.

Table 2.
Distance and azimuth of the wind profilers from the radars used for verification.
To investigate the validity of the quality-controlled radar radial velocity, the radar radial velocity at each stage of quality control was compared with the observed value of the wind profilers. The CLEANER QC radial velocity, which is a step before radial velocity quality control (RAW), radial velocity after noise removal and correction (NOS), and radial velocity restored in the disappearance area (ALL), were calculated from the radial velocity and compared. During the verification period, only the corrected or restored radial velocity (QCD) was extracted through quality control, excluding the actual observation data, and compared with the radial velocity calculated by the wind profilers. The verification period was five months, from 0000 LST on 1 June 2021 to 2350 LST on 31 October 2021. The data were compared every 10 min, considering the time resolution of the wind profiler. The Root Mean Square Error (RMSE) and Correlation Coefficient (CC) were used as verification indicators to compare the radar radial velocity with the observed value of the wind profiler. The RMSE and CC were calculated using Equations (11) and (12), where is the radial velocity of the radar at the point of the wind profiler and is the radial velocity data calculated from the wind profiler.
4.2.2. Verification Results
Figure 15 shows the correlation distribution between the radial velocities of all radars and all wind profilers during the verification period at each quality control stage. The verification results of the RAW, NOS, ALL, and QCD stages are shown in Figure 15a–d. The raw radial velocity values (RAW), excluding non-precipitation echo, were distributed with a lot of noise, as shown in Figure 15a, and the RMSE was 7.99 m s−1 and CC was 0.75. Through the NOS step, it can be seen in Figure 15b that a significant amount of noise was eliminated and corrected, and the error was significantly reduced compared to the previous step. The RMSE was 4.78 m s−1, which was less than that of the previous step of quality control, and the CC was 0.89, which was highly correlated with the radial velocity of the wind profilers. Even after restoring the lost radial velocity region, the RMSE was 4.71 m s−1, which was less than the error in the previous step, even after restoring the lost radial velocity region. The CC was 0.89, which shows a high correlation with the radial velocity of the wind profilers, as shown in Figure 15c. In addition, only the quality-controlled radial velocity was extracted, excluding the actual observed value. The correlation distribution compared with the radial velocity of the wind profilers is shown in Figure 15d. The RMSE was 5.34 m s−1 and the CC was 0.85, which slightly increased the error compared to the values, including the actual observation data of the ALL stage. Although the correlation decreased, the results of the quality control technique were significant when compared to the radial velocity of the wind profilers.
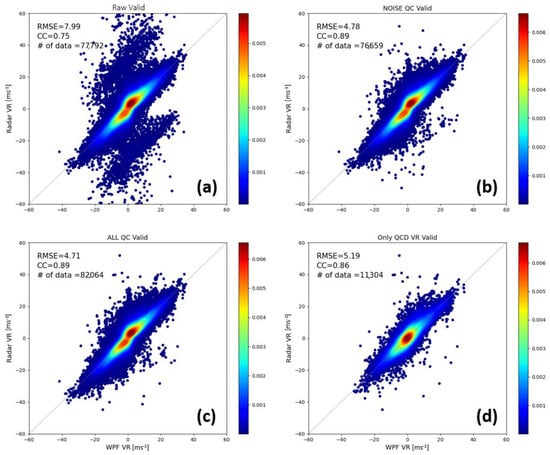
Figure 15.
Two-dimensional normalized frequency distributions (NFDs) of radial velocity between the radars and the wind profilers (a) before noise correction (RAW), (b) after noise correction (NOS), (c) after quality control (ALL), and (d) only quality controlled radial velocity (QCD).
Figure 16 shows the quantitative verification results for each stage of the quality control techniques for the 10 pairs of radar and wind profilers used in the verification. Comparing the verification values of RAW and NOS, the RMSE decreased in all pairs, and CC increased in all pairs. In ALL and QCD, the values of RMSE and CC were similar to those in the NOS step. For most of the verification pairs, the trend in the verification values is shown as KSN-47229 in Figure 17a–d. In the case of GDK-47114, the RMSE value was reduced during the quality control stage. Although the CC value after quality control increased, the CC value in RAW was 0.42, which means that the correlation was low. This is presumed to be due to the mountainous terrain between the GDK radar and the wind profiler at 47114 points and errors in the wind profiler. Nevertheless, the QCD distribution in Figure 17h and the distribution of the actual observation data in Figure 17e are similar, so it is considered effective to use the quality-controlled radial velocity. In the case of PSN-47155, the RMSE value in QCD was 7.60 m s−1, which was larger than that of RAW, and the CC value in QCD was 0.68, which was lower than that of RAW. This is because the amount of data was small, and a few error values influenced the calculation of the verification values. Most of the QCD values in PNS-47155 were valid, as shown in Figure 17. Table 3 lists the values of the RMSE and CC for each stage of the quality control technique for the 10 pairs of radar and wind profilers used for verification.
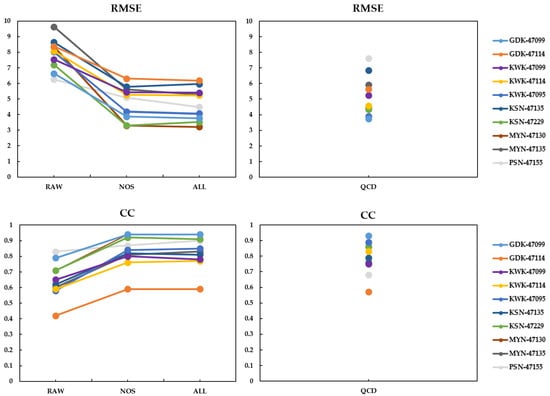
Figure 16.
(top) RMSE and (bottom) CC for each QC stage and QCD of ten pairs. RAW is actual radial velocity, excluding non-precipitation echoes from raw data. NOS is noise-corrected radial velocity in RAW. ALL is the radial velocity after quality control. QCD is only quality-controlled radial velocity excluding actual observations.
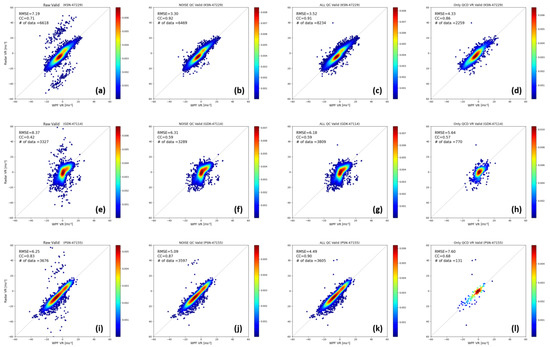
Figure 17.
Same as Figure 15. (a–d) KSN-47229, (e–h) GDK-47114, (i–l) PSN-47155.

Table 3.
Quantitative verification results for each stage of the radial velocity quality control technique.
5. Conclusions
A technique for quality control of radar radial velocity was developed based on WISSDOM to improve the accuracy of wind information, such as a three-dimensional radar wind field. This technique removes only the noise of radial velocity using a noise filter developed using the sign and median value of radial velocity observation, and then re-stores it to the median value while maintaining the precipitation echo. By spatiotemporal comparison of radial velocity between radar and adjacent wind profiler, the original RMSE of 6~10 m s−1 was dramatically reduced to 3~7 m s−1 after noise correction. The radial velocity was restored using the VAD restoration function to fill the blank (loss) area of the radial velocity. In particular, the distribution of radial velocity showed a more realistic and continuous spatial structure after the restoration procedure.
The quality-controlled radial velocity was used as input data to produce wind based on WISSDOM. After applying quality-controlled radial velocity to WISSDOM, it was confirmed that a more spatially continuous and accurate wind could be secured. This technique reflects the surrounding observations to some extent in the loss region because the VAD restoration function is calculated using several azimuth curves. However, wind analysis can be simplified by linearly restoring the lost radial velocity region due to the limitation of the VAD method, but it can be easier to predict and analyze meso-scale precipitation systems. This technique not only eliminates outliers by setting out an outlier range on the VAD curve but also considers that small-scale meteorological phenomena are not blurred in the area where the radial velocity is observed. In addition, each condition and threshold for the quality control algorithm can be flexibly changed in consideration of the user environment, such as radar type and observation strategy.
We operated on this technique as a test, verified its performance, and applied it to the operational radar quality control system of the WRC from August 2021. In the future, it is expected to be used for more accurate analysis and forecast support for various meteorological phenomena, such as precipitation development factor analysis, typhoon tracking, and local vortices.
6. Patents
Korean patent (Patent Number: 10-2212524) and United States patent (Patent Number: US 11,474,237 B2) “Method for retrieval of lost radial velocity in weather radar, recording medium and device for performing the method”.
Author Contributions
This work was possible through significant contributions from all authors. Conceptualization, S.-Y.P., S.-H.J. and K.-H.K.; methodology, S.-Y.P., S.-H.J. and K.-H.K.; software, S.-Y.P., S.-H.J. and K.-H.K.; formal analysis, S.-Y.P.; investigation, S.-Y.P.; writing—original draft preparation, S.-Y.P.; writing—review and editing, S.-Y.P., S.-H.J. and K.-H.K.; visualization, S.-Y.P.; supervision, S.-H.J. and K.-H.K.; funding acquisition, S.-H.J. and K.-H.K.; All authors have read and agreed to the published version of the manuscript.
Funding
This research was supported by the “Development of radar based severe weather monitoring technology (KMA2021-03121)” of “Development of integrated application technology for Korea weather radar” project funded by the Weather Radar Center, Korea Meteorological Administration.
Institutional Review Board Statement
Not applicable.
Informed Consent Statement
Not applicable.
Data Availability Statement
Not applicable.
Conflicts of Interest
The authors declare no conflict of interest.
References
- Liou, Y.C.; Chang, Y.J. A variational multiple-Doppler radar three-dimensional wind synthesis method and its impacts on thermodynamic retrieval. Mon. Wea. Rev. 2009, 137, 3992–4010. [Google Scholar] [CrossRef]
- Liou, Y.C.; Chang, S.F.; Sun, J. An application of the immersed boundary method for recovering the three-dimensional wind fields over complex terrain using multiple-Doppler radar data. Mon. Wea. Rev. 2012, 140, 1603–1619. [Google Scholar] [CrossRef]
- Gong, J.; Wang, L.L.; Xu, Q. A three-step dealiasing method for Doppler velocity data quality control. J. Atmos. Oceanic Technol. 2003, 20, 1738–1748. [Google Scholar] [CrossRef]
- Gao, J.; Droegemeier, K.K. A Variational Technique for Dealiasing Doppler Radial Velocity Data. J. Appl. Meteor. 2003, 43, 934–940. [Google Scholar] [CrossRef]
- Ming, W.; Liu, Y.; Jiawen, P.; Nan, L. New Velocity Dealiasing of Doppler Radar with the Interactive Method. In Proceedings of the WRI World Congress on Computer Science and Information Engineering, Los Angeles, CA, USA, 31 March–2 April 2009. [Google Scholar] [CrossRef]
- Li, G.; He, G.X.; Zou, X.L.; Ray, P.S. A velocity dealiasing scheme for C-band weather radar systems. Adv. Atmos. Sci. 2014, 31, 17–26. [Google Scholar] [CrossRef]
- Chu, A.; Wu, D.; Hu, H.; Xu, D.; Chen, A. A novel velocity dealiasing algorithm for S-Band weather radars. Atmosfera 2018, 32, 1–13. [Google Scholar] [CrossRef]
- He, G.; Sun, J.; Ying, Z.; Zhang, L. A Radar Radial Velocity Dealiasing Algorithm for Radar Data Assimilation and its Evaluation with Observations from Multiple Radar Networks. Remote Sens. 2019, 11, 2457. [Google Scholar] [CrossRef]
- Louf, A.; Protat, A.; Jackson, R.C.; Collis, S.M.; Helmus, J. UNRAVEL: A Robust Modular Velocity Dealiasing Technique for Doppler Radar. J. Atmos. Oceanic Technol. 2020, 37, 741–758. [Google Scholar] [CrossRef]
- Zrnic, D.S.; Mahapatra, P. Two methods of ambiguity resolution in pulse Doppler weather radars. IEEE Trans. Aerosp. Electron. Syst. 1985, AES-21, 470–483. [Google Scholar] [CrossRef]
- Doviak, R.J.; Zrnic, D.S. Doppler Radar and Weather Observations, 2nd ed.; Academic: San Diego, CA, USA, 1993. [Google Scholar]
- Tahanout, M.; Adane, A.E.H.; Chatelet, J.P.D. An improved m-PRT technique for spectral analysis of weather radar observations. IEEE Trans. Geosci. Remote Sens. 2015, 53, 5572–5582. [Google Scholar] [CrossRef]
- Holleman, I.; Beekhuis, H. Analysis and correction of dual PRF velocity data. J. Atmos. Oceanic Technol. 2003, 20, 443–453. [Google Scholar] [CrossRef]
- Joe, P.; May, P.T. Correction of Dual PRF Velocity Errors for Operational Doppler Weather Radars. J. Atmos. Oceanic Technol. 2003, 20, 429–442. [Google Scholar] [CrossRef]
- Hengstebeck, T.; Wapler, K.; Heizenreder, D. Radar Network-Based Detection of Mesocyclones at the German Weather Service. J. Atmos. Oceanic Technol. 2018, 35, 299–321. [Google Scholar] [CrossRef]
- Park, S.-G.; Lee, D.-K. Retrieval of High-Resolution Wind Fields over the Southern Korean Peninsula Using the Doppler Weather Radar Network. Weather. Forecast. 2009, 24, 87–103. [Google Scholar] [CrossRef]
- Altube, P.; Bech, J.; Argemi, O.; Rigo, T.; Pineda, N.; Collis, S.; Helmus, J. Correction of Dual-PRF Doppler Velocity Outliers in the Presence of Aliasing. J. Atmos. Oceanic Technol. 2017, 34, 1529–1543. [Google Scholar] [CrossRef]
- Oh, Y.A.; Kim, H.L.; Suk, M.K. Clutter Elimination Algorithm for Non-Precipitation Echo of Radar Data Considering Meteorological and Observational Properties in Polarimetric Measurements. Remote Sens. 2020, 12, 3790. [Google Scholar] [CrossRef]
- Browning, K.A.; Wexler, R. The determination of kinematic properties of a wind field using Doppler radar. J. Appl. Meteor. 1968, 7, 105–113. [Google Scholar] [CrossRef]
- Miller, L.J.; Anderson, W. Multiple Doppler Radar Wind Synthesis in CEDRIC; CEDRIC Manual, Appendix F; National Center for Atmospheric Research: Boulder, CO, USA, 1991. [Google Scholar]
Disclaimer/Publisher’s Note: The statements, opinions and data contained in all publications are solely those of the individual author(s) and contributor(s) and not of MDPI and/or the editor(s). MDPI and/or the editor(s) disclaim responsibility for any injury to people or property resulting from any ideas, methods, instructions or products referred to in the content. |
© 2023 by the authors. Licensee MDPI, Basel, Switzerland. This article is an open access article distributed under the terms and conditions of the Creative Commons Attribution (CC BY) license (https://creativecommons.org/licenses/by/4.0/).