

Impact of Aerosols on NPP in Basins: Case Study of WRF−Solar in the Jinghe River Basin


Abstract
1. Introduction
2. Study Area and Data
2.1. Study Area
2.2. Data Source and Preprocessing
2.2.1. Reanalysis Data
2.2.2. Moderate−Resolution Imaging Spectroradiometer (MODIS) Data
2.2.3. Other Data
3. Methods
3.1. WRF−Solar Model
3.2. CASA Model
3.3. Solar Radiation Calculation
3.4. Model Evaluation
4. Results
4.1. Spatial and Temporal Characteristics of Aerosol Optical Depth
4.2. Examination of the Results of the WRF−Solar Model
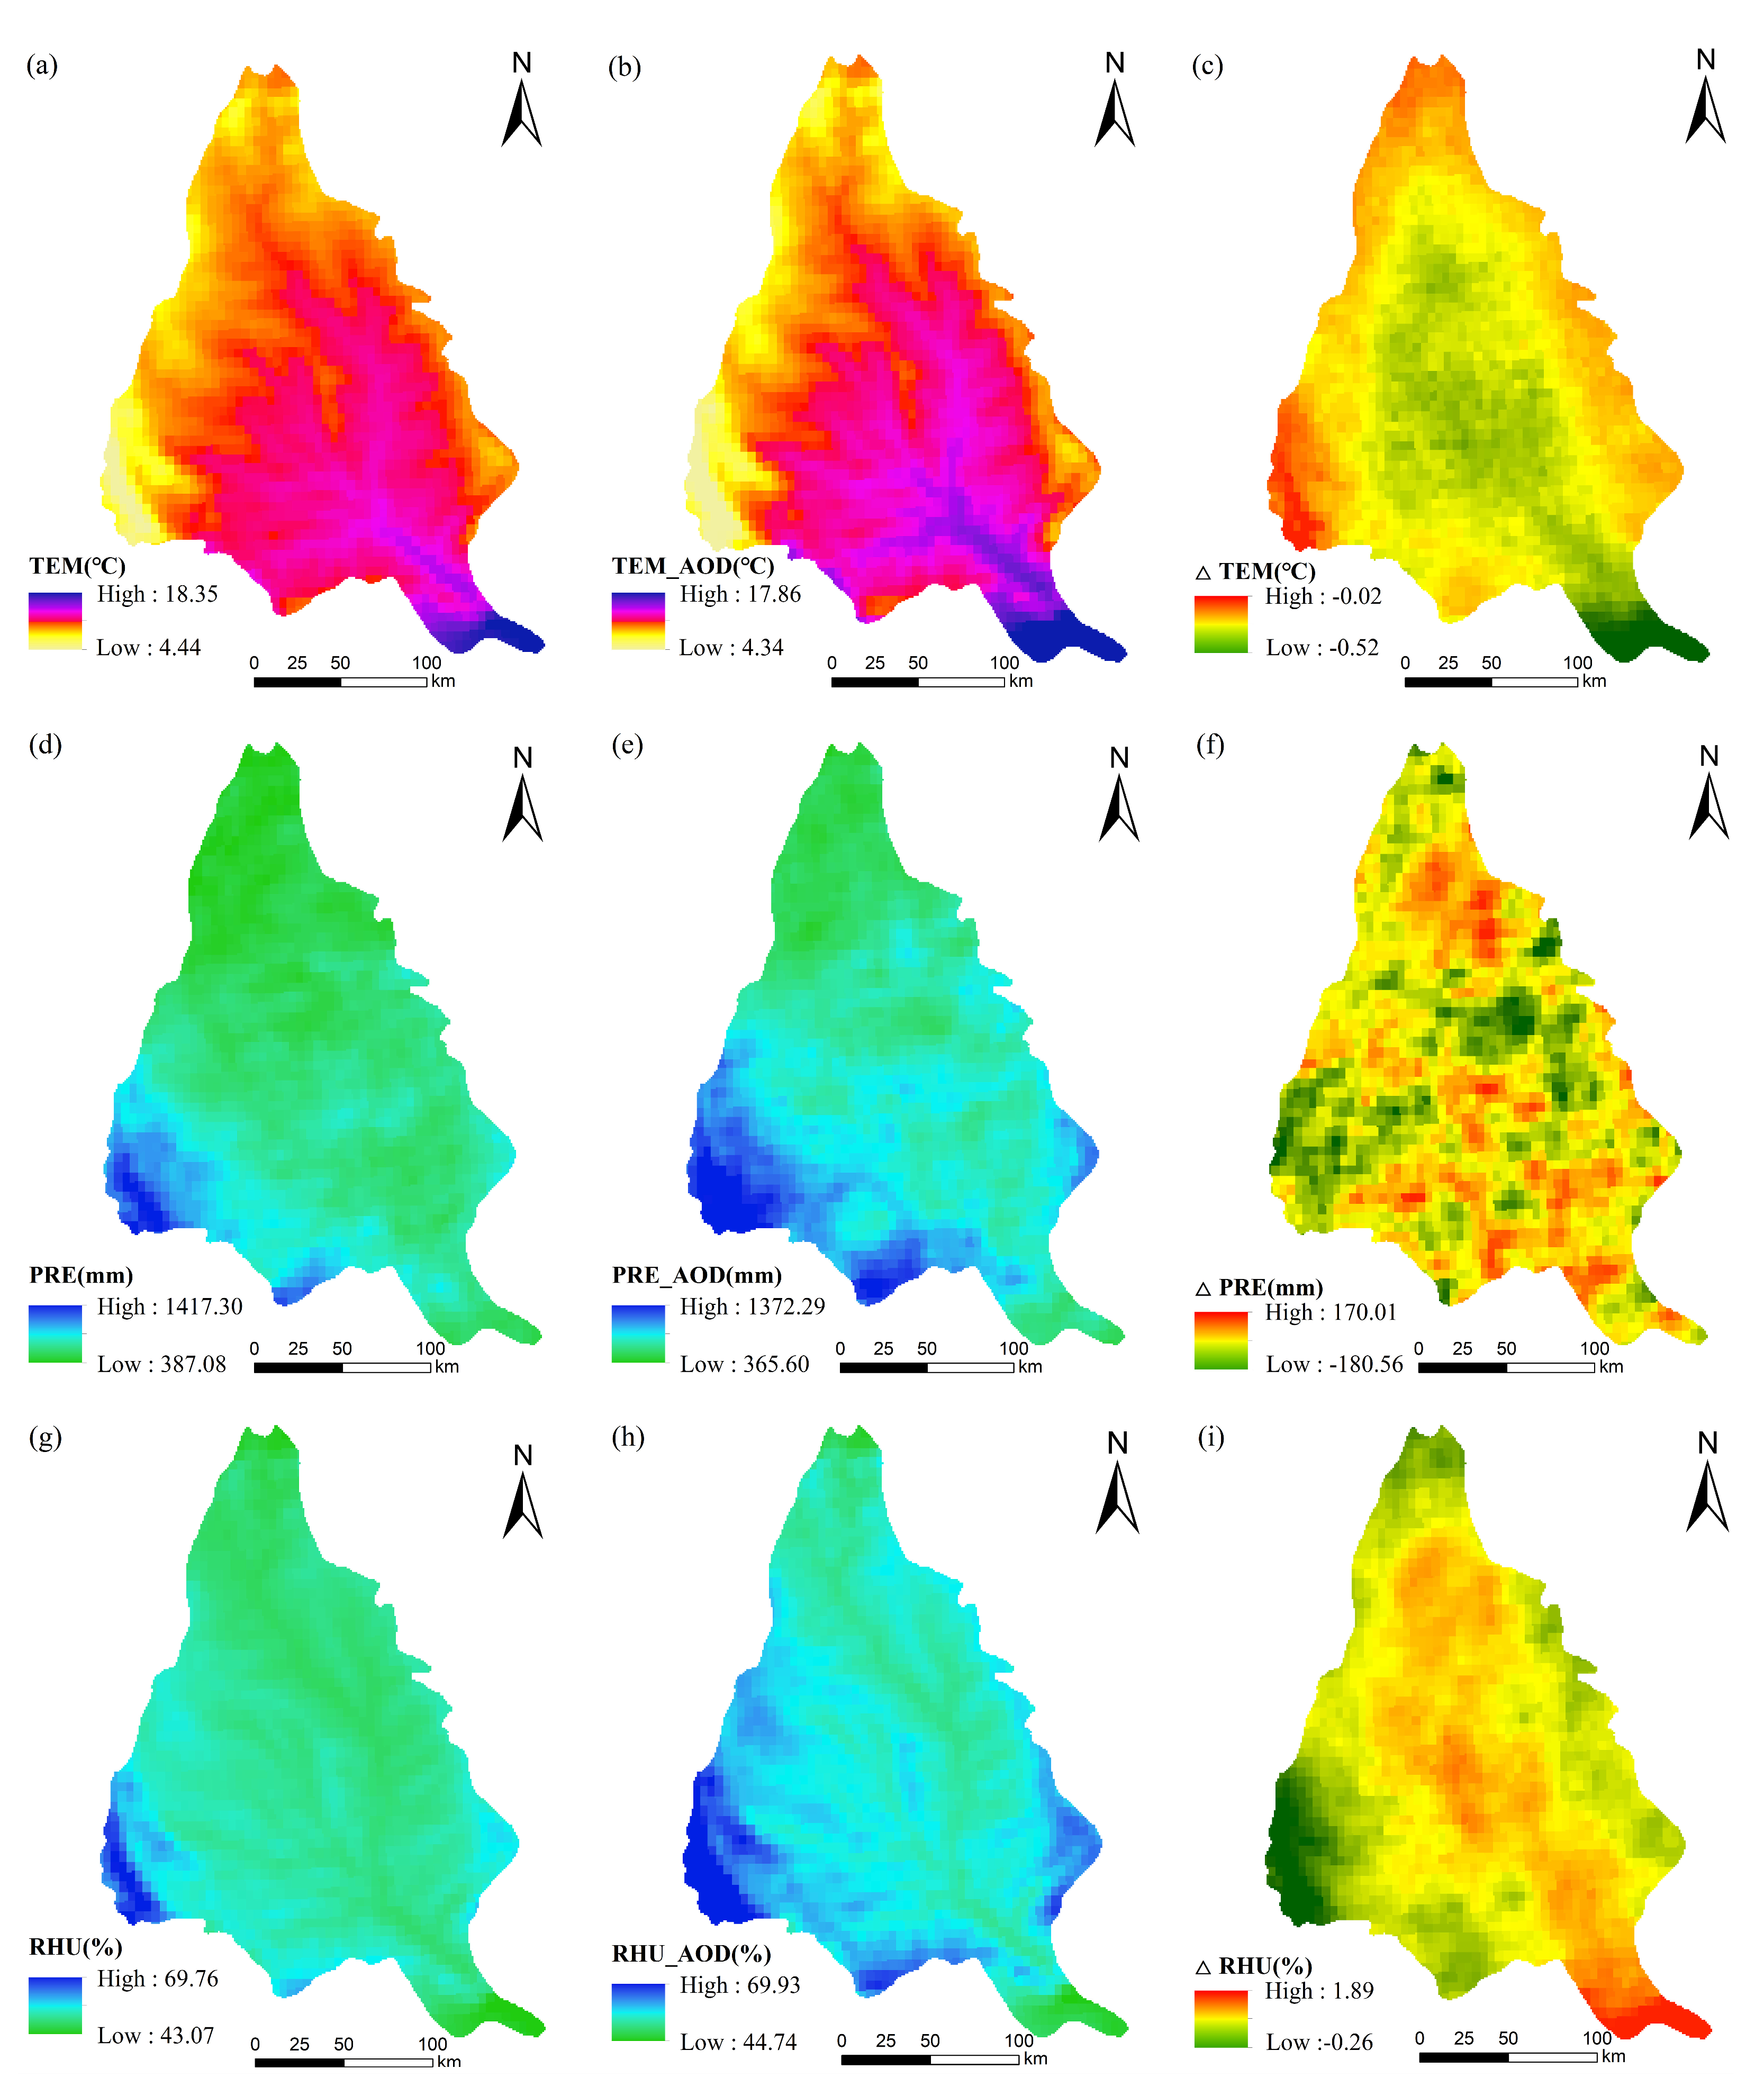
4.3. Comparison of WRF−Solar Model Results and WRF−Solar−AOD Results
4.4. Effects of Aerosols on Vegetation Productivity
5. Discussion
5.1. Aerosol and Radiation
5.2. Aerosol and Temperature
5.3. Aerosol–Cloud and Rainfall
5.4. Aerosol and NPP
5.5. Unit, Scale, and Uncertainty
6. Conclusions
Author Contributions
Funding
Data Availability Statement
Conflicts of Interest
References
- Charlson, R.; Schwartz, S.; Hales, J.; Cess, R.; Coakley, J.A., Jr.; Hansen, J.; Hofmann, D. Climate Forcing by Anthropogenic Aerosols. Science 1992, 255, 423–430. [Google Scholar] [CrossRef] [PubMed]
- Wang, X.; Wang, C.; Wu, J.; Miao, G.; Chen, M.; Chen, S.; Wang, S.; Guo, Z.; Wang, Z.; Wang, B.; et al. Intermediate Aerosol Loading Enhances Photosynthetic Activity of Croplands. Geophys. Res. Lett. 2021, 48. [Google Scholar] [CrossRef]
- Li, Z. Impact of aerosols on the weather, climate and environment of China: An overview. Trans. Atmos. Sci. 2020, 43, 76–92. (In Chinese) [Google Scholar] [CrossRef]
- Li, X.; Liang, H.; Cheng, W. Spatio-Temporal Variation in AOD and Correlation Analysis with PAR and NPP in China from 2001 to 2017. Remote Sens. 2020, 12, 976. [Google Scholar] [CrossRef]
- Zhang, J.; Ding, J.; Zhang, J.; Yuan, M.; Li, P.; Xiao, Z.; Peng, C.; Chen, H.; Wang, M.; Zhu, Q. Effects of increasing aerosol optical depth on the gross primary productivity in China during 2000–2014. Ecol. Indic. 2020, 108, 105761. [Google Scholar] [CrossRef]
- Williams, I.N.; Riley, W.J.; Kueppers, L.M.; Biraud, S.C.; Torn, M.S. Separating the effects of phenology and diffuse radiation on gross primary productivity in winter wheat. J. Geophys. Res. Biogeosci. 2016, 121, 1903–1915. [Google Scholar] [CrossRef]
- Gui, X.; Wang, L.; Su, X.; Yi, X.; Chen, X.; Yao, R.; Wang, S. Environmental factors modulate the diffuse fertilization effect on gross primary productivity across Chinese ecosystems. Sci. Total Environ. 2021, 793, 148443. [Google Scholar] [CrossRef]
- Yang, X.; Li, J.; Yu, Q.; Ma, Y.; Tong, X.; Feng, Y.; Tong, Y. Impacts of diffuse radiation fraction on light use efficiency and gross primary production of winter wheat in the North China Plain. Agric. For. Meteorol. 2019, 275, 233–242. [Google Scholar] [CrossRef]
- Wolffe, M.C.; Wild, O.; Long, S.P.; Ashworth, K. Temporal variability in the impacts of particulate matter on crop yields on the North China Plain. Sci. Total Environ. 2021, 776, 145135. [Google Scholar] [CrossRef]
- Kalina, E.A.; Friedrich, K.; Morrison, H.; Bryan, G.H. Aerosol Effects on Idealized Supercell Thunderstorms in Different Environments. J. Atmos. Sci. 2014, 71, 4558–4580. [Google Scholar] [CrossRef]
- Jimenez, P.A.; Hacker, J.P.; Dudhia, J.; Haupt, S.E.; Ruiz-Arias, J.A.; Gueymard, C.A.; Thompson, G.; Eidhammer, T.; Deng, A. WRF-Solar: Description and Clear-Sky Assessment of an Augmented NWP Model for Solar Power Prediction. Bull. Am. Meteorol. Soc. 2016, 97, 1249–1264. [Google Scholar] [CrossRef]
- Yang, J.; Sengupta, M.; Jiménez, P.A.; Kim, J.-H.; Xie, Y. Evaluating WRF-Solar EPS cloud mask forecast using the NSRDB. Sol. Energy 2022, 243, 348–360. [Google Scholar] [CrossRef]
- Jiménez, P.A.; Dudhia, J.; Thompson, G.; Lee, J.A.; Brummet, T. Improving the cloud initialization in WRF-Solar with enhanced short-range forecasting functionality: The MAD-WRF model. Sol. Energy 2022, 239, 221–233. [Google Scholar] [CrossRef]
- Duan, J.; Zuo, H.; Bai, Y.; Chang, M.; Chen, X.; Wang, W.; Ma, L.; Chen, B. A multistep short-term solar radiation forecasting model using fully convolutional neural networks and chaotic aquila optimization combining WRF-Solar model results. Energy 2023, 271, 126980. [Google Scholar] [CrossRef]
- Sosa-Tinoco, I.; Prósper, M.A.; Miguez-Macho, G. Development of a solar energy forecasting system for two real solar plants based on WRF Solar with aerosol input and a solar plant model. Sol. Energy 2022, 240, 329–341. [Google Scholar] [CrossRef]
- Cheng, X.; Ye, D.; Shen, Y.; Li, D.; Feng, J. Studies on the improvement of modelled solar radiation and the attenuation effect of aerosol using the WRF-Solar model with satellite-based AOD data over north China. Renew. Energy 2022, 196, 358–365. [Google Scholar] [CrossRef]
- Thompson, G.; Eidhammer, T. A Study of Aerosol Impacts on Clouds and Precipitation Development in a Large Winter Cyclone. J. Atmos. Sci. 2014, 71, 3636–3658. [Google Scholar] [CrossRef]
- Liu, Y.; Qian, Y.; Feng, S.; Berg, L.K.; Juliano, T.W.; Jiménez, P.A.; Liu, Y. Sensitivity of solar irradiance to model parameters in cloud and aerosol treatments of WRF-solar. Sol. Energy 2022, 233, 446–460. [Google Scholar] [CrossRef]
- Field, C.B.; Behrenfeld, M.J.; Randerson, J.T.; Falkowski, P. Primary production of the biosphere: Integrating terrestrial and oceanic components. Science 1998, 281, 237–240. [Google Scholar] [CrossRef]
- Jiang, T.; Wang, X.; Afzal, M.M.; Sun, L.; Luo, Y. Vegetation Productivity and Precipitation Use Efficiency across the Yellow River Basin: Spatial Patterns and Controls. Remote Sens. 2022, 14, 5074. [Google Scholar] [CrossRef]
- Su, S.T.; Zeng, Y.; Zhao, D.; Zheng, Z.J.; Wu, X.H. Optimization of net primary productivity estimation model for terrestrial vegetation in China based on CERN data. Acta Ecol. Sin. 2022, 42, 1276–1289. [Google Scholar] [CrossRef]
- Wu, C.; Chen, K.; E, C.; You, X.; He, D.; Hu, L.; Liu, B.; Wang, R.; Shi, Y.; Li, C.; et al. Improved CASA model based on satellite remote sensing data: Simulating net primary productivity of Qinghai Lake basin alpine grassland. Geosci. Model Dev. 2022, 15, 6919–6933. [Google Scholar] [CrossRef]
- Jia, K.; Dandan, Z.; Chunxing, H.; Yanhua, Y.; Hao, J.; Bingzi, L. Temporal and Spatial Variation of Vegetation in Net Primary Productivity of the Shendong Coal Mining Area, Inner Mongolia Autonomous Region. Sustainability 2022, 14, 10883. [Google Scholar] [CrossRef]
- He, Q.; Zhang, M.; Huang, B. Spatio-temporal variation and impact factors analysis of satellite-based aerosol optical depth over China from 2002 to 2015. Atmos. Environ. 2016, 129, 79–90. [Google Scholar] [CrossRef]
- Nooni, I.K.; Tan, G.; Hongming, Y.; Chaibou, A.A.S.; Habtemicheal, B.A.; Gnitou, G.T.; Sian, K.T.C.L.K. Assessing the Performance of WRF Model in Simulating Heavy Precipitation Events over East Africa Using Satellite-Based Precipitation Product. Remote. Sens. 2022, 14, 1964. [Google Scholar] [CrossRef]
- Han, Z.; Long, X.; Wang, S.; Wei, Q.; Chen, X. Numerical Studies on Effects by Different Initial Fields on a Rainstorm in Northwest China. Plateau Meteorol. 2021, 40, 333–342. [Google Scholar] [CrossRef]
- Panuju, D.R.; Paull, D.J.; Griffin, A.L. Spatio-temporal quality distribution of MODIS vegetation collections 5 and 6: Implications for forest-non-forest separability. Int. J. Remote Sens. 2020, 41, 373–397. [Google Scholar] [CrossRef]
- Gohar, A.; Yansong, B.; Richard, B.; Weiyao, T.; Qifeng, L.; Jinzhong, M. Evaluating MODIS and MISR aerosol optical depth retrievals over environmentally distinct sites in Pakistan. J. Atmos. Sol. -Terr. Phys. 2018, 183, 19–35. [Google Scholar] [CrossRef]
- Paraskevi, V.; Theano, M.; Apostolos, A.; Stylianos, K. Medicane Ianos: 4D-Var Data Assimilation of Surface and Satellite Observations into the Numerical Weather Prediction Model WRF. Atmosphere 2022, 13, 1683. [Google Scholar] [CrossRef]
- Haoliang, W.; Shuangqi, Y.; Yubao, L.; Yang, L. Comparison of the WRF-FDDA-Based Radar Reflectivity and Lightning Data Assimilation for Short-Term Precipitation and Lightning Forecasts of Severe Convection. Remote Sens. 2022, 14, 5980. [Google Scholar] [CrossRef]
- Tang, Y.; Campbell, P.C.; Lee, P.; Saylor, R.; Yang, F.; Baker, B.; Tong, D.; Stein, A.; Huang, J.; Huang, H.-C.; et al. Evaluation of the NAQFC driven by the NOAA Global Forecast System (version 16): Comparison with the WRF-CMAQ during the summer 2019 FIREX-AQ campaign. Geosci. Model Dev. 2022, 15, 7977–7999. [Google Scholar] [CrossRef]
- Haihua, M.; Kejun, J.; Peng, W.; Min, S.; Xuemei, W. Co-Benefits of Energy Structure Transformation and Pollution Control for Air Quality and Public Health until 2050 in Guangdong, China. Int. J. Environ. Res. Public Health 2022, 19, 14965. [Google Scholar] [CrossRef]
- Shirali, E.; Shahbazi, A.N.; Fathian, H.; Zohrabi, N.; Hassan, E.M. Evaluation of WRF and artificial intelligence models in short-term rainfall, temperature and flood forecast (case study). J. Earth Syst. Sci. 2020, 129, 188. [Google Scholar] [CrossRef]
- Jane, D.R.; Gerry, B.; Kevin, H.; Luigi, V.P. Sensitivity of simulating Typhoon Haiyan (2013) using WRF: The role of cumulus convection, surface flux parameterizations, spectral nudging, and initial and boundary conditions. Nat. Hazards Earth Syst. Sci. 2022, 22, 3285–3307. [Google Scholar] [CrossRef]
- Gao, Y.; Lü, J.; Li, C.Z.; Liu, J.Y.; Zhang, Z.Q. Effects of atmospheric aerosols on the ecosystem productivity of a poplar plantation in Beijing. Acta Ecol. Sin. 2022, 42, 4892–4902. [Google Scholar] [CrossRef]
- Potter, C.; Randerson, J.T.; Field, C.B.; Matson, P.A.; Vitousek, P.M.; Mooney, H.; Klooster, S.A. Terrestrial ecosystem production: A process model based on global satellite and surface data. Glob. Biogeochem. Cycles 1993, 7, 811–841. [Google Scholar] [CrossRef]
- Duan, J.; Yun, H.; Li, X.; Teng, F.; Na, Q. Estimation of Grassland Productivity in Inner Mongolia Based on CASA Model. For. Invent. Plan. 2022, 47, 133–138+155. (In Chinese) [Google Scholar] [CrossRef]
- Zhang, J.-S.; Zhu, W.-Q.; Pan, Y.-Z. Estimation of Net Primary Productivity of Chinese Terrestrial Vegetation Based On Remote Sensing. Chin. J. Plant Ecol. 2007, 31, 413–424. (In Chinese) [Google Scholar] [CrossRef]
- Paulescu, M.; Stefu, N.; Calinoiu, D.; Paulescu, E.; Pop, N.; Boata, R.; Mares, O. Ångström–Prescott equation: Physical basis, empirical models and sensitivity analysis. Renew. Sustain. Energy Rev. 2016, 62, 495–506. [Google Scholar] [CrossRef]
- Tong, C.; Zhang, W.; Tang, Y.; Wang, H. Simulation of daily solar radiation. Chin. J. Agrometeorol. 2005, 165–169. (In Chinese) [Google Scholar] [CrossRef]
- Yang, X.; Wang, X.; Cui, S.; Feng, Z.; Jiang, Z. Spatio-temporal Distribution Characteristics and Influencing Factors of Different Aerosol Types in the Guanzhong Area. Acta Sci. Circumstantiae 2022, 1–10. (In Chinese) [Google Scholar] [CrossRef]
- Obahoundje, S.; Nguessan-Bi, V.H.; Diedhiou, A.; Kravitz, B.; Moore, J.C. Implication of stratospheric aerosol geoengineering on compound precipitation and temperature extremes in Africa. Sci. Total Environ. 2023, 863, 160806. [Google Scholar] [CrossRef] [PubMed]
- Kanniah, K.D.; Beringer, J.; North, P.; Hutley, L. Control of atmospheric particles on diffuse radiation and terrestrial plant productivity:A review. Prog. Phys. Geogr. Earth Environ. 2012, 36, 209–237. [Google Scholar] [CrossRef]
- Strada, S.; Unger, N.; Yue, X. Observed aerosol-induced radiative effect on plant productivity in the eastern United States. Atmos. Environ. 2015, 122, 463–476. [Google Scholar] [CrossRef]
- Durand, M.; Murchie, E.H.; Lindfors, A.V.; Urban, O.; Aphalo, P.J.; Robson, T.M. Diffuse solar radiation and canopy photosynthesis in a changing environment. Agric. For. Meteorol. 2021, 311, 108684. [Google Scholar] [CrossRef]
- Ruiz-Arias, J.A.; Dudhia, J.; Gueymard, C.A. A simple parameterization of the short-wave aerosol optical properties for surface direct and diffuse irradiances assessment in a numerical weather model. Geosci. Model Dev. 2014, 7, 1159–1174. [Google Scholar] [CrossRef]
- Wang, H.; Shi, G.Y.; Zhang, X.Y.; Gong, S.L.; Tan, S.C.; Chen, B.; Che, H.Z.; Li, T. Mesoscale modelling study of the interactions between aerosols and PBL meteorology during a haze episode in China Jing–Jin–Ji and its near surrounding region—Part 2: Aerosols’ radiative feedback effects. Atmos. Chem. Phys. 2015, 15, 3277–3287. [Google Scholar] [CrossRef]
- Jiang, S.; Huang, Y.; Zhao, L.; Cui, N.; Wang, Y.; Hu, X.; Zheng, S.; Zou, Q.; Feng, Y.; Guo, L. Effects of clouds and aerosols on ecosystem exchange, water and light use efficiency in a humid region orchard. Sci. Total Environ. 2022, 811, 152377. [Google Scholar] [CrossRef]
- Gueymard, C.; Jimenez, P. Validation of Real-Time Solar Irradiance Simulations over Kuwait Using WRF-Solar; 2018. [Google Scholar]
- López-Romero, J.M.; Montávez, J.P.; Jerez, S.; Lorente-Plazas, R.; Palacios-Peña, L.; Jiménez-Guerrero, P. Precipitation response to aerosol–radiation and aerosol–cloud interactions in regional climate simulations over Europe. Atmos. Chem. Phys. 2021, 21, 415–430. [Google Scholar] [CrossRef]
- Yue, X.; Unger, N. Aerosol optical depth thresholds as a tool to assess diffuse radiation fertilization of the land carbon uptake in China. Atmos. Chem. Phys. 2017, 17, 1329–1342. [Google Scholar] [CrossRef]
- Yue, X.; Unger, N.; Harper, K.; Xia, X.; Liao, H.; Zhu, T.; Xiao, J.; Li, J. Ozone and haze pollution weakens net primary productivity in China. Atmos. Chem. Phys. 2017, 17, 6073–6089. [Google Scholar] [CrossRef]


| Double−Layer Nesting Scheme | ||
|---|---|---|
| Initial and lateral boundary conditions | FNL Data | |
| Projection system | Lat−Lon | |
| Regional center location | 36.0°N, 107.4°E | |
| Time step | 120 s | |
| Number of nested grids | d01: 38 × 38 | d02: 71 × 76 |
| Spatial resolution | d01: 0.25° | d02: 0.05° |
| Time resolution of output data | d01: 3 h | d02: 1 h |
| Physical Schemes | ||
| Longwave and shortwave radiation scheme | RRTMG | |
| Surface layer scheme | Revised MM5 Monin–Obukhov | |
| Cloud microphysical scheme | Thompson | |
| Land surface process scheme | Noah LSM | |
| Atmospheric boundary layer scheme | MYNN | |
| R | RMSE | MAE | IA | |
|---|---|---|---|---|
| Tem | 0.9986 | 2.52 °C | 2.41 °C | 0.9807 |
| Pre | 0.9871 | 14.75 mm | 8.50 mm | 0.9859 |
| Rad | 0.8514/0.9962 | 113.78/130.19 MJ/m2 | 103.40/127.10 MJ/m2 | 0.7870/0.8581 |
| Rhu | 0.9093 | 15.31 | 14.43 | 0.6786 |
| Tem_AOD | 0.9987 | 2.30 °C | 2.13 °C | 0.9842 |
| Pre_AOD | 0.9867 | 10.86 mm | 8.33 mm | 0.9917 |
| Rad_AOD | 0.8387/0.9966 | 120.92/96.94 MJ/m2 | 105.58/93.95 MJ/m2 | 0.7632/0.9126 |
| Rhu_AOD | 0.8896 | 14.73 | 13.64 | 0.6972 |
| Source | Min | Max | Mean |
|---|---|---|---|
| MODIS_NPP | 97.40 | 1035.70 | 465.30 |
| WRF−solar_NPP | 85.26 | 1244.75 | 563.17 |
| WRF−solar−AOD_NPP | 77.93 | 1184.45 | 536.53 |
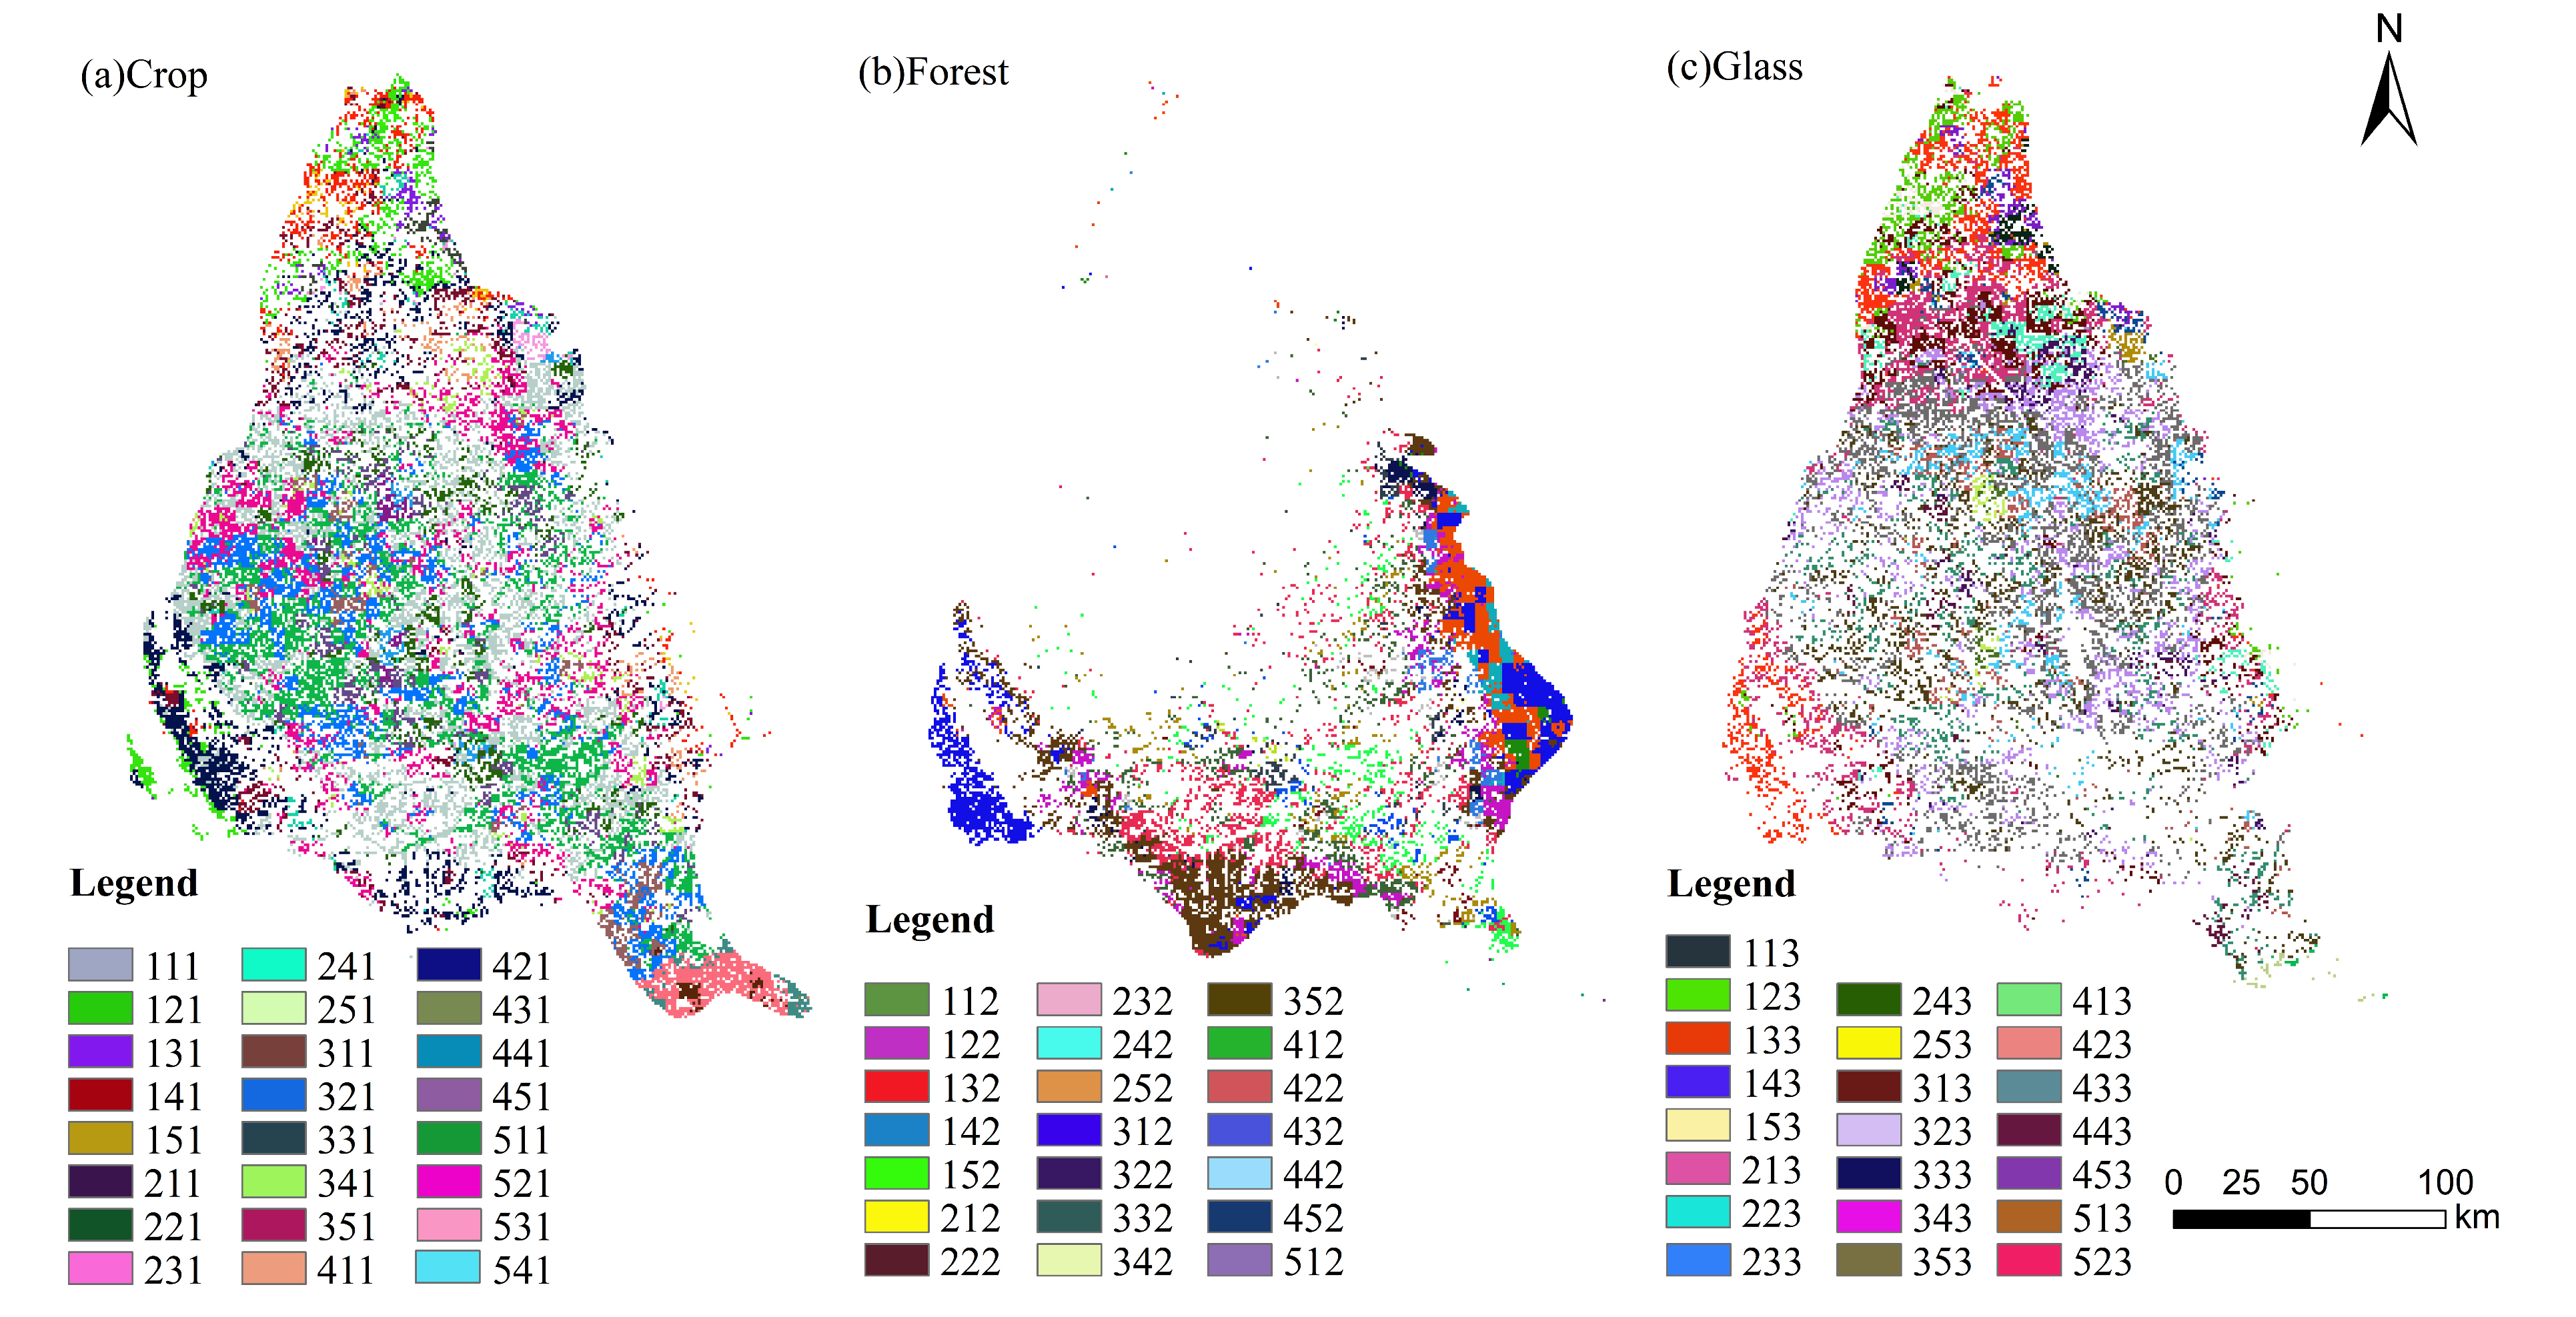
| Crop Value | Crop Count | Crop Ratio | Forest Value | Forest Count | Forest Ratio | Glass Value | Glass Count | Glass Ratio |
|---|---|---|---|---|---|---|---|---|
| 111 | 7 | 0.44% | 112 | 87 | 3.67% | 113 | 8 | 0.37% |
| 121 | 153 | 9.65% | 122 | 442 | 18.65% | 123 | 163 | 7.61% |
| 131 | 962 | 60.69% | 132 | 1164 | 49.11% | 133 | 1231 | 57.44% |
| 141 | 457 | 28.83% | 142 | 594 | 25.06% | 143 | 731 | 34.11% |
| 151 | 6 | 0.38% | 152 | 83 | 3.50% | 153 | 10 | 0.47% |
| 211 | 70 | 2.28% | 212 | 23 | 0.88% | 213 | 75 | 2.29% |
| 221 | 590 | 19.20% | 222 | 581 | 22.16% | 223 | 854 | 26.05% |
| 231 | 1677 | 54.57% | 232 | 1582 | 60.34% | 233 | 1480 | 45.15% |
| 241 | 730 | 23.76% | 242 | 415 | 15.83% | 243 | 866 | 26.42% |
| 251 | 6 | 0.20% | 252 | 21 | 0.80% | 253 | 3 | 0.09% |
| 311 | 512 | 6.80% | 312 | 54 | 2.56% | 313 | 352 | 6.35% |
| 321 | 2660 | 35.33% | 322 | 660 | 31.26% | 323 | 2067 | 37.26% |
| 331 | 3097 | 41.13% | 332 | 936 | 44.34% | 333 | 2286 | 41.21% |
| 341 | 1249 | 16.59% | 342 | 452 | 21.41% | 343 | 834 | 15.04% |
| 351 | 12 | 0.16% | 352 | 9 | 0.43% | 353 | 8 | 0.14% |
| 411 | 1151 | 17.29% | 412 | 163 | 15.44% | 413 | 493 | 15.73% |
| 421 | 2541 | 38.17% | 422 | 349 | 33.05% | 423 | 1171 | 37.36% |
| 431 | 2041 | 30.66% | 432 | 309 | 29.26% | 433 | 1039 | 33.15% |
| 441 | 882 | 13.25% | 442 | 206 | 19.51% | 443 | 414 | 13.21% |
| 451 | 42 | 0.63% | 452 | 29 | 2.75% | 453 | 17 | 0.54% |
| 511 | 523 | \ | 512 | 5 | \ | 513 | 47 | \ |
| 521 | 499 | \ | 522 | 0 | \ | 523 | 1 | \ |
| 531 | 9 | \ | 532 | 0 | \ | 533 | 0 | \ |
| 541 | 0 | \ | 542 | 0 | \ | 543 | 0 | \ |
| 551 | 0 | \ | 552 | 0 | \ | 553 | 0 | \ |
Disclaimer/Publisher’s Note: The statements, opinions and data contained in all publications are solely those of the individual author(s) and contributor(s) and not of MDPI and/or the editor(s). MDPI and/or the editor(s) disclaim responsibility for any injury to people or property resulting from any ideas, methods, instructions or products referred to in the content. |
© 2023 by the authors. Licensee MDPI, Basel, Switzerland. This article is an open access article distributed under the terms and conditions of the Creative Commons Attribution (CC BY) license (https://creativecommons.org/licenses/by/4.0/).
Share and Cite
Fu, Y.; Zhou, Z.; Li, J.; Zhang, S. Impact of Aerosols on NPP in Basins: Case Study of WRF−Solar in the Jinghe River Basin. Remote Sens. 2023, 15, 1908. https://doi.org/10.3390/rs15071908
Fu Y, Zhou Z, Li J, Zhang S. Impact of Aerosols on NPP in Basins: Case Study of WRF−Solar in the Jinghe River Basin. Remote Sensing. 2023; 15(7):1908. https://doi.org/10.3390/rs15071908
Chicago/Turabian StyleFu, Yuan, Zixiang Zhou, Jing Li, and Shunwei Zhang. 2023. "Impact of Aerosols on NPP in Basins: Case Study of WRF−Solar in the Jinghe River Basin" Remote Sensing 15, no. 7: 1908. https://doi.org/10.3390/rs15071908
APA StyleFu, Y., Zhou, Z., Li, J., & Zhang, S. (2023). Impact of Aerosols on NPP in Basins: Case Study of WRF−Solar in the Jinghe River Basin. Remote Sensing, 15(7), 1908. https://doi.org/10.3390/rs15071908