Article

Reprocessed MODIS Version 6.1 Leaf Area Index Dataset and Its Evaluation for Land Surface and Climate Modeling

Southern Marine Science and Engineering Guangdong Laboratory (Zhuhai), Guangdong Province Key Laboratory for Climate Change and Natural Disaster Studies, School of Atmospheric Sciences, Sun Yat-Sen University, Zhuhai 519082, China
*
Author to whom correspondence should be addressed.
Remote Sens. 2023, 15(7), 1780; https://doi.org/10.3390/rs15071780
Submission received: 8 February 2023 / Revised: 15 March 2023 / Accepted: 20 March 2023 / Published: 27 March 2023

Abstract

:
Satellite-based leaf area index (LAI) products, such as the MODIS LAI, play an essential role in land surface and climate modeling research, from regional to global scales. However, data gaps and high-level noise can exist, thus limiting their applications to a broader scope. Our previous work has reprocessed the MODIS LAI Collection 5 (C5) product, and the reprocessed data have been widely used these years. In this study, the MODIS C6.1 LAI data were reprocessed to broaden its application as a successor. We updated the integrated two-step method that is used for MODIS C5 LAI and implemented it into the MODIS C6.1 LAI product. Comprehensive evaluations for the original and reprocessed products were conducted. The results showed that the reprocessed LAI data had better performance in validation against reference maps. In addition, the site scale time series of reprocessed data was much smoother and more consistent with adjacent values. The global scale comparison showed that, though the MODIS C6.1 LAI does have improvements in ground validation with LAI reference maps, its spatial continuity, temporal continuity, and consistency showed little improvement when compared to C5. In contrast, the reprocessed data were more spatiotemporally continuous and consistent. Based on this evaluation, some suggestions for using various MODIS LAI products were given. This study assessed the quality of these different versions of MODIS LAI products and demonstrated the improvement of the reprocessed C6.1 data, which we recommended for use as a substitute for the reprocessed C5 data in land surface and climate modeling.

1. Introduction

Vegetation plays a crucial role in the land surface process through the energy, water, and carbon cycle. As an essential parameter to describing the canopy structure and physiology of vegetation, leaf area index (LAI) has substantial impacts on precipitation interception, radiation transfer, and turbulence exchange, as well as photosynthesis, respiration, and biogenic volatile organic compound (BVOCs) emissions. High-quality LAI products are greatly desired for land surface and climate modeling.
Satellite observations have great advantages for the provision of seasonal and inter-annual varied LAI, from regional to global scales [1]. Many satellite-based optical detectors have been launched to carry out global observation since the 1980s, based on the different spatiotemporal resolutions of LAI products that became available, e.g., GEOV1 [2], GEOV2 [3], MODIS [4,5,6,7], GLASS [8,9], GLOBMAP [10], LAI3g [11], AVH15C1 [12], and so on. These products provided LAI data, with spatial resolutions ranging from hundreds to thousands of meters, and their performance was evaluated and compared [1,13,14,15].
Among global moderate-resolution LAI data, MODIS LAI products have been frequently employed for their satisfactory validation results outcomes [16,17,18], less uncertainty [19], and continuous updates and improvements to the algorithm inputs [6]. Many studies have applied MODIS LAI products in a variety of fields, such as vegetation dynamics and greening trend analysis [20,21,22], assimilation in crop models [23], gross primary productivity and evapotranspiration simulation [24,25,26], downscaling through fusion with a high-resolution reflectance product [27,28], and drought simulation and assessment [29,30,31].
However, like most of the satellite-derived products that are influenced by cloud, snow, or aerosol contamination, sensor malfunctions, sun-target-sensor geometry, or uncertainties in their retrieval algorithm, MODIS LAI is temporally and spatially discontinuous and has high-level noise, which limits its applications [32,33,34,35]. Many methods have been developed to process irregular satellite-retrieved LAI products, which can generally be classified into the following types: (1) temporal-based methods, which exploit the fact that the retrieved data correlate with the phenological characteristics of vegetation, and therefore should be temporally continuous [36,37,38,39,40,41]; (2) spatial-based methods, which assume that missing data have a similar statistical or geometrical structure as the retrieved data [42,43,44]; (3) spectral-based methods, which fill the band that have lost information at some time or locations by adopting the information from other bands that are complete at those time or locations, and to achieve this, the relationship between the incomplete band and the complementary bands is built [45,46,47]; (4) hybrid methods, which attempt to combine the strengths of these temporal, spatial, and spectral-based methods [33,48,49]; and (5) deep learning, which is good at data fusion and downscaling, with its strong capability to build a nonlinear relationship between various data [50,51,52,53]. These methods can effectively fill data gaps and reduce noise, and were comprehensively reviewed and assessed in several studies [45,52,53,54].
In our previous work for reprocessing the MODIS LAI product MOD15A2H C5 ([55], referred to as Y2011 hereafter), an integrated two-step approach was developed, considering the properties of the MODIS LAI product. Its basic algorithms included the Savitzky–Golay (SG) filter [56] and the temporal spatial filter (TSF) method [33,57]. We first assimilated the lower-quality data using the modified temporal spatial filter (mTSF) at each pixel. Then, the TIMESAT (a software package for satellite-derived time series analysis) SG filter was applied to derive the final output. This method made the best use of quality control (QC) information, and the reprocessed data were more continuous and consistent in both the temporal and spatial domains. This reprocessed product has been used in much research, especially for land process modeling [58,59,60,61,62].
The MODIS’s latest version of LAI product, MCD15A2H C6.1, was released in 2021 [63]. Compared with version C6, a polarization correction was applied to the L1B Reflective Solar Bands, and the calibration method of generating MODIS L1B products was enhanced [64]. According to Yan et al. [6], C6 had better accuracy and a larger proportion of main-algorithm retrievals due to its updated reflectance and land cover data. This indicates that there were appreciable improvements from C5 to C6.1 too.
However, our preliminary study showed that C6.1 also had high-level noise and data gaps in the temporal and spatial domains, which limited its applications in modeling. To extend the applicability of the MODIS C6.1 LAI data, just like C5, and to provide better service for land surface models, it is worth reprocessing the updated LAI product. Furthermore, with the availability of the newest version of the MODIS land cover product, the reprocessing method can be further updated. In addition, a comprehensive and detailed evaluation of the updated MODIS C6.1 product is still absent from recent studies. Many studies have assessed the temporal continuity of LAI data, considering the fraction of valid retrievals at the point scale, while large-scale assessments are relatively less.
We aimed to generate a spatiotemporally continuous and consistent MODIS C6.1 LAI product, as a continuation of the reprocessed MODIS C5 product, so as to enhance its applicability for land surface and climate modeling. In addition, we intended to provide quantitative information on both point data validation and global scale evaluation about the quality of the MODIS data and reprocessed data. In Section 2, an update of the reprocessing approach was introduced, and three simple metrics were proposed to quantify the spatial continuity, temporal continuity, and temporal consistency of the LAI products. In Section 3, the MODIS LAI data and the reprocessed data were validated against high-resolution reference maps. Meanwhile, in Section 4, we provided some suggestions on using different kinds of MODIS LAI products.

2. Data and Methodology

2.1. Datasets

2.1.1. MODIS LAI Products

In this study, the MCD15A2H C6.1 (hereafter referred to as MCD C6.1) LAI product (4 July 2002–31 December 2021) was chosen as the input data for reprocessing. The MOD15A2H C6.1 (hereafter referred to as MOD C6.1) LAI product (18 February 2000–31 December 2021) and MOD15A2H C5 (hereafter referred to as MOD C5) LAI product (18 February 2000–31 December 2016) were selected for comparison. The prefix “MOD” means that the data are retrieved from only the Terra satellite, while “MCD” represents a combined product that chooses a better retrieval from both the Terra and Aqua satellites. These products were all composited within an 8-day period, but C6.1 had a higher spatial resolution (500 m) than C5 (1000 m). The MOD C6.1 LAI product was compared with MOD C5 to explore the changes brought about by the version updates. The MCD C6.1 LAI product was also compared with MOD C6.1 to contrast the quality of the data that were retrieved from a single satellite with those from the combined satellites. The MODIS LAI data were projected over a sinusoidal grid system, which divided the globe into 36 × 18 tiles, with each of them labeled as h [00–35]v[00–17]. Covering an area of 1200 × 1200 km2, each tile was separated into 2400 × 2400 pixels (C6.1) or 1200 × 1200 pixels (C5).
The main and backup algorithms for the retrievals were both accessible through the QC layer. A three-dimensional radiative transfer model was used to generate the lookup table (LUT), upon which the main algorithm was built [4]. If the modeled and observed bi-directional reflectance factors differed within a biome-specific threshold value, the average of the acceptable LAI solutions was reported as the result. Otherwise, the backup algorithm was used, which was built upon an empirical relationship between the canopy LAI and normalized difference vegetation index (NDVI), providing a less reliable output. Considering the algorithm paths and cloud and saturation state, the QC values of MCD C6.1, similar to C5, can be classified into five categories (Table 1). In this study, the QC values were used to pick out the relatively good-quality LAIs as the background values (Section 2.2).

2.1.2. MODIS Land Cover Product (MCD12Q1)

Previously, in C5 reprocessing, we used only one-year data (2001) of the MODIS MOD12Q1 product. To account for land cover changes, we used the latest version of the MCD12Q1 C6.1 product [65] from 2001 to 2021. The MODIS land cover products had the same map projections as the LAI products and contained 6 classification schemes. Same as for C5, the Land Cover Type 5, a PFT classification scheme that included 8 vegetation types and 4 other land cover types, was used in the calculation of the background values (Section 2.2).

2.1.3. LAI Reference Maps

For the ground validation, we continued to use the bottom-up method that was recommended by the CEOS Land Product Validation sub-group, since it could effectively bridge the spatial scale gaps between the ground LAI measurements and the satellite-derived LAI data, through two upscaling steps [66]. First of all, a two-stage nested sampling method [67] was adopted to get the LAI measurement at the ESU (elementary sampling unit) level (approximately 30 m). An empirical transfer function, describing the relationship between the ESU-level LAI and the high-spatial-resolution satellite or airborne images, was derived. Then, a high-resolution LAI reference map was produced based on the high-resolution images and the empirical function. Finally, the reference map data were aggregated to the spatial scale of the satellite-derived LAI products, serving as ground-truth values.
We collected 2762 LAI reference maps from various observation sites, including BigFoot ([68]; https://daac.ornl.gov/cgi-bin/dsviewer.pl?ds_id=747, last accessed on 20 March 2023), ImagineS ([69]; http://fp7-imagines.eu, last accessed on 20 March 2023), VALERI (http://w3.avignon.inra.fr/valeri/, last accessed on 20 March 2023), and Boston University ([7,70], which are available from the CEOS LPV sub-group on https://calvalportal.ceos.org/web/olive/site-description, last accessed on 20 March 2023), SMEX02 ([71]; https://calvalportal.ceos.org/web/olive/site-description, last accessed on 20 March 2023) and GBOV ([72]; https://land.copernicus.eu/global/gbov/, last accessed on 20 March 2023). Detailed information can be seen in Table S1. All of these datasets provided the true LAI, considering the clumping effect. However, the GBOV dataset provided PAI (plant area index) estimates, since the in situ optical measurement was sensitive to all the elements of the canopy. The extent of the LAI reference maps ranged in size from 3 × 3 km2 to 15 × 15 km2. All the validation sites together contained 7 land cover types, including DBF (deciduous broadleaf forest), ENF (evergreen needleleaf forest), EBF (evergreen broadleaf forest), mixed forest, grass, crop, and shrub.

2.2. Reprocessing Method

The reprocessing method was based on the method that we developed for the MOD C5 LAI optimization, with updates on the background value calculations. First of all, we filled the gaps and processed the relatively low-quality data using the mTSF method. The basic algorithm, a Cressman analysis that linearly combined the residuals between the observations and the predicted (background) values to modify the pixel value, was applied to obtain the first-step target value. The observed values were gap-filled by a simple temporal filter before applying the Cressman interpolation. Furthermore, the background value of the target pixel was calculated from one of five different cases, considering the proportion of the surrounding data with a relatively high quality (QC < 32), or the data with the same land cover. Finally, a post-processing step further smoothed and adapted the output of the mTSF to its upper envelope, using the SG filter from the TIMESAT program [39,73]. The full details of this were provided in Y2011.
For the C6.1 data reprocessing, the calculation of the background value was updated. The background value of C5 was derived using the ten-year average data and the static year (2001) land cover data, while the background value of C6.1 used the dynamically changed 9-year LAI data and year-specific land cover data. That is to say, the background value of each year was derived using the data from a 9-year window. Also, the land cover data of the corresponding years from MCD12Q1 C6.1 were considered for the background value calculation.

2.3. Upscaling of LAI Reference Maps

Each LAI reference map was first reprojected over the same coordinates as the MODIS data, which could reduce the spatial errors caused by resampling imagery [66]. The MODIS pixels that got more than two-thirds of the greatest possible number of points that were projected from the map were considered to be spatially representative, and the averages of the map values inside these pixels were derived. To reduce the geolocation error caused by spatial mismatch, the site-scale map value was calculated (called MAP LAI, Table S1) by averaging the pixel-scale map values that were derived from the previous step. If more than one MAP LAI existed within the 8-day compositing period of the MODIS data, the maximum MAP LAI value would be chosen for validation. Then, the mean values of MCD C6.1 and the reprocessed data of the corresponding pixels were also calculated (referred to as MCD and RMCD LAI, respectively, Table S1). However, the MODIS pixels that were assigned with filled values (QC ≥ 128) were not considered in the calculation for the mean LAI values. Finally, the validation metrics, including R2, RMSE, and the mean difference (MD) between the mean LAI values, were calculated.
To investigate the difference in the accuracy between the MODIS C5 and C6.1 versions and between the MOD and MCD products, the mean LAI values were also derived for MOD C6.1 using the same method, and the validation results of MOD C5 were reviewed for comparison. In general, a total of 2762 mean LAI values were calculated for the high-resolution reference maps, MODIS, and reprocessed MODIS, respectively.

2.4. Metrics to Quantify Continuity and Consistency

In total, three simple metrics were defined to quantify the LAI products’ quality, including their spatial continuity, temporal continuity, and consistency. Each pixel of the LAI products was assumed to be adjacent to its 8 surrounding pixels and each pair of adjacent pixels had an equal distance. Then, the spatial discontinuity index (SDI) for a certain area (10 × 10 km2 in this study) was determined as the mean of absolute difference between all the pairs of adjacent pixels:
SDI = 1 N S | Δ LAI |
where N is the number of pairs of adjacent pixels, S refers to the considered domain, and |ΔLAI| is the absolute difference in the LAI between two adjacent pixels. For example, in Figure 1a, a domain containing 3 × 3 pixels was considered, with their LAI values labeled at the center. Each pair of adjacent pixels (20 pairs in total) was linked together with a green line, and their absolute differences in LAI values were labeled on these green lines. Then, the averages of these LAI differences were calculated, indicating that the LAI values varied by 1.8 m2 m−2 every 500 m, on average. A larger SDI value over a considered domain indicated a more abrupt change within a specific distance. Similarly, the temporal discontinuity index (TDI) was defined for a specific period (2003–2016 in this study) as the mean of absolute differences between all the adjacent time steps:
TDI = 1 N t = 1 N t 1 | LAI t LAI t + 1 |
where Nt is the number of time steps for a considered period. For example, in Figure 1b, two time series with a total of 11 timesteps were considered and compared. The absolute difference between each pair of the adjacent timesteps was calculated, and then the average of the absolute differences was derived. It was found that a smaller TDI value corresponded with a relatively smoother time series. In this study, the TDI was first computed for the time series of each pixel, and then averaged over a 10 × 10 km2 region. The invalid pixels in the MODIS data were also excluded from the calculation of the TDI of the reprocessed data.
The variations of the LAI should be consistent within the previous and next timestep under natural conditions, unless they have approached the maximum or minimum values in a seasonal cycle. A data point in time series which is larger or lower than both the previous and the next timestep values is regarded as a local “extreme” value (Figure 1c). Therefore, we assumed that the number of local extreme values within a year would not be many. We defined a temporal inconsistency index (TII) in order to quantify the extent of the data inconsistency, which was computed as the percentage of the extreme values over a period (see Equation (3)). For example, in Figure 1c, the TII values of two different time series were computed. Time series b contained 50% of extreme values, which was far more inconsistent with the natural vegetation growth than that of time series a.
TII = Number   of   extreme   values Number   of   time   steps
The above-mentioned three indexes do not have to be as small as possible, because, even if considering the natural land surface, these indexes cannot reach their minimum (i.e., zero). The LAI of the land surface changes gradually across the spatial and temporal scales, thus, the indexes should fall within a certain range. Therefore, the indexes of an LAI product with improved continuity and consistency are expected to decrease to a certain range, similar to that of the natural land surface. That is to say, smaller values of these indexes of the LAI products are preferred, but the values do not have to be as small as zero. In this study, we tried to focus on the differences in the indexes between the MODIS LAI and the improved MODIS LAI, rather than the specific values of the indexes. Under conditions with a similar data accuracy, we assumed that the data with a larger SDI, TDI, or TII value would perform poorer in terms of their data continuity and consistency, especially for unrealistically large values.

3. Results

3.1. Validation against LAI Reference Maps

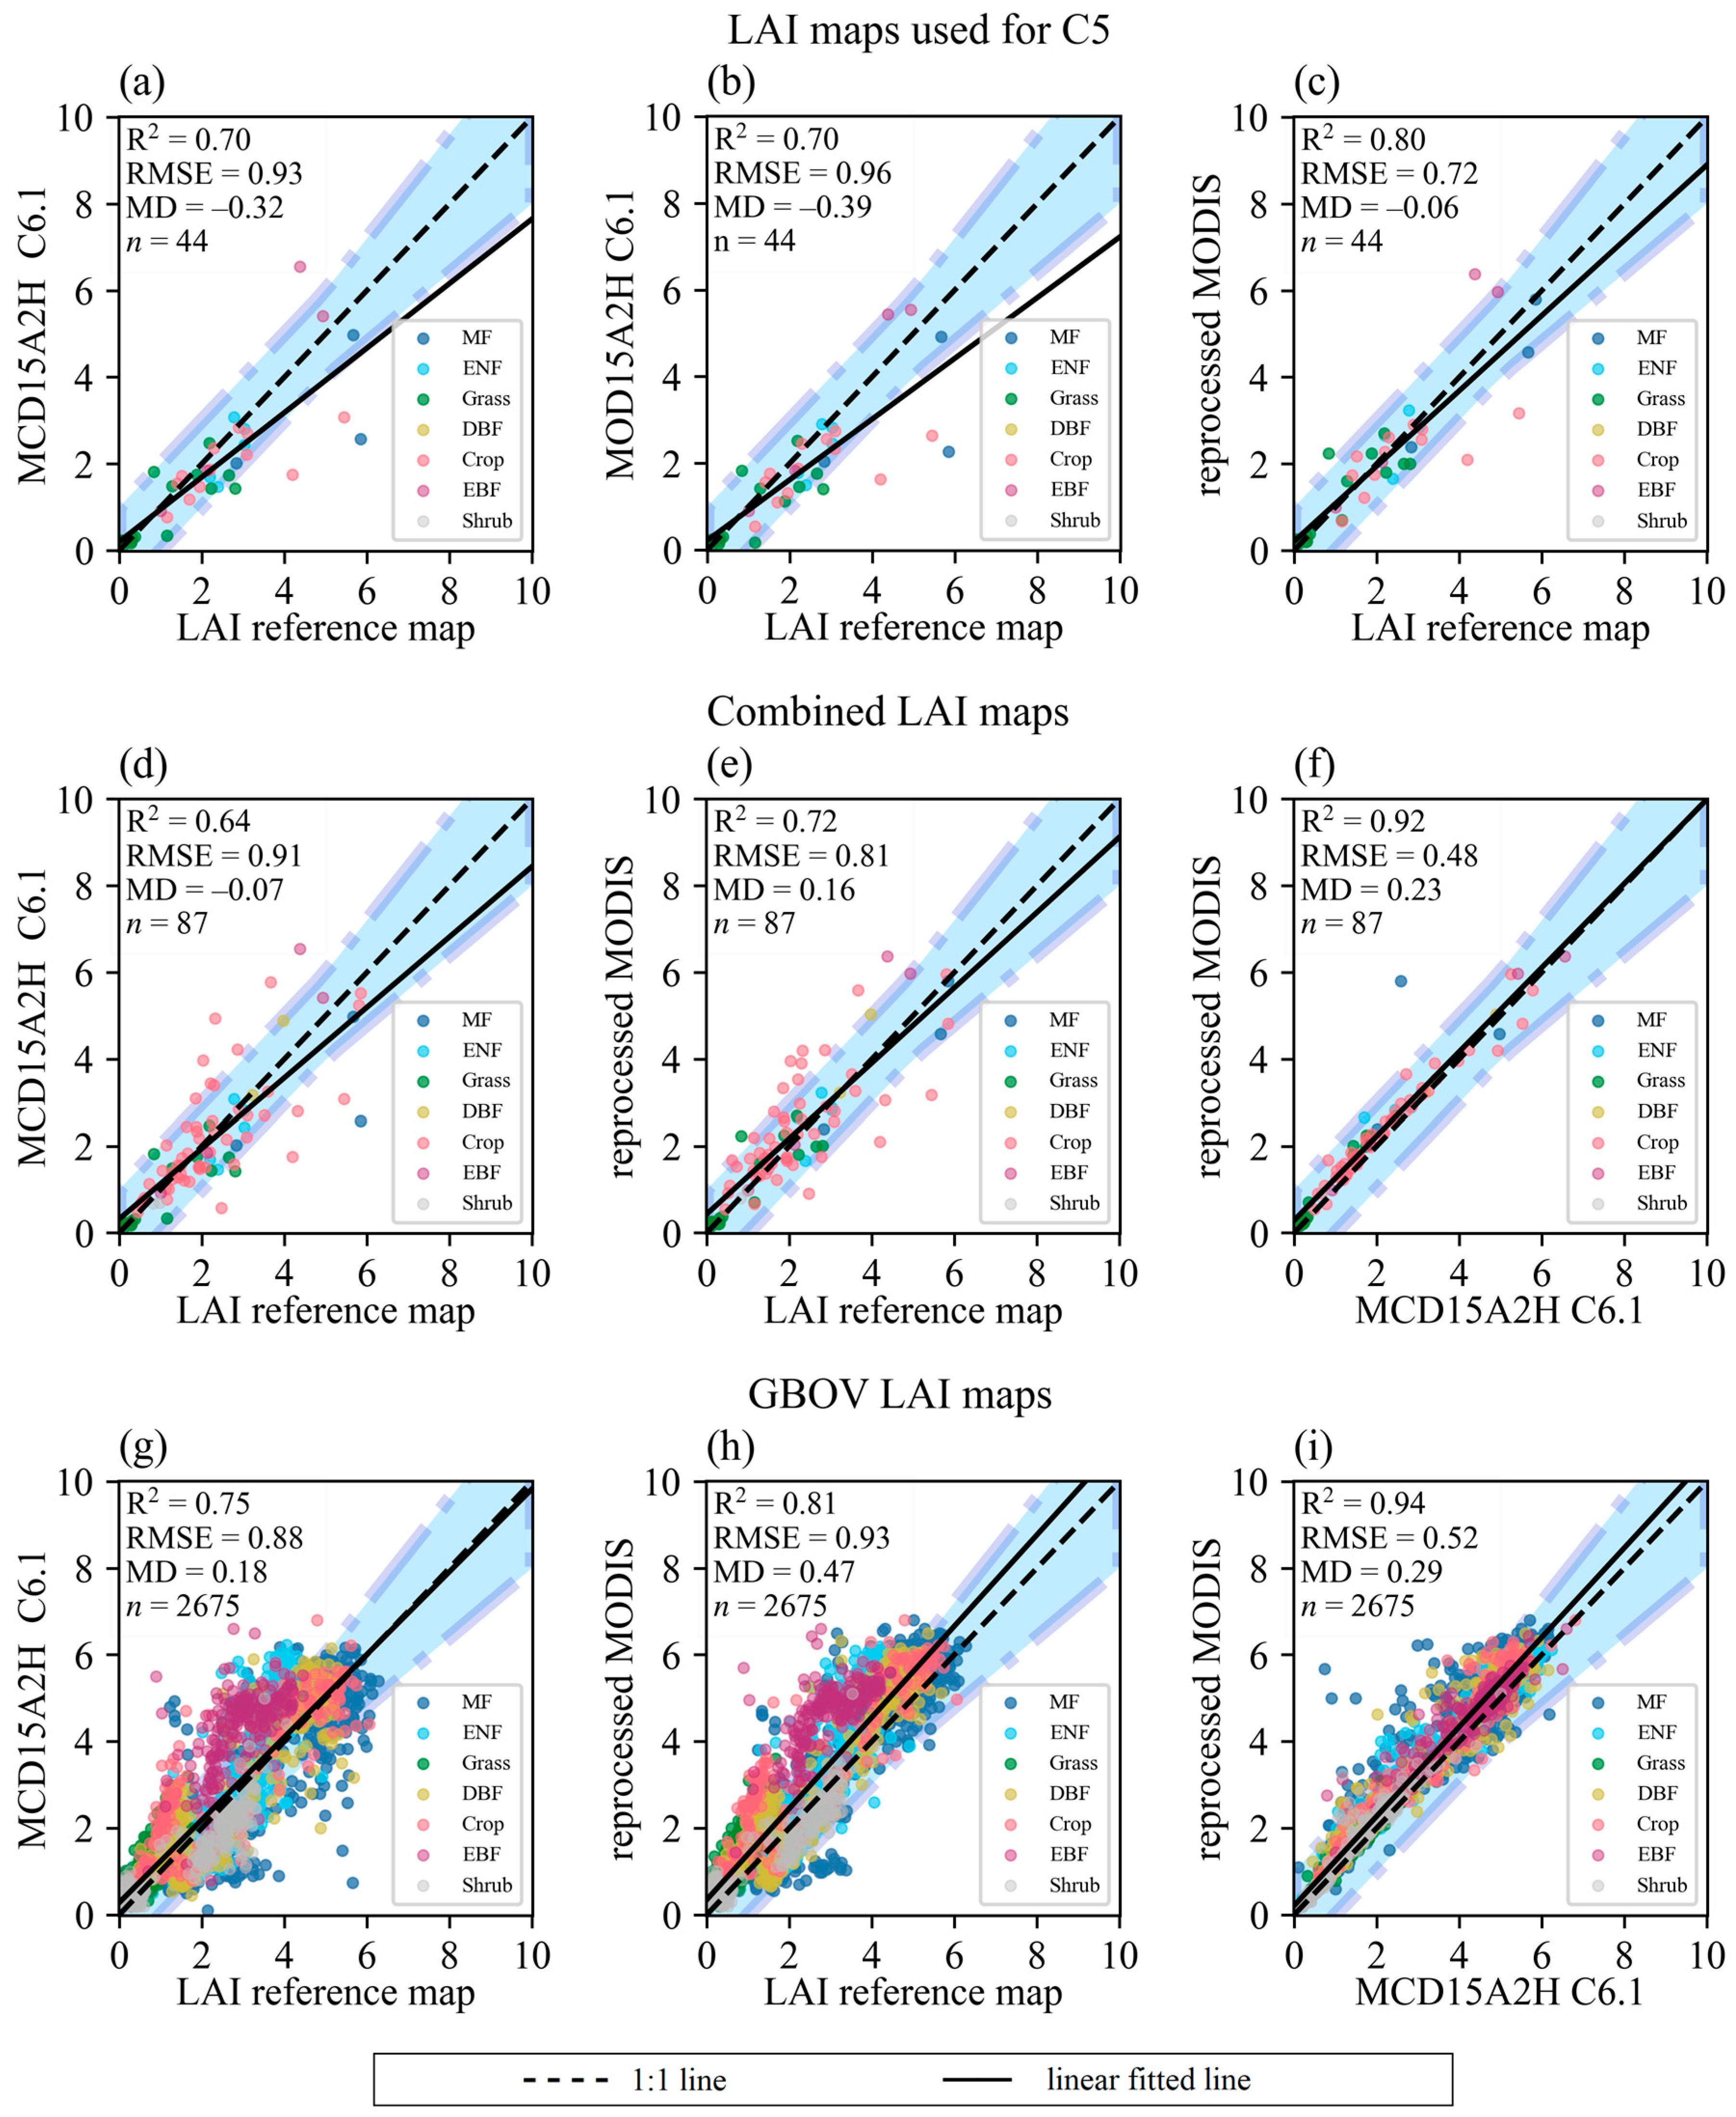
Previous validation for MOD C5 used LAI reference maps from the VALERI, BigFoot, Boston University, and SMEX02 datasets. For a better comparison, we derived the statistical results of different products using the same reference maps (Figure 2a–c). The validation of MOD C5 LAI showed that the R2 was 0.62 and the RMSE reached 1.06 (Y2011), and these were found to be 0.7 and 0.96, respectively, in the validation of MOD C6.1 LAI (Figure 2b), indicating that the updated version improved the accuracy of the LAI product. In contrast, the difference between MOD and MCD was much smaller in terms of C6.1, since their R2, RMSE, and MD were similar (Figure 2a,b). It is notable that the MOD C6.1 data, before 4 July 2002, were used in Figure 2a if their data maps existed, but they were still similar in accuracy when validated against the data maps from after 4 July 2002. Additionally, the performance of the reprocessed MODIS was evaluated. The reprocessed MODIS performed better than MCD C6.1, with the R2 increasing to 0.8 and the RMSE decreasing to 0.72 (Figure 2a,c). Furthermore, compared with the reprocessed C5 product, the RMSE of the reprocessed MODIS was reduced by 0.07, and the R2 increased by 0.04, implying that the accuracy of the reprocessed product can be influenced by the MODIS data itself.
We also used all the collected maps, excluding the GBOV dataset (hereafter referred to as combined maps), to compare MCD C6.1 and the reprocessed MODIS LAIs (Figure 2d–f). Since the number of LAI reference maps from the GBOV dataset was far more than that from the other datasets, the validation metrics were calculated separately to make sure that the results would not be largely affected by the GBOV map values (Figure 2g–i). For both the combined maps and the GBOV maps, the reprocessed MODIS achieved a higher R2 than MCD C6.1, with the R2 increasing from 0.64 to 0.72 and from 0.75 to 0.81, respectively. In addition, the reprocessed MODIS was still consistent with MCD C6.1, since it preserved the characteristics of the original data with a good quality (Figure 2f,i). When using the combined maps, the RMSE, which represented uncertainty, decreased from 0.91 to 0.81, and the MD changed from −0.07 to 0.16, indicating a shift from a slight underestimation to an overestimation of the map values. In particular, the reprocessed MODIS demonstrated less bias when using either the VALERI or BigFoot reference maps for validation (Table 2). However, the reprocessed MODIS had a slightly larger bias than MCD C6.1 when validated against the GBOV and ImagineS reference maps. This may be related to the uncertainty within the LAI reference maps, which can be viewed more clearly in the time series plots of Section 3.2. A further discussion is provided in Section 4.1.

3.2. Temporal Comparison between MODIS and Reprocessed MODIS

For each 8-day composite between 2000–2021, the MCD C6.1 LAI and the reprocessed MODIS data were spatially averaged within the extent of the LAI reference maps. These LAI mean values made up the time series, as shown in Figure 3, with scatters representing the LAI reference map values at the corresponding period. Each land cover type presented the time series of two sites. Note that if more than one map value existed within the same 8-day composite, only the maximum was plotted.
High-frequency noise could be observed in the temporal sequences of the MODIS LAI time series, especially for the forest sites where the fluctuation was more intense than that of the crop, shrub, and grass sites with lower LAI values. Sudden peaks and spikes existed in the MODIS LAI time series, while the reprocessed MODIS LAI smoothed these noises to make them continuous with the adjacent values. The reprocessed MODIS LAI data varied smoothly over time, and could still exhibit pronounced seasonal cycles of the leaf area index. Generally, they agreed well with the main-algorithm retrieved LAI of the MODIS. The QC value that indicated the main algorithm with saturation occurred periodically at the forest sites and was always associated with high-frequency noise in the summer. The QC value that indicated the backup algorithm tended to appear at some of the forest sites, and was associated with sudden peaks or spikes (e.g., site NOBS in Figure 3d and BART, HAIN in Figure S2). Furthermore, it was observed that the QC value indicating the main algorithm with cloud could sometimes be associated with the spikes in the time series (e.g., site DELA in Figure 3b and GUAN in Figure 3c). In addition, the LAI reference map values could also undergo notable changes within a short period and sometimes had sudden drops (e.g., site TALL in Figure 3d, SCBI in Figure 3f, JORN in Figure S3, and NRMN in Figure S4). Some of the LAI map values at the DBF sites were unrealistically high in the winter (e.g., site BLAN in Figure 3b and BART in Figure S2). These may indicate that uncertainties could exist within the LAI reference maps, which could affect the results of the direct validation (Section 3.1).

3.3. Spatial and Temporal Continuity Comparison

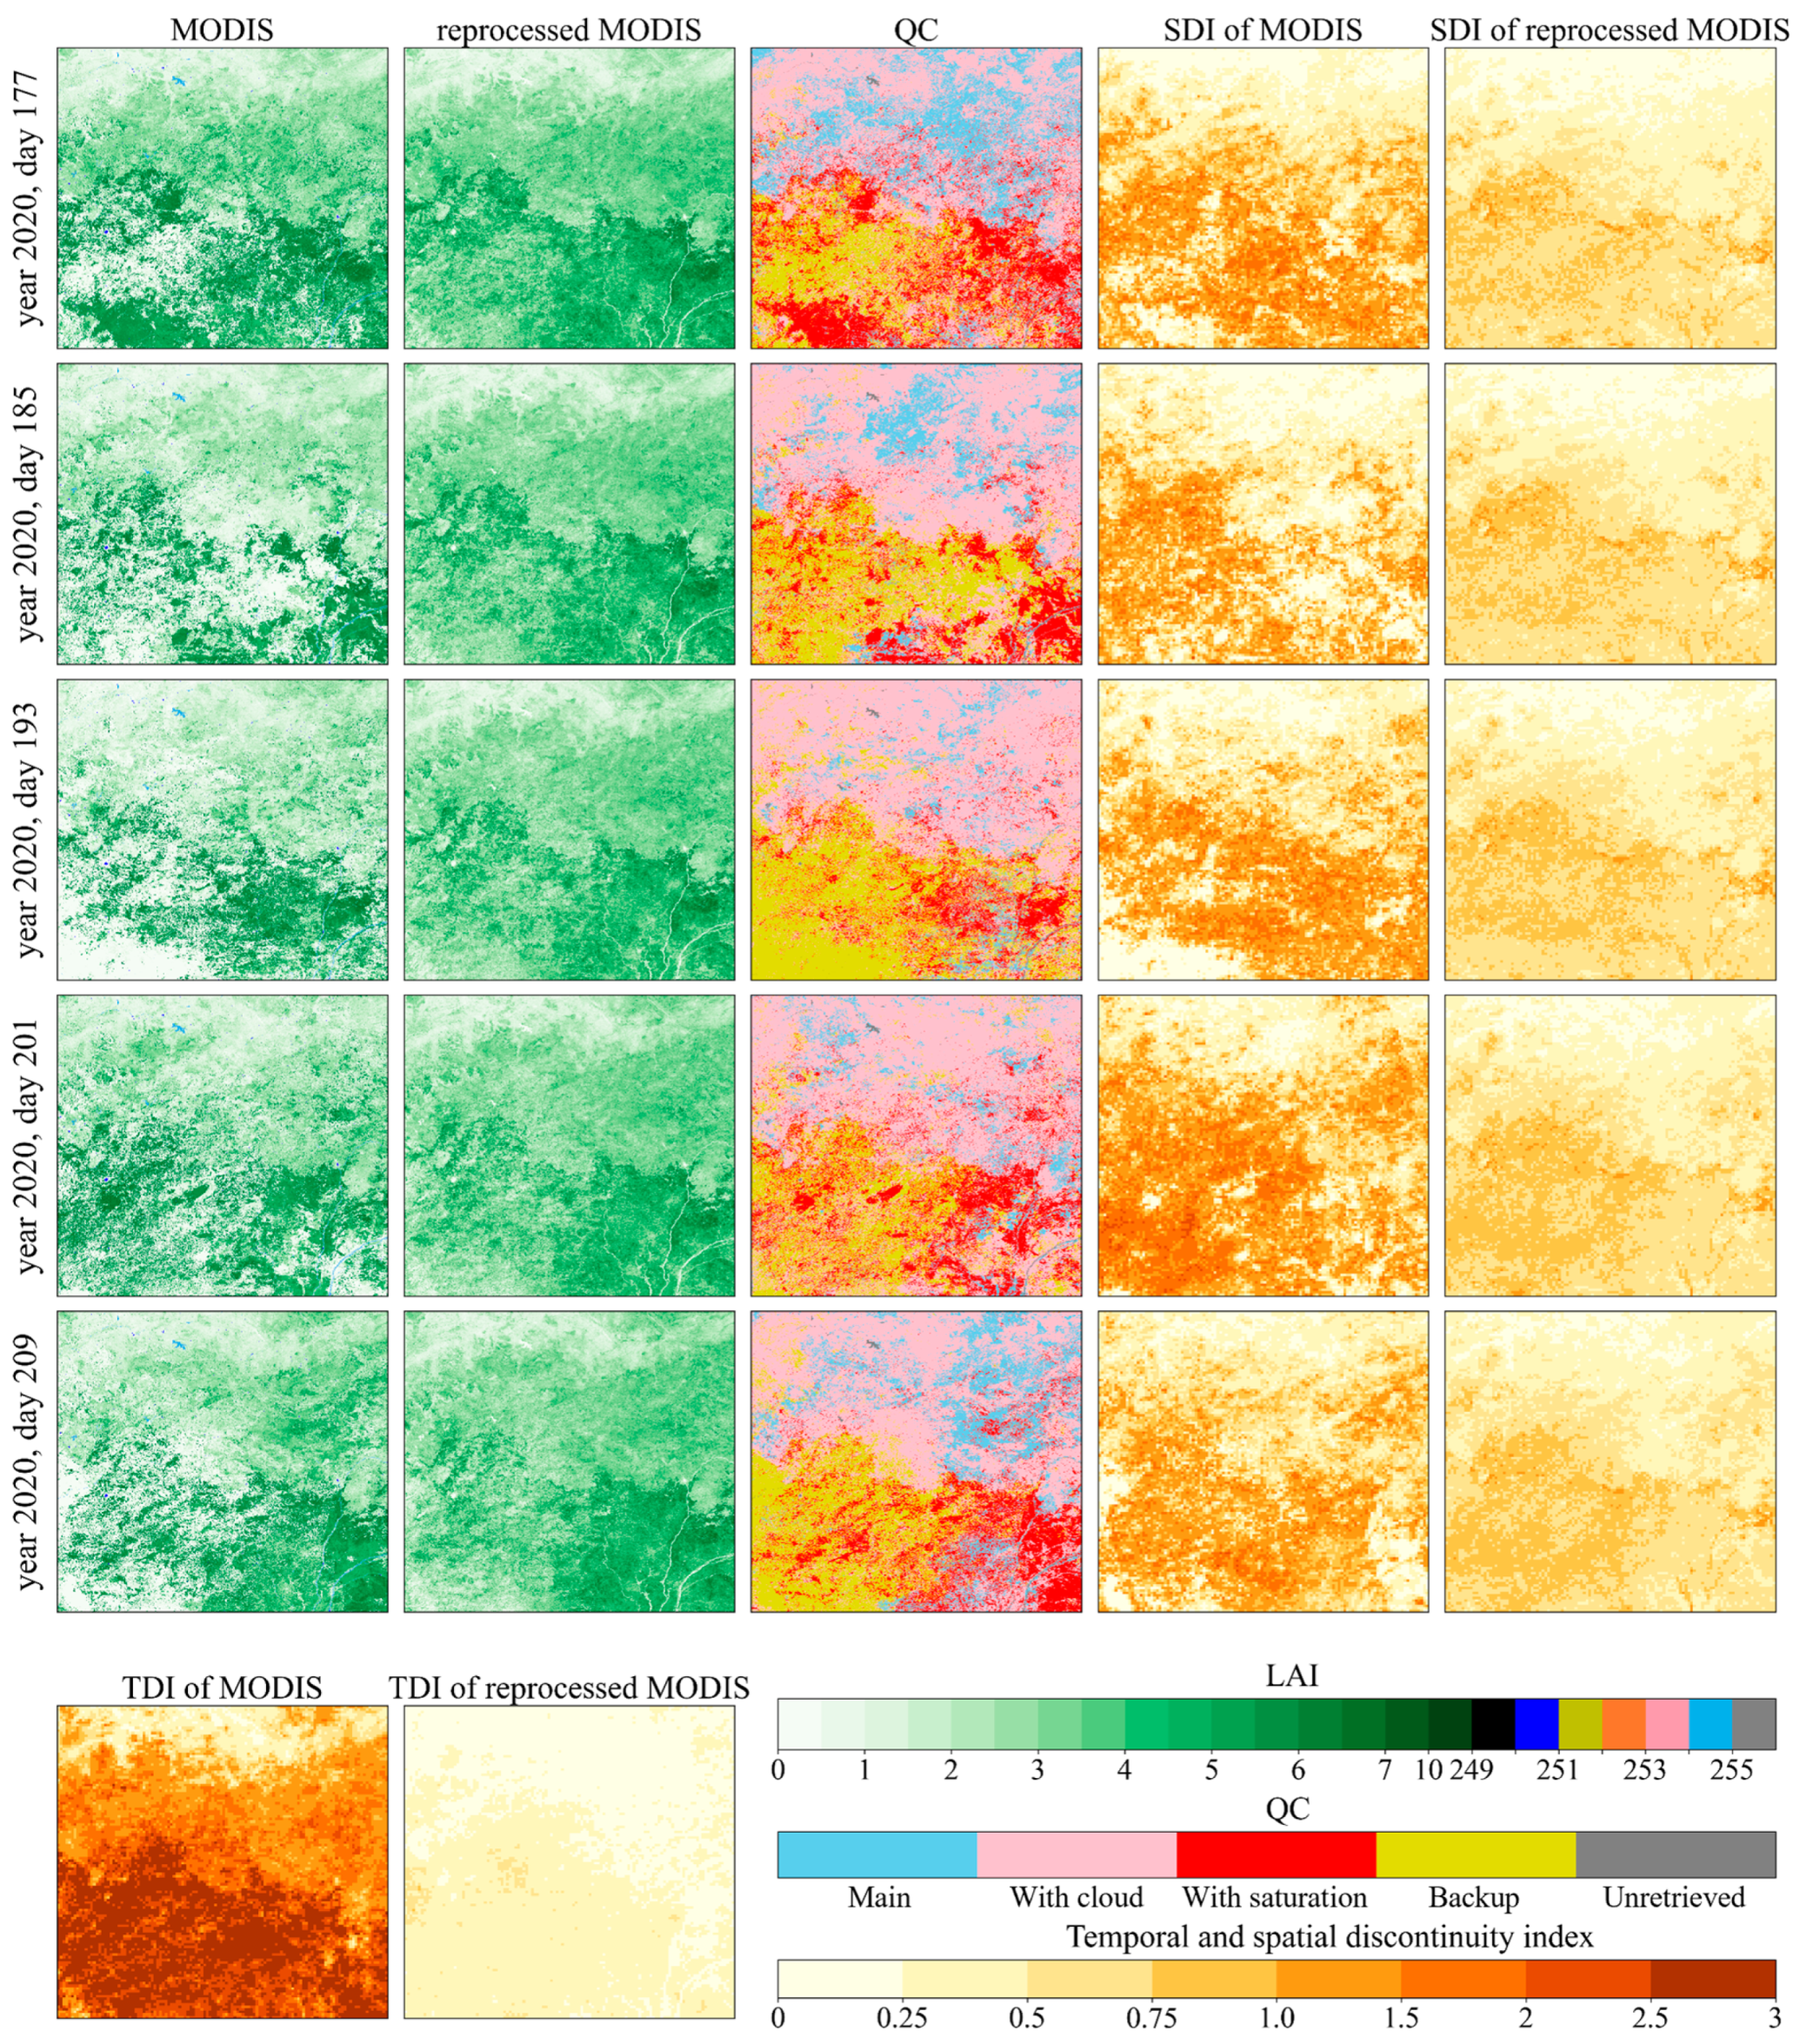
The time series plots (Figure 3) provided an intuitive view of the differences in the temporal continuity between the MODIS LAI and the reprocessed MODIS LAI. In this section, we used the SDI and TDI indexes, which were defined in Section 2.3, to make quantitative comparisons of the extent of the spatial and temporal discontinuity, respectively. Tile h19v08 was selected as an example to investigate the spatial and temporal discontinuity of the MODIS and reprocessed MODIS LAI data. This region was mainly covered by EBF (43.22%) and savanna (26.44%). It could be seen that the MCD 6.1 LAI had obvious spatial noise in the lower part of the region (Figure 4), which meant that its LAI value varied considerably within a short distance. In contrast, the reprocessed MODIS LAI varied smoothly in the spatial domain. Large SDI could appear in the domains with an abrupt LAI change and spatial noise; thus, the MCD C6.1 LAI had higher SDI values than the reprocessed MODIS in the lower part of the region.
The TDI was also calculated for the year 2020, days 177 to 209. For the MCD C6.1 LAI, the lower left region had higher TDI values of up to 3 m2 m−2, because the LAI decreased from day 185 to day 193, then immediately increased from day 193 to day 201. This abnormal change did not appear in the reprocessed MODIS, which had a much lower TDI value. Furthermore, both the SDI and TDI of MCD C6.1 had an unstable variation in space, which may not accord with natural conditions. It could also be seen that the main algorithm (QC < 64) corresponded to less spatial noise. The lower left region, which was mainly retrieved from the backup algorithm (64 ≤ QC < 128), corresponded to higher SDI and TDI values. Overall, the MCD C6.1 LAI had a higher level of spatial and temporal discontinuity compared with the reprocessed MODIS in most regions of tile h19v08, which could be related to the retrieval algorithms of the MODIS data.
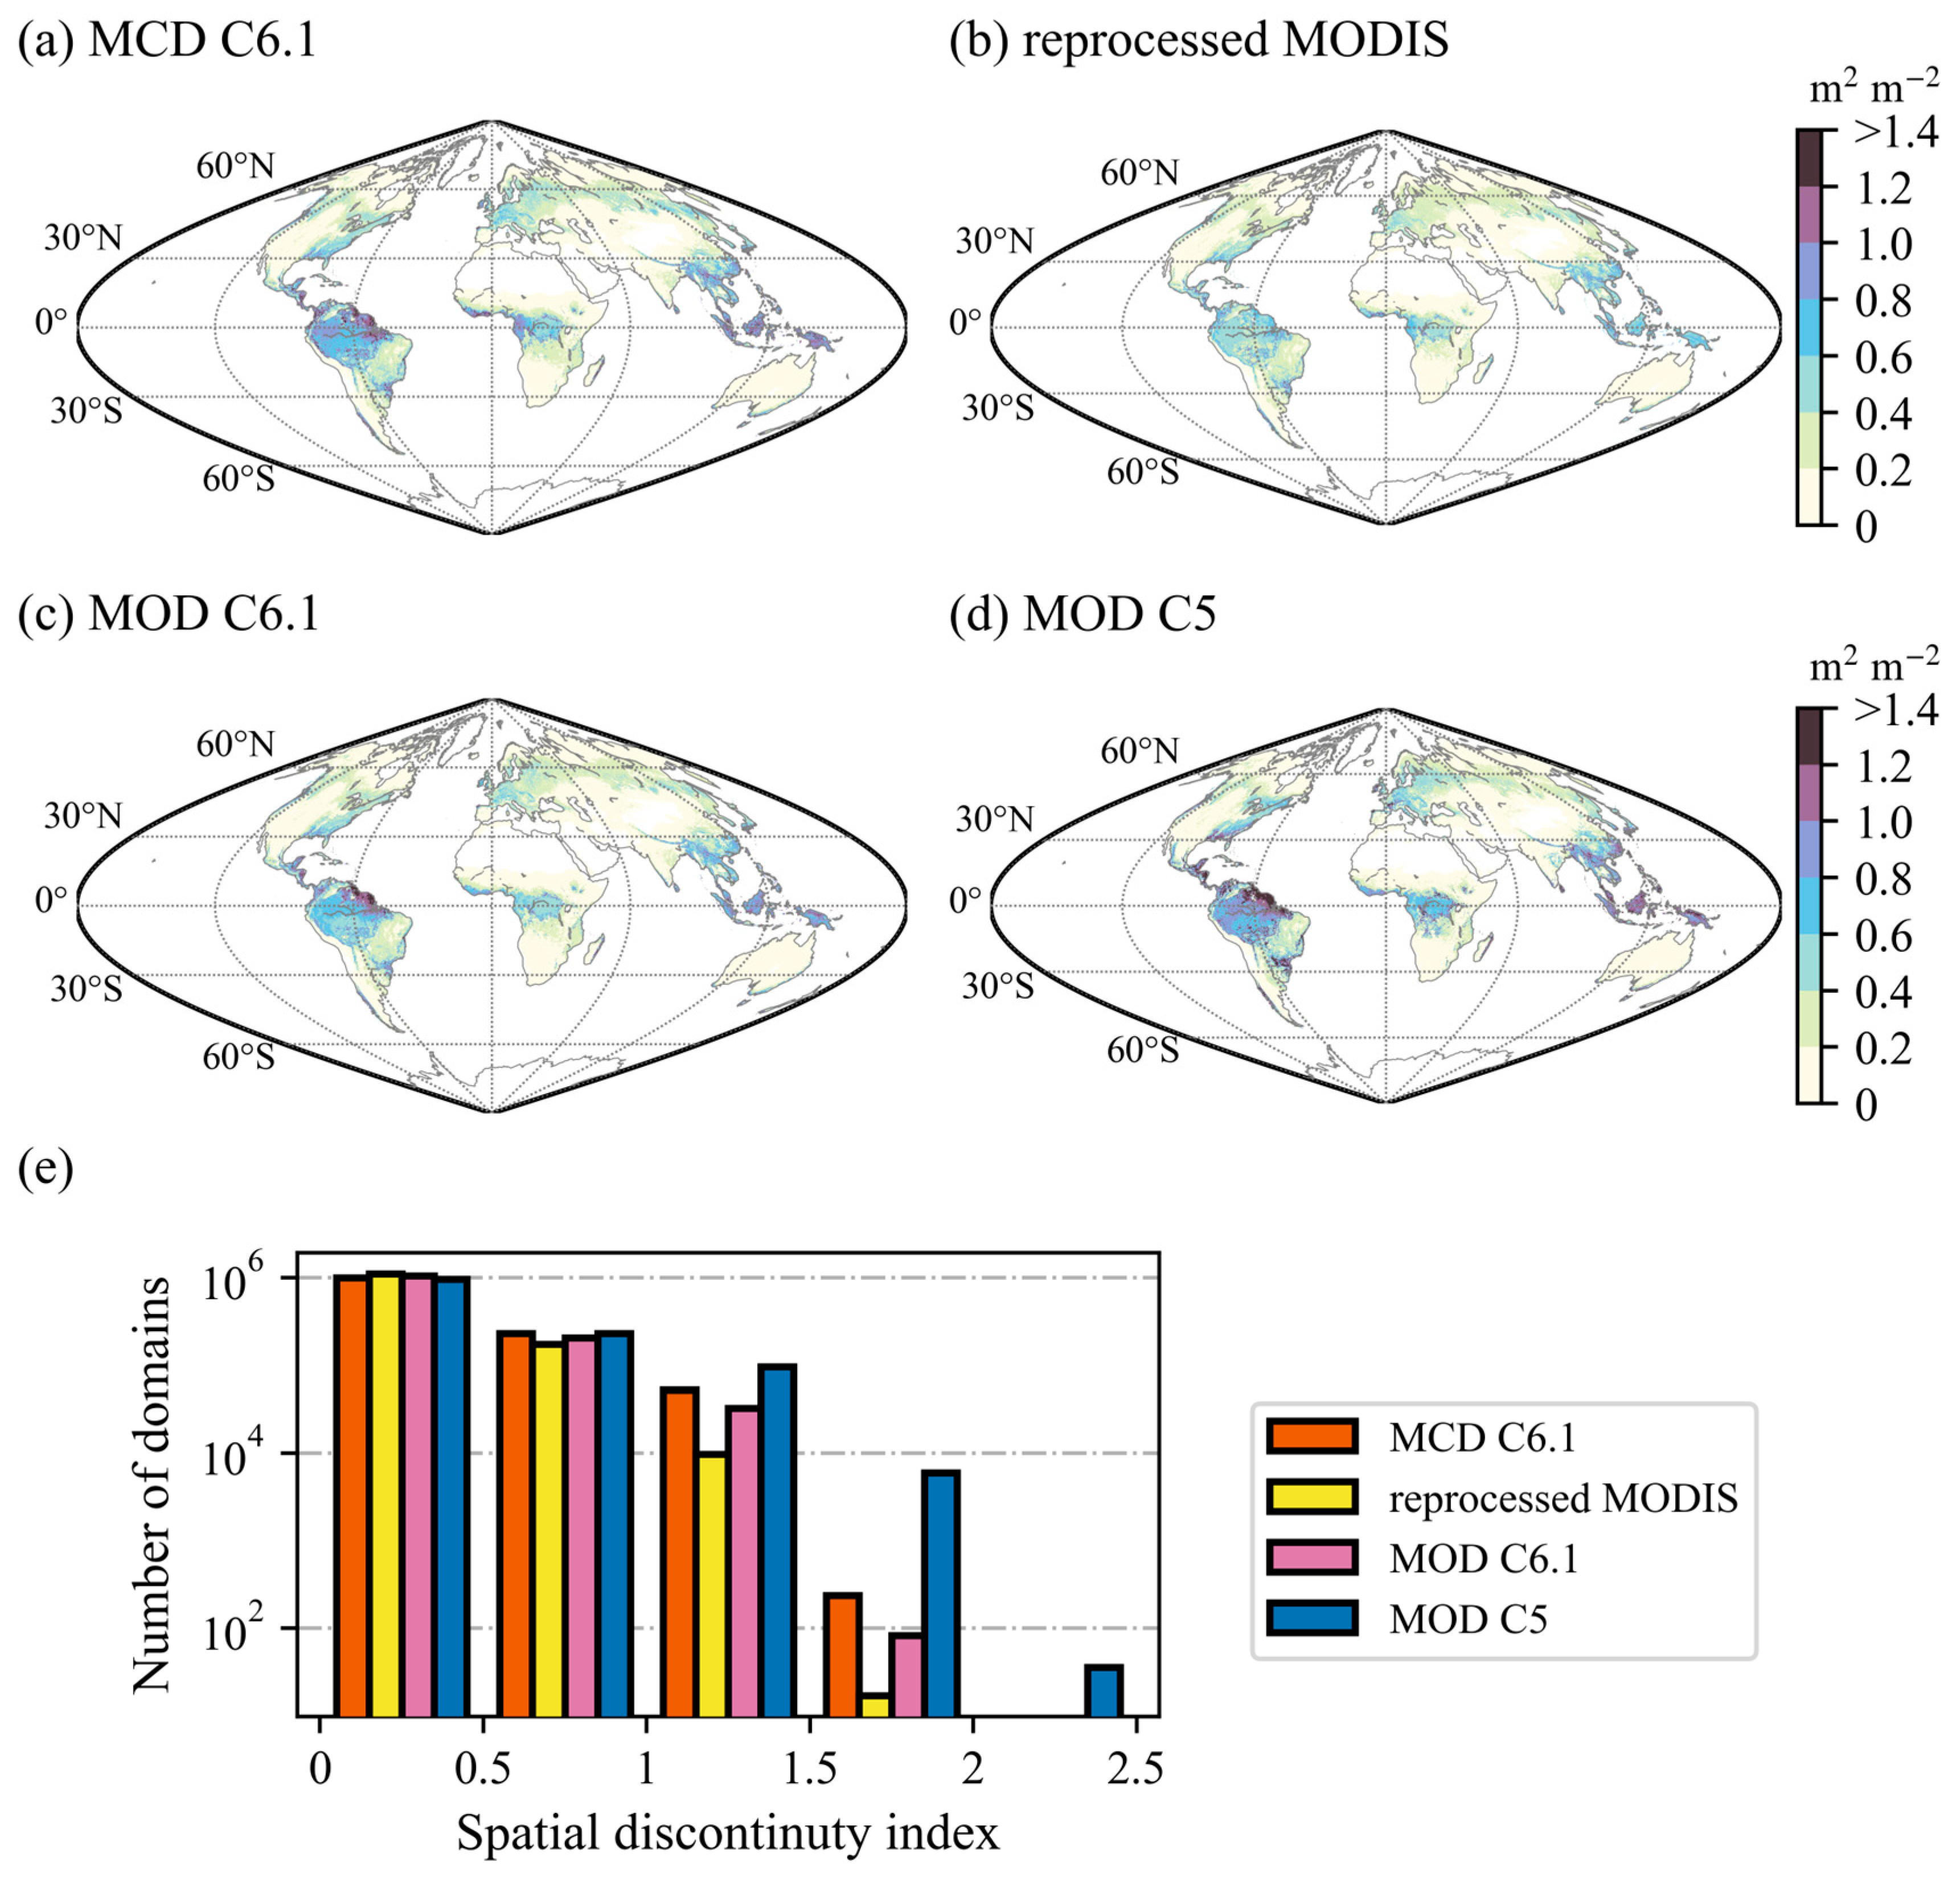
To quantify the spatial and temporal discontinuity on a global scale for the different versions of the MODIS LAI products, the 14-year mean (2003–2016) SDI was calculated for every 10 × 10 km2 domain, containing 20 × 20 pixels for the C6.1 LAI and 10 × 10 pixels for the C5 LAI data. Notably, only the domains with more than 30% valid pixels (QC < 128) were taken into account. The different LAI products displayed similar spatial patterns (Figure 5a–d), which showed that the LAI values were most discontinuous near the equatorial region, such as in the Amazon region, central Africa, and southeast Asia. MCD C6.1 had higher SDI values than the reprocessed MODIS, especially in the equatorial regions (Figure 5a,b), indicating that its spatial variations between the adjacent pixels were larger. To have a clearer view of the spatial discontinuity distribution, we classified the global SDI maps into five intervals (Figure 5e). In the range with a relatively high SDI value (SDI > 1), the reprocessed MODIS had far fewer domains than the MODIS, which meant that the reprocessed data reduced the discontinuity level of many domains. In addition, we also explored the difference in the spatial discontinuity between the MOD C6.1 and MCD C6.1 LAI products. The SDI value of the MCD data was slightly higher than that of the MOD data near the equatorial region (Figure 5a,c), while their global mean SDI values were similar (0.3 m2 m−2 and 0.27 m2 m−2 respectively). Furthermore, the MOD15A2H C5 and C6.1 were compared to investigate the improvement of the updated product. Their SDI disparity was most noticeable in the equatorial region, in the southeast of South and North America, and in western Europe (Figure 5c,d). Additionally, MOD C6.1 had far fewer domains in the range with a relatively high SDI (SDI > 1) (Figure 5e), indicating that the updated version reduced the spatial discontinuity in the high SDI region.
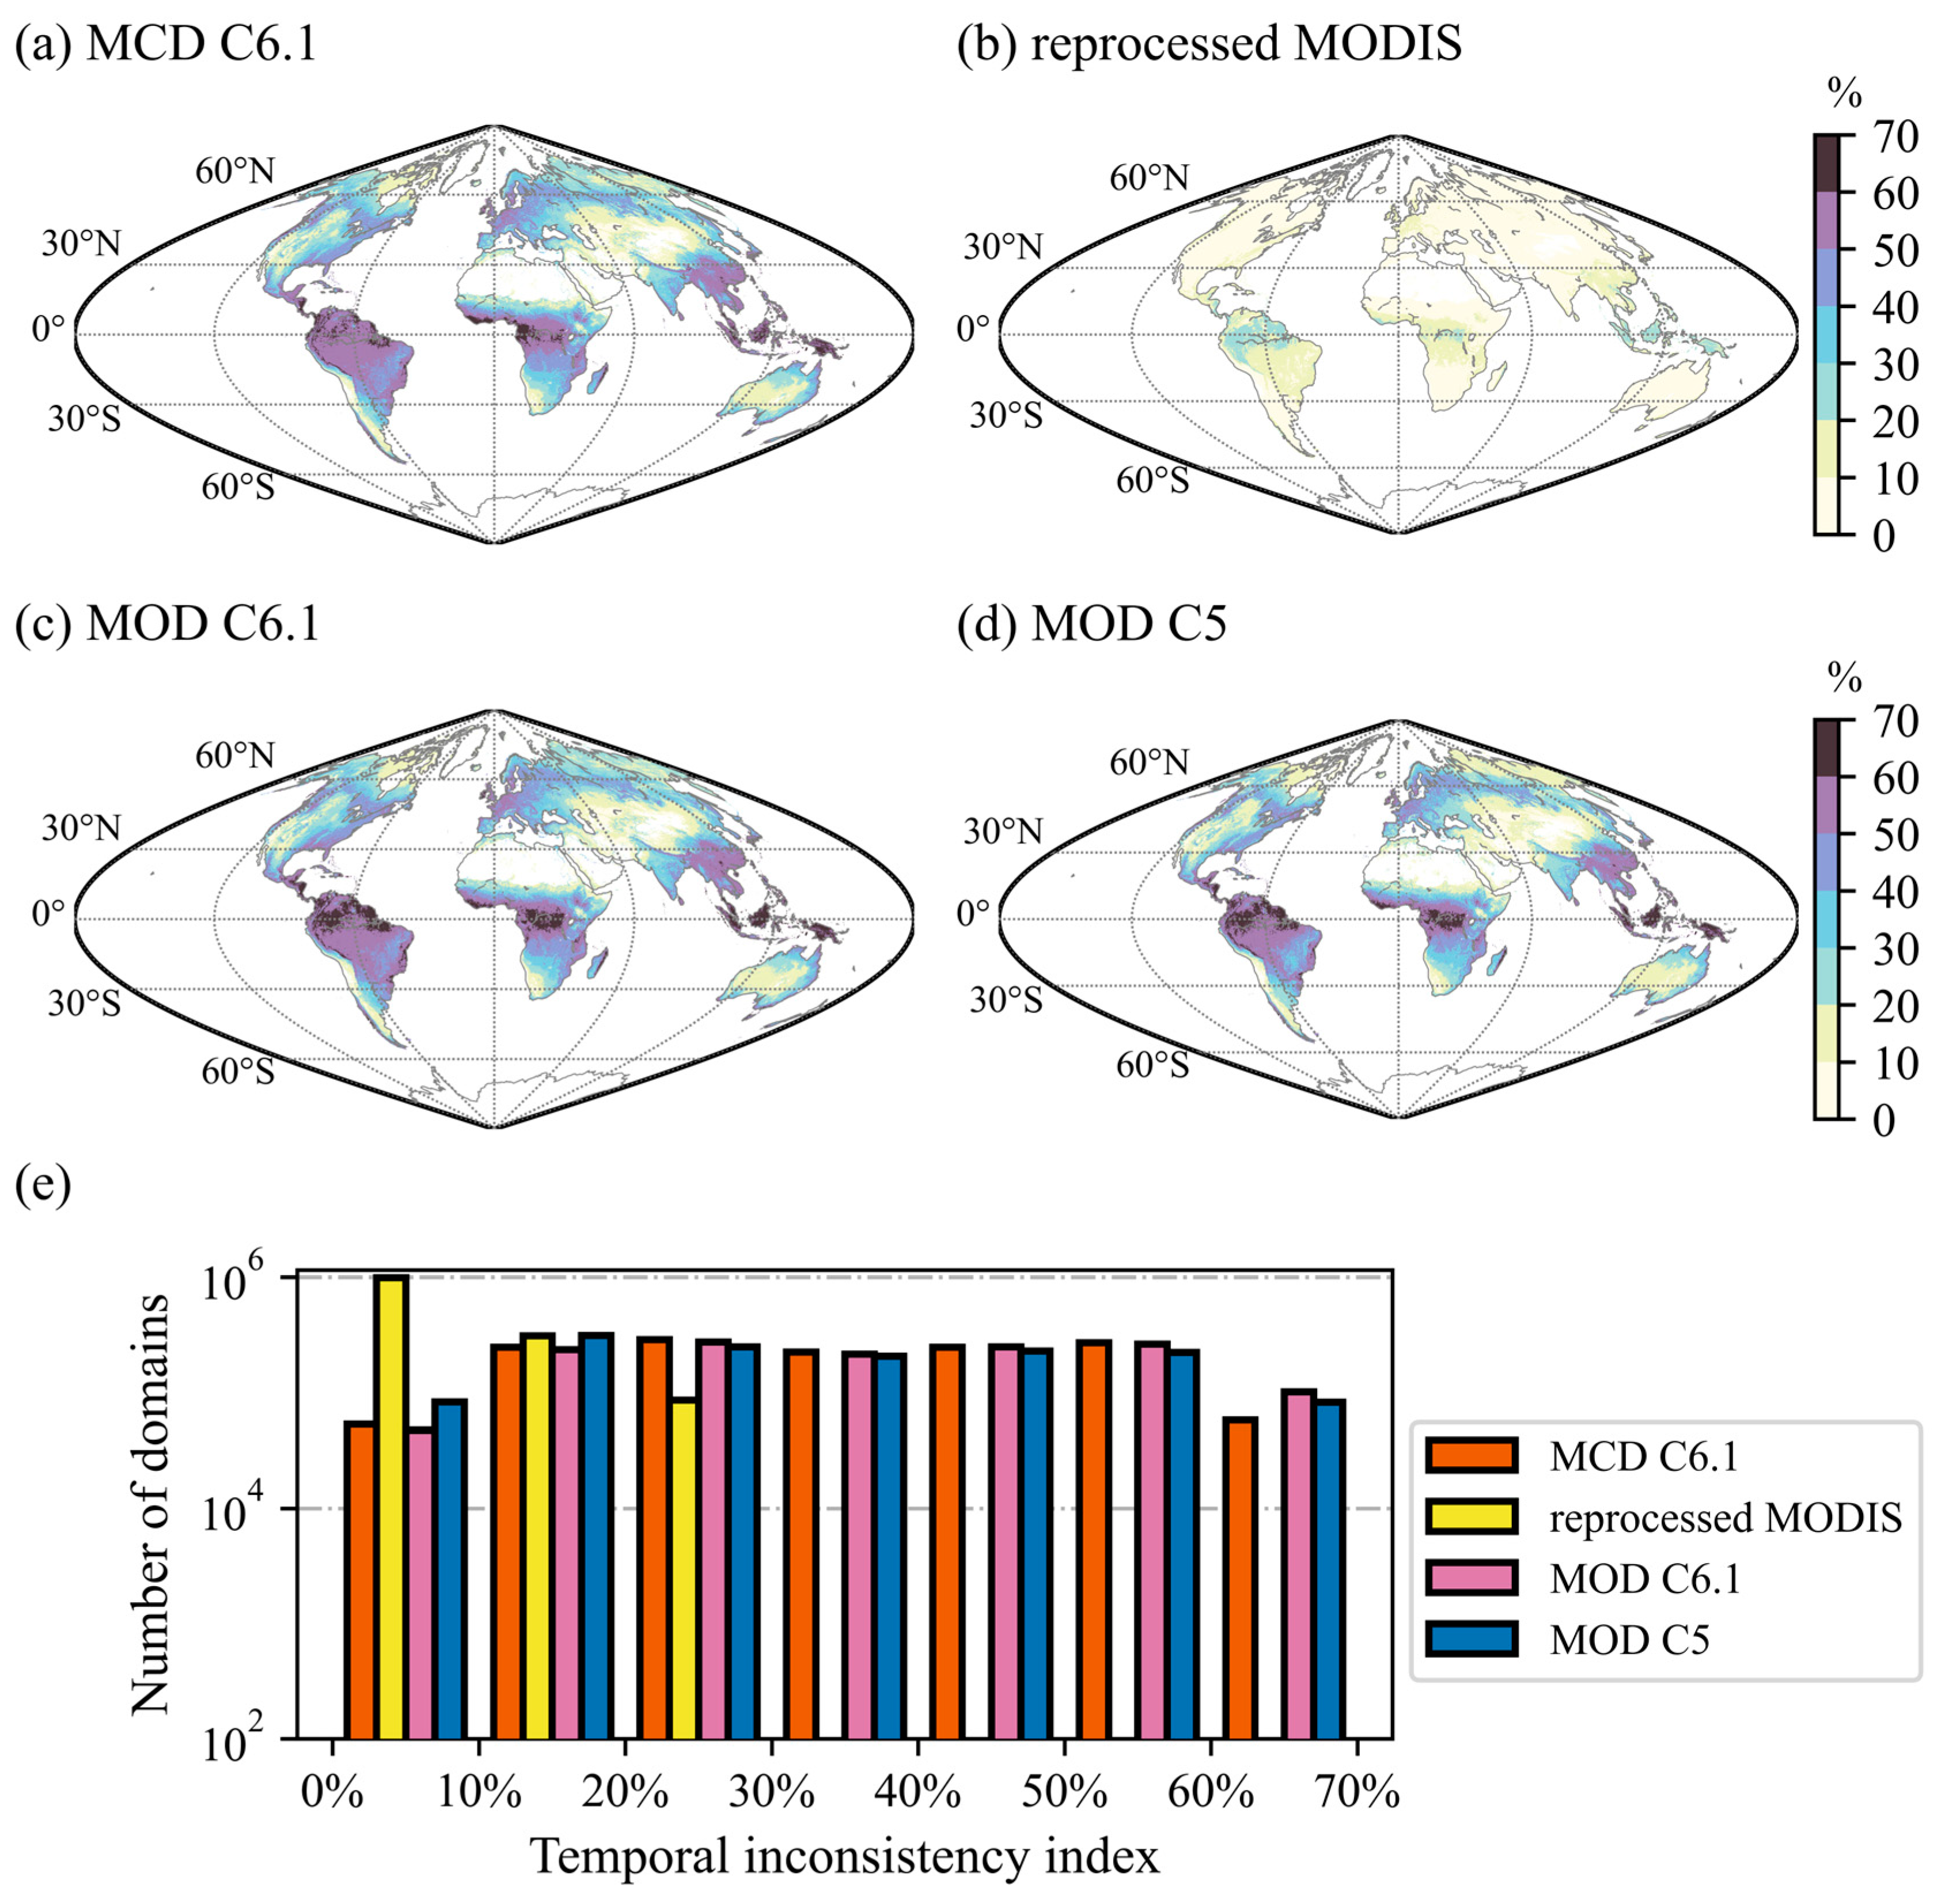
The TDI of each pixel for 2003–2016 was calculated and then aggregated to 10 × 10 km2 (Figure 6). Similar to the global distribution of the SDI, the TDI value of the MODIS LAI was highest in the equatorial region, and the northern high latitude regions came next (Figure 6a). This may be associated with the more serious cloud contamination in these regions [75]. The TDI of the reprocessed MODIS was less than 0.5 m2 m−2 (Figure 6b), which was much lower than MCD C6.1. Compared with the difference in the SDI, their TDI disparity was much larger near the equatorial region, indicating that the reprocessed product had a more significant improvement in terms of its temporal continuity. According to the results of the global statistics, the reprocessed MODIS decreased the TDI of MCD C6.1 to less than 0.5 m2 m−2 (Figure 6e). We also explored the difference in the temporal discontinuity between the MOD C6.1 and MCD C6.1 LAI products. The TDI value of the MOD data was slightly higher than the MCD data near the equatorial region, which was just the opposite of the SDI case, but their global mean TDI values were still similar (0.54 m2 m−2 and 0.50 m2 m−2, respectively). Furthermore, the TDI difference between the C5 and C6.1 of the MOD15A2H products was quite small. The global mean TDI of C6.1 was 0.05 m2 m−2 higher than C5, which may be related to its higher spatial resolution.

3.4. Consistency Comparison

The TII value was first computed for the time series (2003–2016) of each pixel and then averaged over a 10 × 10 km2 region (Figure 7). All of the LAI products achieved their highest TII values near the equatorial region, similar to the distribution of the discontinuity indexes. For the MCD C6.1 LAI data, the TII value was more than 50% near the equatorial region, southern China, and western Europe (Figure 7a). This meant that more than 23 timesteps corresponded with the extreme values in a year with 46 timesteps, and that many fluctuations existed within a seasonal cycle. For the reprocessed MODIS LAI (Figure 7b), the number of extreme values was much less than MCD C6.1. According to the statistical result, the TII of the reprocessed MODIS in most regions was less than 20% (Figure 7e), indicating that the variation of the reprocessed MODIS generally followed the natural seasonal pattern. We also compared the consistency between the MOD C6.1 and MCD C6.1 LAI products (Figure 7a,c). Their TII values were similar in most regions and were both much higher than the reprocessed MODIS. The MOD product had a higher TII value when the TII was greater than 60%. The TII difference between the MOD C5 and C6.1 products was quite small (Figure 7c,d), implying that the updated version may not have improved the consistency of the LAI time series.

3.5. Long-Term Trends Comparison

The trend of the global annual growing season mean LAIs of MCD 6.1 and the reprocessed MODIS, during the period 2003–2021, were compared. The global LAI data were first aggregated to 50 km and a monthly scale, excluding those unvegetated pixels. After this, the annual LAI data were derived by averaging the monthly LAI that had monthly temperatures that were greater than 0 °C [76]. The monthly temperature data were gathered from the Climate Research Unit gridded Time Series version 4 (CRU TS v4) [77], and were projected onto the tile coordinate system. We used the multiyear averaged monthly temperature to make the inter-annual land masks consistent. After deriving the growing season mean LAI map, its spatial average was used to determine the global mean LAI values.
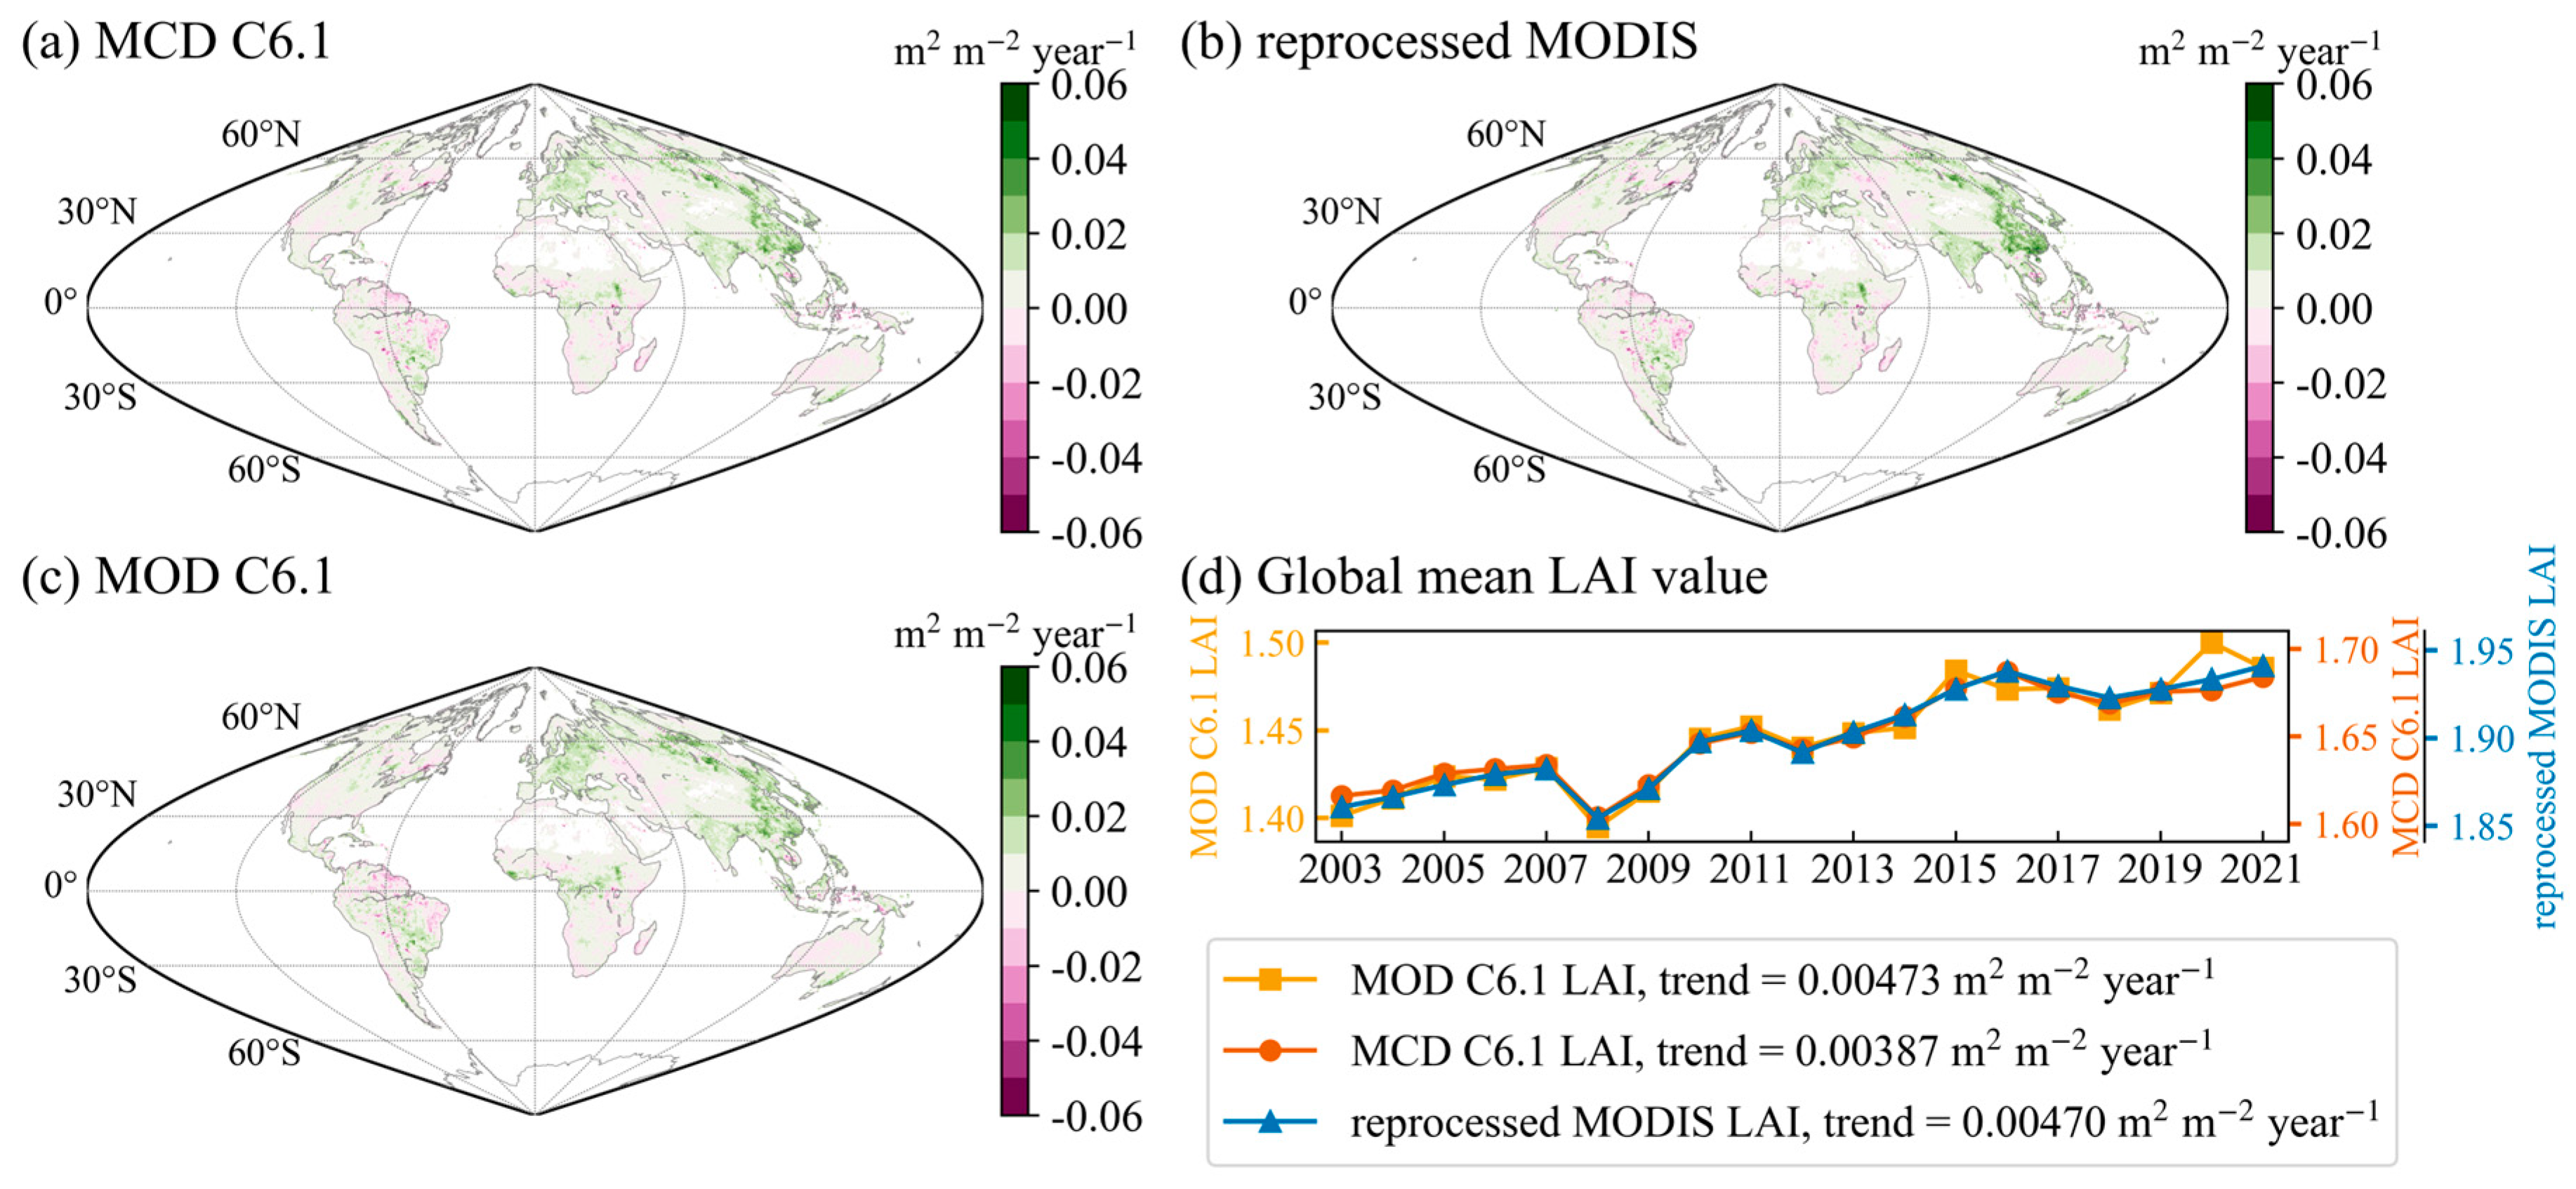
The spatial patterns of the linear trends of MCD 6.1 and the reprocessed MODIS were almost identical (Figure 8a,b), displaying a significant greening and browning trend over about 32% and 5% of the global area, respectively (p < 0.1 in the Mann–Kendall test). They revealed greening trends in China, India, eastern Siberia, Europe, southern South America, and central Africa, and showed browning trends in central south America. In addition, the global mean LAI values were plotted using different y-axes to assess the consistency of their trends (Figure 8d). It was shown that MCD C6.1 and the reprocessed MODIS exhibited very similar growing trends, though the reprocessed MODIS was 0.00083 m2 m−2 year−1 higher. The difference in the global mean LAI values among MCD C6.1, MOD C6.1, and the reprocessed MODIS may be related to the extent of temporal and spatial discontinuity. In general, the reprocessed MODIS finely preserved the trend of the MCD C6.1 data. Additionally, the linear trend of MOD C6.1 had a similar spatial pattern to MCD C6.1, too (Figure 8a,c), and their global mean LAI values showed comparable growing trends (Figure 8d). However, the difference in this trend increased if the period of 2003–2011 (0.00411 m2 m−2 year−1 for MCD C6.1 and 0.00579 m2 m−2 year−1 for MOD C6.1) was considered, implying that the different versions of the MODIS LAI products may be inconsistent in their trends.

3.6. Composition of Retrieval Algorithm of MOD and MCD Products

The quality difference between the MOD C6.1 and MCD C6.1 products was explored in Section 3.3 and Section 3.4. The MCD product was found to perform better in its temporal continuity and consistency near the equatorial region, which may be due to the different composition of the retrieval algorithms. We derived the proportion of these retrievals from the main algorithm during 2003–2021, and then aggregated the result into 10 × 10 km2 domains (Figure 9). The temporal ratio of the data that were retrieved from the main algorithms of both products was lower than 60% in northern high latitudes. The main-algorithm retrievals of the MCD product had a proportion of more than 75% in the Amazon region, southern China, southeast Asia, and middle Africa, while they were less than 60% for the MOD product in these regions, indicating that more LAI data were retrieved from the backup algorithm or not produced. More retrievals from the main algorithm improved the temporal continuity and consistency of the MCD data near the equatorial region. That is, the MCD product that was acquired from the combined satellites may have been able to capture more uncontaminated images, and thus had a higher chance of being retrieved from the main algorithm. Therefore, the MCD data were recommended for studies over the equatorial region.

3.7. Difference between QC-Selected MODIS and Reprocessed MODIS LAI

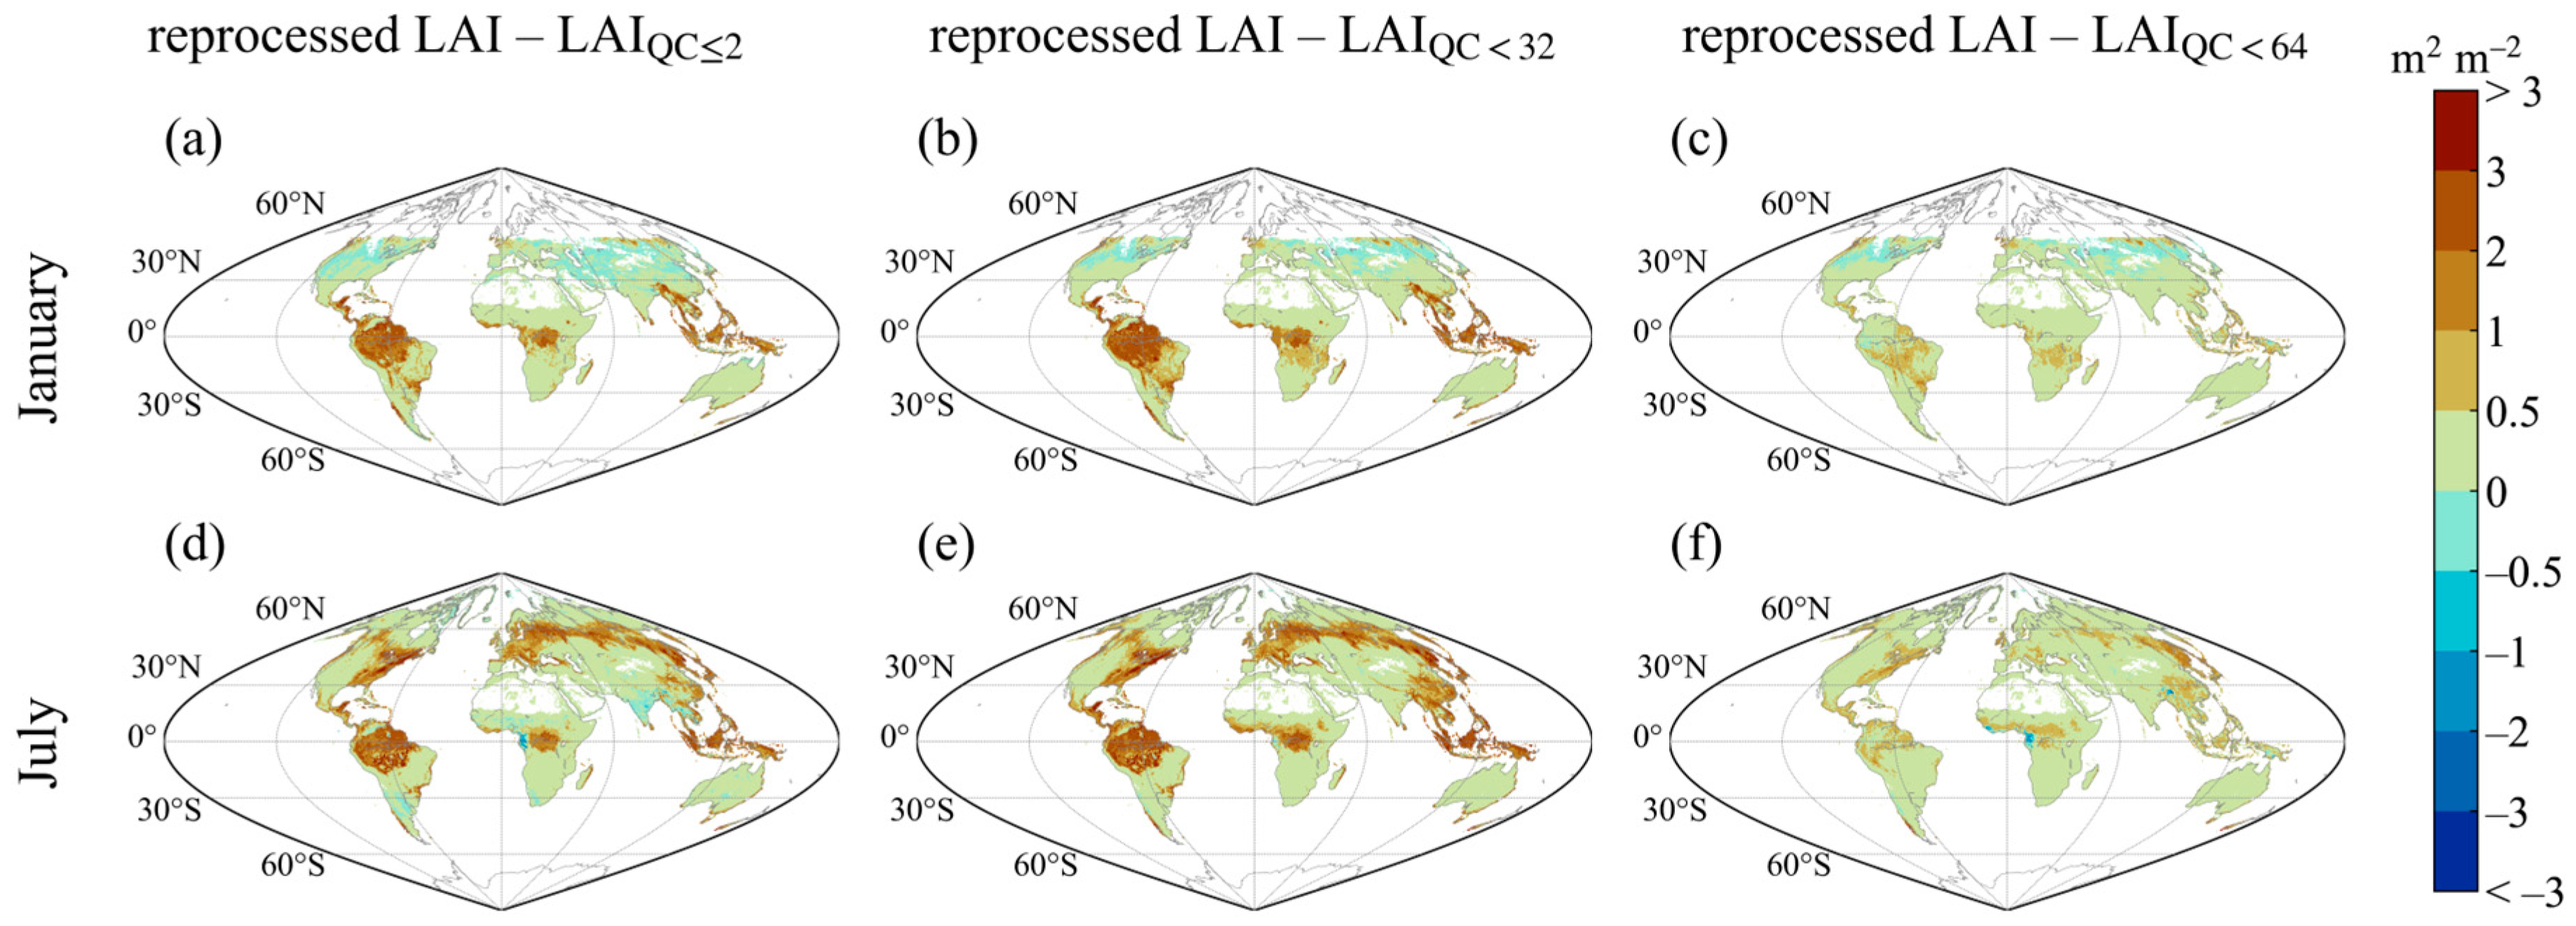
The MODIS LAI products provided QC information, with details about their retrieval algorithms and cloud states stored in the FparLAI_QC layer. Many studies selected the LAI data within a specific QC range, in order to exclude the cloud-contaminated, backup-algorithm-retrieved or invalid data [78,79,80,81,82,83]. To explore the difference between the QC-selected LAI and the reprocessed data, the MCD C6.1 LAI product was filtered by setting different QC constraints, including QC ≤ 2 (the main algorithm used without cloud or saturation), QC < 32 (the main algorithm used without saturation), and QC < 64 (the main algorithm used). Then, the results were aggregated to 0.5-degree resolution on monthly scale, labeled as LAIQC≤2, LAIQC<32, and LAIQC<64, respectively. The reprocessed MODIS LAI was also aggregated on the same scale, and their difference in January and July of the year 2010 was derived (Figure 10).
When aggregating the MCD C6.1 LAI product to 0.5-degree domains, the mean LAI values from the pixels that met the QC limit conditions were calculated. For some domains, sometimes, none of their pixels met a specific QC limit condition, especially those that were mainly covered by water bodies. These domains would not be taken into consideration when compared with the reprocessed LAI. For the domains in the inland region, only a few of them could not meet the QC requirement, and this only occurred in several 8-day periods. In general, the aggregation results could be derived in most domains, and therefore could be compared with the reprocessed MODIS LAI on the global scale.
The LAI that was constrained by different QC limit conditions had lower values compared with the reprocessed MODIS in many regions, most of the time. For LAIQC≤2 and LAIQC<32, these were lower than the reprocessed MODIS in the eastern North America and Eurasia high latitudes, especially in the summer. In the Amazon basin, they were also lower, and the extent of their underestimation was higher in the summer and autumn, reaching more than 3 m2 m−2. In central Africa, southeast China, and southeast Asia, the reprocessed MODIS LAI was about 2 m2 m−2 higher than LAIQC≤2 and LAIQC<32. For LAIQC<64, this was about 0.5 m2 m−2 lower in most domains of the Amazon region, central Africa, southern China, and southeast Asia, while it was slightly higher in the west of the EBF belt in central Africa. Among the three LAI data that were constrained by different QC limit conditions, LAIQC≤2 and LAIQC<32 had a larger difference with the reprocessed MODIS compared with LAIQC<64. LAIQC<64 was the most consistent with the reprocessed MODIS in the global range, although it still underestimated the reprocessed MODIS in some of the regions that are mentioned above. It was noteworthy that the difference between the reprocessed MODIS and the QC-limited MCD C6.1 LAI was calculated at a 0.5-degree resolution during one month, and would probably increase if aggregated at a higher temporal or spatial resolution.

4. Discussion

4.1. Uncertainty of LAI Reference Maps

In normal circumstances, LAI varies continuously and would not apparently fluctuate within a season. However, several LAI reference maps showed short-term variations and contained sudden drops in values, such as sites BLAN, GUAN, and STEI from the GBOV maps, and sites Barrax and SouthWest_2 from the ImagineS maps (see Figure 3 and Figures S6 and S11). This indicated that uncertainties may exist within the LAI reference maps, which can affect the results of the direct validation (Section 3.1). The sources of uncertainty within LAI reference maps are generally linked to ground measurement errors [1,84], especially when indirect optical methods are used [85,86,87,88]. In addition, uncertainty can arise in the process of land cover classification, which would then introduce variations into the ecological modeling results [89]. The reliability of the reference maps can also be affected by the quality of the obtained satellite data [7]. As for remote sensing retrieval, clouds and atmospheric interference would probably affect the LAI negatively, and the local low values are, in most cases, considered to be contaminated data [75]. The same as the MODIS products, reference maps also use data from remote sensing. We can find that the MODIS LAI time series had high-frequency noise and sudden spikes that were affected by the reflectance data quality, and that the values of the LAI maps sometimes dropped within a short period simultaneously. For instance, over the period of 12 August 2018–15 September 2018, the LAI map value of site HAIN (Figure S2) experienced a sudden decline of 3.65 m2 m−2 and then an increase of 3.63 m2 m−2. Coincidentally, the MODIS LAI fluctuated over this time, first decreasing by 3.88 m2 m−2 and then increasing by 3.52 m2 m−2, bringing it closer to the reference map value. In contrast, the reprocessed MODIS LAI was approximately an upper envelope of the MODIS, and it was farther from the LAI map values compared with the MODIS under this circumstance. Since the LAI fluctuations appeared constantly in the time series of both the reference maps and the MODIS data, it was assumed that these high-frequency noises may account for the better RMSE results of the MODIS LAI validation than those of the reprocessed MODIS validation. Therefore, the validation of the LAI products using reference maps remained uncertain to some extent, since the quality of the ground-based observations was subject to the short-term fluctuations themselves. This implied that, when evaluating the quality of the LAI products, we should not only focus on the accuracy of the validation results, but also the uncertainty in the reference maps.

4.2. Suggestions on MODIS LAI Data Chosen

We have compared the accuracy, continuity, and consistency of different LAI products (Section 3) and then tried to provide some notes on the MODIS LAI data that were chosen. First of all, we considered different versions of the MOD products. It can be found that C6.1 had a higher accuracy than C5 in the validation using reference maps, and also that it was more spatially continuous in the equatorial region. This may be owing to the algorithm improvements of C6.1 and its higher spatial resolution. Then, we compared different versions of C6.1. A direct validation revealed that MOD and MCD had comparable accuracy, and that their spatiotemporal continuity was close to each other considering the global average. In terms of consistency, the MOD product had more extreme TII values when the TII was greater than 60%, indicating that it was much less consistent near the equatorial region. Therefore, we suggest using MCD C6.1 instead of MOD when the studied region is in the tropics. Moreover, it should be utilized with caution when using the QC-selected method to aggregate the LAI values, since it would probably cause underestimation, especially in the equatorial region and the northern high latitudes. This may be associated with the existence of peak or spike values, even when retrieved from the main algorithm. Lastly, it was found that different versions of the MODIS LAI products could show a little discrepancy in their values of trends [90,91]. In contrast, the reprocessed MODIS retained an almost identical trend with the MODIS, which implied that the results of the LAI trend study would be very close.
The reprocessed C6.1 LAI had more improvements in its accuracy than the previous reprocessed C5 product, which was revealed by the validation that used reference maps (Figure 2c). We also used the ImagineS reference maps to compare the two reprocessed products, and found that the reprocessed C6.1 performed better, with a higher R2 (0.65 for C6.1 and 0.57 for C5) and less bias (0.90 for C6.1 and 0.92 for C5). The GBOV maps were not used for the validation, since most of the ground measurements were conducted after the year 2016. Additionally, the new version of the reprocessed product had a higher spatial resolution of 500 m, since the raw data were upscaled. In general, the improvements in the reprocessed products were attributed not only to the changes in the raw data, but also to the update of the reprocessing method which incorporated an annually updated land cover product. Furthermore, the trends of both the reprocessed products were almost identical with the raw data they used, which meant that the trend of the reprocessed C6.1 product was different from that of the reprocessed C5 product (Figure S18). During the overlapped period of the two reprocessed products (i.e., 2003–2016), the global growing season mean of the reprocessed C6.1 LAI showed a growing trend of 0.00547 m2 m−2 year−1, while no significant trend was observed for the reprocessed C5 (−0.00164 m2 m−2 year−1, p = 0.27). The global patterns showed that a decreasing trend of the reprocessed C5 was pronounced in central Africa (Figure S19), while the reprocessed C6.1 had no significant trend in this region. Additionally, the reprocessed C6.1 had a larger greening trend than the reprocessed C5 in northern high latitudes and southeast China. This indicated that there was uncertainty in the trend of the LAI, and that using different versions of the LAI products for the trend analysis could result in different trends.

4.3. Caution for Using Conjunctive MOD and MCD Products

The MODIS LAI C6.1 products, MCD15A2H and MOD15A2H, have been evaluated and compared in this study. As previously stated, the prefix “MOD” means that the product is retrieved using the data from only the Terra satellite, while the prefix “MCD” represents a combined product that obtains a better retrieval from the Terra and Aqua satellites. Therefore, the MCD product is less affected by atmospheric conditions and should be of a better quality than the MOD product. The MCD product begins at 4 July 2002, while the MOD product starts from 18 February 2000. When using the conjunctive MOD and MCD products for a long-term LAI trend analysis, caution should be taken. We have found that their quality differed in terms of continuity, consistency, and the proportion of main algorithm retrievals, especially in the equatorial regions (Section 3.3 and Section 3.6), which may result in an unrealistic trend.
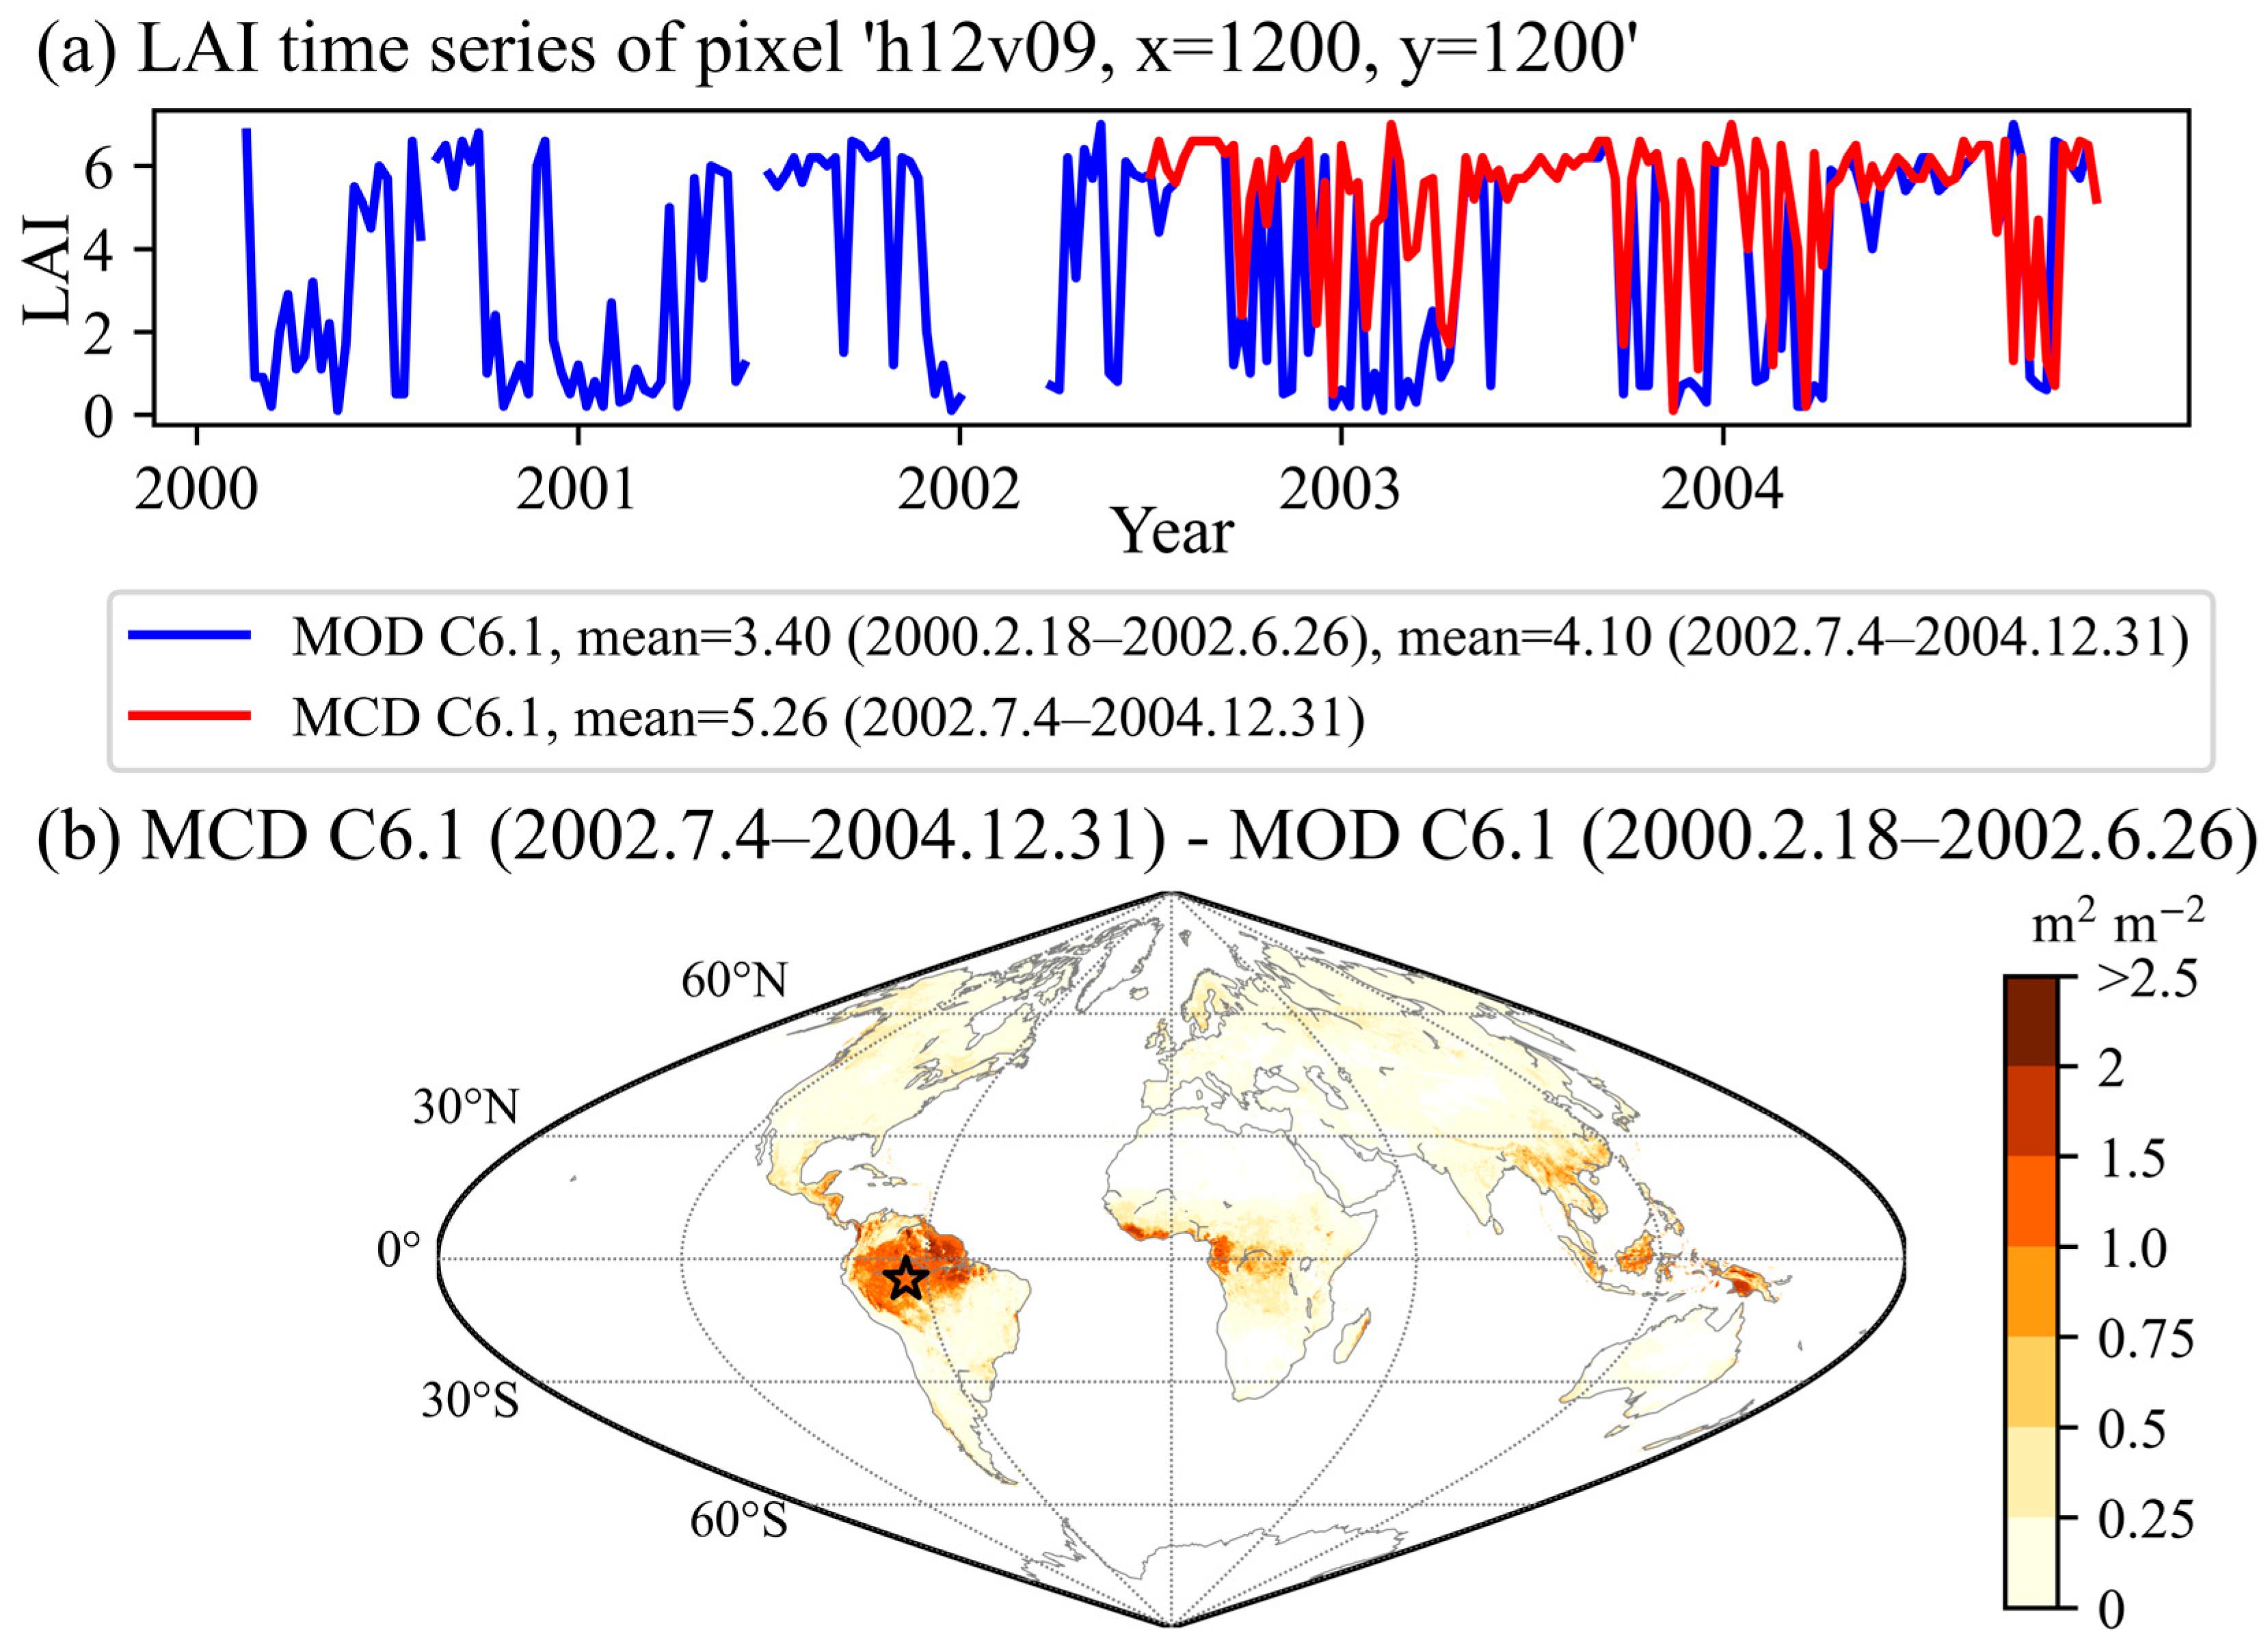
To demonstrate this, the time series of the MOD C6.1 (18 February 2000–31 December 2004) and MCD C6.1 (4 July 2002–31 December 2004) LAI data at the pixel ‘h12v09, x = 1200, y = 1200’ (lat = −4.998, lon = −65.250) were derived. If we used MOD (18 February 2000–26 June 2002) as a complement for MCD, it can be seen that there was a sudden leap in the mean value near the year 2002 (Figure 11a), which would therefore result in an unrealistic increasing trend. We also calculated the temporal mean values of MOD (18 February 2000–26 June 2002) and MCD (4 July 2002–31 December 2004) at the global scale, and their difference was shown in Figure 11b. The MOD value was obviously lower than MCD in the Amazon region, southeast Asia, and central Africa, indicating that a sudden change in the temporal mean value of the combined time series may exist in these regions. This unrealistic trend may be correlated to the difference in quality between the MCD and MOD products. The MOD product was more discontinuous in the temporal domain (Section 3.3), which dragged down the mean value. Furthermore, these regions had a lower ratio of main algorithm retrievals, implying that the quality of the retrieved data was relatively lower. Therefore, we suggest that the conjoint MOD and MCD data should not be used in LAI long-term trend analyses.

5. Conclusions

Our previous work reprocessed the MODIS C5 LAI data, which were widely used in many studies. The latest MODIS LAI product, version C6.1, has been released after undergoing various calibration changes and polarization correction, but still has retrieval quality issues. To enhance its applications in land surface and climate modeling, we reprocessed the MCD15A2H C6.1 LAI product to expect better data quality, data continuity, and consistency, in both the temporal and spatial domains.
We continued to use the integrated two-step method that was developed for C5, but with updated background value calculations and land cover data to account for the land cover changes in the data reprocessing. A comprehensive collection of LAI reference maps from several projects were used for the validation. Moreover, three indexes were proposed and applied to quantify the spatial and temporal continuity and consistency of the LAI products. Finally, different kinds of MODIS data were compared, as well as the data that were selected by specific QC values. The conclusions are as follows:
(1)
The reprocessed MODIS data were found to be closer to the reference map values than MODIS. From the results of the time series plots, high-frequency noise can still be observed in the MODIS LAI, especially in the forest sites that were largely retrieved by the main algorithm with saturation. Contrarily, the reprocessed LAI data changed smoothly over time.
(2)
Short-term fluctuation, together with unexpected low values, can be observed in some of the LAI reference maps, which may have led to uncertainty in the validation results.
(3)
The reprocessed MODIS LAI data were found to be more consistent and continuous than MODIS on a global scale, especially in the equatorial region and northern high latitudes.
Based on these comparison results, some suggestions for the MODIS LAI data have been made. First, the C6.1 data are recommended for their better accuracy than C5. In addition, the MCD data are suggested to be used in the tropics, considering their better consistency and a higher proportion of data that were retrieved from the main algorithm than the MOD product. Because of their differences, using conjunctive MOD and MCD products can have a significant impact on the long-term trend analysis, which should be avoided. Furthermore, it is noteworthy that the MODIS LAI value, when aggregated by the QC-selected method, is likely to be underestimated, particularly near the equatorial region and northern high latitudes, and especially in the summer. Thus, the MODIS LAI data, filtered by a QC value, should be used with caution and the reprocessed data are recommended.
Since the inherent properties of the MODIS data, such as their quality and trends, were preserved, the trends of the reprocessed C5 LAI that were derived by the previous work and the reprocessed C6.1 LAI were different. The reprocessed C6.1 product outperformed the reprocessed C5 in its accuracy, which was revealed by the direct validation against the LAI reference maps. In addition, the spatial resolution increased from 1000 m to 500 m. Therefore, the reprocessed C6.1 can be used as a substitute for the reprocessed C5 product in land surface and climate modeling.

Supplementary Materials

The following supporting information can be downloaded at: https://www.mdpi.com/article/10.3390/rs15071780/s1, Figure S1: Time series plot of LAI mean values within the reference map extent for sites ARGO, KONZ, SEVI from BigFoot dataset, Figure S2: Time series plot of LAI mean values within the reference map extent for sites BART, CPER, DSNY, HAIN from GBOV dataset, Figure S3: Time series plot of LAI mean values within the reference map extent for sites JERC, JORN, KONA, LAJA from GBOV dataset. The QC values, which indicate the retrieved algorithms, are drawn in different colors on the top of time series, Figure S4: Time series plot of LAI mean values within the reference map extent for sites NRMN, ORNL, OSBS, SERC from GBOV dataset, Figure S5: Time series plot of LAI mean values within the reference map extent for sites SRER, TUMB, UNDE, VASN from GBOV dataset, Figure S6: Time series plot of LAI mean values within the reference map extent for sites WOOD, HARV, ONAQ, STEI from GBOV dataset. The QC values, which indicate the retrieved algorithms, are drawn in different colors on the top of time series, Figure S7: Time series plot of LAI mean values within the reference map extent for sites 25de Mayo_Shurb, AHSPECT-Condom, AHSPECT-Creón D’armagnac, AHSPECT-Meteopol from ImagineS dataset, Figure S8: Time series plot of LAI mean values within the reference map extent for sites AHSPECT-Peyrousse, AHSPECT-Savenès, AHSPECT-Urgons, Albufera from ImagineS dataset, Figure S9: Time series plot of LAI mean values within the reference map extent for sites Collelongo, LaReina_Cordoba_1, LaReina_Cordoba_2, Maragua_UpperTana from ImagineS dataset, Figure S10: Time series plot of LAI mean values within the reference map extent for sites Pshenichne, Rosasco, SanFernando, SouthWest_1 from ImagineS dataset, Figure S11: Time series plot of LAI mean values within the reference map extent for sites SouthWest_2 and Barrax-LasTiesas from ImagineS dataset, Figure S12: Time series plot of LAI mean values within the reference map extent for site Walnut Creek from SMEX02 dataset, Figure S13: Time series plot of LAI mean values within the reference map extent for sites Fundulea, Gilching, Gnangara, Laprida from VALERI dataset, Figure S14: Time series plot of LAI mean values within the reference map extent for sites Larose, Le Larzac, Les Alpilles, Nezer from VALERI dataset, Figure S15: Time series plot of LAI mean values within the reference map extent for sites Plan-de-Dieu, Puechabon, Sud-Ouest, Turco from VALERI dataset, Figure S16: Time series plot of LAI mean values within the reference map extent for sites Wankama, Camerons and Zhang Bei from VALERI dataset, Figure S17: Time series plot of LAI mean values within the reference map extent for site Ruokolahti from Boston University dataset. The QC values, which indicate the retrieved algorithms, are drawn in different colors on the top of time series. Figure S18: Linear trends of the global growing season mean LAI values of different LAI products during their overlapped period 2003–2016, Figure S19: Linear trends of the growing season mean LAI of (a) reprocessed C5 LAI and (b) reprocessed C6.1 LAI during the period 2003–2016. Table S1: Characteristics of the validation sites (total 73) and associated LAI reference maps (total 2762).

Author Contributions

Conceptualization, H.Y.; methodology, H.Y. and W.L.; validation, S.Z., S.L., N.W., X.L., Z.W. and Y.H.; formal analysis, W.L., H.Y. and W.D.; investigation, H.Y. and W.L.; writing—original draft preparation, W.L.; writing—review and editing, W.L., Y.H. and Y.D.; visualization, W.L.; funding acquisition, Y.D. and H.Y. All authors have read and agreed to the published version of the manuscript.

Funding

This research was funded by the Guangdong Major Project of Basic and Applied Basic Research (2021B0301030007), the Natural Science Foundation of China (under Grants 42075160, 41730962 and 42088101), the National Key R&D Program of China (under Grant 2017YFA0604300), the Innovation Group Project of Southern Marine Science and Engineering Guangdong Laboratory (Zhuhai) (311021009), and the specific research fund of the Innovation Platform for Academicians of Hainan Province (YSPTZX202143).

Data Availability Statement

The reprocessed MODIS MCD15A2H C6.1 data can be downloaded from http://globalchange.bnu.edu.cn/research/laiv061 (last accessed on 25 December 2022) with various temporal and spatial resolutions or from https://doi.org/10.4121/21858717.v1. The MODIS LAI and land cover products can be downloaded from https://lpdaac.usgs.gov (last accessed on 20 March 2023), maintained by the NASA EOSDIS Land Processes Distributed Active Archive Center (LP DAAC).

Acknowledgments

We want to thank Per Jönsson and Lars Eklundh for providing software TIMESAT on the web site. We also want to thank the VALERI project, BigFoot science team and CEOS LPV group for providing LAI reference maps on their websites. This study has been undertaken using data from GBOV “Ground Based Observation for Validation” (https://land.copernicus.eu/global/gbov, last accessed on 20 March 2023) founded by European Commission Joint Research Centre FWC9418374, part of the Global Component of the European Union’s Copernicus Land Monitoring Service. GBOV LAI products are developed and managed by ACRI-ST with the support from University of Southampton and Battelle. We thank C. Meier, J. Dash, L.A. Brown and H. Morris and the NEON and GBOV networks for the measurements collected in the field and used to generate GBOV products. We also want to thank Alexander Knohl, Lukas Siebicke, Katherine N. Suding, Will Woodgate and Ernesto Lopez-Baeza and the FLUXNET, TREN and UVEG networks for the measurements collected in the field and used to generate GBOV products. We want to thank Aryeh Feinberg for feedback on the earlier version of the reprocessed LAI data. We would also like to thank two anonymous reviewers for providing such valuable comments.

Conflicts of Interest

The authors declare no conflict of interest.

References

  1. Garrigues, S.; Lacaze, R.; Baret, F.; Morisette, J.T.; Weiss, M.; Nickeson, J.E.; Fernandes, R.; Plummer, S.; Shabanov, N.V.; Myneni, R.B.; et al. Validation and intercomparison of global Leaf Area Index products derived from remote sensing data. J. Geophys. Res. Biogeosci. 2008, 113, 2–9. [Google Scholar] [CrossRef]
  2. Baret, F.; Weiss, M.; Lacaze, R.; Camacho, F.; Makhmara, H.; Pacholcyzk, P.; Smets, B. GEOV1: LAI and FAPAR essential climate variables and FCOVER global time series capitalizing over existing products. Part1: Principles of development and production. Remote Sens. Environ. 2013, 137, 299–309. [Google Scholar] [CrossRef]
  3. Verger, A.; Baret, F.; Weiss, M. Near Real-Time Vegetation Monitoring at Global Scale. IEEE J. Sel. Top. Appl. Earth Obs. Remote Sens. 2014, 7, 3473–3481. [Google Scholar] [CrossRef]
  4. Knyazikhin, Y.; Martonchik, J.V.; Myneni, R.B.; Diner, D.J.; Running, S.W. Synergistic algorithm for estimating vegetation canopy leaf area index and fraction of absorbed photosynthetically active radiation from MODIS and MISR data. J. Geophys. Res. Atmos. 1998, 103, 32257–32275. [Google Scholar] [CrossRef]
  5. Myneni, R.B.; Hoffman, S.; Knyazikhin, Y.; Privette, J.L.; Glassy, J.; Tian, Y.; Wang, Y.; Song, X.; Zhang, Y.; Smith, G.R.; et al. Global products of vegetation leaf area and fraction absorbed PAR from year one of MODIS data. Remote Sens. Environ. 2002, 83, 214–231. [Google Scholar] [CrossRef]
  6. Yan, K.; Park, T.; Yan, G.; Chen, C.; Yang, B.; Liu, Z.; Nemani, R.R.; Knyazikhin, Y.; Myneni, R.B. Evaluation of MODIS LAI/FPAR Product Collection 6. Part 1: Consistency and Improvements. Remote Sens. 2016, 8, 359. [Google Scholar] [CrossRef]
  7. Yang, W.; Tan, B.; Huang, D.; Rautiainen, M.; Shabanov, N.V.; Wang, Y.; Privette, J.L.; Huemmrich, K.F.; Fensholt, R.; Sandholt, I.; et al. MODIS leaf area index products: From validation to algorithm improvement. IEEE Trans. Geosci. Remote Sens. 2006, 44, 1885–1898. [Google Scholar] [CrossRef]
  8. Xiao, Z.; Liang, S.; Wang, J.; Xiang, Y.; Zhao, X.; Song, J. Long-Time-Series Global Land Surface Satellite Leaf Area Index Product Derived From MODIS and AVHRR Surface Reflectance. IEEE Trans. Geosci. Remote Sens. 2016, 54, 5301–5318. [Google Scholar] [CrossRef]
  9. Ma, H.; Liang, S. Development of the GLASS 250-m leaf area index product (version 6) from MODIS data using the bidirectional LSTM deep learning model. Remote Sens. Environ. 2022, 273, 112985. [Google Scholar] [CrossRef]
  10. Liu, Y.; Liu, R.; Chen, J.M. Retrospective retrieval of long-term consistent global leaf area index (1981–2011) from combined AVHRR and MODIS data. J. Geophys. Res. Biogeosci. 2012, 117, 1–14. [Google Scholar] [CrossRef]
  11. Zhu, Z.; Bi, J.; Pan, Y.; Ganguly, S.; Anav, A.; Xu, L.; Samanta, A.; Piao, S.; Nemani, R.R.; Myneni, R.B. Global Data Sets of Vegetation Leaf Area Index (LAI)3g and Fraction of Photosynthetically Active Radiation (FPAR)3g Derived from Global Inventory Modeling and Mapping Studies (GIMMS) Normalized Difference Vegetation Index (NDVI3g) for the Period 1981 to 2011. Remote Sens. 2013, 5, 927–948. [Google Scholar] [CrossRef]
  12. Claverie, M.; Matthews, J.L.; Vermote, E.F.; Justice, C.O. A 30+ Year AVHRR LAI and FAPAR Climate Data Record: Algorithm Description and Validation. Remote Sens. 2016, 8, 263. [Google Scholar] [CrossRef]
  13. Camacho, F.; Cernicharo, J.; Lacaze, R.; Baret, F.; Weiss, M. GEOV1: LAI, FAPAR essential climate variables and FCOVER global time series capitalizing over existing products. Part 2: Validation and intercomparison with reference products. Remote Sens. Environ. 2013, 137, 310–329. [Google Scholar] [CrossRef]
  14. Pisek, J.; Chen, J.M. Comparison and validation of MODIS and VEGETATION global LAI products over four BigFoot sites in North America. Remote Sens. Environ. 2007, 109, 81–94. [Google Scholar] [CrossRef]
  15. Weiss, M.; Baret, F.; Garrigues, S.; Lacaze, R. LAI and fAPAR CYCLOPES global products derived from VEGETATION. Part 2: Validation and comparison with MODIS collection 4 products. Remote Sens. Environ. 2007, 110, 317–331. [Google Scholar] [CrossRef]
  16. Fang, H.; Wei, S.; Liang, S. Validation of MODIS and CYCLOPES LAI products using global field measurement data. Remote Sens. Environ. 2012, 119, 43–54. [Google Scholar] [CrossRef]
  17. Huemmrich, K.F.; Privette, J.L.; Mukelabai, M.; Myneni, R.B.; Knyazikhin, Y. Time-series validation of MODIS land biophysical products in a Kalahari woodland, Africa. Int. J. Remote Sens. 2005, 26, 4381–4398. [Google Scholar] [CrossRef]
  18. Yan, K.; Park, T.; Yan, G.; Liu, Z.; Yang, B.; Chen, C.; Nemani, R.R.; Knyazikhin, Y.; Myneni, R.B. Evaluation of MODIS LAI/FPAR Product Collection 6. Part 2: Validation and Intercomparison. Remote Sens. 2016, 8, 460. [Google Scholar] [CrossRef]
  19. Fang, H.; Jiang, C.; Li, W.; Wei, S.; Baret, F.; Chen, J.M.; Garcia-Haro, J.; Liang, S.; Liu, R.; Myneni, R.B.; et al. Characterization and intercomparison of global moderate resolution leaf area index (LAI) products: Analysis of climatologies and theoretical uncertainties. J. Geophys. Res. Biogeosci. 2013, 118, 529–548. [Google Scholar] [CrossRef]
  20. Chen, C.; Park, T.; Wang, X.; Piao, S.; Xu, B.; Chaturvedi, R.K.; Fuchs, R.; Brovkin, V.; Ciais, P.; Fensholt, R.; et al. China and India lead in greening of the world through land-use management. Nat. Sustain. 2019, 2, 122–129. [Google Scholar] [CrossRef]
  21. Tang, X.; Wang, Z.; Xie, J.; Liu, D.; Desai, A.R.; Jia, M.; Dong, Z.; Liu, X.; Liu, B. Monitoring the seasonal and interannual variation of the carbon sequestration in a temperate deciduous forest with MODIS time series data. For. Ecol. Manag. 2013, 306, 150–160. [Google Scholar] [CrossRef]
  22. Xie, X.; He, B.; Guo, L.; Huang, L.; Hao, X.; Zhang, Y.; Liu, X.; Tang, R.; Wang, S. Revisiting dry season vegetation dynamics in the Amazon rainforest using different satellite vegetation datasets. Agric. For. Meteorol. 2022, 312, 108704. [Google Scholar] [CrossRef]
  23. Fang, H.; Liang, S.; Hoogenboom, G. Integration of MODIS LAI and vegetation index products with the CSM–CERES–Maize model for corn yield estimation. Int. J. Remote Sens. 2011, 32, 1039–1065. [Google Scholar] [CrossRef]
  24. Kala, J.; Decker, M.; Exbrayat, J.-F.; Pitman, A.J.; Carouge, C.; Evans, J.P.; Abramowitz, G.; Mocko, D. Influence of Leaf Area Index Prescriptions on Simulations of Heat, Moisture, and Carbon Fluxes. J. Hydrometeorol. 2014, 15, 489–503. [Google Scholar] [CrossRef]
  25. Leuning, R.; Zhang, Y.Q.; Rajaud, A.; Cleugh, H.; Tu, K. A simple surface conductance model to estimate regional evaporation using MODIS leaf area index and the Penman-Monteith equation. Water Resour. Res. 2008, 44, 10. [Google Scholar] [CrossRef]
  26. Xie, X.; Li, A.; Jin, H.; Tan, J.; Wang, C.; Lei, G.; Zhang, Z.; Bian, J.; Nan, X. Assessment of five satellite-derived LAI datasets for GPP estimations through ecosystem models. Sci. Total Environ. 2019, 690, 1120–1130. [Google Scholar] [CrossRef]
  27. Gao, F.; Anderson, M.C.; Kustas, W.P.; Houborg, R. Retrieving Leaf Area Index From Landsat Using MODIS LAI Products and Field Measurements. IEEE Geosci. Remote Sens. Lett. 2014, 11, 773–777. [Google Scholar] [CrossRef]
  28. Houborg, R.; McCabe, M.F.; Gao, F. A Spatio-Temporal Enhancement Method for medium resolution LAI (STEM-LAI). Int. J. Appl. Earth Obs. Geoinform. 2016, 47, 15–29. [Google Scholar] [CrossRef]
  29. Chakroun, H.; Mouillot, F.; Nasr, Z.; Nouri, M.; Ennajah, A.; Ourcival, J.M. Performance of LAI-MODIS and the influence on drought simulation in a Mediterranean forest. Ecohydrology 2014, 7, 1014–1028. [Google Scholar] [CrossRef]
  30. Dhorde, A.G.; Patel, N.R. Spatio-temporal variation in terminal drought over western India using dryness index derived from long-term MODIS data. Ecol. Inform. 2016, 32, 28–38. [Google Scholar] [CrossRef]
  31. Mariano, D.A.; dos Santos, C.A.C.; Wardlow, B.D.; Anderson, M.C.; Schiltmeyer, A.V.; Tadesse, T.; Svoboda, M.D. Use of remote sensing indicators to assess effects of drought and human-induced land degradation on ecosystem health in Northeastern Brazil. Remote Sens. Environ. 2018, 213, 129–143. [Google Scholar] [CrossRef]
  32. Borak, J.S.; Jasinski, M.F. Effective interpolation of incomplete satellite-derived leaf-area index time series for the continental United States. Agric. For. Meteorol. 2009, 149, 320–332. [Google Scholar] [CrossRef]
  33. Fang, H.; Liang, S.; Townshend, J.R.; Dickinson, R.E. Spatially and temporally continuous LAI data sets based on an integrated filtering method: Examples from North America. Remote Sens. Environ. 2008, 112, 75–93. [Google Scholar] [CrossRef]
  34. Gao, F.; Morisette, J.T.; Wolfe, R.E.; Ederer, G.; Pedelty, J.; Masuoka, E.; Myneni, R.; Tan, B.; Nightingale, J. An Algorithm to Produce Temporally and Spatially Continuous MODIS-LAI Time Series. IEEE Geosci. Remote Sens. Lett. 2008, 5, 60–64. [Google Scholar] [CrossRef]
  35. Lawrence, P.J.; Chase, T.N. Representing a new MODIS consistent land surface in the Community Land Model (CLM 3.0). J. Geophys. Res. Biogeosci. 2007, 112, G01023. [Google Scholar] [CrossRef]
  36. Chen, J.; Zhu, X.; Vogelmann, J.E.; Gao, F.; Jin, S. A simple and effective method for filling gaps in Landsat ETM+ SLC-off images. Remote Sens. Environ. 2011, 115, 1053–1064. [Google Scholar] [CrossRef]
  37. Gu, J.; Li, X.; Huang, C.; Okin, G.S. A simplified data assimilation method for reconstructing time-series MODIS NDVI data. Adv. Space Res. 2009, 44, 501–509. [Google Scholar] [CrossRef]
  38. Holben, B.N. Characteristics of maximum-value composite images from temporal AVHRR data. Int. J. Remote Sens. 1986, 7, 1417–1434. [Google Scholar] [CrossRef]
  39. Jönsson, P.; Eklundh, L. TIMESAT—A program for analyzing time-series of satellite sensor data. Comput. Geosci. 2004, 30, 833–845. [Google Scholar] [CrossRef]
  40. Viovy, N.; Arino, O.; Belward, A.S. The Best Index Slope Extraction (BISE): A method for reducing noise in NDVI time-series. Int. J. Remote Sens. 1992, 13, 1585–1590. [Google Scholar] [CrossRef]
  41. Vorobiova, N.; Chernov, A. Curve fitting of MODIS NDVI time series in the task of early crops identification by satellite images. Procedia Eng. 2017, 201, 184–195. [Google Scholar] [CrossRef]
  42. Bhattacharjee, S.; Mitra, P.; Ghosh, S.K. Spatial Interpolation to Predict Missing Attributes in GIS Using Semantic Kriging. IEEE Trans. Geosci. Remote Sens. 2014, 52, 4771–4780. [Google Scholar] [CrossRef]
  43. Guillemot, C.; Le Meur, O. Image Inpainting: Overview and Recent Advances. IEEE Signal Process. Mag. 2014, 31, 127–144. [Google Scholar] [CrossRef]
  44. Maalouf, A.; Carre, P.; Augereau, B.; Fernandez-Maloigne, C. A Bandelet-Based Inpainting Technique for Clouds Removal From Remotely Sensed Images. IEEE Trans. Geosci. Remote Sens. 2009, 47, 2363–2371. [Google Scholar] [CrossRef]
  45. Shen, H.; Li, X.; Cheng, Q.; Zeng, C.; Yang, G.; Li, H.; Zhang, L. Missing Information Reconstruction of Remote Sensing Data: A Technical Review. IEEE Geosci. Remote Sens. Mag. 2015, 3, 61–85. [Google Scholar] [CrossRef]
  46. Wang, L.; Qu, J.J.; Xiong, X.; Hao, X.; Xie, Y.; Che, N. A New Method for Retrieving Band 6 of Aqua MODIS. IEEE Geosci. Remote Sens. Lett. 2006, 3, 267–270. [Google Scholar] [CrossRef]
  47. Rakwatin, P.; Takeuchi, W.; Yasuoka, Y. Restoration of Aqua MODIS Band 6 Using Histogram Matching and Local Least Squares Fitting. IEEE Trans. Geosci. Remote Sens. 2009, 47, 613–627. [Google Scholar] [CrossRef]
  48. Li, X.; Shen, H.; Zhang, L.; Li, H. Sparse-based reconstruction of missing information in remote sensing images from spectral/temporal complementary information. ISPRS J. Photogramm. Remote Sens. 2015, 106, 1–15. [Google Scholar] [CrossRef]
  49. Chu, D.; Shen, H.; Guan, X.; Chen, J.M.; Li, X.; Li, J.; Zhang, L. Long time-series NDVI reconstruction in cloud-prone regions via spatio-temporal tensor completion. Remote Sens. Environ. 2021, 264, 112632. [Google Scholar] [CrossRef]
  50. Arslan, N.; Sekertekin, A. Application of Long Short-Term Memory neural network model for the reconstruction of MODIS Land Surface Temperature images. J. Atmos. Sol.-Terr. Phys. 2019, 194, 105100. [Google Scholar] [CrossRef]
  51. Xiao, Z.; Liang, S.; Wang, J.; Chen, P.; Yin, X.; Zhang, L.; Song, J. Use of General Regression Neural Networks for Generating the GLASS Leaf Area Index Product From Time-Series MODIS Surface Reflectance. IEEE Trans. Geosci. Remote Sens. 2014, 52, 209–223. [Google Scholar] [CrossRef]
  52. Yu, W.; Li, J.; Liu, Q.; Zhao, J.; Dong, Y.; Zhu, X.; Lin, S.; Zhang, H.; Zhang, Z. Gap Filling for Historical Landsat Ndvi Time Series by Integrating Climate Data. Remote Sens. 2021, 13, 484. [Google Scholar] [CrossRef]
  53. Yuan, Q.; Shen, H.; Li, T.; Li, Z.; Li, S.; Jiang, Y.; Xu, H.; Tan, W.; Yang, Q.; Wang, J.; et al. Deep learning in environmental remote sensing: Achievements and challenges. Remote Sens. Environ. 2020, 241, 111716. [Google Scholar] [CrossRef]
  54. Li, S.; Xu, L.; Jing, Y.; Yin, H.; Li, X.; Guan, X. High-quality vegetation index product generation: A review of NDVI time series reconstruction techniques. Int. J. Appl. Earth Obs. Geoinform. 2021, 105, 102640. [Google Scholar] [CrossRef]
  55. Yuan, H.; Dai, Y.; Xiao, Z.; Ji, D.; Shangguan, W. Reprocessing the MODIS Leaf Area Index products for land surface and climate modelling. Remote Sens. Environ. 2011, 115, 1171–1187. [Google Scholar] [CrossRef]
  56. Savitzky, A.; Golay, M.J.E. Smoothing and Differentiation of Data by Simplified Least Squares Procedures. Anal. Chem. 1964, 36, 1627–1639. [Google Scholar] [CrossRef]
  57. Fang, H.; Liang, S.; Kim, H.-Y.; Townshend, J.R.; Schaaf, C.L.; Strahler, A.H.; Dickinson, R.E. Developing a spatially continuous 1 km surface albedo data set over North America from Terra MODIS products. J. Geophys. Res. Atmos. 2007, 112. [Google Scholar] [CrossRef]
  58. Decker, M.; Or, D.; Pitman, A.; Ukkola, A. New turbulent resistance parameterization for soil evaporation based on a pore-scale model: Impact on surface fluxes in CABLE: Cable soil evaporation parameterization. J. Adv. Model. Earth Syst. 2017, 9, 220–238. [Google Scholar] [CrossRef]
  59. Falk, M.; Pyles, R.D.; Ustin, S.L.; Paw, U.K.T.; Xu, L.; Whiting, M.L.; Sanden, B.L.; Brown, P.H. Evaluated Crop Evapotranspiration over a Region of Irrigated Orchards with the Improved ACASA–WRF Model. J. Hydrometeorol. 2014, 15, 744–758. [Google Scholar] [CrossRef]
  60. Ke, Y.; Leung, L.R.; Huang, M.; Coleman, A.M.; Li, H.; Wigmosta, M.S. Development of high resolution land surface parameters for the Community Land Model. Geosci. Model Dev. 2012, 5, 1341–1362. [Google Scholar] [CrossRef]
  61. Niu, G.-Y.; Fang, Y.-H.; Chang, L.-L.; Jin, J.; Yuan, H.; Zeng, X. Enhancing the Noah-MP Ecosystem Response to Droughts With an Explicit Representation of Plant Water Storage Supplied by Dynamic Root Water Uptake. J. Adv. Model. Earth Syst. 2020, 12, e2020MS002062. [Google Scholar] [CrossRef]
  62. Sindelarova, K.; Markova, J.; Simpson, D.; Huszar, P.; Karlicky, J.; Darras, S.; Granier, C. High-resolution biogenic global emission inventory for the time period 2000–2019 for air quality modelling. Earth Syst. Sci. Data 2022, 14, 251–270. [Google Scholar] [CrossRef]
  63. Myneni, R.; Knyazikhin, Y.; Park, T. MODIS/Terra + Aqua Leaf Area Index/FPAR 8-Day L4 Global 500 m SIN Grid V061, NASA EOSDIS Land Processes DAAC [Data Set]. 2021. Available online: https://doi.org/10.5067/MODIS/MCD15A2H.061 (accessed on 20 March 2023).
  64. Myneni, R. MODIS Collection 6.1 (C6.1) LAI/FPAR Product User’s Guide. 2020. Available online: https://Modis-Land.Gsfc.Nasa.Gov/Pdf/MOD15_C61_UserGuide_April2020.Pdf (accessed on 20 March 2023).
  65. Friedl, M.; Sulla-Menashe, D. MODIS/Terra + Aqua Land Cover Type Yearly L3 Global 500 m SIN Grid V061 [Data Set]. NASA EOSDIS Land Processes DAAC. 2022. Available online: https://doi.org/10.5067/MODIS/MCD12Q1.061 (accessed on 20 March 2023).
  66. Morisette, J.T.; Baret, F.; Privette, J.L.; Myneni, R.B.; Nickeson, J.E.; Garrigues, S.; Shabanov, N.V.; Weiss, M.; Fernandes, R.A.; Leblanc, S.G.; et al. Validation of global moderate-resolution LAI products: A framework proposed within the CEOS land product validation subgroup. IEEE Trans. Geosci. Remote Sens. 2006, 44, 1804–1817. [Google Scholar] [CrossRef]
  67. Cochran, W.G. Sampling Techniques, 3rd ed.; Wiley & Sons: Hoboken, NJ, USA, 1977; ISBN 9780471162407. [Google Scholar]
  68. Cohen, W.B.; Maiersperger, T.K.; Pflugmacher, D. BigFoot Land Cover Surfaces for North and South American Sites, 2000–2003; Oak Ridge National Laboratory Distributed Active Archive Center: Oak Ridge, TN, USA, 2006. [Google Scholar] [CrossRef]
  69. Fuster, B.; Sánchez-Zapero, J.; Camacho, F.; García-Santos, V.; Verger, A.; Lacaze, R.; Weiss, M.; Baret, F.; Smets, B. Quality Assessment of PROBA-V LAI, fAPAR and fCOVER Collection 300 m Products of Copernicus Global Land Service. Remote Sens. 2020, 12, 1017. [Google Scholar] [CrossRef]
  70. Wang, Y.; Woodcock, C.E.; Buermann, W.; Stenberg, P.; Voipio, P.; Smolander, H.; Häme, T.; Tian, Y.; Hu, J.; Knyazikhin, Y.; et al. Evaluation of the MODIS LAI algorithm at a coniferous forest site in Finland. Remote Sens. Environ. 2004, 91, 114–127. [Google Scholar] [CrossRef]
  71. Anderson, M.C.; Neale, C.M.U.; Li, F.; Norman, J.M.; Kustas, W.P.; Jayanthi, H.; Chavez, J. Upscaling ground observations of vegetation water content, canopy height, and leaf area index during SMEX02 using aircraft and Landsat imagery. Remote Sens. Environ. 2004, 92, 447–464. [Google Scholar] [CrossRef]
  72. Bai, G.; Dash, J.; Brown, L.; Meier, C.; Lerebourg, C.; Ronco, E.; Lamquin, N.; Bruniquel, V.; Clerici, M.; Gobron, N. GBOV (Ground-Based Observation for Validation): A Copernicus Service for Validation of Vegetation Land Products. In Proceedings of the IGARSS 2019–2019 IEEE International Geoscience and Remote Sensing Symposium, Yokohama, Japan, 28 July–2 August 2019; pp. 4592–4594. [Google Scholar]
  73. Jönsson, P.; Eklundh, L. Seasonality extraction by function fitting to time-series of satellite sensor data. IEEE Trans. Geosci. Remote Sens. 2002, 40, 1824–1832. [Google Scholar] [CrossRef]
  74. Brown, L.A.; Meier, C.; Morris, H.; Pastor-Guzman, J.; Bai, G.; Lerebourg, C.; Gobron, N.; Lanconelli, C.; Clerici, M.; Dash, J. Evaluation of global leaf area index and fraction of absorbed photosynthetically active radiation products over North America using Copernicus Ground Based Observations for Validation data. Remote Sens. Environ. 2020, 247, 111935. [Google Scholar] [CrossRef]
  75. Cao, R.; Chen, Y.; Shen, M.; Chen, J.; Zhou, J.; Wang, C.; Yang, W. A simple method to improve the quality of NDVI time-series data by integrating spatiotemporal information with the Savitzky-Golay filter. Remote Sens. Environ. 2018, 217, 244–257. [Google Scholar] [CrossRef]
  76. Prentice, I.C.; Meng, T.; Wang, H.; Harrison, S.P.; Ni, J.; Wang, G. Evidence of a universal scaling relationship for leaf CO 2 drawdown along an aridity gradient. New Phytol. 2011, 190, 169–180. [Google Scholar] [CrossRef]
  77. Harris, I.; Osborn, T.J.; Jones, P.; Lister, D. Version 4 of the CRU TS monthly high-resolution gridded multivariate climate dataset. Sci. Data 2020, 7, 1–18. [Google Scholar] [CrossRef] [PubMed]
  78. Campos-Taberner, M.; García-Haro, F.J.; Busetto, L.; Ranghetti, L.; Martínez, B.; Gilabert, M.A.; Camps-Valls, G.; Camacho, F.; Boschetti, M. A Critical Comparison of Remote Sensing Leaf Area Index Estimates over Rice-Cultivated Areas: From Sentinel-2 and Landsat-7/8 to MODIS, GEOV1 and EUMETSAT Polar System. Remote Sens. 2018, 10, 763. [Google Scholar] [CrossRef]
  79. Liu, Y.; Xiao, J.; Ju, W.; Zhu, G.; Wu, X.; Fan, W.; Li, D.; Zhou, Y. Satellite-derived LAI products exhibit large discrepancies and can lead to substantial uncertainty in simulated carbon and water fluxes. Remote Sens. Environ. 2018, 206, 174–188. [Google Scholar] [CrossRef]
  80. Myneni, R.B.; Yang, W.; Nemani, R.R.; Huete, A.R.; Dickinson, R.E.; Knyazikhin, Y.; Didan, K.; Fu, R.; Negrón Juárez, R.I.; Saatchi, S.S.; et al. Large seasonal swings in leaf area of Amazon rainforests. Proc. Natl. Acad. Sci. USA 2007, 104, 4820–4823. [Google Scholar] [CrossRef] [PubMed]
  81. Nie, W.; Kumar, S.V.; Arsenault, K.R.; Peters-Lidard, C.D.; Mladenova, I.E.; Bergaoui, K.; Hazra, A.; Zaitchik, B.F.; Mahanama, S.P.; McDonnell, R.; et al. Towards effective drought monitoring in the Middle East and North Africa (MENA) region: Implications from assimilating leaf area index and soil moisture into the Noah-MP land surface model for Morocco. Hydrol. Earth Syst. Sci. 2022, 26, 2365–2386. [Google Scholar] [CrossRef]
  82. Wang, J.; Xiao, X.; Bajgain, R.; Starks, P.; Steiner, J.; Doughty, R.B.; Chang, Q. Estimating leaf area index and aboveground biomass of grazing pastures using Sentinel-1, Sentinel-2 and Landsat images. ISPRS J. Photogramm. Remote Sens. 2019, 154, 189–201. [Google Scholar] [CrossRef]
  83. Xu, B.; Li, J.; Park, T.; Liu, Q.; Zeng, Y.; Yin, G.; Zhao, J.; Fan, W.; Yang, L.; Knyazikhin, Y.; et al. An integrated method for validating long-term leaf area index products using global networks of site-based measurements. Remote Sens. Environ. 2018, 209, 134–151. [Google Scholar] [CrossRef]
  84. Fernandes, R.; Butson, C.; Leblanc, S.; Latifovic, R. Landsat-5 TM and Landsat-7 ETM+ based accuracy assessment of leaf area index products for Canada derived from SPOT-4 VEGETATION data. Can. J. Remote Sens. 2003, 29, 241–258. [Google Scholar] [CrossRef]
  85. Chen, J.M.; Rich, P.M.; Gower, S.T.; Norman, J.M.; Plummer, S. Leaf area index of boreal forests: Theory, techniques, and measurements. J. Geophys. Res. Atmos. 1997, 102, 29429–29443. [Google Scholar] [CrossRef]
  86. Chen, J.M.; Govind, A.; Sonnentag, O.; Zhang, Y.; Barr, A.; Amiro, B. Leaf area index measurements at Fluxnet-Canada forest sites. Agric. For. Meteorol. 2006, 140, 257–268. [Google Scholar] [CrossRef]
  87. Gower, S.T.; Kucharik, C.J.; Norman, J.M. Direct and Indirect Estimation of Leaf Area Index, fAPAR, and Net Primary Production of Terrestrial Ecosystems. Remote Sens. Environ. 1999, 70, 29–51. [Google Scholar] [CrossRef]
  88. Weiss, M.; Baret, F.; Smith, G.J.; Jonckheere, I.; Coppin, P. Review of methods for in situ leaf area index (LAI) determination: Part II. Estimation of LAI, errors and sampling. Agric. For. Meteorol. 2004, 121, 37–53. [Google Scholar] [CrossRef]
  89. Iiames, J.S.; Congalton, R.G.; Lewis, T.E.; Pilant, A.N. Uncertainty Analysis in the Creation of a Fine-Resolution Leaf Area Index (LAI) Reference Map for Validation of Moderate Resolution LAI Products. Remote Sens. 2015, 7, 1397–1421. [Google Scholar] [CrossRef]
  90. Jiang, C.; Ryu, Y.; Fang, H.; Myneni, R.; Claverie, M.; Zhu, Z. Inconsistencies of interannual variability and trends in long-term satellite leaf area index products. Glob. Chang. Biol. 2017, 23, 4133–4146. [Google Scholar] [CrossRef] [PubMed]
  91. Piao, S.; Wang, X.; Park, T.; Chen, C.; Lian, X.; He, Y.; Bjerke, J.W.; Chen, A.; Ciais, P.; Tømmervik, H.; et al. Characteristics, drivers and feedbacks of global greening. Nat. Rev. Earth Environ. 2020, 1, 14–27. [Google Scholar] [CrossRef]
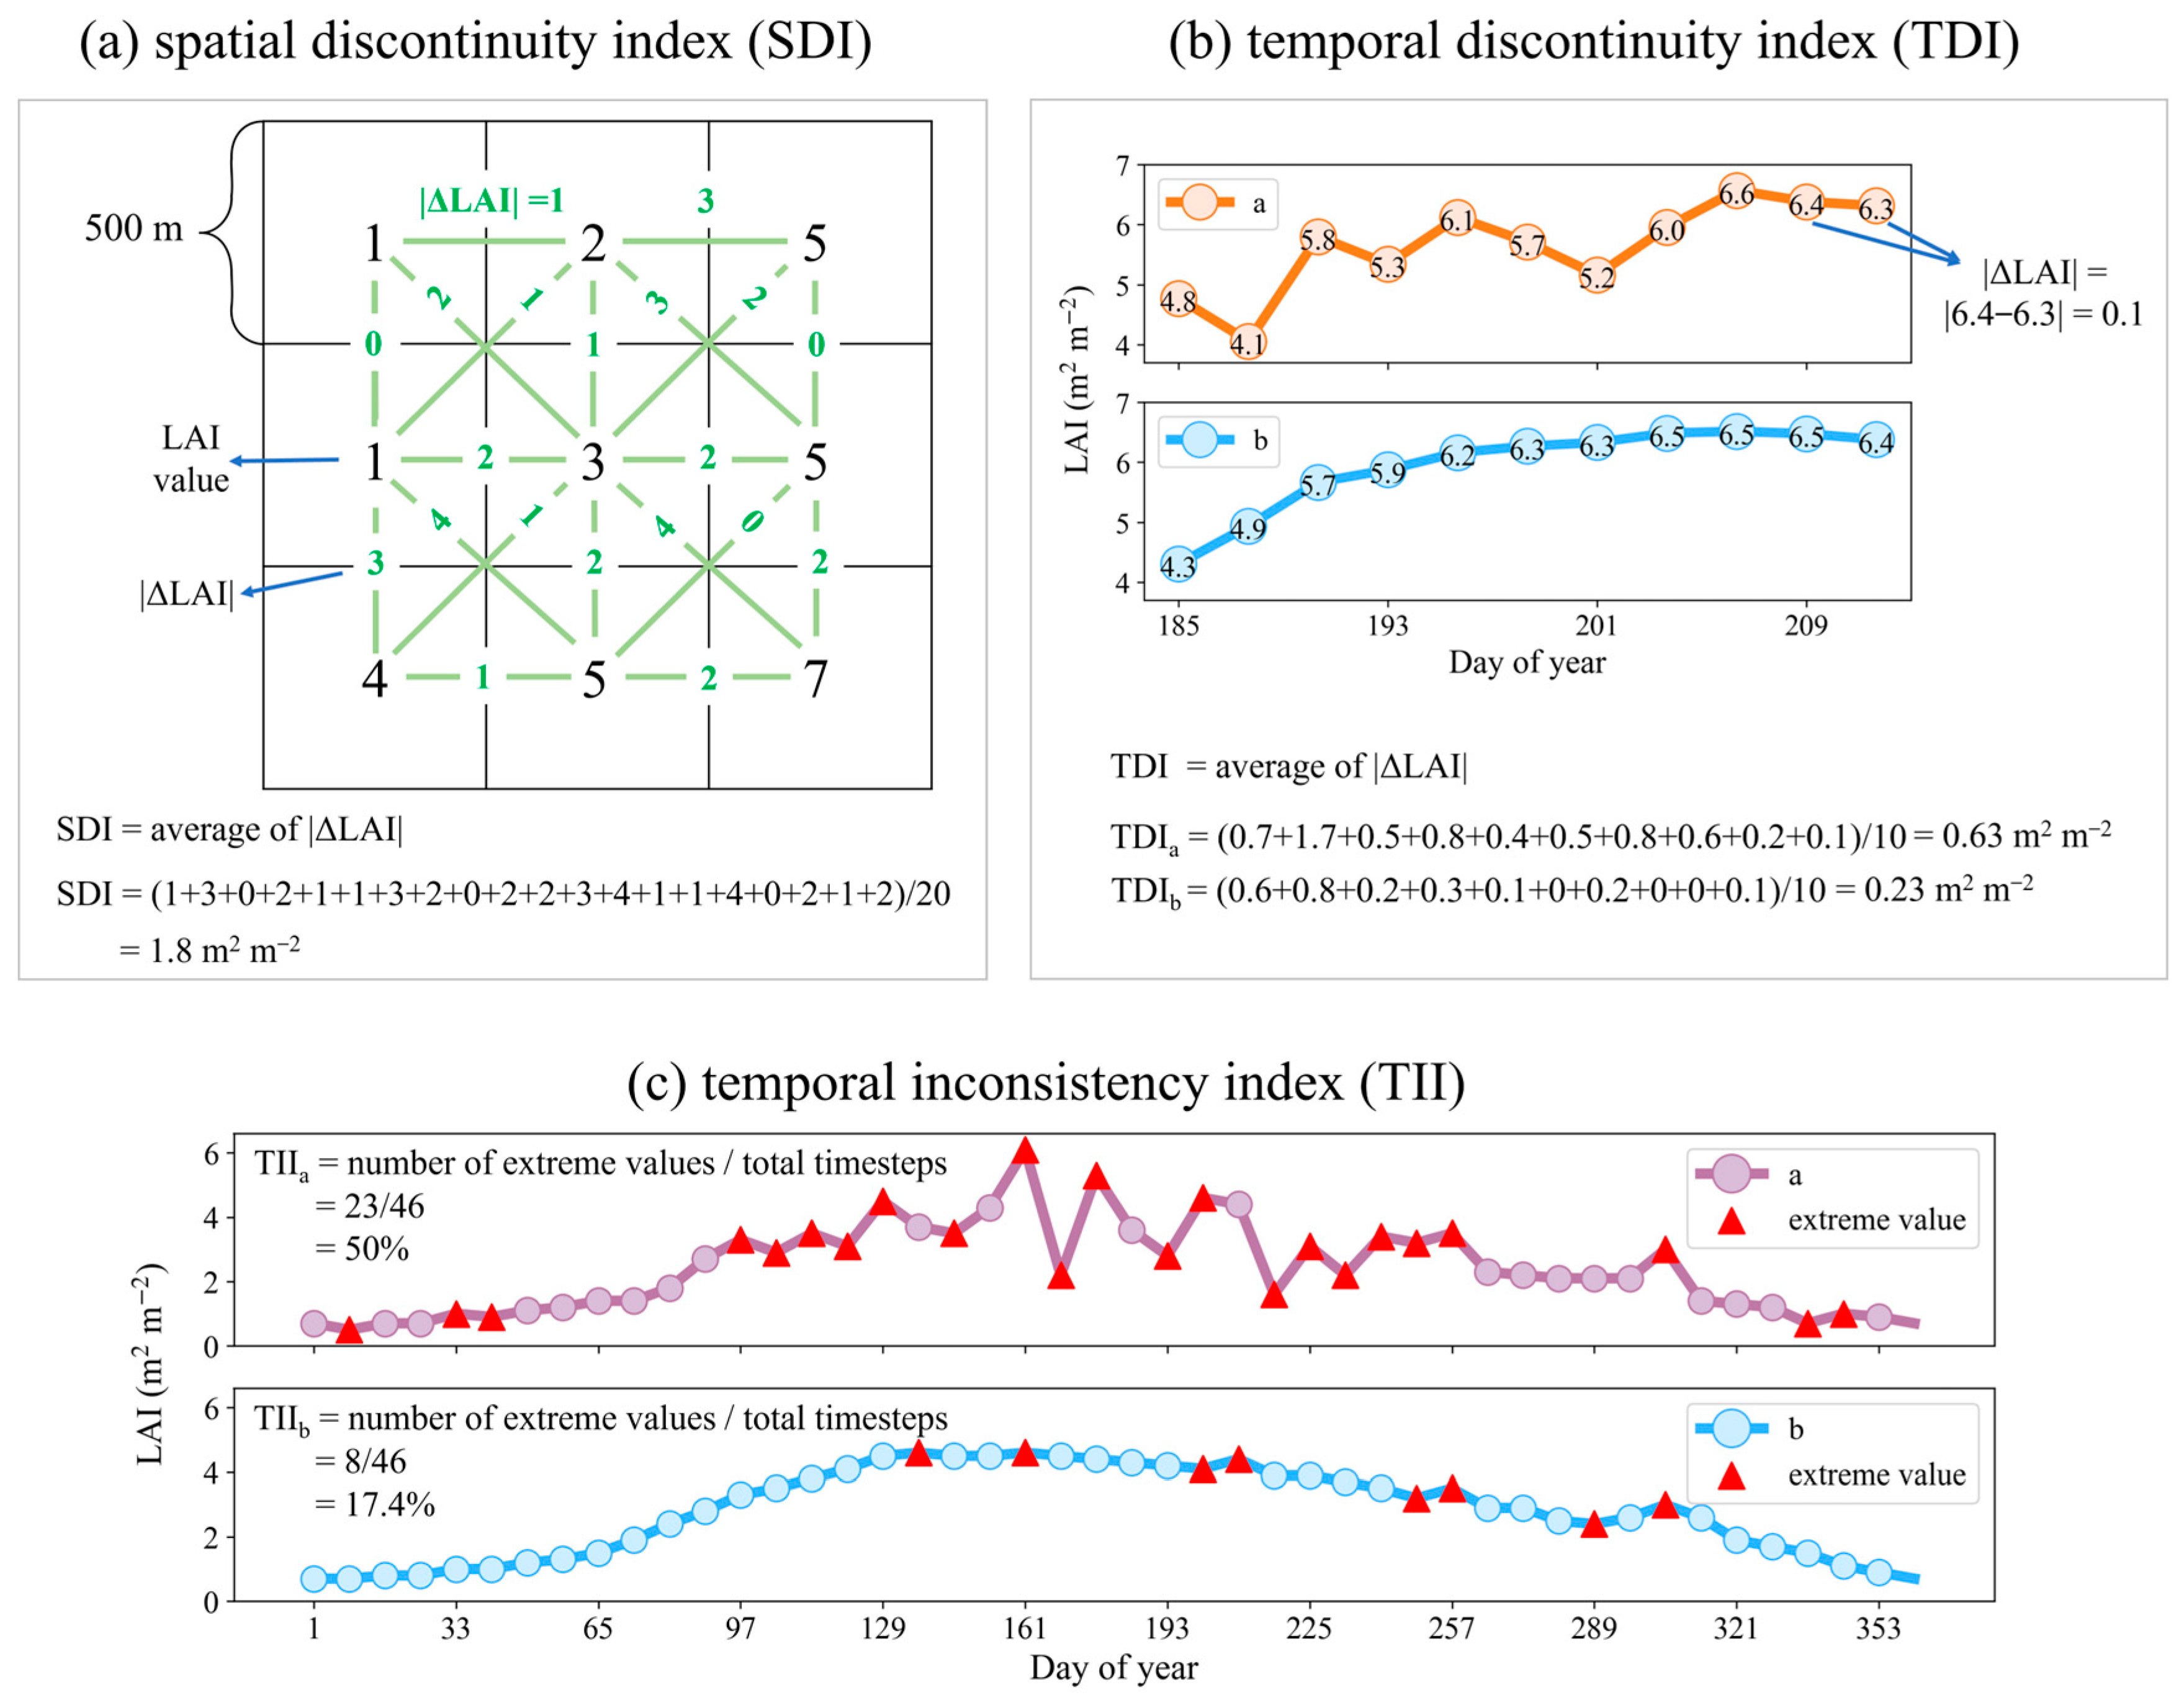
Figure 1. Schematic diagrams for calculating (a) spatial discontinuity index (SDI), (b) temporal discontinuity index (TDI), and (c) temporal inconsistency index (TII). | Δ LAI | represents the absolute difference between the adjacent LAI values. TDIs and TIIs of different time series were calculated as an example to exhibit different extents of (b) temporal discontinuity, and (c) temporal inconsistency.
Remotesensing 15 01780 g001
Figure 2. Validation of MODIS C6.1 LAI products and reprocessed LAI data against (ac) reference maps used in the validation of MOD C5 LAI [55], (df) combined LAI reference maps (VALERI, BigFoot, Boston University, SMEX02, and ImagineS datasets), and (gi) GBOV LAI reference maps. The shaded area stands for the uncertainty agreement ratio [1,74], and the distance between the diagonal and the upper or lower bound of the shaded area is equal to the greater 20% of the reference map value and 1 m2 m−2. “MD” is the average difference between the LAI values shown on the y and x axes.
Remotesensing 15 01780 g002
Figure 3. Time series plot of spatial mean MCD15A2H C6.1 LAI and reprocessed MODIS LAI within the reference map extent. MOD15A2H C6.1 LAI was used for the time prior to 26 June 2002, in the cases of the reference map data existing. QC information that indicates retrieval algorithms was plotted above the time series, and corresponded with the five categories listed in Table 1.
Remotesensing 15 01780 g003
Figure 4. Spatial and temporal comparisons between MCD15A2H C6.1 and reprocessed MODIS LAI in tile h19v08. The location of the center of this tile (1200 × 1200 km2) is 15.055°E, 5.002°N. The first column’s first five subplots show the MODIS LAI for the five 8-day compositing periods that are labeled to the figure’s left. The second column’s first five frames refer to reprocessed MODIS LAI. Information on quality control is divided into five categories, as listed in Table 1, and displayed in the “QC” column. The last two columns display, respectively, the spatial discontinuity index (SDI) of MODIS and reprocessed MODIS. The last row displays the temporal discontinuity index (TDI) of MODIS and reprocessed MODIS of the above five 8-day compositing periods.
Remotesensing 15 01780 g004
Figure 5. 14-year (2003–2016) means of spatial discontinuity index (SDI) maps of (a) MCD15A2H C6.1, (b) reprocessed MODIS, (c) MOD15A2H C6.1, (d) MOD15A2H C5 LAI products, and (e) the numbers of domains in SDI maps over different intervals.
Remotesensing 15 01780 g005
Figure 6. Temporal discontinuity index (TDI) maps of (a) MCD15A2H C6.1, (b) reprocessed MODIS, (c) MOD15A2H C6.1, and (d) MOD15A2H C5 LAI products for the 14-year (2013–2016) period, and (e) the numbers of domains in TDI maps over different intervals.
Remotesensing 15 01780 g006
Figure 7. The same as Figure 6 but for temporal inconsistency index (TII).
Remotesensing 15 01780 g007
Figure 8. Linear trends of the growing season mean LAIs of (a) MCD15A2H C6.1, (b) reprocessed MODIS, (c) MOD15A2H C6.1, and (d) their global mean values in 2003–2021. Trends of LAI mean values of all products in (d) are significant (p < 0.05 in the Mann–Kendall test).
Remotesensing 15 01780 g008
Figure 9. Proportion of LAI data retrieved from the main algorithm in 2003–2021 for (a) MOD15A2H C6.1 product, and (b) MCD15A2H C6.1 product.
Remotesensing 15 01780 g009
Figure 10. Difference between reprocessed MODIS LAI and MCD15A2H C6.1 LAI constrained by QC ≤ 2, QC < 32, and QC < 64 in (ac) January, and (df) July of the year 2010.
Remotesensing 15 01780 g010
Figure 11. Difference in temporal mean value between MCD15A2H C6.1 and MOD15A2H C6.1 LAI products at (a) pixel ‘h12v09, x = 1200, y = 1200’ (lat = −4.998, lon = −65.250), and (b) the global scale. The black star in (b) indicates the location of the pixel plotted in (a).
Remotesensing 15 01780 g011
Table 1. Classifications of quality control information of MCD15A2H C6.1 LAI product.
QC ValueMODIS LAI Algorithm
QC ≤ 2Main algorithm used without cloud or saturation
3 ≤ QC < 32Main algorithm used, with cloud or cloud state not defined, no saturation
32 ≤ QC < 64Main algorithm used, with saturation
64 ≤ QC < 128Main algorithm failed, backup algorithm adopted
QC ≥ 128Pixel not produced, no value retrieved
Table 2. Validation metrics of MCD15A2H C6.1 LAI product and reprocessed MODIS.
Reference DatabasesRemote Sensing DataR2RMSEMean DifferenceNumber of Maps
VALERIMODIS0.601.24−0.4722
reprocessed MODIS0.730.97−0.15
BigFootMODIS0.900.42−0.1518
reprocessed MODIS0.940.30−0.01
ImagineSMODIS0.630.890.1843
reprocessed MODIS0.650.900.38
GBOVMODIS0.750.880.182675
reprocessed MODIS0.810.930.47
Disclaimer/Publisher’s Note: The statements, opinions and data contained in all publications are solely those of the individual author(s) and contributor(s) and not of MDPI and/or the editor(s). MDPI and/or the editor(s) disclaim responsibility for any injury to people or property resulting from any ideas, methods, instructions or products referred to in the content.