Abstract
Doppler wind lidar measurements were used for the first time in Romania to analyse the wind and turbulence statistics for a peri-urban site located at Măgurele, southwest of Bucharest. Vertical and scanning measurements between December 2019 and November 2021 were processed using an existing toolbox. The statistics over the two-year period were performed on seasonal and diurnal cycle bases. The analyses showed a diurnal cycle for the horizontal wind speed, with lower values during daytime. In the upper part of the planetary boundary layer (PBL), the wind speed is lowest during the day and highest at night (near surface, the behaviour is reversed). The diurnal cycle has variations during the year (from approximately 500 m during midnight winter to approximately 1250 m during summer noon). The wind direction during autumn shows similarities with the summer season, with prevailing directions from east and northeast. The winter season is characterised by westerly winds. The most variable diurnal wind direction is observed during summer, with nighttime westerly winds and changing directions (from northeast to west) during daytime. The ERA5 reanalysis shows similar patterns for wind speed with Doppler wind lidar (slightly underestimated) and direction. The planetary boundary layer classes over the altitude region analysed shows the predominant convection during daytime and non-turbulent behaviour during nighttime. To a lesser extent, the intermittent turbulent class is observed during the growth and the decay of the mixing layer.
1. Introduction
According to the World Meteorological Organization, several surface variables are essential for understanding Earth’s climate stem: precipitation, pressure, surface radiation budget, temperature, water vapour, and surface wind [1]. Surface wind contributes to, among others, heat and air pollutants transport and is also associated, in the case of extreme wind events, with significant societal and economical impact (e.g., lost of life, damages to infrastructure). Wind is also a key variable for understanding the physical processes in the planetary boundary layer (PBL). Thus, the retrieval of wind speed and direction with high temporal and spatial resolution is of utmost importance. Such wind retrievals can also be used in aviation, meteorology, and the energy sector. High resolution wind data are needed to obtain information regarding on the low-level wind shear and turbulence which are vital information for flight safety, e.g., [2,3]. Vertical profiles of wind speed and direction collected by ground-based instruments (e.g., radar and wind profiles) can be assimilated into numerical weather prediction models (NWP) leading to more accurate forecasts, e.g., [4,5], or for the monitoring and tracking of urban air pollution, e.g., [6,7]. High resolution wind measurements are required in the energy sector for wind power forecast applications, e.g., [8,9].
High-resolution wind measurements can be provided by radiosondes, wind profilers, sodars, and Doppler wind lidars (DWL). Regular radiosondes launches are performed twice a day while the other instruments can be operated continuously. Certain types of wind profiles can provide vertical measurements of wind up to 100 km (e.g., mesosphere–stratosphere–troposphere wind profilers). Sodars and certain type of DWL are restricted to the PBL. Previously, DWLs were used, for example, to determine the mixing layer height (MLH) and to study the characteristics of low level jet (LLJ). Schween et al. [10] performed an inter-comparison of the MLH derived from DWL and ceilometers. The results showed that on average, the aerosol-based retrieval from ceilometers gives higher MLH than the DWL with an overestimation of MLH by about 300 m (600 m) in the morning (late afternoon). The daily maximum MLH derived from ceilometers was larger and occurred later during the day and the average morning growth rates were smaller than those derived from DWL (vertical wind). Moreover, Tuononen et al. [11] made use of DWL and sonic anemometers to investigate the occurrence and characteristics of LLJs and their diurnal and seasonal variations for a site in Finland. Various statistics were calculated based on seasons. The results showed that the long-term mean LLJ frequency of occurrence was 12% while the mean LLJ wind speed was 11.6 m s−1. The vast majority of identified LLJs occurred below 150 m above ground level. Tsiringakis et al. [12] investigated the interactions between LLJ and urban BL using two DWLs and NWPs data. The authors found out that LLJ is influenced by both topography and the urban area and consequently there is an increase in wind shear. Banakh and Smalikho, [13] calculated turbulent kinetic energy, dissipation rate, and integral scale of turbulence at the altitudes of LLJ at Tomsk and Lake Baikal, Russia.
Various classification schemes were developed based on data from DWL to characterise the PBL. Harvey et al. [14] used a vertically pointing DWL and a sonic anemometer to classify the PBL into nine classes. The climatology constructed over three years (2008–2011) of measurements over Chilbolton, UK showed a clear diurnal and seasonal cycles which were dominated by variations in the surface sensible heat flux. The most common PBL types were: stable with clear skies (30%) and unstable well-mixed with no cloud (15.4%). Recently, Manninen et al. [15] developed a methodology for identifying the main sources of turbulent mixing within PBL. This methodology is used in the current study and it is further described in Section 3. Ortiz-Amezcua et al. [16] analysed the wind and turbulence in the urban PBL over a mountain–valley system in Granada, Spain. The study employed the Halo lidar toolbox developed by [15,17]. The results showed a general trend of mean daytime wind from the NW with mean speed around 3–4 m s−1 at low altitudes and 6–10 m s−1 at higher altitudes. During the night, the mean wind was weaker and from SE with similar height dependence. In a similar study, Ortiz-Amezcua et al. [18] studied the dynamics of the PBL over two mid-latitude rural sites located in Southern Spain and northwestern Poland. The statistical analysis of turbulent sources showed a common diurnal cycle for convective mixing at both sites. The nocturnal wind shear driven turbulence showed difference between the two locations.
The present study shows the first results of using DWL to characterise the PBL over a site in southern Romania and thus contributing to the study of wind and turbulence characteristics over Eastern Europe. Previous studies on PBL based on measurements in Măgurele near Bucharest have been published using only lidar data and models [19,20]. As in recent studies, the DWL data were processed using Halo lidar toolbox. This article is structured as follows. First, the instrument (Section 2) and the data processing are presented (Section 3). Section 4 describes the ERA5 reanalysis wind data used for comparisons with the DWL data. The results are presented in Section 5 and Section 6 concludes this study.
2. Instrument—StreamLine XR Doppler Wind Lidar
There are different types of DWLs systems with respect to their operating wavelengths. A review of all these systems can be found in Shangguan et al. [21]. The DWLs systems using a wavelength ≤ 1.06 μm rely on the backscatter processes from both aerosols and molecules (i.e., direct detection). The DWLs with wavelength > 1.06 μm are using only aerosols for the backscatter process (i.e., coherent detection). The direct detection of DWLs (D-DWLs) are optimised for detecting the global wind field since they can combine both Mie (aerosols) and Rayleigh (gas molecules) scattering, and thus covering the altitude range up to the mesosphere. The most used coherent DWL (C-DWL) operates at 1.5 μm and there is a variety of more than 13 different types in the 1.50–1.55 μm range [21]. The main advantages of C-DWLs are that they are eye-safe and they operate at high atmospheric window transmittance.
One such type of C-DWL is the StreamLine XR DWL manufactured by HALO Photonics [22] (Figure 1). A StreamLine XR DWL was deployed at Măgurele Center for Atmosphere and Radiation Studies (MARS, 44.3°N, 26.1°E, 70 m ASL) in December 2019 [23]. MARS is located in a peri-urban area, 12 km southwest of Bucharest. It is a 20.000 sqm facility combining high standard, ground-based remote sensing, in situ laboratories and data centres which provides open access to data and services within the Earth Observation Envelope Program (EOEP) and the pan-European Aerosol, Clouds and Trace Gases Research Infrastructure (ACTRIS-RI). The advanced observations facilities are used for a better understanding of the aerosol and cloud fields and interactions [24,25,26], atmospheric composition [27,28] and atmospheric processes but also for participation in large international field campaigns, e.g., [29].
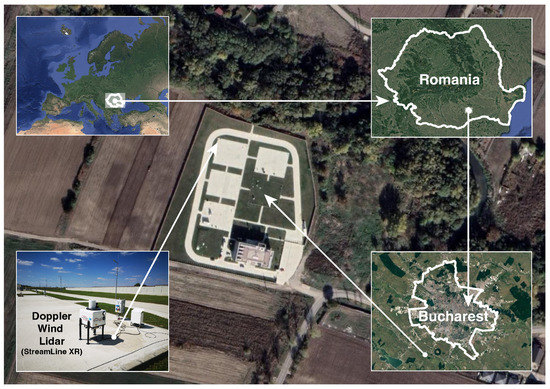
Figure 1.
StreamLine XR Doppler wind lidar located at the Măgurele Center for Atmosphere and Radiation Studies (MARS), Măgurele, Romania. Based on Google Maps (map data: Google, Maxar Technologies) processed on QGIS [33].
As previously stated, the presence of aerosols or cloud particles in the atmosphere is an essential condition for the operation of this lidar system. The dynamical behaviour of these particles can be measured due to the Doppler shift detected by the instrument. Assuming that the particles are following the wind, the line-of-sight (or radial) wind speed is determined. The StreamLineXR DWL is performing continuous measurements of vertical wind profiles with approximately 6 seconds temporal resolution and a 30 m spatial resolution. The system is configured to also perform the velocity-azimuth display (VAD) scanning scenario [30] every 15 minutes with constant elevation angles of 70° and 12 azimuthal directions which allows the retrieval of the horizontal wind field. The Figure 1 detected range by this instrument is 12 km conditioned by the particle concentration in the atmosphere which is essential for the signal backscattering. The minimum resolution of Doppler speed is ±0.0382 m s−1 (Nyquist velocity). For more details on the performance of StreamLine XR DWL and its applications see for example [31,32].
3. Processing of Doppler Wind Lidar Data
In this study, DWL data were collected continuously between December 2019 and November 2021. StreamLine XR DWL provides vertical measurements of aerosol backscatter and wind speed. The vertical measurements are collected in hourly files. These data are further used as input files for the “HALO Streamline Photonics Doppler lidar data postprocessing toolbox” (Halo Toolbox) presented by Manninen et al. [15] and available at [17] to obtain the wind characteristics, PBL structure, and turbulent mixing sources. Some changes to the Halo Toolbox were implemented by the authors to adapt the scripts to the latest version of Matlab.
A short description of the workflow of the Halo toolbox is presented below and in Figure 2a.
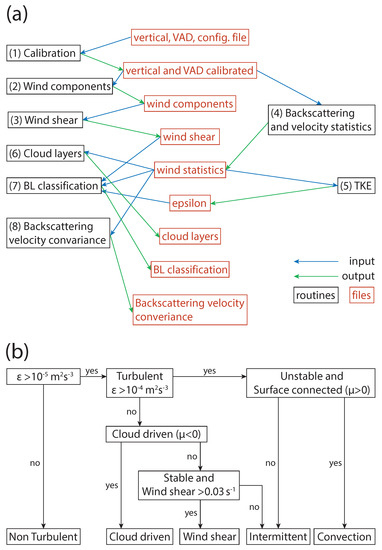
Figure 2.
(a) Workflow of the Halo Toolbox and (b) the decision tree scheme for PBL classification.
- Calibration: First, a background correction is applied to both the vertical and VAD measurements [34] followed by a ripple removal [31] and focus correction. The resulting files are further used in the next steps.
- Wind components: Based on the calibrated VAD files, the wind components (i.e., wind speed and wind direction) are calculated.
- Wind shear: The wind components are used to determine the wind shear every 3 min and 30 min.
- Statistics: Vertical calibrated data (output step 1) are used to extract the mean, standard deviation, variance, skewness and kurtosis for radial velocity. For attenuated backscatter and signal the mean and variance are computed. Associated errors are also provided. The statistics are performed over 3 min, 30 min, and 60 min.
- Turbulence: The determined statistics are next used to calculate the dissipation rate of the turbulent kinetic energy TKE [35] at 3 min, 30 min, and 60 min.
- Clouds: The statistics from step 4 are also used to determine the cloud base height, cloud base velocity, and to provide the cloud mask with the temporal resolution of the input file.
- Planetary Boundary Layer: The PBL classification is based on the statistics (output from step 4), turbulence (output from step 5), and wind shear (output from step 3) files at 3 min temporal resolution. The main output variables are PBL classification, turbulence coupling, and aerosol layer mask. The PBL classification consists in eight classes: No signal, Non-turbulent, Convective mixing, Wind shear, Intermittent, In cloud, Cloud-driven and Precipitation. According to [15], the classification scheme requires as input data the attenuated backscatter coefficient, vertical speed skewness, dissipation rate of TKE (), vertical profiles of horizontal wind, and vector wind shear (see also Figure 2). An attenuated backscatter coefficient () greater than 10−5 m sr−1 is associated with clouds resulting in the In Cloud category. For the other categories, is lower than than 10−5 m−1sr−1. Next, if is lower than 10−5 m2s−3 the flow is considered non-turbulent. For small values of (<10−4 m−1sr−1) and in the case in which skewness is negative starting just below the cloud, the PBL turbulent mixing source is Cloud-Driven. If the skewness is positive, unstable near the surface (daytime), and it is surface connected then the turbulence mixing source is Convective. If it is not surface connected then the turbulence mixing is categorised as Intermittent. When it is not unstable near the surface (nighttime) and the wind shear is greater than 0.03 s−1, the category is Wind Shear. Otherwise, the category is Intermittent. The turbulence can be Surface Connected, Cloud-driven or Unconnected. The range gates that are classified as turbulent but are unconnected to surface or clouds during daytime, and also are not related to wind shear during night-time, are labelled as Intermittent. In this case, the turbulence is assumed to arise from other intermittent sources [16]. The corresponding decision tree scheme to determine the PBL classification is shown in Figure 2b.
- Covariance: The statistics from step 4 are used to calculates the covariance between the attenuated backscatter coefficient and vertical speed at 3 min temporal resolution. A window of 90 min and six range bins are used to estimate the covariance, standard errors, and confidence intervals.
4. ERA5 Reanalysis Model
In this study, we used wind speed and direction profiles derived from ERA5 reanalysis at the closest grid point from Măgurele, Romania (44.25°N, 26.00°E) to construct a 30-year climatology (1991–2020) and for comparison with wind products from DWL (December 2019–November 2021). ERA5 is a state-of-the-art global reanalysis model developed by the European Centre for Medium-Range Weather Forecasts (ECMWF). Being a successor of the ERA-Interim model, ERA5 benefits from long time developments in data management, and physical and dynamical processes of climate parameters [36]. ERA5 is a high temporal and spatial resolution model with 1 hour, 0.25° × 0.25° horizontal and 137 pressure levels (from surface to 0.01 hPa) output grid [37]. The wind at 100 m from ERA5 reanalysis was also extracted from the ERA5 hourly data on single levels available from Copernicus [38].
5. Results
5.1. Wind Speed and Direction
The monthly frequency of occurrence of every PBL class is shown in Figure 3. For each month, based on all available profiles, the frequency of occurrence of each PBL class for all range gates up to 3000 m altitude was extracted. For each profile, the first three range bins were not included in the analysis based on previous research [15,16,18] to eliminate non reliable range gates. The range gates categorised as No signal are those for which SNR (signal to noise ratio) is lower than 0.01 (1%) [17]. The range gates with SNR < 0.01 correspond to free troposphere where the aerosol load is usually low. The range gates with SNR > 0.01 were used to determine the PBL classification.
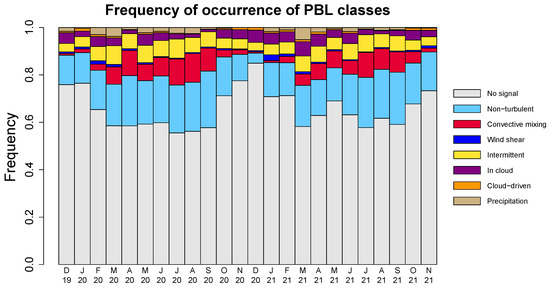
Figure 3.
Frequency of occurrence of PBL classes for the December 2019–November 2021 period.
There is a distinct seasonal variability in the frequency of occurrence of No signal (Figure 3). Maximum values (approximately 80%) are observed during winter months when PBL is lower. During the summer months the frequency of occurrence of No signal was approximately 60% which corresponds to a mean PBL height of approximately 1200 m. The PBL Non-turbulent class is the most frequent except for December 2020, due to almost continuous cloud cover over the site [23]. The Convective class is more pronounced in July, August, September 2020–21, April 2020 and May 2021 which correspond to the convective season in Romania [39]. The In cloud class is less pronounced during summer (more days without cloud cover compared with the other seasons). There was more precipitation (Precipitation class) occurring during 2020 compared to 2021 (not shown). The contribution Cloud driven and Wind shear is the smallest compared with other classes (not shown). We observe in general a large contribution from the Intermittent class (not shown).
To filter the wind products, we used the PBL classification data based on Signal/No signal, seasonal data at 3 minutes temporal resolution for every range gate over the two-year study period. For each season and for each range gate, the percentage of PBL classes from the total number of available observations was calculated (Figure 4). A threshold valued of 60% was used to determine the maximum altitude of reliable signal and to select the range gates used for analysis. Also calculated were the mean (i.e., value on the middle of each season, for example, 15 January for DJF) sunrise start, sunrise end, sunset start, and the sunset end for each season with the main purpose of having an approximate delimitation of day and night variations (Figure 4). The diurnal cycle of the data availability shows a maximum at approximately 1200 m altitude during summer around 12 UTC (Figure 4c) and a minimum at approximately 400 m during winter around 00 UTC (Figure 4a).
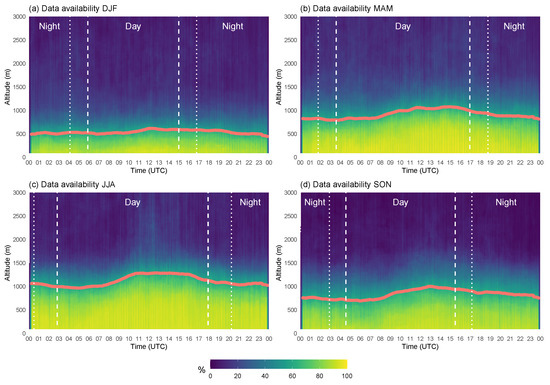
Figure 4.
Data availability for Bucharest–Măgurele station between December 2019 and November 2021 period. Red lines show the altitudes where data availability drops below 60%. The time of the sunrise start, sunrise end (dashed white lines), sunset start, and the sunset end (dotted white lines) are also indicated.
The mean DWL horizontal speed and wind direction for each season are shown in Figure 5 and Figure 6. Note that there is an artefact at approximately 350 m altitude where the wind speed shows low values compared with the above and below range gates. This artefact is most probably due to low performance of the Halo Toolbox under specific meteorological conditions such as precipitation and fog [15]. Note that Ortiz et al. [16,18] removed for their analyses the ranged gates with fog and precipitation.
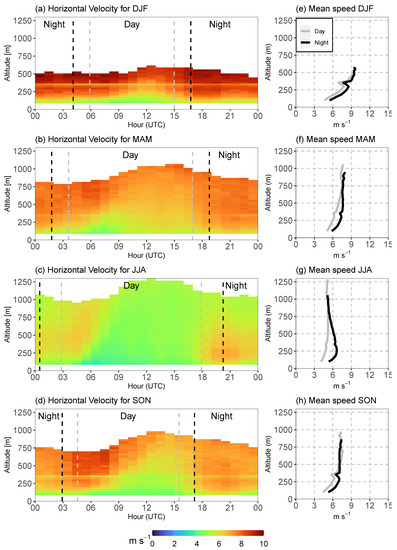
Figure 5.
DWL hourly means of horizontal wind speeds for December 2019–November 2021 analysed period for all seasons (a–d) and the mean speed profiles for daytime and nighttime (e–h).
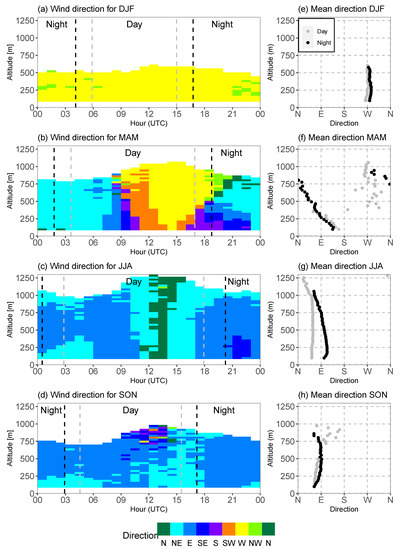
Figure 6.
DWL hourly means of horizontal wind directions for December 2019–November 2021 analysed period for all seasons (a–b) and the mean direction profiles for daytime and nighttime (e–h).
The analysis of DWL wind field shows that, in general, the horizontal wind speed is increasing with altitude for all seasons except summer (Figure 5c), reaching a maximum speed of approximately 10 m s−1 during winter (Figure 5a). These high values for the wind speed during winter are associated with western circulation from Central Europe towards Eastern Europe (see also Figure 6). The daily average of the vertical distribution of mean wind speed is similar during spring and autumn except around 12 UTC at lower altitudes (>8 m/s, Figure 5f,h). This situation is typical for transition from the warm to cold season and vice versa. During summer, there is a distinct difference between day and night at all altitudes up to 750 m (Figure 5g) but in general all horizontal speeds are the small compared with other seasons. This is due to the presence of a stable tropical air mass associated with a high pressure system, a typical situation during summer in Romania.
Figure 7 shows a similar vertical pattern for all the seasons compared with Figure 5. The ERA5 reanalysis underestimates DWL wind speeds with a maximum of approximately 1–2 m s−1. The diurnal cycle of wind speed for all seasons it is also reproduced by the ERA5 reanalysis. Additional comparison of the wind speed and direction at approximately 100 m altitude (first available range gate with reliable signal of DWL) with ERA5 single level at 100 m altitude data showed also a good agreement (see Figure A1 from Appendix A).
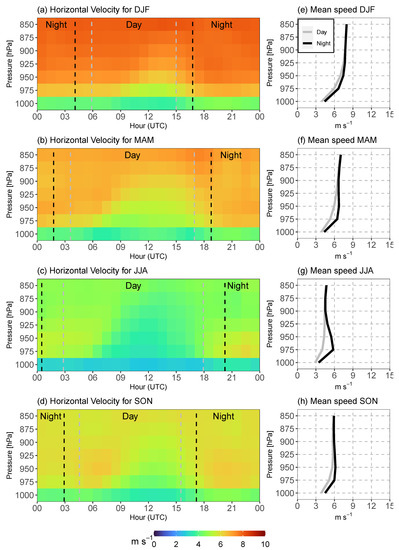
Figure 7.
ERA5 hourly means of horizontal wind speeds for December 2019–November 2021 analysed period for all seasons (a–d) and the mean speed profiles for daytime and nighttime (e–h).
The ERA5 30 years climatology of wind speed (see Figure A2 from Appendix A) shows very close values of wind speed with the analysed period December 2019–November 2021 (Figure 7). Slightly small differences can be observed during spring and autumn seasons around 950 mb pressure level at 5:00 and 20:00 UTC (higher climatological values) and during summer around 21:00 UTC below 900 mb (smaller climatological values).
During winter time, the wind direction is predominantly from the west, being associated with the extension of Azores High pressure system over southeastern Europe (Figure 6a,e). This pattern is characteristic of milder winters with a low precipitation regime and fits well with the ERA5 30-years climatology (Figure 8a,e) where the dominant wind is from west and northwest. The northwestern component of ERA5 is attributed to cold front passages of extratropical Mediterranean cyclones during the severe blizzard events [40]. For spring, the prevailing circulation is from northeast between 23–07 UTC for all altitudes. The wind is veering between 09–11 UTC from southeast to west and backing between 16–23 UTC from south to northwest (Figure 6b,f). The diurnal cycle of wind direction is more pronounced in spring compared to the other seasons, being related to a larger temperature difference between day and night. The DWL distribution of diurnal wind direction fits well with ERA5 climatology (Figure 8b,f).
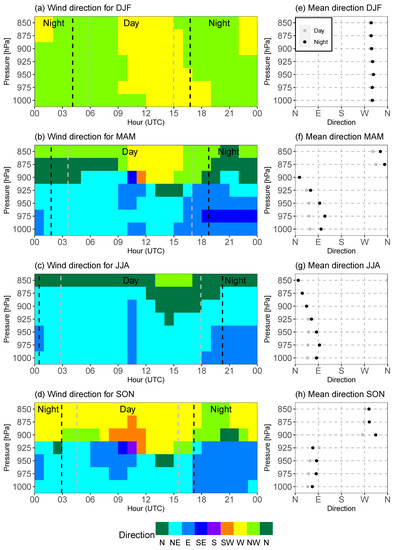
Figure 8.
ERA5 hourly means of horizontal wind directions for 1990–2020 climatology period for all seasons (a–b) and the mean direction profiles for daytime and nighttime (e–h).
During summer, the mean wind direction is mostly from the east and northeast while at around 12 UTC the wind blows from north (Figure 6c). It is again notable that the similarities between DWL data and ERA5 climatology (Figure 8c,g). We speculate that this behaviour may be attributed to some local features that involves topographical aspects and the effect of Bucharest UHI (Urban Heat Island) which requires further in-depth investigations. The wind direction during autumn is prevailing from east and northeast similar with the patter for summer (Figure 6d,h). The prolonged Summer-like days during the autumn 2020 and 2021 can explain the similarities between summer and autumn wind patterns.
The seasonal diurnal cycle of wind direction retrieved from ERA5 reanalysis shows a very good agreement with DWL measurements (Figure 9). Note that ERA5 reanalysis also show data at higher levels than those from DWL data. For example, during autumn, the data above 900 hPa are not shown in the DWL data. The comparison of the wind direction at approximately 100 m from ERA5 and DWL shows also a good agreement except over the spring season where larger differences have been observed (see Figure A1 from Appendix A).
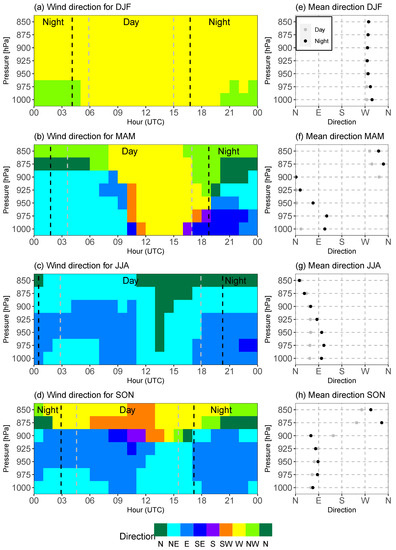
Figure 9.
ERA5 hourly means of horizontal wind directions for December 2019–November 2021 analysed period for all seasons (a–b) and the mean direction profiles for daytime and nighttime (e–h).
5.2. PBL Classification
Figure 10 show the most frequently detected PBL classes: Convective, Non Turbulent and Intermittent. The other three classes Cloud Driven, Wind Shear, and In Cloud have a contribution smaller than 10% and are not shown here. The averaged values correspond to all available data up to the limit shown in Figure 4. As expected, the convection is the strongest during summer, followed closely by spring and then autumn and winter. The Convective class presents a diurnal behaviour with a maximum peak at noon. Small values (<40%) are shown in the morning and afternoon in the lower part of the atmosphere (few hundred meters) when the sun is slowly heating the ground and large values (>80%) during the 09–15 h interval during summer noon. The convection determines the mixing layer rise within PBL. The Convective class is associated with surface-connected turbulence during day (unstable conditions). The Non Turbulent class is dominant (>80%) during night-time up to the altitude detection limit (Figure 4) and during dawn and dusk at altitudes above mixing layer height. The frequency of occurrence follows the same pattern, stronger during summer and weaker during winter. The Intermittent class reached a maximum of approximately 40% and its pattern is complementary to the Convective and Non turbulent classes, being more pronounced in the top of the mixing layer. One can observe the high contribution during sunset for summer, spring and autumn. The high frequency in the late afternoon transition is due to the weakening of the surface connected turbulence [41]. The Intermittent class is associated with the Surface Connected during the night (stable conditions) and other turbulent sources except Wind Shear and Cloud Driven.
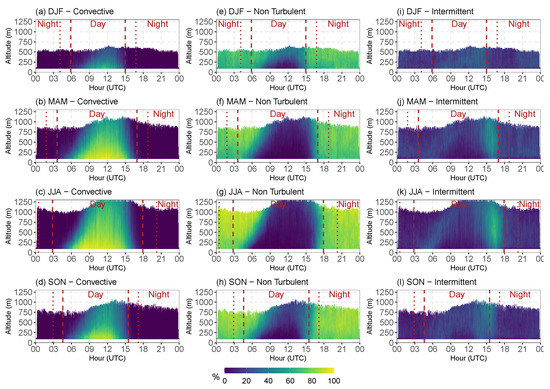
Figure 10.
Frequency of occurrence for the three dominant PBL classes: Convective (a–d); Non Turbulent (e–h); and Intermittent (i–l) for each hour, range gate and season at Magurele station.
6. Conclusions
The current study represents two-year data analyses of a HALO Doppler Wind Lidar, located in a peri-urban location (Măgurele, Romania). The data processing is based on the HALO lidar toolbox [15,17]. The diurnal wind speed and direction along with PBL classes for each season are presented. The horizontal wind speed shows a diurnal cycle, with higher values during nighttime and lower values during daytime over the region associated with the mixing layer. Over similar regions (100–500 m), the wind is stronger during winter, followed by spring and autumn and summer. The wind data from ERA5 reanalysis are also displayed, showing a very good agreement with DWL results. On average, ERA5 underestimates the wind speeds measured by DWL. The wind direction show different seasonal patterns. During summer and autumn, the prevalent direction is E and NE while during winter the predominant direction is W. For a short time, northerly winds are observed during summer noon. During spring, the wind is blowing mostly from NE during nighttime while during daytime the wind is blowing from E, SE, S, SW and W. Westerly winds occur over larger time intervals towards higher altitudes. The ERA5 reanalysis wind direction shows a good agreement with DWL results. The diurnal cycles for wind speed show a similar pattern over seasons but with different values, while for wind direction they show different seasonal patterns. However, there is a similarity from summer to autumn which may explain the "summer" temperatures over autumn seen over last years. The westerly winds over winter may explain the mild winters we witnessed over the last years. The comparisons between DWL and ERA5 at 100 m altitude show a good agreement for both wind speed and wind direction except for Spring wind direction. The climatology of the wind direction from 1991 to 2020 show good agreement with the last two years analysed. The PBL classification (based on HALO toolbox) was made based on six classes (except Precipitation and No signal): Non-Turbulent, Convective, Wind Shear, Intermittent, In cloud, and Cloud Driven. The dominant class during daytime it is the Convective mixing while during nighttime is the Non-Turbulent class. The Intermittent class is more present in the top of the mixing layer over spring–summer–autumn. As mentioned by [15], the PBL classification scheme provides insights into the processes responsible for mixing within the PBL and their variability in space and time. The long-term monitoring by a DWL provides valuable information about the wind variability and constitute a good validation data-set for models and satellites’ wind retrievals while it builds good statistics for climatology studies. Further work will investigate in detail the influence of topography and UHI on wind statistics and will contribute to a complete description and understanding of various pollution or convective events.
Author Contributions
Conceptualization, B.A., R.P. and M.A.; methodology, R.P., M.A. and B.A.; software, R.P. and M.A.; validation, M.A. and S.A.; formal analysis, M.A. and R.P.; investigation, R.P., B.A., S.A. and M.A.; resources, R.P., M.A., B.A. and S.A.; data curation, M.A. and R.P.; writing—original draft preparation, R.P., B.A., S.A. and M.A.; writing—review and editing, B.A., S.A. and S.Ş.; visualization, R.P.; supervision, B.A.; project administration, S.A. and S.Ş.; funding acquisition, S.A. All authors have read and agreed to the published version of the manuscript.
Funding
This work was carried out through the Core Program within the National Research Development and Innovation Plan 2022–2027, with the support of MCID, project no. PN 23 05.
Data Availability Statement
The ERA5 reanalysis data are available by request to https://cds.climate.copernicus.eu (accessed on 11 January 2023). The DWL processed data are available by request from authors.
Acknowledgments
Part of the work performed for this study was funded by the Romanian Ministry of Research, Innovation and Digitalization, through Program 1—Development of the national research-development system, Subprogram 1.2—Institutional performance—Projects to finance the excellent RDI, Contract no. 18PFE/30.12.2021 and CCCDI-UEFISCDI (Project No. PN-III-P2-2.1-PED-2021-1938) within PNCDI III. The research was partially funded by the European Regional Development Fund through the Competitiveness Operational Programme 2014–2020, POC-A.1-A.1.1.1- F- 2015, project Research Centre for Environment and Earth Observation CEO-Terra, SMIS code 108109, contract No. 152/2016. This article is also based upon work from COST Action CA18235 PROBE, supported by COST (European Cooperation in Science and Technology) www.cost.eu (accessed on 6 March 2023). Further support was provided by the project Strengthen the participation of the ACTRIS-RO consortium in the pan-European research infrastructure ACTRIS, ACTRIS-ROC, MYSMIS code 107596 (ctr. no.337/2021). Bogdan Antonescu acknowledge the project the ClimExRo project (DG-2209-64717) funded by the European Climate Foundation.
Conflicts of Interest
The authors declare no conflict of interest.
Appendix A
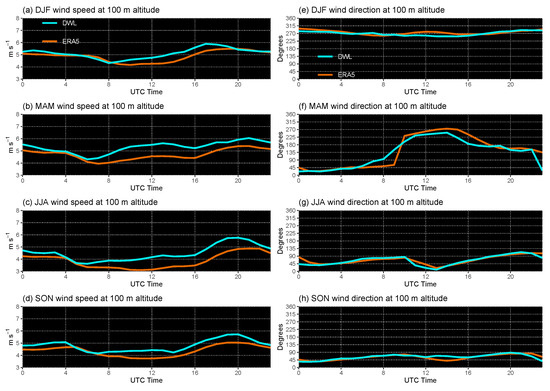
Figure A1.
Seasonal diurnal wind speed (left) and wind direction (right) at 100 m retrieved from DWL and ERA5 reanalysis.
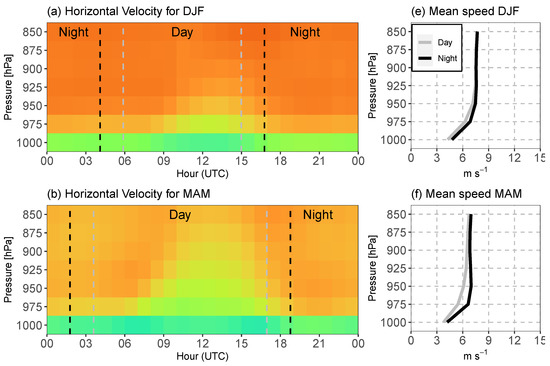
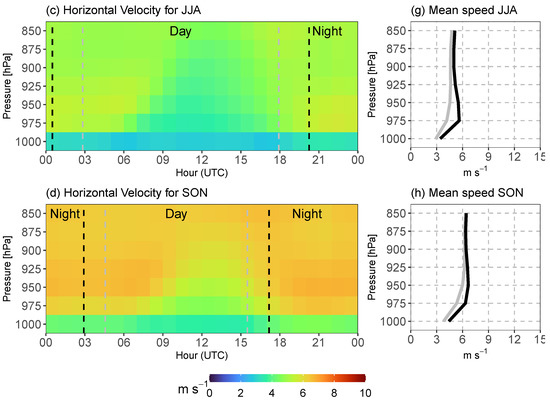
Figure A2.
ERA5 hourly means of horizontal wind speeds for 1990–2020 climatology period for all seasons (a–d) and the mean speed profiles for daytime and nighttime (e–h).
References
- WMO. World Meteorological Organization, Essential Climate Variables. Available online: https://public.wmo.int/en/programmes/global-climate-observing-system/essential-climate-variables (accessed on 16 November 2022).
- Buzdugan, L.; Ștefan, S. A comparative study of sodar, lidar wind measurements and aircraft derived wind observations. Rom. J. Phys. 2020, 65, 810. [Google Scholar]
- Urlea, A.D.; Barbu, N.; Andrei, S.; Stefan, S. Simulation of Vesuvius volcanic ash hazards within Romanian airspace using the Hybrid Single-Particle Lagrangian Integrated Trajectory Volcanic Ash numerical model. Meteorol. Appl. 2021, 28, e2021. [Google Scholar] [CrossRef]
- Finn, T.S.; Geppert, G.; Ament, F. Towards assimilation of wind profile observations in the atmospheric boundary layer with a sub-kilometre-scale ensemble data assimilation system. Tellus A Dyn. Meteorol. Oceanogr. 2020, 72, 1–14. [Google Scholar] [CrossRef]
- Liu, D.; Huang, C.; Feng, J. Influence of Assimilating Wind Profiling Radar Observations in Distinct Dynamic Instability Regions on the Analysis and Forecast of an Extreme Rainstorm Event in Southern China. Remote Sens. 2022, 14, 3478. [Google Scholar] [CrossRef]
- Yim, S.H.L. Development of a 3D Real-Time Atmospheric Monitoring System (3DREAMS) Using Doppler LiDARs and Applications for Long-Term Analysis and Hot-and-Polluted Episodes. Remote Sens. 2020, 12, 1036. [Google Scholar] [CrossRef]
- Yuan, J.; Wu, Y.; Shu, Z.; Su, L.; Tang, D.; Yang, Y.; Dong, J.; Yu, S.; Zhang, Z.; Xia, H. Real-Time Synchronous 3-D Detection of Air Pollution and Wind Using a Solo Coherent Doppler Wind Lidar. Remote Sens. 2022, 14, 2809. [Google Scholar] [CrossRef]
- Frehlich, R. Scanning Doppler Lidar for Input into Short-Term Wind Power Forecasts. J. Atmos. Ocean. Technol. 2013, 30, 230–244. [Google Scholar] [CrossRef]
- Pichault, M.; Vincent, C.; Skidmore, G.; Monty, J. Short-Term Wind Power Forecasting at the Wind Farm Scale Using Long-Range Doppler LiDAR. Energies 2021, 14, 2663. [Google Scholar] [CrossRef]
- Schween, J.; Hirsikko, A.; Löhnert, U.; Crewell, S. Mixing layer height retrieval with ceilometer and Doppler lidar: From case studies to long-term assessment. Atmos. Meas. Tech. Discuss. 2014, 7, 3685–3704. [Google Scholar] [CrossRef]
- Tuononen, M.; O’Connor, E.J.; Sinclair, V.A.; Vakkari, V. Low-Level Jets over Utö, Finland, Based on Doppler Lidar Observations. J. Appl. Meteorol. Climatol. 2017, 56, 2577–2594. [Google Scholar] [CrossRef]
- Tsiringakis, A.; Theeuwes, N.; Barlow, J.; Steeneveld, G.J. Interactions Between the Nocturnal Low-Level Jets and the Urban Boundary Layer: A Case Study over London. Bound. -Layer Meteorol. 2022, 183, 249–272. [Google Scholar] [CrossRef]
- Banakh, V.A.; Smalikho, I.N. Lidar Studies of Wind Turbulence in the Stable Atmospheric Boundary Layer. Remote Sens. 2018, 10, 1219. [Google Scholar] [CrossRef]
- Harvey, N.; Hogan, R.; Dacre, H. A method to diagnose boundary-layer type using Doppler lidar. Q. J. R. Meteorol. Soc. 2013, 139, 1681–1693. [Google Scholar] [CrossRef]
- Manninen, A.; Marke, T.; Tuononen, M.; O’Connor, E. Atmospheric Boundary Layer Classification With Doppler Lidar. J. Geophys. Res. Atmos. 2018, 123, 8172–8189. [Google Scholar] [CrossRef]
- Ortiz Amezcua, P.; Martínez-Herrera, A.; Manninen, A.; Pentikäinen, P.; O’Connor, E.; Guerrero-Rascado, J.; Arboledas, L. Wind and Turbulence Statistics in the Urban Boundary Layer over a Mountain–Valley System in Granada, Spain. Remote Sens. 2022, 14, 2321. [Google Scholar] [CrossRef]
- Manninen, A. HALO Lidar Toolbox. Available online: https://github.com/manninenaj/HALO_lidar_toolbox (accessed on 1 February 2023).
- Ortiz-Amezcua, P.; Andújar-Maqueda, J.; Manninen, A.J.; Pentikäinen, P.; O’Connor, E.J.; Stachlewska, I.S.; de Arruda Moreira, G.; Benavent-Oltra, J.A.; Casquero-Vera, J.A.; Poczta, P.; et al. Dynamics of the Atmospheric Boundary Layer over two middle-latitude rural sites with Doppler lidar. Atmos. Res. 2022, 280, 106434. [Google Scholar] [CrossRef]
- Livio, B.; Nicolae, D.; Nemuc, A.; Talianu, C.; Derognat, C. Retrieval of the boundary layer height from active and passive remote sensors. Comparison with a NWP model. Acta Geophys. 2014, 62, 276–289. [Google Scholar] [CrossRef]
- Timofte, A.; Belegante, L.; Cazacu, M.; Albina, B.; Talianu, C.; Gurlui, S. Study of planetary boundary layer height from LIDAR measurements and ALARO model. J. Optoelectron. Adv. Mater. 2015, 17, 911–917. [Google Scholar]
- Shangguan, M.; Qiu, J.; Yuan, J.; Shu, Z.; Zhou, L.; Xia, H. Doppler Wind Lidar From UV to NIR: A Review With Case Study Examples. Front Remote Sens. 2022, 2, 59. [Google Scholar] [CrossRef]
- Pearson, G.; Davies, F.; Collier, C. An Analysis of the Performance of the UFAM Pulsed Doppler Lidar for Observing the Boundary Layer. J. Atmos. Ocean. Technol. 2009, 26, 240–250. [Google Scholar] [CrossRef]
- Pîrloagă, R.; Ene, D.; Boldeanu, M.; Antonescu, B.; O’Connor, E.J.; Ştefan, S. Ground-Based Measurements of Cloud Properties at the Bucharest–Măgurele Cloudnet Station: First Results. Atmosphere 2022, 13, 1445. [Google Scholar] [CrossRef]
- Andrei, S.; Toanca, F.; Dandocsi, A.; Belegante, L.; Nemuc, A.; Marmureanu, L.; Vulturescu, V.; Florescu, G.; Nicolae, D. Assessment of cloud particle types in a deep convective environment using active remote sensing—A case study. J. Optoelectron. Adv. Mater. 2017, 19, 610–616. [Google Scholar]
- Nicolae, D.; Nemuc, A.; Müller, D.; Talianu, C.; Vasilescu, J.; Livio, B.; Kolgotin, A. Characterization of fresh and aged biomass burning events using multiwavelength Raman lidar and mass spectrometry. J. Geophys. Res. Atmos. 2013, 118, 1–10. [Google Scholar] [CrossRef]
- Adam, M.; Nicolae, D.; Stachlewska, I.; Papayannis, A.; Balis, D. Biomass burning events measured by lidars in EARLINET – Part 1: Data analysis methodology. Atmos. Chem. Phys. 2020, 20, 13905–13927. [Google Scholar] [CrossRef]
- Nicolae, V.; Talianu, C.; Andrei, S.; Antonescu, B.; Ene, D.; Nicolae, D.; Dandocsi, A.; Toader, V.; Stefan, S.; Savu, T.; et al. Multiyear Typology of Long-Range Transported Aerosols over Europe. Atmosphere 2019, 10, 482. [Google Scholar] [CrossRef]
- Fragkos, K.; Antonescu, B.; Giles, D.M.; Ene, D.; Boldeanu, M.; Efstathiou, G.A.; Belegante, L.; Nicolae, D. Assessment of the total precipitable water from a sun photometer, microwave radiometer and radiosondes at a continental site in southeastern Europe. Atmos. Meas. Tech. 2019, 12, 1979–1997. [Google Scholar] [CrossRef]
- Merlaud, A.; Livio, B.; Constantin, D.; den Hoed, M.; Meier, A.; Allaart, M.; Ardelean, M.; Arseni, M.; Bösch, T.; Brenot, H.; et al. Satellite validation strategy assessments based on the AROMAT campaigns. Atmos. Meas. Tech. 2020, 13, 5513–5535. [Google Scholar] [CrossRef]
- Päschke, E.; Leinweber, R.; Lehmann, V. An assessment of the performance of a 1.5 μm Doppler lidar for operational vertical wind profiling based on a 1-year trial. Atmos. Meas. Tech. 2015, 8, 2251–2266. [Google Scholar] [CrossRef]
- Vakkari, V.; Manninen, A.; O’Connor, E.; Schween, J.; Zyl, P.; Marinou, E. A novel post-processing algorithm for Halo Doppler lidars. Atmos. Meas. Tech. 2019, 12, 839–852. [Google Scholar] [CrossRef]
- Steinheuer, J.; Detring, C.; Beyrich, F.; Löhnert, U.; Friederichs, P.; Fiedler, S. A new scanning scheme and flexible retrieval for mean winds and gusts from Doppler lidar measurements. Atmos. Meas. Tech. 2022, 15, 3243–3260. [Google Scholar] [CrossRef]
- QGIS.org. QGIS Geographic Information System. QGIS Association. Available online: http://www.qgis.org (accessed on 1 August 2022).
- Manninen, A.J.; O’Connor, E.J.; Vakkari, V.; Petäjä, T. A generalised background correction algorithm for a Halo Doppler lidar and its application to data from Finland. Atmos. Meas. Tech. 2016, 9, 817–827. [Google Scholar] [CrossRef]
- O’Connor, E.; Illingworth, A.; Brooks, I.; Westbrook, C.; Hogan, R.; Davies, F.; Brooks, B. A Method for Estimating the Turbulent Kinetic Energy Dissipation Rate from a Vertically Pointing Doppler Lidar, and Independent Evaluation from Balloon-Borne In Situ Measurements. J. Atmos. Ocean. Technol. 2010, 27, 1652–1664. [Google Scholar] [CrossRef]
- Hersbach, H.; Bell, B.; Berrisford, P.; Hirahara, S.; Horányi, A.; Muñoz-Sabater, J.; Nicolas, J.; Peubey, C.; Radu, R.; Schepers, D.; et al. The ERA5 global reanalysis. Q. J. R. Meteorol. Soc. 2020, 146, 1999–2049. [Google Scholar] [CrossRef]
- Hersbach, H.; Bell, B.; Berrisford, P.; Biavati, G.; Horányi, A.; Muñoz Sabater, J.; Nicolas, J.; Peubey, C.; Radu, R.; Rozum, I.; et al. ERA5 Hourly Data on Pressure Levels from 1959 to Present. Copernicus Climate Change Service (C3S) Climate Data Store (CDS). 2018. Available online: https://cds.climate.copernicus.eu/cdsapp#!/dataset/reanalysis-era5-pressure-levels?tab=overview (accessed on 11 January 2023).
- Hersbach, H.; Bell, B.; Berrisford, P.; Biavati, G.; Horányi, A.; Muñoz Sabater, J.; Nicolas, J.; Peubey, C.; Radu, R.; Rozum, I.; et al. ERA5 Hourly Data on Single Levels from 1959 to Present. Copernicus Climate Change Service (C3S) Climate Data Store (CDS). 2018. Available online: https://cds.climate.copernicus.eu/cdsapp#!/dataset/reanalysis-era5-pressure-levels?tab=overview (accessed on 11 January 2023).
- Andrei, S.; Andrei, M.; Hustiu, M.; Cheval, S.; Antonescu, B. Tornadoes in Romania—From Forecasting and Warning to Understanding Public’s Response and Expectations. Atmosphere 2020, 11, 966. [Google Scholar] [CrossRef]
- Kotsias, G.; Lolis, C.; Hatzianastassiou, N.; Bakas, N.; Lionello, P.; Bartzokas, A. Objective climatology and classification of the Mediterranean cyclones based on the ERA5 data set and the use of the results for the definition of seasons. Theor. Appl. Climatol. 2023, 1–17. [Google Scholar] [CrossRef]
- Lothon, M.; Lohou, F.; Pino, D.; Couvreux, F.; Pardyjak, E.R.; Reuder, J.; Vilá-Guerau de Arellano, J.; Durand, P.; Hartogensis, O.; Legain, D.; et al. The BLLAST field experiment: Boundary-Layer Late Afternoon and Sunset Turbulence. Atmos. Chem. Phys. 2014, 14, 10931–10960. [Google Scholar] [CrossRef]
Disclaimer/Publisher’s Note: The statements, opinions and data contained in all publications are solely those of the individual author(s) and contributor(s) and not of MDPI and/or the editor(s). MDPI and/or the editor(s) disclaim responsibility for any injury to people or property resulting from any ideas, methods, instructions or products referred to in the content. |
© 2023 by the authors. Licensee MDPI, Basel, Switzerland. This article is an open access article distributed under the terms and conditions of the Creative Commons Attribution (CC BY) license (https://creativecommons.org/licenses/by/4.0/).