Communication

A Time-Gated, Time-Correlated Single-Photon-Counting Lidar to Observe Atmospheric Clouds at Submeter Resolution

1
Brookhaven National Laboratory, Upton, NY 11973, USA
2
Department of Physics, Stevens Institute of Technology, Hoboken, NJ 07030, USA
3
Raymetrics Inc., 14452 Athens, Greece
4
School of Marine and Atmospheric Sciences, Stony Brook University, Stony Brook, NY 11794, USA
*
Author to whom correspondence should be addressed.
Remote Sens. 2023, 15(6), 1500; https://doi.org/10.3390/rs15061500
Submission received: 7 February 2023 / Revised: 4 March 2023 / Accepted: 6 March 2023 / Published: 8 March 2023
(This article belongs to the Special Issue Remote Sensing of Aerosol, Cloud and Their Interactions)

Abstract

:
Most lidars used for cloud observations have the range resolution of about 10 m, so they are incapable of resolving submeter-scale processes that are crucial to cloud evolution. This article describes a prototype of a ground-based, vertically pointing, time-gated, time-correlated single-photon-counting lidar (referred to as the T2 lidar) developed to explore atmospheric clouds at range resolution two orders of magnitude finer than traditional atmospheric lidars. The T2 lidar emits green-light pulses (532 nm) at a repetition rate of 20.6 kHz and a pulse width of ∼650 ps, which enables the observation of aerosol and cloud layers at heights from a few hundred meters to 7.28 km above the ground level at range resolution down to 10 cm. In addition, a digital delay pulse generator controls the detector to only receive photons for a short period after each laser pulse. This time-gated technique blocks photons arriving from regions outside the target zone, thus significantly reducing the noise level and allowing observation even inside clouds. Initial observations show that the T2 lidar can detect sharp cloud boundaries and fine structures near the cloud base. Such refined measurements of cloud structure could lead to an improved understanding of microphysical processes such as droplet activation, entrainment and mixing, and precipitation.

1. Introduction

High-resolution dynamic, thermodynamic, and microphysical properties of the atmosphere, along with their temporal evolution, are crucial to understanding atmospheric processes that are important to weather and climate [1]. Airborne in situ observations can provide detailed, high-resolution information but require airborne platforms, which are costly and limited in their spatio-temporal range [2]. Spaceborne and ground-based remote sensing techniques can compensate for the limitations of in situ observations by providing temporally continuous observations of the atmospheric state, such as retrieved aerosol and cloud microphysical properties, required for developing predictive models of Earth’s climate [3,4].
Ground-based lidars have been widely used by the atmospheric science community for the measurement and retrieval of atmospheric properties [5]. For example, various types of lidars are routinely operated by the U.S. Department of Energy (DOE) Atmospheric Radiation Measurement (ARM) user facility, as well as other ground-based networks and observatories, e.g., [6,7,8]. Specifically, ceilometers with the wavelength of 910 nm and the range resolution of 10 m are used to measure cloud base height and atmospheric boundary layer thickness, e.g., [9,10]. Micropulse lidars, with the wavelength of 532 nm and the range resolution of 15 m, are more sensitive to small particles and are used to observe aerosol and cloud layers, e.g., [11,12]. Doppler lidars, with the wavelength of 1.5 μ m and range resolution down to 18 m, are used to obtain the air radial velocity in the atmospheric boundary layer, e.g., [13,14]. High-spectral-resolution lidars, with the wavelength of 532 nm and the range resolution of 7.5 m, can independently calculate particle backscatter and extinction coefficients, e.g., [15,16]. Raman lidars with range resolution down to 7.5 m can be used to estimate profiles of temperature and water vapor mixing ratio, e.g., [17,18].
Note that all these atmospheric lidars, as well as most other commercial atmospheric lidars, have range resolution in the order of 10 m. Such resolution is comparable to the resolution of large-eddy simulations (LESs); thus, lidar observations have been used to evaluate and advance such simulations. For example, Endo et al. [19] found that LESs underestimate cloud-base downdrafts observed with Doppler lidars unless the model physics is improved to better capture cloud microphysical and radiation properties near the cloud edges. However, in situ observations have shown that cloud droplet number concentration can be inhomogeneous at centimeter scales in a turbulent environment [20,21]. In addition, microphysical processes, such as droplet activation, collision coalescence, and local entrainment and mixing, occur at a much smaller scale compared with LES resolution. Although various sub-grid-scale parameterizations have been developed to account for unresolved microphysical processes, e.g., [22,23], they are difficult to evaluate due to limited observations at those scales. Knowledge gaps in cloud physics at the fundamental level and the poor representation of sub-grid cloud microphysical properties and processes in cloud-resolving models result in large uncertainty in the modeling and predictability of weather and climate [24].
To enable the collection of observations at higher resolution than that of traditional lidars to be achieved, shorter-pulse lasers as well as time-correlated single-photon-counting (TCSPC) techniques have been developed and applied in many fields, such as single-photon imaging [25], forestry mapping [26], archaeology site surveillance [27], fluorescence lifetime measurement [28], remote sensing [29], and non-line-of-sight imaging [30]. The TCSPC technique can record the arrival time of each individual photon at picosecond resolution with respect to a reference clock [31]. By combining a short laser pulse and a single-photon detector with low timing jitter, such as avalanche diodes (SPADs), TCSPC can acquire a histogram of photon arrival times relative to the illuminating laser pulses, revealing transient optical signals for depth-resolved measurement at millimeter resolution [31]. Since TCSPC is a precise and robust technique to capture photon arrival times with a large dynamic range in time, from picoseconds to microseconds, it allows optical transient signals in atmospheric lidars to be easily acquired, thus enabling refined atmospheric profiling to be achieved. Barton-Grimley et al. [32] applied the TCSPC technique to atmospheric lidars, making the resolution of fine-scale cloud features at centimeter scales possible. Their work paved the way toward profiling fine-scale atmospheric processes associated with cloud formation, turbulence, and other phenomena.
In this study, we developed a prototype of a time-gated, time-correlated single-photon-counting (hereafter referred to as T2) lidar for atmospheric observations at range resolution down to 10 cm, or two orders of magnitude finer than that of traditional lidars. The T2 lidar can operate in two modes: continuous mode and time-gated mode. The continuous mode is similar to the lidar developed by Barton-Grimley et al. [32], while the time-gated mode allows the lidar to explore a small region of interest (e.g., cloud base) in great detail and with lower uncertainty (i.e., higher signal-to-noise ratio). Section 2 introduces the design, calibration, and alignment of the lidar system. Initial observations to demonstrate the capability of the T2 lidar are detailed in Section 3. Conclusions and potential implications are discussed in Section 4.

2. Method

2.1. Design of the T2 Lidar

Figure 1a shows the exterior construction of the T2 lidar. The lidar is enclosed inside a sealed and temperature-controlled cabinet with dimensions of 0.632 m (width) × 0.674 m (depth) × 1.25 m (height). High-precision anti-reflection windows, rain cover, and fans are integrated on top of the cabinet to protect the two windows from rain and dust. Thermoelectric coolers have a maximum cooling efficiency of about 400 W, allowing the lidar to operate between −10 C and 45 C ambient temperatures. The base can manually tilt the lidar, allowing the T2 lidar to be operated off zenith. In this paper, we show only vertically pointing lidar data for demonstration purposes.
Figure 1b shows the interior of the T2 lidar, and Figure 1c is a schematic diagram illustrating how the lidar system works. Table 1 lists the names of components numbered in Figure 1b, and Table 2 summarizes the system parameters. The computer (1), detector (3), digital delay pulse generator (4), laser (5), beam expander (7), telescope (8), and filter (11) are responsible for firing the laser pulses and receiving the backscattered photons. A motorized actuator (6), a camera (9), and an adjustable optical fiber eyepiece (10) are used to align the laser beam with the telescope before operation, which will be discussed in Section 2.3. A power distribution unit (2) provides remote hard reset for all components, while (12) is a laser power supply and control unit.
The T2 lidar operates with a customized, passively Q-switched, frequency-doubled Nd:YAG microchip laser with a built-in high-speed biased photodetector (Teems Photonics). The laser emits at a wavelength of 532 nm with a pulse width of 650 ps and a repetition rate of 20.6 kHz, corresponding to range resolution down to 10 cm and a maximum range of 7.28 km. The emitted laser pulses are expanded and collimated to a diameter of 9 cm to achieve eye safety. The backscattered photons are collected with a 20 cm aperture Dall Kirkham Cassegrain telescope and spatially filtered with an adjustable field of view from 0.5 to 3 mrad. The collected photons are filtered using an optical bandpass filter centered at 532.2 nm with a full width at half maximum (FWHM) of 0.21 nm. The minimum full overlap height between the laser beam and the telescope field of view is about 900 m (see Section 3). Three optical filters are used to efficiently transmit at 532 nm with a narrow bandwidth while rejecting other wavelengths. The filtered signal is received by an ultra-low-noise single-photon-counting detector (AUREA Technology). One unique component of the T2 lidar is a digital delay pulse generator. It accepts a pulse from the laser and outputs a modified pulse with specific delay and width to control the detector, allowing the detector to only be open for a short period (defined as the gated window) after each pulse is fired. A custom-made industrial computer is used to control each component (e.g., laser, detector, and pulse generator) and store the acquired data.
The T2 lidar can be operated in two modes: continuous mode and time-gated mode. In continuous mode, the detector remains open until a specified number of photons (up to 10 7 ) have been observed. The arrival time of each photon is recorded by the detector synchronized with the most recent laser pulse. The concept of the continuous mode is similar to the time-correlated single-photon-counting lidar developed by Barton-Grimley et al. [32]. In this mode, the detector is synchronized to receive photons after each laser pulse; once the detector receives a photon, it cannot receive any photons within a short period (i.e., the dead time of the detector, which is about 50 ns for our detector); after the dead time, the detector is ready to receive photons again. This means that the detector can receive photons corresponding to different heights for each laser pulse.
The time-gated mode is a unique capability of the T2 lidar. In this mode, the detector is only open for a narrow time window after each laser pulse based on a user-selected delay. The time delay and the width of the gated window are controlled by a digital delay pulse generator. This effectively makes the detector only receive photons from a certain region of the atmosphere. The maximum width of the gated window can be up to 80 ns, corresponding to a range of 12 m. For example, with a delay setting of 20 μ s and a gated window of 80 ns, the backscattered photons received by the detector are from a small region between 3 km and 3.012 km away in the absence of atmospheric background and instrument noise (i.e., dark counts).
There are several advantages to the time-gated mode compared with the continuous mode. First, the data flow rate (i.e., the observed photon rate) is much smaller in time-gated mode, allowing efficient data storage and transfer to be achieved. Second, the physical meaning of the data observed in gated mode is easier to interpret. In continuous mode, the detector can receive photons after each laser pulse from different altitudes. In time-gated mode, because the width of the gated window is similar to the dead time of the detector, we can assume that the detector can receive either one photon or zero photons for each laser pulse. Therefore, it is safe to say that the photons received in gated mode are the first-arriving photons within the gated window. Third, the detector is unlikely to receive photons from just behind a strong scattering layer (e.g., cloud base) in continuous mode because of the dead time issue. However, the time-gated mode can block photons from these strong scattering layers to enable the exploration of other regions of interest (e.g., behind a strong scattering layer) to be performed in greater detail.

2.2. Calibration

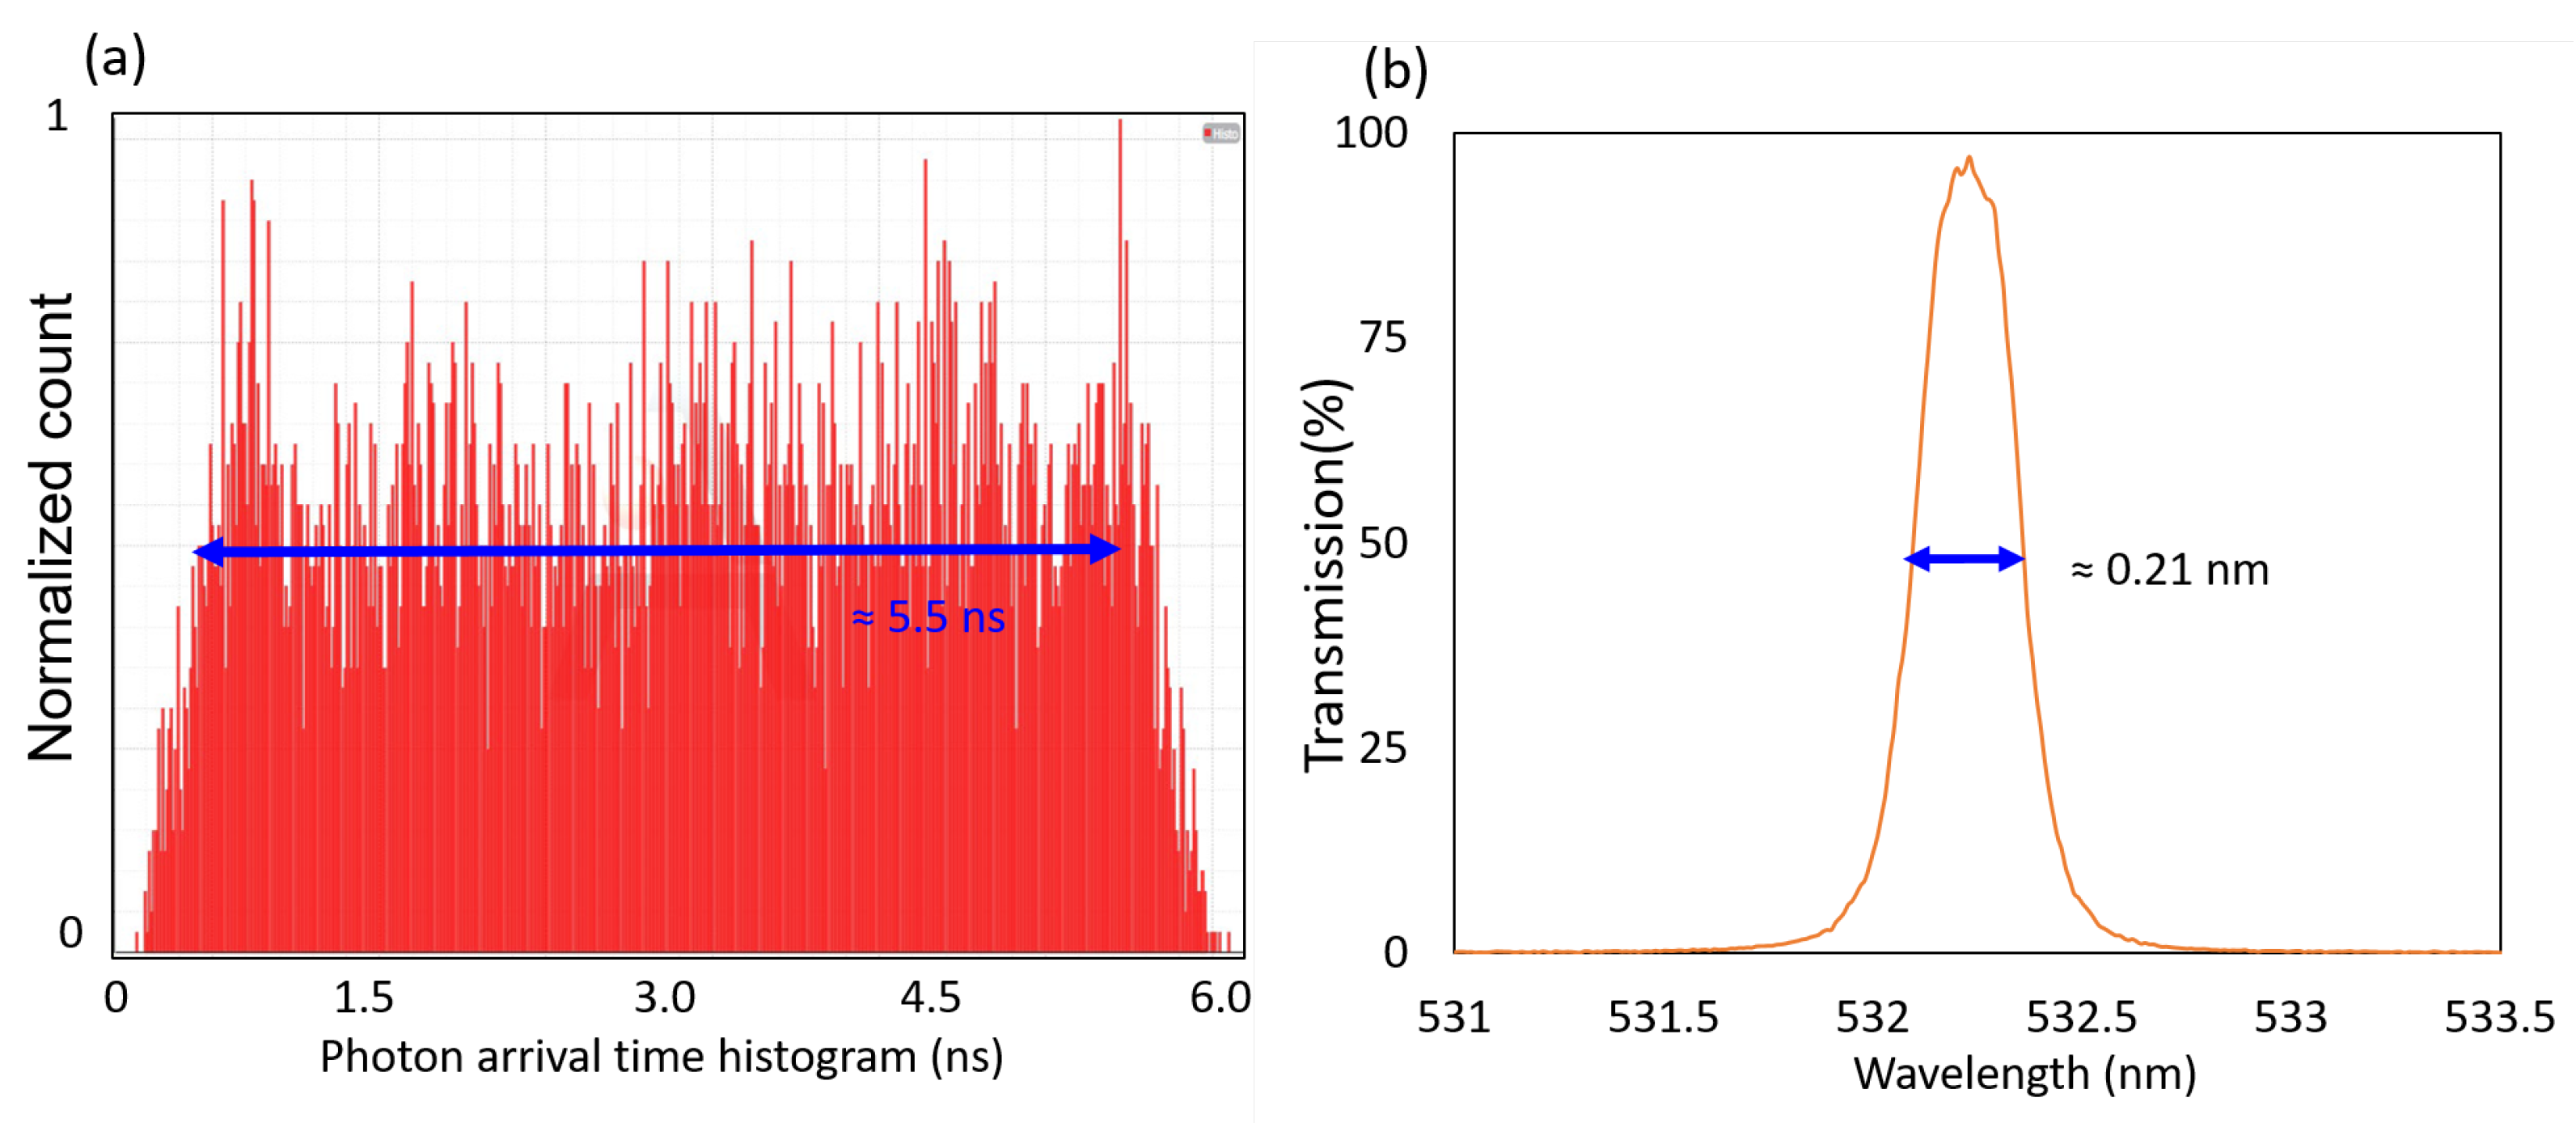
We tested and calibrated the performance of the laser source and time-gated function in the lab prior to performing atmospheric observations. The widest gating window to which the single-photon detector can be set is 80 ns, corresponding to a range of 12 m. The temporal width of the narrowest gating window is determined according to the time-tagging histogram of the detector dark counts, as shown in Figure 2a. The narrowest effective gating window of the single-photon detector is limited by the gating electronics of the detector and was measured to be ≈5.5 ns, corresponding to a range of around 0.825 m. Additionally, we applied a narrow spectral filter centered at 532.2 nm with an FWHM of 0.21 nm (shown in Figure 2b) in combination with the time-gated detector to enable operation under high-background conditions, potentially amid the solar background during daytime, to be achieved.
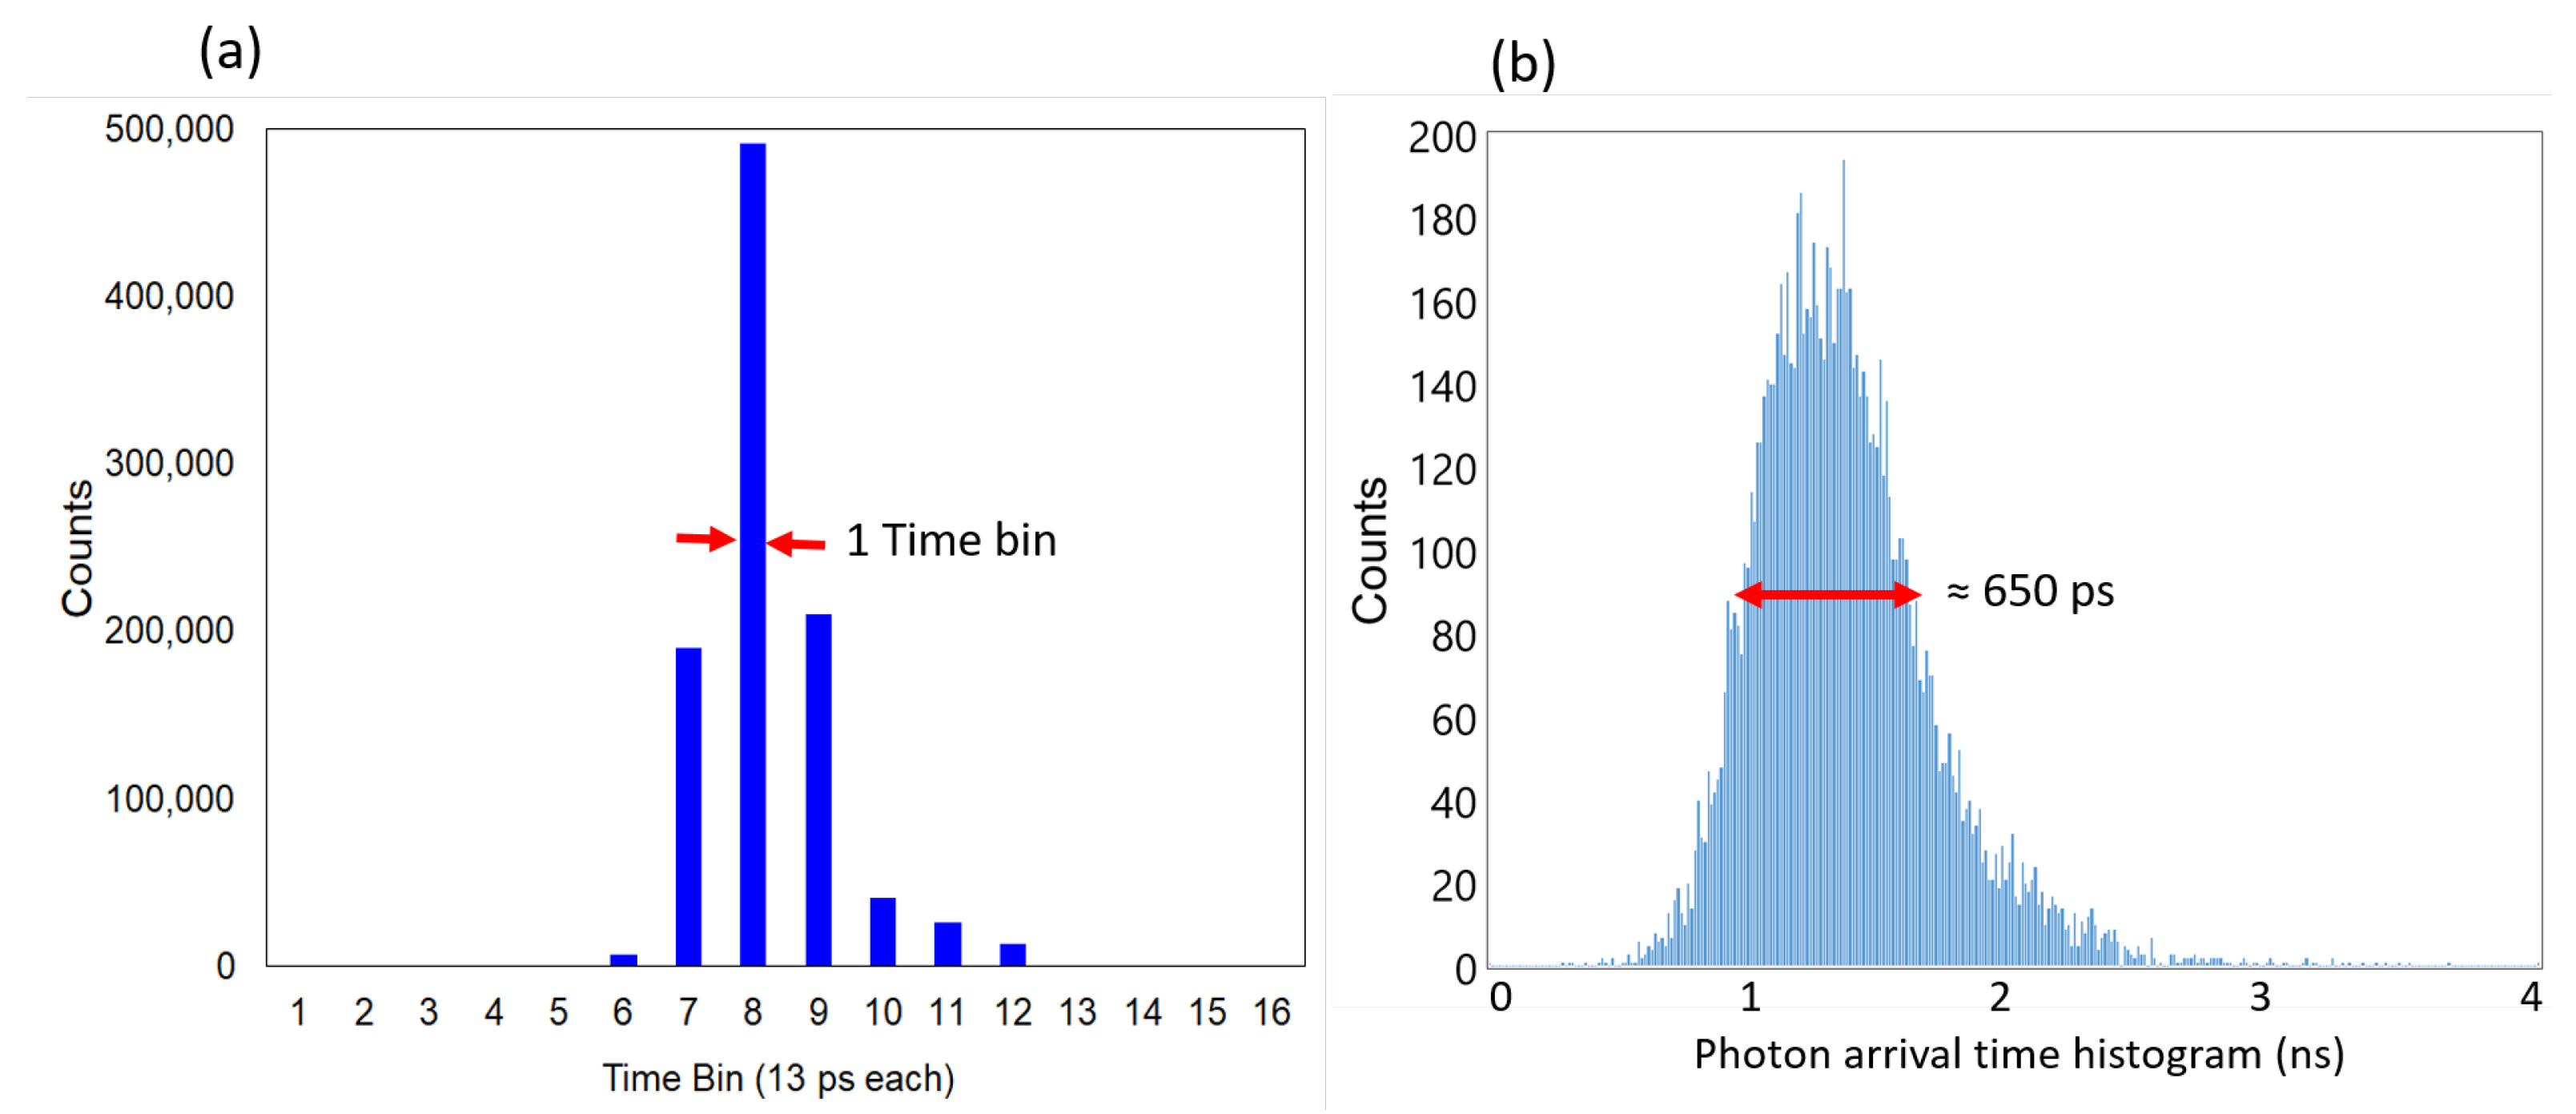
The detector, which is triggered by and synchronized to the laser, can record the arrival time of each photon received at resolution up to 45 ps. The time resolution of the detector is limited by the timing jitter of the detector and the instrument response function (IRF) of the built-in time-to-digital converter (TDC). The IRF of the TDC is limited by the timing jitter of the system reference clock derived from the pulse laser. As depicted in Figure 3a, the histogram indicates the timing jitter of the laser pulse to be <13 ps, obtained by measuring the relative time between subsequent laser pulses with a time tagger (Time Tagger Ultra; Swabian). This value is much less than the timing jitter of the single-photon detector of 45 ps. Nevertheless, the range resolution of the T2 lidar is limited by the pulse width of the laser. The FWHM of the laser pulse was measured to be 650 ps using time-correlated single-photon counting (Figure 3b), equivalent to the range resolution of ≈10 cm. The laser pulse width dominates the convoluted IRF of the T2 lidar, so that the measurement resolution of the acquisition system is not limited by the single-photon detector and TDC temporal response functions. A shorter laser pulse width (e.g., 50 ps) would be needed to achieve sub-centimeter range resolution.

2.3. Lidar Alignment

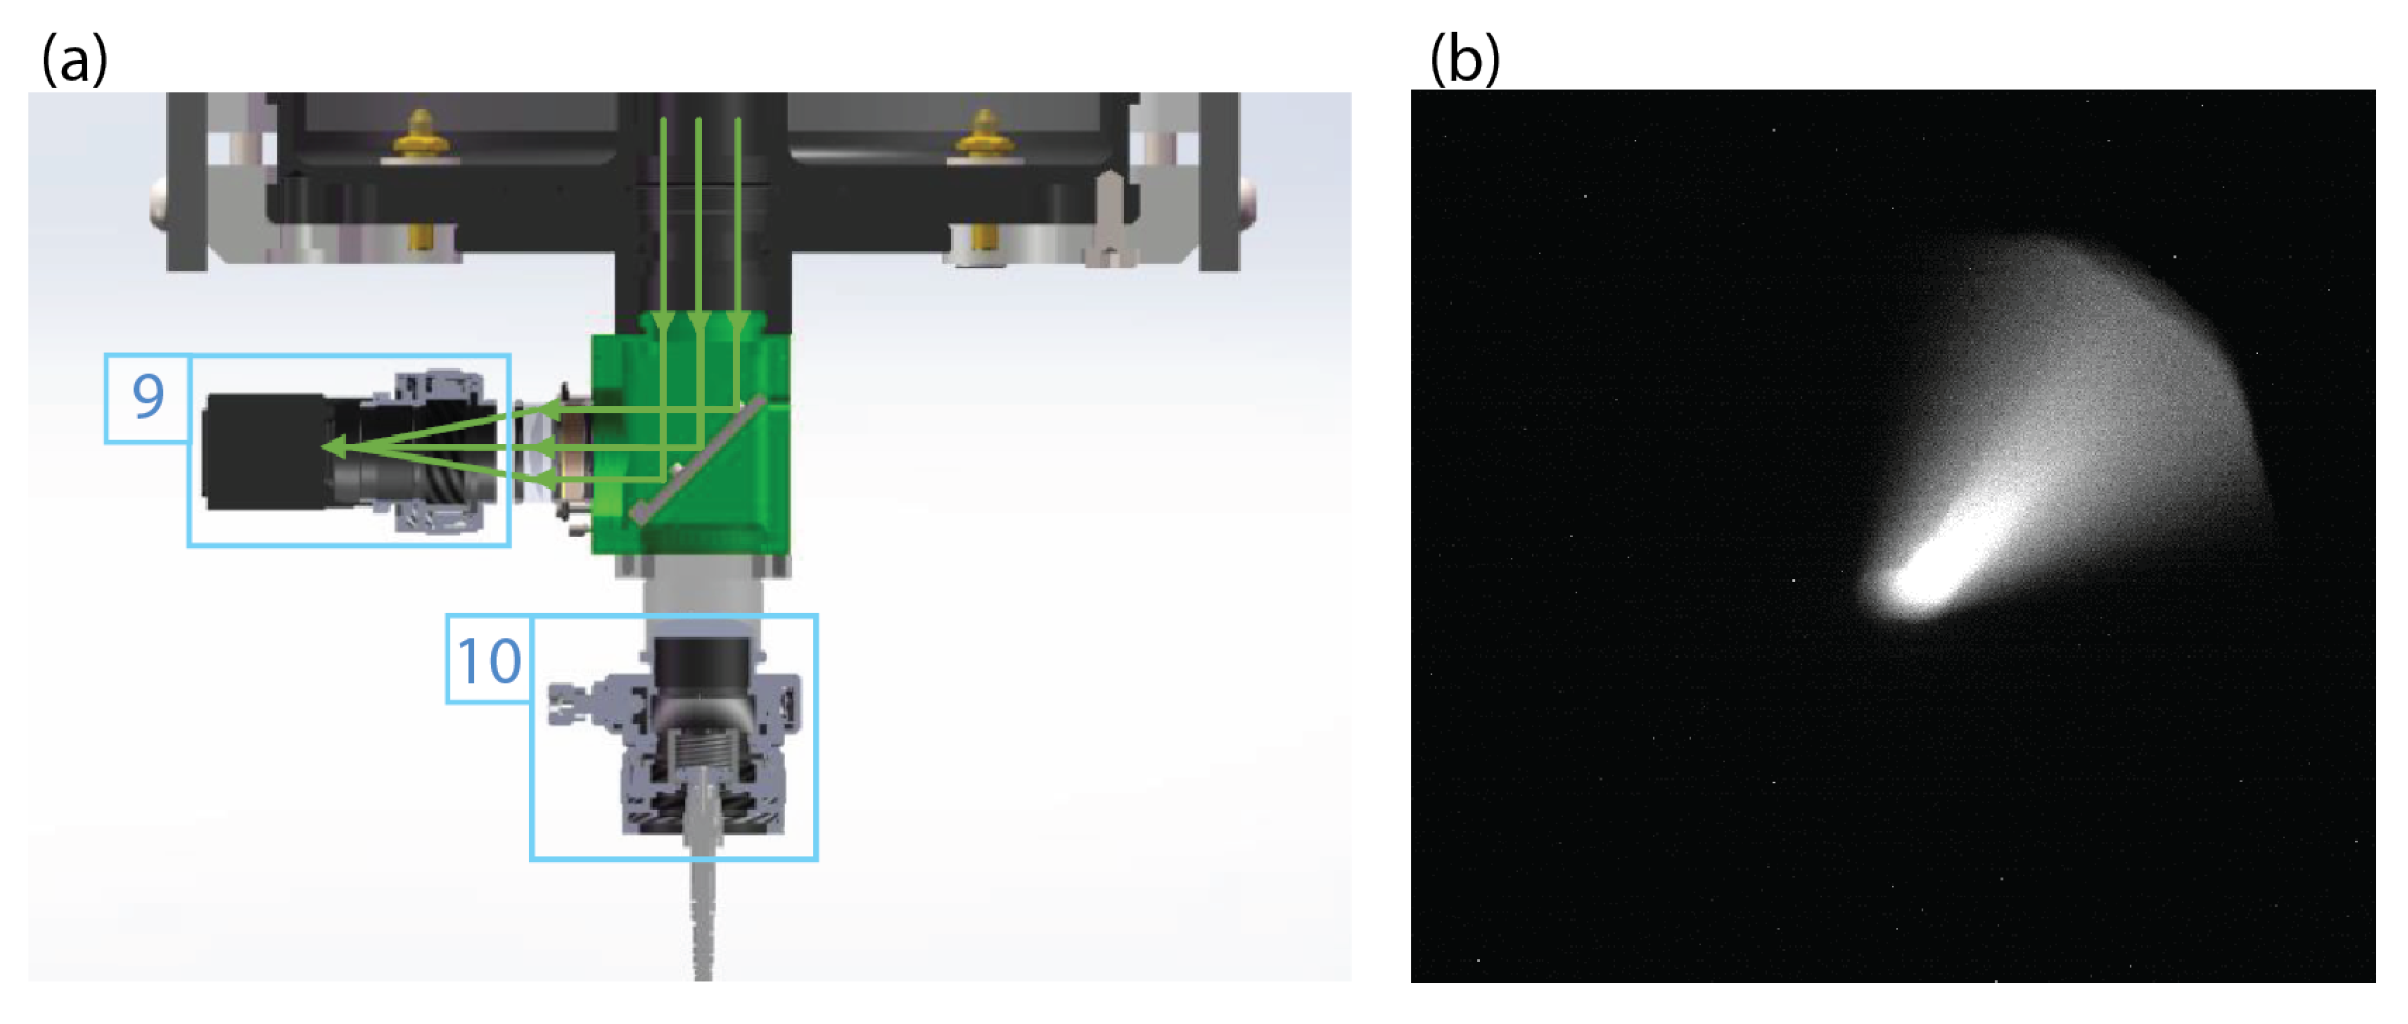
The T2 lidar performance is maximized when properly aligned. The following procedure and components were designed to align the T2 lidar: First, the flip mirror is turned to reflect all light to the side camera (9) as illustrated in Figure 4a. Motorized actuators (6 in Figure 1b) are used to bring the center of the “comet” to the middle of the camera image (Figure 4b), so that the laser beam is parallel to the telescope field of view. Once the laser is aligned, the position of the fiber is centered by adjusting the XYZ positions of the optical fiber eyepiece (10 in Figure 1b and Figure 4a) to maximize the intensity of the signal (e.g., photon-counting rate) from the detector. A similar eyepiece for the fiber is also placed at the exit of the filter case (11 in Figure 1b). The lidar underwent a similar alignment process before the atmospheric observations.

3. Results

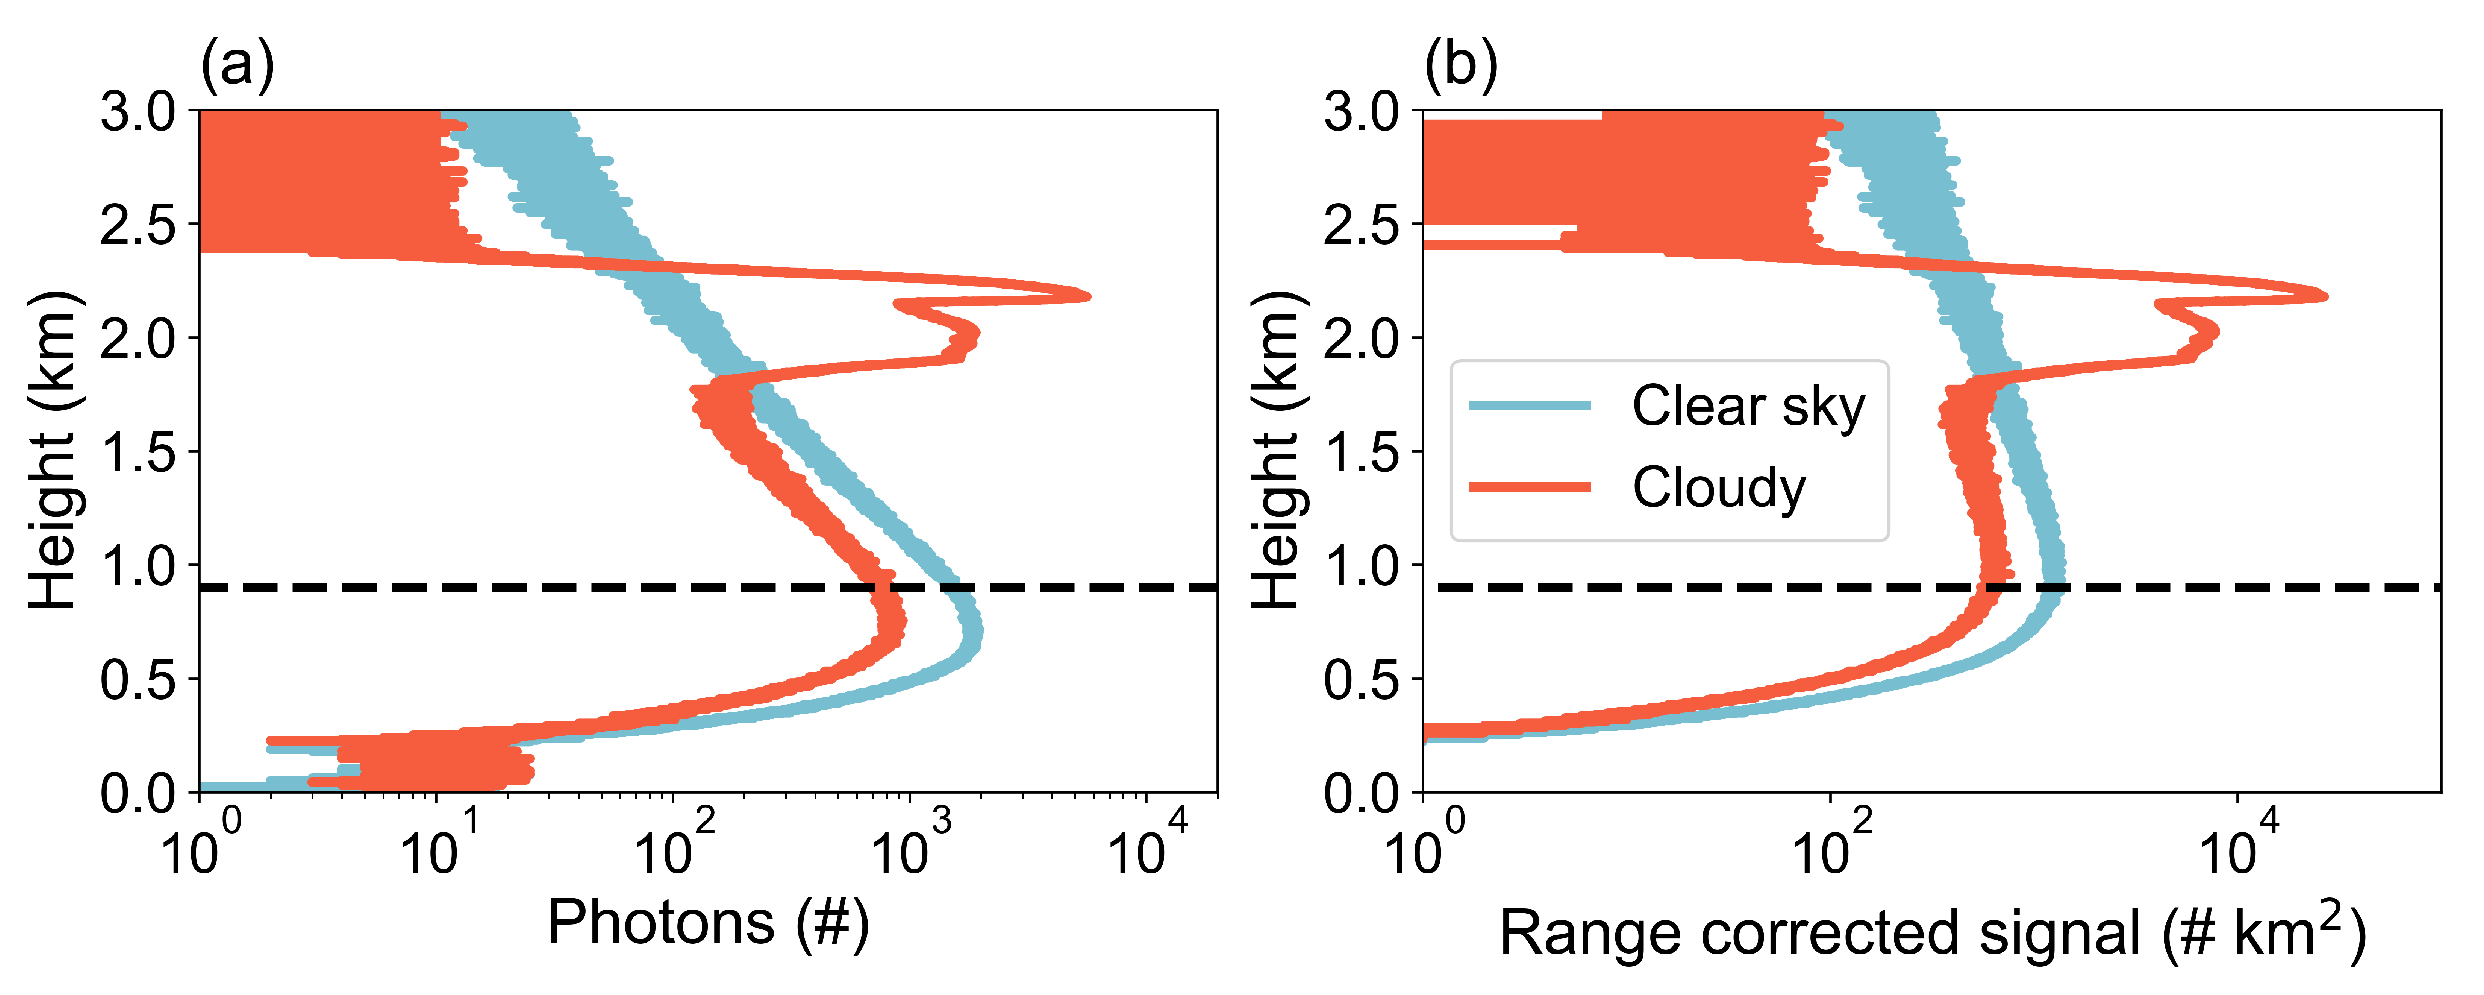
Here, we present first-light observations collected with the T2 lidar, demonstrating its capabilities to detect clouds when operated in continuous mode and explore fine cloud structures when operated in time-gated mode. Observations with the vertically pointing T2 lidar in continuous mode were obtained at the Brookhaven National Laboratory (BNL) Center for Multiscale Applied Sensing (CMAS) observational site at about 9 pm local time (LT) on June 20 (clear sky) and 21 (cloudy), 2022. Figure 5 shows the profiles of the raw signal and range-corrected photons received (i.e., product of photon amount and distance squared). As detailed in the previous section, when the lidar is operated in continuous mode, the synchronized detector remains open until a specified number of photons are recieved, in this case, 10 7 . The arrival time of each photon, with accuracy of 45 ps, was initially saved on memory and then stored on a hard drive using software provided by Aurea. All received photons were post-processed to 1 ns resolution, corresponding to the range resolution of 15 cm, as shown in Figure 5.
During the clear day (blue line in Figure 5), the range-corrected signal increased with the height up to the minimum full overlap height between the laser beam and telescope field of view, which was about 900 m. Above that height, the range-corrected signal roughly and linearly decreased with height, suggesting that the atmosphere below 2.5 km was homogeneous in terms of its scattering properties that day [33]. More effort is needed to estimate and evaluate the backscatter and extinction profiles of the T2 lidar, which will be explored in a future study. It is also interesting to see that the fluctuations in the range-corrected signal increased with the height, due to fewer photons being received at higher levels. The fluctuations are expected to be fewer if we bin the raw data to coarser range resolution or operate with a longer integration time.
During the cloudy day (red line in Figure 5), the local maximum of the range-corrected signal at about 900 m was still observable, but its magnitude was strongly suppressed compared with that on the clear sky day, and more photons were received between 1.8 km and 2.3 km due to the cloud layer. Similarly, all photons were binned to 1 ns resolution, corresponding to the range resolution of 15 cm. Such high resolution revealed fine cloud structures, including the local minimum at about 2 km. Our results suggest that the T2 lidar could be useful to explore the cloud structure close to the boundary (e.g., cloud base or edge) before the signal is strongly attenuated (e.g., above 2.4 km in this case). More effort is needed to obtain microphysically relevant variables (e.g., lidar backscattering profiles) from the raw data, which is beyond the scope of this study.
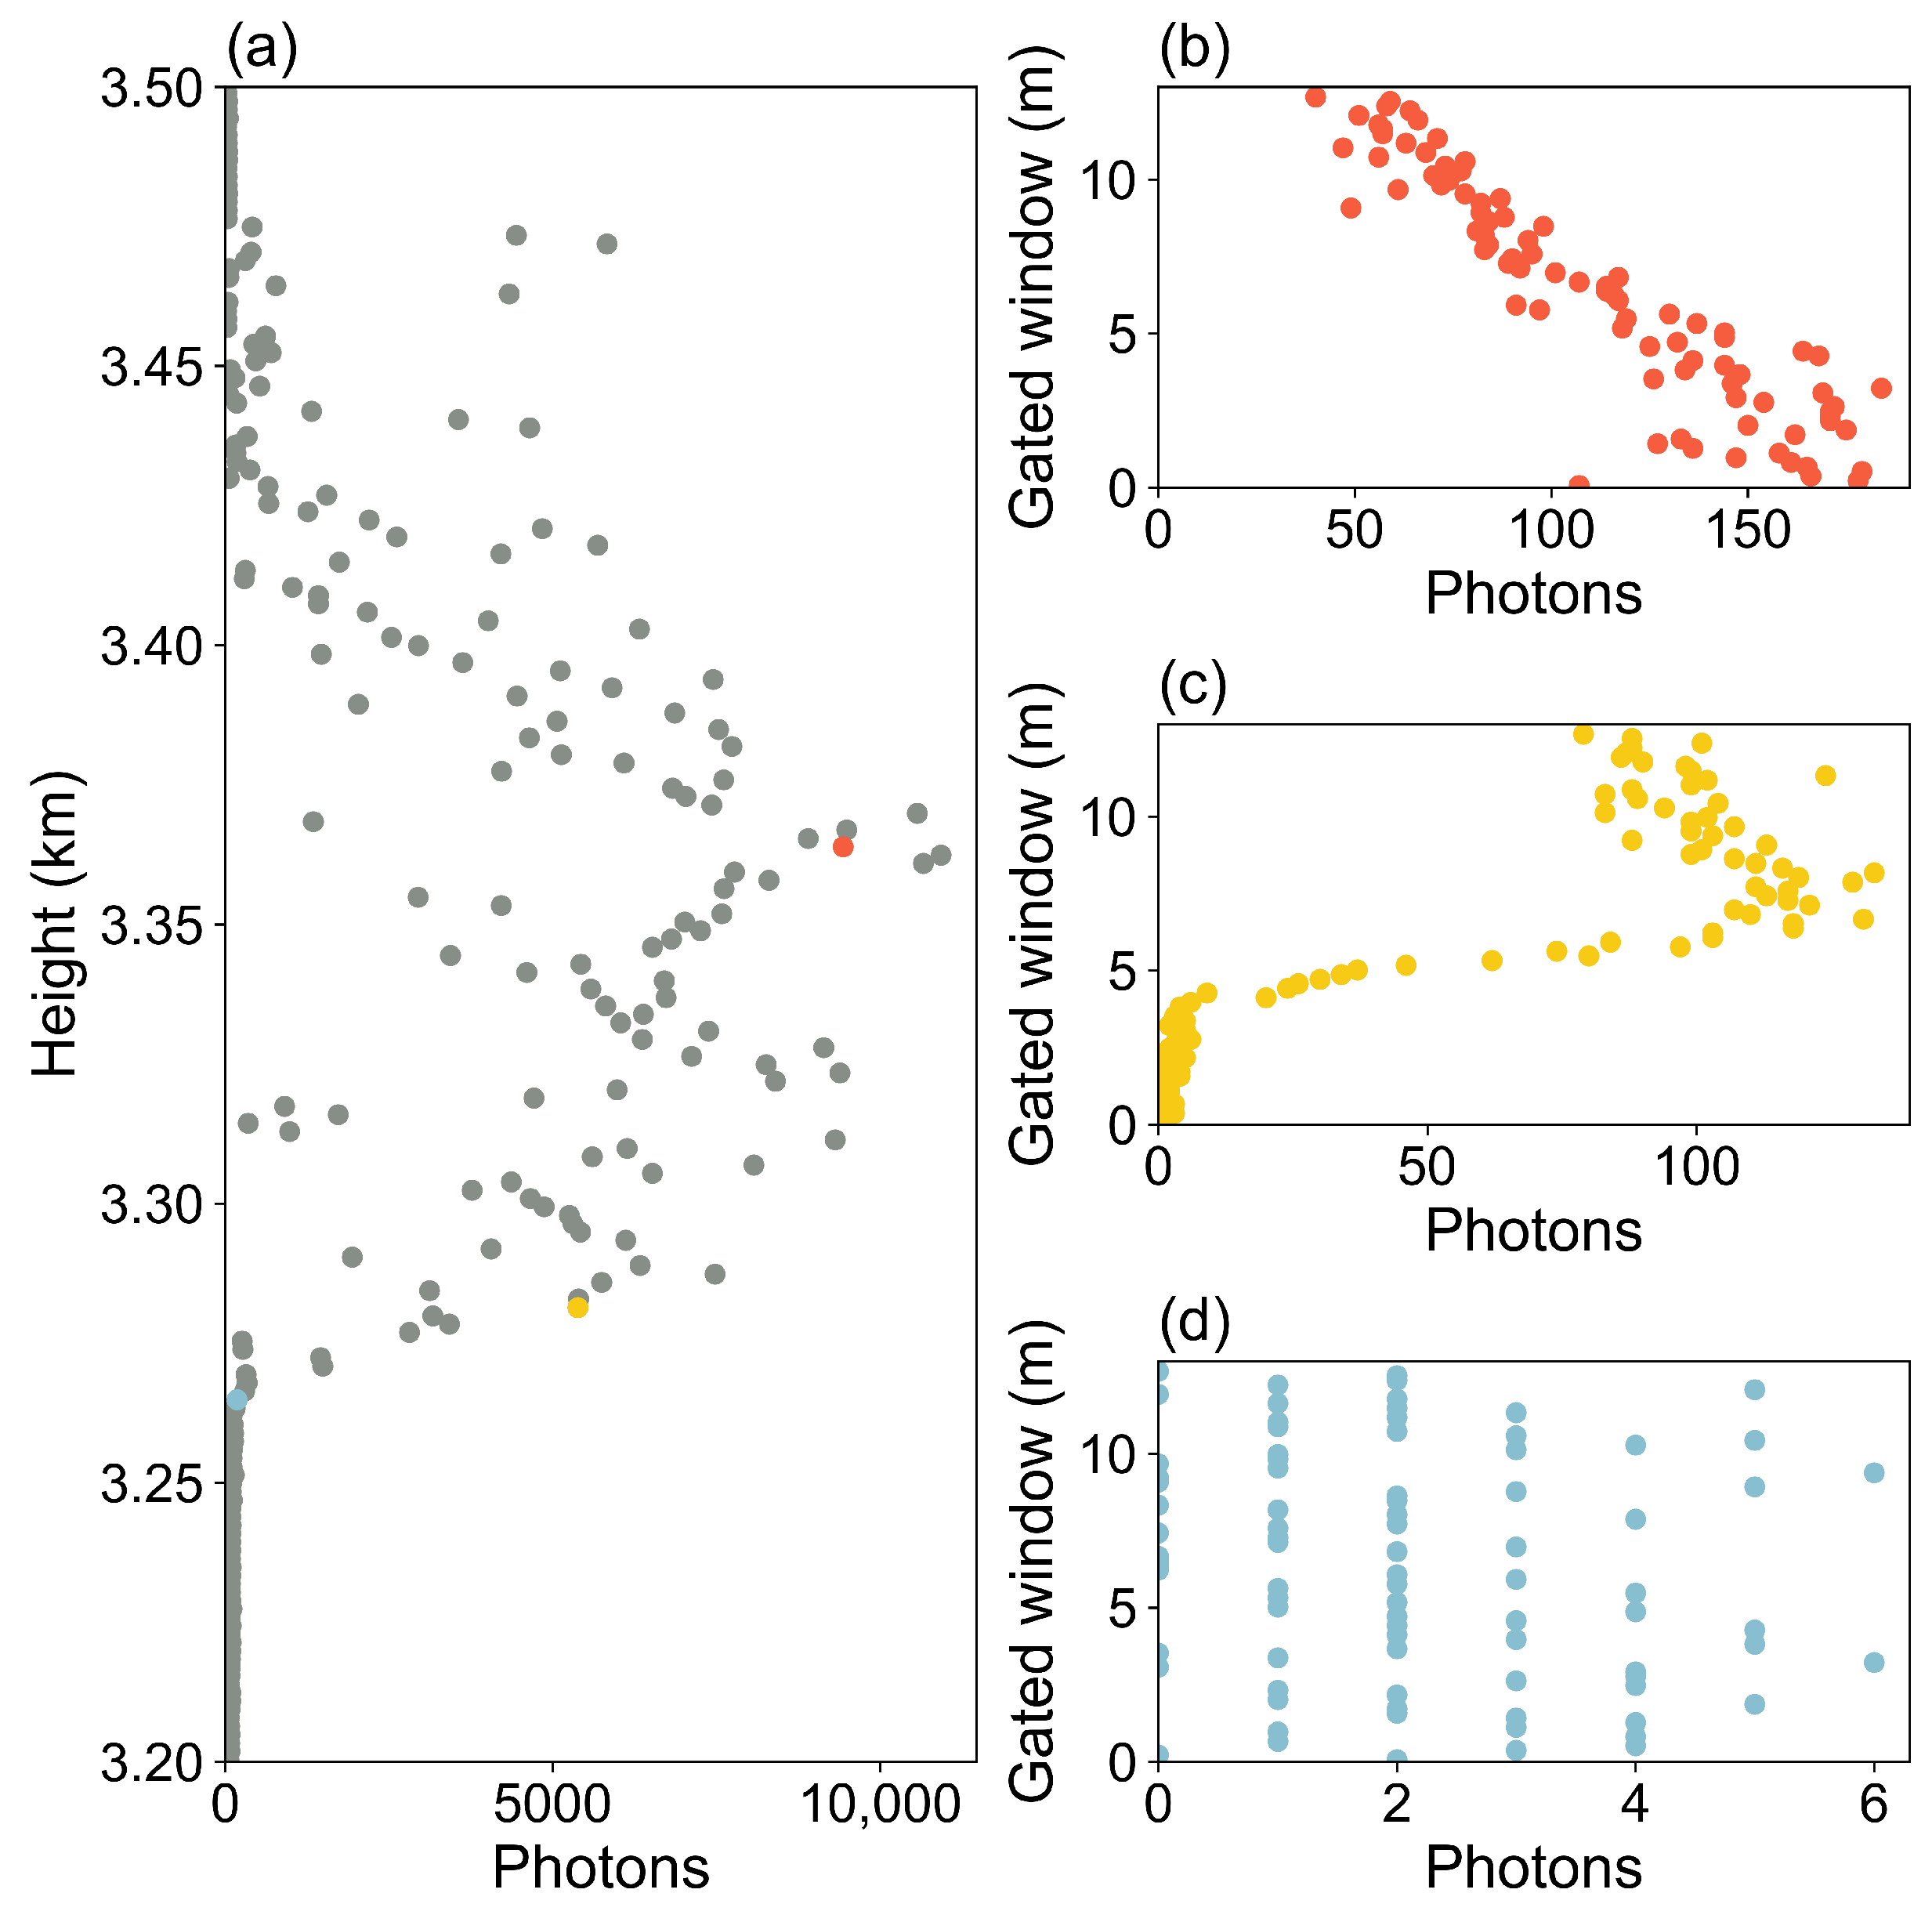
The unique capability of the T2 lidar is that it can operate in time-gated mode, where the detector is expected to only receive photons from a small region. One set of time-gated observations obtained at the BNL CMAS observational site at around 8:30 p.m. LT on 8 July 2022 is shown in Figure 6. The T2 lidar scanned through a 300 m thick layer, between 3.2 km and 3.5 km, as follows: Observations were made for 1 s starting at 3.2 km with a gated window of 80 ns, which corresponds to 12 m, meaning that the detector was constrained to only receive backscattering photons between 3.200 km and 3.212 km. After 1 s, the gated window moved upward by 10 ns (corresponding to 1.5 m), and observations were made for another 1 s, and so on, until the gated window reached 3.5 km. Figure 6a shows the total number of photons received in each gated window. A larger number of backscattered photons were observed between 3.26 and 3.48 km due to the presence of cloud droplets. The number of photons detected within one gated window for one second can be as much as 10k, significantly more than that those below 3.25 km. The arrival time of the photons received within each gated window was recorded and then processed to 1 ns resolution (corresponding to 15 cm). As discussed in Section 2.1, the gated mode records the first-arriving photons within the gated window. Here, we will qualitatively show that the distribution of the first-arriving photons within the gated window reflects the fine cloud structure.
The distributions of the received photons are shown for three gated windows selected to be inside the cloud, at the cloud base, and below the cloud. Figure 6b shows an example of in-cloud gated window, in which the number of first-arriving photons decreased with the height in the 12 m window. Figure 6c shows an example in which the cloud base is inside the gated window. The results show that the photon number suddenly increased at about 5 m above the beginning of the gated window, where the photon number increased from almost 0 to over 100 within about one meter. The cloud base was observable at submeter-scale resolution, more than one order of magnitude higher than that of typical atmospheric lidars. Figure 6d shows an example in which the gated window is below the cloud base. Photons were randomly distributed within the gated window in extremely low numbers compared with when cloud droplets were present. Our results suggest that the distribution of photons received within a gated window can reflect the fine structures therein. More theoretical and observational efforts are needed to better understand the distribution of arriving photons within the gated window and its potential connection to cloud microphysical properties, which is beyond the scope of this study.

4. Summary and Implications

A prototype time-gated, time-correlated single-photon-counting lidar, named the T2 lidar, was built for cloud observation at submeter-scale resolution. Components of the T2 lidar were carefully evaluated in the lab. Specifically, the time resolution of the time-to-digital converter, the effective gating window of the gated single-photon detector, the laser pulse width, and the spectral filtering window were characterized and calibrated prior to outdoor operation. The lidar was assembled for atmospheric measurements at the observational site of Brookhaven National Laboratory Center for Multiscale Applied Sensing. The T2 lidar emits laser pulses with a width of 650 ps, which results in range resolution down to 10 cm, two orders of magnitude finer than traditional atmospheric lidars. The wavelength of the laser is 532 nm, the same as that of micropulse lidars, which is suitable for the detection of aerosol and cloud layers.
The T2 lidar can be operated in two modes: continuous mode or time-gated mode. The continuous mode is similar to that of other single-photon-counting lidars, such as that by Barton-Grimley et al. [32], in which the detector remains open except shortly after receiving one photon due to dead time. The arrival time of each photon, which is synchronized to the firing of the laser pulse, is recorded with accuracy of 45 ps. The profiles of photons received on clear sky and cloudy days demonstrate that the T2 lidar can detect cloud layers and show fine structures therein.
The time-gated mode is a unique capability of the T2 lidar compared with other atmospheric lidars. It is the first time, as far as we know, that the time-gated technique is applied to cloud observations. In time-gated mode, the detector can be delayed to only open for a short period after each laser pulse is fired. The maximum width to which the gated window can be set is 80 ps, corresponding to a range of 12 m. The detector is expected to only receive backscattered photons within the gated window. In reality, the received photons can also arrive from background noise or dark counts, but these contributions are significantly smaller than the backscattering photons from aerosol and cloud droplets at night.
The high-resolution arrival time of photons in the gated window should provide insights into cloud microphysical properties. When the gated window is fully inside the cloud, the received photon rate can be over 10k per second. Note that, theoretically, the maximum photon rate that can be achieved in time-gated mode equals the pulse repetition rate, which is 20.8k per second for the T2 lidar. When the cloud base is inside the gated window, a sharp increase in photon number is observed. The sharp boundary at the cloud base is a common phenomenon based on observations performed using the T2 lidar on other days. Our results suggest that the cloud-base boundary can be as sharp as tens of centimeters, which could not be resolved using typical atmospheric lidars with range resolution in the order of 10 m. When the gated window is below the cloud base, the photon rate is much lower, and the arriving photons are randomly distributed within the gated window. It should be mentioned that the T2 lidar is a prototype. More effort is needed to improve the system (including system control, data acquisition, and data post-processing) to better understand the performance of the lidar and the physical meaning of the obtained raw data, as well as the connection to cloud microphysical properties.
In summary, the initial high-resolution observations of atmospheric clouds shown in this study confirm the capability of the T2 lidar to observe cloud structures at submeter scales, shedding light on cloud microphysical processes at the fundamental level. More observations are needed to understand the performance of the lidar both in the daytime and at nighttime under different weather conditions. Theoretical investigations are also needed to advance our understanding of the raw data and their potential connection to cloud microphysical properties. It is also practicable to apply the time-gated, time-correlated single-photon-counting technique to other types of ground-based lidars, as well as airborne or spaceborne lidars. Next-generation high-resolution lidars, such as the time-correlated single-photon-counting lidar developed by Barton-Grimley et al. [32] and the T2 lidar in this study, are expected to yield new insights into fine-scale cloud microphysical properties and processes that have not been fully explored before due to the resolution limitations of current remote sensing instruments.

Author Contributions

Conceptualization, F.Y., Y.M.S., A.L. and K.L.; methodology, F.Y.; software, F.Y. and Y.M.S.; validation, F.Y. and Y.M.S.; formal analysis, F.Y.; investigation, F.Y.; resources, F.Y. and K.L.; data curation, F.Y. and Z.Z.; writing—original draft preparation, F.Y. and Y.M.S.; writing—review and editing, K.L., Z.Z., E.L., A.L., A.M.V., P.K. and A.M.; visualization, F.Y.; supervision, Y.-P.H., A.M.V., P.K. and A.M.; project administration, A.M.V. and P.K.; funding acquisition, A.M. All authors have read and agreed to the published version of the manuscript.

Funding

This work was supported by Brookhaven National Laboratory Program Development award No. 20-012 and Laboratory Directed Research and Development Program award No. 21-039.

Data Availability Statement

The data presented in this study are available on request from the corresponding author.

Acknowledgments

F.Y. acknowledges discussions with and support from Martin Schoonen, David Asner, Gabriella Carini, Paul O’Connor, and Thomas Tsang through projects funded by Brookhaven National Laboratory Program Development award No. 20-012 and Laboratory Directed Research and Development Program award No. 21-039. Part of the data analysis and paper writing was completed during F.Y.’s visit at KITP as part of the Multiphase Flows in Geophysics and the Environment program. The KITP visit was supported in part by National Science Foundation under grant No. NSF PHY-1748958 and by Biological and Environmental Research Program in the US Department of Energy, Office of Science, through contract No. DE-SC0012704 to Brookhaven National Laboratory.

Conflicts of Interest

Z.Z. is a guest editor for the Remote Sensing Special Issue “Remote Sensing of Aerosol, Cloud and Their Interactions”. The authors declare no conflict of interest. The funders had no role in the design of the study; in the collection, analyses, or interpretation of data; in the writing of the manuscript; or in the decision to publish the results.

Abbreviations

The following abbreviations are used in this manuscript:
LidarLight detection and ranging
TCSPCTime-correlated single-photon counting
T2 lidarTime-gated, time-correlated single-photon-counting lidar
DOEDepartment of Energy
ARMAtmospheric Radiation Measurement
BNLBrookhaven National Laboratory
CMASCenter for Multiscale Applied Sensing

References

  1. Stith, J.L.; Baumgardner, D.; Haggerty, J.; Hardesty, R.M.; Lee, W.C.; Lenschow, D.; Pilewskie, P.; Smith, P.L.; Steiner, M.; Vömel, H. 100 years of progress in atmospheric observing systems. Meteorol. Monogr. 2018, 59, 2.1–2.55. [Google Scholar] [CrossRef]
  2. Schmid, B.; Ellingson, R.G.; McFarquhar, G.M. ARM aircraft measurements. Meteorol. Monogr. 2016, 57, 10.1–10.13. [Google Scholar] [CrossRef]
  3. Wilczak, J.; Gossard, E.; Neff, W.; Eberhard, W. Ground-based remote sensing of the atmospheric boundary layer: 25 years of progress. In Boundary-Layer Meteorology 25th Anniversary Volume; Springer: Dordrecht, The Netherlands, 1996; Volume 78, pp. 321–349. [Google Scholar] [CrossRef]
  4. Ackerman, S.; Platnick, S.; Bhartia, P.; Duncan, B.; L’ecuyer, T.; Heidinger, A.; Skofronick-Jackson, G.; Loeb, N.; Schmit, T.; Smith, N. Satellites see the world’s atmosphere. Meteorol. Monogr. 2019, 59, 4.1–4.53. [Google Scholar] [CrossRef]
  5. Wang, Z.; Menenti, M. Challenges and Opportunities in Lidar Remote Sensing. Front. Remote Sens. 2021, 2, 641723. [Google Scholar] [CrossRef]
  6. Illingworth, A.; Hogan, R.; O’connor, E.; Bouniol, D.; Brooks, M.; Delanoë, J.; Donovan, D.; Eastment, J.; Gaussiat, N.; Goddard, J.; et al. Cloudnet: Continuous evaluation of cloud profiles in seven operational models using ground-based observations. Bull. Am. Meteorol. Soc. 2007, 88, 883–898. [Google Scholar] [CrossRef] [Green Version]
  7. Stevens, B.; Farrell, D.; Hirsch, L.; Jansen, F.; Nuijens, L.; Serikov, I.; Brügmann, B.; Forde, M.; Linne, H.; Lonitz, K.; et al. The Barbados Cloud Observatory: Anchoring investigations of clouds and circulation on the edge of the ITCZ. Bull. Am. Meteorol. Soc. 2016, 97, 787–801. [Google Scholar] [CrossRef]
  8. Sarna, K.; Russchenberg, H.W. Monitoring aerosol–cloud interactions at the CESAR Observatory in the Netherlands. Atmos. Meas. Tech. 2017, 10, 1987–1997. [Google Scholar] [CrossRef] [Green Version]
  9. Hey, J.D.V. A Novel Lidar Ceilometer: Design, Implementation and Characterisation. Ph.D. Thesis, Loughborough University, Loughborough, UK, 2015. [Google Scholar] [CrossRef]
  10. Morris, V.R. Ceilometer Instrument Handbook; Technical Report; DOE Office of Science Atmospheric Radiation Measurement (ARM) User Facility: Washington, DC, USA, 2016. [Google Scholar] [CrossRef] [Green Version]
  11. Flynna, C.J.; Mendozaa, A.; Zhengb, Y.; Mathurb, S. Novel polarization-sensitive micropulse lidar measurement technique. Opt. Express 2007, 15, 2785–2790. [Google Scholar] [CrossRef]
  12. Muradyan, P.; Coulter, R. Micropulse Lidar (MPL) Handbook; Technical Report; DOE Office of Science Atmospheric Radiation Measurement (ARM) User Facility: Washington, DC, USA, 2020. [Google Scholar] [CrossRef] [Green Version]
  13. Grund, C.J.; Banta, R.M.; George, J.L.; Howell, J.N.; Post, M.J.; Richter, R.A.; Weickmann, A.M. High-resolution Doppler lidar for boundary layer and cloud research. J. Atmos. Ocean Technol. 2001, 18, 376–393. [Google Scholar] [CrossRef]
  14. Newsom, R.; Krishnamurthy, R. Doppler Lidar (DL) Instrument Handbook; Technical Report; DOE Office of Science Atmospheric Radiation Measurement (ARM) User Facility: Washington, DC, USA, 2020. [Google Scholar] [CrossRef] [Green Version]
  15. Hair, J.W.; Hostetler, C.A.; Cook, A.L.; Harper, D.B.; Ferrare, R.A.; Mack, T.L.; Welch, W.; Izquierdo, L.R.; Hovis, F.E. Airborne high spectral resolution lidar for profiling aerosol optical properties. Appl. Opt. 2008, 47, 6734–6752. [Google Scholar] [CrossRef] [Green Version]
  16. Goldsmith, J. High Spectral Resolution Lidar (HSRL) Instrument Handbook; Technical Report; DOE Office of Science Atmospheric Radiation Measurement (ARM) User Facility: Washington, DC, USA, 2016. [Google Scholar] [CrossRef]
  17. Engelmann, R.; Kanitz, T.; Baars, H.; Heese, B.; Althausen, D.; Skupin, A.; Wandinger, U.; Komppula, M.; Stachlewska, I.S.; Amiridis, V.; et al. The automated multiwavelength Raman polarization and water-vapor lidar Polly XT: The neXT generation. Atmos. Meas. Tech. 2016, 9, 1767–1784. [Google Scholar] [CrossRef] [Green Version]
  18. Newsom, R.K.; Bambha, R.; Chand, D. Raman Lidar (RL) Instrument Handbook; Technical Report; DOE Office of Science Atmospheric Radiation Measurement (ARM) User Facility: Washington, DC, USA, 2021. [Google Scholar] [CrossRef] [Green Version]
  19. Endo, S.; Zhang, D.; Vogelmann, A.M.; Kollias, P.; Lamer, K.; Oue, M.; Xiao, H.; Gustafson, W.I., Jr.; Romps, D.M. Reconciling differences between large-eddy simulations and Doppler lidar observations of continental shallow cumulus cloud-base vertical velocity. Geophys. Res. Lett. 2019, 46, 11539–11547. [Google Scholar] [CrossRef] [Green Version]
  20. Shaw, R.A. Particle-turbulence interactions in atmospheric clouds. Annu. Rev. Fluid Mech. 2003, 35, 183–227. [Google Scholar] [CrossRef] [Green Version]
  21. Beals, M.A.; Fugal, J.P.; Shaw, R.A.; Lu, J.; Spuler, S.M.; Stith, J.L. Holographic measurements of inhomogeneous cloud mixing at the centimeter scale. Science 2015, 350, 87–90. [Google Scholar] [CrossRef] [Green Version]
  22. Bogenschutz, P.A.; Krueger, S.K. A simplified PDF parameterization of subgrid-scale clouds and turbulence for cloud-resolving models. J. Adv. Model. Earth Syst. 2013, 5, 195–211. [Google Scholar] [CrossRef]
  23. Hoffmann, F.; Feingold, G. Entrainment and mixing in stratocumulus: Effects of a new explicit subgrid-scale scheme for large-eddy simulations with particle-based microphysics. J. Atmos. Sci. 2019, 76, 1955–1973. [Google Scholar] [CrossRef]
  24. Morrison, H.; van Lier-Walqui, M.; Fridlind, A.M.; Grabowski, W.W.; Harrington, J.Y.; Hoose, C.; Korolev, A.; Kumjian, M.R.; Milbrandt, J.A.; Pawlowska, H.; et al. Confronting the challenge of modeling cloud and precipitation microphysics. J. Adv. Model. Earth Syst. 2020, 12, e2019MS001689. [Google Scholar] [CrossRef]
  25. Rehain, P.; Sua, Y.M.; Zhu, S.; Dickson, I.; Muthuswamy, B.; Ramanathan, J.; Shahverdi, A.; Huang, Y.P. Noise-tolerant single photon sensitive three-dimensional imager. Nat. Commun. 2020, 11, 921. [Google Scholar] [CrossRef] [Green Version]
  26. Wallace, A.; Nichol, C.; Woodhouse, I. Recovery of Forest Canopy Parameters by Inversion of Multispectral LiDAR Data. Remote Sens. 2012, 4, 509–531. [Google Scholar] [CrossRef] [Green Version]
  27. Inomata, T.; Triadan, D.; Vázquez López, V.A.; Fernandez-Diaz, J.C.; Omori, T.; Méndez Bauer, M.B.; García Hernández, M.; Beach, T.; Cagnato, C.; Aoyama, K.; et al. Monumental architecture at Aguada Fénix and the rise of Maya civilization. Nature 2020, 582, 530–533. [Google Scholar] [CrossRef] [PubMed]
  28. Isbaner, S.; Karedla, N.; Ruhlandt, D.; Stein, S.C.; Chizhik, A.; Gregor, I.; Enderlein, J. Dead-time correction of fluorescence lifetime measurements and fluorescence lifetime imaging. Opt. Express 2016, 24, 9429–9445. [Google Scholar] [CrossRef] [PubMed] [Green Version]
  29. Titchener, J.; Millington-Smith, D.; Goldsack, C.; Harrison, G.; Dunning, A.; Ai, X.; Reed, M. Single photon Lidar gas imagers for practical and widespread continuous methane monitoring. Appl. Energy 2022, 306, 118086. [Google Scholar] [CrossRef]
  30. Zhu, S.; Sua, Y.M.; Rehain, P.; Huang, Y.P. Single photon imaging and sensing of highly obscured objects around the corner. Opt. Express 2021, 29, 40865–40877. [Google Scholar] [CrossRef]
  31. Roberts, G.W.; Ali-Bakhshian, M. A Brief Introduction to Time-to-Digital and Digital-to-Time Converters. IEEE Trans. Circuits Syst. II Express Briefs 2010, 57, 153–157. [Google Scholar] [CrossRef]
  32. Barton-Grimley, R.A.; Stillwell, R.A.; Thayer, J.P. High resolution photon time-tagging lidar for atmospheric point cloud generation. Opt. Express 2018, 26, 26030–26044. [Google Scholar] [CrossRef]
  33. Kovalev, V.A.; Eichinger, W.E. Elastic Lidar: Theory, Practice, and Analysis Methods; John Wiley & Sons: Hoboken, NJ, USA, 2004. [Google Scholar] [CrossRef]
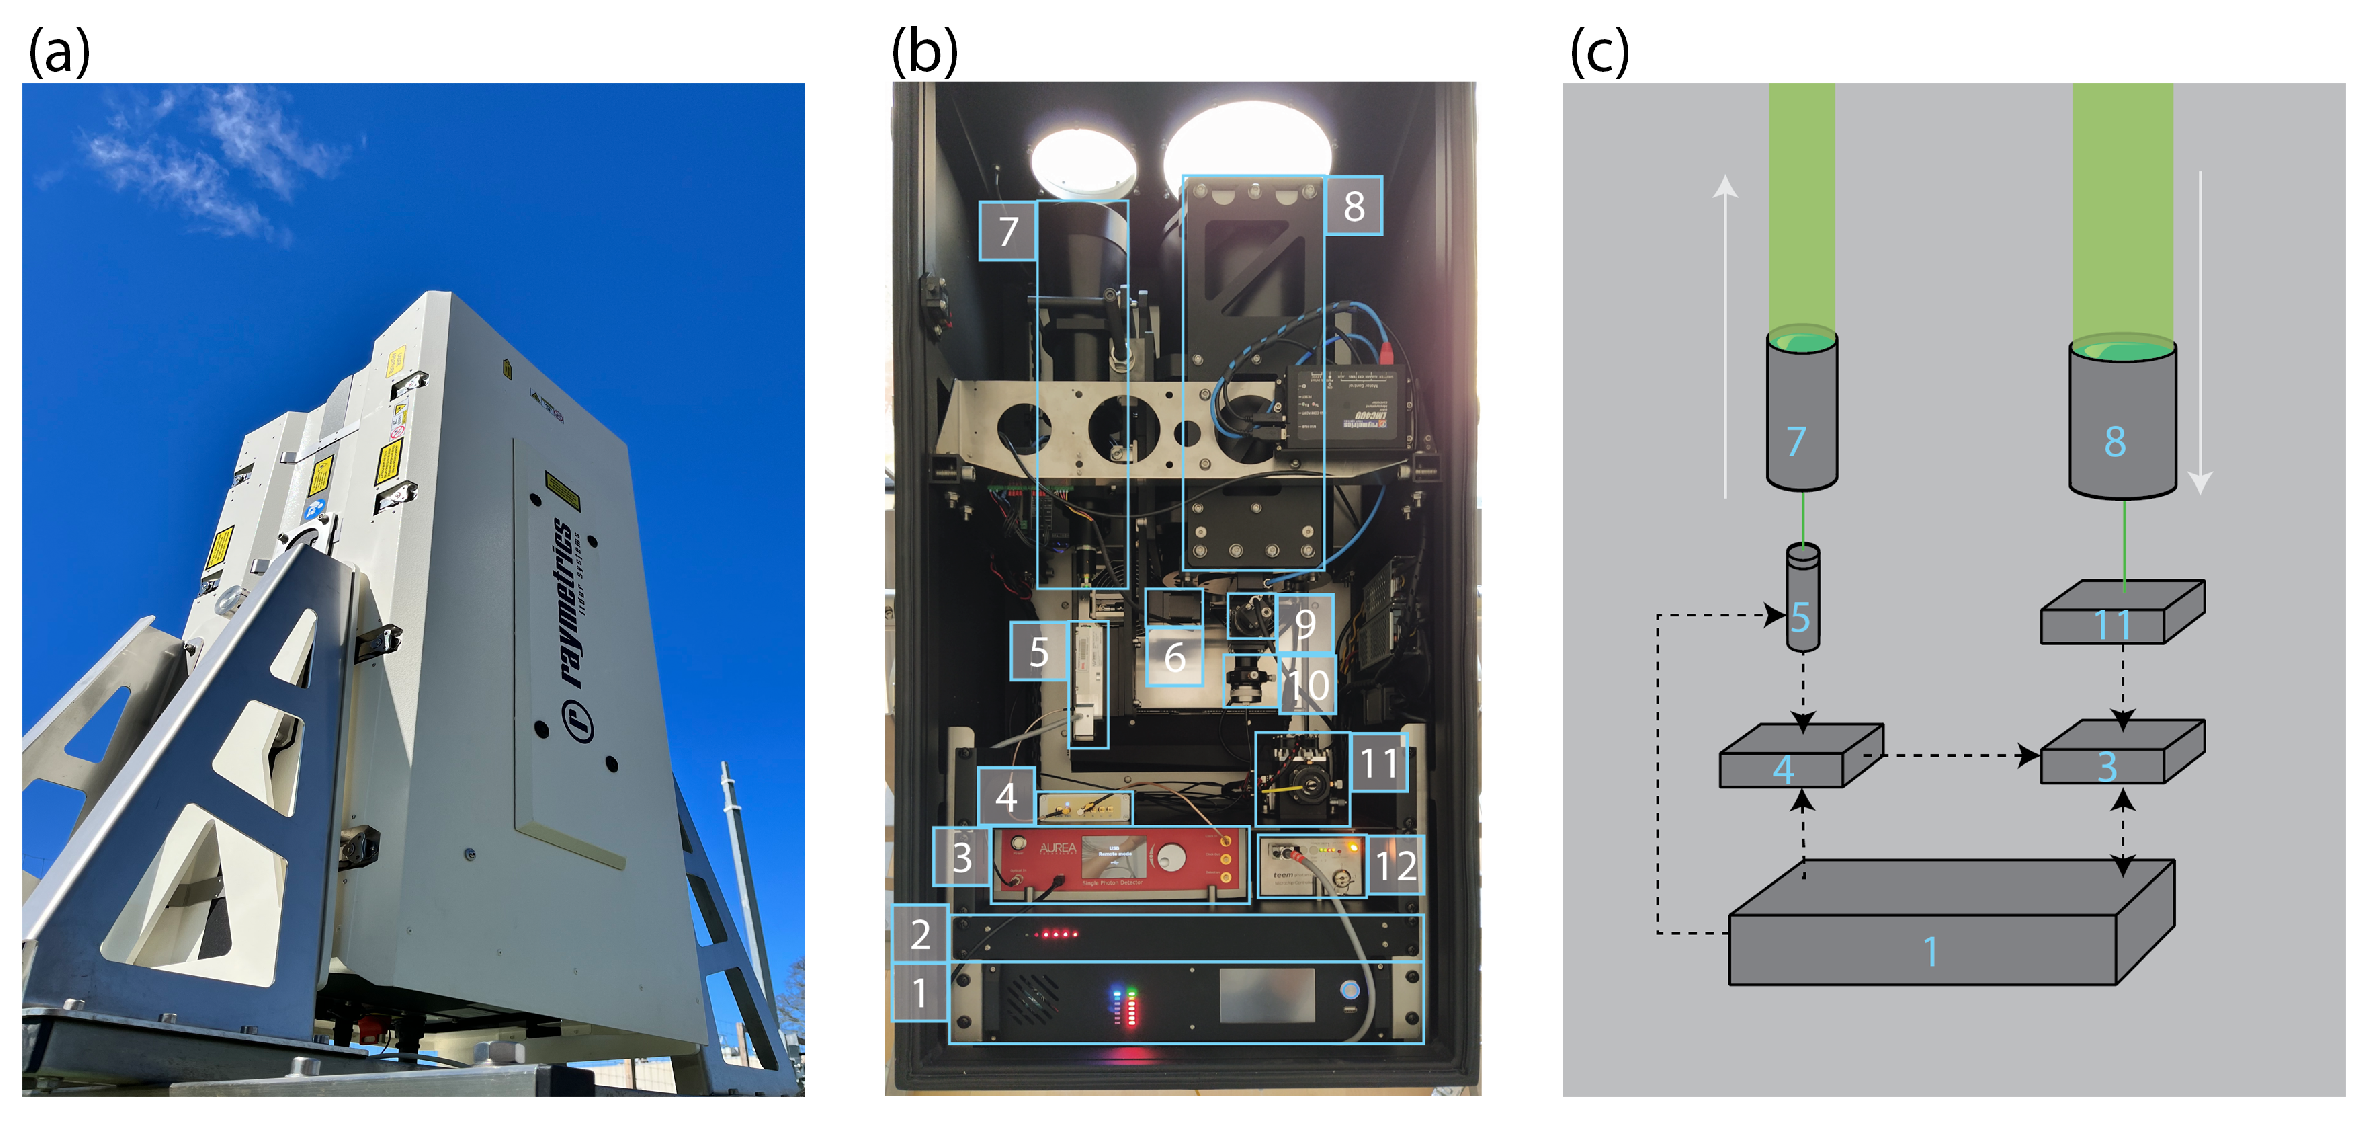
Figure 1. (a) Photo of exterior of T2 lidar. (b) Photo of interior of T2 lidar. (c) Lidar component flow diagram. Numbered components are detailed in Table 1.
Remotesensing 15 01500 g001
Figure 2. (a) Time-tagging histogram of the time-gated single-photon detector dark counts (without optical signal input) showing the minimum effective temporal gate width of ≈5.5 ns. (b) Spectrum of the optical bandpass filter obtained using a broadband light source and an optical spectrum analyzer. The filtering window of the laser source was calibrated at the center wavelength of 532.2 nm with an FWHM of 0.21 nm.
Remotesensing 15 01500 g002
Figure 3. (a) Timing jitter histogram of the system reference clock derived using the pulse laser verifying the time resolution to be <13 ps. (b) Histogram of arrival time with an attenuated laser pulse by the means of time-correlated single-photon-counting measurement integrated over 10 s, indicating an FWHM pulse width of ≈650 ps.
Remotesensing 15 01500 g003
Figure 4. (a) Schematic diagram illustrating how the camera is used for lidar alignment. (b) Camera image of aligned lidar.
Remotesensing 15 01500 g004
Figure 5. (a) Raw signal and (b) range-corrected photons received by the T2 lidar operated in continuous mode. The returns with a clear sky after sunset at 9 pm LT on 20 June 2022 (blue line) and a cloudy sky after sunset at 8:40 p.m are shown. LT on 21 June 2022 (red line). The arrival time data of received photons were binned to 1 ns, corresponding to the range resolution of 15 cm. The horizontal dashed line indicates the minimum full overlap height of about 900 m.
Remotesensing 15 01500 g005
Figure 6. (a) Profiles of photons received with the vertically pointing T2 lidar operating in time-gated mode. Each point represents the number of photons received from a specific height in an 80 ns gated window (corresponding to 12 m) within 1 s. The subpanels on the right show the distribution of photons received within three selected gated windows at the locations given in (a) by colored points coded to match the color used in each subpanel: (b) inside the cloud (red), (c) at the cloud base (yellow), and (d) below the cloud base (blue). The arrival times of photons within each gated window were binned to 1 ns, corresponding to 15 cm range resolution.
Remotesensing 15 01500 g006
Table 1. List of T2 lidar components.
NumberComponent
1Lidar peripheral controller and computer
2Programmable power distribution unit
3Single-photon detector with built-in time-to-digital converter
4Digital delay pulse generator
5Laser head
6Motorized actuator for laser alignment
7Beam expander
8Telescope
9Camera with focuser for laser alignment
10Optical fiber eyepiece with XYZ adjustments for laser alignment
11Triple-filter case
12Laser power supply and control unit
Table 2. Summary of the T2 lidar parameters.
System ParameterValue
Wavelength532 nm
Laser repetition rate20.6 kHz
Laser pulse width650 ps
Laser output energy≈3.4 μ J
Beam divergence≈0.029 mrad
Polarization≈Linear
Receiver telescope aperture≈200 mm
Maximum range≈7.28 km
Range resolution≈10 cm
Filter spectral width (FWHM)≈0.21 nm
Narrowest temporal gating≈5.5 ns
Photon-counting integration time125 ms
Detector quantum efficiency≈65 %
Detector dark-count rate≈50 Hz
Detector time resolution45 ps
Disclaimer/Publisher’s Note: The statements, opinions and data contained in all publications are solely those of the individual author(s) and contributor(s) and not of MDPI and/or the editor(s). MDPI and/or the editor(s) disclaim responsibility for any injury to people or property resulting from any ideas, methods, instructions or products referred to in the content.