Abstract
UAVs have recently become a very popular tool for acquiring geospatial data. Photographs, films, images, and results of measurements of various sensors from them constitute source material for generating, among other things, photographic documentation, visualisation of places and objects, cartographic materials and 3D models. These models are not only material for the visualisation of objects but are also source material for spatial analysis, including the assessment and analyses of the solar potential of buildings. This research aims to benchmark the feasibility of using UAV-derived data acquired from three sensors, namely the DJI Zenmuse P1 camera, the Share PSDK102S v2 multi-lens camera and the DJI Zenmuse L1 laser scanner. The data from these were acquired for the construction of comprehensive and reliable 3D models, which will form the basis for generating solar potential maps. Various sensors, data storage formats, and geospatial data processing capabilities are analysed to determine the most optimal and efficient solution for providing accurate, complete and reliable 3D models of places and objects for the construction of solar potential maps. In this paper, the authors prepare a compilation of the results of the studies from different measurement combinations and analyse the strengths and weaknesses of the different solutions, as well as the integration of the results for an optimal 3D model, which was used to perform solar potential analyses for the selected built-up area. The results of the study show that the parameters for assessing the quality of a 3D model can be statistical parameters that determine the coplanarity of roof slope points (i.e., standard deviation, distances from the plane, and RMS value). The completeness of the model is defined as the percentage of the recorded area by sensors to the total area of the model.
1. Introduction
Geospatial data is currently one of the basic carriers of information about the real world [1]. The information about places and objects recorded from using them can be obtained in a variety of ways—from cartographic materials [2], point clouds from the air [3], mobile [4] terrestrial laser scanning [5], as well as using aerial [6] and terrestrial photogrammetry [7]. Spatial data has a wide range of applications—starting from the visualisation and presentation of places and objects [8] to the construction of their 3D models [9] and various types of spatial analyses [10,11,12,13].
Among the commonly used data acquisition tools are Unmanned Aerial Vehicles (so-called drones) which are becoming more and more popular, ubiquitous and increasingly used [14,15,16]. UAVs have become one of the basic tools used in modern engineering. These are tools used not only for recreational and sports purposes, but they have become measuring instruments used by professionals and specialised researchers. Currently, numerous UAV solutions are available on the market, as well as tools for processing spatial data obtained from the UAV board [17,18].
1.1. Obtaining and Processing Spatial Data for Solar Analyses
Solar analysis (potential) means estimating the amount of solar energy that we get from the sun for a specific location. According to Huang et al. [19] the solar potential in a specific location is determined based on the amount of solar radiation reaching the ground, the accessibility of receiving solar radiation at a specific location and the space available for mounting solar instruments. The amount and intensity of solar radiation on the Earth’s surface vary depending on the geographical location (latitude), time of year and the particular day, as well as the meteorological situation and topography of the earth’s surface [20]. In recent years, interest in this topic has increased significantly, and also in modelling the potential of solar radiation. For this purpose, various types of geospatial, photogrammetric and spectral data, statistical analyses, GIS tools and many other methods and tools enabling solar analyses are being used more and more often [21].
Potential solar assessments can also be carried out based on solar maps. They are a valuable analytical tool that allows us to determine local energy production capacities, and also allows us to use this information to design and implement energy solutions for a given facility. However, the emergence of various types of natural and artificial spatial objects (for urbanised areas) has a significant impact on the solar potential of places and objects. These objects can affect the availability of light by shading adjacent places. This is particularly important in urban and highly urbanizedareas [19,22]. The conducted research confirms that both buildings and relief have a significant impact on the solar potential of buildings in urbanised areas. According to Machate et al. [23], the average difference in the obtained model values observed between simulations, with and without taking into account the geographical and urban environment, is about 30%. This study also showed that the 3D approach has great potential in fully assessing access to solar energy in complex urban layouts [23].
Due to the need to obtain information about vast areas to build solar maps and 3D models that will be used to perform solar analyses, geospatial data obtained using photogrammetric and remote sensing studies are a frequent source of data. Satellite data has proven to be effective in generating maps of the solar potential of large areas. These studies are characterised by low resolution due to the quality of the obtained studies. However, they allow for generating studies of vast areas—entire cities, regions, and even countries. Based on satellite data, numerous solar analyses are carried out, an example of which is the study of Escobar et al. [24,25,26] and many others. The use of remote sensing technologies in this type of research is also common [27]. These types of studies provide two-dimensional analyses enabling the acquisition of solar maps. On the other hand, due to the possibility of providing (for analytical purposes) curvatures and curvatures of shapes and surfaces, photogrammetry is a frequent source of information. This type of data is characterised by high resolution while ensuring a large area of study [28,29,30]. For solar analyses, statistical data and various types of numerical analyses, simulations are also very often used [31,32,33,34,35].
In recent years, LiDAR (Light Detection and Ranging) data has been widely used in potential assessments of solar analyses [19,36,37] for their robustness in identifying the orientation of buildings and the inclination of their roof planes. Voegtle et al. [38] proposed the use of airborne laser scanning (ALS) data to determine areas suitable for the installation of photovoltaic cells. Their research suggests that ALS data can be used to estimate the area and pitch of roofs and help select suitable areas for PV installations [30]. Due to the possibility of quickly obtaining a point cloud, which is an accurate and faithful reflection of the measured objects, for 3D modelling and subsequent solar analyses, data from mobile (MLS) are also used [39,40] as well as terrestrial (TLS) laser scanning [41].
Research conducted by Fuentes et al. [42] involving the use of 3D data from UAVs and GIS tools to assess the solar potential of building roofs also confirms the possibility of using UAV data for solar analysis. These studies showed the consistency of the data at the simulation level of the potential model estimated from UAV data and the results obtained after installing solar panels [42]. Data from UAVs are characterised by very high accuracy and resolution. Both photogrammetry and laser scanning, from the UAV, provide high-quality spatial data that is used for 3D modelling of places and objects, and then for carrying out spatial analyses and also performing types of solar studies [43,44,45].
1.2. UAV Data as a Data Source for Solar Analysis—Scientific Goal
Among the numerous literature positions on the subject, we can find articles devoted to UAVs—their work, data acquisition and processing, as well as various ways of using the results of these studies. However, fewer items consider the time and scope of work carried out at individual stages of development, the selection of appropriate equipment, comparison of the quality of the results obtained or attempts to optimise the above-mentioned processes, especially for spatial analyses, including solar analyses.
Therefore, the research aimed to determine the optimal parameters of data acquisition and processing to make maps of the solar potential of rural built-up areas. Both the hardware resources necessary to use, the time necessary for data processing and the quality of the output material obtained for analyses were taken into account. This study was created as part of the ongoing cooperation between a research and development unit and a commercial partner. It is a presentation of the results of scientific research, as well as field and chamber works, aimed at improving the quality of the commercially offered product while optimising the resources necessary for its implementation. The research aimed to analyse the geospatial data acquired and the possibility of generating an optimal 3D model to perform solar analyses. Various types of sensors were used to obtain data of different types and genres. Information was added to the introduction as suggested by the reviewer.
The paper structure consists of five elements. The first includes geospatial data acquisition using UAV and sensors, a DJI Zenmuse P1 camera, a Share PSDK102S v2 multi-lens camera and a DJI Zenmuse L1 laser scanner. After the introduction, which presents the aspects related to the acquisition and processing of data obtained from UAVs for 3D modelling and solar analyses, the second part is a discussion of the fieldwork, the process of processing the obtained data and generating 3D models and assessing the solar potential. The third part is a presentation of the results and an example of the implementation of the solution placed on the internet platform. The fourth part is a discussion of the results and the final one includes the presentation of conclusions from the research work carried out.
2. Materials and Methods
The research was conducted in a rural built-up area. The work was carried out in the western part of the village of Ochotnica Dolna (Małopolskie Voivodeship, Poland) (Figure 1).
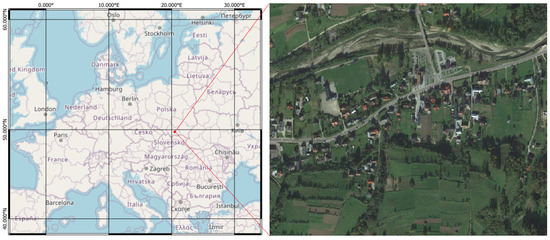
Figure 1.
Location of conducted research work: 49°31′31.6″N 20°19′13.0″E—Ochotnica Dolna, Małopolskie Voivodeship, Poland.
The data was obtained using an unmanned aerial vehicle (UAV) DJI Matrcie 300 RTK (Figure 2) equipped with a set of sensors:
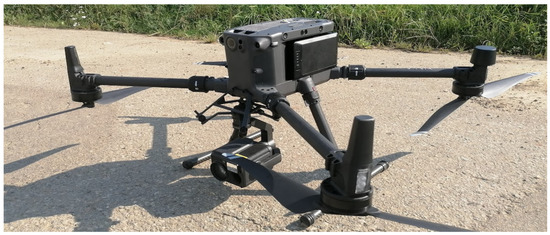
Figure 2.
Measuring equipment: DJI Matrcie 300 RTK with DJI Zenmuse L1 laser scanner.
- DJI Zenmuse L1 laser scanner, characterised by the measurement accuracy specified by the manufacturer at the horizontal level: 10 cm @ 50 m; vertical: 5 cm @ 50 m [46];
- DJI Zenmuse P1 digital camera, with a sensor size of 35.9 × 24 mm (full frame) and an effective number of pixels of 45 MP, equipped with a fixed-focus object f = 35 mm [47];
- Share PSDK102S v2 multi-lens camera with a resolution of 5 × 24.3 MP, equipped with one lens with a focal length of 25 mm (located in the vertical axis) and 4 lenses with a focal length of 35 mm (located in the axis at an angle of 45°) [48].
The UgCS software was used to plan the survey with the use of the terrain tracking option, ensuring a constant relative height of the flight over the mapped terrain, Figure 3. The surveys were carried out using the DJI Pilot 2 software, Figure 4. The surveys were carried out in the RTK mode.
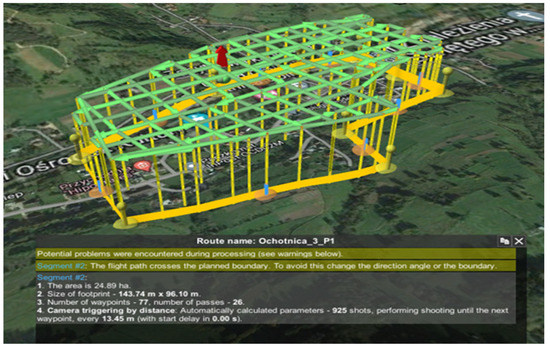
Figure 3.
Flight project with basic parameters for the DJI Zenmuse P1 sensor—UgCS software.
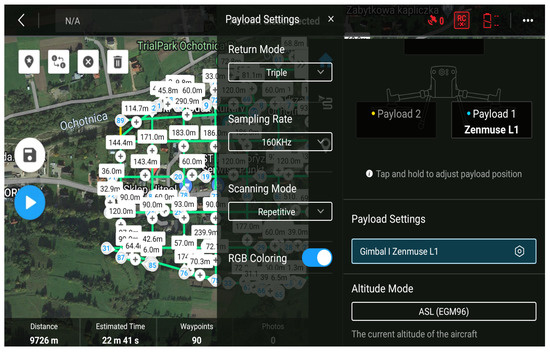
Figure 4.
Flight project with basic parameters for the DJI Zenmuse L1 sensor—after importing to the DJI Pilot 2 software.
The area of the planned survey was 25 ha of land covering the centre of the village of Ochotnica Dolna, characterised by a dispersed development. The surveys were made at a relative height of 100 m above ground level. In the case of the L1 scanner and the P1 camera, in order to obtain the most complete information about the buildings, criss-cross surveys with the following parameters were performed:
- for the L1 scanner: the flight speed was 10 m/s, there was a 65% overlap between the scan lines, 90 waypoints, and 18 scan lines, the width of a single scan line was approximately 196 m, and the distance between scanning axes was 68.6 m. There were three reflections, with a sampling rate of 160 kHz and in repetitive scan mode. An average density of 245 points/m2 was obtained. in the resulting point cloud;
- for the P1 camera: the flight speed was 10 m/s, the forward overlap was 85%, and the side overlap was 65%, which gave a total of 26 overflight lines during which 968 photos were obtained in the camera’s native format (DNG). The ground sampling distance of the GSD (Ground Sampling Distance) images was 1.26 cm/pixel.
In both cases, the survey lasted about 25 min.
In the case of the PSDK camera, due to the simultaneous acquisition of oblique and vertical photos, the flight was designed and carried out in one direction. The designed flight parameters were as follows: the flight speed was 10 m/s, for vertical images forward the overlap was 85%, and side overlap was 65%. During the 19-min flight, 4120 photos were obtained in JPG format. The GSD size was 1.57 cm/pixel for vertical photos.
During the surveys, 19 Ground Control Points (GPC) were measured (Figure 5), of which 13 were used as control points and six as checkpoints. The photo prints were measured with a Trimble R8 receiver.
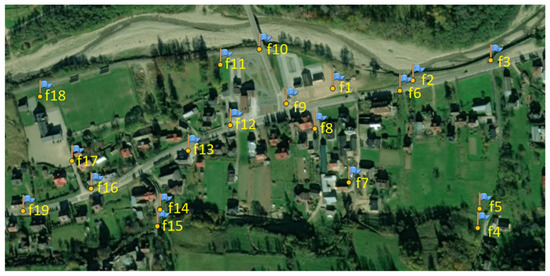
Figure 5.
Distribution of ground control points in the surveyed area.
The surveys were carried out on 26 October 2022, with a partly cloudy sky, which resulted in the recorded shadows being of a significant length in the photos. This fact had a considerable impact on the obtained effects of photo processing, in particular in the case of data obtained with the PSDK camera, for which only JPG photos are available in this hardware version.
The acquired data were processed on a graphic computing station with the following parameters:
- Processor: AMD Ryzen Threadripper 3970X 32-Core Processor 3.69 GHz;
- RAM: 256 GB
- Graphics card: NVIDIA GeForce RTX 3090
- Operating system: Windows 10 Pro.
In the data processing process, DJI TERRA software was used for processing measurement data from the DJI Zenmuse L1 scanner, and RawTherapee and Agisoft Metashape Professional software for image processing. In addition, TerraSolid software was used in the processing, classification and integration of point clouds from a laser scanner and those generated based on the photos.
All calculations were made in the ETRS89/Poland CS2000 zone 7 geodetic flat rectangular coordinate system (EPSG::178) and the normal height system.
Data for flights with the DJI Zenmuse L1 sensor was processed in the DJI TERRA software, taking into account the following parameters:
- processed points were limited to those whose distance from the scanner did not exceed 150 m in order to minimise noise and measurement errors;
- the option of optimising and smoothing the point cloud has been applied;
- the output system for the data was the ETRS89/Poland CS2000 zone 7 system, while the altitude system was EGM 2008 with a correction of 0.16 m, which allowed to obtain an altitude model compatible with the PL-EVRF-2007-NH system used in Poland.
- the output format for the generated resultant point cloud (Figure 6) was LAS format.
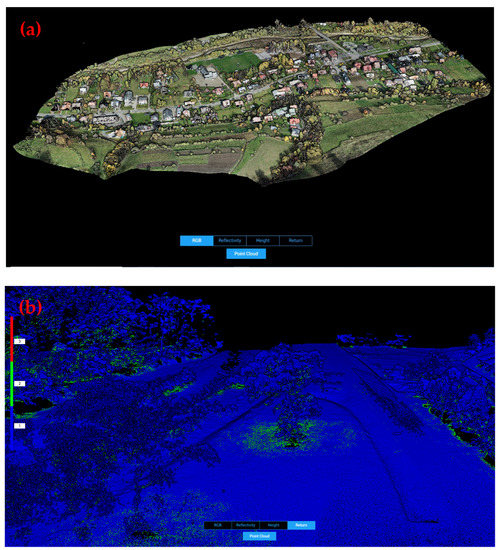 Figure 6. A point cloud generated in the DJI Terra software, (a) the entire study area in the RGB form, (b) a fragment with the registration of the second and third reflections under the vegetation.
The data of source material was photos from both the DJI Zenmuse P1 camera and the Share PSDK102S v2 camera and they were developed in the Agisoft Metashape Professional software. However, in the case of images from the P1 camera, the photo processing procedure was performed twice. In the first case, images in the native DNG format were used for processing, in the second case, the shadows were brightened and the highlights darkened using the RAWTherapee software and then the corrected images were saved to a 16-bit uncompressed TIF file.
For the images for all three datasets (two sets for the P1 camera and one for the PSDK), the same data processing procedure was used, including:
- aerotriangulation of full-resolution photos (accuracy: High option) using photo points and calibration of the camera’s interior orientation parameters (fx, fy, cx, cy, K1, K2, K3, P1, P2), and using the external orientation parameters of the photos measured in flight converted to the flat system ETRS89/Poland CS2000 zone 7 (EPSG:21780), and the altitude system PL-EVRF-2007-NH (Easting, Northing, Altitude, Yaw, Pitch, Roll);
- generating depth maps and point clouds with high-quality parameters and a moderate noise filtering option. In the case of dense point clouds, the confidence parameter was also calculated for the points, which enabled the initial denoising of the data in the next step;
- generating a digital elevation model (DEM) based on both point clouds (Dense Cloud) and depth maps with a resolution of 0.1 m/pix. These models were then used to assess the quality and completeness of the data used to generate the solar potential.
The next step was the preparation of the digital terrain model with structures and buildings and the digital model of high vegetation. Together with the meteorological data, these are the basis for the preparation of maps of the solar potential of both buildings and structures as well as the ground surface. Theoretically, the fastest way to obtain the above-mentioned geometric data, based on the data obtained as part of the research, is to classify the point cloud from the flight carried out using the DJI Zenmuse L1 laser scanner. However, these data, as described in a further part of the study in the field of buildings and structures, are characterised by significant data gaps and significant noise that is difficult to remove. Raster height models (DEMs) generated from photos perform much better in terms of the quality of surface mapping and the completeness of data in the field of buildings and structures. However, due to the raster format of the representation of the elevation model, it is impossible to classify them quickly and remove information that is undesirable from the point of view of the studied analyses.
As a result of the analysis of the results of the research tests presented below, and taking into account the requirements and expectations that were set for geometric data, a procedure based on the integration of data from a laser scanner and high-resolution digital images was proposed. This procedure, along with a description of the commercial partner’s expectations, is described in the discussion section.
3. Results
Below, in individual sub-sections, the basic parameters are presented, which were taken into account when selecting the finally proposed and developed technology for the preparation of geometric data for performing solar potential analyses. These parameters are the time needed to acquire and process data, and the geometrical accuracy of spatial data, which translates directly into the possibility of their seamless integration and totality of data for each sensor and data quality.
3.1. Data Processing Time
The problem of time necessary to obtain and process data can be divided into several key stages:
- Data acquisition.
- Data processing into semi-products necessary for data integration.
- Processing of semi-finished products for data integration.
However, the way of processing semi-products into a geometric model containing ground, buildings and structures, as well as tall vegetation, was carried out only for the selected, best products. The process for making and selecting data processing parameters was experimental, both with multiple repetitions of certain stages (e.g., with different parameters, filtration, decimation, smoothing, classification, etc. of point clouds), and the implementation on various computer hardware configurations. For this reason, we do not provide here a summary in tabular form for this stage.
Data acquisition flights were performed with the Matrice 300 RTK unmanned aerial vehicle. In the case of flight design, the same source design was used for each of the sensors used, modifying only the sensor and flight parameters, and adapting them to the specifics of a given device. For all sensors, the flight time was similar and is summarised in Table 1. Due to the flight preparation procedure itself, notification in the DroneRadar application, equipment preparation and inspection, the following differences can be considered negligible.

Table 1.
Approximate time of execution of the surveys.
However, there are significant differences in the processing of the obtained data. As part of the generation of semi-finished products for data integration, the processes of generating point clouds in LAS and DEM formats along with their export to an external file were distinguished. The generation times of individual products, broken down into sub-processes, are summarised in Table 2.

Table 2.
Product generation times.
Table 2 includes only recorded processes performed by individual software. For the record, the processes of data preparation or manual measurement should also be considered.
In the case of the DJI Zenmuse P1 scanner, the preparatory and manual activities included only the recording of measurement data from the sensor and the preparation of a file with the coordinates of the photogrammetric control network. The rest of the processing, including saving to the LAS file, was done automatically after selecting the appropriate options.
For the DJI Zenmuse P1 camera, in both cases of the photo formats used, in addition to data downloading, it was also necessary to transform the heights of the ellipsoidal projection centres to normal heights in the PL-EVRF-2007-NH system. In addition, 19 photo points had to be measured on 968 photos taken in the double grid mission.
The photos taken with the Share PSDK102S v2 multi-lens camera required the most additional manual work. The process of uploading photos should be performed using the SHARE software in order to assign external orientation parameters to individual images. As in the case of the P1 camera, it was necessary to transform the ellipsoidal heights to normal ones. Performing manual measurement/control of the position of the control points in the block of photos, due to their number (4120), was the most laborious activity for all the processed data and took several hours of manual work by the operator. To sum up, due to the length of time of data acquisition and processing, the most optimal sensor is the Zenmuse L1 laser scanner.
3.2. Geometrical Accuracy of the Study
The issue of the geometric accuracy of the generated products understood in the sense of their correct location in space, is extremely important from the point of view of integrating products from various sensors, in particular creating a building model and generating the correct “smooth” planes of roof slopes for the solar potential calculation algorithm.
In the case of data from the DJI Zenmuse L1 laser scanner, the generated point cloud was verified in two separate processes. The first one was made in the DJI TERRA software. based on the loaded north (N), east (E), and altitude (A) coordinates of the photogrammetric control points, a report of height differences between the field measurement and the value obtained from the point cloud was generated. The summary of the basic statistical parameters of this report, for 19 control points, is presented in Table 3.

Table 3.
Summary of statistical accuracy parameters for height differences. DJI Terra software report (DJI Terra Lidar quality report).
The second process of verifying the geometric accuracy of the point cloud obtained for the DJI Zenmuse L1 laser scanner was the identification of photo points on the point cloud and comparing their flat coordinates with the field measurement. Due to the use of natural points as points of the photogrammetric control network, it was not possible to identify all points on the cloud. To limit the impact of point identification errors when measuring on the cloud, the measurement was performed only on selected clearly identifiable points. As a result, the analysis for flat coordinates was performed for 12 control points. The basic statistical parameters for plane coordinates are listed in Table 4.

Table 4.
Summary of statistical accuracy parameters for plane coordinates.
In the case of data obtained with the DJI Zenmuse P1 and Share PSDK102S v2 cameras, the accuracy parameters are determined by the aerotriangulation alignment report for control points and checkpoints. These parameters are summarised in Table 5.

Table 5.
Summary of statistical accuracy parameters for photogrammetric projects. Agisoft Metashape reports.
The accuracy parameters presented in Table 4 and Table 5 meet the accuracy conditions given in the introduction, defined as NE = 0.30 m, A = 0.15 m.
As a result of data processing, semi-finished products were generated for further analysis and data processing with the parameters listed in Table 6.

Table 6.
List of generated semi-finished products for further analysis and data processing.
3.3. Data Completeness
An important feature of the data affecting the efficiency and correctness of the analyses as well as the labour consumption of the preparation of the geometric model is the completeness of the geometric data in the layers concerning the ground, buildings and structures, as well as tall vegetation. Below are examples of the lack of geometric information for data from the sensors used. Data completeness was compared for dense point clouds.
For the DJI Zenmuse L1 laser scanner, some roof slopes are problematic surfaces. The unfavourable combination of the angle of inclination of the roof slope in relation to the laser beam, the material from which the roof is made, and probably its lighting led to an unacceptable number of cases where there is missing data for roofs, which for selected cases is illustrated in Figure 7, Figure 8 and Figure 9.
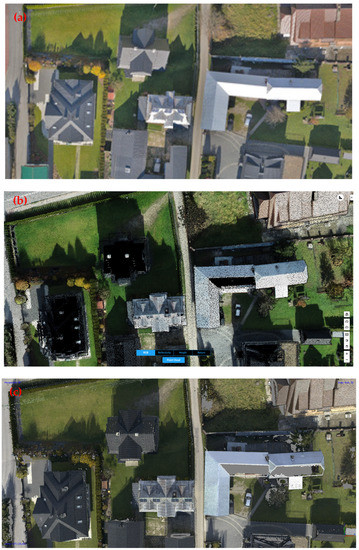
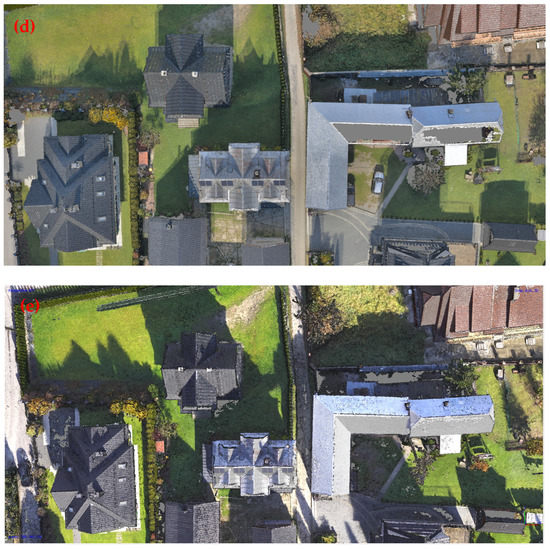
Figure 7.
Missing information for roof planes in point clouds example 1 (a) photos of roof planes (b) point cloud from L1 scanner, (c) point cloud from DNG files, P1 camera, (d) point cloud from TIF files, P1 camera, (e) point cloud from JPG files PSDK camera.
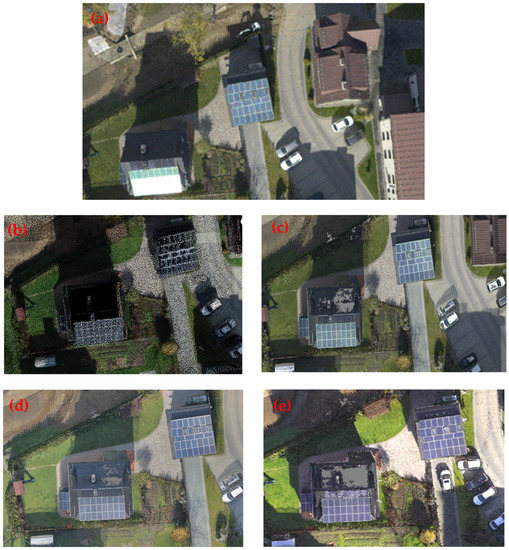
Figure 8.
Missing information for roof planes in point clouds example 2 (a) photos of roof planes (b) point cloud from L1 scanner, (c) point cloud from DNG files, P1 camera, (d) point cloud from TIF files, P1 camera, (e) point cloud from JPG files PSDK camera.
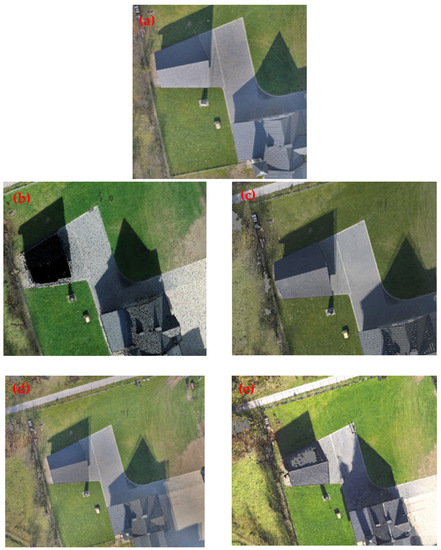
Figure 9.
Lack of information for roof planes in point clouds example 3 (a) photos of roof planes (b) point cloud from L1 scanner, (c) point cloud from DNG files, P1 camera, (d) point cloud from TIF files, P1 camera, (e) point cloud from JPG files PSDK camera.
For digital images, the problem areas are elements that are very dark or in deep shadows, as well as elements that are very bright and overexposed. Ideal lighting conditions for obtaining photos occur when the sky is completely cloudy and the cloud base is high. Unfortunately, in most cases, during the implementation of surveys in sunny weather, we are dealing with extreme pixel brightness values in both white and black in the photographed scene.
The use of photos in 8-bit derivative formats, such as JPG, and TIF, often with compression, to generate point clouds makes it impossible to effectively edit these photos and eliminate the influence of unfavourable lighting, which in turn leads to the appearance of missing information in the generated dense point cloud.
The DJI Zenmuse P1 camera allows saving RAW photos in DNG format. As part of the experiments, data processing was performed in two variants:
- in the first one, DNG files were used directly without any modification;
- in the second, the DNG files were digitally processed (developed) in the RawTherapee software, consisting in brightening the shadows and darkening the x-rays, and then saving the resulting images to 16-bit uncompressed tifs.
The above procedures made it possible to use the capabilities of the P1 camera matrix to the maximum extent and at the same time to examine whether the digital processing of photos affects the completeness and quality of the acquired geometric material in the form of a point cloud.
The Share PSDK102s v2 camera in its original configuration saves photos only in JPG format. However, the lack of digital development of the photos is compensated to some extent by diagonal photos covering the same surfaces many times.
Figure 7, Figure 8 and Figure 9 show the problem areas of the roof slopes and the results of generating a dense point cloud for them for individual sensors.
In the scope of the study of the completeness of geometric data, the possibility of mapping high-incline sensors was also considered (Figure 10).
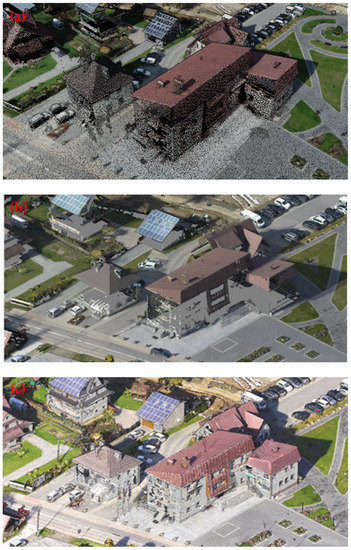
Figure 10.
Completeness of geometric data for surfaces with a large inclination (a) L1 laser scanner (b) P1 camera (c) PSDK camera.
The analysis of the generated data shows that in the implementation of the double grid with the forward and side overlaps assumed in the conducted research, as well as scanning parameters and coverages between the rows of air surveys for the scanner, significant differences occur only at vertical surfaces.
Summing up the performed analyses of data completeness, it was found that the largest number of data deficiencies in the roof slopes come from the DJI Zenmuse L1 laser scanner. As for the data generated from the photos, the point clouds obtained from the developed photos (16-bit TIF format) from the DJI Zenmuse P1 camera are more complete and better maintain their uniform density than data generated directly from RAW files (DNG format). On the other hand, the point clouds generated from the photos obtained with the Share PSDK camera are more complete than those from the laser scanner, and in relation to the point clouds from the P1 camera, the material is comparable. It should be noted, however, that data loss occurs at different points in the data.
It should also be noted that due to the measurement properties of the laser scanner, and in particular the registration of up to three reflections of the returning signal, the data from this device are the most complete, among all analysed, for the ground layer and the layer of high vegetation, which is shown, among others, in Figure 6b.
3.4. Data Quality
Elevation models (DEM, Digital Elevation Model) generated for the data from each sensor were evaluated. The assessment was made visually by verifying parameters such as surface smoothness, surface continuity and edge quality. For the assessment, height models (DEM) with a resolution of 0.1 m/pixel were generated for all analysed data, regardless of the maximum achievable resolution for data from individual sensors. On the one hand, it enabled the evaluation of the same product but on the other hand, assuming the target resolution of the altitude model for solar analyses of 0.5 m/pixel, the working model subjected to further analysis has a five times higher resolution, enabling testing of various filtering parameters during further processing, decimation and smoothing.
The first test that was performed was a comparison of the altitude model (DEM) generated based on point clouds and depth maps for all sensors. This verification allowed us to conclude that, regardless of the sensor, the model generated from depth maps is of better quality than the model generated from point clouds. An example of such a models is shown in Figure 11.
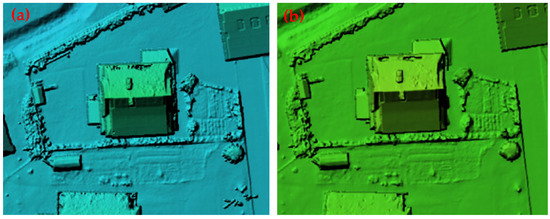
Figure 11.
Comparison of DEMs with a resolution of 0.1 m/pix (a) DEM generated from point clouds (b) DEM generated from depth maps.
Both generated elevation models (DEMs) are of similar quality, with the exception that the model generated from depth maps preserves the surface and edge smoothness parameter in a better way.
The next stage of verification of the obtained data was the comparison of the height models (DEM) obtained for the individual tested sensors. Except for the DJI Zenmuse L1 scanner, DEM generated from the point cloud was analysed, and for the other sensors from depth maps. The list of individual DEM models is presented in Figure 12.
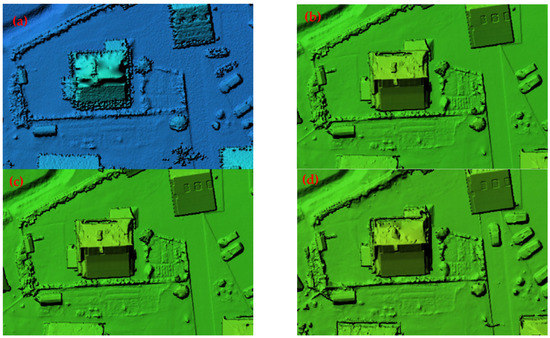
Figure 12.
Comparison of DEM with a resolution of 0.1 m/pix (a) DEM generated from point clouds, L1 scanner (b) DEM generated from depth maps, P1 camera, DNG, (c) DEM generated from depth maps, P1 camera, TIF, (d) DEM generated from depth maps PSDK camera.
By analysing the elevation models (DEM) generated for all the tested sensors using both dense point clouds and depth maps, it was determined that the best product in terms of quality, taking into account the parameters of surface smoothness, surface continuity and edge continuity, is the DEM generated, based on maps depth for TIF files, from the DJI Zenmuse P1 camera and results obtained from developing RAW files.
3.5. Data Integration Procedure and Product
Taking into account the analyses performed above, the following, generalised procedure for creating a digital terrain model (DTM), with buildings and structures and a digital model of high vegetation, is proposed.
- The resulting models are created by integrating data from the DJI Zenmuse L1 laser scanner and the DJI Zenmuse P1 camera.
- From the point cloud obtained from the L1 scanner, following their classification, the classes of ground, high vegetation and buildings and structures are extracted (Figure 13).
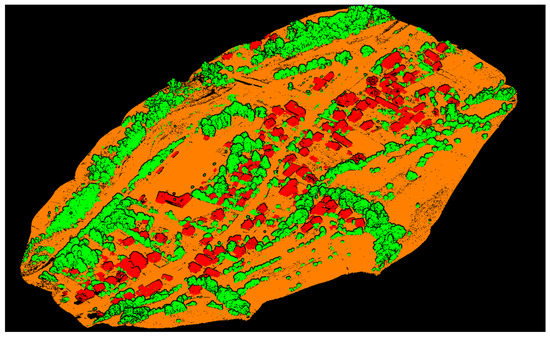 Figure 13. Classified point cloud from the L1 scanner.
 - Buildings and structures are classified from the Digital Elevation Model (DEM) from RAW images developed into TIF format (Figure 14).
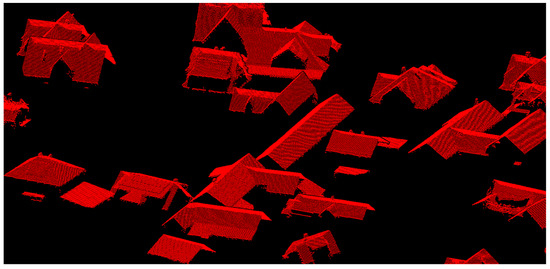 Figure 14. Classified roofs from depth maps, P1 camera, *.TIF files.
 - The ground class from the L1 scanner is combined in one file with the building class from the P1 camera.
- High vegetation is recorded separately.
- Deficiencies in the building class from the P1 camera are, if possible, supplemented with data from the building class from the L1 scanner if such data is available in these places.
- For the integrated data, the resulting digital elevation model with a resolution of 0.5 m is created, which is the basis for the analysis of the solar potential (Figure 15).
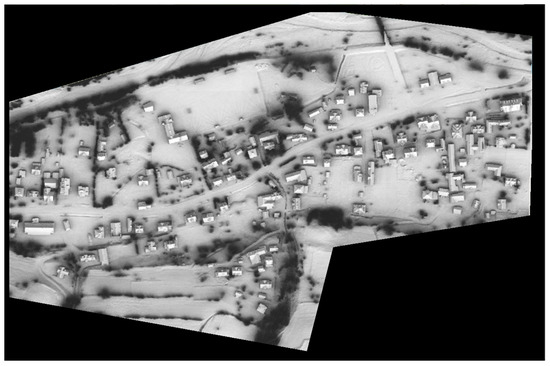 Figure 15. Digital height model for potential solar analyses.
The proposed data processing and integration procedure is, according to the authors, the optimal solution that maintains a balance between the quality of the product and the time-consuming and demand for computing and hardware resources in its implementation. The use of two sensors for air surveys: the DJI Zenmuse L1 laser scanner and the DJI Zenmuse P1 camera, on the one hand, double the time taken to acquire data in the field—unfortunately, it is not possible to simultaneously mount these two sensors on a double gimbal—on the other hand, it allows the achievement of measurable benefits at the stages of data processing. Data from the L1 scanner are characterised by a short processing time and high efficiency of automatic classification algorithms, at the expense of higher measurement noise. On the other hand, the data from the P1 camera—additionally used in the procedure with the development of images to the TIF format—means the need to ensure appropriate hardware resources and computing power, and time-consuming processes. Finally, there is difficulty in selecting the optimal classification parameters for unusual high-density data, which, for example, results in the frequent classification of high vegetation as buildings. However, the high resolution of the source material, and the low level of measurement noise, which translates directly into the smoothness of the generated surfaces, means that in the subsequent stages of data processing, there is no need to filter the noise and smooth the surface, which is often a process of limited effectiveness and leads to the formation of artefacts on the generated surfaces.
The applicability of the proposed procedure for obtaining and processing data has been confirmed in practice by conducting pilot analyses of the solar potential in the commune of Ochotnica Dolna (Figure 16a,b) by a commercial partner of the conducted research.
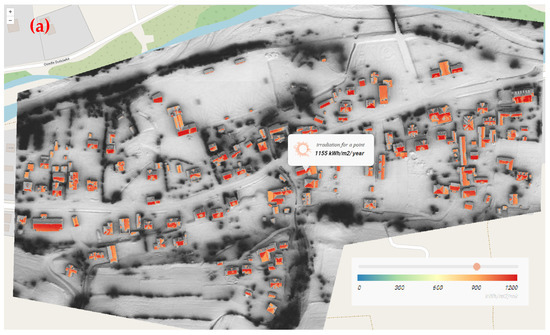
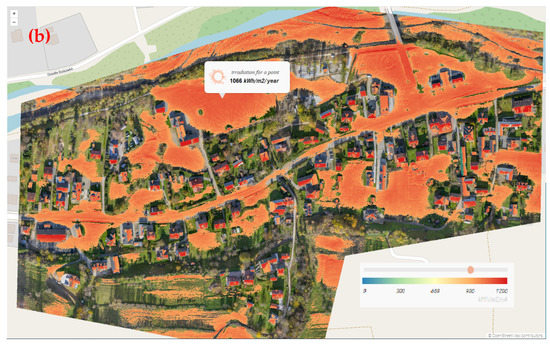
Figure 16.
Solar potential map (a) for buildings and structures based on a height model (b) taking into account the ground on a true orthophoto map basis. Source: Solarmap Sp. z o. o. [49].
4. Discussion
Several researchers emphasise the possibility of using (geo)spatial data from various sources as the basis for determining the solar potential of places and objects. The construction of the model is most often performed based on GIS tools and various types of geospatial data [21]. It is also very important to use three-dimensional data by Macheta et al. [23]. Such research results are consistent with the conclusions obtained from the conducted research work. Therefore, to determine the solar potential of each fragment of the roof slope, as well as the potential of land properties, it is necessary to rely on current data representing the correct geometry. For this purpose, the best solution as a basis for further analysis is a set of measurement data represented by a point cloud or high-quality DEM generated from photos. The point cloud can come from both aviation [19,36,37], terrestrial [41] or mobile [39,40] laser scanning. It can also come from UAV measurements [43,44,45] or, in special cases, from photogrammetric data [28,29,30]. The research presented in the paper is consistent with the results of other authors and confirms the opinion that photogrammetric data and 3D models allow for a very detailed estimation of the solar potential at low costs, as well as determining the optimal location and orientation of the panels. The conducted research showed the consistency of the simulated data based on the potential model made based on UAV data and the results obtained after installing solar panels [42].
These geospatial data are the basis for creating two models representing the geometry:
- Digital Terrain Model with structures and buildings
- Digital Model of High Vegetation.
Vegetation does not fully block sunlight and has a different effect on diffused light; therefore it should be treated in a particular way in the potential analysis.
The digital terrain model together with structures and buildings should represent the relief of the terrain in detail, also under wooded areas and correctly show the geometry of the roof slopes so that each of its fragments is visible for the analysis. In the analysis, elements such as chimneys located on roofs also have an impact. This determines the minimum parameters with which the data should be obtained.
Based on the results, it is suggested to use point clouds with an optimal data density of 20 points/m2 for carrying out spatial modelling and analyses. With a minimum value of 12 points/m2. For a density of 4 points/m2, it is also possible to perform an analysis of the solar potential. However, the roof slopes will not fully take into account the impact of the reduction of irradiation by the elements located on it. Too much data density is also not desirable. It causes very slow performance of analyses without increasing their quality. A very important step in data preparation is the correct classification of the point cloud. Even the smallest single points at a later stage can make a significant difference to local results. Elements to which special attention should be paid include:
- high vegetation in the close vicinity of buildings—if single points of vegetation remain on the building class, they will be treated as its element, significantly reducing the amount of irradiation in the shadow of this element.
- noise—all points should be removed, even a single point in the later analysis will have a large impact on local results.
The resulting solar potential maps are prepared as a grid with a resolution of 0.5 m × 0.5 m. Such resolution allows for a relatively accurate representation of the geometry of the terrain and buildings while maintaining relatively good performance during large-area calculations.
True orthophoto maps are a very useful tool for quick analysis verification. The orthophoto map should have a GSD value optimally at the level of 0.02 m, with the minimum acceptable accuracy of 0.05 m. The most favourable case is its execution from data obtained at the same time as the measurement data. Thanks to this, there are no differences resulting from the dynamic development of the city/village. It is also important to assign an appropriate (global) coordinate system and the ability to specify the location accuracy parameters up to dx, dy = 0.30 m and dz = 0.15 m.
Solar potential analyses are often superimposed on map bases, so the orthophoto map mustn’t have radial shifts. This makes drawing conclusions much more difficult.
In summary, several key elements affecting the quality of the resulting geometric model and the efficiency of its preparation can be defined:
- The results of solar potential analyses are primarily influenced by the correct classification of data, primarily in terms of ground, high vegetation and buildings and structures but it is equally important to remove all undesirable, irrelevant or temporary elements that do not affect the value of the solar potential of a given place.
- An equally important issue is the removal of noise, understood in the sense of random erroneous points created in the data processing process or incorrectly classified, especially in the nearby roof planes. Their presence causes the formation of incorrect planes and disturbances to the results of solar potential analyses.
- The previous issue also relates to measurement noise resulting from the applied measurement technique and data processing technology that allows filtering such noise and smoothing data. As shown above, in the text of the manuscript, the selection of an appropriate measurement technique and data processing procedures significantly affects the achievable surface and edge smoothness parameters.
- An important aspect affecting the efficiency of the process understood as both time-consuming and cost-intensive is the possibility of its automation and limiting manual activities performed by the operator to the necessary minimum. This applies to the processes of obtaining source data, processing data from air surveys, data classification processes, or manual work at the stage of data integration and filling in the missing information.
5. Conclusions
As part of the most important results and main summaries for the work, it can be stated that:
- The L1 scanner: It has a short data processing time, very high automation of the data processing process, and sufficient data density, but the problem is data gaps and measurement noise, which is important for calculating the solar potential and is difficult to remove.
- The P1 camera: The advantage is the RAW-DNG format—it is possible to improve the radiometric quality in the process of developing photos. At the expense of this additional process, we gain, especially in places of deep shadows and x-rays, an improvement in the quality of geometric data compared to processing in the DNG format. We do not record or poorly record vertical or almost vertical surfaces (potential analyses for facades), but they are not taken into account at the current stage of product and service development with the resolution used.
- The PSDK camera: Its advantage is the registration of facade surfaces, even in the conditions of closely located buildings but only produced compressed JPEG images in the camera model we used. Moreover, the time required to process the large number of photos, means that compared to other sensors with flight parameters, too much resource is required and their final quality is lower than in the case of the P1 camera.
- Integration of data obtained from the L1 scanner and the P1 camera results in the optimal product in terms of execution time and quality needed to prepare solar potential maps.
- The use of both point clouds, allowing for the classification of appropriate data layers as intermediates, as well as high-quality raster height models, provides for the effective preparation of a product that meets the requirements of a commercial partner.
As part of the ongoing cooperation between the research unit and the commercial entity, it is planned to continue the work undertaken to both solve the problems encountered and optimise the adopted solutions. It is planned to conduct further research in the field:
- automating the processing of point clouds from the DJI Zenmuse L1 scanner and the DJI Zenmuse P1 camera while achieving the highest possible accuracy of data classification, taking into account:
- ○
- different data sources (photographs, scans), and thus different available information accompanying the geometric information;
- ○
- different densities of input data and their spatial arrangement;
- ○
- different measurement noise parameters.
- the ability to create and automate procedures for processing and integrating elevation models based on raster formats.
- automating the identification of information gaps in data from one sensor and supplementing them with data from another sensor.
- possibilities and legitimacy of using measurement data from airborne laser scanning.
Author Contributions
Conceptualization, B.M., P.K. and P.P.; methodology, B.M., P.K. and P.P.; software, B.M., P.K. and P.P.; validation, B.M., P.K. and P.P.; formal analysis, B.M., P.K. and P.P.; investigation, B.M., P.K. and P.P.; resources, B.M., P.K. and P.P.; data curation, B.M., P.K. and P.P.; writing—original draft preparation, B.M., P.K. and P.P.; writing—review and editing, B.M., P.K. and P.P.; visualization, B.M., P.K. and P.P.; supervision, B.M.; project administration, B.M., P.K. and P.P. All authors have read and agreed to the published version of the manuscript.
Funding
The research was funded by Ministry of Education and Science from a subsidy for the University of Agriculture in Krakow (Department of Agricultural Land Surveying, Cadastre and Photogrammetry and Department of Land Surveying).
Data Availability Statement
The data used in the study are available from the corresponding author upon reasonable request.
Acknowledgments
The authors would like to thank the authorities of the Ochotnica Dolna Commune (pol. Gmina Ochotnica Dolna [50]) for their cooperation and for enabling the measurement and research work.
Conflicts of Interest
The authors declare no conflict of interest.
References
- Li, D.; Wang, S.; Li, D. Spatial Data Mining—Theory and Application; Springer: Berlin/Heidelberg, Germany, 2015. [Google Scholar] [CrossRef]
- Klapa, P.; Mitka, B.; Zygmunt, M. Integration of TLS and UAV data for the generation of a three-dimensional. Adv. Geod. Geoinf. 2022, 71, e27. [Google Scholar]
- Bożek, P.; Janus, J.; Klapa, P. Influence of canopy height model methodology on determining abandoned agricultural areas. In Proceedings of the 17th International Scientific Conference: Engineering for rural development, Jelgava, Lativa, 23–25 May 2018; pp. 795–800. [Google Scholar] [CrossRef]
- Kukko, A.; Kaartinen, H.; Hyyppä, J.; Chen, Y. Multiplatform Mobile Laser Scanning: Usability and Performance. Sensors 2012, 12, 11712–11733. [Google Scholar] [CrossRef]
- Gawronek, P.; Mitka, B. The use of terrestrial laser scanning in monitoring of the residential barracks at the site of the former concentration camp Auschwitz II-Birkenau. Geomat. Landmanag. Landsc. 2015, 3, 53–60. [Google Scholar] [CrossRef]
- Kwoczyńska, B. Modelling of a heritage property using a variety of photogrammetric Methods. Geomat. Landmanag. Landsc. 2019, 4, 155–169. [Google Scholar] [CrossRef]
- Boroń, A.; Rzonca, A.; Wróbel, A. The digital photogrammetry and laser scanning methods used for heritage documentation. Rocz. Geomatyki 2007, 5, 129–140. [Google Scholar]
- Kocur-Bera, K.; Dawidowicz, A. Land Use versus Land Cover: Geo-Analysis of National Roads and Synchronisation Algorithms. Remote Sens. 2019, 11, 3053. [Google Scholar] [CrossRef]
- Skrzypczak, I.; Oleniacz, G.; Leśniak, A.; Zima, K.; Mrówczyńska, M.; Kazak, J.K. Scan-to-BIM method in construction: Assessment of the 3D buildings model accuracy in terms inventory measurements. Build. Res. Inf. 2022, 50, 859–880. [Google Scholar] [CrossRef]
- Kruk, E.; Klapa, P.; Ryczek, M.; Ostrowski, K. Influence of DEM Elaboration Methods on the USLE Model Topographical Factor Parameter on Steep Slopes. Remote Sens. 2020, 12, 3540. [Google Scholar] [CrossRef]
- Liakos, L.; Panagos, P. Challenges in the Geo-Processing of Big Soil Spatial Data. Land 2022, 11, 2287. [Google Scholar] [CrossRef]
- Kudas, D.; Wnęk, A.; Tátošová, L. Land Use Mix in Functional Urban Areas of Selected Central European Countries from 2006 to 2012. Int. J. Environ. Res. Public Health 2022, 19, 15233. [Google Scholar] [CrossRef]
- Janus, J.; Ostrogorski, P. Underground Mine Tunnel Modelling Using Laser Scan Data in Relation to Manual Geometry Measurements. Energies 2022, 15, 2537. [Google Scholar] [CrossRef]
- Salandra, M.; Colacicco, R.; Dellino, P.; Capolongo, D. An Effective Approach for Automatic River Features Extraction Using High-Resolution UAV Imagery. Drones 2023, 7, 70. [Google Scholar] [CrossRef]
- Pádua, L.; Chiroque-Solano, P.M.; Marques, P.; Sousa, J.J.; Peres, E. Mapping the Leaf Area Index of Castanea sativa Miller Using UAV-Based Multispectral and Geometrical Data. Drones 2022, 6, 422. [Google Scholar] [CrossRef]
- Stal, C.; Covataru, C.; Müller, J.; Parnic, V.; Ignat, T.; Hofmann, R.; Lazar, C. Supporting Long-Term Archaeological Research in Southern Romania Chalcolithic Sites Using Multi-Platform UAV Mapping. Drones 2022, 6, 277. [Google Scholar] [CrossRef]
- Turner, I.L.; Harley, M.D.; Drummond, C. UAVs for coastal surveying. Coast. Eng. 2016, 114, 19–24. [Google Scholar] [CrossRef]
- Klapa, P.; Gawronek, P. Synergy of Geospatial Data from TLS and UAV for Heritage Building Information Modeling (HBIM). Remote Sens. 2023, 15, 128. [Google Scholar] [CrossRef]
- Huang, Y.; Chen, Z.; Wu, B.; Chen, L.; Mao, W.; Zhao, F.; Wu, J.; Wu, J.; Yu, B. Estimating Roof Solar Energy Potential in the Downtown Area Using a GPU-Accelerated Solar Radiation Model and Airborne LiDAR Data. Remote Sens. 2015, 7, 17212–17233. [Google Scholar] [CrossRef]
- Dubayah, R.; Rich, P.M. Topographic solar radiation models for GIS. Int. J. Geogr. Inf. Syst. 1995, 9, 405–419. [Google Scholar] [CrossRef]
- Kodysh, J.; Omitaomu, O.; Bhaduri, B.; Neish, B. Methodology for estimating solar potential on multiple building rooftops for photovoltaic systems. Sustain. Cities Soc. 2013, 8, 31–41. [Google Scholar] [CrossRef]
- Li, D.H.W.; Wong, S.L. Daylighting and energy implications due to shading effects from nearby buildings. Appl. Energy 2007, 84, 1199–1209. [Google Scholar] [CrossRef]
- Machete, R.; Falcão, A.P.; Gomes, M.G.; Rodrigues, A.M. The use of 3D GIS to analyse the influence of urban context on buildings’ solar energy potential. Energy Build. 2018, 177, 290–302. [Google Scholar] [CrossRef]
- Escobar, R.; Cortés, C.; Pino, A.; Salgado, M.; Pereira, E.; Martins, F.; Boland, J.; Cardemil, J. Estimating the potential for solar energy utilization in Chile by satellite-derived data and ground station measurements. Sol. Energy 2015, 121, 139–151. [Google Scholar] [CrossRef]
- Perez, R.; Seals, R.; Stewart, R.; Zelenka, A.; Estrada-Cajigal, V. Using satellite-derived insolation data for the site/time specific simulation of solar energy systems. Sol. Energy 1994, 53, 491–495. [Google Scholar] [CrossRef]
- Kumar, D. Satellite-based solar energy potential analysis for southern states of India. Energy Rep. 2020, 6, 1487–1500. [Google Scholar] [CrossRef]
- Hammer, A.; Heinemann, D.; Hoyer, C.; Kuhlemann, R.; Lorenz, E.; Müller, R.; Beyer, H. Solar energy assessment using remote sensing technologies. Remote Sens. Environ. 2003, 86, 423–432. [Google Scholar] [CrossRef]
- Pottler, K.; Lu¨pfert, E.; Johnston GH, G.; Shortis, M.R. Photogrammetry: A Powerful Tool for Geometric Analysis of Solar Concentrators and Their Components. ASME. J. Sol. Energy Eng. 2005, 127, 94–101. [Google Scholar] [CrossRef]
- Saadaoui, H.; Ghennioui, A.; Ikken, B.; Rhinane, H.; Maanan, M. Using GIS and photogrammetry for assessing solar photovoltaic potential on Flat Roofs in urban area case of the city of Ben Guerir/Morocco, The International Archives of the Photogrammetry. Remote Sens. Spat. Inf. Sci. 2019, 42, 155–166. [Google Scholar] [CrossRef]
- Zhang, Y.; Dai, Z.; Wang, W.; Li, X.; Chen, S.; Chen, L. Estimation of the Potential Achievable Solar Energy of the Buildings Using Photogrammetric Mesh Models. Remote Sens. 2021, 13, 2484. [Google Scholar] [CrossRef]
- Shrivastava, R.L.; Kumar, V.; Untawale, S.P. Modeling and simulation of solar water heater: A TRNSYS perspective. Renew. Sustain. Energy Rev. 2017, 67, 126–143. [Google Scholar] [CrossRef]
- Huang, Z.; Mendis, T.; Xu, S. Urban solar utilization potential mapping via deep learning technology: A case study of Wuhan, China. Appl. Energy 2019, 250, 283–291. [Google Scholar] [CrossRef]
- Chow, A.; Fung, A.S. Modeling urban solar energy with high spatiotemporal resolution: A case study in Toronto, Canada. Int. J. Green Energy 2016, 13, 2016. [Google Scholar] [CrossRef]
- Erdélyi, R.; Wang, Y.; Guo, W.; Hanna, E.; Colantuono, G. Three-dimensional SOlar RAdiation Model (SORAM) and its application to 3-D urban planning. Sol. Energy 2014, 101, 63–73. [Google Scholar] [CrossRef]
- Jowkar, S.; Shen, X.; Olyaei, G.; Morad, M.; Zeraatkardevin, A. Numerical analysis in thermal management of high concentrated photovoltaic systems with spray cooling approach: A comprehensive parametric study. Sol. Energy 2023, 250, 150–167. [Google Scholar] [CrossRef]
- Quiros, E.; Pozo, M.; Ceballos, J. Solar potential of rooftops in Cáceres city, Spain. J. Maps 2018, 14, 44–51. [Google Scholar] [CrossRef]
- Lingfors, D.; Bright, J.M.; Engerer, N.A.; Ahlberg, J.; Killinger, S.; Widén, J. Comparing the capability of low- and high-resolution LiDAR data with application to solar resource assessment, roof type classification and shading analysis. Appl. Energy 2017, 205, 1216–1230. [Google Scholar] [CrossRef]
- Voegtle, T.; Steinle, E.; Tóvári, D. Airborne laserscanning data for determination of suitable areas for photovoltaics. ISPRS-J. Photogramm. Remote Sens. 2012, 36, 215–220. [Google Scholar]
- Jochem, A.; Höfle, B.; Rutzinger, M. Extraction of vertical walls from mobile laser scanning data for solar potential assessment. Remote Sens. 2011, 3, 650–667. [Google Scholar] [CrossRef]
- Qin, R.; Gruen, A. 3D change detection at street level using mobile laser scanning point clouds and terrestrial images. ISPRS-J. Photogramm. Remote Sens. 2014, 90, 23–35. [Google Scholar] [CrossRef]
- Huang, P.; Cheng, M.; Chen, Y.; Zai, D.; Wang, C.; Li, J. Solar potential analysis method using terrestrial laser scanning point clouds. IEEE J. Sel. Top. Appl. Earth Observ. 2017, 10, 1221–1233. [Google Scholar] [CrossRef]
- Fuentes, J.E.; Moya, F.D.; Montoya, O.D. Method for Estimating Solar Energy Potential Based on Photogrammetry from Unmanned Aerial Vehicles. Electronics 2020, 9, 2144. [Google Scholar] [CrossRef]
- Nelson, J.; Grubesic, T. The use of LiDAR versus unmanned aerial systems (UAS) to assess rooftop solar energy potential. Sustain. Cities Soc. 2020, 61, 102353. [Google Scholar] [CrossRef]
- Moudry, V.; Bekova, A.; Lagner, O. Evaluation of a high resolution UAV imagery model for rooftop solar irradiation estimates. Remote Sens. Lett. 2019, 10, 1077–1085. [Google Scholar] [CrossRef]
- Szabó, S.; Enyedi, P.; Horváth, M.; Kovács, Z.; Burai, P.; Csoknyai, T.; Szabó, G. Automated registration of potential locations for solar energy production with Light Detection And Ranging (LiDAR) and small format photogrammetry. J. Clean. Prod. 2016, 112, 3820–3829. [Google Scholar] [CrossRef]
- DJI Zenmuse L1 laser Scanner—Technical Specifications. Available online: https://www.dji.com/pl/zenmuse-l1/specs (accessed on 5 January 2023).
- DJI Zenmuse P1 digital Camera—Technical Specifications. Available online: https://www.dji.com/en/zenmuse-p1/specs (accessed on 5 January 2023).
- Share PSDK102S v2 Multi-Lens Camera—Technical Specifications. Available online: https://www.shareuavtec.com/DownLoad/102312.html (accessed on 5 January 2023).
- Solarmap Sp. z o.o. Available online: https://portal.solarmap.pl/irr121110/ (accessed on 25 January 2023).
- Ochotnica Dolna Commune. Available online: https://www.ochotnica.pl/ (accessed on 29 January 2023).
Disclaimer/Publisher’s Note: The statements, opinions and data contained in all publications are solely those of the individual author(s) and contributor(s) and not of MDPI and/or the editor(s). MDPI and/or the editor(s) disclaim responsibility for any injury to people or property resulting from any ideas, methods, instructions or products referred to in the content. |
© 2023 by the authors. Licensee MDPI, Basel, Switzerland. This article is an open access article distributed under the terms and conditions of the Creative Commons Attribution (CC BY) license (https://creativecommons.org/licenses/by/4.0/).