Article

A Study on Spatial and Temporal Dynamic Changes of Desertification in Northern China from 2000 to 2020

1
Ministry of Education Key Laboratory of Ecology and Resource Use of the Mongolian Plateau, Inner Mongolia Key Laboratory of Grassland Ecology, School of Ecology and Environment, Inner Mongolia University, Hohhot 010021, China
2
School of Resources and Environment, University of Electronic Science and Technology of China, Chengdu 611731, China
3
Yangtze Delta Region Institute (Huzhou), University of Electronic Science and Technology of China, Huzhou 313001, China
*
Author to whom correspondence should be addressed.
These authors contributed equally to this work.
Remote Sens. 2023, 15(5), 1368; https://doi.org/10.3390/rs15051368
Submission received: 6 February 2023 / Revised: 21 February 2023 / Accepted: 23 February 2023 / Published: 28 February 2023
(This article belongs to the Special Issue Monitoring Environmental Changes by Remote Sensing)

Abstract

:
Desertification is of significant concern as one of the world’s most serious ecological and environmental problems. China has made great achievements in afforestation and desertification control in recent years. The climate varies greatly across northern China. Using a long-time series of remote sensing data to study the effects of desertification will further the understanding of China’s desertification control engineering and climate change mechanisms. The moist index was employed in this research to determine the climate type and delineate the potential occurrence range of desertification in China. Then, based on the Google Earth Engine platform, MODIS data were used to construct various desertification monitoring indicators and applied to four machine learning models. By comparing different combinations of indicators and machine learning models, it was concluded that the random forest model with four indicator combinations had the highest accuracy of 86.94% and a Kappa coefficient of 0.84. Therefore, the random forest model with four indicator combinations was used to monitor desertification in the study area from 2000 to 2020. According to our studies, the area of desertification decreased by more than 237,844 km2 between 2000 and 2020 due to the impact of human activities and in addition to climatic factors such as the important role of precipitation. This research gives a database for the cause and control of desertification as well as a reference for national-scale desertification monitoring.

1. Introduction

Desertification is the degradation of land in arid, semi-arid, and dry sub-humid zones induced by various factors, including climatic variations and human activities [1]. Land desertification has become one of the world’s most severe ecological and environmental issues. Desertification encompasses around 41% of the world’s geographical area (including hyper-dry regions) while affecting more than 38% of the worldwide population [2]. Northern China, with scarce precipitation and a dry climate, has eight deserts and four sandy areas, covering an area of 1.28 million km2, and accounting for 13% of the national territory. Serious desertification not only affects the local ecological environment but undermines China’s economic development and social stability [3,4]. Therefore, it is imperative to precisely track the dynamic shifts of desertification and comprehend its progression to provide the foundation for desertification control.
Desertification is a long-time series, large-range, and multi-scale natural disaster phenomenon [5]. Traditional monitoring methods are time-consuming, laborious, and easily influenced by subjective factors, making it difficult to monitor the dynamic changes of land desertification on a large scale. The rapid development of remote sensing and image recognition technology has greatly improved the efficiency of desertification information acquisition, making it possible to monitor desertification over large areas for long periods of time [6]. However, issues persist with traditional remote sensing in the management and application of large data sets [7]. Google Earth Engine (GEE) was created in response to the challenges posed by the acquisition, storage, analysis, transmission, and visualization of remote-sensing big data [8,9]. GEE is a comprehensive platform for scientific analysis and visualization of geographic information data, making earth observation research easier and faster. Landsat, MODIS, NOAA AVHRR, Sentinel 1, 2, and 3, and ALOS data can be expediently used in the GEE [10]. This platform is unique in the field as it is integrated and enables rapid batch processing of image data, lowering the cost and complexity of geospatial data analysis [11], and can be used to solve a wide range of social issues such as climate, environment, disasters, and diseases [12].
This study intends to investigate the impact of desertification in northern China using MODIS data based on the Google Earth Engine platform and provide feasibility for large-scale and long-time series desertification monitoring. The minimum distance, classification and regression tree, support vector machine, and random forest were used to monitor the desertification situation in northern China. Then, taking the most precise classification approach and band combinations, we analyzed the spatial and temporal dynamics of desertification in northern China from 2000 to 2020 and explored the driving factors. Specifically: (1) Delineating the climatic zoning of desertification in China using the moist index to determine the potential occurrence extent of desertification. (2) Monitoring desertification in northern China from 2000 to 2020 by selecting different combinations of machine learning models and desertification indicators based on the Google Earth engine. (3) Analyzing the spatial and temporal dynamics of desertification in northern China from 2000 to 2020 and its driving factors.

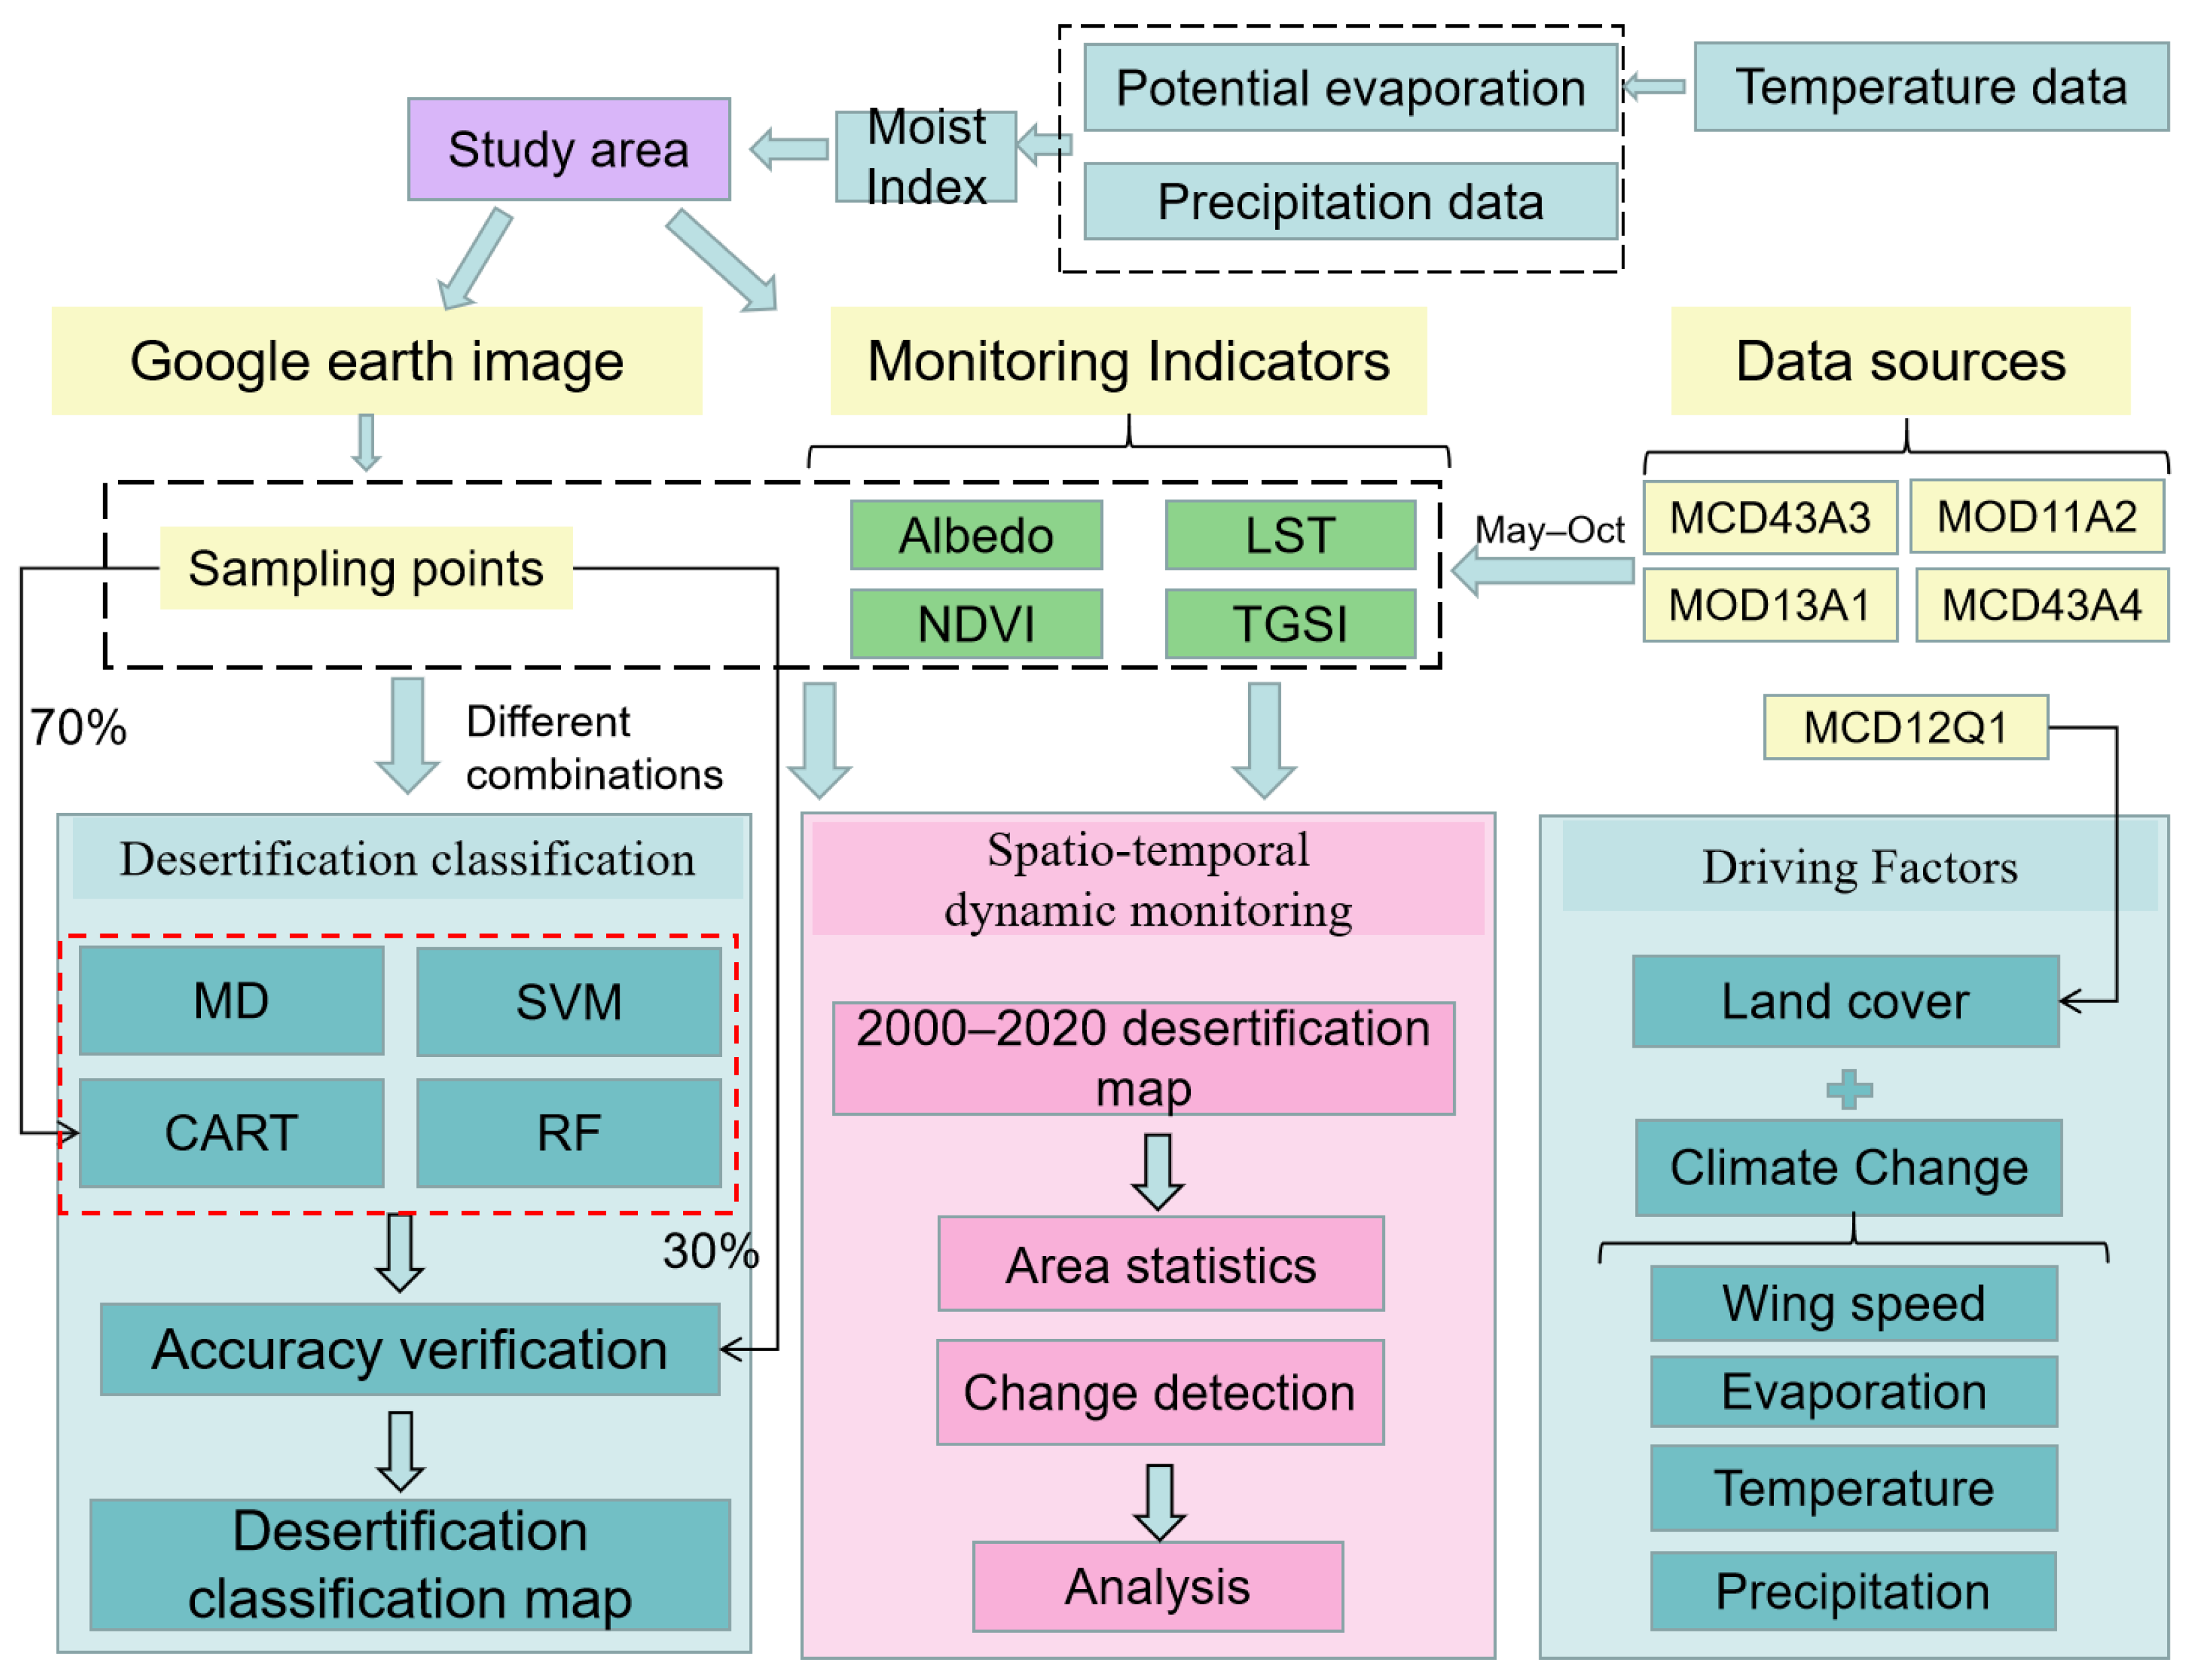
2. Materials and Methods
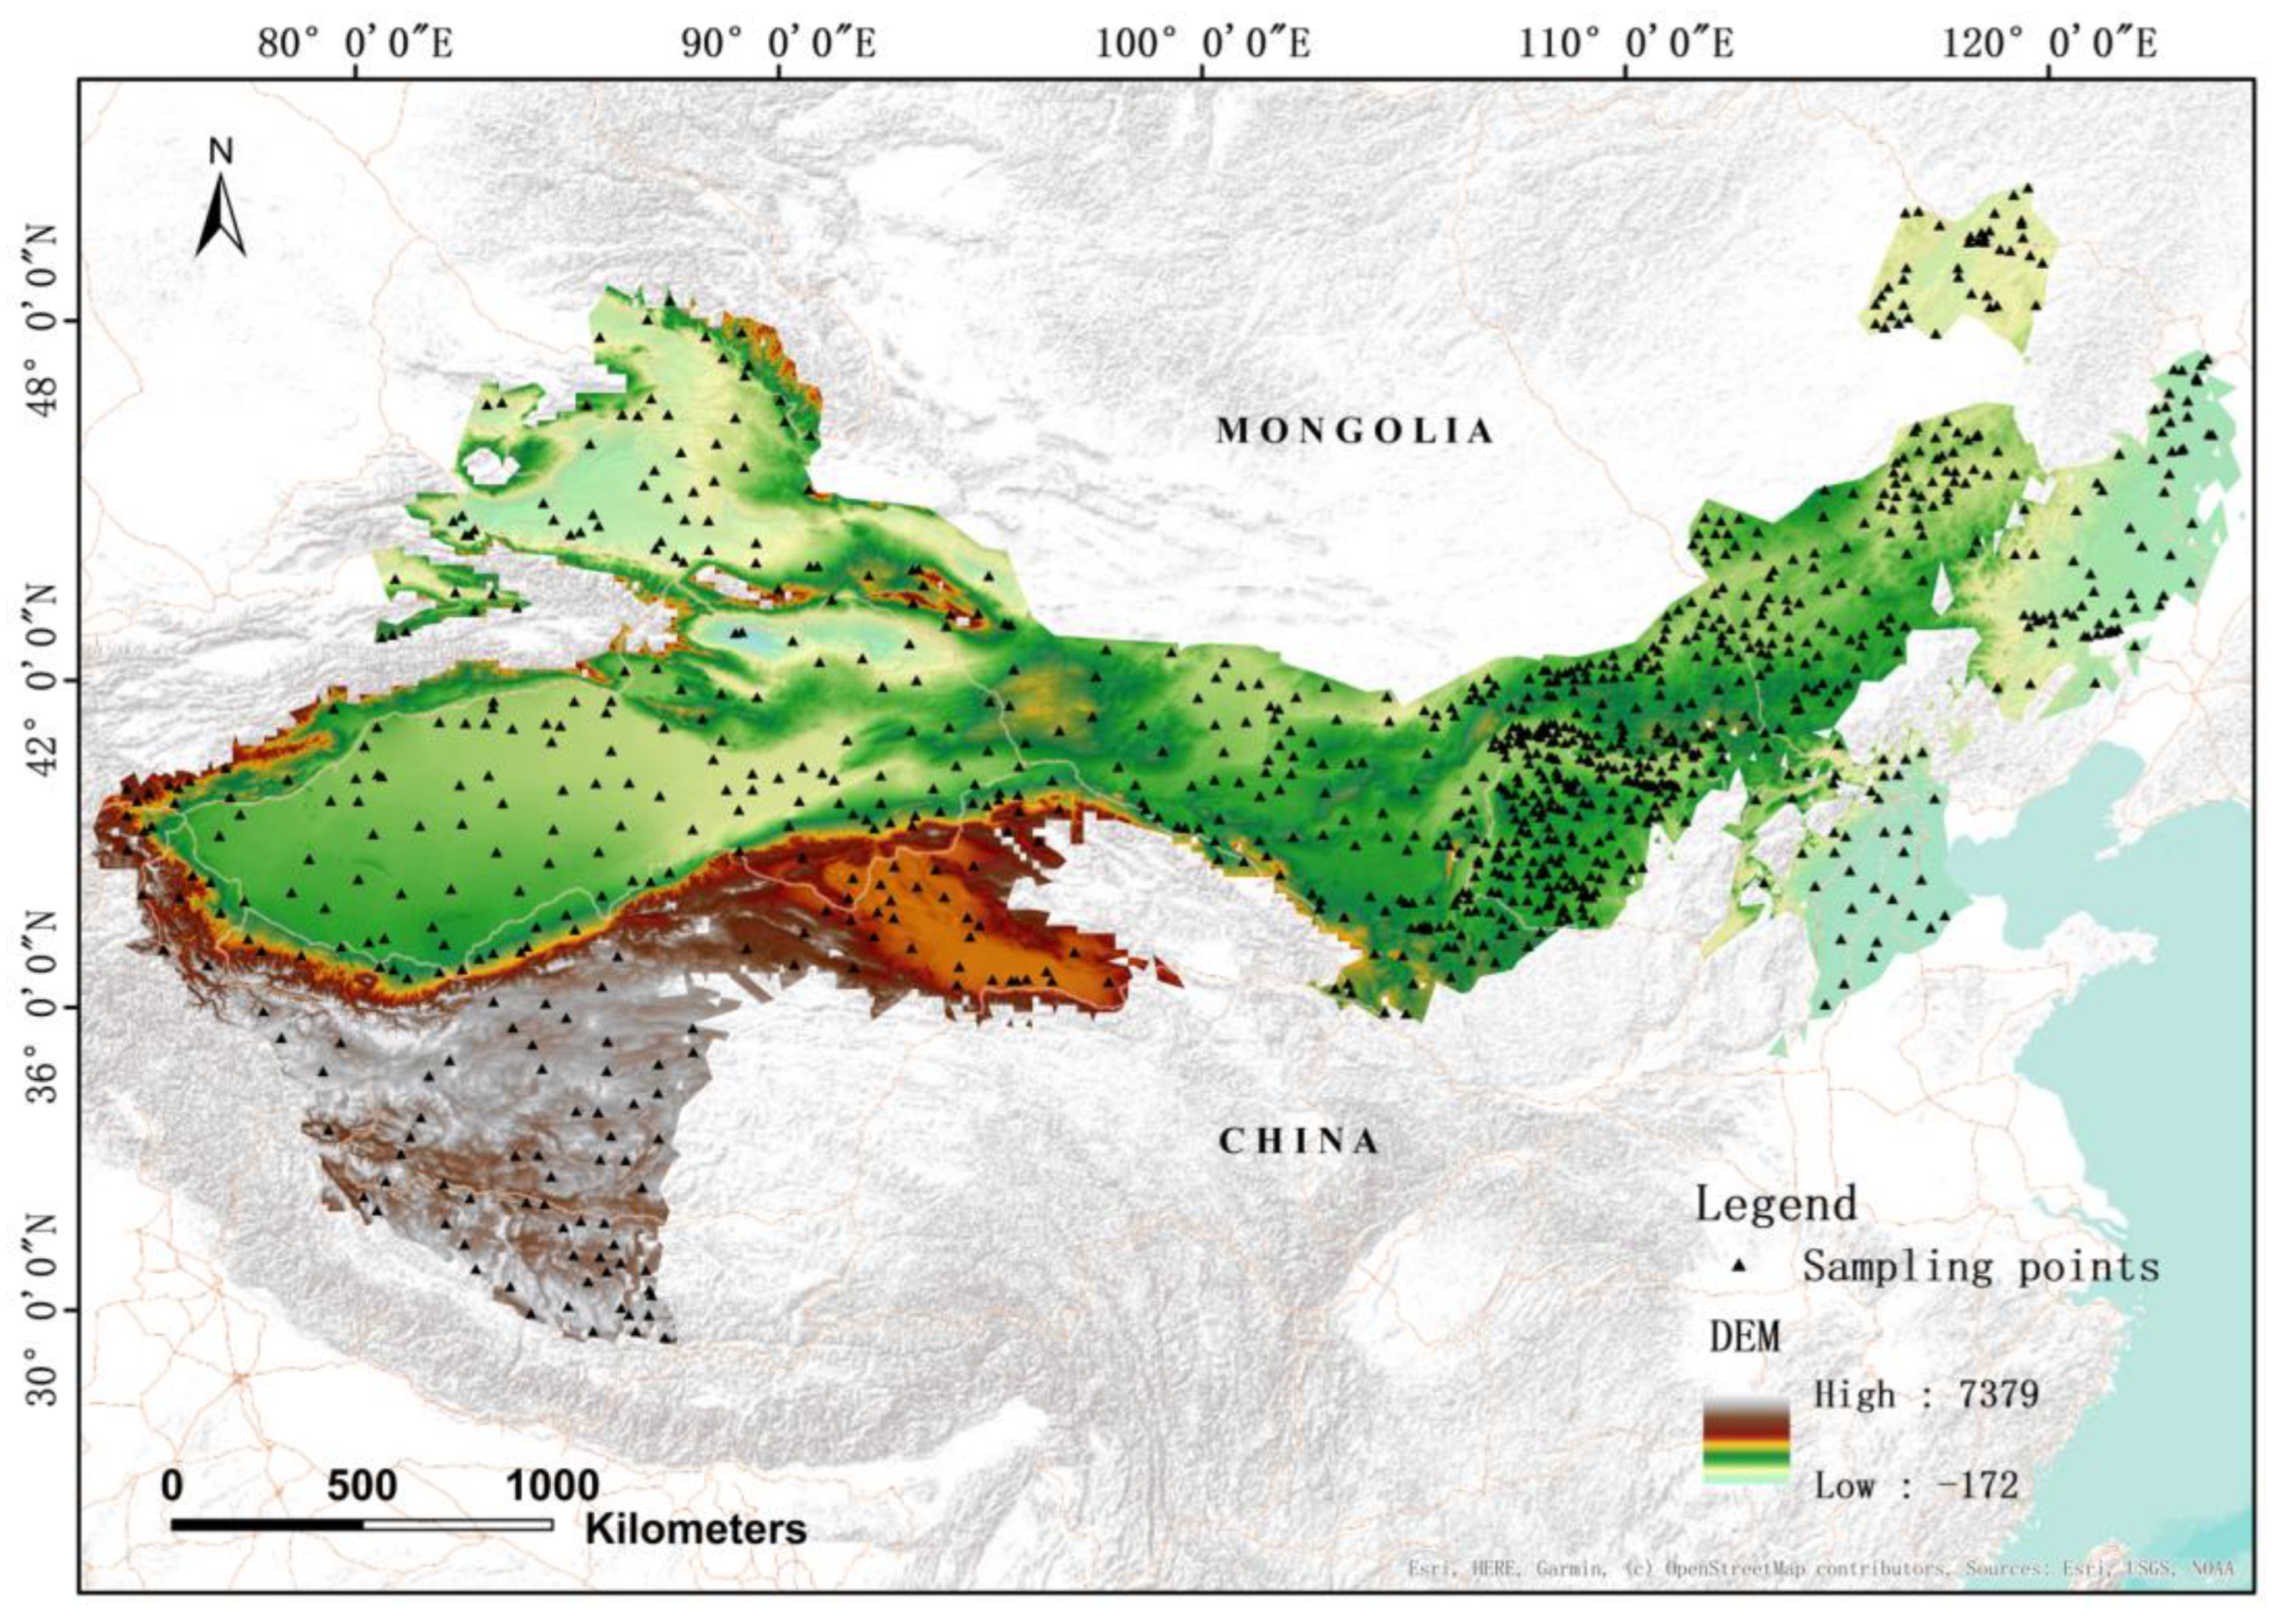
We initially identified the climate type of China based on temperature and precipitation data to determine the potential range of desertification occurrence in our study area. Then we used MODIS products to calculate albedo, LST, NDVI, and TGSI in the growing season (May–October) as desertification monitoring indicators; the different combinations of indicators were put into four machine learning models for desertification monitoring. We then compared the model accuracy of different combinations of indicators and selected the best combination and model for spatiotemporal dynamic monitoring research, and finally analyzed the driving factors of desertification. The flowchart of this study can be seen in Figure 1.

2.1. Study Area

According to the definition of desertification, the potential occurrence range of desertification is determined according to the climate zone. In the United Nations Convention to Combat Desertification, the moist index is used to determine the climate type, and the potential occurrence of desertification is defined in arid, semi-arid, and dry sub-humid zones as having a moist index (MI) greater than 0.05 and less than 0.65 [13]. The moist index is the ratio of annual precipitation to potential evapotranspiration. Desertification in China extends to not only arid, semi-arid, and sub-humid arid areas but also hyper-arid areas [14,15,16,17]. In this paper, potential evapotranspiration is calculated according to the Thornthwaite method to classify climate types [18,19,20,21]. The potential evapotranspiration of Thornthwaite is calculated as follows:
P E = 16 · ( 10 T / I ) α
α = ( 0.675 I 3 77.1 I 2 + 17920 I + 492390 ) × 10 6 ,
I = i = 1 12 ( T / 5 ) 1.514 ,
where PE is the potential evapotranspiration (mm), T is the monthly average temperature (°C), and α is a complex function calculated by I. This calculation method is applicable to areas where the monthly average temperature T is between 0 °C and 26.5 °C. When T is less than or equal to 0, the PE value is 0, and when T is greater than 26.5 °C, PE is calculated by the following formula:
P E = α 1 + α 2 T + α 3 T 2
where T is the monthly average temperature (°C), α1 value is −415.8547, α2 value is 32.2441, and α3 value is −0.4325. PE needs to be adjusted for latitude with the formula:
A P E = P E × C F
where APE is the adjusted potential evapotranspiration (mm), and CF is the correction value, which is calculated based on the number of sunshine hours at different latitudes, taking into account the geographical differences in surface radiation intensity and duration [19,22,23]. The calculation formula is:
C F = T S 360  
and TS stands for local month-by-month sunshine hours, where 360 means 360 h of sunshine per month based on 12 h of sunshine per day for 30 days per month. For convenience, some scholars have created a look-up table to facilitate the calculation (Table 1).
Since the CF value look-up table is discontinuous, this study fits the raster data with spatially continuous CF values by establishing a linear regression relationship between CF and latitude. January is taken as an example (Figure 2).
The annual evapotranspiration data from 2000 to 2020 were calculated using the above method, and then the annual precipitation was divided by the annual evapotranspiration to obtain the annual moist index; the annual climatic zones were divided according to the threshold values specified in the United Nations Convention to Combat Desertification. To acquire the final climate zone data, the data from 2000 to 2020 were averaged, and the hyper-arid, arid, semi-arid, and dry sub-humid zones were utilized as our study area (Figure 3).
The study area is located in northern China, including most parts of Xinjiang, Inner Mongolia, and Gansu. It also includes Tibet, the northwestern part of Qinghai, and some areas in the southern part of Hebei province. The topography of the study area is diverse, with an overall distribution pattern of highs in the west and lows in the east. Mainly mountains and basins reside in the west, plateaus in the center, and plains in the east. Most of the study area is located inland with low precipitation, and the general trend shows an increase from west to east. The number of sunshine days is above 2500–3000 h throughout the year. The vegetation types in the study area are diverse, with a trend toward semi-desertified and desertified vegetation, grasslands, and forests from west to east. Most of the area is dominated by desert and desertified grassland.

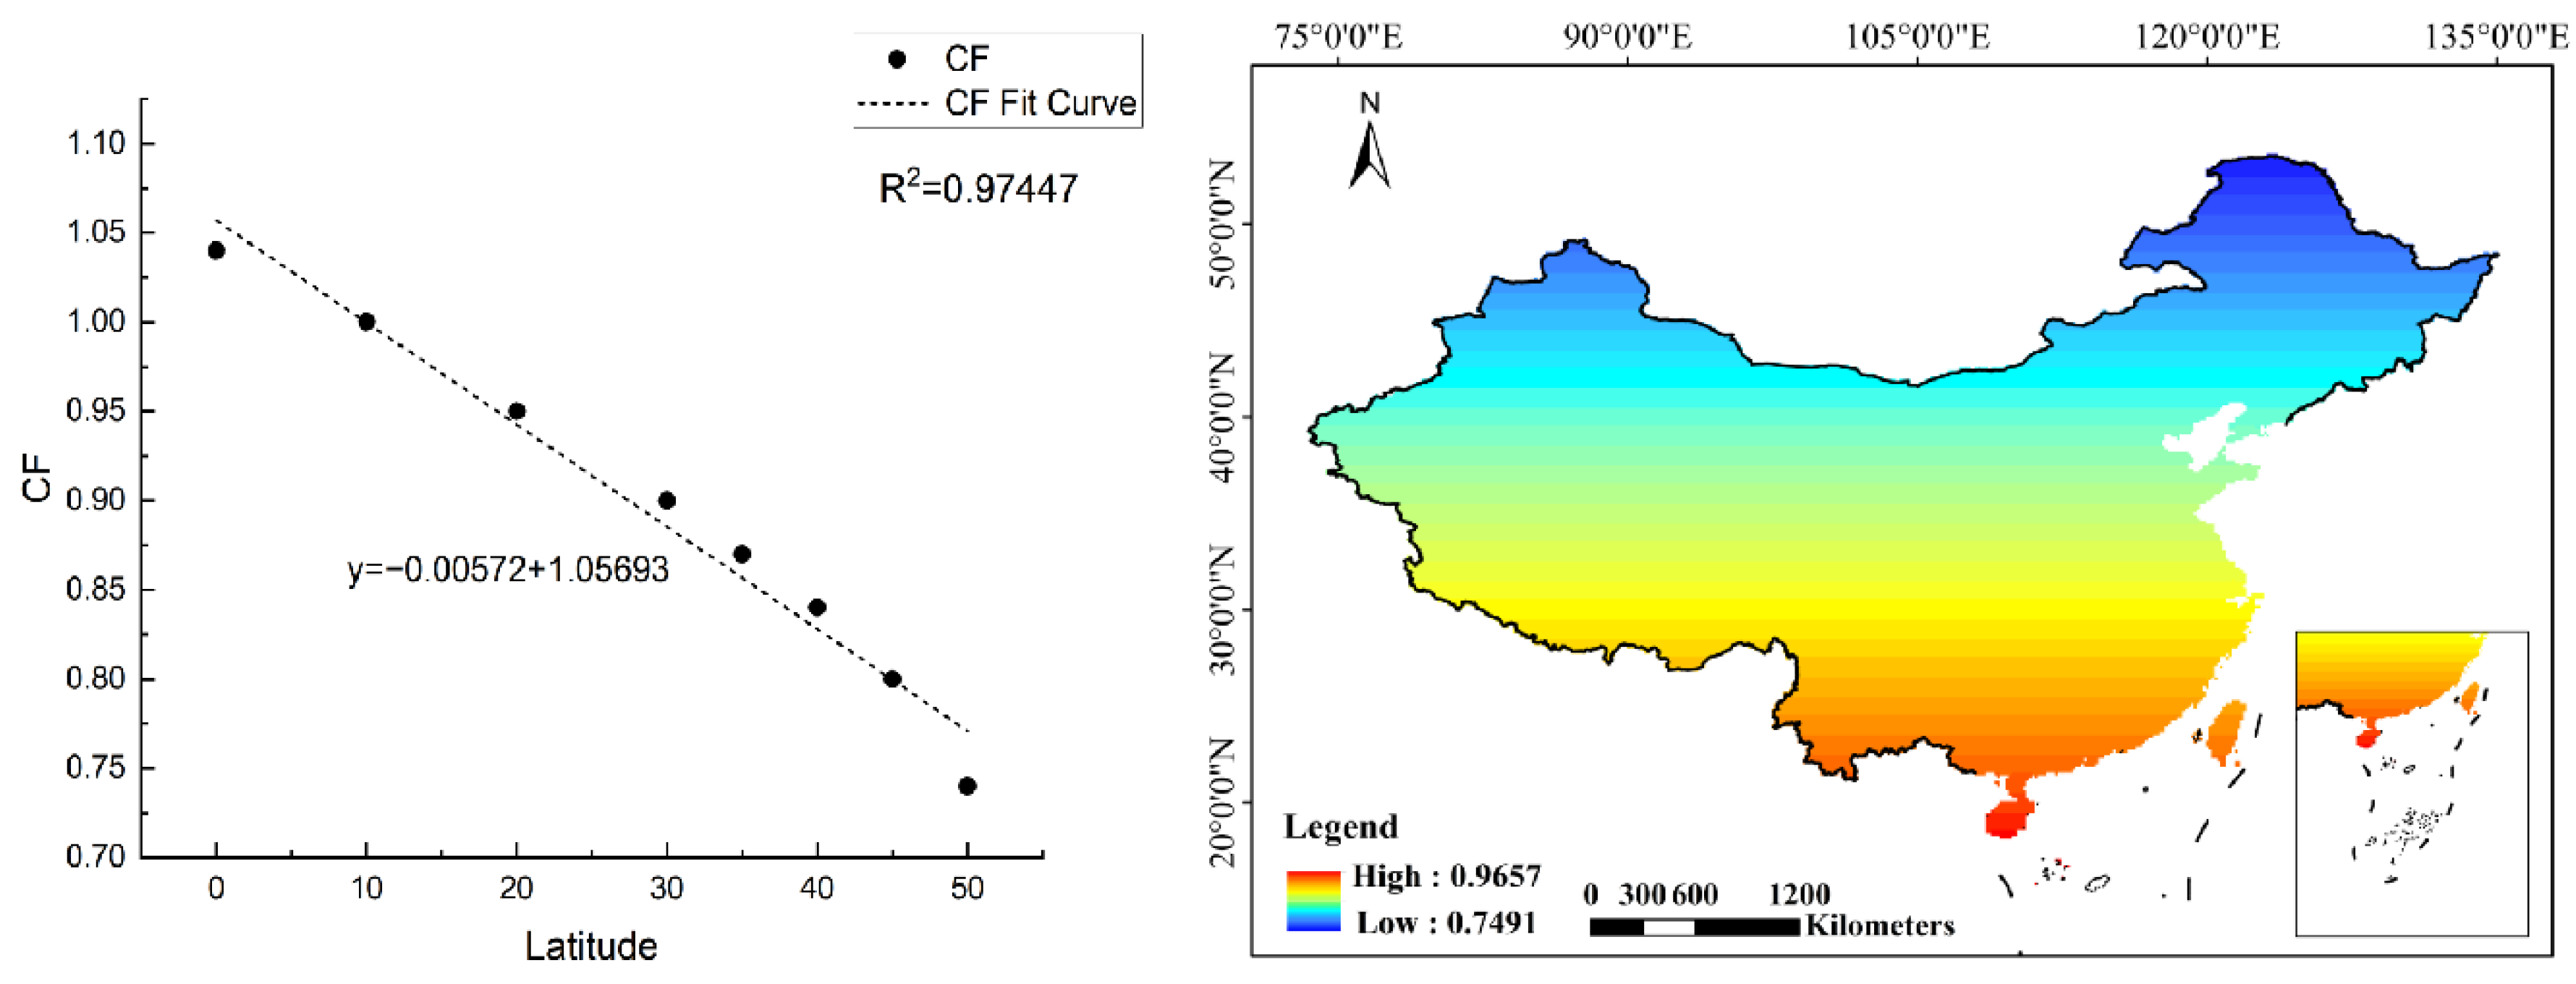
2.2. Data and Preprocessing

Albedo data—Albedo is the ratio of reflected solar radiation to incident solar radiation at the Earth’s surface and is one of the most important parameters affecting the biosphere and climate processes [24,25]. In this study, the MODIS MCD43A3 V6 product was used to acquire albedo data, which provides daily albedo at a 500 m spatial resolution, thus allowing more seasonal vegetation dynamics and rapid surface changes to be obtained [26]. It provides directional hemispheric reflectance (black-sky albedo) and bidirectional hemispheric reflectance (white-sky albedo) for each surface reflectance band of MODIS (band 1 to band 7), as well as for three broad spectral bands (visible, near-infrared, and shortwave). In this study, the white-sky albedo in the short-wave band was used [6].
Land Surface Temperature data—LST is an important geophysical parameter that plays an important role in the process of earth-air material exchange [27]. We used the MOD11A2 V006 product to calculate the land surface temperature. The MOD11A2 product is formed by averaging all LST observations of the MOD11A1 product under clear sky conditions for 8 days, with a spatial resolution of 1 km and a temporal resolution of 8 days [28]. We converted to Celsius using Equation (7):
L S T ( ° C ) = D N × 0.02 273.15
Normalized Difference Vegetation Index—NDVI is widely applied in vegetation growth, climate change, and drought monitoring [29,30]. In this study, NDVI was calculated using the MODIS MOD13A1 product, which provides a 16-day composite NDVI product with a spatial resolution of 500 m [31]. The calculation equation is shown in (8):
N D V I = N I R R N I R + R
where NIR is the near-infrared band and R is the red band.
Topsoil Grain Size Index—TGSI was developed based on field investigations of the spectral reflectance of the soil surface and laboratory analysis of the particle size composition of the soil [32], and used to detect topsoil texture or grain size. Vegetation and water bodies are negative or close to 0, and areas covered by fine sand (deserts) with TGSI values are close to 0.20 [33,34]. In this study, TGSI was calculated using the MCD43A4 product, which provides adjusted reflectance in the terrestrial band 1–7 with a temporal resolution of 1 day and a spatial resolution of 500 m and can be used to monitor surface dynamics [35]. TGSI was calculated as follows:
T G S I = R B R + B + G
where R, B, and G represent the red, blue, and green bands, respectively.
The above data were averaged from the vegetation growing season (May–October) as annual data, and the study covers the period 2000–2020. The data used in this study are shown in Table 2.

2.3. Machine Learning Models

2.3.1. Classification System and Samples

According to the existing desertification classification system, we classify desertification in northern China into five categories: extremely severe, severe, moderate, light, and none [36]. We combined Google Earth and Landsat-8 imagery to select 1000 sample points (Figure 4), and the rules followed for sample point selection for each type are shown in Table A1. 70% of the sample points were randomly taken as training samples, and the remaining 30% as validation samples in the Google Earth Engine, which were put into four machine learning models for desertification monitoring in the study area [11].

2.3.2. Machine Learning Models

Minimum distance—The minimum distance method is popular in image classification since it is straightforward in theory and quick to compute [37]. It is a nonparametric classifier that assigns the pixels to be classified to the class that is closer to the sample mean in terms of the spectrum after collecting the mean vectors of each class from the training data [38].
CART—The classification and regression tree is a recursive algorithm in data mining that analyzes the structure of a set of data to develop decision rules to predict categorical and continuous variables [39]. CART develops the tree by splitting the training sample set into subsets in a binary recursive partitioning process based on attribute-value testing and then repeating this process on each derived subset. The tree stops growing when the subsets cannot be split further [40].
Support vector machine—SVM is a supervised classifier based on statistical theory that can correctly partition the training data set and find the geometrically separated hyperplane with the largest interval, thus separating the two classes of samples [41].
Random forest—Random forest is an algorithm that integrates multiple trees through the bagging idea of integrated learning [42]. It contains two crucial methods: random feature subspace and out-of-bag estimation. The former enables faster tree construction, while the latter allows assessing the relative importance of each input feature [43]. In brief, random forests are made up of a series of categorical or regression trees that recursively partition a set of explanatory variables to predict the values of categorical or continuous response variables [44].

2.4. Accuracy Verification

In this study, we took albedo, LST, NDVI, and TGSI as desertification monitoring indicators, and rated the accuracy of different models based on 44 combinations of different indicators. To compare the accuracy of various models, we used the overall accuracy (OA) and the Kappa coefficient. The OA is usually expressed as a percentage of the correct classification of the reference sample, and the Kappa coefficient is a statistical measure to evaluate the overall reliability between the classification and the reference of the multi-source data product [45].
O A = i = 1 i = 5 X i i / N
K a p p a = N i = 1 i = 5 X i i i = 1 i = 5 ( X + i + X i + ) N 2 i = 1 i = 5 ( X + i + X i + ) ,
The equation terms are as follows: N is the sum of the number of samples; X i i denotes the number of samples in row i and column i; and X + i and X i + represent the sum of row i and column i, respectively.
In addition, we used the 2010 land desertification dataset from the Northwest Arid Region of China to validate our 2010 desertification data. This dataset was provided by the National Cryosphere Desert Data Center (http://www.ncdc.ac.cn, accessed on 17 January 2023). The data is supported by the National Key Basic Research Development Program (973 Program) of the Arid Zone Oasis and Desertification Characteristics and their Spatial and Temporal Patterns project. This data is based on Landsat MSS and TM/ETM data, using human-computer interactions to extract desertification land information; the actual qualitative accuracy of the interpretation was verified by post-sampling to be over 95%. We used this data as validation data to construct a confusion matrix with our 2010 desertification data and measured the accuracy using the overall accuracy and Kappa coefficient.

3. Results

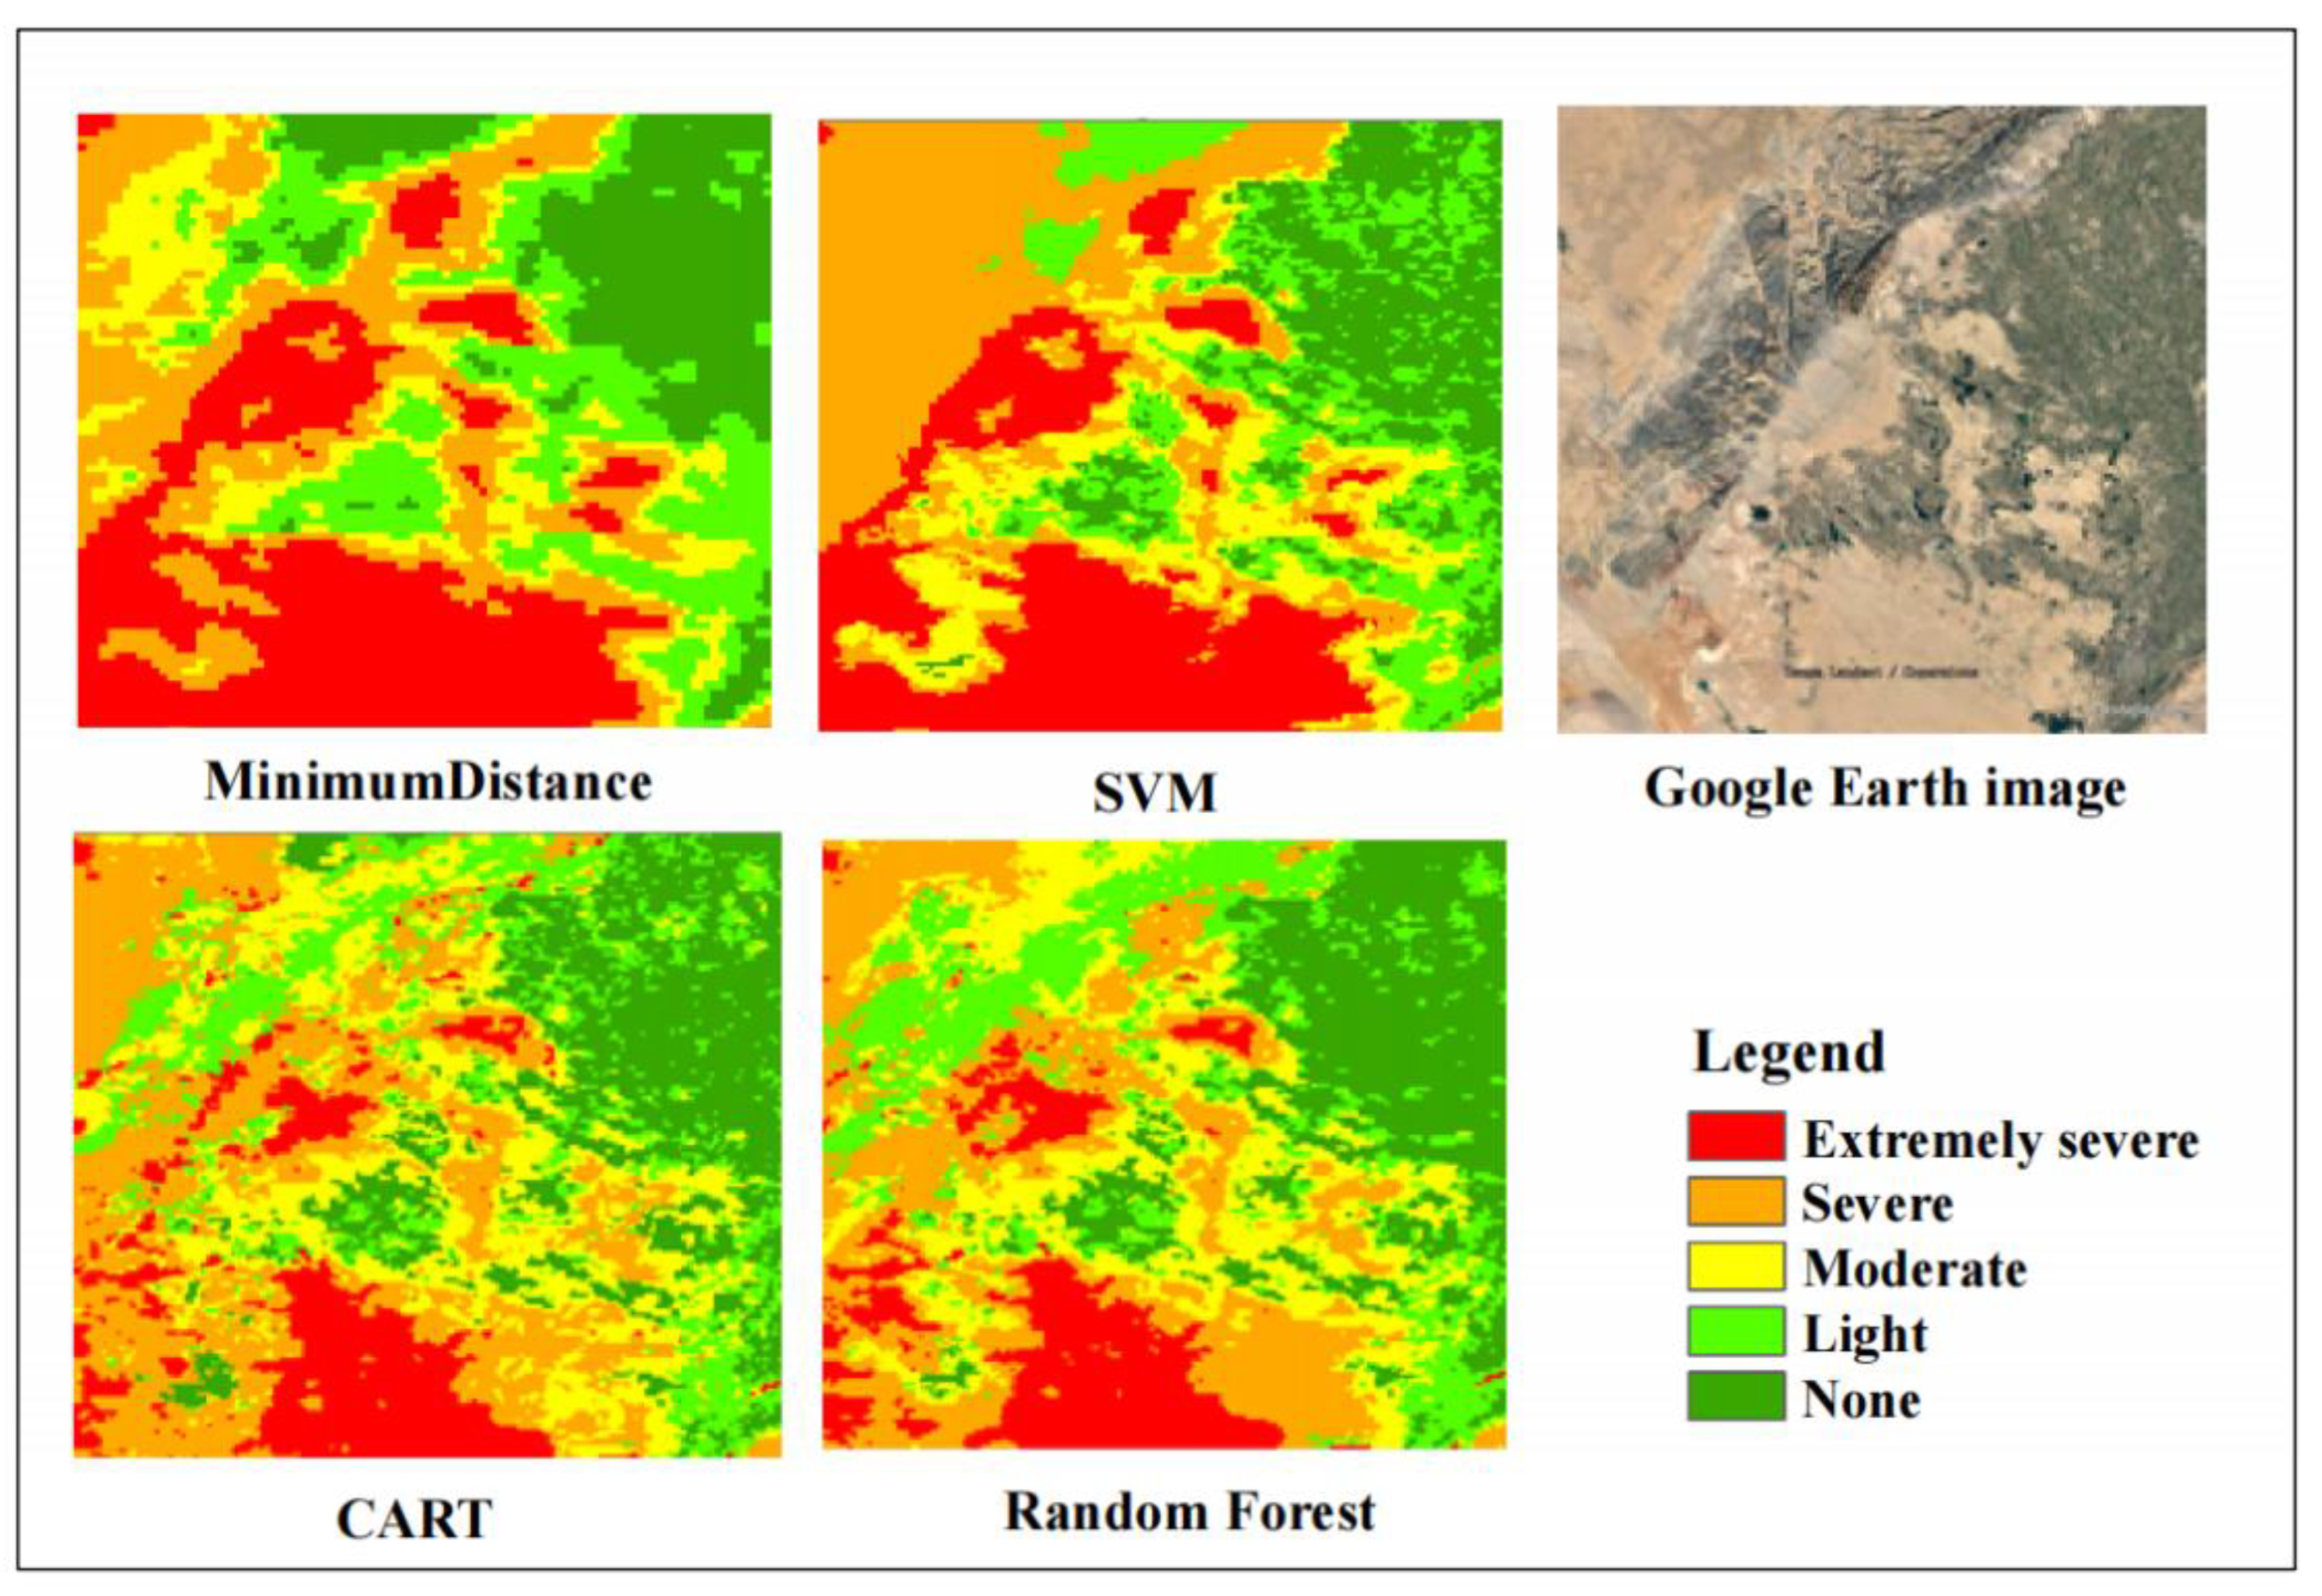
3.1. Accuracy of Machine Learning Models with Different Combinations of Metrics

By evaluating the accuracy of different machine learning models with 44 indicator combinations, we found that the random forest classification method with four indicator combinations had the highest accuracy, with an overall accuracy of 86.94% and a Kappa coefficient of 0.84. According to Table 3, we believe that the random forest has the highest classification accuracy, followed by the CART, support vector machine, and minimum distance method in decreasing classification effects, respectively. In addition, we conclude that the accuracy of the four indicator combinations is generally higher than that of the three indicator combinations and higher than that of the two indicator combinations. However, we also found that the ALT accuracy of the three indicator combinations was the lowest and even lower than some of the two indicator combinations. The higher precision of AN and NT in the two indicator combinations reflects that the NDVI contributes a lot to desertification monitoring and also indicates that vegetation growth has a greater influence on desertification.
We intercepted a typical area to analyze the desertification situation, classified by different models. From Figure 5, the minimum distance method and support vector machine are shown to be less effective in classification; they have an overestimation of the desertification degree, the classification is rough, and the classes are easily indistinguishable from each other. The classification effects of CART and the random forest are better than the above two categories, but CART mistakenly but easily classifies non-desertification as light desertification.

3.2. Accuracy Verification by the Data Set

We used the 2010 Northwest Arid Lands desertification dataset provided by the National Cryosphere Desert Data Center to help validate the accuracy of our 2010 desertification data. An appropriate number of sample points in each desertification category (extremely severe, severe, moderate, and light) of this dataset were selected for comparison with our data. The distribution of sample points is shown in Figure S1. Table 4 shows the confusion matrix of this dataset with our data for accuracy validation. The results show that the overall accuracy of the data is 72.8%, with a Kappa coefficient of 0.63.
Where ES represents extremely severe desertification, S represents severe desertification, M represents moderate desertification, and L represents light desertification.In general, the accuracy is relatively good, but there are some areas of severe desertification classified as extremely severe, and some areas of moderate desertification are classified as severe or moderate. We believe that these differences in classification are mainly due to the differences in the judgment criteria for the degree of desertification during visual interpretation.

3.3. Spatial and Temporal Distribution Characteristics of Desertification

3.3.1. Changes in the Spatial Distribution of Desertification

We monitored desertification in the study area from 2000 to 2020 using a random forest model with a combination of four bands (albedo, LST, NDVI, and TGSI). We used change detection to explore the spatial variability of desertification. Change detection captures spatial changes attributed to anthropogenic or natural phenomena from multi-temporal satellite images. Change detection is important in the study of environmental and land-use change [46,47]. In this study, four periods, 2000–2005, 2005–2010, 2010–2015, and 2015–2020, were monitored for desertification to analyze the changes of desertification in northern China in a more visual manner. We clearly show (Figure 6) that the change of desertification of northern China is mostly mitigated during all the four periods, with a slight increase in a few areas. In 2000–2005, northern Tibet was slightly aggravated; in 2005–2010, some areas of eastern Inner Mongolia were worsened; in 2010–2015, a small part of northwestern Xinjiang was significantly exacerbated; and in 2015–2020, only northeastern Xinjiang was slightly intensified, while the rest were mostly alleviated.

3.3.2. Interannual Variation of Desertification

To clarify the changes in desertification in the study area, we counted the area of land with different degrees of desertification for each year from 2000 to 2020 (Table S1). In general, from 2000–2020, moderate, severe, and extremely severe of the total area of desertified land all decreased. The total area of desertified land decreased by more than 237,844 km2, and only light desertification increased. However, there are also great fluctuations in the area of desertified land with different degrees between different years, which we believe is due to the interannual variation of monitoring indicators.
We studied the interannual variability of four monitoring indicators (albedo, LST, NDVI, and TGSI) (Figure 7). We found that NDVI showed a negative correlation with desertification, and when the fluctuation of NDVI showed a trough (where the value of NDVI was relatively small), the desertification in the study area was relatively severe, corresponding to the peak of the fluctuation in the desertification area. Whereas, albedo showed a positive correlation with desertification, and when the fluctuation of albedo was located in the peak (where the value of albedo was relatively large), the desertification situation in the study area was relatively severe, and the fluctuation of the desertification area was also located in the wave peak. TGSI showed some positive correlation corresponding with the desertification situation in some extreme years (2004, 2006, 2014, and 2020). However, the fluctuation of LST showed no significant relationship with the change of desertification.

4. Discussion

4.1. Theil–Sen Median Slope Estimation and Mann–Kendall Trend Analysis for Long-Time Series

The Theil–Sen Median method, also known as Sen slope estimation, is a robust nonparametric statistical method of trend calculation for trend analysis of long-time series data. The formula is as follows:
β k = m e d i a n X j X i j i   ( k = 1 , N )
where Xj and Xi represent the values of time j and i (j > i), respectively. Sen’s slope is obtained by taking the median value of these N values of βk.
The Mann–Kendall (MK) test is a nonparametric time series trend test in which the data need not obey a specific distribution and are not affected by outliers [48]. It is suitable for testing the trend significance of long-time series data. The calculation formula is as follows:
S = i = 1 n 1 j = i + 1 n s g n ( X j X k )
where Xj and Xi represent the values of time j and i (j > i), and n is the length of the time series. The sgn term represents the following sign function:
s g n ( X j X k ) = { + 1 ,   ( X j X i > 0 ) 0 ,   ( X j X i = 0 ) 1 ,   ( X j X i < 0 )
Z = { S 1 V a r ( S ) ,       S > 0         0 ,                     S = 0 S + 1 V a r ( S ) ,       S < 0
V a r ( S ) = 1 18 [ n ( n 1 ) ( 2 n + 5 ) p = 1 q t p ( t p 1 ) ( 2 t p + 5 ) ]
where n is the number of data, q is the number of tied groups, and tp denotes the number of ties of extent p. The significance level α = 0.05 is given in this paper, when | Z | > Z 1 α / 2 , the original hypothesis is rejected and the trend is considered significant.
By examining the changes in desertification trends over a long-time series (Figure 8), we found that desertification mitigation was significant. However, this trend is mostly localized, so we believe that human activities play a major role in the mitigation of desertification in northern China.

4.2. Driving Forces of Desertification Change

Human activities such as overgrazing, cultivation, and deforestation tend to cause land-use change and thus desertification [49,50]. However, climate change also has an impact on desertification by mainly changing the spatial and temporal patterns of temperature, rainfall, and wind [51]. Therefore, we monitored land use and climate change in our study area to explore the drivers of desertification change.

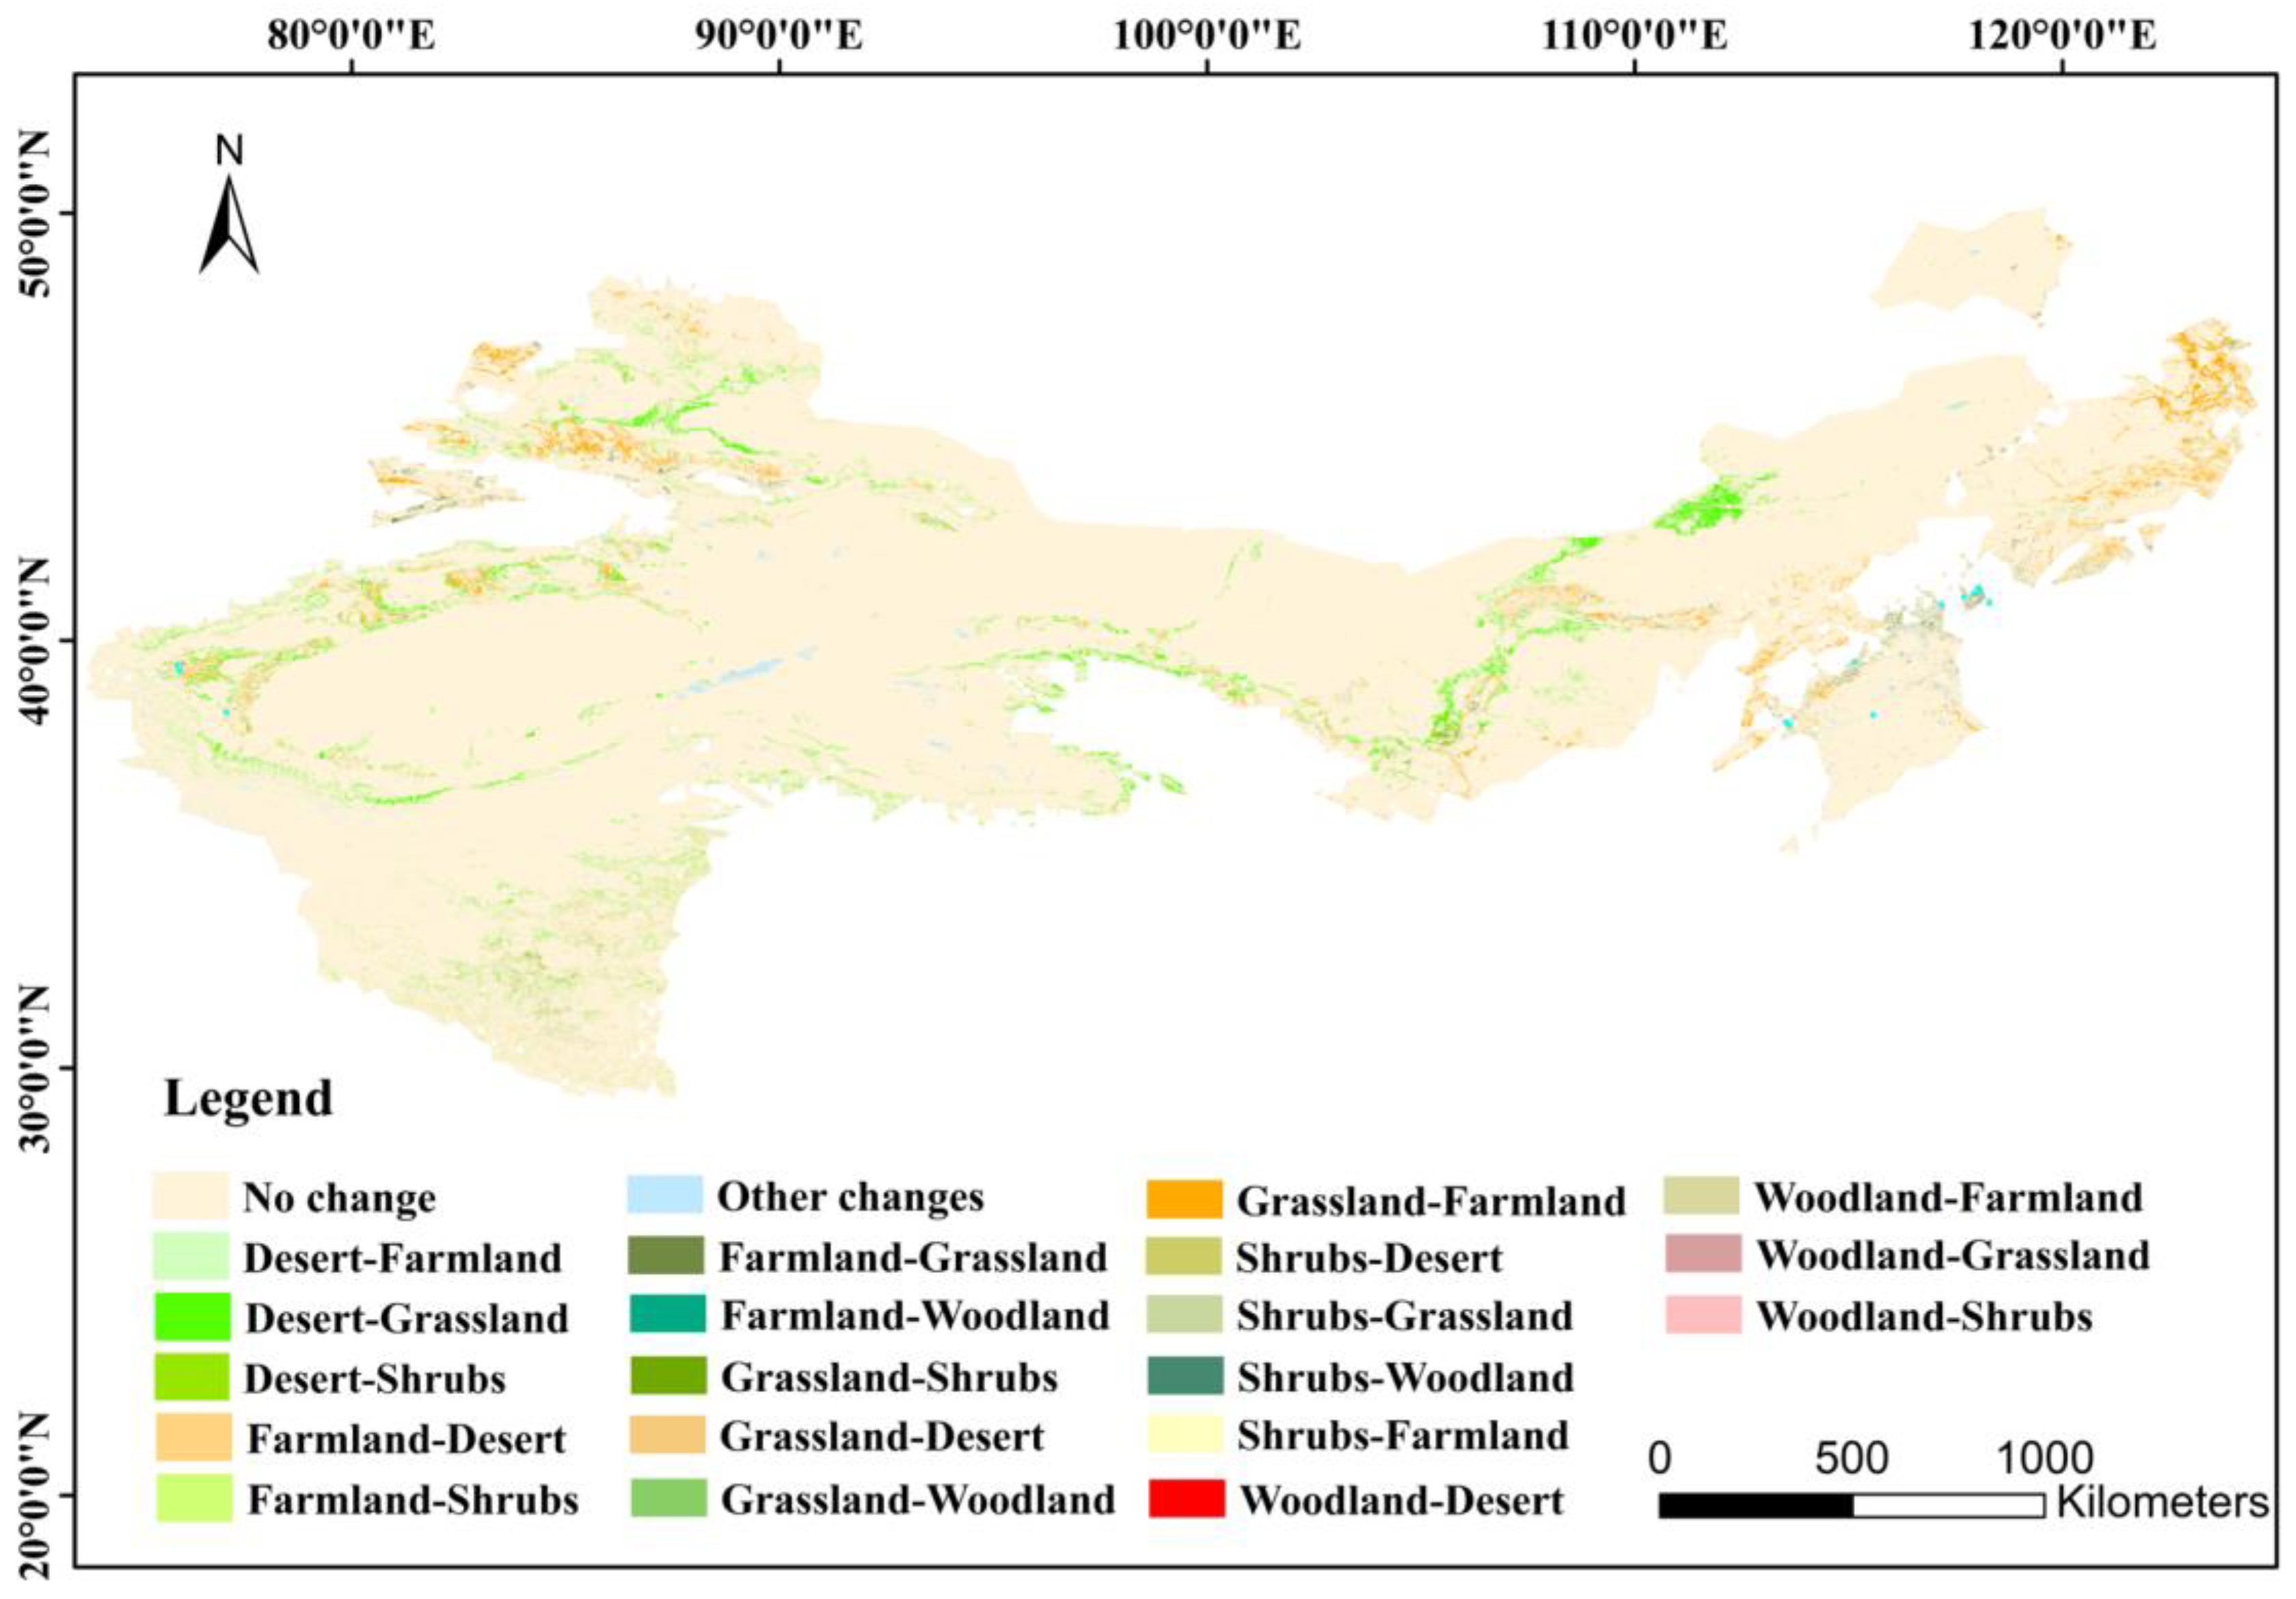
4.2.1. Land-Use Changes

Land-use change is the process of regional land-use transformation from one form to another. We studied 2001 and 2020 using MODIS MCD12Q1 land-use data, which divides land types into 17 categories [52]. We merged the relevant categories and eventually simplified them into nine different land types for land-use change studies. We used the transfer matrix (Table S2) to measure dynamic information on land-use changes over time [53] and produced a map of land-use transfers (Figure 9). We found that from 2001–2020, the desert area was reduced by 117,919 km2, mostly converted to grassland. In addition, 12,583 km2 of farmland was converted to grassland. These conversions are mainly due to the Chinese government’s policy of returning farmland to forests and grasses after the year 2000 [54]; the project targets sloping arable land prone to soil erosion, arable land prone to land sanding, and arable land with low and unstable grain yields by planting them with forests and grasses according to local conditions. Thus acting as a sand fixation, effectively mitigating desertification in northern China.

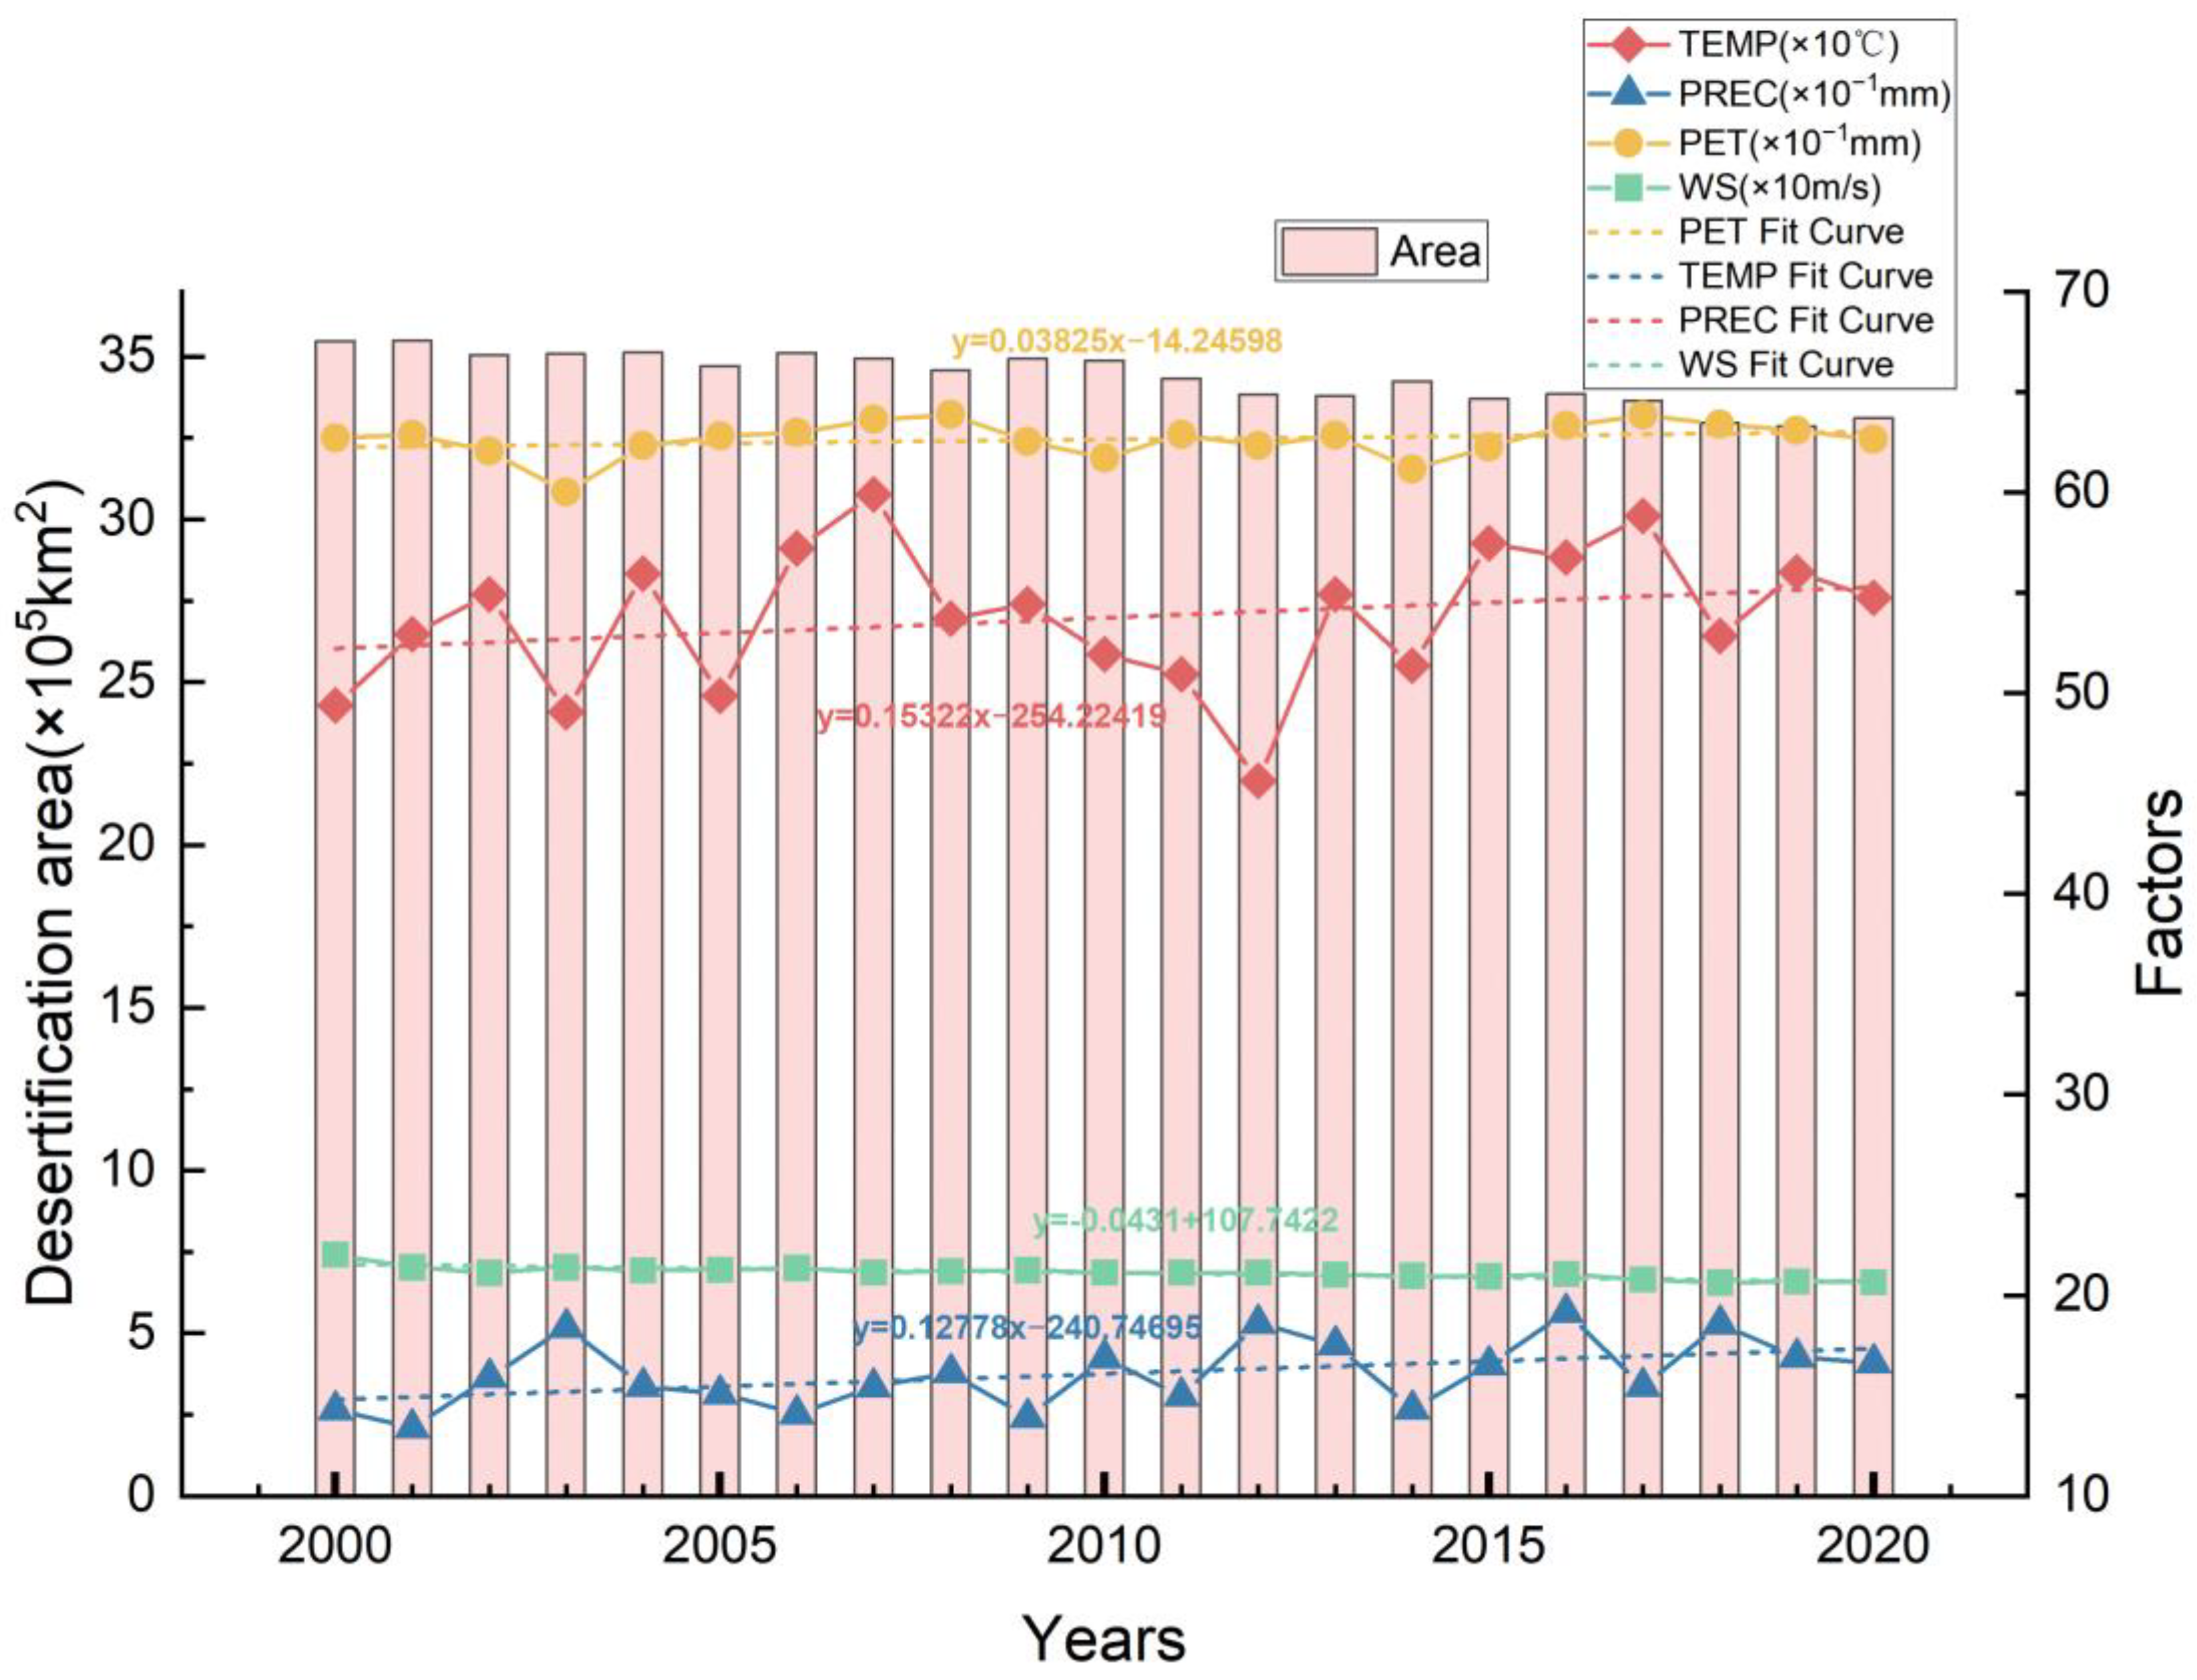
4.2.2. Changes in Climate Drivers

Several studies have shown that human activities play a large role in the changes of desertification in China [11,55,56], which is consistent with our study. However, climate change also plays a very important role in desertification by affecting vegetation growth and the physicochemical properties of soil [57,58]; therefore, its change characteristics also need to be explored. We counted the changes in the degree of desertification in areas with unchanged land use (Table 5) and found that the degree of change of desertification is also significant in areas with unchanged land use, much of which is due to climate change.
We mainly analyzed the average annual precipitation, average temperature, average potential evapotranspiration, and average wind speed in northern China to study the climatic drivers of desertification. In Figure 10, the year-to-year variation of various climatic factors in the study area is shown. We found that the fluctuations in temperature and potential evapotranspiration were generally consistent, but they did not seem to correlate well with desertification area. Precipitation and desertification area have some negative correlation, and in some years with low precipitation (2001, 2006, 2009, 2014, and 2020), desertification area is relatively larger. While the overall fluctuation of wind speed is not great, it can also be seen that wind speed has some positive correlation with desertification area, and in the years with higher wind speeds (2000, 2006, 2009, and 2016), desertification area is also relatively larger. However, we still need to conduct specific data analysis for the specific correlation.
We tested the correlation between each climatic factor and desertification area. In Table 6, the Pearson correlation coefficients and the significance of each climatic factor with desertification area is shown. We found that the Pearson correlation coefficient between precipitation and desertification area is −0.57, which is moderately negatively correlated. The Pearson correlation coefficient of wind speed and desertification area reached 0.856, which is a strong correlation; the significance level is less than 0.05, which indicates a significant correlation with the desertification area. The correlation of temperature and evapotranspiration with desertification area is low, which is also consistent with our analysis above. Overall, desertification is the result of the combined effects of several factors.

5. Conclusions

In this study, we determined the potential occurrence range of desertification in China based on meteorological data, calculated desertification monitoring indicators (albedo, LST, NDVT, and TGSI) using MODIS data based on the Google Earth Engine platform, and used four machine learning models (minimum distance, SVM, CART, and random forest) for desertification monitoring. The results showed that the accuracy of both the random forest model and CART with the combination of the four indicators is good, but the accuracy of the random forest is somewhat higher with an overall accuracy of 86.94% and a Kappa coefficient of 0.84. We used the random forest to monitor the desertification in northern China dynamically for the past 21 years and found that there are some fluctuations between years, but the overall trend of desertification in northern China is decreasing from 2000–2020. By examining the drivers of desertification change, we found that climate change and human activities have jointly led to changes in desertification conditions in northern China. Among them, human activities, especially ecological restoration projects implemented by the Chinese government, have greatly reduced the level of desertification. Meanwhile, climate change in the past two decades has also contributed to the reduction of desertification levels. In addition, this study did not carefully consider the effects of increasing NDVI values and surface greening due to climate factors such as CO2 and carbon deposition in the last 20 years and also did not consider growing seasonal changes, all of which may affect the accuracy of desertification change in northern China, but overall did not prevent us from concluding that desertification is decreasing in northern China. In future studies, we will include field validation data to improve the credibility of the dataset. We will also introduce higher resolution land-use classification data to further understand the role of the Chinese government’s ecological restoration projects in the process of desertification mitigation, as well as increase the analysis of the uncertainty of desertification change attributed to climatic and other factors.

Supplementary Materials

The following supporting information can be downloaded at: https://www.mdpi.com/article/10.3390/rs15051368/s1.

Author Contributions

The analysis was performed by Z.J. and X.N. All authors contributed with ideas, writing, and discussions. All authors have read and agreed to the published version of the manuscript.

Funding

This research was funded by the Inner Mongolia Science and Technology Major Project (Grand No. 2021ZD0011) and the Inner Mongolia University High Level Talent Research Startup Project (Grand No. 21800-5215105).

Data Availability Statement

Not applicable.

Acknowledgments

The authors would like to thank the three anonymous reviewers whose comments significantly improved this manuscript. This study was partially funded by the Inner Mongolia Science and Technology Major Project (Grand No. 2021ZD0011). This work was also supported by the Inner Mongolia University High Level Talent Research Startup Project (Grand No. 21800-5215105).

Conflicts of Interest

The authors declare no conflict of interest.

Appendix A

Table A1. Characteristics of different desertification types.
Desertification TypeImage CharacteristicsGoogle EarthLandsat-8
Extremely severe desertificationThe surface morphology is mostly sand dunes and Gobi, with almost no vegetation and white or yellowish tones on Landsat images.Remotesensing 15 01368 i001Remotesensing 15 01368 i002
Severe desertificationSemi-fixed, semi-fluid dunes with sparse vegetation, mainly white and yellow with some red patches on Landsat images.Remotesensing 15 01368 i003Remotesensing 15 01368 i004
Moderate desertificationThe surface morphology is mostly mobile or semi-fixed sand with vegetation distribution. Landsat images show interspersed red and white patches.Remotesensing 15 01368 i005Remotesensing 15 01368 i006
Slight desertificationThe surface morphology is mostly vegetated, with floating sand accumulations in the vegetation. On Landsat images, yellow and creamy white patches are scattered in patches of deep red.Remotesensing 15 01368 i007Remotesensing 15 01368 i008
None desertificationSurface morphology is overwhelmingly vegetated, with large areas of red on Landsat images.Remotesensing 15 01368 i009Remotesensing 15 01368 i010

References

  1. UNCCD. United Nations Convention to Combat Desertification in Countries Experiencing Serious Drought and/or Desertification, particularly in Africa; UNCCD: Paris, France, 14 October 1994. [Google Scholar]
  2. Reynolds, J.F.; Smith, D.M.S.; Lambin, E.F.; Turner, B.L.; Mortimore, M.; Batterbury, S.P.J.; Downing, T.E.; Dowlatabadi, H.; Fernandez, R.J.; Herrick, J.E. Global desertification: Building a science for dryland development. Science 2007, 316, 847–851. [Google Scholar] [CrossRef] [Green Version]
  3. Zhang, Z.H.; Huisingh, D. Combating desertification in China: Monitoring, control, management and revegetation. J. Clean. Prod. 2018, 182, 765–775. [Google Scholar] [CrossRef]
  4. Xu, D.Y.; Zhang, X. Multi-scenario simulation of desertification in North China for 2030. Land Degrad. Dev. 2021, 32, 1060–1074. [Google Scholar] [CrossRef]
  5. Ming, Y.F.; Zhang, Y.N.; Kang, J.F.; Feng, K.T. Spatial-temporal dynamic monitoring of desertification degree in China-Pakistan Economic Corridor based on MODIS images. Remote Sens. Technol. Appl. 2021, 36, 827–837. [Google Scholar]
  6. Feng, K.; Wang, T.; Liu, S.; Kang, W.; Chen, X.; Guo, Z.; Zhi, Y. Monitoring Desertification Using Machine-Learning Techniques with Multiple Indicators Derived from MODIS Images in Mu Us Sandy Land, China. Remote Sens. 2022, 14, 2663. [Google Scholar]
  7. Amani, M.; Ghorbanian, A.; Ahmadi, S.A.; Kakooei, M.; Brisco, B. Google Earth Engine Cloud Computing Platform for Remote Sensing Big Data Applications: A Comprehensive Review. IEEE J. Sel. Top. Appl. Earth Obs. Remote Sens. 2020, 13, 5326–5350. [Google Scholar] [CrossRef]
  8. Liu, P. A survey of remote-sensing big data. Front. Environ. Sci. 2015, 3, 45. [Google Scholar] [CrossRef] [Green Version]
  9. Tamiminia, H.; Salehi, B.; Mahdianpari, M.; Quackenbush, L.; Adeli, S.; Brisco, B. Google Earth Engine for geo-big data applications: A meta-analysis and systematic review. ISPRS J. Photogramm. Remote Sens. 2020, 164, 152–170. [Google Scholar] [CrossRef]
  10. Kumar, L.; Mutanga, O. Google Earth Engine Applications Since Inception: Usage, Trends, and Potential. Remote Sens. 2018, 10, 1509. [Google Scholar] [CrossRef] [Green Version]
  11. Meng, X.; Gao, X.; Li, S.; Li, S.; Lei, J. Monitoring desertification in Mongolia based on Landsat images and Google Earth Engine from 1990 to 2020. Ecol. Indic. 2021, 129, 107908. [Google Scholar] [CrossRef]
  12. Gorelick, N.; Hancher, M.; Dixon, M.; Ilyushchenko, S.; Moore, R. Google Earth Engine: Planetary-scale geospatial analysis for everyone. Remote Sens. Environ. 2017, 202, 18–27. [Google Scholar] [CrossRef]
  13. Zdruli, P.; Lacirignola, C.; Lamaddalena, N.; Liuzzi, G.T. The eu-funded medcoastland thematic network and its findings in combating land degradation in the mediterranean region. Environ. Sci. Eng. 2007, 421–435. [Google Scholar]
  14. Martinez-Valderrama, J.; Guirado, E.; Maestre, F. Desertifying deserts. Nat. Sustain. 2020, 3, 572–575. [Google Scholar] [CrossRef]
  15. Wang, X.M.; Hua, T.; Liang, L.L.; Ma, W.Y. Spatial differences of aeolian desertification responses to climate in arid Asia. Glob. Planet. Change 2017, 148, 22–28. [Google Scholar] [CrossRef] [Green Version]
  16. Wu, B.; Su, Z.Z.; Chen, Z.X. Revision of the potential range of desertification in China. J. Desert Res. 2007, 27, 911–917+1093–1094. [Google Scholar]
  17. Zhu, Y.; Zhang, J.; Zhang, Y.; Qin, S.; Shao, Y.; Gao, Y. Responses of vegetation to climatic variations in the desert region of northern China. Catena 2019, 175, 27–36. [Google Scholar] [CrossRef]
  18. Aragaw, H.M.; Mishra, S. Runoff curve number-potential evapotranspiration-duration relationship for selected watersheds in Ethiopia. Model. Earth Syst. Environ. 2022, 8, 1899–1910. [Google Scholar] [CrossRef]
  19. Guo, Q. Monitoring and Assessment Desertification from Remote Sensing in the Northern China; University of Chinese Academy of Sciences: Beijing, China, 2018. [Google Scholar]
  20. Thornthwaite, C.W. An Approach Toward a Rational Classification of Climate. Soil Sci. 1948, 66, 55–94. [Google Scholar] [CrossRef] [Green Version]
  21. Yang, Q.; Ma, Z.; Zheng, Z.; Duan, Y. Sensitivity of Potential Evapotranspiration Estimation to the Thornthwaite and Penman-Monteith Methods in the Study of Global Drylands. Adv. Atmos. Sci. 2017, 34, 1381–1394. [Google Scholar] [CrossRef]
  22. Bian, Z. Studies of Desertification Monitoring Methods Based on Remote Sensing Techniques; Beijing Forestry University: Beijing, China, 2011. [Google Scholar]
  23. Zheng, J.; Yin, X.R.; Yan, Y. Introduction to Thornthwaite revised water zoning method. Meteorol. Sci. Technol. 1982, 65–74. [Google Scholar] [CrossRef]
  24. He, T.; Liang, S.; Song, D. Analysis of global land surface albedo climatology and spatial-temporal variation during 1981–2010 from multiple satellite products. J. Geophys. Res.-Atmos. 2014, 119, 10281–10298. [Google Scholar] [CrossRef]
  25. Qin, Y.H.; Luo, J.; Chen, Z.; Mei, G.X.; Yan, L. Measuring the albedo of limited-extent targets without the aid of known-albedo masks. Sol. Energy 2018, 171, 971–976. [Google Scholar] [CrossRef]
  26. Wang, Z.S.; Schaaf, C.B.; Sun, Q.; Shuai, Y.; Román, M.O. Capturing rapid land surface dynamics with Collection V006 MODIS BRDF/NBAR/Albedo (MCD43) products. Remote Sens. Environ. 2018, 207, 50–64. [Google Scholar] [CrossRef]
  27. Wan, Z.M. New refinements and validation of the collection-6 MODIS land-surface temperature/emissivity product. Remote Sens. Environ. 2014, 140, 36–45. [Google Scholar] [CrossRef]
  28. de Andrade, M.D.; Delgado, R.C.; da Costa de Menezes, S.J.M.; de Ávila Rodrigues, R.; Teodoro, P.E.; da Silva Junior, C.A.; Pereira, M.G. Evaluation of the MOD11A2 product for canopy temperature monitoring in the Brazilian Atlantic Forest. Environ. Monit. Assess. 2021, 193, 45. [Google Scholar]
  29. Ning, T.; Liu, W.; Wen, L.; Song, X. NDVI Variation and Its Responses to Climate Change on the Northern Loess Plateau of China from 1998 to 2012. Adv. Meteorol. 2015, 2015, 725427. [Google Scholar] [CrossRef] [Green Version]
  30. Singh, R.P.; Roy, S.; Kogan, F. Vegetation and temperature condition indices from NOAA AVHRR data for drought monitoring over India. Int. J. Remote Sens. 2003, 24, 4393–4402. [Google Scholar] [CrossRef]
  31. Tomar, V.; Mandal, V.P.; Srivastava, P.; Patairiya, S.; Singh, K.; Ravisankar, N.; Subash, N.; Kumar, P. Rice Equivalent Crop Yield Assessment Using MODIS Sensors’ Based MOD13A1-NDVI Data. IEEE Sens. J. 2014, 14, 3599–3605. [Google Scholar] [CrossRef]
  32. Xiao, J.; Shen, Y.; Tateishi, R.; Bayaer, W. Development of topsoil grain size index for monitoring desertification in arid land using remote sensing. Int. J. Remote Sens. 2006, 27, 2411–2422. [Google Scholar]
  33. Lamchin, M.; Lee, J.Y.; Lee, W.K.; Lee, E.J.; Kim, M.; Lim, C.H.; Choi, H.A.; Kim, S.R. Assessment of land cover change and desertification using remote sensing technology in a local region of Mongolia. Adv. Space Res. 2016, 57, 64–77. [Google Scholar] [CrossRef]
  34. Liu, Q.S.; Liu, G.; Huang, C. Monitoring desertification processes in Mongolian Plateau using MODIS tasseled cap transformation and TGSI time series. J. Arid Land 2018, 10, 12–26. [Google Scholar] [CrossRef] [Green Version]
  35. Diem, P.K.; Diem, N.K.; Hung, H.V. Assessment of the Efficiency of Using Modis Mcd43a4 in Mapping of Rice Planting Calendar in the Mekong Delta. IOP Conf. Ser. Earth Environ. Sci. 2021, 652, 012015. [Google Scholar] [CrossRef]
  36. Na, R.S.; Du, H.; Na, L.; Shan, Y.; Huang, L. Spatiotemporal changes in the Aeolian desertification of Hulunbuir Grassland and its driving factors in China during 1980–2015. Catena 2019, 182, 104123. [Google Scholar] [CrossRef]
  37. Wang, Y.; Jiang, Y. A Weighted Minimum Distance Classifier Based on Relative Offset. In Proceedings of the 2019 IEEE 4th International Conference on Cloud Computing and Big Data Analysis (ICCCBDA), Chengdu, China, 12–15 April 2019; pp. 343–347. [Google Scholar]
  38. Lu, D.S.; Mausel, P.; Batistella, M. Comparison of land-cover classification methods in the Brazilian Amazon Basin. Photogramm. Eng. Remote Sens. 2004, 70, 723–731. [Google Scholar] [CrossRef] [Green Version]
  39. Choubin, B.; Darabi, H.; Rahmati, O.; Sajedi-Hosseini, F.; Klve, B. River suspended sediment modelling using the CART model: A comparative study of machine learning techniques. Sci. Total Environ. 2018, 615, 272–281. [Google Scholar] [CrossRef]
  40. Qian, Y.G.; Zhou, W.Q.; Yan, J.L.; Li, W.F.; Han, L.J. Comparing Machine Learning Classifiers for Object-Based Land Cover Classification Using Very High Resolution Imagery. Remote Sens. 2015, 7, 153–168. [Google Scholar] [CrossRef]
  41. Tehrany, M.S.; Pradhan, B.; Jebur, M.N. Flood susceptibility mapping using a novel ensemble weights-of-evidence and support vector machine models in GIS. J. Hydrol. 2014, 512, 332–343. [Google Scholar] [CrossRef]
  42. Gislason, P.O.; Benediktsson, J.A.; Sveinsson, J.R. Random Forests for land cover classification. Pattern Recognit. Lett. 2006, 27, 294–300. [Google Scholar] [CrossRef]
  43. Chan, J.C.W.; Paelinckx, D. Evaluation of Random Forest and Adaboost tree-based ensemble classification and spectral band selection for ecotope mapping using airborne hyperspectral imagery. Remote Sens. Environ. 2008, 112, 2999–3011. [Google Scholar] [CrossRef]
  44. Brieuc, M.S.O.; Waters, C.D.; Drinan, D.P.; Naish, K.A. A practical introduction to Random Forest for genetic association studies in ecology and evolution. Mol. Ecol. Resour. 2018, 18, 755–766. [Google Scholar] [CrossRef]
  45. Fan, Z.M.; Li, S.B.; Fang, H.Y. Explicitly Identifying the Desertification Change in CMREC Area Based on Multisource Remote Data. Remote Sens. 2020, 12, 3170. [Google Scholar] [CrossRef]
  46. Asokan, A.; Anitha, J. Change detection techniques for remote sensing applications: A survey. Earth Sci. Inform. 2019, 12, 143–160. [Google Scholar] [CrossRef]
  47. Jiang, L.L.; Jiapaer, G.; Bao, A.M.; Kurban, A.; Guo, H.; Zheng, G.X.; De Maeyer, P. Monitoring the long-term desertification process and assessing the relative roles of its drivers in Central Asia. Ecol. Indic. 2019, 104, 195–208. [Google Scholar] [CrossRef]
  48. Wang, Y.F.; Zhang, J.Q.; Guo, E.L.; Tong, S.Q. Monitoring the trends of aeolian desertified lands based on time-series remote sensing data in the Horqin Sandy Land, China. Catena 2017, 157, 286–298. [Google Scholar] [CrossRef]
  49. Erb, K.H.; Kastner, T.; Plutzar, C.; Bais, A.L.S.; Carvalhais, N.; Fetzel, T.; Gingrich, S.; Haberl, H.; Lauk, C.; Niedertscheider, M. Unexpectedly large impact of forest management and grazing on global vegetation biomass. Nature 2018, 553, 73–76. [Google Scholar] [CrossRef] [PubMed]
  50. Burrell, A.L.; Evans, J.P.; De Kauwe, M.G. Anthropogenic climate change has driven over 5 million km(2) of drylands towards desertification. Nat. Commun. 2020, 11, 3853. [Google Scholar] [CrossRef]
  51. Huang, J.P.; Zhang, G.L.; Zhang, Y.T.; Guan, X.D.; Wei, Y.; Guo, R.X. Global desertification vulnerability to climate change and human activities. Land Degrad. Dev. 2020, 31, 1380–1391. [Google Scholar] [CrossRef]
  52. Seydi, S.T.; Akhoondzadeh, M.; Amani, M.; Mahdavi, S. Wildfire Damage Assessment over Australia Using Sentinel-2 Imagery and MODIS Land Cover Product within the Google Earth Engine Cloud Platform. Remote Sens. 2021, 13, 220. [Google Scholar] [CrossRef]
  53. Huang, H.; Zhou, Y.; Qian, M.J.; Zeng, Z.Q. Land Use Transition and Driving Forces in Chinese Loess Plateau: A Case Study from Pu County, Shanxi Province. Land 2021, 10, 67. [Google Scholar] [CrossRef]
  54. Peng, L.; Chen, T.T.; Liu, S.Q. Spatiotemporal Dynamics and Drivers of Farmland Changes in Panxi Mountainous Region, China. Sustainability 2016, 8, 1209. [Google Scholar] [CrossRef] [Green Version]
  55. Liu, Q.F.; Zhang, Q.; Yan, Y.Z.; Zhang, X.F.; Niu, J.M.; Svenning, J.C. Ecological restoration is the dominant driver of the recent reversal of desertification in the Mu Us Desert (China). J. Clean. Prod. 2020, 268, 122241. [Google Scholar] [CrossRef]
  56. Duan, H.C.; Wang, T.; Xue, X.; Yan, C.Z. Dynamic monitoring of aeolian desertification based on multiple indicators in Horqin Sandy Land, China. Sci. Total Environ. 2019, 650, 2374–2388. [Google Scholar] [CrossRef] [PubMed]
  57. Costa, A.C.; Soares, A. Local spatiotemporal dynamics of a simple aridity index in a region susceptible to desertification. J. Arid Environ. 2012, 87, 8–18. [Google Scholar] [CrossRef]
  58. Zhang, C.X.; Wang, X.M.; Li, J.C.; Hua, T. Identifying the effect of climate change on desertification in northern China via trend analysis of potential evapotranspiration and precipitation. Ecol. Indic. 2020, 112, 106141. [Google Scholar] [CrossRef]
Figure 1. The total flowchart of this study. MD, SVM, CART, and RF stand for minimum distance, support vector machine, classification and regression tree, and random forest, respectively. LST is land surface temperature, NDVI is normalized difference vegetation index, and TGSI is topsoil grain size index.
Remotesensing 15 01368 g001
Figure 2. CF-fitted data for January. The left panel shows the linear regression relationship between CF values and latitude, and the right panel shows the fitted spatially continuous CF raster data. The CF values show a negative correlation with latitude.
Remotesensing 15 01368 g002
Figure 3. The study area. Divided into 5 climatic zones according to the moist index: MI less than 0.05 as the hyper-arid zone; MI between 0.05 and 0.2 as the arid zone; MI between 0.2 and 0.5 as the semi-arid zone; MI between 0.5 and 0.65 as the sub-humid arid zone; and MI greater than 0.65 as the humid zone.
Remotesensing 15 01368 g003
Figure 4. Distribution of sample points. Within the study area, 1000 sample points were selected and distributed as evenly as possible. DEM is the digital elevation model.
Remotesensing 15 01368 g004
Figure 5. Classification results of different machine learning models for a typical region. SVM stands for support vector machine and CART stands for classification and regression tree.
Remotesensing 15 01368 g005
Figure 6. Changes in the degree of desertification from 2000 to 2020. (a) 2000–2005; (b) 2005–2010; (c) 2010–2015; (d) 2015–2020.
Remotesensing 15 01368 g006
Figure 7. Desertification monitoring indicators and interannual variation of desertification area. Columns indicate the area of various types of desertification land, colored lines indicate the four monitoring indicators, and the black lines are the total area of desertification land.
Remotesensing 15 01368 g007
Figure 8. Desertification trends from 2000–2020 based on the Theil–Sen Median slope and Mann–Kendall test.
Remotesensing 15 01368 g008
Figure 9. Land-use changes in the study area within the last 20 years. We focused mainly on the changes in vegetation and the desert. The remaining land types did not change much, and we attributed them to other changes.
Remotesensing 15 01368 g009
Figure 10. The year-to-year trend of climate factors. Pink bars are areas of relatively increasing desertification area. TEMP, PREC, PET, and WS represent temperature, precipitation, potential evapotranspiration, and wind speed, respectively.
Remotesensing 15 01368 g010
Table 1. CF values by month at different latitudes.
Month123456789101112
Latitude
01.040.941.041.011.041.011.041.041.011.041.011.04
1010.911.031.031.081.061.081.071.021.020.980.99
200.950.891.031.051.131.111.141.111.0210.930.94
300.90.871.031.081.181.171.21.141.030.980.890.88
350.870.851.031.091.211.211.231.161.030.970.860.85
400.840.831.031.111.241.251.271.181.040.960.870.81
450.80.811.021.131.281.291.311.211.040.940.790.75
500.740.781.021.151.321.361.371.251.060.920.760.7
Table 2. Basic datasets.
DataData SourcesSpatial ResolutionTemporal Resolution
Albedohttps://lpdaac.usgs.gov/products/mcd43a3v006/ (accessed on 23 August 2022)500 m1 day/2000–2020
LSThttps://lpdaac.usgs.gov/products/mod11a2v006/
(accessed on 23 August 2022)
1000 m8 days/2000–2020
NDVIhttps://lpdaac.usgs.gov/products/mod13a1v006/
(accessed on 23 August 2022)
500 m16 days/2000–2020
TGSIhttps://lpdaac.usgs.gov/products/mcd43a4v006/
(accessed on 23 August 2022)
500 m1 day/2000–2020
Precipitationhttp://www.geodata.cn
(accessed on 9 July 2022)
1000 m1 month/2000–2020
Potential evaporationhttp://www.geodata.cn1000 m1 month/2000–2020
Temperaturehttp://www.geodata.cn1000 m1 month/2000–2020
Wind speedhttp://www.geodata.cn1000 m1 month/2000–2020
Land Coverhttps://lpdaac.usgs.gov/products/mcd12q1v006/
(accessed on 3 October 2022)
500 m1 year/2001–2020
Table 3. Accuracy validation of four models with different combinations of indicators.
CombinationsMDCARTSVMRF
OA (%)KAPPAOA (%)KAPPAOA (%)KAPPAOA (%)KAPPA
ALNT54.300.4378.690.7371.130.6486.940.84
ALN51.330.3972.330.6571.670.65730.66
ALT50.000.3761.740.5253.020.4268.460.61
ANT69.420.6275.840.769.110.6281.040.76
LNT52.160.4071.430.6469.770.6276.410.70
AL53.430.4153.070.4149.460.3763.540.54
AN68.870.6170.130.6368.870.6169.810.62
AT57.470.4754.870.4445.780.3259.420.49
LN50.330.3863.910.5570.200.6368.890.61
LT54.100.4252.460.4151.800.4053.770.42
NT66.560.5868.130.6066.880.5975.310.69
Where A is Albedo, L is LST, N is NDVI, and T is TGSI. MD, CART, SVM, and RF stand for minimum distance, classification regression tree, support vector machine, and random forest, respectively.
Table 4. Confusion matrix for accuracy verification by the data set.
Degree of
Desertification
ESSMLTotal
ES92702101
S3785313138
M714461380
L0805563
Table 5. Area changes of desertification in unchanged land-use areas.
20002020
Extremely severe (km2)1,581,3171,370,842
Severe (km2)703,489.5676,974.9
Moderate (km2)335,991.7282,457.2
Light (km2)75,5867.4833,718.7
Total (km2)3,376,6653,163,992
Table 6. Correlation test between climatic factors and desertification area.
PRECWSPETTEMP
Pearson correlation coefficient−0.5700.856−0.274−0.163
Sig0.0070.0000.2300.480
TEMP, PREC, PET, and WS represent temperature, precipitation, potential evapotranspiration, and wind speed, respectively. Sig stands for significance.
Disclaimer/Publisher’s Note: The statements, opinions and data contained in all publications are solely those of the individual author(s) and contributor(s) and not of MDPI and/or the editor(s). MDPI and/or the editor(s) disclaim responsibility for any injury to people or property resulting from any ideas, methods, instructions or products referred to in the content.

