Abstract
The polarimetric synthetic aperture radar (PolSAR) provides us with a two-by-two scattering matrix data set. The ensemble averaged coherency matrix in an imaging window derived using a scattering matrix has all non-zero elements in its three-by-three matrix. It is a full 3 × 3 matrix that bears nine real-valued and independent polarimetric parameters inside. In the proposed decomposition method, G5U, we preprocess observed coherency matrix [T] by using two consecutive unitary transformations to become an ideal form for five-component decomposition. The transformation reduces nine parameters to seven, which is the best fit for five-component scattering model expansion. We can retrieve five powers corresponding to surface scattering, double bounce scattering, volume scattering, oriented dipole scattering, and compound dipole scattering, directly. These powers can be calculated easily and used to display superb polarimetric RBG images as never before, and are further applicable for polarimetric calibration, classification, validation, etc.
1. Introduction
Ensemble averaged coherency matrix generally has all non-zero elements in its three-by-three matrix [1]. It becomes a full 3 × 3 matrix that bears nine real-valued and independent polarimetric parameters inside [2]. In the development of scattering power decomposition schemes [1,2,3,4,5,6], the number of scattering mechanisms and corresponding models were increased to account for nine parameters, as shown in Yamaguchi four-component decomposition scattering power (Y4O) [5], six-component scattering power decomposition (6SD) [7], and seven-component scattering power decomposition (7SD) [8]. These methods try to use polarimetric parameters as much as possible in the decomposition aimed at 100% utilization.
On the other hand, there is another way to deal with nine polarimetric parameters. If the number of parameters is decreased, the corresponding number of scattering models can be reduced. Yamaguchi four-component scattering power decomposition with rotation of coherency matrix (Y4R) forced and reduced nine parameters to eight [9,10]. Then, four scattering models are used to account for six parameters out of eight. General four-component scattering power decomposition using two consecutive unitary transformations of original coherency matrix (G4U) makes ; then, eight parameters are reduced to seven [11]. G4U accounts for seven parameters out of seven, and four scattering models are used to account for seven parameters of coherency matrix, namely surface scattering, double-bounce scattering, volume scattering, and helix scattering. In this case, accounting for seven parameters is enough for complete decomposition. If we prepare some appropriate scattering models, it is possible to decompose the coherency matrix with full utilization of polarimetric information (7/7) [12].
In the proposed new decomposition model, General five-component scattering power decomposition with Unitary transformation (G5U), we preprocess the observed coherency matrix [T] using two consecutive unitary transformations to make , then decompose the unitary transformed matrix into five submatrices obtained, using surface scattering, double-bounce scattering, volume scattering, oriented dipole scattering, and compound dipole scattering, to become an ideal form for five-component decomposition. Therefore, we retrieve the five-component powers derived using surface scattering, double-bounce scattering, volume scattering, oriented dipole scattering, and compound dipole scattering. The HV contribution from oriented dihedral or vegetation is discriminated in the branch condition .
2. Materials and Methods
In this new decomposition, G5U, we preprocess observed coherency matrix [T] using two consecutive unitary transformations [11] to become an ideal form for five-component decomposition.
2.1. Preprocessing of G5U Scheme
Once coherency matrix
Is obtained using ensemble averaging in an imaging window, we try to convert it to an ideal form for five-component scattering power decomposition with as follows.
Step 1: Transformation aimed at .
The first transformation is
where the rotation matrix is
with the angle
The first transformation (2) forces pure imaginary.
Step 2: Transformation aimed at .
Followed by Transformation (2), the next unitary transformation is carried out:
where the unitary matrix
and the angle
Transformation (6) forces to be real-valued
Hence, element becomes zero after step 1 and 2.
These two consecutive transformations make so that the final form of the coherency matrix transform is
physically means no correlation between and , which decouples their scattering. It forces redistribution of original into and . It should be noted in the Transformations (2) and (6) that is maximized, whereas is minimized. The minimization of contributes to the reduction in overestimating volume scattering power.
It is understood that is invariant, is minimized, while is maximized by the same amount {}. Through this consecutive transformation, is redistributed to and .
2.2. General 5-Component Scattering Power Decomposition with Unitary Transformation (G5U)
We expand transformation (11) using the submatrices of surface scattering, double-bounce scattering, volume scattering, oriented dipole scattering, and compound dipole scattering as follows in (12) and Figure 1:

Figure 1.
Pictorial representation of total power in G5U.
: surface scattering power, : double-bounce scattering power;
: volume scattering power, : oriented dipole power, : compound dipole power.
From Equation (14), we can directly obtain the values of , , and .
For the case of uniform distribution with the magnitude condition , Equation (14) derives the following 3 equations with 4 unknowns ()
For the case of sine distribution with , the following 3 equations can be derived from Equation (14):
For the case of cosine distribution with , the following 3 equations are derived:
For oriented dihedral, the expansion equation becomes with 4 unknowns ()
The solution of Equations (16)-(19) can be obtained through branch condition .
2.3. Branch Condition
On the basis of covariance matrix formulation, the expression for derives
Approximate solution of 3 equations:
Albedo () is defined as the fraction of incident radiation that is reflected by a surface. While reflectance is defined as this same fraction for a single incidence angle, albedo is the directional integration of reflectance over all sun-view geometries.
Recently the following paper claimed the superiority of angle [13] for discriminating the scattering mechanism [14,15]. can be rewritten as
Since is the roll-invariant parameter for any polarization basis, it is worth checking its availability. Since is equivalent to , it is easy to add and check.
We use the right-hand side of Equation (20) as the branch condition for , and or does not appear in this expression. Since is invariant, so, we use the branch condition to discriminate the dominant scattering, i.e., either surface or double-bounce. The criterion is used to determine surface scattering using , and double-bounce scattering using .
2.4. Branch Condition
For oriented dihedral scattering, the covariance matrix formulation for is rewritten as
Since , the above expression becomes
2.5. Flowchart of G5U
Figure 2 depicts the methodology flow chart for the general five-component scattering power decomposition model (G5U), in which we ensure that all scattering powers are nonnegative.
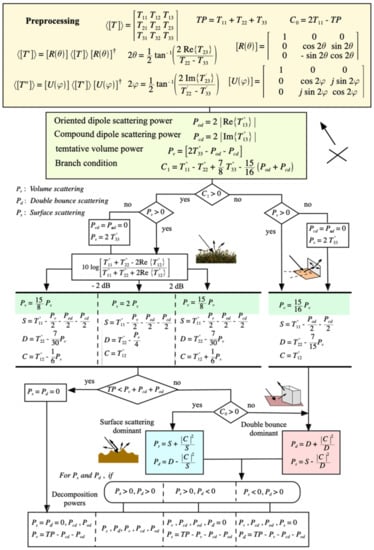
Figure 2.
Flowchart of G5U.
3. Results
Using four different quad polarization datasets, including the Mumbai quad pol. data, the Mexico City quad polarization data, the San Francisco quad polarization data, the Ahmedabad quad polarization dataset from the Advanced Land Observation Satellite-2/Phased Array type L-band Synthetic Aperture Radar-2 (ALOS-2/PALSAR-2), and F-SAR airborne quad polarization datasets for L- and S-bands, we compared the findings of five-component decomposition (G5U) with all the model-based decompositions that are currently existing, including FDD, Y4O, Y4R, S4R, G4U, 6SD, and 7SD.
Three colors are assigned to three distinct powers for qualitative analysis, blue for surface scattering, red for double-bounce scattering, and green for volume scattering. By compositing these three powers, we can create an RGB color-code image that is easy to understand, classify images, and identify targets, since it allows us to notice the differences with unaided eyes.
We selected several AOIs (areas of interest) for quantitative investigation in order to determine the contribution of scattering power in that particular area.
The results and analysis for all four datasets are explained in the following subsections:
3.1. L-Band Mumbai Dataset
We applied all decomposition models to the ALOS-2/PALSAR-2 L-band quad polarization Mumbai, Western India dataset, which was acquired on 14 April 2016 (with level 1.1, single-look complex). Spatial resolution in range and azimuth directions are 52.2 m and 53 m, respectively on the ground and the matrix was created with a 6 × 10 multi-look factor in the range and azimuth direction, respectively.
The 7SD decomposition model clearly outperforms the other decomposition models (FDD, Y4O, Y4R, S4R, G4U, G5U, and 6SD) in terms of overall results, but the G5U decomposition, which makes use of 100% polarimetric parameters of the coherency matrix and is also known as complete scattering power decomposition, performs significantly better in oriented urban areas (Figure 3).
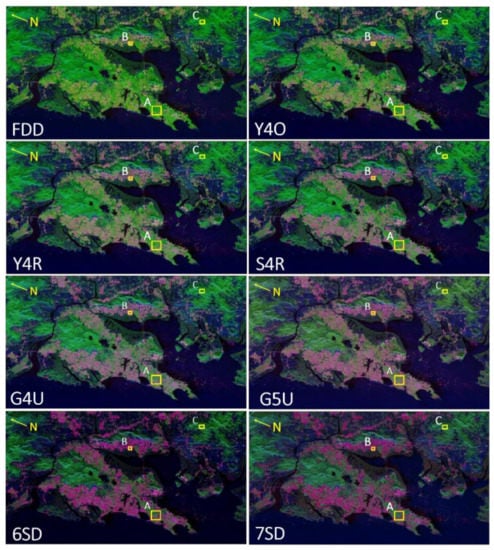
Figure 3.
Scattering power decomposition RGB images using FDD, Y4O, Y4R, S4R, G4U, G5U, 6SD, and 7SD applied to ALOS-2 L-band quad polarization Mumbai dataset. Red: double-bounce; green: volume scattering; blue: surface scattering.
We chose some patches on the RGB color-coded images (Figure 3) with yellow-colored boxes and performed statistical analysis to examine the impact of all scattering powers on the findings generated results. Patch A represents oriented urban area, patch B represents orthogonal urban area about the radar line of sight, and patch C represents a hilly area covered in vegetation.
For patch A, oriented urban area, the FDD decomposition model overestimates volume scattering and incorrectly categorizes oriented urban area (Figure 4) due to the strong contribution of volume scattering (56.8%) and the low contribution of double-bounce scattering (26.8%). When we move forward the improved models (Y4O, Y4R, S4R, G4U, G5U, 6SD, 7SD), we can predict that the contributions of double-bounce scattering increase (28.2%, 29.9%, 30.1%, 30.7%, 36.7%, 33.9%, 31.2%, respectively) and volume scattering decrease (47.2%, 44.5%, 43.5%, 40.6%, 28.6%, 27.1%, 24.8%, respectively), which help to improve the classification and interpretation of PolSAR images and reduce the impact of overestimating in volume scattering. As expected, G5U provides greater double-bounce scattering for oriented urban areas, where the contributions from volume scattering and double-bounce scattering are 28.6% and 36.7%, respectively. The inclusion of element of the coherency matrix with scattering interpretation and models in Gulab decomposition (G4U) [11] produces two scattering powers in G5U as generates oriented dipole scattering and represents the compound dipole scattering phenomenon (). The existence of and are found significant in oriented urban areas and tree branches [7,8]. G5U correctly recognizes urban features as compared to G4U, especially in the case of oriented dihedral structures. This represents a significant improvement over the misclassification of the oriented man-made structures from vegetation.
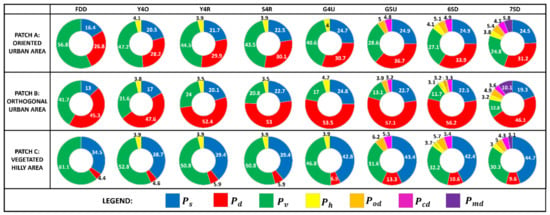
Figure 4.
Quantitative analysis for a few patch images (A: oriented urban area; B: orthogonal urban area; C: vegetated hilly area) corresponding to a chosen AOI in Figure 3.
For patch B, an orthogonal urban area, it is observed that the cross-polarized component is less in orthogonal urban structures, which also leads to low amounts of generated compound radar signals. As a result, the contributions of helix scattering (), oriented-dipole scattering (), compound scattering (), and mixed dipole scattering () are also low. Since the selected AOI urban area is globally orthogonal with respect to the radar line of sight, the contribution of double-bounce scattering is observed, which is almost similar in G5U (57.1%) and 6SD (56.2%) methods. As a result, there will not be a significant difference in double-bounce scattering compared to the other decomposition methods (Figure 4).
For patch C, a hilly area covered with vegetation, there is sparse vegetation that contributes to the cross-polarization component and provides volume scattering (61.1%, 52.8%, 50.8%, 50.8%, 46.8%, 31.6%, 32.2%, and 30.3% in FDD, Y4O, Y4R, S4R, G4U, G5U, 6SD, and 7SD, respectively). Due to sloppy surface, hilly terrain creates oriented surface structures that are formed along the radar line of sight, so it produces more cross-polarization factors that lead to be misclassification of the image. Compounded generated signal scattering compensates for the cross-polarization in volume scattering, which aids in the accurate identification of the targets. In G5U, 6SD and 7SD, a physical model of and parameters of the coherency matrix were introduced, which is the representation of the oriented targets and compound scattering-produced targets, respectively. In addition, unitary transformation of the matrix minimizes elements, which is a generator element in model-based decomposition.
3.2. L-Band Mexico City Dataset
We used the L-band Mexico City quad polarization SAR dataset as another example to check the efficacy of the G5U model. This dataset was acquired on 19 April 2017 (with level 1.1, single-look complex), and incidence angle (side-looking angle) is 30.9° with 5 × 8 multi-look factor in range and azimuth direction, respectively.
The three major scatterings, surface scattering, double-bounce scattering, and volume scattering, were used to create RGB color-code images (Figure 5) in a similar manner to previous dataset. We can observe that the G5U model, which offers higher double-bounce scattering in comparison to other approaches, has improved for oriented urban areas with respect to radar line of sight.
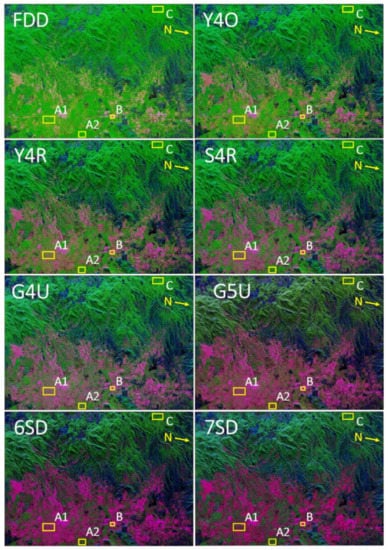
Figure 5.
Scattering power decomposition RGB images using FDD, Y4O, Y4R, S4R, G4U, G5U, 6SD, and 7SD applied to ALOS-2 L-band Mexico quad polarization dataset. Red: double-bounce; green: volume scattering; blue: surface scattering.
To quantify the contribution of all scattering powers, we then chose a few patches. In Figure 5, we highlighted four different patches, patch A1 and A2 represent oriented urban areas, patch B represents an orthogonal urban area with respect to radar line of sight, and patch C represents a vegetation area.
In comparison to other decomposition methods, the contribution of volume scattering is low (7.8% and 17.3% for patch A1 and patch A2, respectively), and the contribution of double-bounce scattering is high (66.9% and 49.9% for patch A1 and patch A2, respectively), in the G5U model (Figure 6). This reduces the problem of misclassification and overestimation of volume scattering in urban areas and aids in the accurate identification of man-made structures. Double-bounce scattering is almost equivalent in all decomposition models (FDD, Y4O, Y4R, S4R, G4U, G5U, 6SD, and 7SD) for orthogonal urban areas (patch B), as shown in Figure 6. Comparably, 7SD performs better in the situation of the vegetation AOI (patch C). It divides the total power into various scattering and offers information on various target types, which helps to deal with the overestimation of volume scattering.
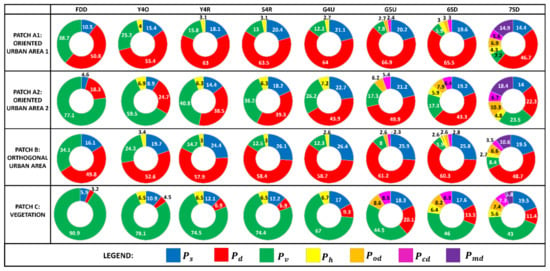
Figure 6.
Quantitative analysis for a few patch images (A1 and A2: oriented urban area; B: orthogonal urban area; C: vegetated area) corresponding to a chosen AOI in Figure 5.
3.3. L-Band San Francisco Dataset
ALOS-2/PALSAR-2 L-band San Francisco, CA, USA data, which was obtained on April 24, 2016, serves as another illustration (with level 1.1, single-look complex). Range and azimuth spatial resolution are 8.7 m and 5.3 m, respectively. Multi-look factor 6 × 10 was used to create the coherency matrix, also known as the matrix, for range and azimuth direction, respectively. Figure 7 illustrates how all decomposition models (FDD, Y4O, Y4R, S4R, G4U, G5U, 6SD, and 7SD) were applied to the data and used to produce an RGB color code image using surface, double-bounce, and volume scatterings. It is observed that results were improved significantly for the developed decomposition models [6,7,10] which utilized 100% polarimetric information of . It can be either minimizing the elements of using unitary transformation, which helps to use 100% polarimetric information in the model-based decomposition (G4U) or the inclusion of new scattering models for individual elements of the matrix (6SD/7SD) or modification in the existing decomposition model by combining the information of scattering models of elements and unitary transformation of for reducing elements of (proposed G5U method). G5U produces better outcome in their respective scattering natures (Figure 7).
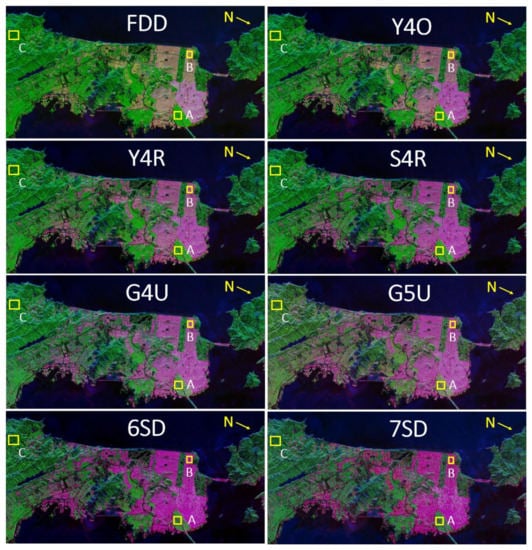
Figure 7.
Scattering power decomposition RGB images using FDD, Y4O, Y4R, S4R, G4U, G5U, 6SD, and 7SD applied to ALOS-2 L-band San Francisco quad polarization data. Red: double-bounce; green: volume scattering; blue: surface scattering.
For the statistical comparison, we chose some yellow-colored patches, as shown in Figure 7, and calculated the mean of all scattering powers of those selected AOIs, as shown in Figure 8. Patch A represents oriented urban area with respect to radar line of sight; patch B represents orthogonal urban area with respect to radar line of sight, and patch C represents vegetated hilly area.
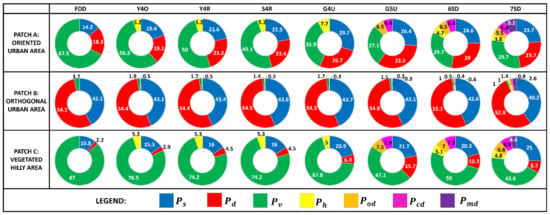
Figure 8.
Quantitative analysis for some patch images (A: oriented urban area; B: orthogonal urban area; C: vegetated hilly area) corresponding to selected AOI in Figure 7.
In contrast to other decomposition techniques (FDD, Y4O, Y4R, S4R, G4U, 6SD, 7SD), the G5U model provides higher double-bounce scattering (33.5%) for patch A (an oriented urban area). Additionally, G5U (54.8%, ) and 6SD (55.1%, ) both provide superior and comparable results for patch B (an orthogonal urban area), and higher contribution to double-bounce scattering than other powers models. We observed that 7SD produces better results and offers more information for patch C (vegetated hilly areas) than other decomposition techniques.
3.4. Ahmedabad City Dataset
The last quad polarization dataset of Ahmedabad city was used to verify the G5U model, which was acquired using ALOS-2/PALSAR-2 on 21 October 2022 (with level 1.1, single-look complex) with an incidence angle of 25.4°. In range and azimuth direction, multi-look factor is 5 × 11, respectively.
The RGB color composite images for all decomposition methods are shown in Figure 9, which facilitates visual interpretation and offers improved double-bounce scattering in the G5U model in comparison to other models.
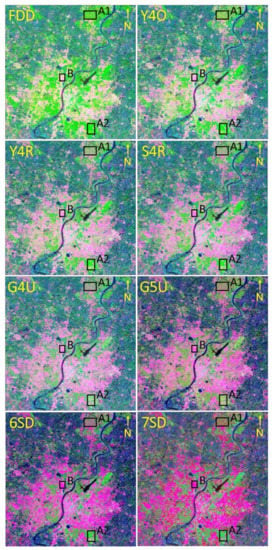
Figure 9.
Scattering power decomposition RGB images using FDD, Y4O, Y4R, S4R, G4U, G5U, 6SD, and 7SD applied to ALOS-2 L-band Ahmedabad city quad polarization data. Red: double-bounce; green: volume scattering; blue: surface scattering.
By choosing a few patches and calculating their statistical mean scattering powers, we were able to prove the qualitative analysis and demonstrate the increase in double-bounce scattering in oriented urban areas for the G5U model as compared to other decomposition methods.
As depicted in Figure 9, we chose two patches (patch A1 and patch A2) for oriented urban areas and one patch (patch B) for an orthogonal urban area with respect to the radar line of sight, with black-colored boxes.
It is clearly demonstrated that G5U produces higher double-bounce scattering (44% and 40.4%, oriented urban areas (patch A1 and A2), respectively) as compared to other approaches (Figure 10). G5U produces a double-bounce scattering contribution similar to the existing decompositions in our orthogonal urban area patch B.
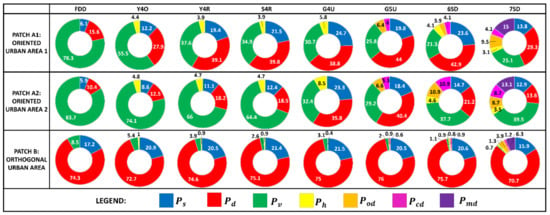
Figure 10.
Quantitative analysis for a few patch images (A1 and A2: oriented urban areas; B: orthogonal urban area) corresponding to a chosen AOI in Figure 9.
3.5. L-Band and S-Band F-SAR PolSAR Data
We used the airborne F-SAR quad polarization dataset with different frequencies (L-band and S-band) over Kaufbeuren, Germany, acquired on 8 June 2010. The multi-look factors for L-band and S-band are 5 × 10 and 10 × 12 in range and azimuth direction, respectively, and G5U results were produced for PolSAR datasets of F-SAR. G5U RGB color composite images are shown in Figure 11. An area of interest (a white line polygon, Figure 11) was chosen over forest region for statistical analysis of proposed decomposition to check the behavior of scattering powers with different frequency acquisitions.
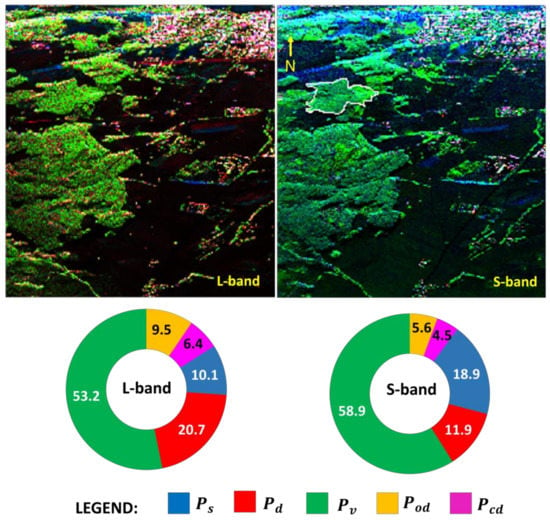
Figure 11.
(Top) Scattering power decomposition of RGB images using G5U for two bands (L-band and S-band) over Kaufbeuren, Germany, acquired using F-SAR quad polarization data. Red: double-bounce; green: volume scattering; blue: surface scattering. (Bottom) Quantitative analysis for white-color polygon (vegetation area) drawn in RGB color code image in S-band (Top Right).
Volume scattering contribution over forest patch is dominant in G5U with both frequencies. L-band results produce 53.2% volume scattering while the S-band generates 58.9% volume scattering. L-band radar signal can penetrate through forest canopy and interact with the tree branches and tree-trunk and ground, produced compound ( + ~15.9%) and double-bounce scattering ( ~ 20.7%) significantly. S-band radar signal mostly interacts at the top of the canopy and within the top of the canopy, surface scattering from the top of the canopy and volume scattering are more prominent. This is why the contributions of double-bounce scattering ( ~ 10%), and compound scattering ( + ~ 10.1%) are less in the S-band as compared to the L-band.
4. Discussion
After implementing these models to the test on various datasets, it can be stated that G5U offers superior performance in oriented urban areas with respect to radar line of sight, which makes it easier to correctly recognize man-made structures, as compared to existing decomposition models (FDD, Y4O, Y4R, S4R, G4U, 6SD, and 7SD).
There are two branch conditions ( and ) in the G5U model. Branch condition allows to distinguish between volume scattering caused by cloud of dipoles and oriented dihedral structures. To distinguish between the two types of dominant scattering, surface scattering and double-bounce scattering, we used the branch condition .
The initial rotation of the matrix by an angle reduces the elements of the original coherency matrix, which is dominated in the cross-polarized factor and produces volume scattering, and becomes zero. In a similar way, the second rotation by an angle causes to become zero and it minimizes parameter of rotated coherency matrix, which aims to minimize the cross polarization from oriented urban structures. The element, which dominates volume scattering, is reduced by the amount of and , and the element, which dominates double bounce scattering, is increased by the same amount. and are found in tree branches, oriented structures, etc., but when these parameters are made zero by unitary transformation of the matrix, the effect of volume scattering is reduced, as is minimized, and the addition of the same amount in element, which increases double bounce scattering in oriented urban areas.
Urban areas are dominated by double-bounce scattering, and G5U provides better double-bounce scattering results than existing models (FDD, Y4O, Y4R, S4R, G4U, 6SD, and 7SD), particularly in the case of oriented urban areas. Because it uses 100% polarimetric coherency matrix parameters, as model is also referred to as the complete scattering power decomposition model.
5. Conclusions
A general five-component scattering power decomposition scheme (G5U) was presented. As preprocessing, observed coherency matrix was unitarily transformed two times to become an ideal form for five-component decomposition. Using this specific form, G5U divided the unitarily transformed coherency matrix into a sum of five sub-matrices using surface scattering, double-bounce scattering, volume scattering, oriented, and compound dipole scatterings. G5U accounts for seven polarization parameters out of seven contained in the unitarily transformed coherency matrix. That is, 100% utilization of polarimetric information. The difference between G5U and the existing G4U is the utilization of the element. This G5U completely nulls the element mathematically, which means that it neutralizes the mutual effect of double-bounce and volume scattering physically. Through two consecutive transformations, one can see that the element in the coherency matrix is minimized twice, which means a reduction in volume scattering power. This effect contributes to the mitigation of overestimation of volume scattering power in the decomposition result and improves it to correctly identify urban areas in G5U images. The outcome of the proposed decomposition is also important for PolSAR applications for classification and identification of targets/objects [16,17]. Furthermore, this study can be extended for type of target classification, for example, vegetation species classification [18].
Author Contributions
Conceptualization, R.M. and Y.Y.; methodology, R.M., Y.Y. and G.S.; software, R.M.; validation, R.M.; formal analysis, R.M.; investigation, R.M. and Y.Y.; resources, O.D. and G.S.; data curation, G.S.; writing—original draft preparation, R.M. and Y.Y.; writing—review and editing, O.D. and G.S.; visualization, R.M. and Y.Y.; supervision, Y.Y. and O.D.; funding acquisition, G.S. All authors have read and agreed to the published version of the manuscript.
Funding
This work was supported by Strategic Programmes Large Initiatives and Coordinated Action Enabler-Climate Change Program (SPLICE-CCP), Department of Science and Technology (DST), Government of India, under National Network Program on Himalayan Cryosphere with the project no. DST/CCP/NHC/155/2018(G) and Niigata University, Japan.
Data Availability Statement
Data will be made available on request.
Acknowledgments
The authors are grateful to JAXA for providing fully polarimetric ALOS-2/PALSAR-2 data for projects ER3A2N027 and ER3A2N126 under EORA3 ALOS-2/4. Rashmi Malik thanks Ministry of Education, Government of India for providing fellowship under the Prime Minister’s Research Fellows (PMRF) Scheme.
Conflicts of Interest
The authors declare no conflict of interest.
References
- Lee, J.S.; Pottier, E. Polarimetric Radar Imaging from Basics to Applications; CRC Press: Boca Raton, FL, USA, 2009; pp. 3–9. [Google Scholar]
- Yamaguchi, Y. Polarimetric SAR Imaging: Theory to Applications; CRC Press: Boca Raton, FL, USA, 2020; pp. 2–9. ISBN 978-0-367-47831-5. [Google Scholar]
- Freeman, A.; Durden, S.L. A three-component scattering model for polarimetric SAR data. IEEE Trans. Geosci. Remote Sens. 1998, 36, 693–973. [Google Scholar] [CrossRef]
- Freeman, A. Fitting a Two-Component Scattering Model to Polarimetric SAR Data from Forests. IEEE Trans. Geosci. Remote Sens. 2007, 45, 2583–2592. [Google Scholar] [CrossRef]
- Yamaguchi, Y.; Yajima, Y.; Yamada, H. A four-component decomposition of POLSAR images based on the coherency matrix. IEEE Geosci. Remote Sens. Lett. 2006, 3, 292–296. [Google Scholar] [CrossRef]
- Lee, J.S.; Ainsworth, T.L.; Wang, Y. Generalized polarimetric model-based decompositions using incoherent scattering models. IEEE Trans. Geosci. Remote Sens. 2014, 52, 2474–2491. [Google Scholar] [CrossRef]
- Singh, G.; Yamaguchi, Y. Model-based six-component scattering matrix power decomposition. IEEE Trans. Geosci. Remote Sens. 2018, 56, 5687–5704. [Google Scholar] [CrossRef]
- Singh, G.; Malik, R.; Mohanty, S.; Rathore, V.S.; Yamada, K.; Umemura, M.; Yamaguchi, Y. Seven-component scattering power decomposition of POLSAR coherency matrix. IEEE Trans. Geosci. Remote Sens. 2019, 57, 8371–8372. [Google Scholar] [CrossRef]
- Yamaguchi, Y.; Sato, A.; Boerner, W.M.; Sato, R.; Yamada, H. Four-component scattering power decomposition with rotation of coherency matrix. IEEE Trans. Geosci. Remote Sens. 2011, 49, 2251–2258. [Google Scholar] [CrossRef]
- Sato, A.; Yamaguchi, Y.; Singh, G.; Park, S.-E. Four-component scattering power decomposition with extended volume scattering model. IEEE Geosci. Remote Sens. Lett. 2012, 9, 166–170. [Google Scholar] [CrossRef]
- Singh, G.; Yamaguchi, Y.; Park, S.-E. General four-component scattering power decomposition with unitary transformation of coherency matrix. IEEE Trans. Geosci. Remote Sens. 2013, 51, 3014–3022. [Google Scholar] [CrossRef]
- Singh, G.; Mohanty, S.; Yamazaki, Y.; Yamaguchi, Y. Physical scattering interpretation of POLSAR coherency matrix by using compound scattering phenomenon. IEEE Trans. Geosci. Remote Sens. 2020, 58, 2541–2556. [Google Scholar] [CrossRef]
- Cloude, S.R.; Pottier, E. A review of target decomposition theorems in radar polarimetry. IEEE Trans. Geosci. Remote Sens. 1996, 34, 498–518. [Google Scholar] [CrossRef]
- Maurya, H.; Panigrahi, R.K. Investigation of branching conditions in model-based decomposition methods. IEEE Geosci. Remote Sens. Lett. 2018, 15, 1224–1228. [Google Scholar] [CrossRef]
- Maurya, H.; Panigrahi, R.K. PolSAR coherency matrix optimization through selective unitary rotations for model-based decomposition scheme. IEEE Geosci. Remote Sens. Lett. 2019, 16, 658–662. [Google Scholar] [CrossRef]
- Yang, J.; Yamaguchi, Y.; Lee, J.-S.; Touzi, R.; Boerner, W.-M. Applications of polarimetric SAR. J. Sens. 2015, 2015, 316391. [Google Scholar] [CrossRef]
- Lee, J.S.; Grunes, M.R.; Pottier, E.; Famil, L.F. Unsupervised terrain classification preserving polarimetric scattering characteristics. IEEE Trans. Geosci. Remote Sens. 2004, 42, 722–731. [Google Scholar]
- Priyanka, R.; Avtar, R.; Malik, R.; Musthafa, M.; Rathore, V.S.; Kumar, P.; Singh, G. Forest plantation species classification using Full-Pol-Time-Averaged SAR scattering powers. Remote Sens. Appl. Soc. Environ. 2023, 29, 100924. [Google Scholar] [CrossRef]
Disclaimer/Publisher’s Note: The statements, opinions and data contained in all publications are solely those of the individual author(s) and contributor(s) and not of MDPI and/or the editor(s). MDPI and/or the editor(s) disclaim responsibility for any injury to people or property resulting from any ideas, methods, instructions or products referred to in the content. |
© 2023 by the authors. Licensee MDPI, Basel, Switzerland. This article is an open access article distributed under the terms and conditions of the Creative Commons Attribution (CC BY) license (https://creativecommons.org/licenses/by/4.0/).