Article

A Reconstructed Method of Acoustic Logging Data and Its Application in Seismic Lithological Inversion for Uranium Reservoir

1
College of Geo-Exploration Science and Technology, Jilin University, Changchun 130026, China
2
Liaohe Oilfield Company, CNPC, Panjin 124010, China
3
Guangxi Bureau of Geology and Mineral Prospecting and Exploitation, Nanning 530023, China
4
Guangxi Zhuang Autonomous Region Geological Survey Institute, Nanning 530031, China
5
Daqing Geophysical Research Institute of BGP, CNPC, Daqing 163357, China
*
Author to whom correspondence should be addressed.
Remote Sens. 2023, 15(5), 1260; https://doi.org/10.3390/rs15051260
Submission received: 1 January 2023 / Revised: 17 February 2023 / Accepted: 22 February 2023 / Published: 24 February 2023
(This article belongs to the Special Issue Geophysical Data Processing in Remote Sensing Imagery)

Abstract

:
As a sedimentary mineral, most sandstone type uranium deposits are formed in petroliferous basins. Therefore, we can fully tap the residual economic value of historical logging and 3D seismic data measured for oil and gas to search for sandstone type uranium deposits. However, a large amount of acoustic logging data are missing in the target stratum of the uranium reservoir in that it is not the main stratum of oil and gas. A reconstructed method of acoustic logging data based on clustering analysis and with the low-frequency compensation of deterministic inversion is proposed to solve this problem. Secondly, we can use these logging data with seismic data to obtain the 3D inversion data volume representing the sand body of the uranium reservoir based on seismic lithological inversion. Then, we can also delimit the 3D spatial range of sandstone type uranium deposits in petroliferous basins based on the calibration of uranium anomaly and sub-body detection. Finally, a 3D field data example is given to test and analyze the effectiveness of the above research schemes.

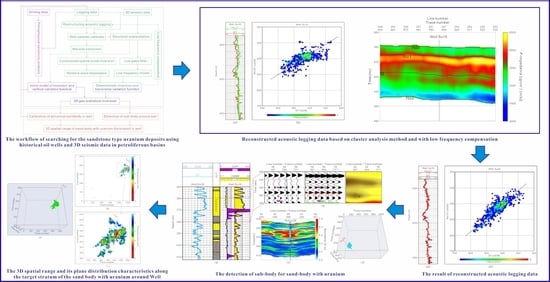
Graphical Abstract

1. Introduction

As a strategic clean resource exploited in in situ leaching at a low economic cost, sandstone type uranium deposits are of great significance to the utilization of nuclear energy in the world [1,2,3,4,5]. They exist in different regions of the world, and 89% of them are formed in petroliferous basins [6,7,8,9,10,11]. Usually, there is a large amount of historical logging and 3D seismic data in these areas. Therefore, it is of theoretical significance and economic benefit to use them to search for sandstone type uranium deposits. However, compared with coal, oil, and gas, the exploration and development of sandstone type uranium deposits started late. Historically, only a small amount of 3D seismic data are used to explore sandstone type uranium deposits [12,13,14,15]. In fact, there are some similarities in reservoir-forming models between sandstone type uranium deposits and oil and gas resources. Both of them are sedimentary type minerals and are mostly formed in sand bodies [16,17,18,19]. Therefore, the advanced reservoir characterization and prediction methods in the oil and gas field can be applied to the exploration and development of sandstone type uranium deposits.
However, the target stratum of sandstone type uranium deposits is usually not the main formation of oil and gas in the petroliferous basin. Therefore, we have to face a serious problem of missing acoustic logging data in the seismic lithological inversion of the uranium reservoir. We all know that acoustic logging data is the bridge to establishing an accurate time–depth relationship between the seismic data in the time domain and the logging data in the depth domain [20,21]. On the one hand, it is essential data for well seismic calibration. On the other hand, it is the most important prior information for seismic lithological inversion. It is also one of the most critical factors determining the success or failure of seismic lithological inversion for thin reservoirs. Fortunately, some reconstructed methods of acoustic logging data can solve this serious problem. At present, the reconstruction of acoustic logging data mainly includes methods based on the theoretical formula [22], cluster analysis [23], support vector machine [24], neural network [25], etc. Each of these methods has its own merits, but they have a common defect. The reconstructed acoustic logging data are all seriously missing the low-frequency component. Unfortunately, this low-frequency component in acoustic logging data is essential to seismic lithological inversion with the constraint of the well. At present, there are few methods to deal with this problem. Only Kriging interpolation is used to reconstruct the low-frequency components of acoustic logging data [26]. However, this method needs to use more wells with acoustic logging data as the constraint condition in the area around the target well.
Given the above problems, this paper innovatively adopts reverse thinking. We take the results of seismic impedance inversion as the low-frequency compensation for the reconstruction of acoustic logging data. A reconstructed method of acoustic logging data incorporating low-frequency compensation by constrained sparse pulse inversion is proposed in this paper.
After reconstructing adequate acoustic logging data for uranium reservoirs, we can comprehensively use historical logging and 3D seismic data to search for the sandstone type uranium deposits in petroliferous basins. However, there is little research on applying 3D seismic data to the fine description of uranium reservoirs. Moreover, in sandstone type uranium deposits, most research based on seismic reservoir inversion is only carried out in 2D space [20,21,27,28,29]. Recently, we have carried out some studies based on 3D seismic data [4,5,30,31]. However, these works are all carried out in the condition of sufficient logging data. As mentioned above, the target formation of sandstone type uranium deposits usually lacks acoustic logging data because the target formation is not the main stratum of the oil and gas reservoir. This is fatal to the exploration of sandstone type uranium deposits using historical 3D seismic data in petroliferous basins. To solve these problems, a method for fine delineation of sandstone type uranium deposits in petroliferous basins based on the 3D seismic lithological inversion of the uranium reservoir is proposed in this paper: Firstly, the problem of a large number of acoustic logging curves missing in the target formation of the uranium reservoir is solved by using a reconstructed method of acoustic logging data; Secondly, based on the petrophysical sensitivity analysis and 3D geostatistical inversion, the inversion data volume that can describe the 3D spatial distribution characteristics of the sand body in the uranium reservoir is obtained; Then, based on the calibration of uranium anomalies in the well and the detection of sub-body around the well, the 3D spatial range of sandstone type uranium deposits is delineated. Finally, we realized to search for sandstone type uranium deposits using historical logging and 3D seismic data in petroliferous basins.

2. Background and Methods

As shown in Figure 1, we expect to search for the sandstone type uranium deposits in a target area covered by historical 380 km2 3D seismic data and 26 oil wells. Firstly, four abnormal gamma wells (Wells su07, su21, su25, and su26 in Figure 1) are screened by analyzing the logging data of these 26 oil wells. We can determine some favorable areas of sandstone type uranium deposits based on them. Furthermore, after entering these locally favorable areas, it is necessary to fully use 3D seismic data to determine the 3D spatial range (the regions delineated by the red dotted line in Figure 1) of uranium anomalies found in these wells. Finally, we can assess the reserves of these areas and plan the direction of future exploration and development in petroliferous basins.
When we use historical logging and 3D seismic data to search for the sandstone type uranium deposits, the following problems need to be solved:
  • Many oil and gas wells lack acoustic logging data in the target stratum of the uranium reservoir in that they are not the main stratum of oil and gas (only 6 of the 26 wells have acoustic logging data in the study area).
  • What is the most significant feature of the sandstone with uranium in logging data, and how to screen out the most sensitive petrophysical parameters of the sand body with uranium?
  • What seismic inversion method can obtain high-resolution inversion data volume characterizing the 3D distribution characteristics of sandstone in a uranium reservoir?
  • How to delineate the 3D spatial range of sandstone type uranium deposits in high-resolution 3D seismic lithological inversion data volume of uranium reservoir?
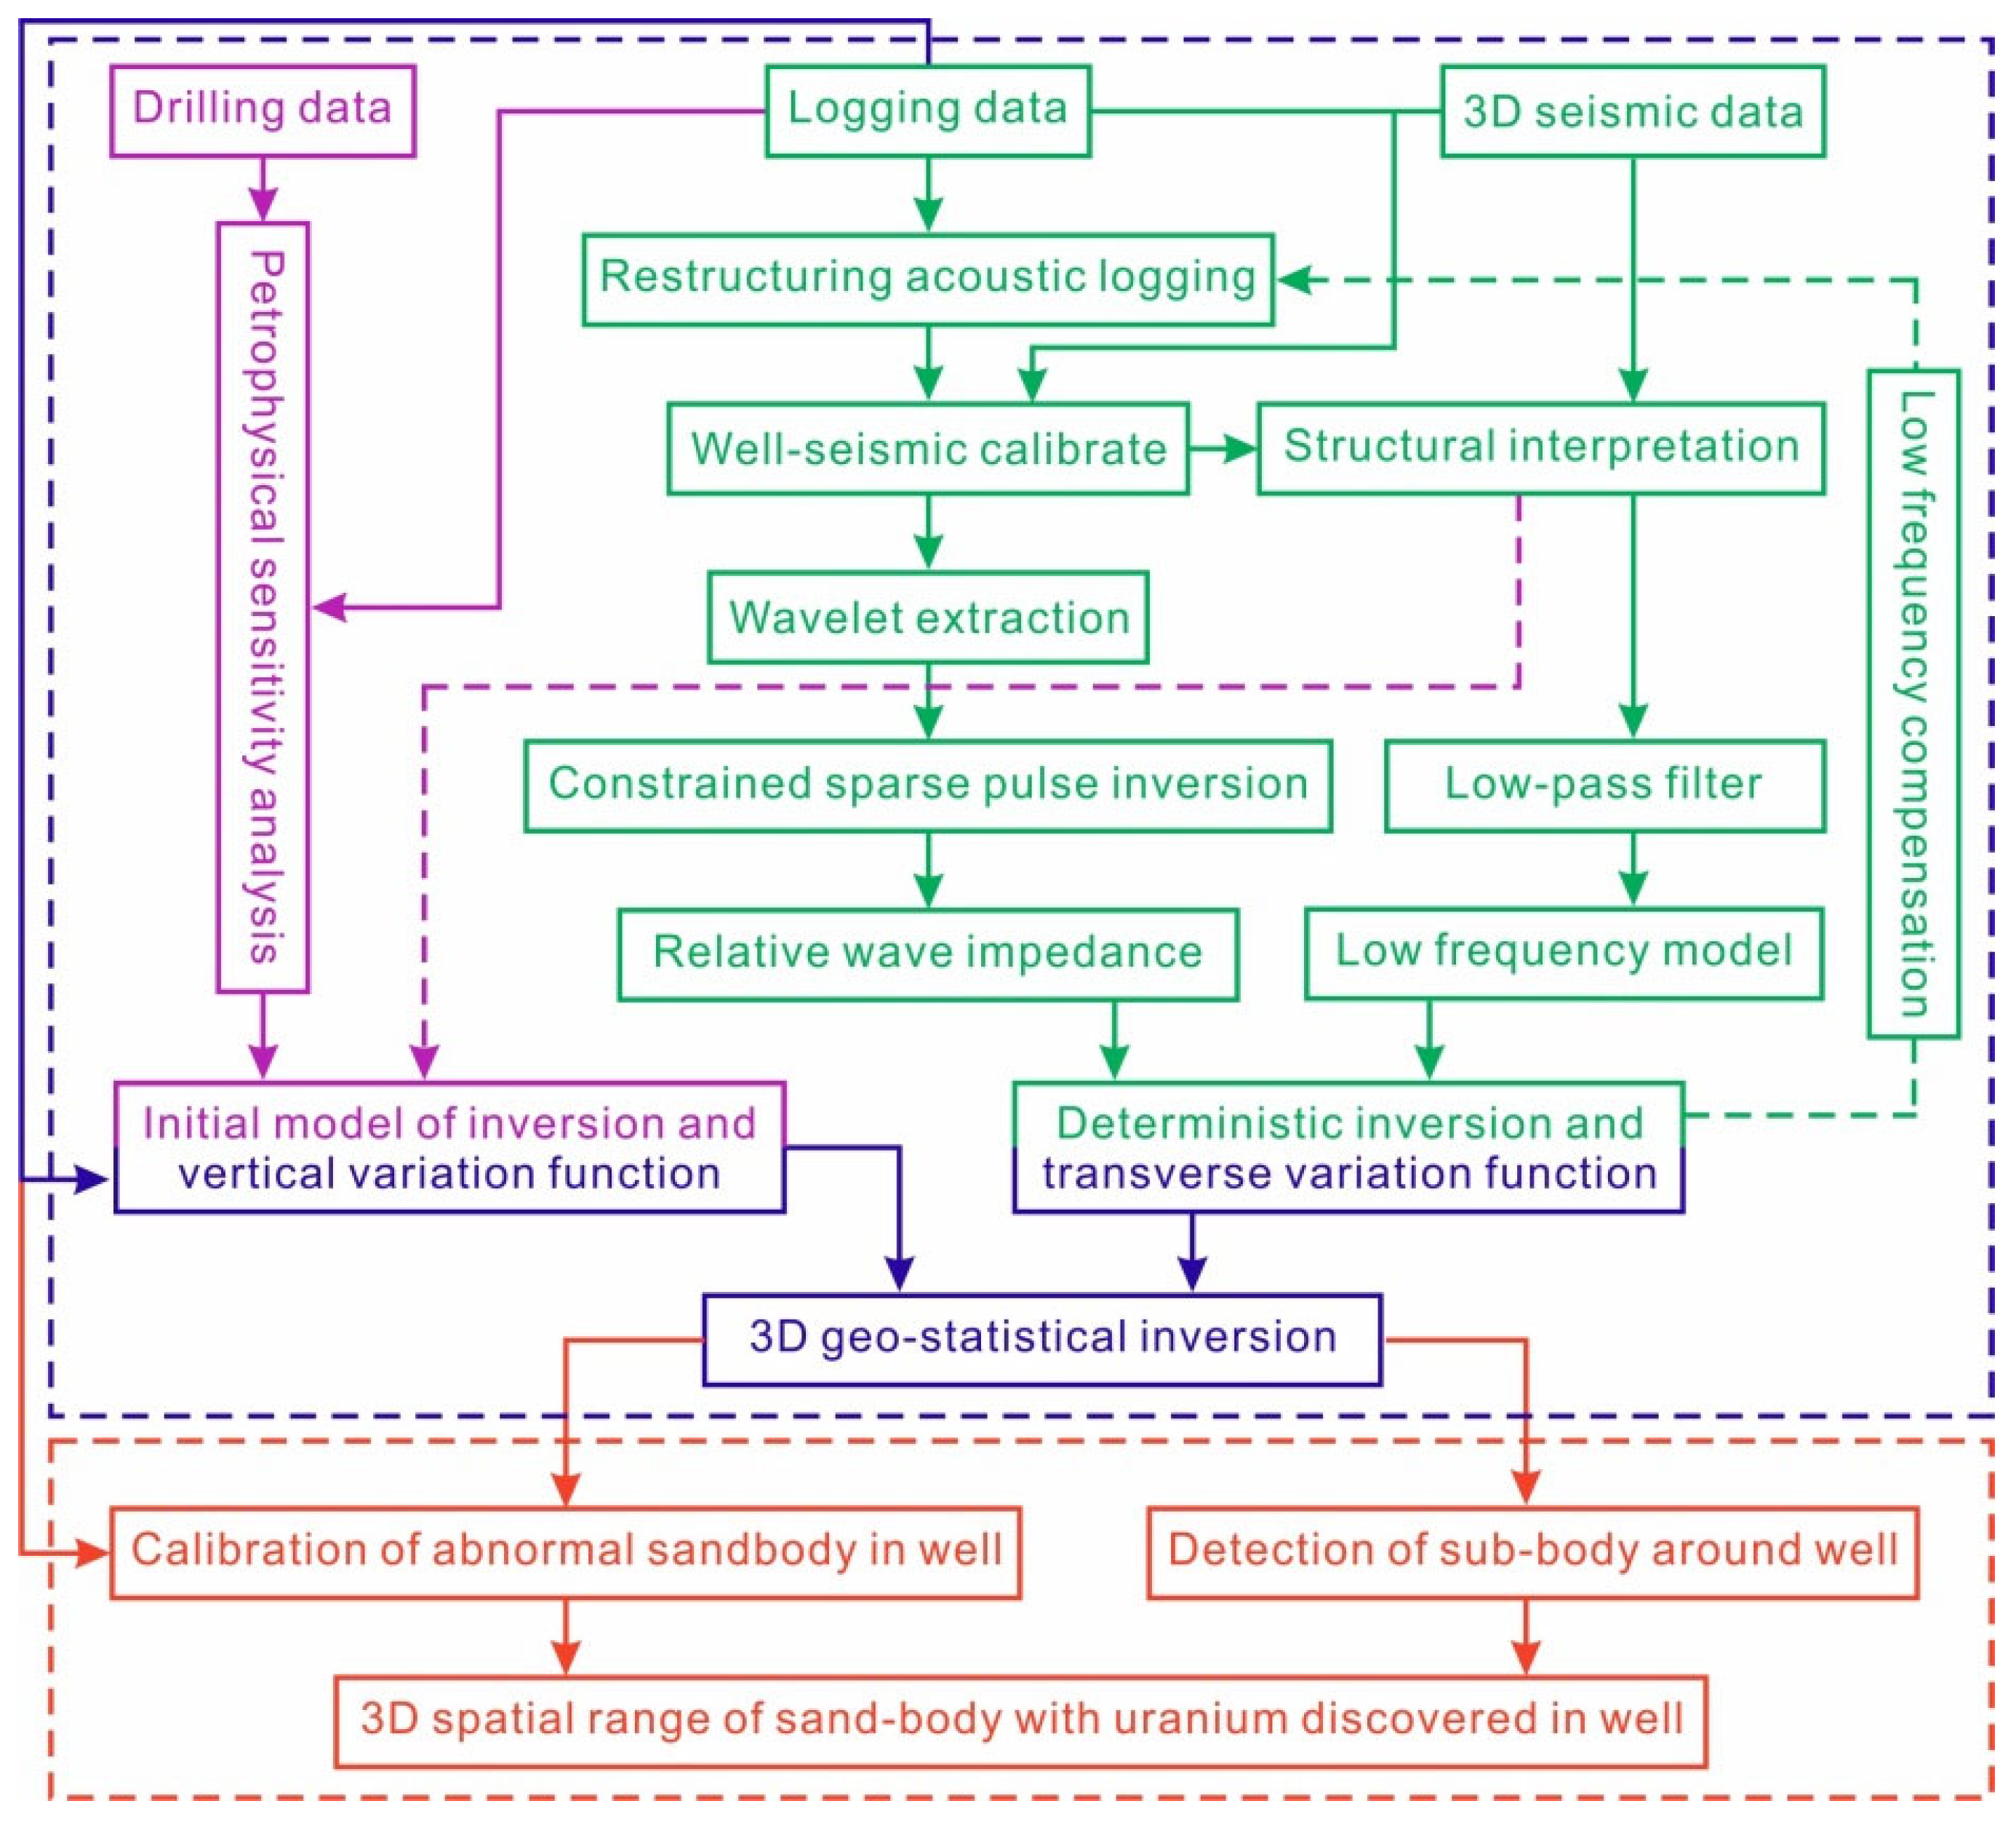
To solve the above four problems, we propose the workflow shown in Figure 2. This workflow mainly includes four essential techniques:
  • A reconstructed method of acoustic logging data with low-frequency compensation obtained by deterministic inversion (the part marked in green in Figure 2) is used for solving the problem of missing acoustic logging data of target formations in the study area.
  • A method of petrophysical sensitivity analysis (the part marked in purple in Figure 2) focuses on the screening of petrophysical sensitivity parameters for the seismic lithological inversion of the uranium reservoir.
  • A 3D geostatistical inversion method (the part marked in blue in Figure 2) which is adopted to solve the problem of high-resolution 3D seismic lithological inversion of the sand body in a uranium reservoir.
  • The calibrations of the uranium anomaly and the sub-body detection (the part marked in red in Figure 2) are used to delineate the 3D spatial range of sandstone type uranium deposits in 3D lithological inversion data volume.

3. Reconstructed Method of Acoustic Logging Data

Acoustic logging data is very important to establish the time-depth relationship between 3D seismic and logging data. It is also the necessary basic data for target layer tracing of 3D seismic data, seismic lithological inversion, and the calibration of the uranium anomaly in the target stratum of the uranium reservoir. We only have six wells with acoustic logging data in our study area. Therefore, we have to reconstruct them at those wells without acoustic logging data.

3.1. The Analysis of Correlation for Logging Data

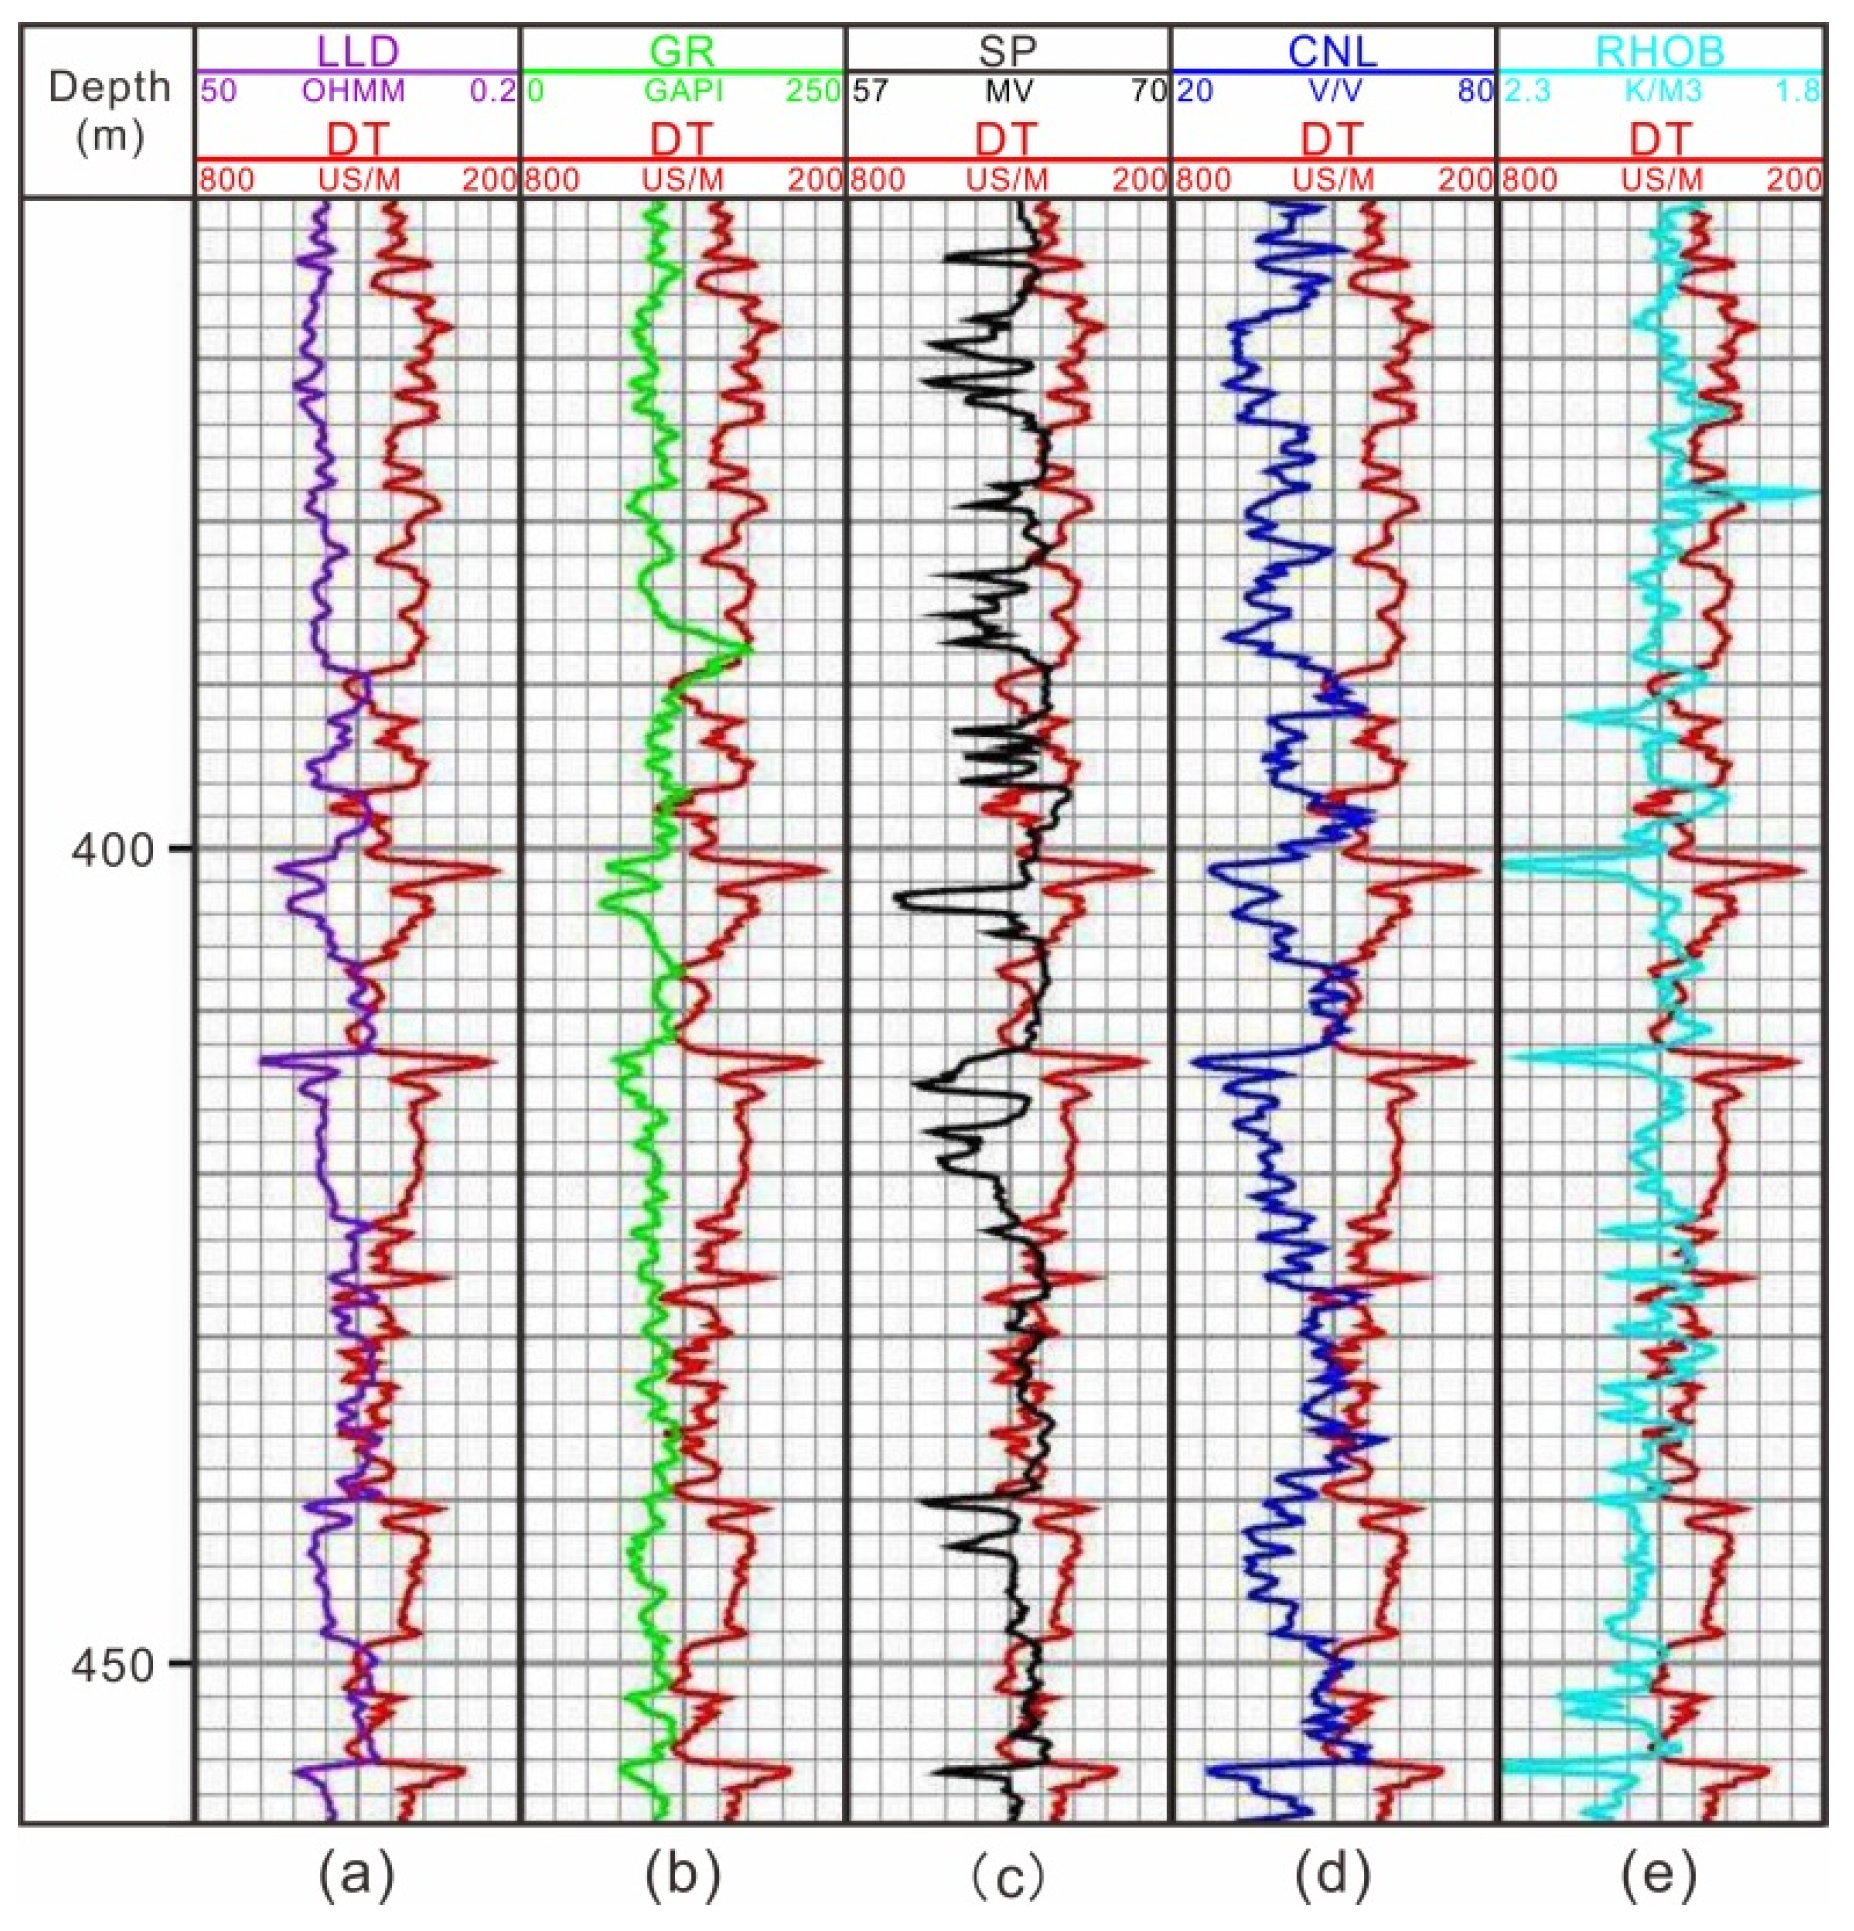
Before reconstructing missing acoustic logging data, we need to analyze the correlation between the existing data and other data. It is beneficial to screen out the logging data with the best correlation with acoustic logging data as the referenced data. As shown in Figure 3, we plotted the acoustic logging data together with resistivity (Figure 3a), gamma (Figure 3b), natural potential (Figure 3c), neutron (Figure 3d), and density (Figure 3e) logging data. Comparing their relationship, we found that the correlation between acoustic logging data and resistivity logging data (Figure 3a) was the highest. Fortunately, the resistivity logging data is generally the standard logging data. They are measured throughout the whole section of every oil and gas well. All 26 oil wells in our study area contain resistivity logging data. Therefore, the resistivity logging data was finally selected as the referenced data for reconstructing acoustic logging data.

3.2. Cluster Analysis Method

Because of the great influence of a well environment, an accurate petro-physical model is not easy to establish. Therefore, the reconstructed method based on petro-physical analysis is not applicable to our study area. The clustering analysis method based on data statistics is adopted to reconstruct acoustic logging data in this paper in order to solve this problem. The clustering analysis is a process of dividing a set of logging data into similar object classes. It is an unsupervised process that automatically divides data into meaningful classes according to similarity. It includes three elements: similarity measure, clustering criterion, and clustering algorithm. The similarity measure gives the similarity between two variables according to the similarity coefficient. The results in Figure 3 show that the similarity between acoustic logging data and resistivity logging data is the highest. The clustering criterion is a rule to end the clustering algorithm when the clustering quality meets the requirements during the clustering cycle. The clustering algorithm is a data analysis method used to realize clustering purposes. After considering previous research experience, the basic principle of the algorithm, and the experimental results in our study area, the multi-resolution image clustering (MRGC) method is adopted as the clustering analysis algorithm to build the predictive model in this paper.
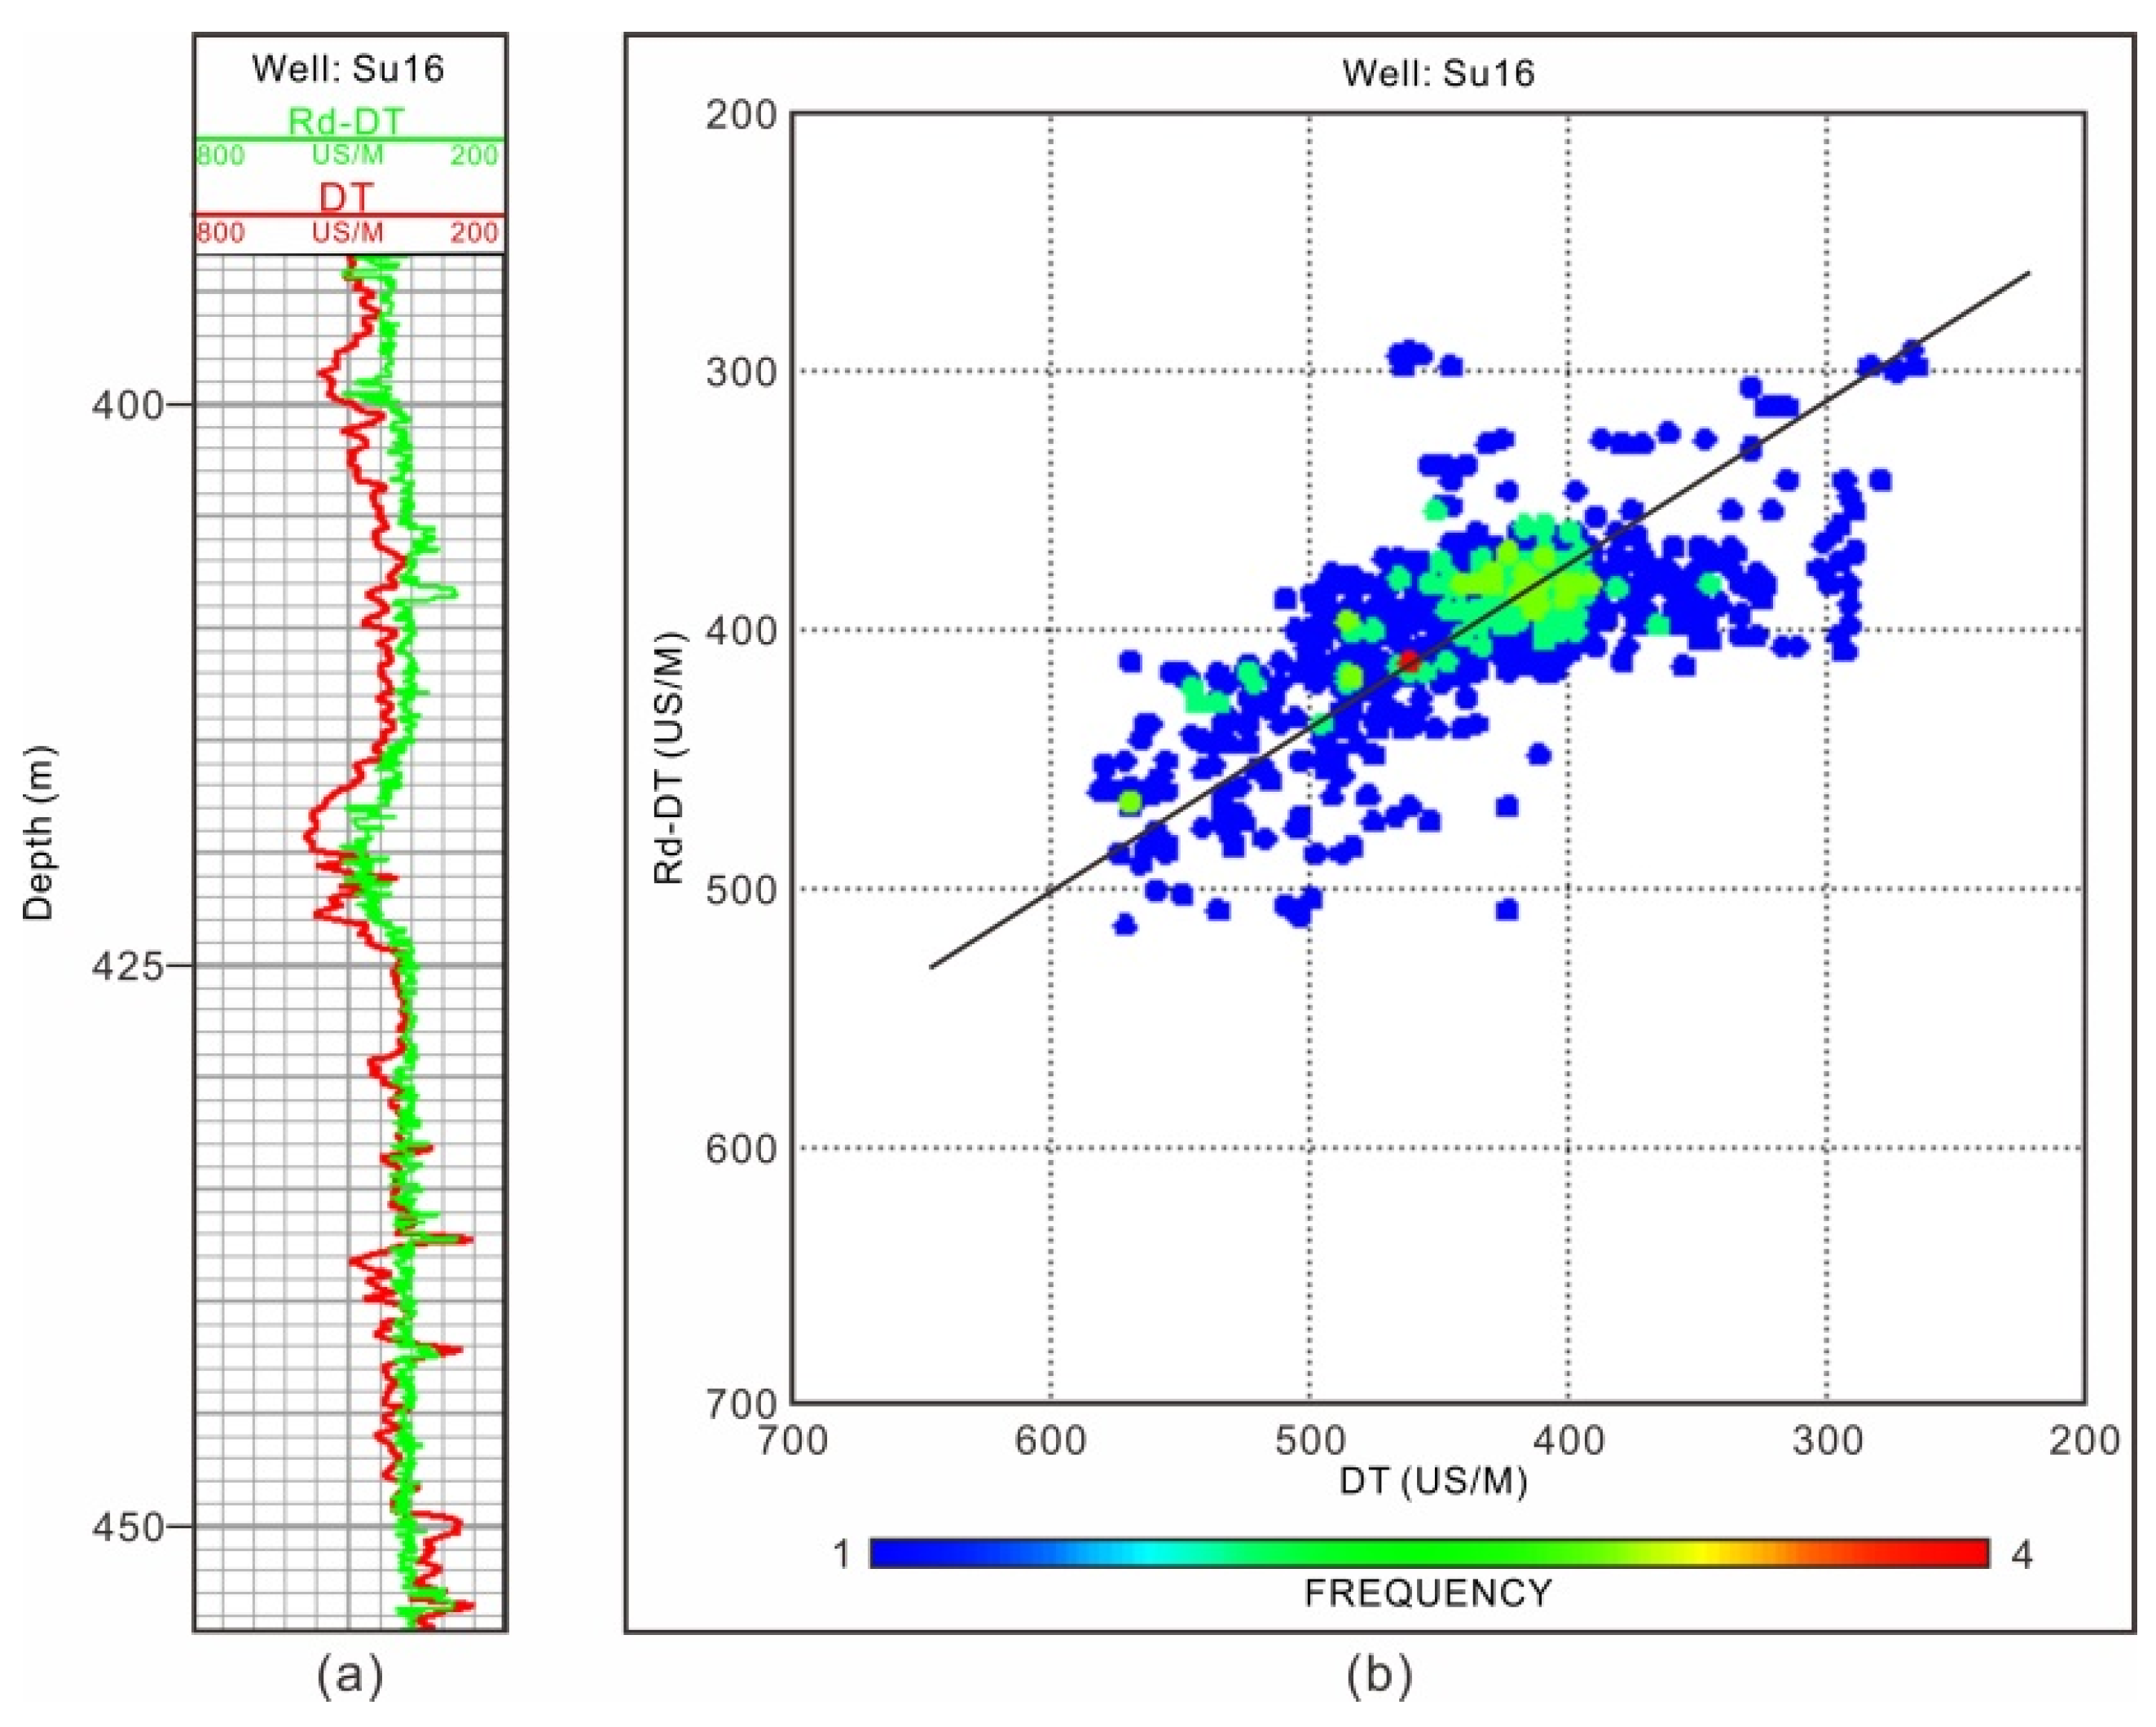
The result of the verification well (Well Su16) obtained by MRGC is shown in Figure 4. Here, the red curve is the measured logging data, and the green one is the data from MRGC (Figure 4a). Both have good consistency in the local shape of the logging curve. The result of numerical intersection analysis between measured and reconstructed logging data is also shown in Figure 4b, and they are also consistent in value. However, after careful analysis of the two curves in Figure 4a, it is obvious that the reconstructed acoustic logging data (green one in Figure 4a) is missing low-frequency components compared with the measured acoustic logging data. It leads to poor consistency between these two curves in the overall trend.

3.3. Low Frequency Compensation Using Deterministic Inversion

The lack of low-frequency components in the reconstructed acoustic logging data is caused by the fact that the resistivity data is more sensitive to local small-scale lithological changes. Therefore, its high-frequency information is relatively rich. Fortunately, the trend of this low-frequency component is included in seismic data. Therefore, a reconstructed method of acoustic logging data with low-frequency compensated by deterministic inversion is proposed in a reverse thinking way in this paper (the part marked with the green dotted line in Figure 2).

3.3.1. Deterministic Inversion

Deterministic inversion is based on seismic data. It is independent of the geological model and has a fast running speed. Its accuracy mainly depends on the original seismic data. It can well reflect the spatial characteristics of seismic data [32]. The impedance model obtained by it tends to the macroscopic distribution of geological bodies. It can well reflect the distribution of large sets of sand bodies. Furthermore, the macro low-frequency trend reflected by the results of deterministic inversion is in good agreement with the one reflected by acoustic logging data. Therefore, it can be used as the low-frequency compensation for reconstructing acoustic logging data. As shown in Figure 2, the basic steps of deterministic inversion include the following:
  • Well seismic calibration and structural interpretation.
  • Wavelet extraction.
  • Calculate the relative wave impedance by the constrained sparse pulse inversion.
  • Build the low-frequency model based on the spatial coordinate data of layer tracing for the target stratum interface through well seismic calibration, framework construction, attribute filling, and low-pass filtering.
  • Obtain the final results of deterministic inversion by trace merging of the results of steps 3 and 4.
It can be seen from the above steps that deterministic inversion is strictly faithful to seismic data. In general, the resolution of deterministic inversion makes it challenging to meet the requirements of fine description for the sand body of the uranium reservoir. To better ensure the implementation of seismic lithological inversion of the uranium reservoir under the control of macro geological significance, the result of the deterministic inversion can be used as the main basis for obtaining the lateral variation function of geostatistical inversion. In addition, although the resolution of deterministic inversion is limited, it can reflect the spatial macro distribution characteristics of large sand bodies in the target stratum. This macro low-frequency component is missing in the reconstructed acoustic logging data. Therefore, the results of deterministic inversion can be used as the low-frequency compensation for the reconstructed acoustic logging data.

3.3.2. Low Frequency Compensation

Both acoustic logging and seismic data use the acoustic physical field to measure the acoustic properties of the media in the earth’s interior. Then the impedance parameters of the formation are obtained by them. Hence, they can be connected through an impedance. The difference is that acoustic logging goes deep into the formation through logging equipment for local small-scale high-resolution logging. However, seismic data is generally a large-scale measurement of the earth’s surface. For the measurement carried out in the same stratum, they have good consistency in the low-frequency component representing the general change trend of lithology in this stratum. Therefore, the impedance parameter inversed from seismic data can be used to compensate for the missing low-frequency components of the reconstructed acoustic logging data. The steps are as follows:
  • Build the initial model through well seismic calibration and interpolation using the existing wells with acoustic logging data, framework construction using the results obtained by 3D seismic structural interpretation, and impedance filling.
  • Calculate the 3D impedance data volume in the time domain using deterministic inversion.
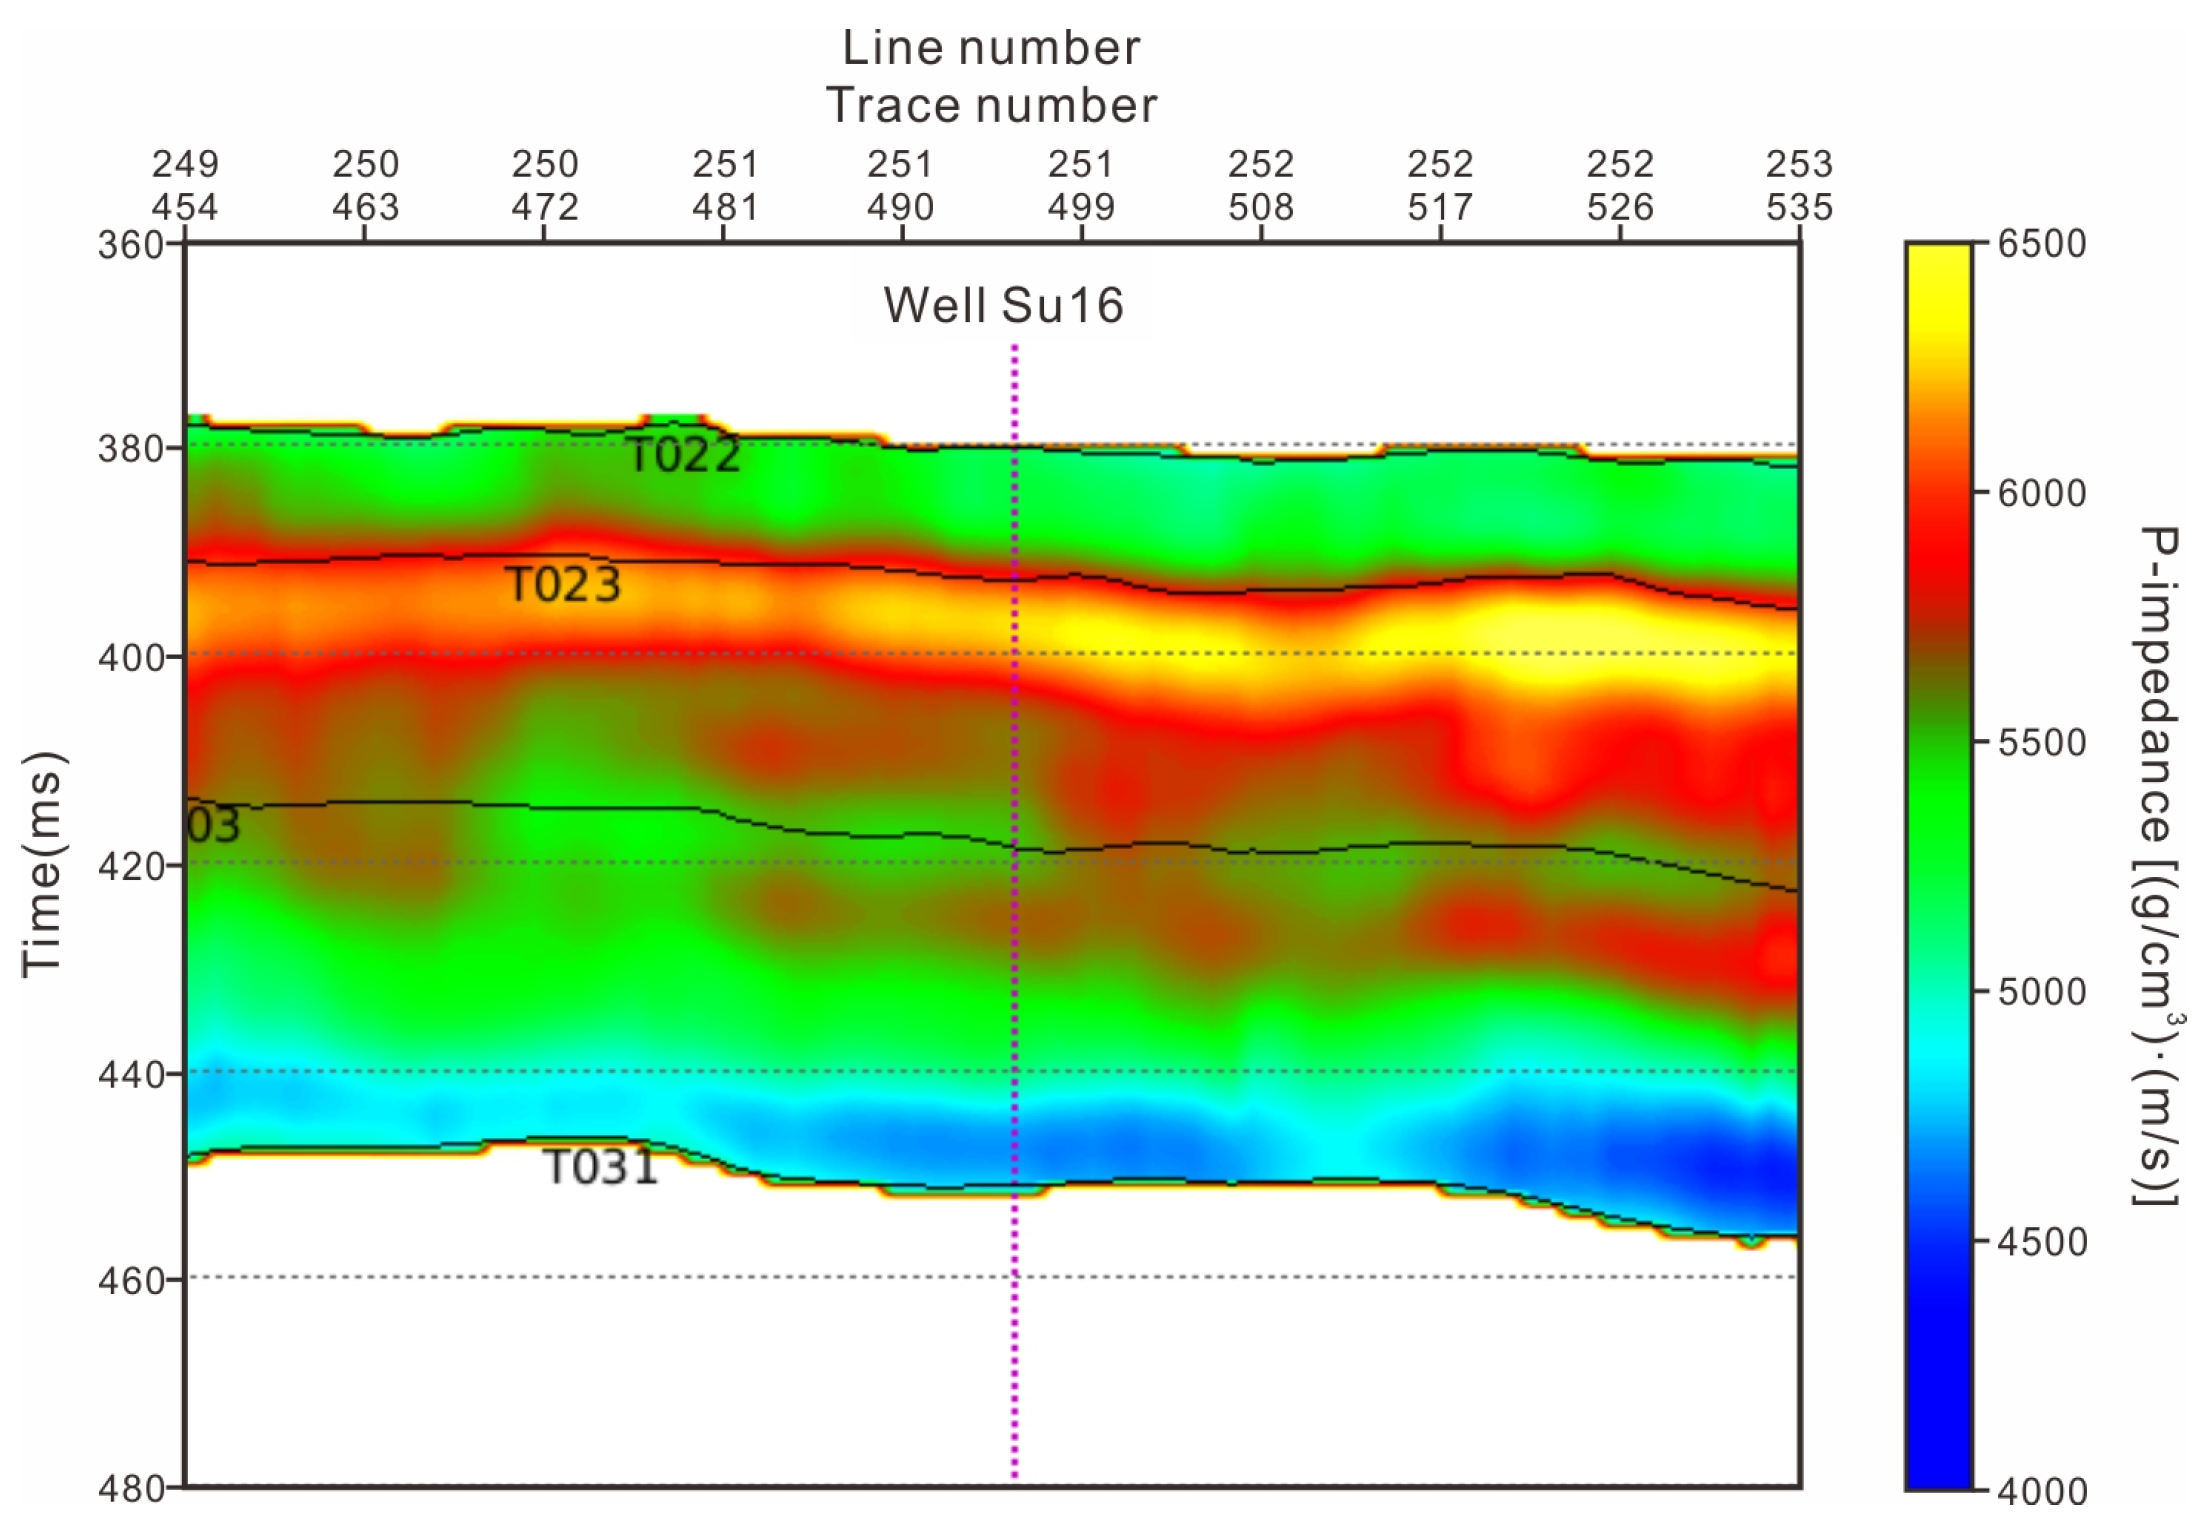
  • Extract the impedance curve at the location of the well requiring low-frequency compensation (the purple dotted line in Figure 5), calculate the velocity through this impedance divided by density, and then reverse-calculate the low-frequency acoustic curve by taking the reciprocal of velocity.
  • Obtain the final reconstructed acoustic logging data by trend combining the reconstructed acoustic logging data acquired by cluster analysis with the result of step 3.
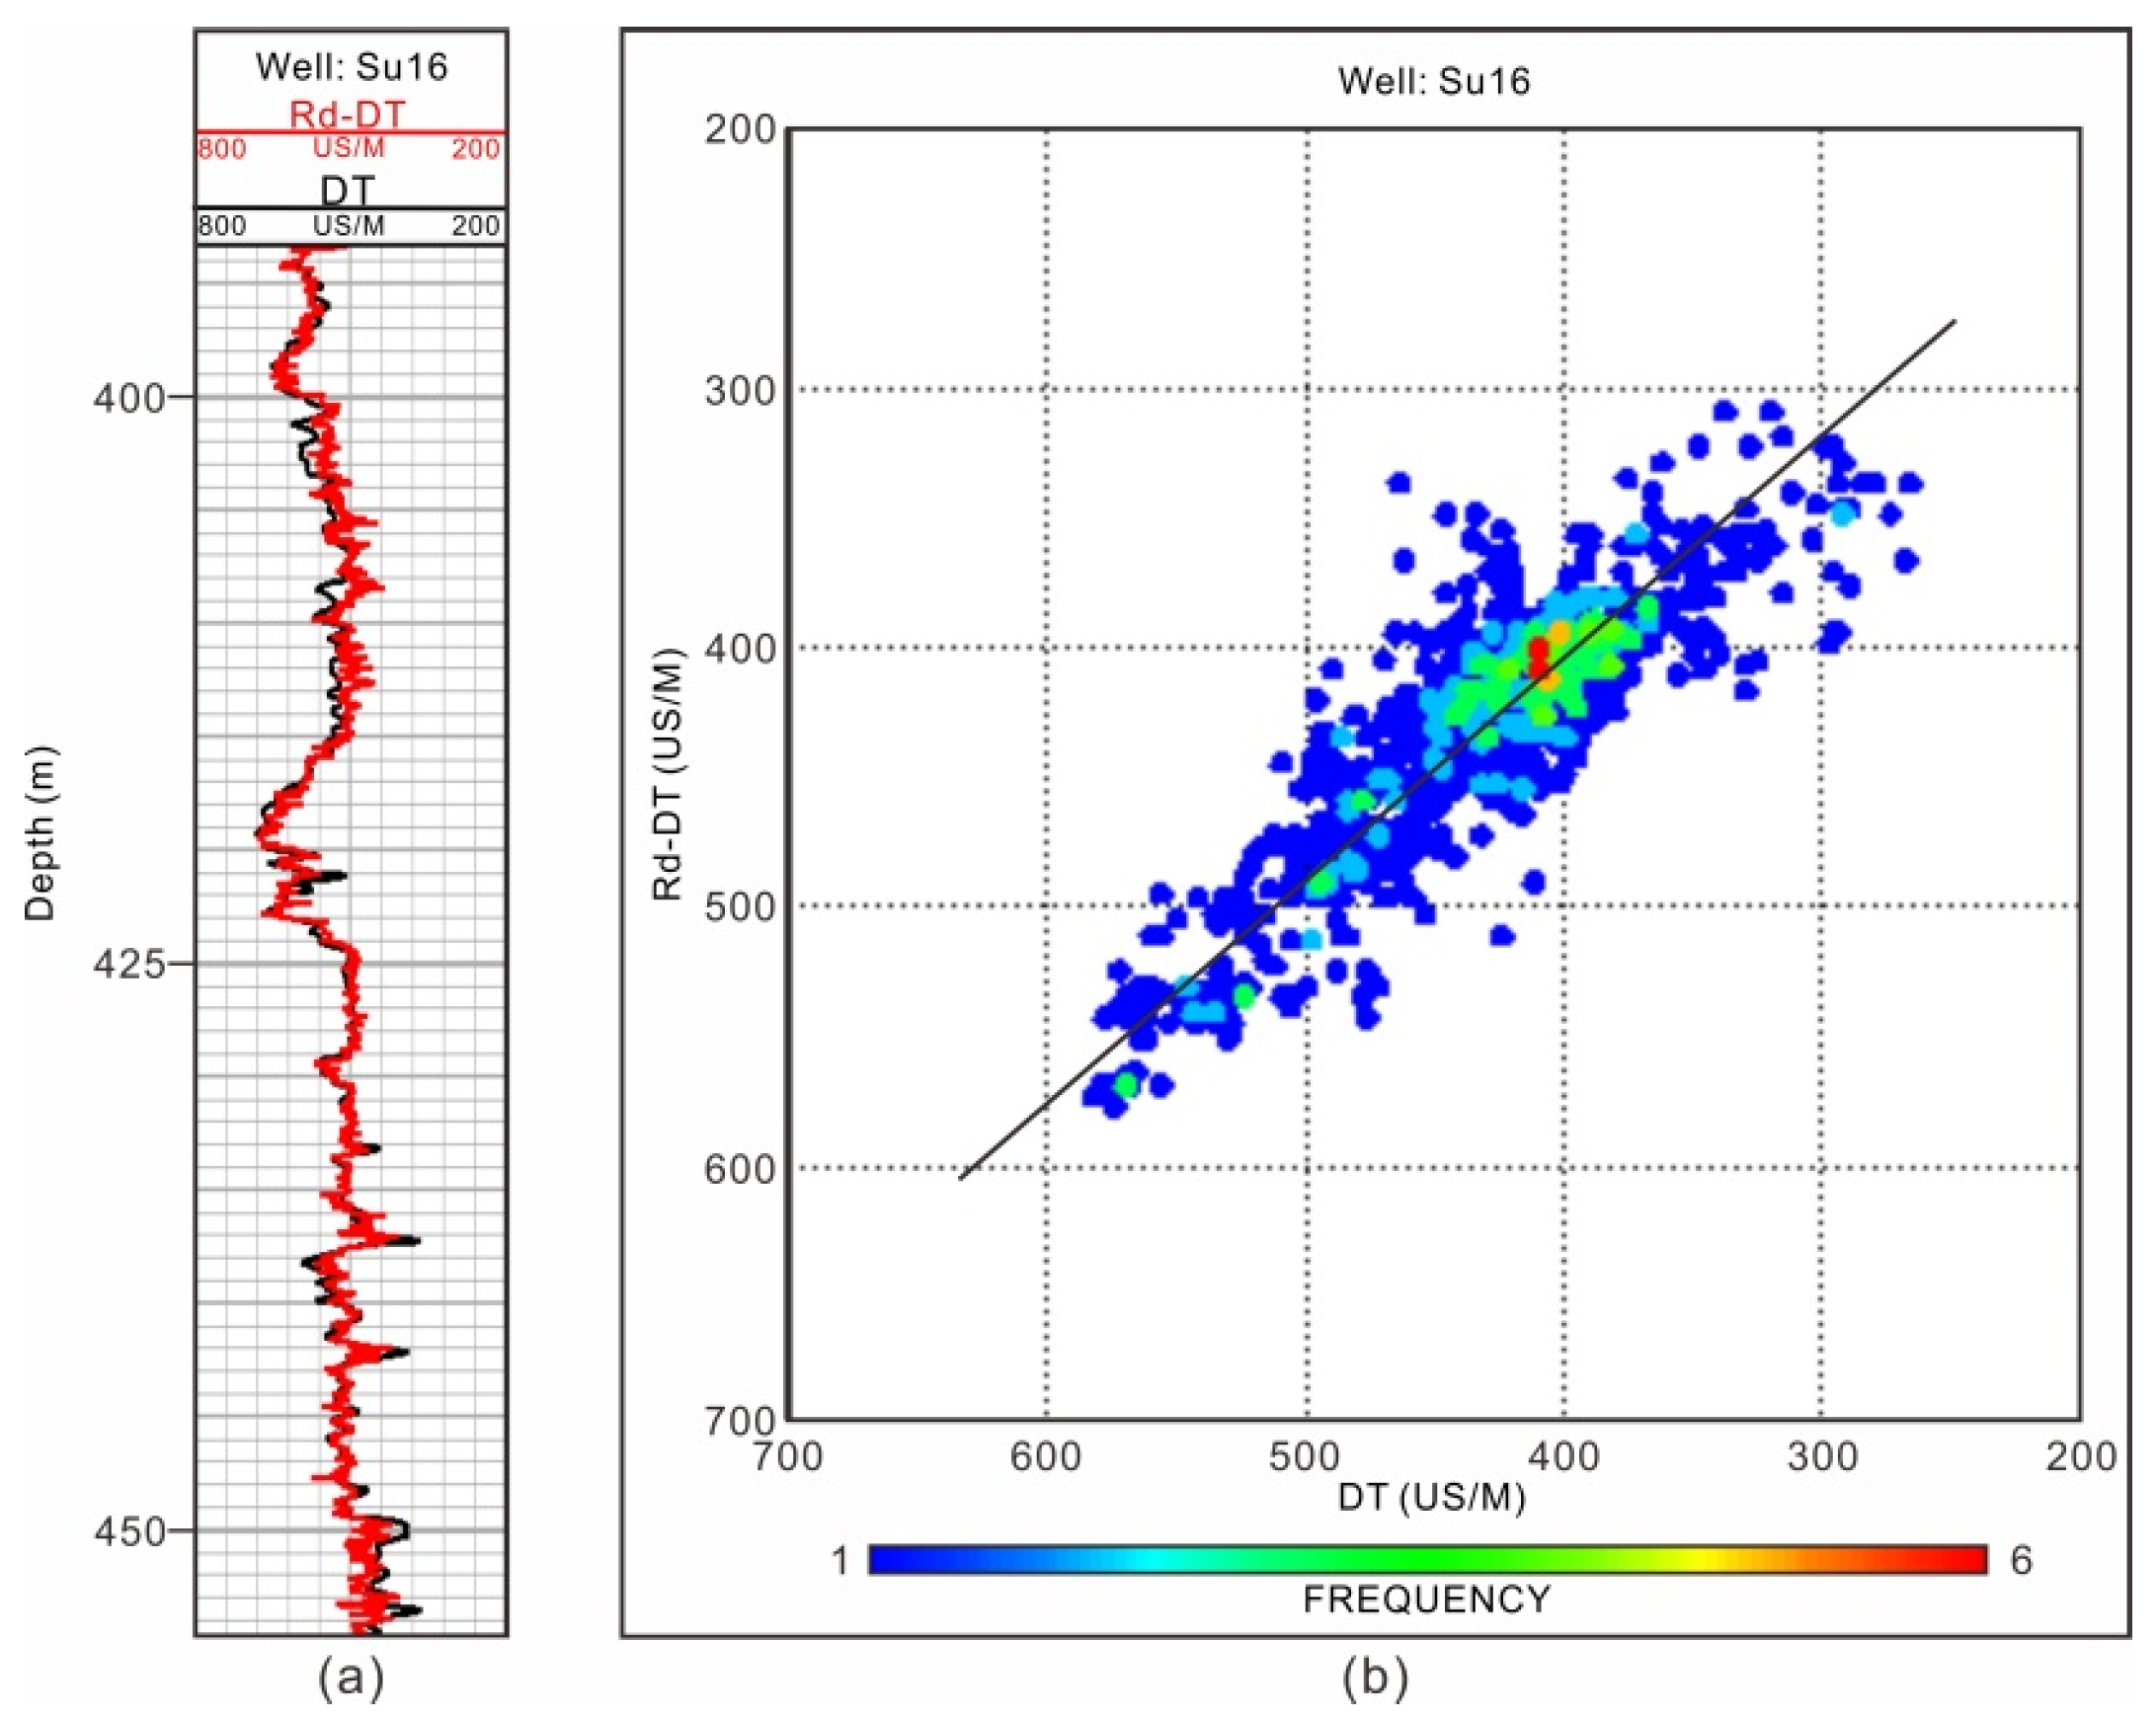
The reconstructed result with low-frequency compensation of acoustic logging data for the verification well (Well Su16) is shown in Figure 6. Here, the black curve is the measured logging curve, and the red one is the reconstructed curve (Figure 6a). Comparing Figure 6a and Figure 4a, it can be seen that the reconstructed acoustic logging curve with low-frequency compensation has better consistency with the measured data in the curve shape. At the same time, comparing Figure 6b and Figure 4b, it can be seen that the reconstructed acoustic logging data with low-frequency compensation is better in numerical consistency than the measured one. In summary, the reconstructed method of acoustic logging data with low-frequency compensation can reconstruct the high-frequency components through clustering analysis and obtain the low-frequency components through the compensation of deterministic inversion to obtain the best-reconstructed effect.

4. Seismic Lithological Inversion of Uranium Reservoir

In order to meet the requirements of resolution, the method of lithological inversion for a uranium reservoir, with seismic data as a horizontal constraint, logging data as a vertical constraint, and 3D geostatistical inversion as the key algorithm, is adopted in this paper. The two key parts of this method are the petrophysical sensitivity analysis for selecting lithological sensitivity parameters of the uranium reservoir and the 3D geostatistical inversion method.

4.1. Petro-Physical Sensitivity Analysis

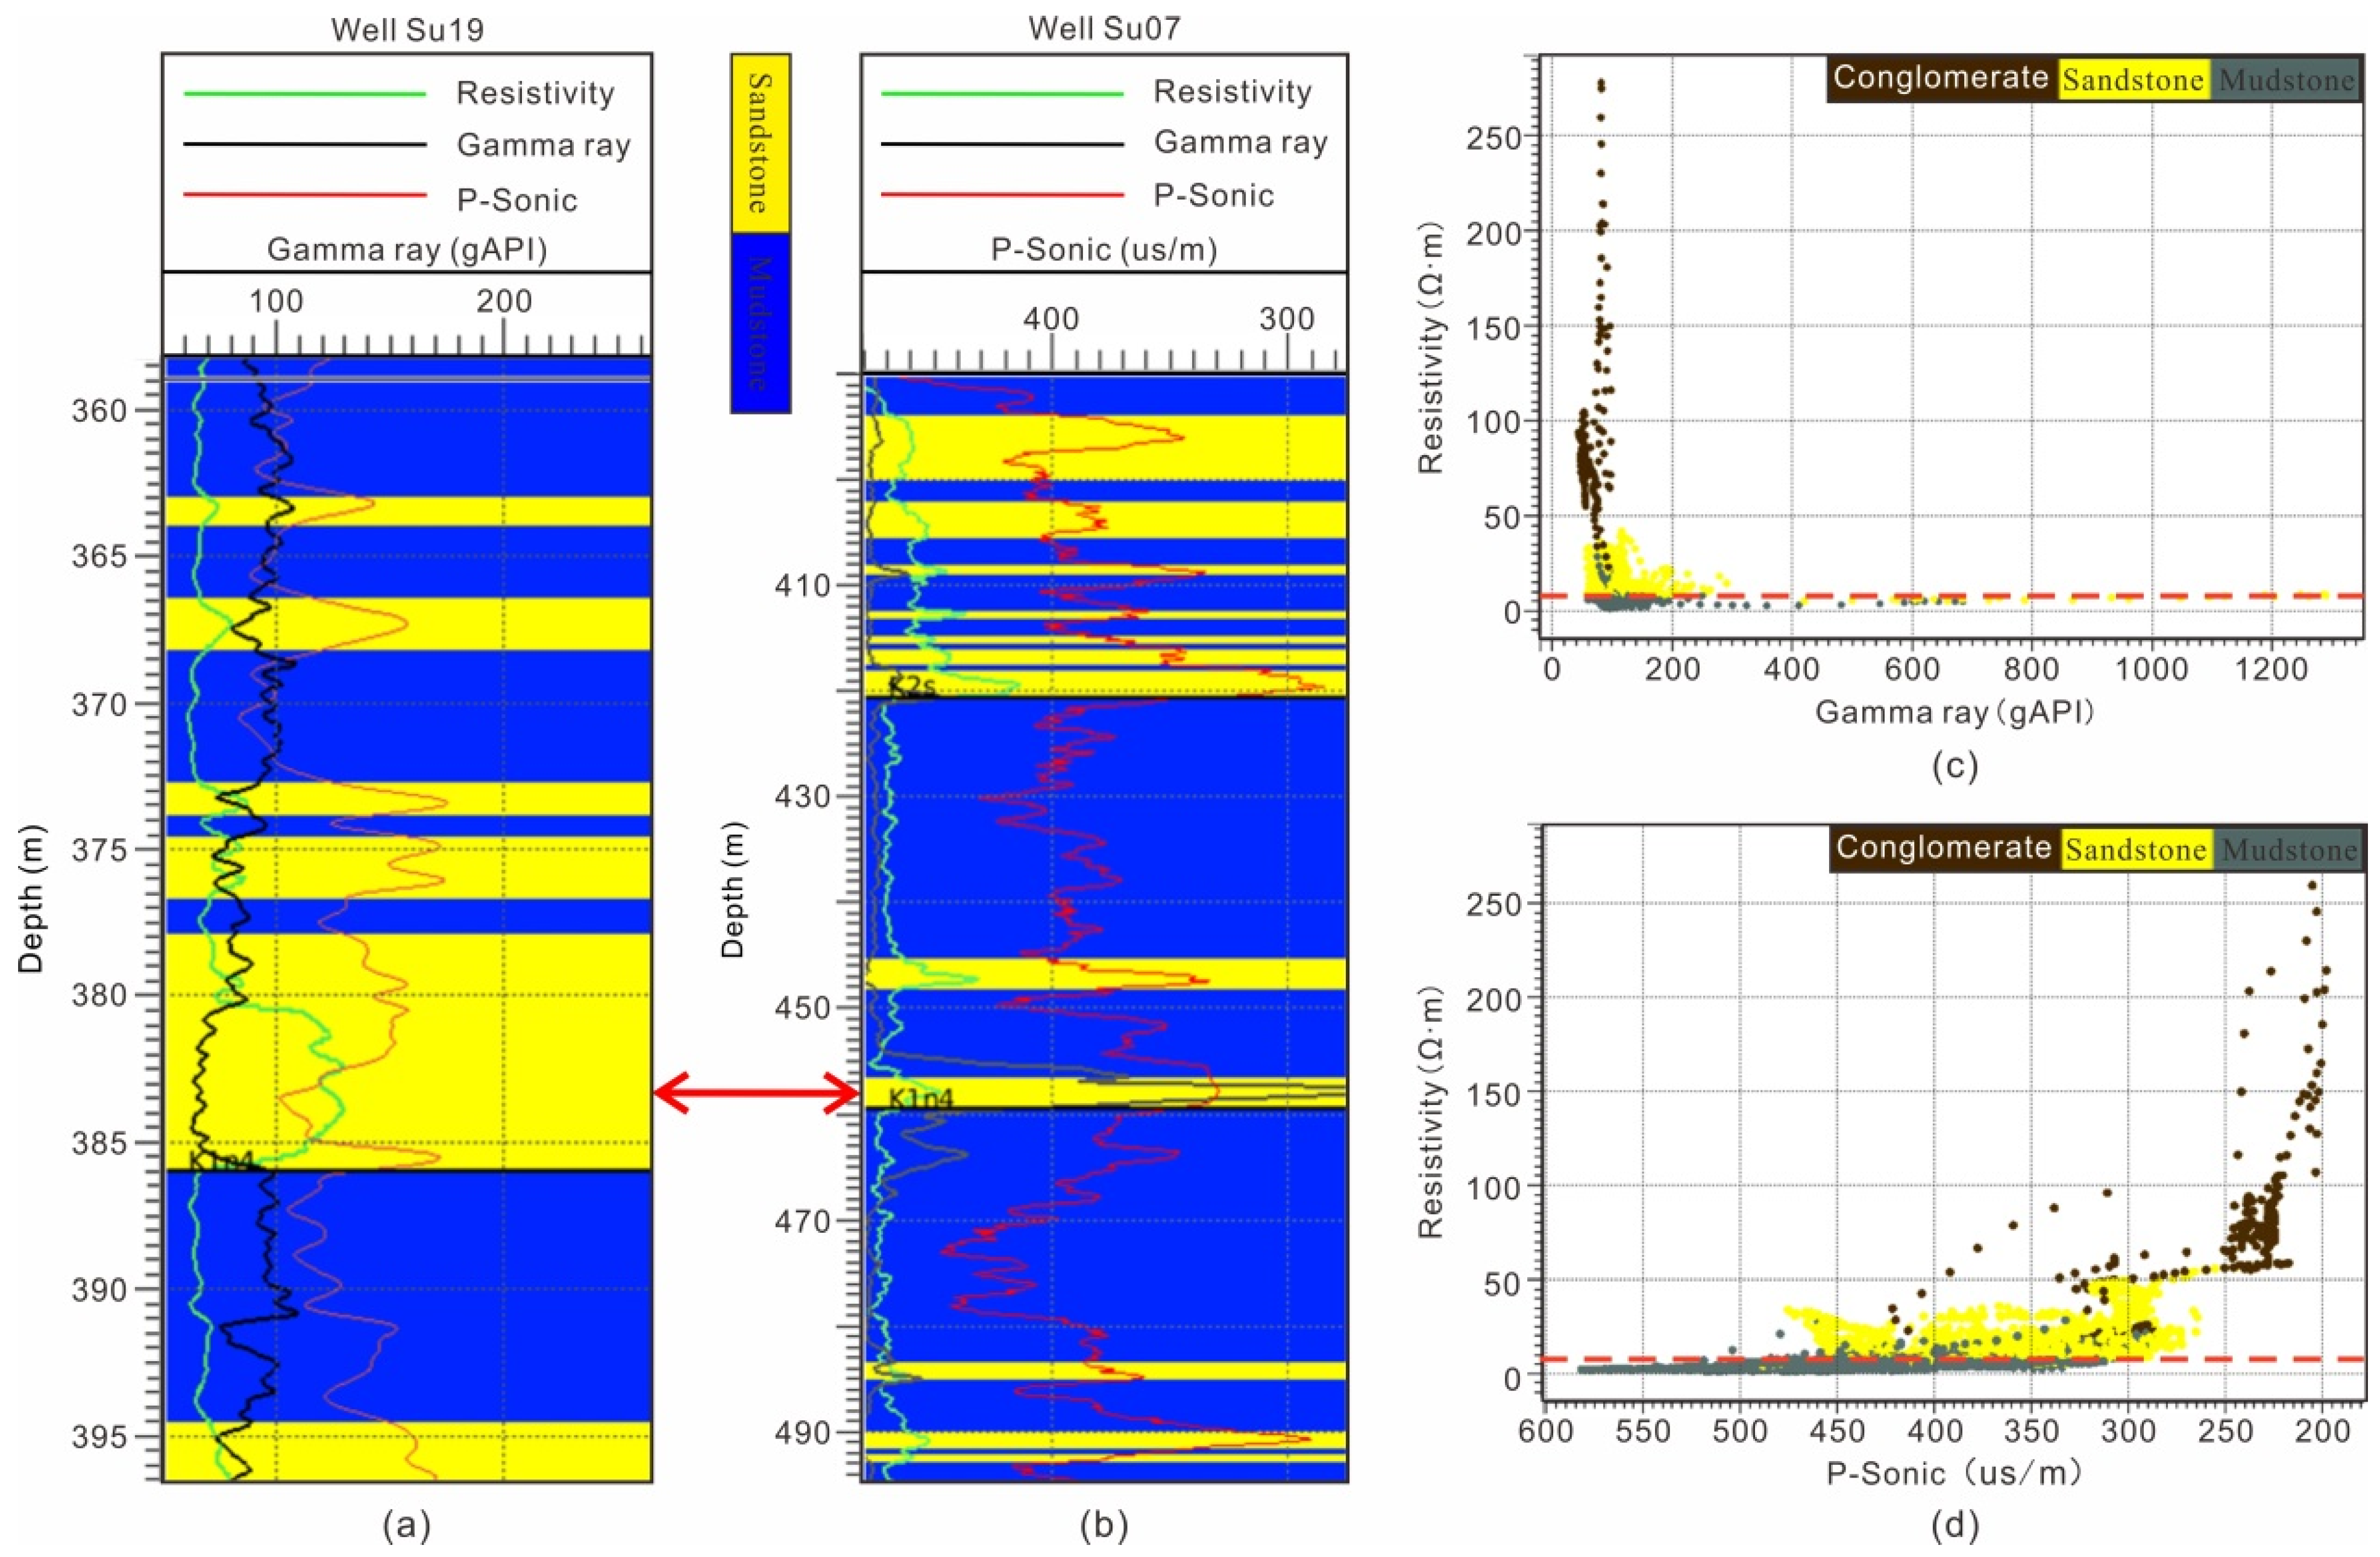
The key objective of petrophysical sensitivity analysis is to select the logging parameters most sensitive to the sandstone of the uranium reservoir in the target stratum. The basic data include drilling and logging data. Its key content includes qualitative and quantitative analysis. Qualitative analysis is to superimpose the logging curve on the lithological curve and analyze the corresponding relationship between them [33,34]. The result of quantitative analysis is obtained by cross-analysis of logging data and lithological data. As shown in Figure 7a,b, based on qualitative analysis, we can draw the following conclusions: (1) The sandstone with uranium is characterized by high resistivity, high gamma, and high P-sonic on the logging curve, while sandstone without uranium is characterized by high resistivity, low gamma, and high P-sonic; (2) The gamma curve (brown one in Figure 7a,b) is not sensitive to sandstone. The lithology of some sections in the well with high gamma are sandstone, while others are mudstone; (3) The acoustic curve (the red one in Figure 7a,b) has moderate sensitivity to sandstone; however, the resolution is not high; (4) The resistivity curve (green curve in Figure 7a,b) is most sensitive to sandstone. As long as it hits on sandstone, it will quickly jump to the high-value area. When it leaves sandstone, it will quickly fall back to the low-value area.
As shown in Figure 7c,d, based on quantitative analysis, we can draw the following conclusions: (1) The gamma logging data cannot distinguish lithology in the well, and different lithology are mixed in each value range; (2) The P-sonic logging data has moderate ability to distinguish lithology, the sandstone can only be distinguished in a very high value of P-sonic logging data, and the distinguishing ability is limited; (3) The resistivity logging data has the best ability to distinguish lithology. As long as the resistivity value is higher than 5.0 ohm·m, the lithology is mostly sandstone. When the value of resistivity is higher than 7.5 ohm·m, the lithology is all sandstone.
In conclusion, both qualitative and quantitative petrophysical sensitivity analyses show that resistivity logging data has the best distinguishing ability to the lithology of sandstone for the uranium reservoir in our study area. Therefore, the logging parameter of resistivity is selected as the target parameter of seismic lithological inversion for the uranium reservoir.

4.2. 3D Geostatistical Inversion

A 3D geostatistical inversion is performed to obtain 3D data volume reflected by the lithological attributes of the reservoir, based on a random simulation in the process of seismic inversion, and then to realize the prediction of the reservoir. The geostatistical inversion for the parameter estimation of the reservoir can be reduced to a Bayesian parameter estimation problem [35,36,37]. That is, the conditional optimal solution of the reservoir parameter is obtained by continuously updating the prior information based on some measured information. It can be given by the following formula:
P p o s t ( R ) P d a t a [ d f ( R ) ] P p r i o r ( R )
Here P p o s t ( . ) is the density function of the posterior probability. R is the target parameter of inversion, and it is obtained through petrophysical sensitivity analysis. The petrophysical sensitivity parameter characterizing the sandstone of the uranium reservoir in our study area is resistivity. P d a t a ( . ) is the likelihood function, and it is used to describe the similarity between the measured seismic data and the simulated synthetic data. d is the seismic data, and it is the basic data of inversion. Its signal-to-noise ratio and resolution directly determine the effectiveness and resolution of seismic lithological inversion of the uranium reservoir. f ( R ) is the operator of forward modeling, and it is used to calculate synthetic seismic data. P p r i o r ( . ) is the density function of prior probability and it is generally obtained from the prior information (such as existing logging data, macroscopic geological data, etc.) in the study area.
Under the framework of Bayesian inference, the geostatistical inversion described in Formula (1) can be concretely transformed into the inversion of reservoir parameters based on seismic data under the constraint of logging data [35,36,37], and its formula is:
P p o s t ( R | L d ) = P p r i o r ( R | L ) P ( d | R ) P ( d )
Here, L is the logging data, and the other parameters are the same as Formula (1). Formula (2) expresses that the posterior probability of reservoir parameters R in the condition of both logging data and seismic data are satisfied. This can be expressed as the product of the conditional probability P ( R | L ) of known logging information and the likelihood function P ( d | R ) / P ( d ) of seismic data d .
As shown in Figure 2, in the process of geostatistical inversion (the part delineated by the blue rectangle in Figure 2), there are four key contents: (1) The petrophysical sensitivity analysis can obtain the most sensitive logging parameter for the sandstone of the uranium reservoir, which will be regarded as the target parameter of inversion, such as the resistivity of the study area in this paper. The key objective of inversion is to obtain the 3D inversion data volume of the sensitive parameter for the target stratum; (2) The initial inversion model is constructed by extensive use of the sensitivity parameter of constraint wells, 3D seismic data, and the result of structural interpretation. This initial model can establish the statistical relationship between the lithological sensitivity parameter of the uranium reservoir and the seismic data; (3) Statistical analysis of logging data and the calculation of the vertical variation function: it is obtained by statistical analysis of logging data as prior information in formula (1). It is one of the most important parameters of inversion, which is used to control the consistency between the inversion results and the characteristics of prior reservoir parameters in the well; (4) Deterministic inversion and calculation of lateral variation function: seismic data are involved in geostatistical inversion through the likelihood function. The likelihood function is equivalent to the objective function of a conventional deterministic inversion (the green label in Figure 2), namely, P ( d | R ) / P ( d ) in Formula (2). The objective of deterministic inversion is to minimize the residual between the measured seismic data and the synthetic seismic data. Because deterministic inversion is most loyal to seismic data, it generally plays the role of a lateral constraint in the process of inversion. This lateral constraint is embodied in the lateral variation function of geostatistical inversion, and it is obtained by statistical analysis of the results of the deterministic inversion.
The 3D geostatistical inversion method using the workflow shown in Figure 2 as the method of seismic lithological inversion for a uranium reservoir has the following advantages: (1) Based on the analysis of petrophysical sensitivity, the method can select the logging parameters that are most sensitive to the sandstone of the uranium reservoir as the target parameters for inversion, making the lithological inversion more targeted, and then obtaining a higher resolution inversion data volume; (2) Logging data is involved in the process of inversion in the form of the vertical variation function, which can ensure that the inversion is carried out under the control of prior information, thus ensuring the vertical reliability of inversion; (3) A progressive inversion model from deterministic impedance inversion to geostatistical lithological sensitivity parameter inversion is adopted, which can ensure that the process of inversion is most faithful to seismic data and geological laws; (4) The geostatistical inversion method, which comprehensively uses the sensitivity analysis of the petrophysical, the vertical constraint of logging data, and the lateral constraint of deterministic inversion, has high resolution and is suitable for fine characterization of sand bodies in the uranium reservoir.

5. Detection of Sub-Body for Sand-Body with Uranium

After acquiring the 3D inversion data volume representing the spatial distribution characteristics of sandstone in the uranium reservoir, the spatial range of sandstone type uranium deposits can be delineated based on this 3D data volume through the calibration of uranium anomalies in wells and the detection of the sub-body around wells.
As shown in Figure 8a, the abnormal sand body with uranium in the well is delineated by comprehensive use of lithology, resistivity, and gamma logging data. It is characterized by lithology of sandstone, high gamma, and high resistivity (the section of the well is delineated by two red dotted lines in Figure 8a). However, the delineation is carried out only in the depth domain of the well. If we want to use the 3D inversion data volume to delineate the 3D spatial range around the well, it must be calibrated in the time domain of 3D inversion data volume. The inversion data volume and seismic data are the same in the time domain. Therefore, the seismic data can be used as a bridge to calibrate the abnormal sand body with uranium in the 3D inversion data body. The steps are as follows:
  • Calibrate the location and range of the sand bodies with uranium in the depth domain of the well by lithology, resistivity, and gamma logging data (Figure 8a).
  • Extract the acoustic curve of the section with abnormal uranium in the well and determine the location of abnormal points in the well corresponding to the time domain of seismic data according to the location calibrated by synthetic records (Figure 8b).
  • Determine the location of the anomaly section in 3D inversion data volume according to the consistency of seismic data and inversion data in the time domain (Figure 8c).
  • Based on the above steps, the calibration of the abnormal sand body with uranium in 3D inversion data volume is completed.
After the spatial range of sand bodies with uranium in the well is calibrated in the 3D inversion data volume, its 3D spatial range around the well can be delineated by using the detection of the sub-body. It is a method to delineate the local data volume range that meets a certain threshold condition at a specific location in the entire 3D inversion data volume. Its steps are as follows:
  • Determine the threshold range of the sand body with uranium by analyzing the change range of 3D inversion data volume, lithology in the well, and resistivity values of logging data within the time window of the target interval of the 3D inversion data volume calibrated at the well’s point (Figure 8c).
  • Delineate the spatial range of sampling points in the 3D inversion data volume meeting the above threshold within the calibrated time window (Figure 8d).
  • If the range of step 2 has a clear boundary, it is extracted as the final result (Figure 8d).
  • If the range has good horizontal continuity and no obvious boundary, the 3D spatial range of a single sand body with uranium (Figure 8d) can be determined according to the pinch out (Figure 8c) of the inversion profile along the layer thickness change in all directions, the value of uranium anomaly in the well, and the empirical understanding of the mineralization law.
To sum up, the comprehensive application of calibration and detection of the sub-body can determine the 3D spatial range around the well of the sand body with uranium in the well.

5.1. 3D Field Dataset Example

Data and Geological Background

To verify and analyze the feasibility and effect of the above methods, a 3D field data example is given. The study area is located in Songliao Basin in northeast China. It is a prospective area for the exploration of oil and gas in the Daqing Oilfield. The area of the whole region covered by 3D seismic data is 380 km2. There are 26 oil and gas wells in the area (Figure 1). Among them, obvious uranium anomalies were found in four wells. Only six wells have acoustic logging data. The geological survey of this area shows that the uranium anomaly is mainly located near an unconformity at the bottom of the Sifangtai Formation. The drilling data analysis shows that the sedimentary environment of the Sifangtai Formation in this study area during the geological period is river delta sedimentary facies. The lithology is mainly composed of brownish-red mudstone, sandy mudstone, and sandy conglomerate. The stratum is characterized by obvious sand–mud interaction. The spatial characteristics of sand bodies in the whole study area are typical characteristics of the sand body in the uranium reservoir, such as sand mud superimposition in the vertical direction, thin thickness, poor horizontal continuity, and strong heterogeneity. The analysis of petrophysical sensitivity in this study area (Figure 7) shows that resistivity is most sensitive to sandstone. Therefore, resistivity is selected as the target parameter of inversion. The 3D resistivity body representing the 3D spatial characteristics of the sand body in the target formation is obtained by seismic lithological inversion.

5.2. Numerical Evaluation of Inversion

The result of inversion must be numerically evaluated before we use this 3D resistivity data volume. The numerical evaluation of 3D inversion data volume mainly includes two qualitative and quantitative aspects. As shown in Figure 9a,b, the qualitative analysis is achieved by extracting the slices along the layers of the target stratum for deterministic impedance inversion and geostatistical lithological inversion and comparing them. At first, the deterministic inversion is strictly loyal to the seismic data, so its result can characterize the spatial distribution characteristics of the sand bodies at the bottom interface of the Sifangtai Formation on a macro level (Figure 9a). Secondly, comparing Figure 9a,b, it can be found that they are consistent in the macro distribution characteristics of the sand body, which shows that the results of seismic lithological inversion for the uranium reservoir in this paper meet the geological understanding of the study area in the overall macro distribution. Finally, comparing the details of Figure 9a,b, it can be found that the resolution of the deterministic inversion to the detailed description of the sand body distribution is limited. It only obtains some macroscopic distribution characteristics of the sand body. The boundaries of single sand bodies are not clear. The result of seismic lithological inversion for the uranium reservoir has a higher spatial resolution. It can more clearly depict the boundary of a single sand body. This is more conducive to the delineation of the 3D spatial range of sand bodies with uranium in the wells.
As shown in Figure 9c,d, quantitative analysis is achieved by extracting the coincidence degree between the lithological distribution represented by the results of inversion at the well’s points and the lithological distribution obtained from drilling data. At first, as shown in Figure 9c, the profile extracted from deterministic inversion through Well Su26 can only depict the distribution of large sand bodies in a macroscopic way. However, it can hardly depict thinner single sand bodies in the well and the horizontal continuity of the sand body. Secondly, as shown in Figure 9d, the results of geostatistical lithological inversion through Well Su26 can depict the spatial characteristics of the sand bodies in the target stratum. It can depict not only the thicker sand bodies in the well but also the thinner single sand bodies. Furthermore, it can well depict the change of the sand body in the horizontal direction. Finally, comparing and analyzing the details of Figure 9c,d, it can be found that the seismic lithological inversion of the uranium reservoir has a high resolution, which is highly consistent with the verification well, and the description of the single sand body is more apparent.
To sum up, both qualitative and quantitative numerical evaluations show that the progressive seismic lithological inversion for the uranium reservoir from deterministic inversion to geostatistical inversion in this paper can obtain high-resolution lithological inversion data volume under the control of macro geological law, which can provide high-resolution 3D lithological inversion data volume for delineating the 3D spatial range of sand bodies with uranium in wells.

5.3. Numerical Results

The 3D seismic lithological inversion data volume after the above accuracy evaluation can be used to delineate the 3D spatial range of the sand body with uranium around the well. The 3D spatial range around the well of the sand body with uranium found in wells Su07, Su21, Su25, and Su26 are shown in Figure 10, Figure 11, Figure 12 and Figure 13. Among them, Well Su07 is located in the northeast region of our study area. Figure 10a shows the 3D spatial range of the sand body with uranium around Well Su07. The 3D spatial range is large. Moreover, the time thickness slice of the sand body with uranium within the time window can be extracted to obtain the plane distribution characteristics of the sand body in the target stratum (Figure 10b). We can obtain Figure 10c by enlarging the local plane distribution characteristics of the sand body in Figure 10b. It can be found from the analysis of Figure 10c that the sand body with uranium is mainly distributed to the south and southwest of Well Su07 on the overall trend, and these two directions are favorable directions of exploration in the future. The sand body shows the characteristics of a channel sand body, and this is consistent with the sand body characteristics of sandstone type uranium deposits.
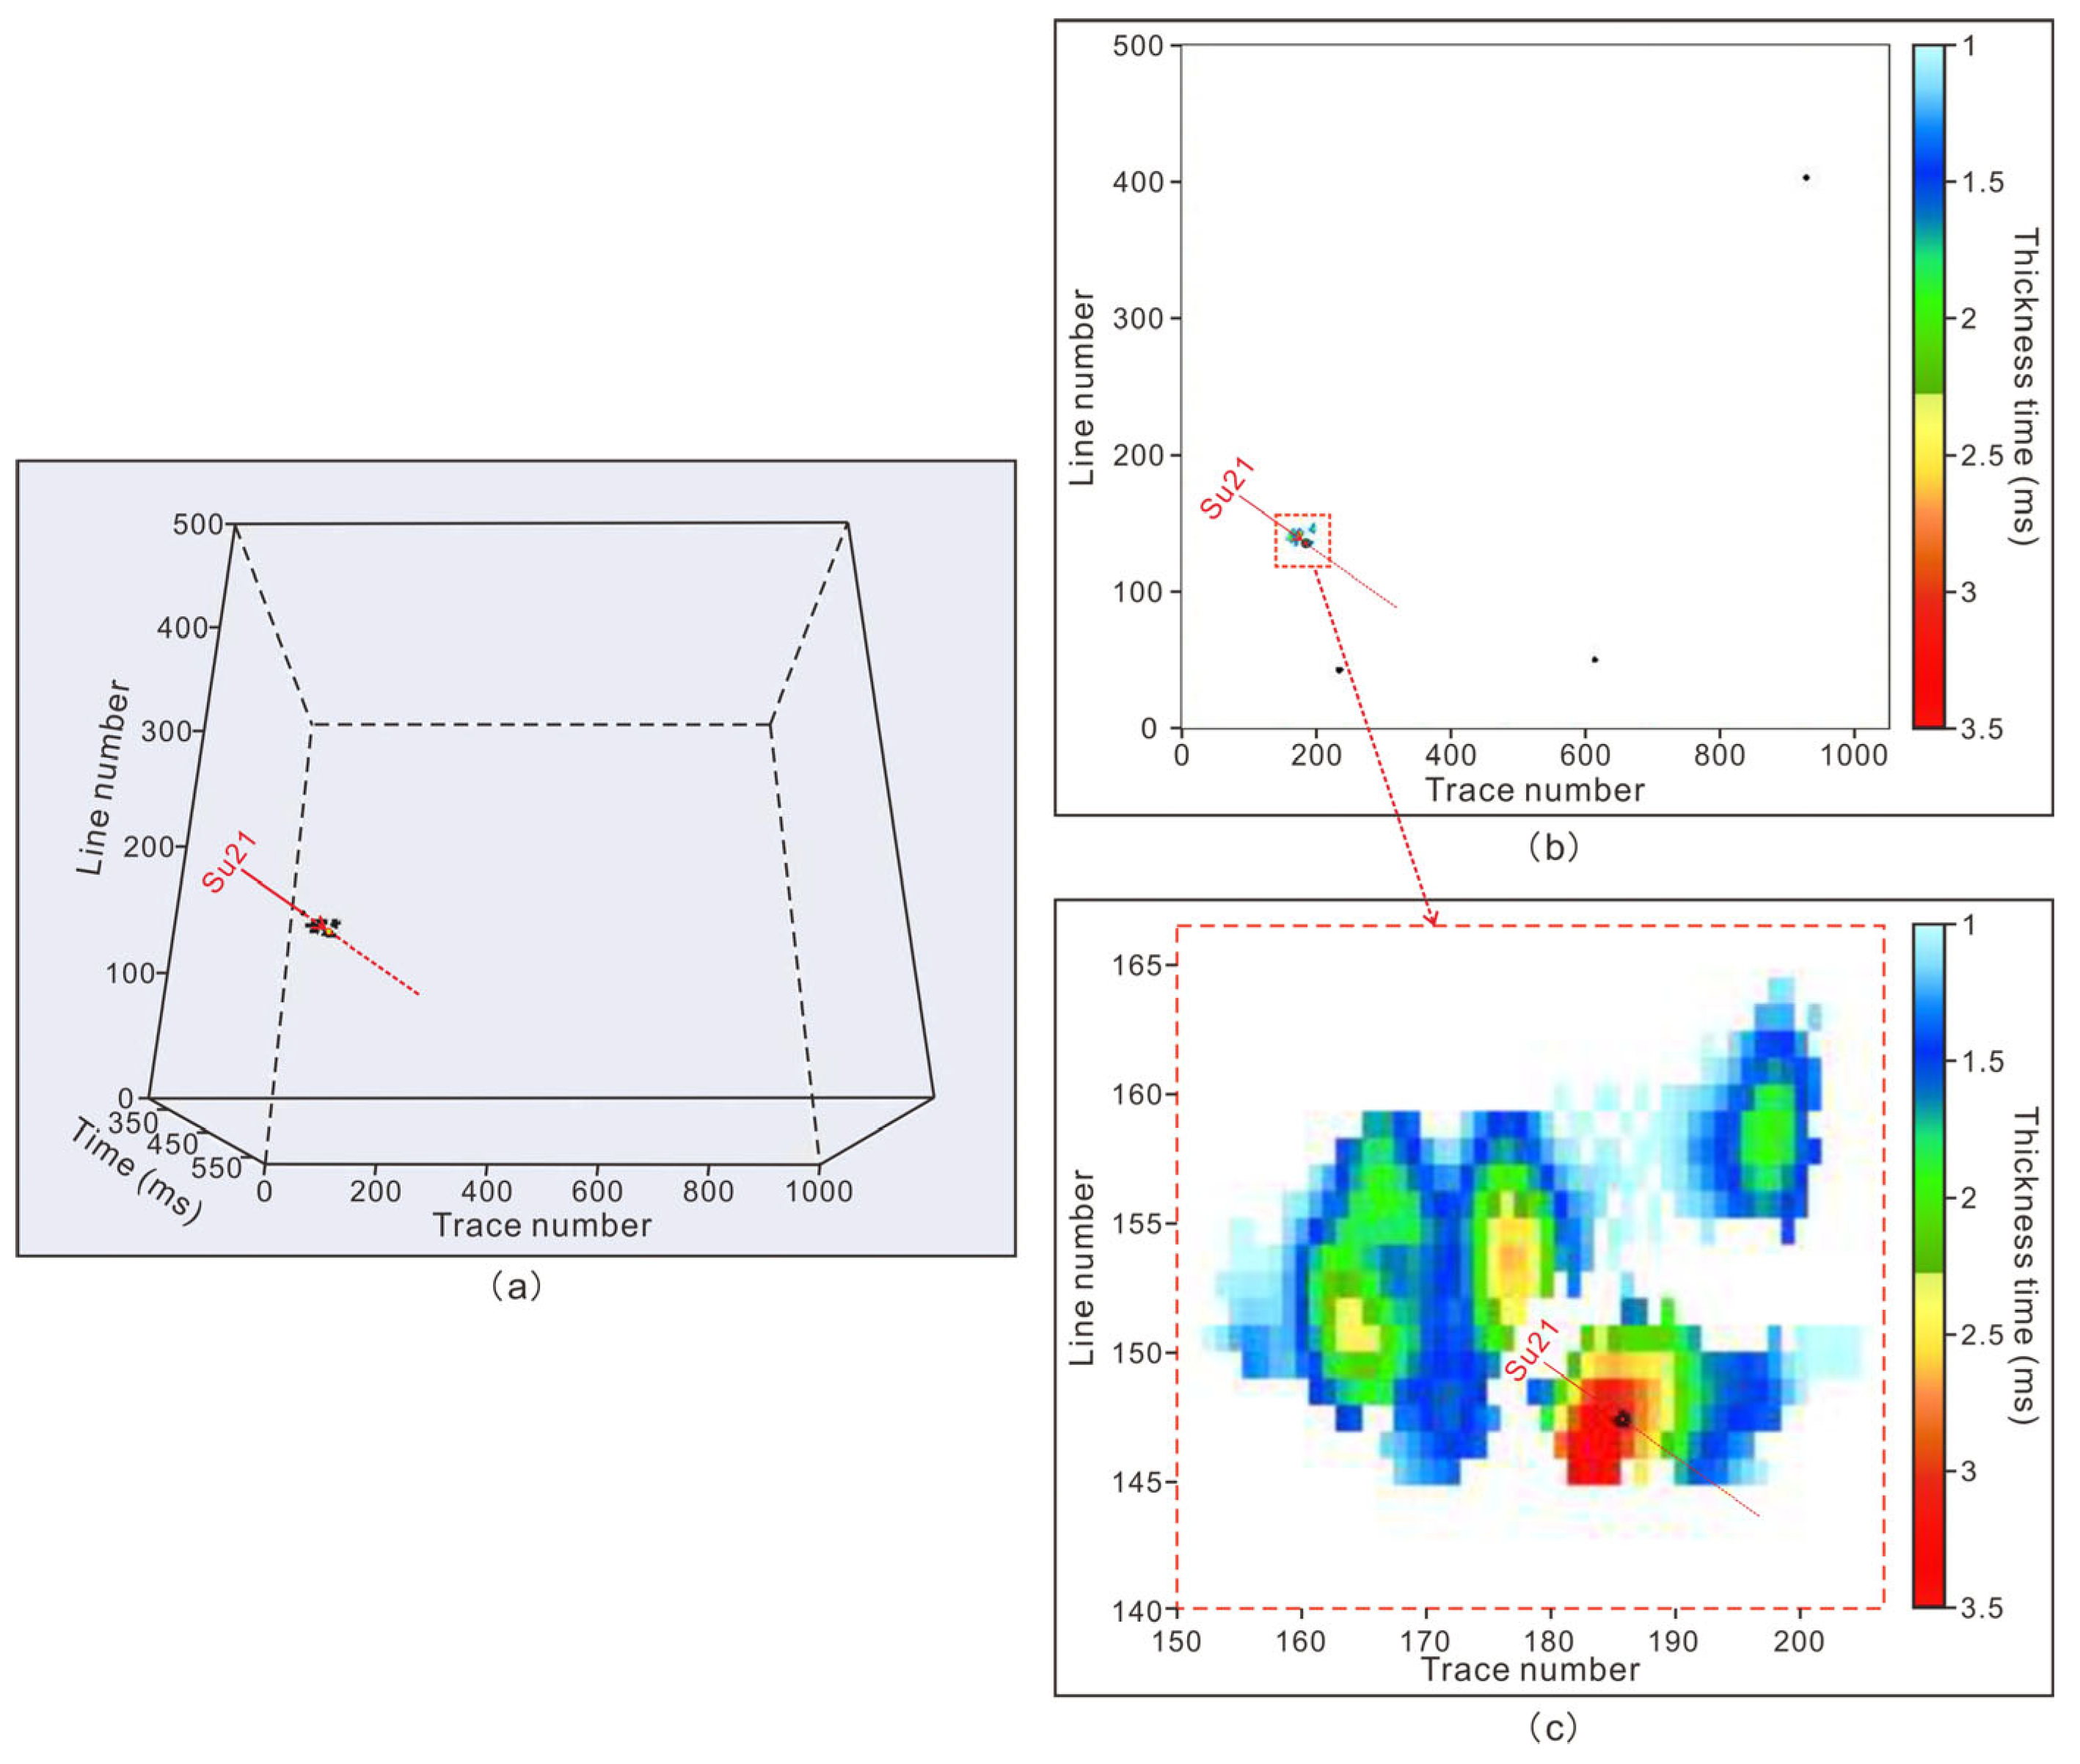
Wells Su21 and Su26 are located in the southwestern region of our study area. Although these two wells are not far apart, they show very different characteristics of the sand body. Among them, the spatial range of the sand body with uranium around Well Su21 is very small (Figure 11a,b). Figure 11c can be obtained by enlarging the local plane distribution characteristics of the sand body in Figure 11b. It can be found from the analysis of Figure 11c in the overall trend that the sand body with uranium is mainly characterized by several isolated sand bodies of locally connected river beach cores. Their spatial range is very limited. This shows that the exploration prospect around Well Su21 is not optimistic, and it cannot be classified as a favorable area for future exploration.
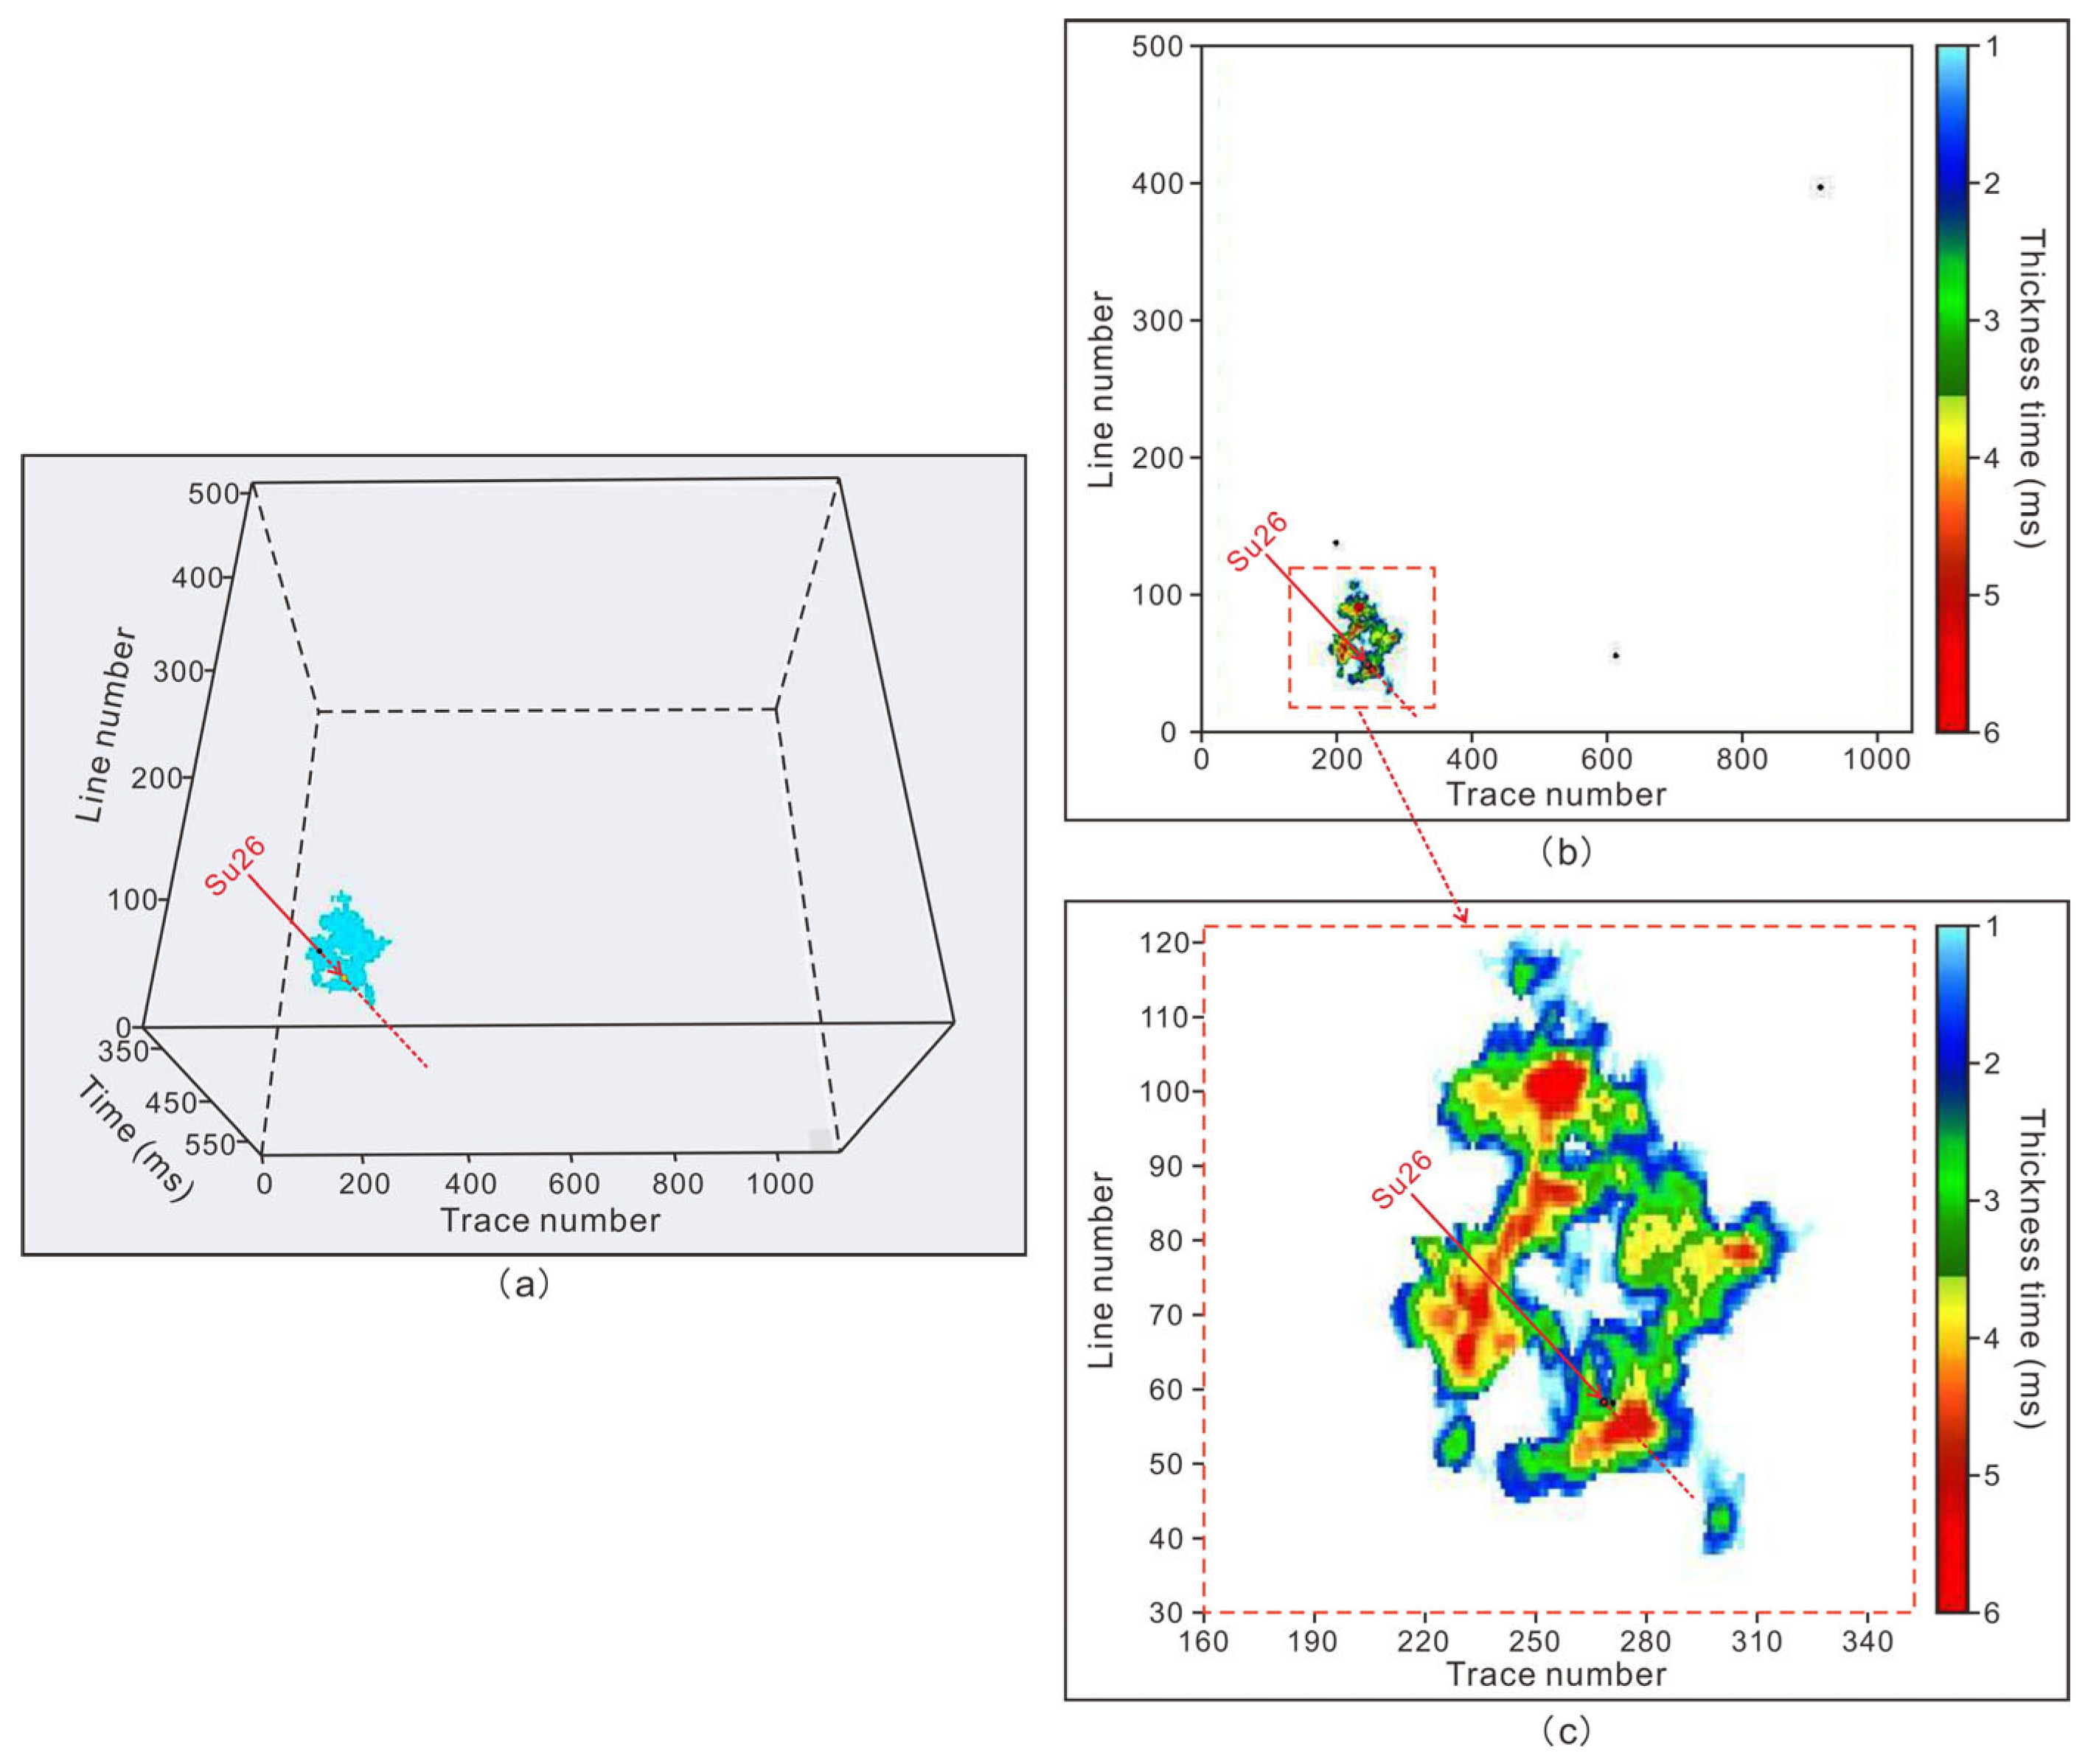
However, the spatial range of the sand body with uranium around Well Su26 is huge (Figure 12a,b). Figure 12c can be obtained by enlarging the local plane distribution characteristics of the sand body in Figure 12b. By analyzing Figure 12c, it can be found that the sand body with uranium is mainly characterized by a braided river channel sand body in the overall trend, and it is also consistent with the sand body characteristics of sandstone type uranium deposits. Sand bodies are mainly distributed to the north of Well Su26, and this direction is the favorable direction for exploration in the future. In addition, through a comprehensive comparative analysis of Figure 11c and Figure 12c, it can be found that although wells Su21 and Su26 are relatively close, their sand body sizes are obviously different, and these two sets of sand bodies do not have connectivity. They are two sets of independent sand bodies (the southernmost section of the well sand body around Su21 is near line 145, while the northernmost section of the sand body around Well Su26 is near line 120). The above characteristics more fully reflect the characteristics of sandstone type uranium deposits, such as small sand body size, poor horizontal continuity, and strong heterogeneity.
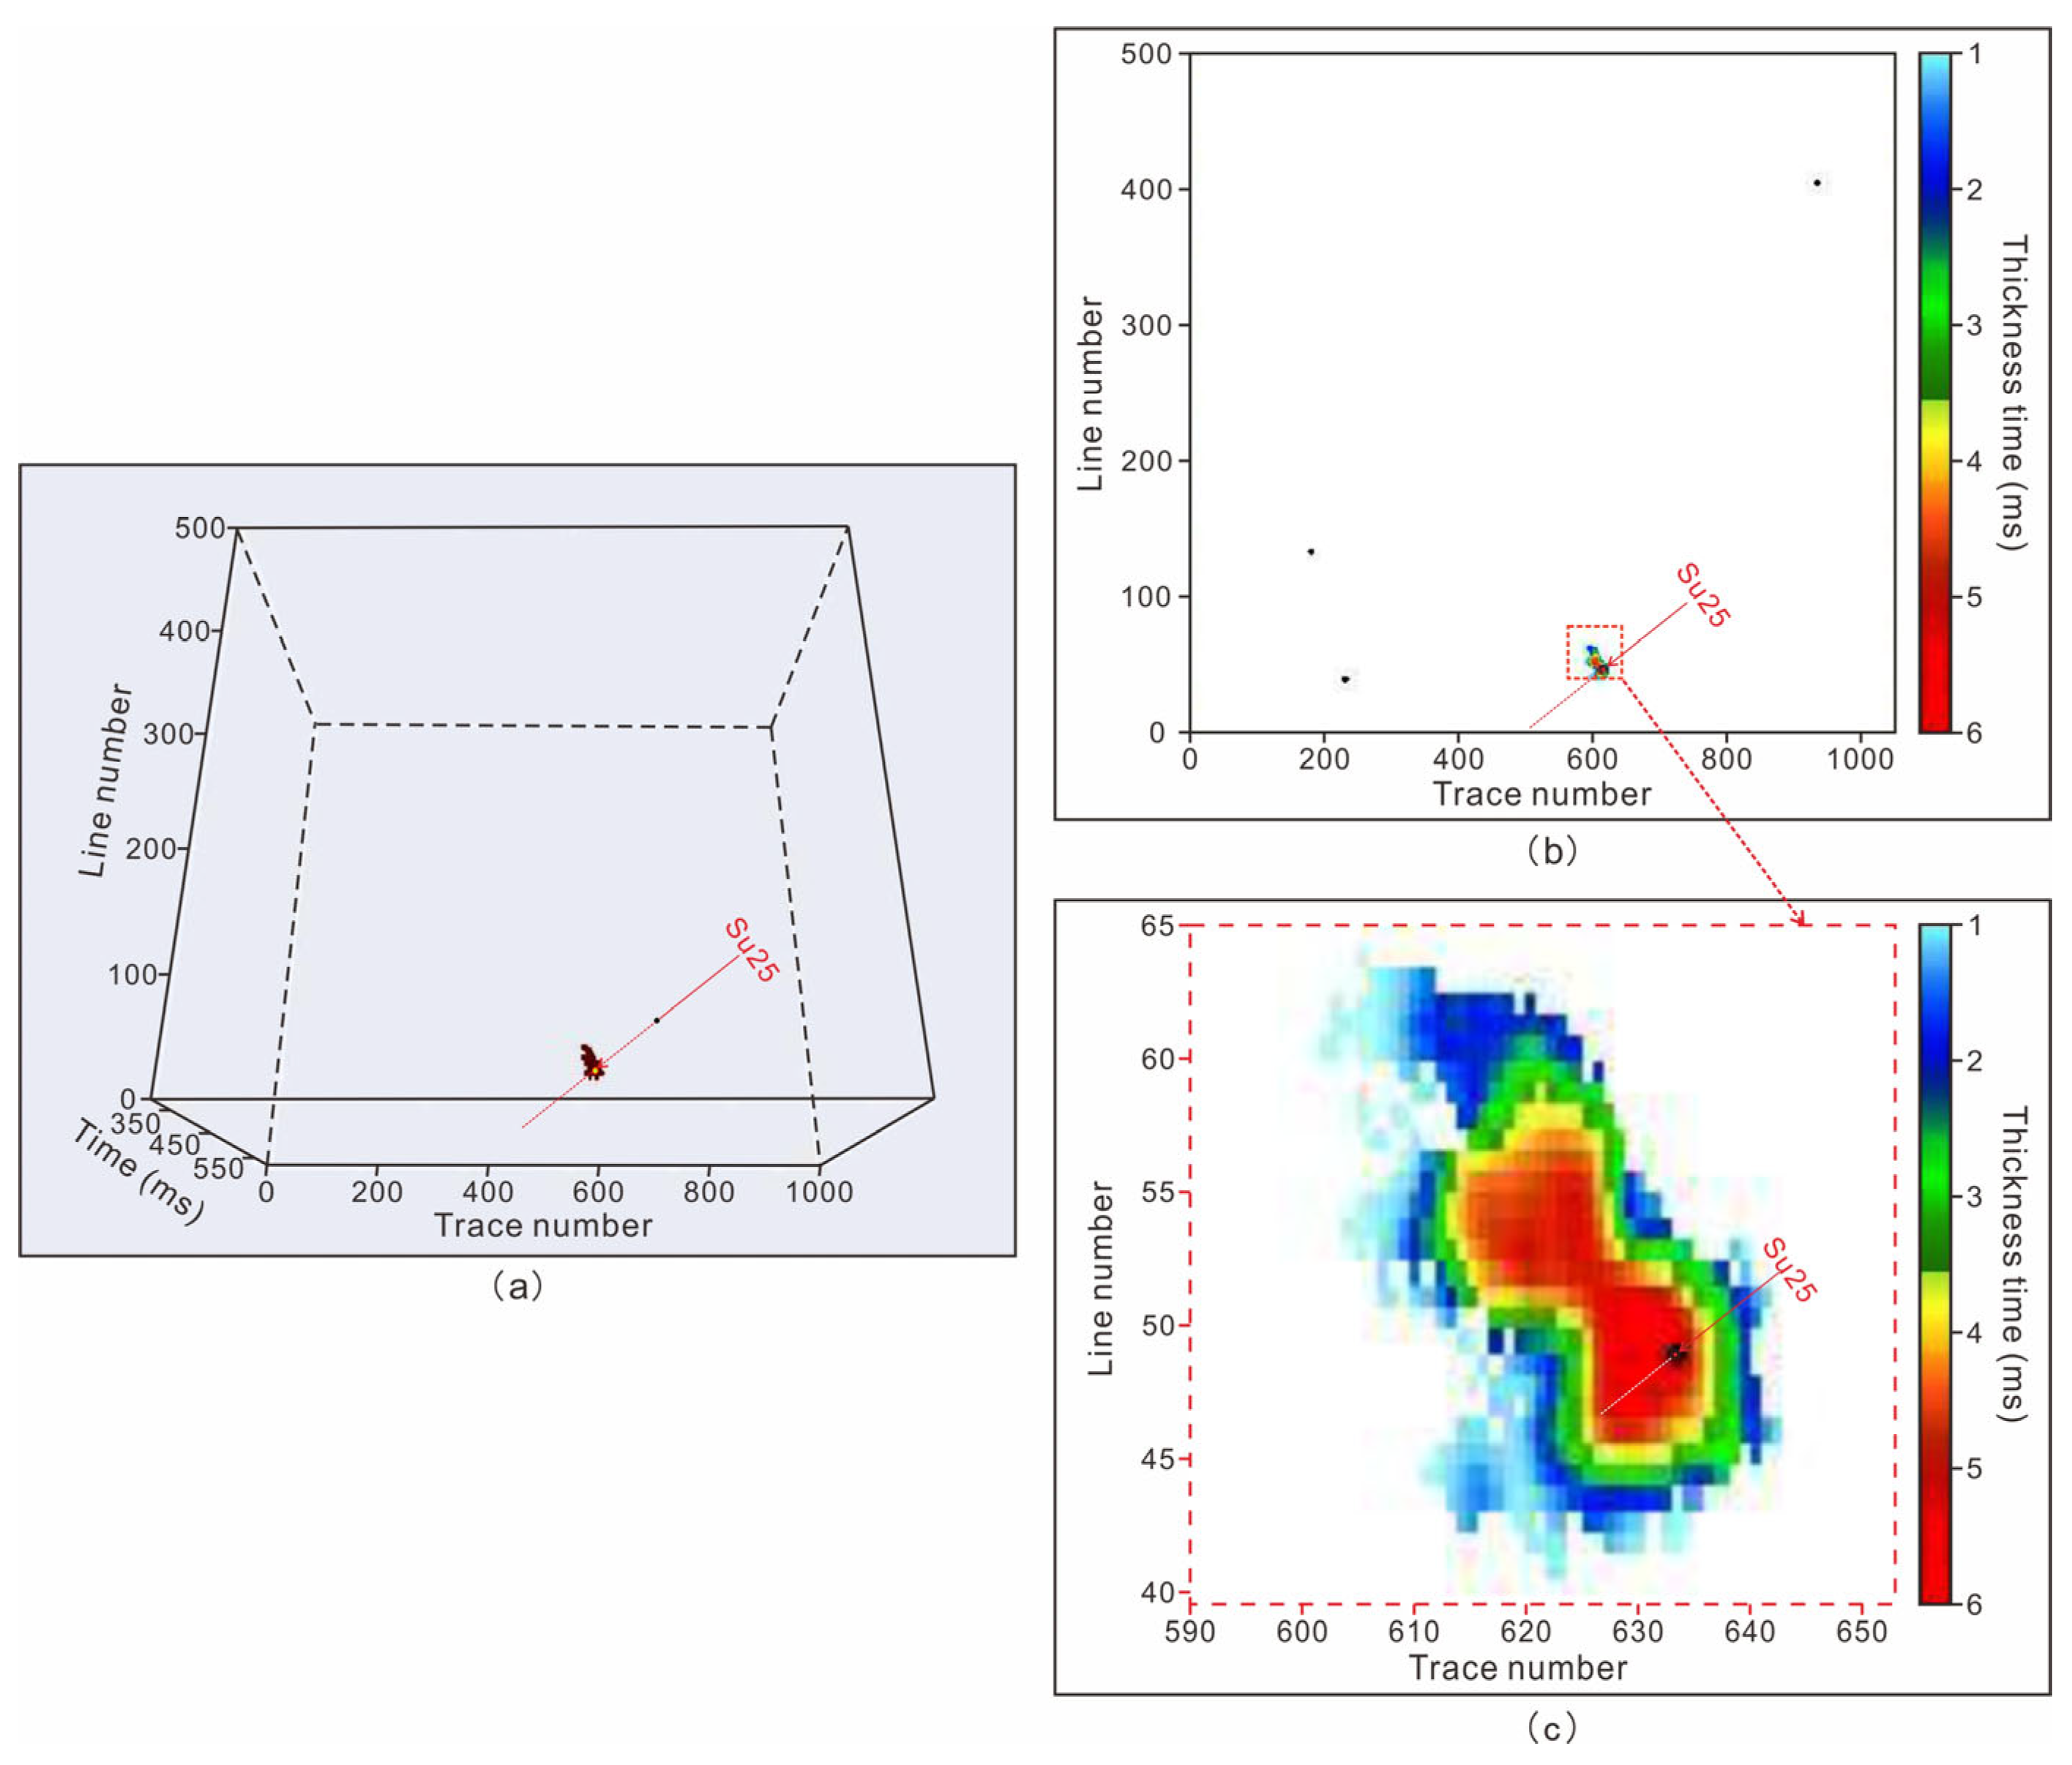
Well Su25 is located in the southern region of our study area. Figure 13a shows the 3D spatial range of the sand body with uranium around Well Su25. Similar to Well Su21, its spatial range is also small. Figure 13b shows the plane distribution of the single sand body along the target stratum. Figure 13c can be obtained by enlarging the local plane distribution characteristics of the sand body in Figure 13b. By analyzing Figure 13c, it can be found that the sand body with uranium is mainly characterized by an isolated channel beach core sand body in the overall trend, and its distribution range is very limited. This also shows that the exploration prospect around well su25 is not optimistic and cannot be classified as a favorable area for future exploration.
In summary, we obtained the 3D spatial range of sand bodies with uranium in four abnormal uranium wells in our study area. The results show great differences. According to the results, we believe that the most favorable areas for future exploration of sandstone type uranium deposits in the study area are south of Well Su07 and north of Well Su26.

6. Discussions

In this paper, we propose a method of searching for sandstone type uranium deposits using historical logging and 3D seismic data measured for oil and gas in petroliferous basins. The keys to the method includes the reconstruction of acoustic logging data, deterministic inversion, petrophysical sensitivity analysis, 3D geostatistical inversion, and the detection of a sub-body. The following special instructions are required for these contents:
  • Although the reconstructed method of acoustic logging data adopted in this paper can compensate for low-frequency components, it is only a reconstructed method based on data analysis. As they are affected by the quality of the original logging data and the error of deterministic inversion, not all wells have a good reconstructed effect. Among the 20 wells to be reconstructed in our study area, the reconstructed effect of 6 wells is not good. Therefore, we have to give them up at last when they are used for the well seismic calibration and seismic lithological inversion.
  • The result of petrophysical analysis in our study area shows that resistivity is the most sensitive logging parameter to sandstone in a uranium reservoir. We are not sure whether this result has universal adaptability to other areas. However, we believe that the qualitative and quantitative petrophysical sensitivity analysis methods adopted in this paper are also effective in other areas.
  • The 3D geostatistical inversion can achieve better results only when there are as many prior conditions as possible. It is more suitable for the mature area of exploration, the development area of sandstone uranium deposits, or the oil and gas areas with a large amount of well data. The constraint of logging data is very important to reduce the multiplicity of solutions and the risk of inversion.
  • The 3D field data case in this paper’s study area shows that the sub-body detection is more suitable for the characteristics of poor horizontal continuity and strong heterogeneity of the sand body with uranium. Combining the experienced judgment such as profile characteristics, gamma anomaly, and mineralization law is necessary to delineate the 3D spatial range of sand bodies with uranium around the well when the continuity of single sand bodies is good.
  • Influenced by the quality of seismic data and logging data, the multiplicity of the solution to 3D seismic lithological inversion for uranium reservoirs will bring risks to delineating sand bodies with uranium. In actual exploration, especially in determining drilling location, more available reference information and multiple pieces of evidence should be used comprehensively to reduce these risks.
  • In areas with high resolution of seismic data and large scale sand bodies in uranium reservoirs, if the deterministic inversion can meet the requirement of the resolution, the results of the deterministic inversion can be directly used to depict sand bodies with uranium. This method does not require the constraint of logging data. It is a good choice in areas with few wells and no wells. It is also suitable for new prospective exploration areas with a low level of exploration.

7. Conclusions

We focus on searching for the sandstone type uranium deposits using historical logging and seismic data in petroliferous basins in the condition that a large amount of acoustic logging data are missing in the target stratum of the uranium reservoir, caused by not being in the main stratum of oil and gas. Through a series of methods, the four key problems, namely, the serious absence of an acoustic curves in the target stratum section, the optimization of lithological sensitivity parameters for the uranium reservoir, the high-resolution 3D seismic lithological inversion of the uranium reservoir, and the delineation of the 3D spatial range of the sand body with uranium around the well, have been solved. Based on this research, we can draw the following conclusions:
  • We give a complete workflow for searching for the sandstone type uranium deposits in petroliferous basins. It comprehensively and meticulously gives a method to fully use the historical logging and 3D seismic data measured for oil and gas to describe the 3D spatial range of the lithology in the uranium reservoir. It has important economic significance for mining the residual value of historical data.
  • The reconstructed method of acoustic logging data based on similarity analysis, cluster analysis, and low-frequency compensation of deterministic inversion proposed in this paper has solved the problem that the target stratum of the uranium reservoir is not the main oil and gas layer, and therefore the acoustic logging data is missing in our study area.
  • The seismic lithological inversion method based on petrophysical sensitivity analysis and 3D geostatistical inversion can be comprehensively used to obtain high-resolution 3D lithological inversion data volume for uranium reservoirs. The qualitative numerical evaluation shows that the results of inversion conform to the lithological distribution characteristics of the uranium reservoir in the macro trend. The quantitative numerical evaluation shows that the results of inversion are in good agreement with the measured wells.
  • Based on the calibration of the sand body with uranium in wells and the detection of the sub-body around the well in 3D inversion data volume, the 3D spatial range of the sand body with uranium around wells and found in wells can be obtained. This method can provide strong technical support and reference data for expanding the discovered results of sandstone type uranium deposits in wells and the accurate development of minerals in the future. Therefore, it has broad application prospects.

Author Contributions

Conceptualization, Z.S., F.Z. and S.Y.; methodology, Z.S.; software, Z.S.; validation, Z.S., F.Z., J.L., R.W., X.O., A.L., F.H., W.C., D.W., M.L. and S.Y.; formal analysis, Z.S.; investigation, Z.S., F.Z., J.L., R.W., X.O., A.L., F.H., W.C., D.W., M.L. and S.Y.; resources, Z.S., F.Z., J.L., R.W., X.O., A.L., F.H., W.C., D.W., M.L. and S.Y.; data curation, Z.S., F.Z., J.L., R.W., X.O., A.L., F.H., W.C., D.W., M.L. and S.Y.; writing—original draft preparation, Z.S. and F.Z.; writing—review and editing, Z.S., F.Z., J.L., R.W., X.O., A.L., F.H., W.C., D.W., M.L. and S.Y.; visualization, Z.S. and F.Z.; supervision, Z.S., F.Z., J.L., R.W., X.O., A.L., F.H., W.C., D.W., M.L. and S.Y.; project administration, Z.S., F.Z., J.L., R.W., X.O., A.L., F.H., W.C., D.W., M.L. and S.Y.; funding acquisition, Z.S., J.L., R.W., X.O., A.L., F.H., W.C., D.W., M.L. and S.Y. All authors have read and agreed to the published version of the manuscript.

Funding

This research work related to this paper has been financially supported by the Key R&D Program of Guangxi Province under grant 2021AB30011, the Scientific Research and Technology R&D Project of CNPC under grant 2021DJ5301 and its sub-project under grant LHYT-KTKFYJY-2022-JS-4299, and the National Key R&D Program of China under grants 2018YFC0604200 and IGCP-675.

Data Availability Statement

The data sets associated with this paper are confidential and may be available by contacting with the authors.

Conflicts of Interest

The authors declare no conflict of interest.

References

  1. Jin, R.S.; Cheng, Y.H.; Yang, J.; Ao, C.; Li, J.G.; Li, Y.F.; Zhou, X.X. Classification and correlation of Jurassic uranium-bearing series in the Junggar Basin. Acta Geol. Sin. 2016, 90, 3293–3309, (In Chinese with English Abstract). [Google Scholar]
  2. Jin, R.S.; Cheng, Y.H.; Li, J.G.; Sima, X.Z.; Miao, P.S.; Wang, S.Y.; Ao, C.; Li, H.L.; Li, Y.F.; Zhang, T.F. Late Mesozoic Continental Basin “Red and black beds” coupling formation constraints on the sandstone uranium mineralization in Northern China. Geol. China 2017, 44, 205–223, (In Chinese with English Abstract). [Google Scholar]
  3. Miao, P.S.; Jin, R.S.; Li, J.G.; Zhao, H.L.; Chen, L.L.; Chen, Y.; Si, Q.H. The first discovery of a large sandstone-type uranium deposit in aeolian depositional environment. Acta Geol. Sin. (Engl. Ed.) 2020, 94, 583–584. [Google Scholar] [CrossRef]
  4. Sun, Z.Q.; Liu, Y.G.; Han, F.X.; Zhang, F.J.; Ou, X.Y.; Cao, M.Q.; Lei, A.G.; Yang, S.L.; Liu, M.C.; Gao, Z.H. Study on the 3D sedimentary characteristics of sandstone type uranium reservoir based on 3D seismic attribute. Minerals 2021, 11, 1096. [Google Scholar] [CrossRef]
  5. Sun, Z.Q.; Huang, X.G.; Li, H.L.; Lei, A.G.; Silva, N.V.; Han, F.X.; Cao, M.Q.; Wei, D. 3D spatial characterization of sand body for uranium reservoirs based on geostatistical resistivity inversion. Interpretation 2021, 9, T809–T819. [Google Scholar] [CrossRef]
  6. Zhang, J.D.; Xu, G.Z.; Lin, J.R.; Peng, Y.B.; Wang, G. Six new types of sandstone-uranium deposits in north China indicate the potential of uranium resources. Geol. China 2010, 37, 1434–1449. [Google Scholar]
  7. Lorilleux, G.; Cuney, M.; Jébrak, M.; Rippert, J.C.; Portella, P. Chemical brecciation processes in the Sue unconformity-type uranium deposits, Eastern Athabasca Basin (Canada). J. Geochem. Explor. 2003, 80, 241–258. [Google Scholar] [CrossRef]
  8. Jaireth, S.; Roach, I.C.; Bastrakov, E.; Liu, S.F. Basin-related uranium mineral systems in Australia, A review of critical features. Ore Geol. Rev. 2016, 76, 360–394. [Google Scholar] [CrossRef]
  9. Ali, A.; Pan, J.Y.; Yan, J.; Nabi, A. Geochemical characteristics and uranium mineralization exploration potential of late Miocene molasse sediments of NW Himalayan foreland basin Pakistan. Arab. J. Geosci. 2020, 13, 123. [Google Scholar] [CrossRef]
  10. Gigon, J.; Mercadier, J.; Annesley, I.R.; Richard, A.; Wygralak, A.S.; Skirrow, R.G.; Mernagh, T.P.; Nancy, I.P.T. Uranium mobility and deposition over 1.3 Ga in the Westmoreland area (McArthur Basin, Australia). Min. Depos. 2021, 56, 1321–1344. [Google Scholar] [CrossRef]
  11. Doynikova, O.A. Paleochannel sandstone-type uranium deposits of Vitim Ore Region. In Uranous Mineralogy of Hypergene Reduction Region; Springer Mineralogy; Springer: Cham, Switzerland, 2021; pp. 179–190. [Google Scholar]
  12. Györfi, I.; Hajnal, Z.; White, D.J.; Roberts, B. High-resolution 2D and 3D seismic imaging of structurally complex hardrock environments hosting high-grade uranium ore, Athabasca Basin, Canada. In Proceedings of the 74th Annual International Meeting, Denver, CO, USA, 10–15 October 2004; pp. 2586–2589. [Google Scholar]
  13. O’Dowd, C.R.; Wood, G.; Brisbin, D.; Powell, B. Enhancing uranium exploration through seismic methods and potential field modeling at the McArthur River mine site, Saskatchewan, Canada. In Proceedings of the 76th Annual International Meeting, New Orleans, LA, USA, 1–6 October 2006; pp. 1253–1257. [Google Scholar]
  14. Juhojuntti, N.; Wood, G.; Juhlin, C.; O’Dowd, C.; Dueck, P.; Cosma, C. 3D seismic survey at the Millennium uranium deposit, Saskatchewan, Canada, Mapping depth to basement and imaging post-Athabasca structure near the orebody. Geophysics 2012, 77, WC245–WC258. [Google Scholar] [CrossRef]
  15. Wood, G.; O’Dowd, C.; Cosma, C.; Enescu, N. An interpretation of surface and borehole seismic surveys for mine planning at the Millennium uranium deposit, northern Saskatchewan, Canada. Geophysics 2012, 77, WC203–WC212. [Google Scholar] [CrossRef] [Green Version]
  16. Galloway, W.E.; Hobday, D.K. Terrigenous Clastic Depositional Systems—Applications to Petroleum, Coal, and Uranium Exploration; Springer: Berlin/Heidelberg, Germany, 1983; p. 423. [Google Scholar]
  17. Hu, F.; Li, J.G.; Liu, Z.J.; Zhao, D.M.; Wan, T.; Xu, C. Sequence and sedimentary characteristics of upper Cretaceous Sifangtai Formation in northern Songliao Baisn, northeast China, Implications for sandstone-type uranium mineralization. Ore Geol. Rev. 2019, 111, 102927. [Google Scholar] [CrossRef]
  18. Sheng, C.D.; Xiang, L.S.; Qi, C.Y. Overview of the researches on sedimentary environment for sandstone-type uranium deposits in the Meso-Cenozoic Basins of China. Acta Sedimentol. Sin. 2006, 24, 223–228. (In Chinese) [Google Scholar]
  19. Jiao, Y.Q.; Wu, L.Q.; Yang, Q. Uranium reservoir: A new concept of sandstone-type uranium deposits geology. Geol. Sci. Technol. Inf. 2007, 26, 1–7. (In Chinese) [Google Scholar]
  20. Li, C.; Yu, C.Q.; Nie, F.J.; Zhou, Y.; Chen, P.; Tian, W. Study on the application of well seismic joint inversion technology in the prospecting of sandstone type uranium deposits. In Proceedings of the China Geoscience Union Annual Meeting, Beijing, China, 15–18 October 2017; pp. 517–518. (In Chinese). [Google Scholar]
  21. Qiu, Y.; Yu, C.Q.; Li, C.; Zheng, X.J. Prediction of sandstone type uranium reservoir in Kunbei area of Qaidam Basin based on well seismic joint inversion. In Proceedings of the China Geoscience Union Annual Meeting, Beijing, China, 21–24 October 2018; pp. 557–558. (In Chinese). [Google Scholar]
  22. Gardner, G.H.F. Formation velocity and density-the diagnostic basics for stratigraphic traps. Geophysics 1974, 39, 770–780. [Google Scholar] [CrossRef] [Green Version]
  23. Zheng, Q.W.; Wang, Z.W.; Ou, X.Y.; Zhang, S. Application of clustering analysis in well logging curve reconstruction. Glob. Geol. 2015, 334, 807–812. (In Chinese) [Google Scholar]
  24. Wei, M.N.; Ma, H.; Sun, Z.Y.; Wang, Y.J. The reconstruction of the virtual well-log acoustic velocity technology based on support vector machine. Pet. Drill. Technol. 2006, 34, 83–87. (In Chinese) [Google Scholar]
  25. Wang, J.; Cao, J.X.; You, J.C. Log reconstruction based on gated recurrent unit recurrent neural network. In Proceedings of the SEG 2019 Workshop, Mathematical Geophysics: Traditional vs. Learning, Beijing, China, 5–7 November 2019; pp. 91–94. [Google Scholar]
  26. Wei, M.A.; Ma, H.; Chen, C.; Wang, Y.J. The well log AC low frequency components reconstruction using Kriging interpolation. Pet. Drill. Technol. 2007, 35, 15–17. (In Chinese) [Google Scholar]
  27. Li, Z.W.; Wu, Q.B.; Cao, C.Y. Study on sandbed recognition technology using impedance inversion in sandstone type uranium deposit. World Nucl. Geosci. 2017, 34, 222–227. (In Chinese) [Google Scholar]
  28. Yuan, F.; Ma, L.; Feng, X.H.; Wen, X.G.; Xu, D.C. Sandstone-type u-ore prediction through geostatistics inversion technology. Coal Geol. China 2015, 27, 62–65. (In Chinese) [Google Scholar]
  29. Luo, L. Application of geostatistical inversion for exploration of sandstone type uranium ore in Qianjiadian area. Uranium Min. Metall. 2018, 37, 68–72. (In Chinese) [Google Scholar]
  30. Sun, Z.Q.; Han, F.X.; Zhang, Y.Q.; Wang, X.Q.; Liu, M.C.; Huang, X.G.; Li, H.L.; Cao, M.Q.; Lei, A.G.; Wei, D. How to get the 3D spatial distribution of sand body with uranium founded in well. In Proceedings of the 2020 2nd SEG Borehole Geophysics Workshop, Virtual, 26–27 November 2020; pp. 94–97. [Google Scholar]
  31. Sun, Z.Q.; Han, F.X.; Zhang, Y.Q.; Wang, X.Q.; Liu, M.C.; Huang, X.G.; Li, H.L.; Cao, M.Q.; Lei, A.G.; Wei, D. Reservoir characterization of sandstone type uranium deposit: 3D field dataset example. In Proceedings of the 90th SEG International Exposition and Annual Meeting, Virtual, 11–16 October 2020; pp. 2350–2354. [Google Scholar]
  32. Sancevero, S.S.; Remacre, A.Z.; Portugal, R.S.; Mundim, E.C. Comparing deterministic and stochastic seismic inversion for thin-bed reservoir characterization in a turbidite synthetic reference model of Campos Basin, Brazil. Lead. Edge 2005, 24, 1168–1172. [Google Scholar] [CrossRef]
  33. Grana, D.; Rossa, E.D. Probabilistic petrophysical properties estimation integrating statistical rock physics with seismic inversion. Geophysics 2010, 75, O21–O37. [Google Scholar] [CrossRef]
  34. Grana, D.; Dvorkin, J. The link between seismic inversion, rock physics, and geostatistical simulations in seismic reservoir characterization studies. Lead. Edge 2011, 30, 54–61. [Google Scholar] [CrossRef]
  35. Haas, A.; Dubrule, O. Geostatistical inversion: A sequential method of stochastic reservoir modeling constrained by seismic data. First Break 1994, 12, 561–569. [Google Scholar] [CrossRef]
  36. Deutsch, C.; Journel, A.G. The application of simulated annealing to stochastic reservoir modeling. SPE Adv. Technol. Ser. 1994, 2, 222–227. [Google Scholar] [CrossRef]
  37. Leite, E.P.; Vidal, A.C. 3D porosity prediction from seismic inversion and neural networks. Comput. Geosci. 2011, 37, 1174–1180. [Google Scholar] [CrossRef]
Figure 1. Background and problems.
Remotesensing 15 01260 g001
Figure 2. The workflow of searching for the sandstone type uranium deposits using historical oil wells and 3D seismic data in petroliferous basins.
Remotesensing 15 01260 g002
Figure 3. The analysis of the correlation between acoustic and other logging data: (a) Acoustic and resistivity, (b) Acoustic and gamma, (c) Acoustic and spontaneous potential, (d) Acoustic and CNL, (e) Acoustic and RHOB.
Remotesensing 15 01260 g003
Figure 4. The result of reconstructed acoustic logging data based on cluster analysis method: (a) The logging curve of measured data (red) superimposed on reconstructed data (green), (b) The numerical correlation between measured and reconstructed data.
Remotesensing 15 01260 g004
Figure 5. The result of deterministic inversion around Well Su16.
Remotesensing 15 01260 g005
Figure 6. The result of reconstructed acoustic logging data with low frequency compensation: (a) The logging curve of measured data (black) superimposed on one of the reconstructed logging data (red), (b) The numerical correlation between measured and reconstructed data.
Remotesensing 15 01260 g006
Figure 7. Petrophysical sensitivity analysis to drilling and logging data: (a) Drilling and logging data of well su19, (b) Drilling and logging data of well su07, (c) The intersection analysis between resistivity and gamma, (d) The intersection analysis between resistivity and P-sonic.
Remotesensing 15 01260 g007
Figure 8. The detection of sub-body for sand-body with uranium: (a,b) The calibration of uranium anomaly in well, (c) Determination of the position of abnormal uranium section in the 3D inversion data volume, (d) The detection of sub-body in 3D inversion data volume.
Remotesensing 15 01260 g008
Figure 9. The numerical evaluation of inversion: (a,b) Qualitative evaluation by comparing the plane attributes of deterministic inversion and geostatistical inversion, (c,d) Quantitative evaluation by comparing the sand bodies (blue) in Well Su26 with the results of deterministic inversion and geostatistical inversion.
Remotesensing 15 01260 g009
Figure 10. The 3D spatial range and its plane distribution characteristics along the target stratum of the sand body with uranium around Well Su07: (a) 3D spatial range, (b) Plane distribution characteristics extracted along the target stratum, (c) Local enlargement of the red rectangular dashed box in (b).
Remotesensing 15 01260 g010
Figure 11. The 3D spatial range and its plane distribution characteristics along the target stratum of the sand body with uranium around Well Su21: (a) 3D spatial range, (b) Plane distribution characteristics extracted along the target stratum, (c) Local enlargement of the red rectangular dashed box in (b).
Remotesensing 15 01260 g011
Figure 12. The 3D spatial range and its plane distribution characteristics along the target stratum of the sand body with uranium around Well Su26: (a) 3D spatial range, (b) Plane distribution characteristics extracted along the target stratum, (c) Local enlargement of the red rectangular dashed box in (b).
Remotesensing 15 01260 g012
Figure 13. The 3D spatial range and its plane distribution characteristics along the target stratum of the sand body with uranium around Well Su25: (a) 3D spatial range, (b) Plane distribution characteristics extracted along the target stratum, (c) Local enlargement of the red rectangular dashed box in (b).
Remotesensing 15 01260 g013
Disclaimer/Publisher’s Note: The statements, opinions and data contained in all publications are solely those of the individual author(s) and contributor(s) and not of MDPI and/or the editor(s). MDPI and/or the editor(s) disclaim responsibility for any injury to people or property resulting from any ideas, methods, instructions or products referred to in the content.