Abstract
As the first hybrid-constellation global navigation system, China’s BeiDou navigation satellite system (BDS) has been fully constructed since July 2020 and provides open services for worldwide users. Due to the natural sensitivity of satellite tracking techniques to geocenter motion, BDS has the capability to determine the geocenter coordinates (GCC). This study aims to improve the precision of geocenter coordinates derived from BDS. To that end, 3-year sets of daily geocenter coordinates have been determined with BDS observations. Different solar radiation pressure (SRP) models, including the empirical CODE orbit model (ECOM), the extended ECOM model (ECOM2), and the a priori box-wing along with the ECOM model (BW + ECOM), have been applied for the BDS geocenter estimation. We show that the BW + ECOM model is beneficial in recovering the geocenter motion. Compared to the ECOM, the BW + ECOM model appears to mitigate the draconitic signal of BDS, which reduces the annual amplitude of the GCC-Z by a factor of 2.9. On the other hand, the amplitude of the 3 cpy signal is also reduced by a factor of 2.9. Furthermore, we studied the impact of BDS constellation configuration on the geocenter estimation. The results indicate that the inclusion of IGSO satellites significantly mitigates the spurious signals in the spectra of the GCC-Z. The amplitudes of the annual signal and 3 cpy signal are reduced by (28%, 14%), (33%, 61%), and (31%, 9%) for ECOM, ECOM2, and BW + ECOM cases, respectively. Meanwhile, the amplitude of the 7-day signal related to the orbital period of MEO satellites is also reduced by 32–45%. Thus, the BW + ECOM model and the MEO+IGSO hybrid configuration are recommended for BDS to determine the geocenter coordinates. However, despite these improvements, a significant annual signal with an amplitude of 20.2 mm and a visible 3 cpy signal with an amplitude of 6.1 mm still exist when compared to the Satellite Laser Ranging (SLR) solution.
1. Introduction
According to the IERS Conventions (2010) [1], the geocenter is stipulated as the center-of-mass (CM) of the whole Earth system, including the solid Earth, oceans, and atmosphere. The movement of geocenter relative to the center-of-figure (CF) of the solid Earth is known as the geocenter motion, which can be expressed by the geocenter coordinates (GCC) in a terrestrial reference frame [2,3]. Precise determination of the instantaneous GCC is one of the critical tasks of geodesy and has profound implications for the interpretation and application of the International Terrestrial Reference Frame (ITRF) [4,5,6,7].
The Satellite Laser Ranging (SLR) to geodetic satellites is, so far, the most robust technique to obtain the GCC, mainly because of its absolute and unambiguous observations, well-established models for propagation delays [8], and simple dynamic model on geodetic satellites with few parameters involved [9]. However, SLR-derived GCC are affected by the limited number and inhomogeneous distribution of the SLR stations [10]. The Global Navigation Satellite System (GNSS), another space geodetic technique to determine the GCC, has a denser tracking network with a much better global distribution than SLR. The equatorial X and Y components determined by GNSS are in good agreement with SLR [11,12]. However, the Z component of GNSS-derived GCC suffers from modeling deficiencies for solar radiation pressure (SRP) and collinearity issues in parameter estimation, leading to the spurious signals in GCC-Z series [7,13,14].
During the past decade, many investigations have been carried out to improve the quality of GCC determination from GNSS observations, particularly in SRP modeling. Hugentobler et al. [15] and Meindl et al. [13] suggested that the spurious signals in the GCC series could be introduced by the correlations between the GCC and SRP parameters. Therefore, the GCC determination will be enhanced when SRP modeling employs fewer parameters or tighter constraints. Bury et al. [16] demonstrated that the combination of the a priori box-wing model and the ECOM with fewer estimated parameters improves the GCC estimation for Galileo. Rodriguez-Solano et al. [17] found that the adjustable box-wing model with parts of SRP estimates constrained reduces the draconitic errors in GCC series for GPS+GLONASS. In addition to the SRP modeling, several other factors have also been studied. Lutz et al. [18] analyzed the impact of the arc length on the GCC estimation and concluded that the 3-day solution is superior to the 1-day solution. Zajdel et al. [19] showed that the distribution of ground tracking stations is also a significant factor affecting the estimated GCC, for asymmetries between the hemispheres may lead to spatially correlated systematic biases.
However, these previous studies on GNSS-based geocenter determination mainly involved GPS, GLONASS, and Galileo, and little attention has been paid to the geocenter estimation using observations from the BeiDou satellite navigation system (BDS). By July 2020, the BDS has been entirely constructed. As of 1 January 2022, there are 27 Medium Earth Orbit (MEO), 10 Inclined Geosynchronous Orbit (IGSO), and 7 Geostationary Earth Orbit (GEO) satellites in normal operation in the BDS constellation. Being the first hybrid-constellation global navigation system, BDS is also capable of determining the GCC, and its unique constellation configuration may bring benefits to the GCC estimation. In this contribution, we present GCC time series derived from the BDS observations collected by a globally distributed tracking network over three years (2019–2021). Given that proper modeling of SRP is the key to accurately determining GCC, we first evaluate the performance of different SRP models within MEO satellites. Then, to explore the effect of constellation configuration on the GCC determination, IGSO satellites are added, but GEO satellites are excluded from this study due to their significant orbital errors [20].
2. Materials and Methods
In this section, after a brief introduction to the GNSS-based approach to the GCC recovery, the availability of selected tracking stations and details of the processing strategy are presented. The solutions in this study differ in terms of solar radiation modelling and constellation configuration, and their impact on the GCC is the focus of this paper.
2.1. Recovery of the GCC
In general, two main approaches are available to determine the GCC: inverse and direct. The inverse approach uses the surface deformation induced by the degree-1 mass load to recover the GCC indirectly [4,21]. The direct approach, also called the translational approach, estimates the translation parameters between the CM frame and the reference CF frame [5,22,23]. Since the inverse approach can only retrieve the non-periodic geocenter motion caused by surface deformation, and therefore has no contribution to defining the origin of ITRF [14], we only focus on the direct approach in this study. In theory, the GCC estimation using GNSS satellite tracking can be described by the GNSS ionosphere-free (IF) observation model [24]:
where and denote IF code and carrier-phase observations; is the satellite position at the emission epoch and is the ground station position at the receiving epoch , both in the inertial coordinate system; and represent the IF clock biases of the satellite and receiver; and denote the IF code biases of satellite and receiver; is the velocity of light in vacuum; and are the IF phase delay of the satellite and receiver signal [25]; and denote the wavelength and ambiguity of the IF carrier-phase; is the zenith wet delay; and is the corresponding mapping function; and refer to the sum of observation noise, multi-path error, and other unmodeled errors for the IF code and carrier-phase observations. Note that the hydrostatic component of the tropospheric delay is usually corrected using the a priori model, which is not given in this IF observation model.
Using the rotation matrixes for precession (), nutation (), Earth rotation (), and polar motion (), can be converted from the position of ground station () and geocenter coordinates () in the Earth-fixed coordinate system. The is aligned to the ITRF using minimum constraints for all fiducial stations, while the is simultaneously estimated with other parameters using least square adjustment. The estimated plays a key role in aligning the Earth’s rotation axis with the origin of the reference frame so that the interconversion between the inertial and Earth-fixed coordinate systems can be carried out correctly [12].
2.2. Ground Tracking Network
In this contribution, a maximum of 130 globally distributed IGS (International GNSS Service [26]) stations (see Figure 1)) during 2019–2021 are selected for the GCC estimation. To make better alignments of solutions to ITRF, we imposed minimum constraints, including No-Net-Translation (NNT) and No-Net-Rotation (NNR), on the core network of IGS (represented by red stars in Figure 1).
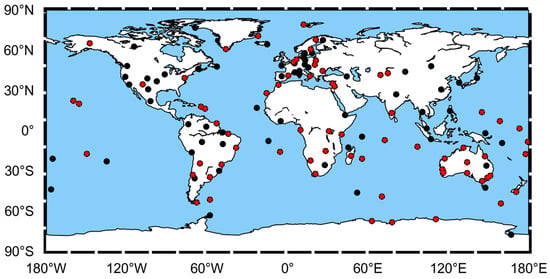
Figure 1.
Distribution of stations used in processing. The black dots denote all stations and red stars denote core stations.
Figure 2 shows the availability of ground stations with IGSO and MEO satellites tracking capability from 2019 to 2021. With the deployment of Trimble Alloy and the update of Trimble NetR9 over the three years, the number of stations tracking BDS satellites has gradually increased from around 80 to 130. Meanwhile, although several new BDS-3 satellites (i.e., C38–C46) were launched in late 2019 and early 2020, they could only be tracked by a few stations before 2021. After the firmware updates of Septentrio receivers, the number of stations tracking these newly deployed BDS-3 satellites saw a sharp increment around the beginning of 2021 and kept growing for the rest of the period shown.
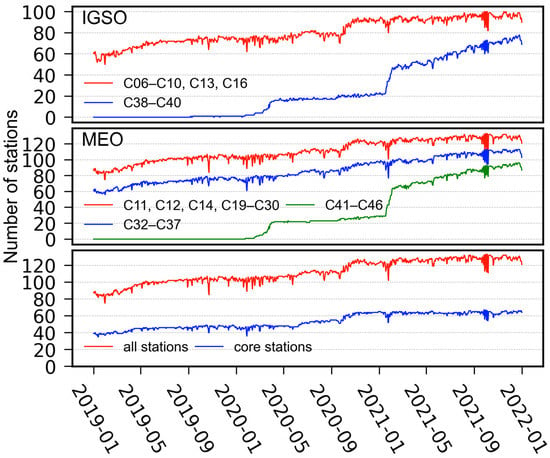
Figure 2.
The availability of selected stations with IGSO and MEO satellites tracking capability from 2019 to 2021.
2.3. Processing Strategy
The whole computation processing within this paper was conducted with the GREAT (GNSS + Research, Application and Teaching) software [27,28,29], and details of the strategy are summarized in Table 1. For this study, we use the undifferenced IF combination of BDS B1I+B3I observations with 300 s sampling from 2019 to 2021, and the elevation cut-off angle is set to 7°. Considering the long-arc solutions were found to be beneficial to the GCC estimation [18], the arc length of solutions is set to 3-day in this study.

Table 1.
Specification of the processing strategy.
In the processing, we use the IGS realization of ITRF2014 to provide an a priori reference frame. The NNT and NNR minimum conditions are imposed to define the datum and eliminate the rank deficiency. This approach is also used by the IGS and analyses from GNSS (e.g., Zajdel et al. [19]). One set of station coordinates is estimated for each 3-day solution, with an a priori constraint of 0.1 m. For the zenith tropospheric delay (ZTD), after the correction using the Saastamoinen model, the residual ZTD and its gradients are treated as piecewise constants, estimated per 2 h and 24 h, respectively. In addition, the clock biases of satellites and receivers are epoch-wise estimated as white noise, while the undifferenced ambiguity parameters are estimated with constraints derived by the double-differenced ambiguity resolution method. The GCC are determined together with the satellite orbits, station coordinates, clock bias, tropospheric parameters, and ambiguities, with an a priori constraint of 0.1 m.
Proper SRP modeling is the prerequisite for accurate GCC determination. To explore the effect of SRP on the GCC estimation, we chose three variants of SRP models listed in Table 2, including the 5-parameter ECOM model, the 7-parameter ECOM2 model, and the a priori box-wing along with the ECOM model (denoted as BW + ECOM in this study). The 5-parameter ECOM [34] is purely empirical, which describes the SRP accelerations in a DYB orthogonal frame, with D pointing from the satellite to the sun, Y along the nominal solar panels axes, and B completing the orthogonal system:
where is the satellite’s argument of latitude with regard to the sun’s in the orbital plane; , and are the five empirical parameters to be estimated. Compared with the 5-paramter ECOM, the 7-parameter ECOM2 [11] has additional higher-order harmonic terms () in the D direction, which can be expressed by:
The BW + ECOM model stands somewhere between the purely empirical model and the analytical model, based on the physical interaction between solar radiation and satellite surfaces. For a single surface, the acceleration is expressed as follow [35]:
where , , and refer to the absorption, diffuse reflection, and specular reflection coefficient, respectively; denotes the area of surface; is the mass of satellite; is the solar irradiance at 1AU; is the speed of light in a vacuum; is the angle between satellite–sun vector and surface’s normal vector .
Equation (4) is suitable for solar panels with the assumption that thermal re-emissions from the front and back sides of the panel are mostly balanced. However, the thermal effect cannot be ignored for satellite body surfaces. Considering an instantaneous re-radiation of the absorbed radiation, the SRP acceleration generated by the satellite body surface is [36]:
Since the pure box-wing model alone is not sufficient to handle the actual behavior of satellites due to the variability or uncertainty of the a priori information, the empirical ECOM parameters are also estimated on top of it. The BW + ECOM solution constructs a box-wing model with the estimated physical information of satellites provided by Duan et al. [37] (see Table 3). Note that Duan et al. [37] only provides information on BDS satellites with PRNs C06–C37; we use the rough optical properties given by Zhao et al. [20] for BDS satellites with PRNs C38–C46 (see Table 4).

Table 3.
Optical coefficients for BDS satellites C06–C37 provided by Duan et al. [37].

Table 4.
Optical coefficients for BDS-3 C38–C46 satellites provided by Zhao et al. [20].

Table 2.
Solutions with different SRP models [20,37].
Table 2.
Solutions with different SRP models [20,37].
| Solution | SRP Parameters | A Priori Physical Model |
|---|---|---|
| ECOM | - | |
| ECOM2 | - | |
| BW + ECOM | Duan et al. [37] for PRNs C06–C37 Zhao et al. [20] for PRNs C38–C46 |
Considering that different constellation configurations may also influence the GCC estimation, we first test different SRP models based on MEO satellites and then add IGSO satellites to evaluate their contribution to the GCC estimation.
3. Results
This section will discuss the impacts of different SRP models and constellation configurations on the BDS-derived GCC. Since the equatorial components of GCC are barely affected, we mainly focus on the GCC-Z series. Finally, all solutions within this paper are evaluated by comparing them to external products.
3.1. Impact of Different SRP Models on the GCC-Z
Figure 3 shows the time series and spectra of GCC-Z derived from BDS MEO satellites for ECOM, ECOM2, and BW + ECOM solutions. When ECOM is adopted, the peak-to-peak excursion of GCC-Z reaches about 30 cm and has a period of about one year. This periodic excursion seems to be related to the draconitic year (the revisit cycle of the satellite with regard to the sun), and it is reflected as a dominant annual signal with an amplitude of 84.6 mm in the GCC-Z series. Meanwhile, a significant 3 cpy (cycle per year) signal in the GCC-Z series reaches the amplitude of 19.6 mm, which is mainly related to the maximum angles of the three MEO orbital planes, and therefore has a period of about one-third of a year.

Figure 3.
Time series and power spectra of GCC-Z derived from MEO satellites of BDS for ECOM, ECOM2, and BW + ECOM solutions, respectively. The curves denote the sun elevation angles above the orbital planes, and the vertical grey lines indicate the harmonics of the year, which are 1, 2, 3, 4, 5, 6, 7 cpy from right to left.
After the switch from ECOM to ECOM2, the amplitude of the annual signal is reduced by a factor of 2.5, whereas the 3 cpy signal is not obviously weakened and still has an amplitude of 19.1 mm. Furthermore, a pronounced 68-day signal with an amplitude of 12.8 mm is visible in the GCC-Z spectrum. This spurious signal is potentially related to the over-parameterization of periodic terms for ECOM2 during the eclipse season, which will be discussed later. When the a priori box-wing model is used together with ECOM, the annual amplitude is further reduced to 29.3 mm, while the 3 cpy signal is also greatly attenuated.
To further explore the advantages of the box-wing model for GCC estimation, we compared the ECOM estimates before and after the inclusion of the box-wing model. Figure 4 shows ECOM estimates of representative satellites from five different groups shown in Table 3, that is, C14 for BDS-2 MEO, C25 for BDS-3 SECM (Shanghai Engineering Center for Microsatellites), C19, C33, and C37 for BDS-3 CAST (China Academy of Space Technology) with different patterns. The results are shifted by the mean values of estimates for better comparison. In general, the addition of the box-wing model dramatically decreases the magnitude of the and flattens the visible pattern of and . However, the Y estimates during eclipse seasons are not effectively managed, indicating that it is controlled by other unconsidered physical effects, e.g., solar sensor bias, satellite body radiator emission, and solar panel thermal radiation. Nonetheless, the a priori box-wing model compensates, to some extent, for the radiation-related disturbances, which is beneficial in recovering the GCC.
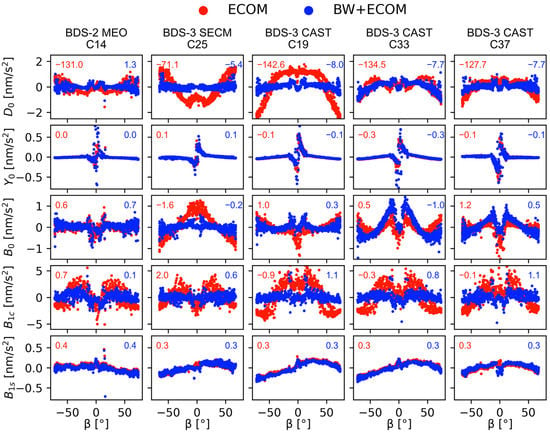
Figure 4.
ECOM estimates of representative MEO satellites from five different groups classified in Table 3. The removed mean values of ECOM estimates are given in the subgraphs. All values are given in nm/s2.
It can also be seen that, in each solution, the GCC-Z shows a significant vibration in the first half of 2019. This is mainly due to the fact that there were only 80–100 stations during this period (see Figure 2), and such vibration diminishes as the number of stations increases. As the BDS MEO satellite has an orbital period of approximately 12.9 h, the Earth rotates precisely 7 times when the MEO satellite has orbited the Earth 13 times, meaning that the ground footprints of the MEO constellation coincide once every 7 days. Therefore, the vibration translates into a spurious 7-day signal in the spectra of the GCC-Z. For this MEO-specific spurious signal, the BW + ECOM model has the best performance. Its amplitude is only 4.4 mm, which is lower than the 5.8 mm of ECOM and 7.2 mm of ECOM2.
3.2. Impact of the Constellation Configuration on the GCC-Z
Since different impacts of IGSO satellites are posed on the GCC due to the handling of SRP modeling, three test cases, ECOM, ECOM2, and BW + ECOM, are considered. Figure 5 compares the time series and power spectra of GCC-Z derived from the MEO constellation and IGSO+MEO constellation of BDS, respectively, and the amplitudes of significant spurious signals are listed in Table 5. Here, we found that the inclusion of IGSO satellites significantly quiets the annual signals and 3 cpy signals in the spectra of GCC-Z, reducing their amplitudes by (28%, 14%), (33%, 61%), and (31%, 9%) for ECOM, ECOM2, and BW + ECOM cases, respectively. It is probably because the IGSO satellites provide three additional orbital planes, allowing the BDS constellation configuration to form a 6-plane geometry similar to that of GPS, which proved superior to constellations with three orbital planes, such as GLONASS and Galileo, in the GCC-Z estimation [13].
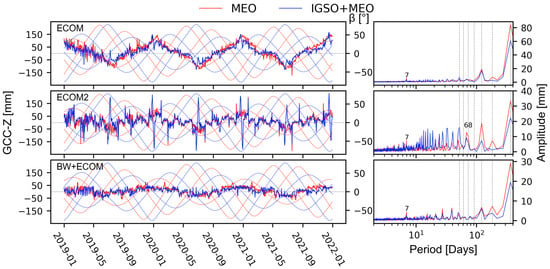
Figure 5.
Time series and power spectra of GCC-Z derived separately from MEO and IGSO+MEO constellation of BDS. The curves show the elevation angles of the sun above the orbital planes, which are distinguished by two different colors (red for MEO and blue for IGSO). The vertical grey lines denote the harmonics of the year, which are 1, 2, 3, 4, 5, 6, 7 cpy from right to left.

Table 5.
Amplitudes of annual signal, 3 cpy signal and 7-day signal in GCC-Z series (units: mm).
Furthermore, the 7-day spurious signal related to the orbital period of MEO satellites is also significantly weakened by the additional IGSO satellites. The amplitude is reduced by 43%, 32%, and 45% for ECOM, ECOM2, and BW + ECOM cases, respectively. It indicates that the inclusion of IGSO satellites can mitigate the periodic systematic error brought by MEO satellites. Meanwhile, since the orbital period of IGSO satellites is equal to the Earth’s rotation period, it will not bring new periodic systematic errors to GCC-Z.
However, in the case of ECOM2, when the angle of the IGSO orbital plane is close to zero, a noticeable peak occurs in the GCC-Z series. It is mainly attributed to the poor performance of ECOM2 during the eclipse season. Figure 6 shows the histogram of intervals between consecutive orbital planes of BDS along the ecliptic. It is clear that the visible 68-day signal in the MEO-derived ECOM2 solution (see Figure 5) is related to the 65-day interval of zero crossing for MEO. After the inclusion of IGSO satellites, the intervals move to the range of approximately 10–50 days, which gives rise to these artificial signals at corresponding periods.
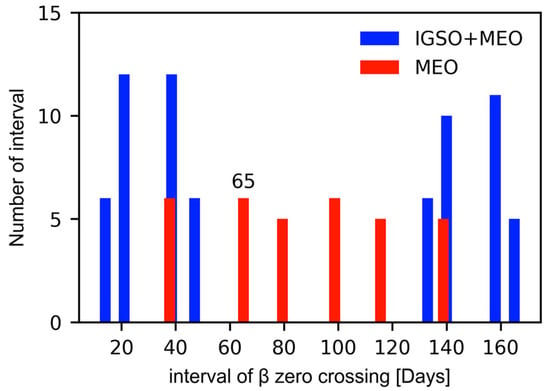
Figure 6.
Histogram of intervals in days between zero-crossing points of consecutive orbital planes from 2019 to 2021, separately for MEO and IGSO + MEO constellations of BDS.
The reliability of GCC-Z could also be reflected by its formal error, which tends to be large for a weakly observed quantity or a poor determination of the parameter [12]. Figure 7 shows formal errors of GCC-Z in the solutions discussed previously. The a posteriori RMS values of unit weight are very close for all solutions, so that a direct comparison of the formal errors is allowed. It can be seen that the formal error of GCC-Z decreases gradually with time, which can be attributed to the increasing number of observations of BDS during this period (illustrated in Figure 2).
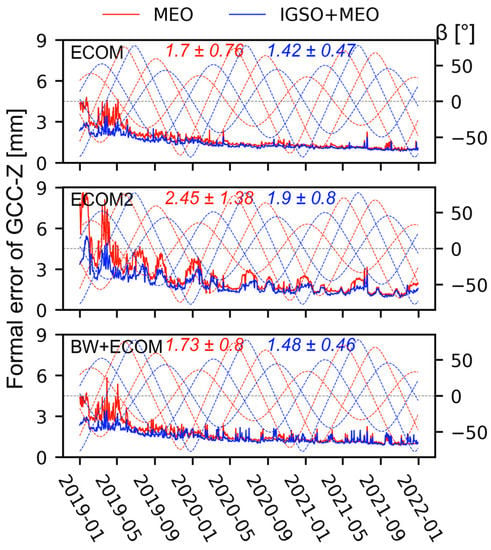
Figure 7.
Time series of formal error of the GCC-Z in mm. The curves denote the sun elevation angles above orbital planes, which are distinguished by two different colors (red for MEO and blue for IGSO).
Among these solutions, the formal error series showed a strong correlation with the angle for the case of ECOM2, which is probably caused by the over-parameterization of periodic terms [38]. When the MEO orbital planes are similarly oriented with regard to the sun, the formal error of GCC-Z will obviously increase. A prominent peak occurs when three MEO orbital planes have similar values of . In comparison, a relatively small peak occurs when only two MEO planes have similar values of unless one of the three MEO planes has a value of close to zero. The same pattern can be distinguished in the ECOM2 solutions for GLONASS and Galileo in the study of Zajdel et al. [38]. Meanwhile, the formal errors of the ECOM and BW + ECOM solutions do not show such patterns.
In comparing the formal errors, we take the average and standard deviation (STD) of formal errors over the 3-year period as evaluation indexes. The inclusion of IGSO satellites decreases the mean formal errors by (16%, 22%, and 14%) and the STDs by (38%, 42%, and 43%) for the ECOM, ECOM2, and BW + ECOM solutions, respectively. Especially for the ECOM2 solution, those peaks related to almost dropped by half after the addition of IGSO satellites.
3.3. Comparison with External Products
As SLR is by far the most robust technique to derive the GCC, the time series of GCC (2019-2021) published by ILRS (International Laser Ranging Service [39]), primarily based on observations to LAGEOS-1/2, is selected as the reference. At the same time, we also compare the results with the GCC products (2019-2021) published by CODE (Center for Orbit Determination in Europe [40]) derived from observations of GPS, GLONASS, and Galileo.
To quantitatively evaluate the reliability of our results, we analyze the annual signals of the resulting GCC series by a least-squares fit of trigonometric functions, written as:
where is the period of signal; is taken as the first day of each year; and and are the amplitude and phase of signal.
Although the 3-year processing time span is too short to distinguish the actual annual signal of GCC-Z from the BDS draconitic signal with a period close to one year, the actual annual signal can be obtained by ILRS solution without the disturbance of the draconitic signal (about 560 days for LAGEOS-1, 222 days for LAGEOS-2). Thus, the spurious part of the annual signal can easily be singled out when the ILRS solution is used as a reference. For the purpose of providing supplementary information, we have also presented the annual GCC results reported by other researchers, including the monthly GCC solution (2002–2010) obtained by Cheng et al. [23] using SLR data to geodetic satellites, and the weekly GCC solution (2002–2009) derived by Wu et al. [41] based on KALREF and GRACE gravity data.
Figure 8 and Table 6 show the amplitudes and phases of annual signals of all solutions in this paper. For a better comparison, a phase shift of 2π has been applied to the phases of the annual signals in GCC-Y/Z for CODE solution, as well as GCC-Z for ILRS, SLR-monthly, and KALREF+GRACE solutions. We found that for these BDS-derived solutions, the difference in SRP modeling and inclusion of IGSO satellites have little impact on the annual signals of the X and Y components of GCC. Compared to the ILRS solution, however, there is an approximate 2 mm amplitude offset in the GCC-X series and an approximate 60 degree phase shift in the GCC-Y series. It may be caused by the different distribution of the ground stations of GNSS and SLR, which has been discussed by Zajdel et al. [19]. For the GCC-Z series, the different solutions show significant differences in annual amplitude and phase. The results of the BW + ECOM model have smaller annual amplitudes than the purely empirical SRP models and are more consistent with the CODE and ILRS solutions.
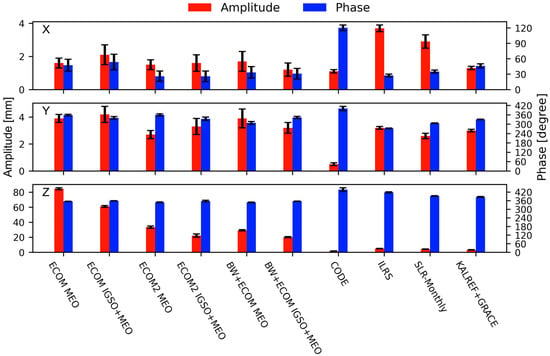
Figure 8.
Annual amplitudes and phases estimated from the time series of GCC.

Table 6.
Annual amplitudes and phases estimated from the time series of GCC [23,41].
Finally, we identified the IGSO + MEO based BW + ECOM solution as the most reliable among all the other solutions. To visualize the achieved results, Figure 9 presents the three geocenter components derived from the IGSO + MEO constellation of BDS using the BW + ECOM model. The bold lines represent the filtered series using the Vondrák filter [42] with a smooth factor of 0.01. It shows that the equatorial X and Y components of GCC are close to the SLR results, which is consistent with the conclusion of others using observations of GPS or GLONASS [11,12,14]. For the Z component, the majority of the spurious signals are largely mitigated. However, a dominant annual signal with an amplitude of 20.2 mm still remains for the BW + ECOM solution. In addition, a distinct 3 cpy signal with the amplitude of 6.1 mm is found in the BW + ECOM solution, which can also be visible for the CODE solution due to the 3-plane constellation characteristics of GLONASS and Galileo.
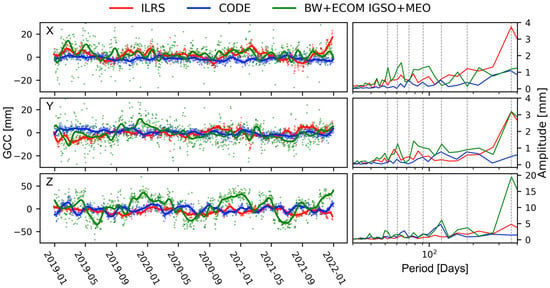
Figure 9.
Time series and power spectra of three components of GCC derived from IGSO + MEO constellation of BDS using the BW + ECOM model. The vertical grey lines denote the harmonics of the year, which are 1, 2, 3, 4, 5, 6, 7 cpy from right to left.
4. Discussion
This study is dedicated to exploring the effects of different SRP modeling and constellation configurations on BDS GCC estimation. Three different SRP models (ECOM, ECOM2, and BW + ECOM) were tested based on the MEO and IGSO+MEO constellation of BDS, respectively. We find that when ECOM2 is applied, there are several peaks in the GCC-Z series visible for the IGSO+MEO solution. The peaks coincide with the epochs when one of the IGSO orbital planes enters eclipsing period. Since the only difference between ECOM and ECOM2 is the addition of second harmonic terms in the D direction, the peaks are potentially caused by the higher order terms during the eclipsing period of the IGSO satellite, which deteriorates the GCC results for BDS. Compared to the purely empirical SRP models (ECOM and ECOM2), the GCC series obtained with the BW + ECOM model are more robust. Using the box-wing model significantly decreases the magnitude of the ECOM parameters (see Figure 4), which is considered beneficial in recovering the geocenter motion from BDS. However, a dominant annual signal with an amplitude of 20.2 mm still remains for the BW + ECOM solution. Some unconsidered physical effects, such as solar sensor bias, solar panel thermal radiation, or satellite body radiator emission, could be the focal point for clarification on this subject. Moreover, the GNSS technique’s intrinsic issues in estimating geocenter coordinates, including its high collinearity with estimated clock bias and troposphere parameters, may impede further reduction of errors identified in the GNSS-derived geocenter Z-component [17].
In addition, the contribution of IGSO satellites for GCC estimation is highlighted in this paper. By incorporating the IGSO satellites into the processing, the spurious signals are effectively attenuated. This is mainly because the IGSO satellites provide more observations, resulting in a reduction in the formal error of the GCC. Moreover, the three additional orbital planes of IGSO enhance the geometric configuration of the BDS, which is beneficial for the GCC estimation.
5. Conclusions
In this study, we presented geocenter coordinates solutions derived from BDS. First, we discussed the impact of different SRP modeling approaches on the GCC-Z estimation. Based on our results, we concluded that the resulting GCC-Z series for the BW + ECOM case has the lowest annual amplitude of 29.3 mm compared to 84.6 mm for the ECOM case and 33.5 mm for the ECOM2 case. Then the contribution of BDS IGSO satellites was studied. We show that the inclusion of IGSO satellites strengthens the geocenter estimation by reducing the effect of MEO-specific orbit characteristic on the GCC results. The amplitudes of the annual signal, 3 cpy signal, and a 7-day periodic system error signal can be reduced by 28–33%, 9–61%, and 32–45% after including IGSO satellites. The formal errors of GCC-Z are also reduced by 14–22%, indicating that the derived GCC-Z estimates are more reliable with the IGSO + MEO hybrid constellation configuration. Finally, we compared all solutions within this paper against external solutions provided by CODE and ILRS. The results show that the annual signals of the equatorial components of GCC are barely affected by the different SRP modeling and the inclusion of IGSO satellites. For the Z components of GCC, the results of the BW + ECOM model exhibit smaller annual amplitudes than the purely empirical SRP models, which are more comparable with the CODE and ILRS solutions. However, a pronounced 3 cpy signal is still found in the BW + ECOM solution, which can also be visible for the CODE solution owing to the 3-plane constellation features of GLONASS and Galileo. Nevertheless, the adoption of the BW + ECOM model and the MEO + IGSO hybrid configuration can reach the best results, which is recommended for BDS to determine the geocenter coordinates.
As a new member of GNSS, BDS has excellent potential for GCC estimation. Considering all BDS satellites are equipped with laser retroreflectors for SLR [43], and nine of them are already tracked by ILRS stations, we plan to add SLR observations of BDS for the GCC estimation. For future geocenter studies, combining BDS together with other GNSS systems is attractive, which may help in reducing the system-specific errors for the GCC estimation. Furthermore, the incorporation of geodetic satellite SLR observations with GNSS is anticipated to improve the realization of the ITRF.
Author Contributions
Conceptualization, X.L. and S.H.; methodology, X.L. and S.H.; software, X.L.; validation, S.H. and Y.Y.; formal analysis, S.H.; investigation, S.H. and Y.Y.; resources, K.Z. and J.L.; data curation, S.H.; writing—original draft preparation, S.H.; writing—review and editing, Y.Y. and J.L.; supervision, K.Z.; project administration, X.L.; funding acquisition, X.L. All authors have read and agreed to the published version of the manuscript.
Funding
This research was funded by the National Key Research and Development Program of China (Grant No. 2021YFB2501102), the National Natural Science Foundation of China (Grant No. 41974027), the Hubei Province Natural Science Foundation (Grant No. 2020CFA002), and the Sino-German mobility program (Grant No. M-0054).
Acknowledgments
We are grateful to the IGS for providing the multi-GNSS observations at the CDDIS website: https://cddis.nasa.gov/archive/gnss/data/ (accessed on 1 January 2023) for free. The ILRS is acknowledged for providing daily GCC products at ftp://edc.dgfi.tum.de/pub/slr/products/pos+eop/ (e.g., /2021/210101/ilrsb.pos+eop.210101.v170.sum.gz for 1 January 2021, accessed on 1 January 2023). The CODE released daily GCC products (XGC_cod_igs.res, YGC_cod_igs.res, and ZGC_cod_igs.res) are publicly available from ftp://igs-rf.ign.fr/pub/gcres/ (accessed on 1 January 2023). The numerical calculations in this paper have been performed on the supercomputing system in the Supercomputing Center of Wuhan University.
Conflicts of Interest
The authors declare no conflict of interest.
Abbreviations
The following abbreviations are used in the text:
| BDS | BeiDou Navigation Satellite System |
| BW + ECOM | A priori Box-Wing Along with the ECOM model |
| CAST | China Academy of Space Technology |
| CDDIS | Crustal Dynamics Data Information System |
| CF | Center-of-Figure |
| CM | Center-of-Mass |
| CODE | Center for Orbit Determination in Europe |
| ECOM | Empirical CODE Orbit Model |
| ECOM2 | Extended ECOM Model |
| GCC | Geocenter Coordinates |
| GEO | Geostationary Earth Orbit |
| GNSS | Global Navigation Satellite System |
| GRACE | Gravity Recovery and Climate Experiment |
| IERS | International Earth Rotation and Reference Systems Service |
| IF | Ionosphere-Free |
| IGS | International GNSS Service |
| IGSO | Inclined Geosynchronous Orbit |
| ILRS | International Laser Ranging Service |
| ITRF | International Terrestrial Reference Frame |
| KALREF | A Kalman Filter and Time Series Approach to the ITRF Realization |
| LAGEOS | Laser Geodynamics Satellite |
| MEO | Medium Earth Orbit |
| NNR | No-Net-Rotation |
| NNT | No-Net-Translation |
| PRN | Pseudo Random Noise Code |
| RMS | Root Mean Square |
| SECM | Shanghai Engineering Center for Microsatellites |
| SLR | Satellite Laser Ranging |
| SRP | Solar Radiation Pressure |
| STD | Standard Deviation |
| ZTD | Zenith Tropospheric Delay |
References
- IERS. IERS Conventions 2010: IERS Technical Note 36; Petit, G., Luzum, B., Eds.; Verlag des Bundesamts für Kartographie und Geodäsie: Frankfurt am Main, Germany, 2011. [Google Scholar]
- Lavallée, D.A.; van Dam, T.; Blewitt, G.; Clarke, P.J. Geocenter motions from GPS: A unified observation model. J. Geophys. Res. Solid Earth 2006, 111, 3784. [Google Scholar] [CrossRef]
- Kang, Z.; Tapley, B.; Chen, J.; Ries, J.; Bettadpur, S. Geocenter variations derived from GPS tracking of the GRACE satellites. J. Geod. 2009, 83, 895–901. [Google Scholar] [CrossRef]
- Blewitt, G.; Lavallée, D.; Clarke, P.; Nurutdinov, K. A New Global Mode of Earth Deformation: Seasonal Cycle Detected. Science 2001, 294, 2342–2345. [Google Scholar] [CrossRef] [PubMed]
- Wu, X.; Ray, J.; van Dam, T. Geocenter motion and its geodetic and geophysical implications. J. Geodyn. 2012, 58, 44–61. [Google Scholar] [CrossRef]
- Zannat, U.J.; Tregoning, P. Estimating network effect in geocenter motion: Theory. J. Geophys. Res. Solid Earth 2017, 122, 8360–8375. [Google Scholar] [CrossRef]
- Kosek, W.; Popiński, W.; Wnęk, A.; Sośnica, K.; Zbylut-Górska, M. Analysis of Systematic Errors in Geocenter Coordinates Determined From GNSS, SLR, DORIS, and GRACE. Pure Appl. Geophys. 2020, 177, 867–888. [Google Scholar] [CrossRef]
- Mendes, V.B.; Pavlis, E.C. High-accuracy zenith delay prediction at optical wavelengths. Geophys. Res. Lett. 2004, 31, 308. [Google Scholar] [CrossRef]
- Spatar, C.B.; Moore, P.; Clarke, P.J. Collinearity assessment of geocentre coordinates derived from multi-satellite SLR data. J. Geod. 2015, 89, 1197–1216. [Google Scholar] [CrossRef]
- Sośnica, K.; Thaller, D.; Dach, R.; Jäggi, A.; Beutler, G. Impact of loading displacements on SLR-derived parameters and on the consistency between GNSS and SLR results. J. Geod. 2013, 87, 751–769. [Google Scholar] [CrossRef]
- Arnold, D.; Meindl, M.; Beutler, G.; Dach, R.; Schaer, S.; Lutz, S.; Prange, L.; Sośnica, K.; Mervart, L.; Jäggi, A. CODE’s new solar radiation pressure model for GNSS orbit determination. J. Geod. 2015, 89, 775–791. [Google Scholar] [CrossRef]
- Kuang, D.; Bar-Sever, Y.; Haines, B. Analysis of orbital configurations for geocenter determination with GPS and low-Earth orbiters. J. Geod. 2015, 89, 471–481. [Google Scholar] [CrossRef]
- Meindl, M.; Beutler, G.; Thaller, D.; Dach, R.; Jäggi, A. Geocenter coordinates estimated from GNSS data as viewed by perturbation theory. Adv. Space Res. 2013, 51, 1047–1064. [Google Scholar] [CrossRef]
- Rebischung, P.; Altamimi, Z.; Springer, T. A collinearity diagnosis of the GNSS geocenter determination. J. Geod. 2014, 88, 65–85. [Google Scholar] [CrossRef]
- Hugentobler, U.; Van der Marel, H.; Springer, T. Identification and mitigation of GNSS errors. In Proceedings of the IGS 2006 Workshop, Darmstadt, Gemany, 8–12 May 2006. [Google Scholar]
- Bury, G.; Zajdel, R.; Sośnica, K. Accounting for perturbing forces acting on Galileo using a box-wing model. GPS Solut. 2019, 23, 74. [Google Scholar] [CrossRef]
- Rodriguez-Solano, C.J.; Hugentobler, U.; Steigenberger, P.; Bloßfeld, M.; Fritsche, M. Reducing the draconitic errors in GNSS geodetic products. J. Geod. 2014, 88, 559–574. [Google Scholar] [CrossRef]
- Lutz, S.; Meindl, M.; Steigenberger, P.; Beutler, G.; Sośnica, K.; Schaer, S.; Dach, R.; Arnold, D.; Thaller, D.; Jäggi, A. Impact of the arc length on GNSS analysis results. J. Geod. 2016, 90, 365–378. [Google Scholar] [CrossRef]
- Zajdel, R.; Sośnica, K.; Dach, R.; Bury, G.; Prange, L.; Jäggi, A. Network Effects and Handling of the Geocenter Motion in Multi-GNSS Processing. J. Geophys. Res. Solid Earth 2019, 124, 5970–5989. [Google Scholar] [CrossRef]
- Zhao, Q.; Guo, J.; Wang, C.; Lyu, Y.; Xu, X.; Yang, C.; Li, J. Precise orbit determination for BDS satellites. Satell. Navig. 2022, 3, 2. [Google Scholar] [CrossRef]
- Fritsche, M.; Dietrich, R.; Rülke, A.; Rothacher, M.; Steigenberger, P. Low-degree earth deformation from reprocessed GPS observations. GPS Solut. 2010, 14, 165–175. [Google Scholar] [CrossRef]
- Dong, D.; Yunck, T.; Heflin, M. Origin of the International Terrestrial Reference Frame. J. Geophys. Res. Solid Earth 2003, 108, 2035. [Google Scholar] [CrossRef]
- Cheng, M.K.; Ries, J.C.; Tapley, B.D. Geocenter Variations from Analysis of SLR Data. In Proceedings of the Reference Frames for Applications in Geosciences, Berlin/Heidelberg, Germany, 4–8 October 2010; Springer: Berlin/Heidelberg, Germany; pp. 19–25. [Google Scholar]
- Li, X.; Yuan, Y.; Zhu, Y.; Huang, J.; Wu, J.; Xiong, Y.; Zhang, X.; Li, X. Precise orbit determination for BDS3 experimental satellites using iGMAS and MGEX tracking networks. J. Geod. 2019, 93, 103–117. [Google Scholar] [CrossRef]
- Li, X.; Zhang, X.; Ge, M. Regional reference network augmented precise point positioning for instantaneous ambiguity resolution. J. Geod. 2011, 85, 151–158. [Google Scholar] [CrossRef]
- Johnston, G.; Riddell, A.; Hausler, G. The International GNSS Service. In Springer Handbook of Global Navigation Satellite Systems; Teunissen, P.J.G., Montenbruck, O., Eds.; Springer International Publishing: Cham, Switzerland, 2017; pp. 967–982. [Google Scholar]
- Li, X.; Han, X.; Li, X.; Liu, G.; Feng, G.; Wang, B.; Zheng, H. GREAT-UPD: An open-source software for uncalibrated phase delay estimation based on multi-GNSS and multi-frequency observations. GPS Solut. 2021, 25, 66. [Google Scholar] [CrossRef]
- Li, X.; Zhang, H.; Zhang, K.; Yuan, Y.; Zhang, W.; Qin, Y. Earth Rotation Parameters Estimation Using GPS and SLR Measurements to Multiple LEO Satellites. Remote Sens. 2021, 13, 3046. [Google Scholar] [CrossRef]
- Li, X.; Wang, Q.; Wu, J.; Yuan, Y.; Xiong, Y.; Gong, X.; Wu, Z. Multi-GNSS products and services at iGMAS Wuhan Innovation Application Center: Strategy and evaluation. Satell. Navig. 2022, 3, 20. [Google Scholar] [CrossRef]
- Standish, E.M. JPL Planetary and Lunar Ephemerides, DE405/LE405. Interoffice Memorandum: JPL IOM 312.F-98-048, 26 August 1998. Available online: https://ssd.jpl.nasa.gov/ftp/eph/planets/ioms/de405.iom.pdf (accessed on 1 January 2023).
- Lyard, F.; Allain, D.; Cancet, M.; Carrere, L.; Picot, N. FES2014 global ocean tide atlas: Design and performance. Ocean Sci. 2021, 17, 615–649. [Google Scholar] [CrossRef]
- Rebischung, P.; Altamimi, Z.; Ray, J.; Garayt, B. The IGS contribution to ITRF2014. J. Geod. 2016, 90, 611–630. [Google Scholar] [CrossRef]
- Saastamoinen, J. Atmospheric Correction for the Troposphere and Stratosphere in Radio Ranging Satellites. In The Use of Artificial Satellites for Geodesy; Geophysical Monograph Series; North Holland Publishing Co.: Amsterdam, The Netherlands, 1972; pp. 247–251. [Google Scholar]
- Springer, T.A.; Beutler, G.; Rothacher, M. Improving the orbit estimates of GPS satellites. J. Geod. 1999, 73, 147–157. [Google Scholar] [CrossRef]
- Milani, A.; Nobili, A.M.; Farinella, P. Non-Gravitational Perturbations and Satellite Geodesy; Taylor & Francis Ltd.: London, UK, 1987. [Google Scholar]
- Fliegel, H.F.; Gallini, T.E.; Swift, E.R. Global Positioning System Radiation Force Model for geodetic applications. J. Geophys. Res. Solid Earth 1992, 97, 559–568. [Google Scholar] [CrossRef]
- Duan, B.; Hugentobler, U.; Selmke, I.; Marz, S.; Killian, M.; Rott, M. BeiDou Satellite Radiation Force Models for Precise Orbit Determination and Geodetic Applications. IEEE Trans. Aerosp. Electron. Syst. 2022, 58, 2823–2836. [Google Scholar] [CrossRef]
- Zajdel, R.; Sośnica, K.; Bury, G. Geocenter coordinates derived from multi-GNSS: A look into the role of solar radiation pressure modeling. GPS Solut. 2020, 25, 1. [Google Scholar] [CrossRef]
- Pearlman, M.R.; Noll, C.E.; Pavlis, E.C.; Lemoine, F.G.; Combrink, L.; Degnan, J.J.; Kirchner, G.; Schreiber, U. The ILRS: Approaching 20 years and planning for the future. J. Geod. 2019, 93, 2161–2180. [Google Scholar] [CrossRef]
- Dach, R.; Schaer, S.; Arnold, D.; Orliac, E.; Prange, L.; Sidorov, S.; Sušnik, A.; Villiger, A.; Mervarta, L.; Jäggi, A.J.I.C.B. Center for Orbit Determination in Europe (CODE) Technical Report 2016; University of Bern: Bern, Switzerland, 2019; p. 27. [Google Scholar]
- Wu, X.; Kusche, J.; Landerer, F.W. A new unified approach to determine geocentre motion using space geodetic and GRACE gravity data. Geophys. J. Int. 2017, 209, 1398–1402. [Google Scholar] [CrossRef]
- Vondrák, J. A contribution to the problem of smoothing observational data. BAICz 1969, 20, 349. [Google Scholar]
- Yang, H.; Xu, T.; Nie, W.; Gao, F.; Guan, M. Precise Orbit Determination of BDS-2 and BDS-3 Using SLR. Remote Sens. 2019, 11, 2735. [Google Scholar] [CrossRef]
Disclaimer/Publisher’s Note: The statements, opinions and data contained in all publications are solely those of the individual author(s) and contributor(s) and not of MDPI and/or the editor(s). MDPI and/or the editor(s) disclaim responsibility for any injury to people or property resulting from any ideas, methods, instructions or products referred to in the content. |
© 2023 by the authors. Licensee MDPI, Basel, Switzerland. This article is an open access article distributed under the terms and conditions of the Creative Commons Attribution (CC BY) license (https://creativecommons.org/licenses/by/4.0/).