Article

A Robust Stepwise Clustering Approach to Detect Individual Trees in Temperate Hardwood Plantations using Airborne LiDAR Data

1
Libraries and School of Information Studies, Purdue University, West Lafayette, IN 47907, USA
2
Forestry and Natural Resources, Purdue University, West Lafayette, IN 47907, USA
*
Author to whom correspondence should be addressed.
Remote Sens. 2023, 15(5), 1241; https://doi.org/10.3390/rs15051241
Submission received: 23 December 2022 / Revised: 4 February 2023 / Accepted: 22 February 2023 / Published: 23 February 2023

Abstract

:
Precise tree inventory plays a critical role in sustainable forest planting, restoration, and management. LiDAR-based individual tree detection algorithms often focus on finding individual treetops to discern tree positions. However, deliquescent tree forms (broad, flattened crowns) in deciduous forests can make these algorithms ineffective. In this study, we propose a stepwise tree detection approach, by first identifying individual trees using horizontal point density and then analyzing their vertical structure profiles. We first project LiDAR data onto a 2D horizontal plane and apply mean shift clustering to generate candidate tree clusters. Next, we apply a series of structure analyses on the vertical phase, to overcome local variations in crown size and tree density. This study demonstrates that the horizontal point density of LiDAR data provides critical information to locate and isolate individual trees in temperate hardwood plantations with varied densities, while vertical structure profiles can identify spreading branches and reconstruct deliquescent crowns. One challenge of applying mean shift clustering is training a dynamic search kernel to identify trees of different sizes, which usually requires a large number of field measurements. The stepwise approach proposed in this study demonstrated robustness when using a constant kernel in clustering, making it an efficient tool for large-scale analysis. This stepwise approach was designed for quantifying temperate hardwood plantation inventories using relatively low-density airborne LiDAR, and it has potential applications for monitoring large-scale plantation forests. Further research is needed to adapt this method to natural stands with diverse tree ages and structures.

1. Introduction

Airborne light detection and ranging (LiDAR) has become an important tool in remote sensing for forest inventory, particularly for detecting individual trees and extracting their characteristics, such as tree height, crown diameter, diameter at breast height (DBH), and stem volume [1,2,3,4,5]. These characteristics are useful for various applications, including estimating aboveground biomass [6,7], assessing wildlife biodiversity and habitats [8], modeling forest ecosystems [9,10], and monitoring biological and biogeochemical processes at broad spatial levels [11]. While LiDAR-based approaches for detecting individual trees often focus on finding treetops to allocate tree positions. This approach works well for trees with an excurrent branching habit (conical crowns) (e.g., coniferous in boreal forests) [12], but it is not as effective for temperate hardwood forests dominated by trees with deliquescent forms (cylindrical, broad flattened crowns) (Figure 1) [13]. As a result, alternative approaches for detecting hardwood trees are needed.
There are several methodologies for detecting individual trees in remotely sensed data, which can be broadly categorized into raster-based classification [1,12,13,14] and point-cloud-based clustering [14,15,16]. The raster-based classifications are mainly based on two-dimensional (2D) image processing algorithms [17]. Individual trees are typically identified using local maxima detection [12], edge detection [18], watershed segmentation [19,20], region growth segmentation [21], and object-based image analysis [15]. Local maxima detection is a kernel approach that uses moving windows to search treetops and identify individual trees. Popescu et al. [22] applied variable-sized moving windows to detect individual trees in a mixed conifer and hardwood forest in Virginia, USA. Edge detection is an image processing method that isolates individual trees by finding and delineating crown edges. Li et al. [23] applied convolutional neural network-based edge detection to delineate subtropical plantations in southern China. Watershed segmentation is another widely used image processing algorithm that separates individual tree canopies using image morphology operations. It has advantages in isolating canopy trees and delineating individual tree crowns. Hu et al. [24] designed a multi-scaled watershed segmentation to delineate tree crowns in a boreal forest in Ontario, Canada. Duncanson [3] designed a multi-layered watershed segmentation to delineate tree crowns in both the overstory and understory in multiple forest sites of U.S. temperate forests. Tang et al. [25] applied marker-controlled watershed segmentation to high-density unmanned aerial vehicle (UAV) data, to isolate individual trees and monitor tree growth in Guangxi, China. Other algorithms such as region growth and object-based image analysis have been studied in previous research but are often used in combination with other techniques to achieve accurate tree detection outcomes. For example, Gleason and Im [26] integrated local maxima filtering, object recognition, and hill climbing methods to delineate even-aged Norway spruce (Picea abies) in New York, USA.
Point-cloud-based clustering methods offer the potential to fully utilize LiDAR data in a 3D space [27], thereby improving the capability to extract individual tree information in temperate hardwood forests. These algorithms group the 3D LiDAR data into clusters that correspond to individual trees by utilizing techniques such as density-based, centroid-based, or hierarchical clustering. Morsdorf et al. [28] used this approach by applying k-means clustering to detect individual trees in boreal pine (Pinus spp.) forests in the Ofenpass valley, Switzerland. Reitberger et al. [29] and Yao et al. [16] demonstrated the application of normalized cut segmentation, a spectral clustering approach to deal with uneven-sized clusters, to detect small crowns under the canopy surface in boreal forests in Germany. Lee et al. [30] developed an adaptive supervised clustering approach to identify tree crowns in pine forests in Florida, USA. Li et al. [31] and Jakubowski et al. [15] employed a geometric approach, largely based on the spacing between the tops of tree to segment the LiDAR points into individual conifer trees in California, USA. These point-cloud-based approaches can enhance the ability to extract detailed information about individual trees compared with raster-based classification methods.
Kaartinen et al. [12] reviewed and compared 33 algorithms for individual tree detection and found that the point-cloud-based algorithms outperformed raster-based algorithms in detection accuracy. Point-cloud-based techniques for individual tree detection typically require high-density airborne LiDAR data, which can be costly to acquire and may have limited spatial coverage. Raster-based techniques, on the other hand, can use well-established computer vision and image processing algorithms and are more computationally efficient, but they lack the 3D spatial information and vertical structure information that is essential for tree detection.
LiDAR data can be collected from different platforms, including airborne, UAV, and terrestrial. The choice of platform can impact the performance of individual tree detection, as each platform may result in different point densities and scan patterns of LiDAR data. Airborne systems collect data from maned aircraft and provide LiDAR point clouds over large areas. The point density of airborne systems varies based on the senor used and the elevation of the aircraft. Some systems collect airborne LiDAR with a point density less than 1 pts/m2 [32], while others collect data with a point density over 20 pts/m2 [33]. For individual tree detection, Kaartinen et al. [12] recommended airborne LiDAR with a point density of more than 2 pts/m2. UAV systems are flexible and cost-effective alternatives to airborne LiDAR. Drones are flown over the study area at local scale and collect high-density LiDAR, providing detailed information on individual trees in a small area [34]. Terrestrial systems gather high-density LiDAR data by scanning tree stems from close range on the ground, making them ideal for local stand-level tree inventory and in-depth tree structure analysis [35]. Numerous studies have compared lidar platforms for individual tree detection [36,37,38]. Overall, airborne LiDAR systems offer broad spatial coverage and are best for detecting individual trees at regional or larger scale. UAV and terrestrial systems, on the other hand, provide more precise tree information in a smaller area and are suitable for local-scale forest inventory and multi-temporal analysis, because of their flexibility.
In this study, we focused on airborne LiDAR systems and proposed and evaluated a stepwise approach that projects 3D LiDAR data onto 2D horizontal and vertical phases for analysis. This approach leverages a horizontal point density distribution to locate individual trees (Figure 1), followed by vertical structure analysis for reconstructing tree canopies and extracting relevant features. This approach preserves 3D spatial information through a stepwise process of 2D operations, allowing for a balance between the accuracy of point-cloud-based algorithms and the computational efficiency of the raster-based methods.

2. Data and Methods

2.1. Study Area

This study was conducted on data acquired from northern red oak (Quercus rubra) and black walnut (Juglans nigra) plantations located in the Martell Forest, West Lafayette, Indiana, USA ( 40 ° 26 N , 87 ° 2 W ). This property, managed by the Department of Forestry and Natural Resources at Purdue University, contains 193 ha of natural hardwood forests and plantations. The northern red oak and black walnut stands were established between 1962 and 1964 and cover areas of 1.1 and 0.9 ha, respectively. Both stands were initially planted at constant spacing, but natural mortality and thinning management have resulted in variable crown sizes and uneven spacing in both stands (Figure 2, more details in Section 2.2. Field data).

2.2. Field Data

The northern red oak stand was stem-mapped in 2013 and georegistered using a portable Differential global positioning system (DGPS) assisted by leaf-on and leaf-off aerial photos. DBH of sampled trees was measured with a DBH tape in 2013 and tree heights were measured using a Swedish Haglöf Vertex IV Hypsometer in October 2015. The northern red oak stand was split into 96 square blocks with an average area of 100 m2; among which, 10 blocks without stems were excluded from this study (the yellow-colored blocks in Figure 2). The tree densities in the remaining 86 blocks varied between 100 and 1200 trees per hectare (TPH), with an average of 568 TPH. In the black walnut stand, a stem map, tree heights, and DBH were all measured in February 2014. The black walnut stand was split into 7 blocks with unequal areas, ranging from 900 to 1500 m2. Tree density of blocks in the black walnut stand varied between 115 and 232 TPH, with an average of 161 TPH. The validation procedures using field data are discussed in detail in Section 2.5.

2.3. LiDAR Data and Pre-Processing

LiDAR data were obtained from the Indiana Statewide LiDAR program [39] and collected during the leaf-off season in 2013 using an Airborne Optech Gemini LiDAR system (ALS50). This sensor collected up to 4 returns per pulse with a 99 kHz pulse repetition rate, flying at the above ground level (AGL) of 2000 m, with a scan angle of 40 degrees and a 35.8 Hz scan frequency. The swath width was 1731 m, and the distance between flight lines was 1211 m. The average point density in the study area was approximately 2.3 pts/m2, which is considered a relatively low-density airborne dataset for individual tree detection according to previous studies by Kaartinen et al. [12] and Vastaranta et al. [40].
Preprocessing was required to extract the above-ground height information of each point and eliminate ground points and outliers [41]. First, a digital elevation model (DEM) with a pixel resolution of 1 m was generated using classified ground points in the raw dataset. Second, the above-ground height of each point was calculated by subtracting their Z coordinate value from the corresponding DEM value [42]. Points with an above-ground height less than 0.5 m were then removed from the dataset, to reduce the effects of ground points on the tree detection algorithm. Finally, points with an above-ground height greater than three standard deviations of the mean point height were eliminated as outliers.

2.4. Stepwise Tree Detection Approach

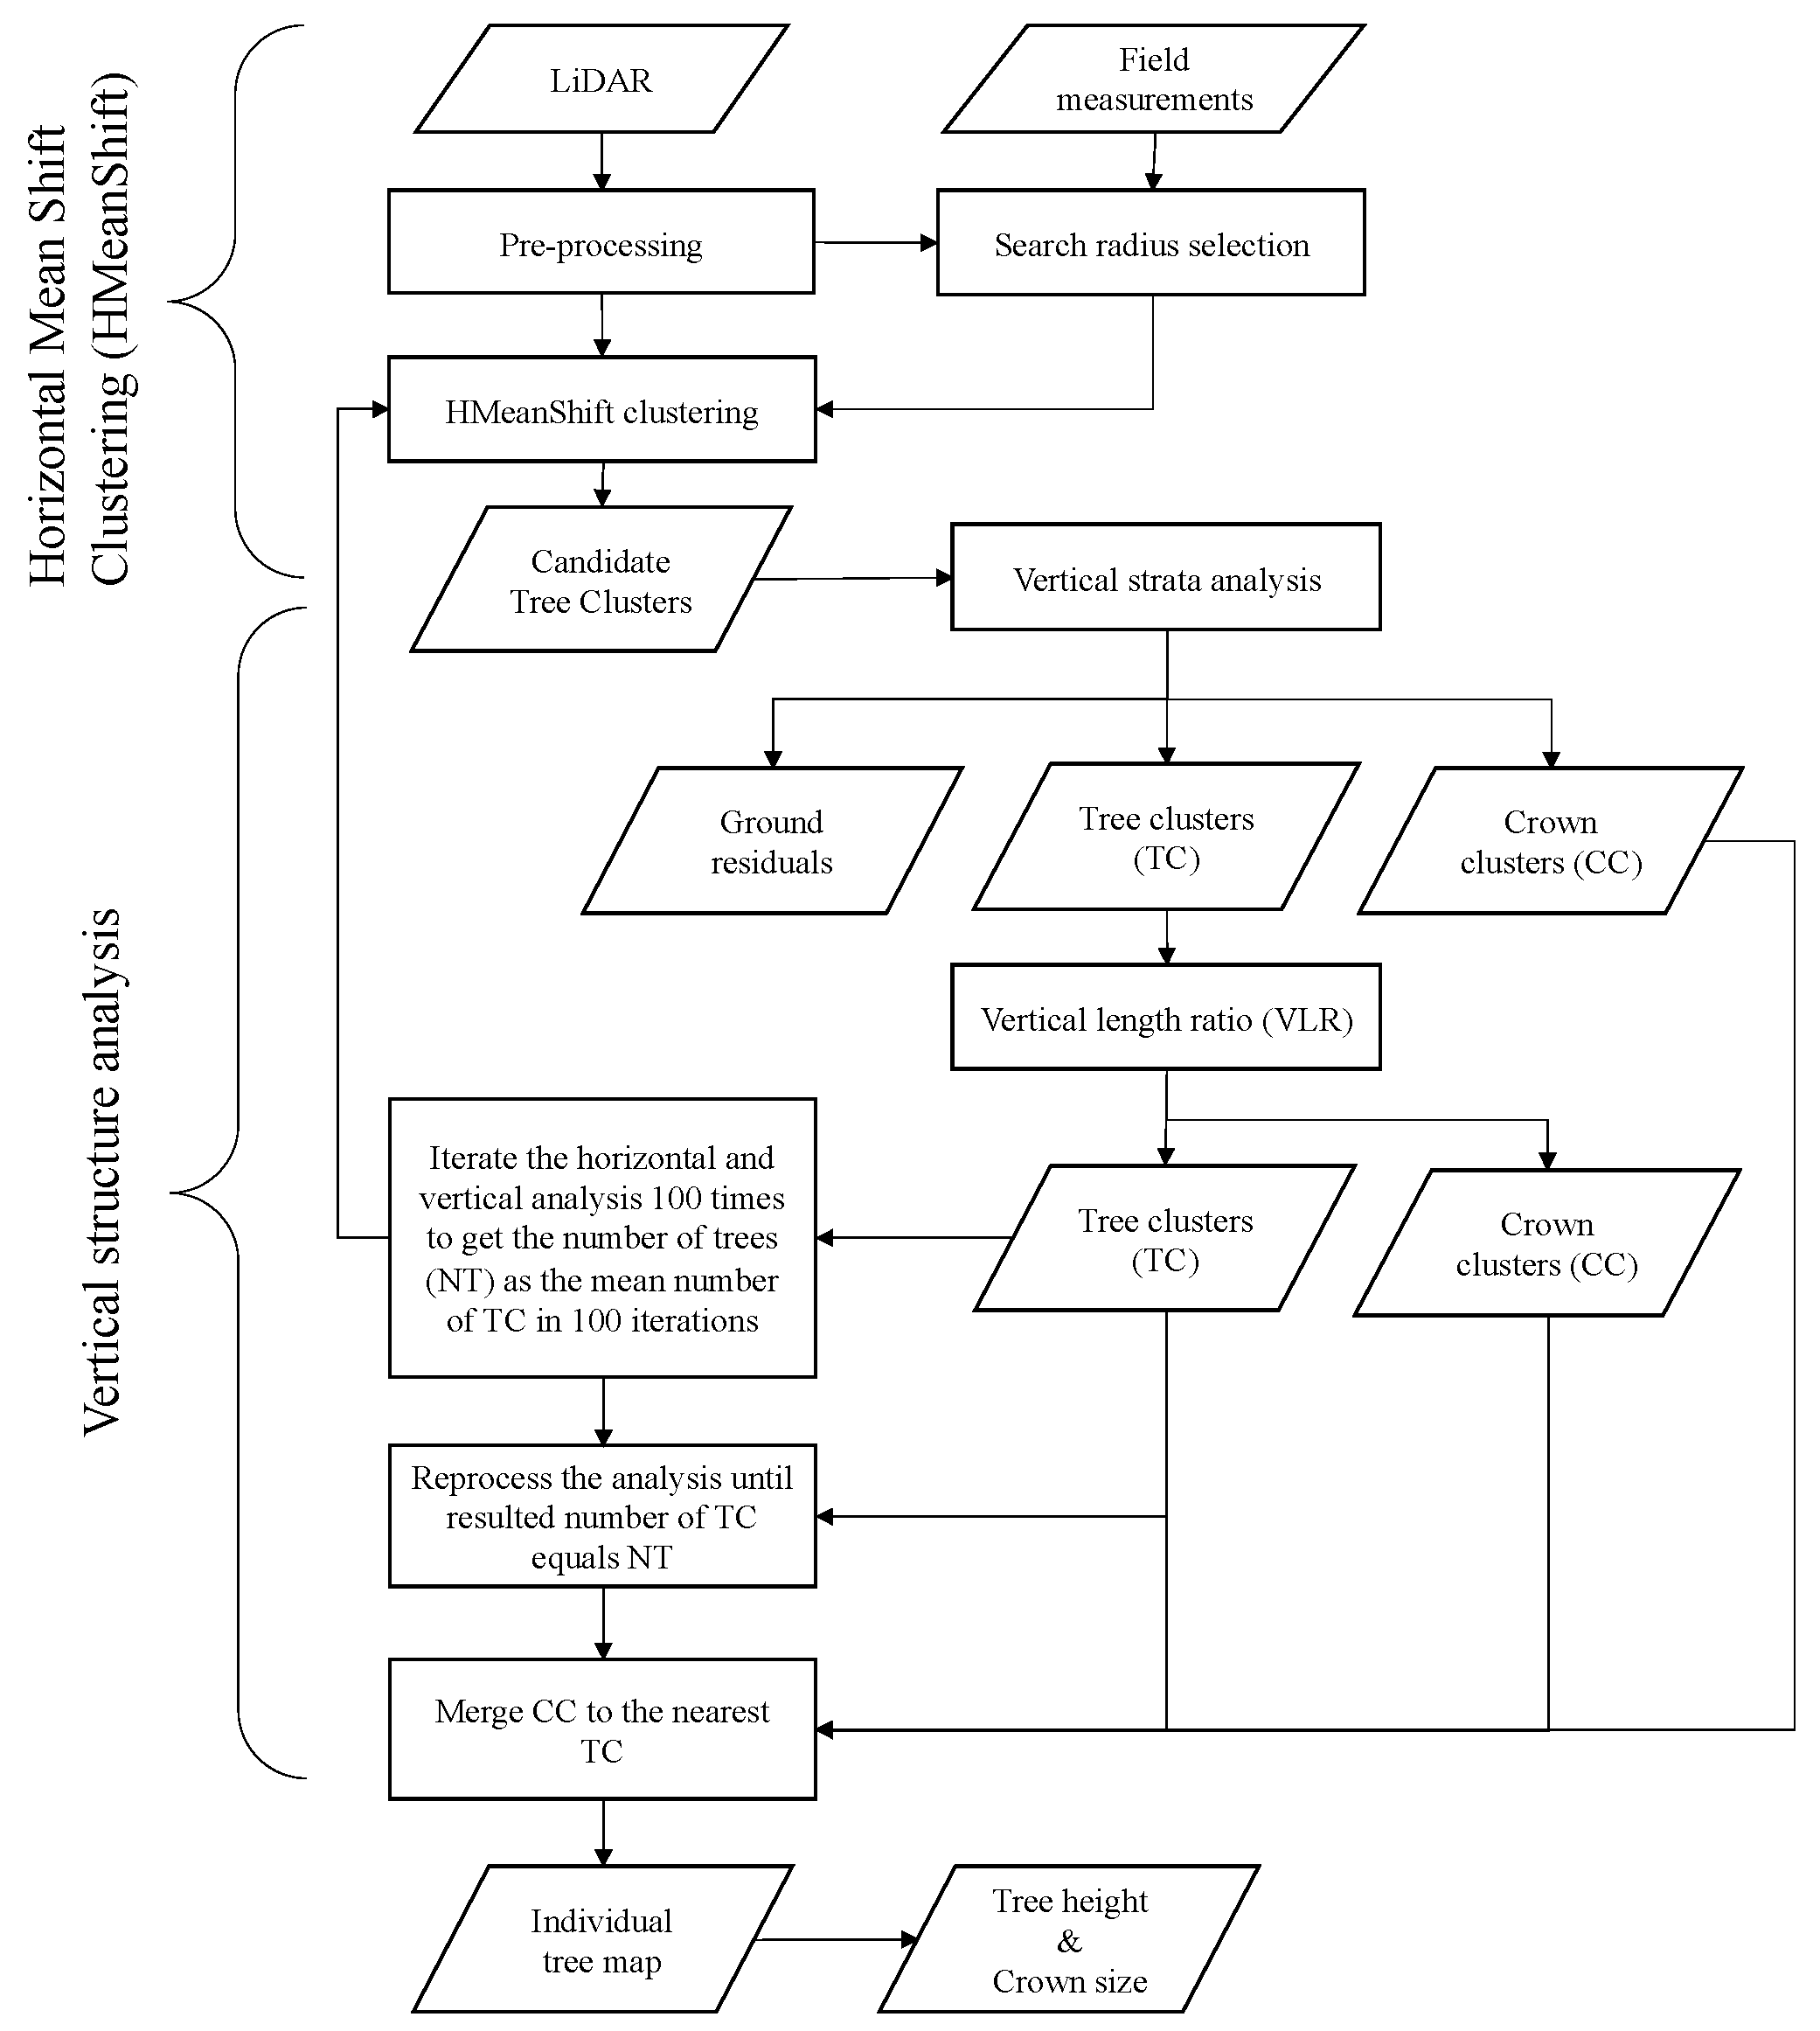
The stepwise tree detection approach analyzes LiDAR point cloud data in two phases: a horizontal phase, and a vertical phase (Figure 3). In the horizontal phase, a machine learning algorithm called horizontal mean shift clustering (HMeanShift) is used to locate individual hardwood tree positions by analyzing the distribution of LiDAR point density. This is based on the assumption that the point density is higher at the center of a tree crown than at the edges of the crown [41]. In the vertical phase, a series of vertical structure analysis techniques are applied to verify each tree cluster and extract tree attributes. HMeanShift clustering provides a unique approach to tree detection that relies on the horizontal point distribution rather than the traditional method of finding treetops. Vertical structure analysis is a post-processing step that merges spreading branches with the main crown and reconstructs deliquescent canopies. This enables the stepwise approach to effectively detect trees with flat, deliquescent crowns, which are often difficult to identify using traditional methods.

2.4.1. HMeanShift Clustering

Mean shift clustering (MeanShift) is a nonparametric machine learning algorithm that defines local maxima using a density function of the given samples [43]. Using mean shift clustering, individual trees are located as mean density centers instead of finding treetops. Traditionally, MeamShift has been used for image processing and segmentation [44]. Recently, it has been shown to have the potential to segment point clouds of LiDAR data, for individual tree detection [14]. Given n data points X i ,   i = 1 , ,   n on a d -dimensional space R d , the probability density function of X is:
f X = 1 nh d i = 1 n K   X   X i h
where h is the radius of the kernel, K X is the kernel function, which satisfies K X =   c k , d k X 2 , where c k , d is a scaling value to assure K X will integrate to one. Setting g s =   k   s and G X =   c g , d g X 2 , the density gradient estimator can be written as
f X = 2 nh d + 2 i = 1 n G X   X i h   m h X
where
m h X = i = 1 n X i g X   X i h 2 i = 1 n g X   X i h 2 X
is the mean shift vector. Then, the iterative mean shift procedure at step t can be written as
X t + 1 =   X t +   m h   X t
Both 2D and 3D MeanShift are available for LiDAR-based individual tree detection. In this study, 2D horizontal MeanShift (HMeanShift) was employed because 3D MeanShift usually focuses on tree crowns, ignoring/removing the stem LiDAR points in the analysis. Stem LiDAR points may provide critical information for individual deciduous tree detection, particularly when utilizing low-density LiDAR data for tree detection. Additionally, HMeanShift reduces the data dimensionality and improves the computational efficiency.

2.4.2. HMeanShift Search Kernel Selection

Selection of the search kernel size is an important aspect of HMeanShift, as it is the only parameter in the model and can have a direct impact on the detection results. Previous research has suggested the use of varied or dynamic search kernels, to detect crowns of different sizes in 3D MeanShift [14]. However, defining the appropriate dynamic search kernel can be challenging, as it requires in-depth knowledge of the forest’s structural characteristics and may need to be adjusted for different forest stands. In this study, we investigated the effects of both constant and dynamic search kernels on our proposed stepwise tree detection approach.
A constant kernel utilizes a fix-sized searching window in mean shift clustering, while a dynamic kernel applies different sized searching windows based on the tree density. In this study, the constant kernel was set based on the average stem spacing of sampled trees in each stand. The dynamic kernel was calculated with the LiDAR metrics of each block (86 blocks in the northern red oak stand and 7 blocks in the black walnut stand). In the northern red oak stand, every block was similar in size but with different tree numbers and stem allocations. The dynamic kernel was set based on the canopy coverage and the “pseudo” tree number of each block. Canopy coverage can be directly calculated using a LiDAR-derived canopy gap fraction Equation (5). The “pseudo” tree numbers were simulated using selected LiDAR metrics. First, half of the blocks were randomly selected as training samples for “pseudo” tree number training. Then, linear regression was applied between the observed tree number and the LiDAR metrics, to calculate the pairwise correlation (Figure S1). The LiDAR metrics used in this study included average point density, canopy gap fraction, and the maximum and mean height in each block. Then, the average point density and mean height metrics were selected as predictors to estimate the tree numbers in each block, due to their high correlation with tree numbers and low correlation between each other (Figure S1). Finally, the radiuses of the dynamic kernel were estimated using the following equation:
Radius = e * A * 1 Gap π * NT 1 2 NT = a     MeanH b     PtsD + c
where A is the area of the block, Gap is the canopy gap fraction; NT is the pseudo tree number; MeanH is the block mean height; PtsD is the block average point density; and a, b, c, and e are the constant factors. A similar procedure was applied in the black walnut stands. As there was no significant variation in the stem spacing in the black walnut stand, we only split the stand into 7 blocks and randomly selected 4 blocks to train the varying kernel radius.

2.4.3. Vertical Structure Analysis

Vertical structure analysis was used to address the issues of over- or under-estimation in HMeanShift clusters. Due to the variable size of the deliquescent crowns, HMeanShift may split a single large tree into one tree cluster and several crown clusters. In addition, ground residuals (e.g., tree snags) under tree canopies or in open areas may be wrongly identified as tree clusters, impacting the accuracy of individual tree detection. To address these challenges, we proposed two vertical analyses: vertical strata analysis, and vertical length ratio.
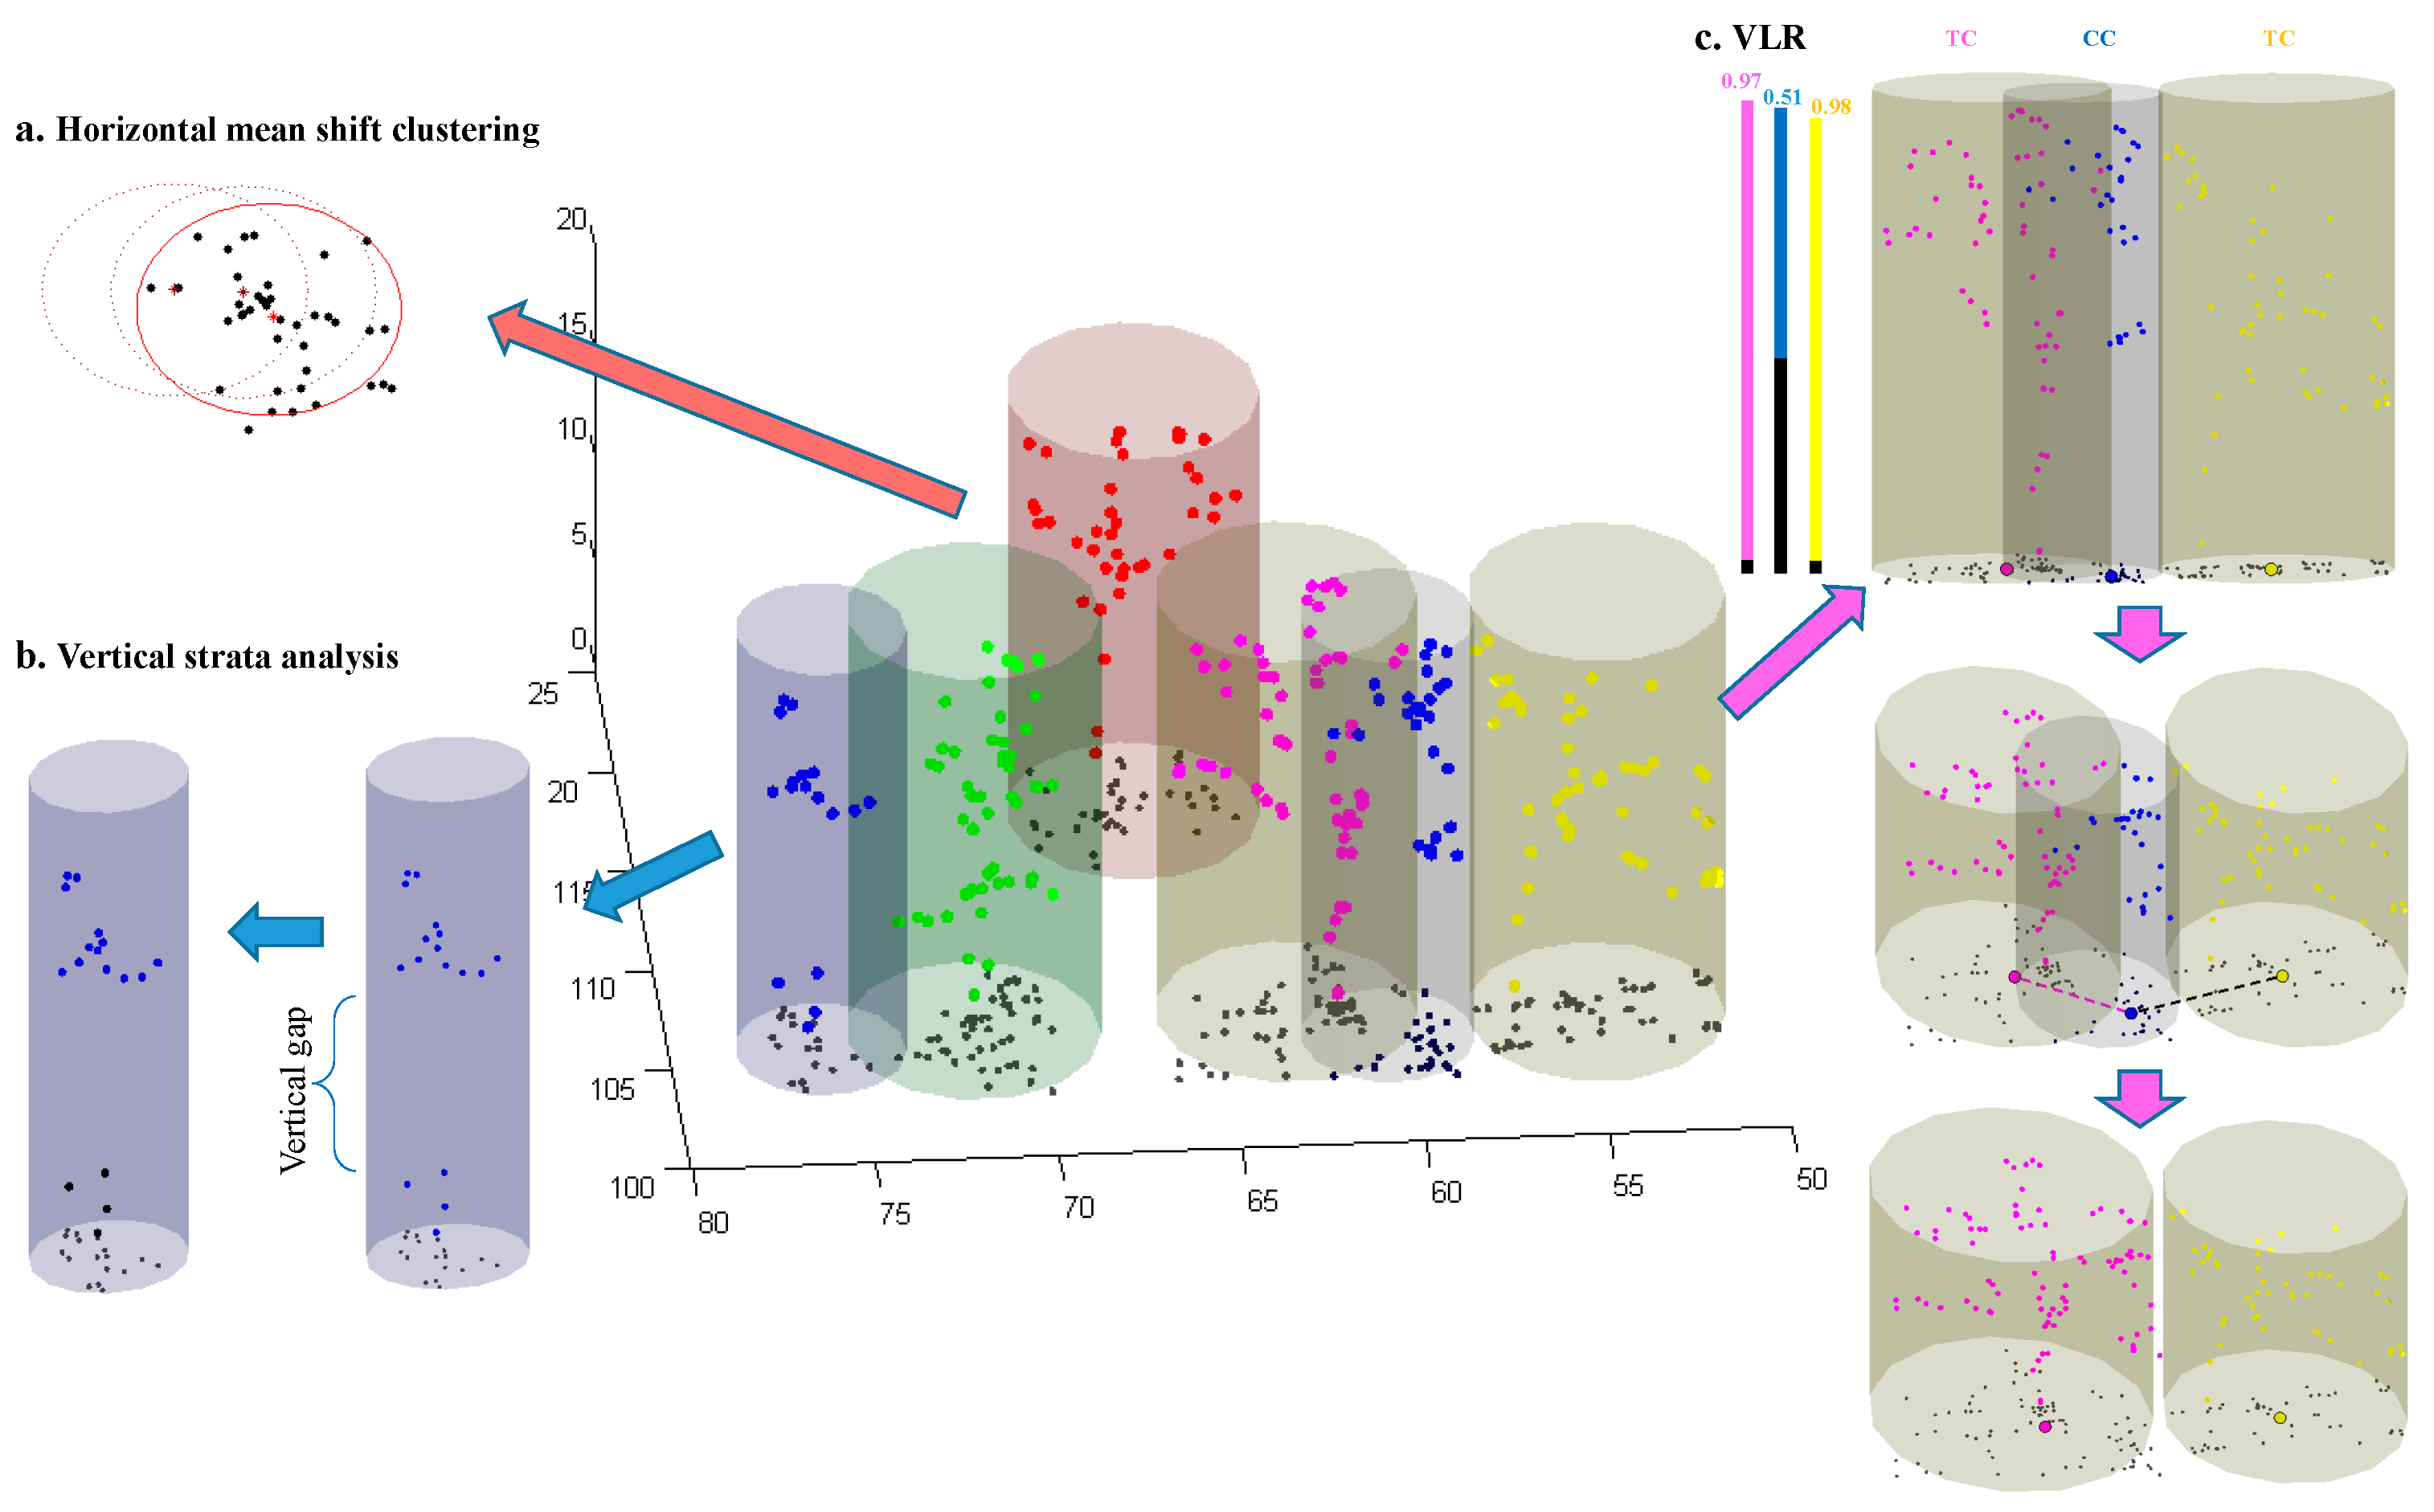
Vertical strata analysis involves analyzing the profile of the LiDAR point cloud, to identify vertical gaps in tree candidate clusters. In this study, we focused on single-layered plantation stands and used vertical strata analysis to find clusters with parts of canopy crowns and the ground residuals underneath (as shown in Figure 4). We defined a vertical gap as an opening in the vertical profile that was greater than 30% of the cluster’s maximum height. This 30% threshold was defined based on the stand structure and LiDAR data used in this study and may need to be fine-tuned when being applied to other forest stands. LiDAR points above the vertical gap were marked as crown points, while those below the gap were removed as ground residuals.
Following the vertical strata analysis, we checked the vertical length ratio (VLR) of the remaining tree candidate clusters, to distinguish crown clusters from tree clusters using stem information. The VLR was defined using the following equation:
VLR = H max H min H max
where Hmax and Hmin are the maximum and minimum heights of the cluster, respectively. High VLR clusters were assigned as tree clusters because they included information about both the crown and stem. In contrast, clusters with lower values were assigned as crown clusters containing only crown information. In this study, the cut-off threshold was set as 0.7, which was the average of the sampled live crown ratios in the study area.

2.4.4. Clustering Optimization and Individual Tree Parameter Estimation

As a nonparametric learning approach, HMeanShift is highly flexible and can capture the diverse characteristics of individual trees. However, this flexibility can also result in inconsistent tree density estimations across classifications, due to a random seed selection each time. To address this issue, we iterated HMeanShift 100 times per block and averaged the results, to obtain a more stable estimate of tree density in each block (See Figure S2 in the supplementary materials for more information about tree number estimations over 100 iterations in each block).
Once our stepwise tree detection approach reached a stable solution, we calculated the various characteristics of individual trees within each tree cluster. These characteristics included tree height and crown size, which represent the horizontal and vertical structural variations of the forest stands, respectively. To calculate tree height, we determined the vertical elevation of the highest LiDAR point in each tree cluster. The crown size was estimated using the average of the two perpendicular diameters (north-south and east-west) of the tree clusters.

2.5. Algorithm Validation

2.5.1. Accuracy Assessment of Individual Tree Detection

The algorithm validation included both accuracy assessment of individual tree detection and validation of the individual tree parameter estimation. Owing to the wide variability in density in the northern red oak plantation, those blocks were grouped into low (100–500 TPH), medium (500–900 TPH), and high (900–1200 TPH) densities; as the blocks of black walnuts had similar densities, there were no additional subgroups in the black walnut stand. The accuracy assessment was performed by matching the mean positions of tree clusters to the positions obtained by stem mapping, with a radius equal to the search radius in HMeanShift. If more than one tree cluster was found within the search radius, the one closer to the center was marked as the correct match, all other tree clusters were marked as commission errors. If no tree cluster was found within the search radius, this was counted as an omission error. Detection rate, detection accuracy, and estimation percentage were used to assess omission and commission errors [3]. The detection rate was an assessment of omission errors, which was calculated using the number of correctly detected trees divided by the total number of trees in the stand. Estimation percentage assessed the commission errors, utilizing the total number of detected trees divided by the total number of trees in the stand. Detection accuracy was an accuracy measurement regarding both omission and commission errors. Its equation is as follows:
A = 2 T 2 T + O + C × 100 %
where A is the detection accuracy, T is the number of corrected detected trees, O is the number of undetected trees, and C is the number of overestimated trees.
McNemar’s test was used to test the differences between estimations using constant and dynamic kernels in HMeanShift [45]. The Z score was calculated as follows:
Z = a b a + b
where a is the number of trees that were detected using the constant kernel but undetected using the dynamic kernel, and b is the number of trees that were detected using the dynamic kernel but undetected using the constant kernel. We assumed these two estimations were statistically different at a 95% confidence interval if the Z score was more significant than 1.96.

2.5.2. Validation of the Individual Tree Parameter Estimation

Field-observed tree heights and DBH of 60 trees (about 10% of the study area) were used as reference measurements to validate LiDAR-derived tree heights and crown sizes (Table 1). As mentioned in Section 2.2, the field measurements were collected later than the LiDAR survey. They were mainly used as the reference data to represent the stand structure variations. The tree heights were compared directly using linear regressions. To validate our crown delineation results, we established linear regressions between LiDAR-derived crown size and field-observed DBH as a proxy. This was done because direct field measurements of crown size were not available. We expected that the LiDAR-derived crown size would be able to reflect the variation in DBH in the field data, as seen in previous forestry studies, which demonstrated a correlation between crown size and DBH (e.g., Lockhart et al. [46] and Shimano [47]). We also compared the LiDAR-derived estimations using constant and dynamic kernels in HMeanShift through linear regression and paired t-tests.
Additionally, our validation procedures were employed both before and after the vertical structure analysis. Therefore, we could investigate the effects of HMeanShift and the vertical structure analysis on the individual tree detections separately. The outcomes of single-step HMeanShift were assessed to explore the responses of individual tree detection to the changes of constant and dynamic kernels. The detection results after vertical structure analysis were assessed and compared to the results of the single-step HMeanShift, to evaluate the efficiency of the vertical strata analysis and VLR in overcoming the spreading crowns of hardwood trees.

3. Results

3.1. Assessment of Single-Step HMeanShift

The detection results of the single-step HMeanShift were assessed before the processing the vertical structure analysis. Using constant kernel in HMeanShift, the overall detection accuracy was 89%, with a 89% detection rate and 1% overestimation in the whole study area (Table 2). However, the accuracy of the detection varied across different stands and density groups within the oak stands, ranging from 77% to 93%. The black walnut stand had higher detection rates and accuracy compared to the northern red oak stand (Table 2), possibly due to more consistent density within the black walnut stand. Within the northern red oak stand, low-density blocks had the highest detection rate but lowest detection accuracy, due to a high overestimation rate of 37%. High-density blocks had the highest detection accuracy but the lowest detection rate of 86% and a high underestimate rate of 12% (Table 2).
Using the dynamic kernel in HMeanShift, the overall detection accuracy improved to 91%, with a higher detection rate of 91% and a slightly higher overestimation rate of 4% (Table 1). The detection rates and accuracies were slightly improved compared to the use of the constant kernel, and there were generally fewer under- and overpredictions of tree density across the stands and density groups. However, the detection rates and accuracies were still somewhat inconsistent among the different density groups (Table 2).

3.2. Assessment of the Stepwise Approach

The stepwise approach, HMeanShift clustering followed by vertical structure analysis, resulted in an overall accuracy of 94% with the constant kernel, and 93% with the dynamic kernel (Figures S3 and S4). The detection rates were more consistent across stands and density groups and were all above 90%. There was also less overestimation in low-density groups (<8%) and less underestimation in the higher-density groups (<7%) compared to the single-step HMeanShift approach. Overall, the stepwise approach improved the accuracy and consistency of the tree detection compared to the single-step approach (Table 3). Additionally, the stepwise approach showed better detection rate and accuracy compared to traditional treetop-based watershed algorithm [3] and improved on the density-based watershed segmentation approach [41], as seen in Table 3. However, the stepwise approaches tended to underestimate the overall tree number, while the watershed algorithms tended to overestimate it. More detailed comparisons are included in Table S2 in the supplementary document.
As the detection results using constant and dynamic kernels were similar in the stepwise approach, McNemar’s test was applied to evaluate the similarity of all four detections results (single-step HMeanShift with both constant and dynamic kernels, and stepwise approach with both constant and dynamic kernels) (Table 4). In McNemar’s test, a higher Z value indicates a more significant difference between the detection results. The results of McNemar’s tests showed that using a dynamic kernel significantly improved the results of mean shift clustering for the individual tree detection, which is consistent with previous literature studies. McNemar’s test also found that the stepwise approach was significantly better than both single-step HMeanShift approaches. There were no significant differences in the stepwise approach using either a constant or dynamic kernel, indicating that the stepwise approach is robust and relatively insensitive to the kernel size used in HMeanShift.

3.3. Validation of Tree Height Estimation

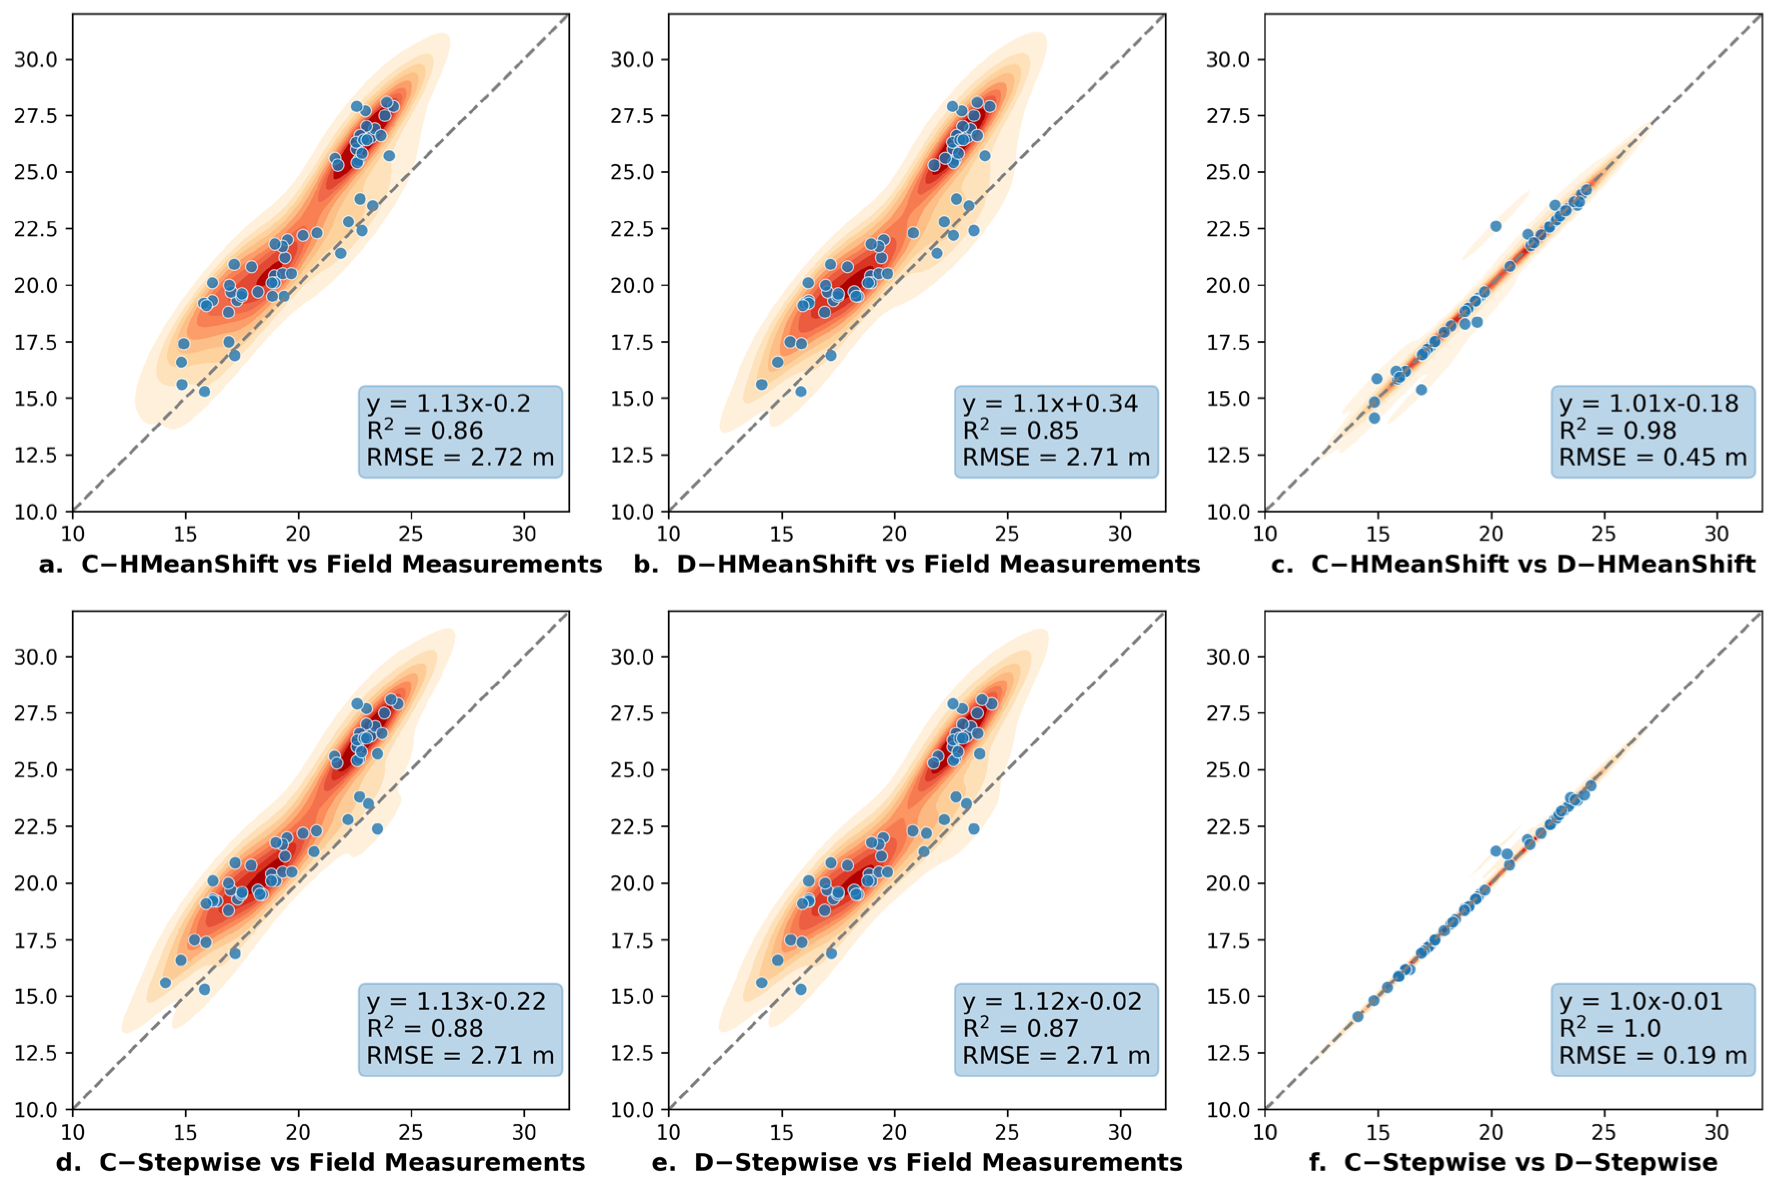
The tree height estimates showed a high level of agreement with the field measurements in all the designed approaches (Figure 5). The estimates made using the stepwise approach with a constant kernel had the highest agreement with the field measurements, with 88% of the vertical structural variance captured (Figure 5d). The estimates with the lowest correlation with field measurements were made using the single-step HMeanShift with the dynamic kernel, which still had a coefficient of determination of 0.85.
The stepwise approach slightly improved the tree height estimation compared to single-step HMeanShift, but the improvement was not statistical significance based on a paired t-test with a p-value of 0.15 (Table S3). Similarly, applying different kernels in HMeanShift produced no significant differences in the tree height estimation (Figure 5c,f and Tables S2–S4). Constant and dynamic kernels had nearly identical estimations with both the single-step HMeanShift (R-squared of 0.98 and RMSE of 0.45 m) and the stepwise approach (R-squared of 1 and RMSE of 0.19).

3.4. Validation of Canopy Crown Estimation

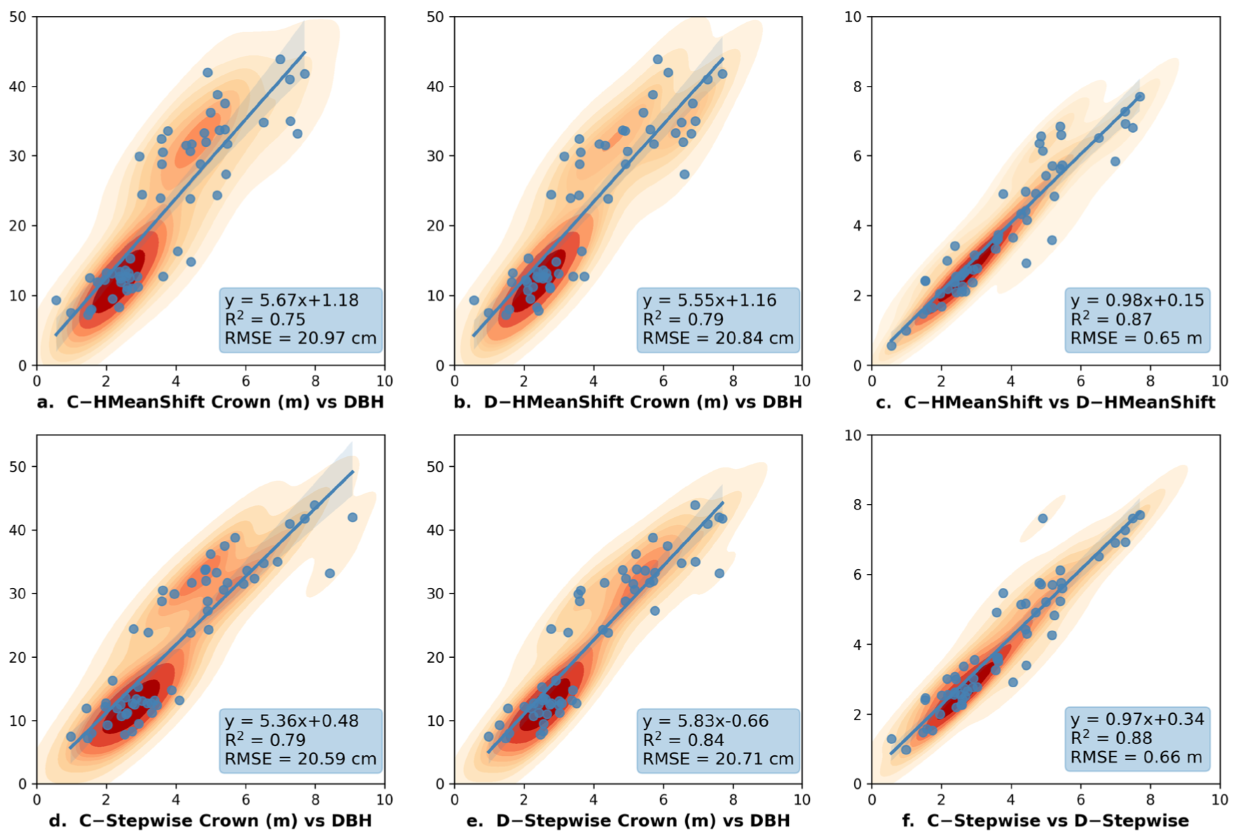
Correlating the LiDAR-derived crown sizes and field-measured DBH indicated that our algorithms were able to partition the horizontal structure at the individual tree level (Figure 6). The stepwise approach with the dynamic kernel showed the highest correlation with DBH measurements and the stepwise approach with the constant kernel had the lowest RMSE (20.59 cm). The stepwise approaches outperformed the single-step HMeanShift in crown size estimation, and the improvement was statistically significant, based on the paired t-test with a p-value of 0.019 (Tables S5–S7). The dynamic kernel improved the crown size estimations compared to the constant kernel. The R-squared improved from 0.75 to 0.79 in single-step HMeanShift and from 0.79 to 0.84 in the stepwise approach. There were no significant improvements/differences in the RMSE (Figure 6).
As the tree number was overestimated by over 30% in the low-density oak blocks (Table 1), there are some concerns about crown size underestimation using single-step HMeanShift. Our crown analysis showed that the stepwise approach produced larger crown sizes compared to the single-step HMeanShift method (see the mean crown sizes in Tables S6 and S7). This indicated a potential improvement of crown delineation using the step-wise approach.

4. Discussion

4.1. Detection Accuracy of the Stepwise Approach

In this study, the stepwise approach using a constant kernel outperformed all other designed approaches and achieved a detection accuracy of 94%. This performance is comparable to that of the conventional 3D point-cloud-based approaches, such as the 91% detection rate of dominant and codominant Eucalyptus trees using a 3D mean shift clustering approach reported by [14]. Though our study sites are even-aged plantations with no stratification, the deliquescent tree forms of temperate hardwoods lead to a homogeneous canopy surface but with variable tree densities, which consequently decreases the efficiency of individual tree detection [41]. Our algorithm also outperformed most of the individual tree detection approaches in dense temperate hardwood forests [48]. To our knowledge, the densest hardwood forests reported in previous individual tree detection studies were about 500–600 TPH, including trees in both the overstory and understory [29], which is similar to the average density in the northern red oak stand used in this study. Our detection algorithm achieved a higher detection accuracy than its 70% detection rate of the dominant trees over the canopy.

4.2. Impacts of the Clustering Kernel of Mean Shift on the Tree Detection

Our results showed that the performance of the stepwise approach using constant and dynamic kernels was similar, indicating that the clustering kernel size has little impact on detection accuracy. In theory, using a dynamic kernel in clustering should improve the detection accuracy, by adjusting the kernel size to match the size of different trees. Previous literature recommended using a dynamic kernel with mean shift clustering [14]. Similarly, our single-step HMeanShift approach also showed a significant improvement in detection accuracy when using the dynamic kernel, particularly in reducing overestimations in the low-density northern red oak blocks (Table 2). However, when using the designed stepwise approach, the detection results were similar for both constant and dynamic kernels. In fact, the detection accuracy using a constant kernel was 1% higher than that using a dynamic kernel, as it performed better in detecting medium-density oak trees and black walnuts (Table 3). The constant kernel also had a slightly better performance in the tree height estimation but underperformed compared to the dynamic kernel in crown size estimation (Figure 5 and Figure 6).
One possible explanation for the similar performances of the constant and dynamic kernels in the stepwise approach could be that the implementation of vertical structural analysis may have offset the effects of the dynamic kernel and resulted in better tree detection. Vertical structural analysis functions as a post-processing step for the mean shift clustering, removing ground wood residuals, separating tree clusters with stems from crown-only clusters, and merging crown clusters with the closest tree clusters, to reshape the canopy. The dynamic kernel uses different search windows to generate tree clusters of different sizes. Our results suggest that vertical structural analysis is insensitive to variations in tree cluster size and can improve the detection accuracy when used in combination with a constant kernel.
Additionally, the use of a dynamic kernel in the clustering process considers the variations in the canopy and adjusts the kernel size as the search window moves, which can increase the processing time by changing the speed at which the mean shift kernel moves. The combination of a constant kernel and vertical structural analysis, on the other hand, is more time efficient, because it creates relatively even-sized tree clusters and only considers canopy variations in the post-processing step. This allows for more efficient tree detection and attribute extraction.
Furthermore, defining a dynamic kernel can be challenging, as this often requires more ground information about the target forests. In our study, for example, we trained the dynamic kernel function using statistical modeling between LiDAR metrics and sampled tree numbers (Section 2.4.3). The sample size and model selection can significantly impact the results. To reduce uncertainties in kernel size generation, we collected and used relatively large samples (covering approximately half of the study area). In contrast, the combination of a constant kernel and vertical structural analysis requires less information about the stand, only requiring measurements of stem spacing, vertical gaps, and live crown ratio. Therefore, this approach is recommended, to maintain reliable accuracy and relatively high efficiency, without the need for extensive inventory information.

4.3. Efficiency of the Stepwise Approach

Instead of using a computation-intensive 3D clustering algorithm, we designed a stepwise approach to project 3D LiDAR points onto horizontal and vertical phases, and only applied 2D HMeanShift to the horizontal phase. In our processing efficiency tests, we found the processing time of the mean shift clustering had power relationships with both the point density and the spatial extent of the processing area (Table S8). This increment would be more prominent with an increase of LiDAR point density and spatial scales. We used a Dell OptiPlex 980 desktop with an Intel i7 CPU (860 @ 2.8 GHz) and 8 GB RAM to process the LiDAR data in these two forest stands. At the block level, the 2D HMeanShift was 2.2 times faster than 3D MeanShift (Table 5). At the stand level, HMeanShift was 5.7 and 21.2 times faster than 3D MeanShift in the black walnut and northern red oak stands, respectively. Therefore, HMeanShift greatly improved the work efficiency and preserved regional 3D structural information in a stepwise fashion. Additionally, since the LiDAR data used in this study had relatively low-density but large spatial coverage, our stepwise approach might have potential for application at large scale.

4.4. Field Measurements and Tree Height Underestimation

Our algorithms globally underestimated the tree heights, with the RMSE consistently being around 2.7 m. There were several potential reasons for this underestimation in height. First, the field measurements were collected about two growing seasons later than the LiDAR measurements. Tree growth between the time of LiDAR acquisition and field measurements could be one of the main reasons for the tree height underestimation. Second, the LiDAR data were collected during the leaf-off season and the point density of the dataset was relatively low compared with the data used in other individual tree detection studies, which made it difficult for the LiDAR to capture the terminals of the branches, and therefore it underestimated the tree heights. Additionally, the small footprint of airborne LiDAR makes it difficult to capture treetops with a low-density survey, and tree height underestimations were reported in many previous LiDAR studies [49].

4.5. Limitations and Uncertainties

There are some limitations and uncertainties in this study that should be noted. The study sites were mono-strata deciduous plantations with a uniform age structure. Though mortalities, thinning, and other management activities cause the stands to have diverse tree densities, the forests seem to preserve some plantation patterns in spacing, which could benefit the tree detection. Therefore, the designed tree detection approach is more suited for hardwood plantation forests with the current framework. Further investigations would be required to apply it to natural stands with a more complex vertical stratification and tree age structure. The stepwise approach used vertical strata analysis and vertical length ratio (VLR) data to identify canopy gaps and distinguish crown clusters and ground residuals from tree cluster candidates. However, its application in natural forests with a more diverse range of tree species and crown shapes is unclear, which may require high-density airborne or UAV LiDAR. The discrepancy in timing between the LiDAR survey and field measurements prevented us from fully assessing the accuracy of LiDAR-derived tree parameter estimates. Additionally, the limited number of field observations hindered our ability to accurately evaluate the heights and crown sizes of the different groups used in the study. Further studies, including extensive field data collection and LiDAR surveys, are needed for a better assessment, especially for a multitemporal analysis. Additionally, the LiDAR data used in this study were collected during the leaf-off season, which may have resulted in higher stem point densities. It is unknown how well the algorithm would perform using LiDAR data collected during the leaf-on season, which may have lower stem point densities. Finally, the stepwise approach was designed to specifically improve tree detection in temperate hardwood forests, and further investigation is needed to determine its effectiveness in other types of forests, such as boreal forests and tropical rainforests.

5. Conclusions

In this study, we developed a stepwise approach to detect individual trees in two temperate hardwood plantations, by first identifying individual trees using horizontal point density with HMeanShift clustering and then analyzing their vertical structure profiles for canopy reconstruction and feature extraction. The approach was robust for detecting deciduous trees with deliquescent, flat crowns in hardwood plantation stands. The stepwise approach produced promising results using a constant clustering kernel size, which reduced the need for field work and computational power to train a dynamic kernel function for varying tree sizes. This approach preserves the 3D spatial information through a stepwise process of 2D operations, enabling a balance between the accuracy of point-cloud-based algorithms and the computational efficiency of raster-based methods. This unique approach allows for both high precision and cost-effectiveness, making it an ideal solution for large-scale tree detection and characterization in temporal plantation forests.

Supplementary Materials

The following supporting information can be downloaded at: https://www.mdpi.com/article/10.3390/rs15051241/s1. Figure S1: Linear correlation between tree number and LiDAR metrics in northern red oak stand; Figure S2: The boxplot shows tree cluster estimation distribution over 100 iterations in each block. Subplot 1 (on top) presents the results using constant kernel HMeanShift clustering; Subplot 2 (at bottom) shows the results using dynamic kernel HMeanShifter clustering; Figure S3: Individual tree maps in the northern red oak stand; Figure S4: Individual tree maps in the black walnut stand; Table S1: Tree detection accuracy comparison table; Table S2: t-test for tree heights between single-step HMeanShift using constant (C–H) and dynamic kernels (D–H); Table S3: t-test for tree heights between stepwise approach (C–S) and single-step HMeanShift (C–H) using constant kernel; Table S4: t-test for tree heights between stepwise approach (D–S) and single-step HMeanShift (D–H) using dynamic kernel; Table S5: t-test for crown size between single-step HMeanShift using constant (C–H) and dynamic kernels (D–H); Table S6: t-test for crown size between stepwise approach (C–S) and single-step HMeanShift (C–H) using constant kernel; Table S7: t-test for crown size between stepwise approach (D–S) and single-step HMeanShift (D–H) using dynamic kernel; Table S8: Time efficiency analysis of point cloud based mean shift clustering.

Author Contributions

Conceptualization, G.S. (Gang Shao); methodology, G.S. (Gang Shao); software, G.S. (Guofan Shao); validation, G.S. (Gang Shao), S.F. and G.S. (Guofan Shao); formal analysis, G.S. (Gang Shao); investigation, S.F.; resources, S.F.; data curation, G.S. (Guofan Shao); writing—original draft preparation, G.S. (Gang Shao); writing—review and editing, S.F. and G.S. (Guofan Shao); visualization, G.S. (Gang Shao); supervision, G.S. (Guofan Shao); project administration, S.F.; funding acquisition, S.F. All authors have read and agreed to the published version of the manuscript.

Funding

USDA National Institute of Food and Agriculture McIntire Stennis project (IND011523MS).

Data Availability Statement

Not applicable.

Conflicts of Interest

The authors declare no conflict of interest.

References

  1. Latella, M.; Sola, F.; Camporeale, C. A Density-Based Algorithm for the Detection of Individual Trees from LiDAR Data. Remote Sens. 2021, 13, 322. [Google Scholar] [CrossRef]
  2. Picos, J.; Bastos, G.; Míguez, D.; Alonso, L.; Armesto, J. Individual Tree Detection in a Eucalyptus Plantation Using Unmanned Aerial Vehicle (UAV)-LiDAR. Remote Sens. 2020, 12, 885. [Google Scholar] [CrossRef] [Green Version]
  3. Duncanson, L.; Cook, B.; Hurtt, G.; Dubayah, R. An Efficient, Multi-Layered Crown Delineation Algorithm for Mapping Individual Tree Structure across Multiple Ecosystems. Remote Sens. Environ. 2014, 154, 378–386. [Google Scholar] [CrossRef]
  4. Lim, K.; Treitz, P.; Wulder, M.; St-Onge, B.; Flood, M. LiDAR Remote Sensing of Forest Structure. Prog. Phys. Geogr. 2003, 27, 88–106. [Google Scholar] [CrossRef] [Green Version]
  5. Wulder, M.A.; White, J.C.; Nelson, R.F.; Næsset, E.; Ørka, H.O.; Coops, N.C.; Hilker, T.; Bater, C.W.; Gobakken, T. Lidar Sampling for Large-Area Forest Characterization: A Review. Remote Sens. Environ. 2012, 121, 196–209. [Google Scholar] [CrossRef] [Green Version]
  6. Hyde, P.; Nelson, R.; Kimes, D.; Levine, E. Exploring LiDAR–RaDAR Synergy—Predicting Aboveground Biomass in a Southwestern Ponderosa Pine Forest Using LiDAR, SAR and InSAR. Remote Sens. Environ. 2007, 106, 28–38. [Google Scholar] [CrossRef]
  7. Næsset, E.; Gobakken, T. Estimation of Above- and below-Ground Biomass across Regions of the Boreal Forest Zone Using Airborne Laser. Remote Sens. Environ. 2008, 112, 3079–3090. [Google Scholar] [CrossRef]
  8. Bergen, K.; Goetz, S.; Dubayah, R.; Henebry, G.; Hunsaker, C.; Imhoff, M.; Nelson, R.; Parker, G.; Radeloff, V. Remote Sensing of Vegetation 3-D Structure for Biodiversity and Habitat: Review and Implications for Lidar and Radar Spaceborne Missions. J. Geophys. Res. Biogeosci. 2009, 114, G2. [Google Scholar] [CrossRef] [Green Version]
  9. Hudak, A.T.; Strand, E.K.; Vierling, L.A.; Byrne, J.C.; Eitel, J.U.; Martinuzzi, S.; Falkowski, M.J. Quantifying Aboveground Forest Carbon Pools and Fluxes from Repeat LiDAR Surveys. Remote Sens. Environ. 2012, 123, 25–40. [Google Scholar] [CrossRef] [Green Version]
  10. Lichstein, J.W.; Dushoff, J.; Ogle, K.; Chen, A.; Purves, D.W.; Caspersen, J.P.; Pacala, S.W. Unlocking the Forest Inventory Data: Relating Individual Tree Performance to Unmeasured Environmental Factors. Ecol. Appl. 2010, 20, 684–699. [Google Scholar] [CrossRef] [PubMed]
  11. Crowther, T.W.; Glick, H.B.; Covey, K.R.; Bettigole, C.; Maynard, D.S.; Thomas, S.M.; Smith, J.R.; Hintler, G.; Duguid, M.C.; Amatulli, G. Mapping Tree Density at a Global Scale. Nature 2015, 525, 201–205. [Google Scholar] [CrossRef] [PubMed]
  12. Kaartinen, H.; Hyyppä, J.; Yu, X.; Vastaranta, M.; Hyyppä, H.; Kukko, A.; Holopainen, M.; Heipke, C.; Hirschmugl, M.; Morsdorf, F. An International Comparison of Individual Tree Detection and Extraction Using Airborne Laser Scanning. Remote Sens. 2012, 4, 950–974. [Google Scholar] [CrossRef] [Green Version]
  13. Popescu, S.C.; Wynne, R.H.; Nelson, R.F. Measuring Individual Tree Crown Diameter with Lidar and Assessing Its Influence on Estimating Forest Volume and Biomass. Can. J. Remote Sens. 2003, 29, 564–577. [Google Scholar] [CrossRef]
  14. Ferraz, A.; Bretar, F.; Jacquemoud, S.; Gonçalves, G.; Pereira, L.; Tomé, M.; Soares, P. 3-D Mapping of a Multi-Layered Mediterranean Forest Using ALS Data. Remote Sens. Environ. 2012, 121, 210–223. [Google Scholar] [CrossRef]
  15. Jakubowski, M.K.; Li, W.; Guo, Q.; Kelly, M. Delineating Individual Trees from LiDAR Data: A Comparison of Vector-and Raster-Based Segmentation Approaches. Remote Sens. 2013, 5, 4163–4186. [Google Scholar] [CrossRef] [Green Version]
  16. Yao, W.; Krzystek, P.; Heurich, M. Tree Species Classification and Estimation of Stem Volume and DBH Based on Single Tree Extraction by Exploiting Airborne Full-Waveform LiDAR Data. Remote Sens. Environ. 2012, 123, 368–380. [Google Scholar] [CrossRef]
  17. Koch, B.; Kattenborn, T.; Straub, C.; Vauhkonen, J. Segmentation of Forest to Tree Objects. For. Appl. Airborne Laser Scanning 2014, 27, 89–112. [Google Scholar]
  18. Culvenor, D.S. TIDA: An Algorithm for the Delineation of Tree Crowns in High Spatial Resolution Remotely Sensed Imagery. Comput. Geosci. 2002, 28, 33–44. [Google Scholar] [CrossRef]
  19. Chen, Q.; Baldocchi, D.; Gong, P.; Kelly, M. Isolating Individual Trees in a Savanna Woodland Using Small Footprint Lidar Data. Photogramm. Eng. Remote Sens. 2006, 72, 923–932. [Google Scholar] [CrossRef] [Green Version]
  20. Koch, B.; Heyder, U.; Weinacker, H. Detection of Individual Tree Crowns in Airborne Lidar Data. Photogramm. Eng. Remote Sens. 2006, 72, 357–363. [Google Scholar] [CrossRef] [Green Version]
  21. Solberg, S.; Næsset, E.; Hanssen, K.H.; Christiansen, E. Mapping Defoliation during a Severe Insect Attack on Scots Pine Using Airborne Laser Scanning. Remote Sens. Environ. 2006, 102, 364–376. [Google Scholar] [CrossRef]
  22. Popescu, S.C.; Wynne, R.H.; Nelson, R.F. Estimating Plot-Level Tree Heights with Lidar: Local Filtering with a Canopy-Height Based Variable Window Size. Comput. Electron. Agric. 2002, 37, 71–95. [Google Scholar] [CrossRef]
  23. Li, Y.; Chai, G.; Wang, Y.; Lei, L.; Zhang, X. ACE R-CNN: An Attention Complementary and Edge Detection-Based Instance Segmentation Algorithm for Individual Tree Species Identification Using UAV RGB Images and LiDAR Data. Remote Sens. 2022, 14, 3035. [Google Scholar] [CrossRef]
  24. Hu, B.; Li, J.; Jing, L.; Judah, A. Improving the Efficiency and Accuracy of Individual Tree Crown Delineation from High-Density LiDAR Data. Int. J. Appl. Earth Obs. Geoinf. 2014, 26, 145–155. [Google Scholar] [CrossRef]
  25. Tang, X.; You, H.; Liu, Y.; You, Q.; Chen, J. Monitoring of Monthly Height Growth of Individual Trees in a Subtropical Mixed Plantation Using UAV Data. Remote Sens. 2023, 15, 326. [Google Scholar] [CrossRef]
  26. Gleason, C.J. A Fusion Approach for Tree Crown Delineation from Lidar Data. Photogramm. Eng. Remote Sens. 2012, 78, 679–692. [Google Scholar] [CrossRef]
  27. Wagner, W.; Hollaus, M.; Briese, C.; Ducic, V. 3D Vegetation Mapping Using Small-footprint Full-waveform Airborne Laser Scanners. Int. J. Remote Sens. 2008, 29, 1433–1452. [Google Scholar] [CrossRef] [Green Version]
  28. Morsdorf, F.; Meier, E.; Kötz, B.; Itten, K.I.; Dobbertin, M.; Allgöwer, B. LIDAR-Based Geometric Reconstruction of Boreal Type Forest Stands at Single Tree Level for Forest and Wildland Fire Management. For. Fire Prev. Assess. 2004, 92, 353–362. [Google Scholar] [CrossRef]
  29. Reitberger, J.; Schnörr, C.; Krzystek, P.; Stilla, U. 3D Segmentation of Single Trees Exploiting Full Waveform LIDAR Data. ISPRS J. Photogramm. Remote Sens. 2009, 64, 561–574. [Google Scholar] [CrossRef]
  30. Lee, H.; Slatton, K.C.; Roth, B.E.; Cropper, W., Jr. Adaptive Clustering of Airborne LiDAR Data to Segment Individual Tree Crowns in Managed Pine Forests. Int. J. Remote Sens. 2010, 31, 117–139. [Google Scholar] [CrossRef]
  31. Li, W.; Guo, Q.; Jakubowski, M.K.; Kelly, M. A New Method for Segmenting Individual Trees from the Lidar Point Cloud. Photogramm. Eng. Remote Sens. 2012, 78, 75–84. [Google Scholar] [CrossRef] [Green Version]
  32. Jakubowski, M.K.; Guo, Q.; Kelly, M. Tradeoffs between Lidar Pulse Density and Forest Measurement Accuracy. Remote Sens. Environ. 2013, 130, 245–253. [Google Scholar] [CrossRef]
  33. Shao, G.; Stark, S.C.; de Almeida, D.R.; Smith, M.N. Towards High Throughput Assessment of Canopy Dynamics: The Estimation of Leaf Area Structure in Amazonian Forests with Multitemporal Multi-Sensor Airborne Lidar. Remote Sens. Environ. 2019, 221, 1–13. [Google Scholar] [CrossRef]
  34. Zhou, T.; dos Santos, R.C.; Liu, J.; Lin, Y.-C.; Fei, W.C.; Fei, S.; Habib, A. Comparative Evaluation of a Newly Developed Trunk-Based Tree Detection/Localization Strategy on Leaf-Off LiDAR Point Clouds with Varying Characteristics. Remote Sens. 2022, 14, 3738. [Google Scholar] [CrossRef]
  35. Liang, X.; Kankare, V.; Hyyppä, J.; Wang, Y.; Kukko, A.; Haggrén, H.; Yu, X.; Kaartinen, H.; Jaakkola, A.; Guan, F. Terrestrial Laser Scanning in Forest Inventories. ISPRS J. Photogramm. Remote Sens. 2016, 115, 63–77. [Google Scholar] [CrossRef]
  36. Brede, B.; Lau, A.; Bartholomeus, H.M.; Kooistra, L. Comparing RIEGL RiCOPTER UAV LiDAR Derived Canopy Height and DBH with Terrestrial LiDAR. Sensors 2017, 17, 2371. [Google Scholar] [CrossRef]
  37. Hyyppä, E.; Yu, X.; Kaartinen, H.; Hakala, T.; Kukko, A.; Vastaranta, M.; Hyyppä, J. Comparison of Backpack, Handheld, under-Canopy UAV, and above-Canopy UAV Laser Scanning for Field Reference Data Collection in Boreal Forests. Remote Sens. 2020, 12, 3327. [Google Scholar] [CrossRef]
  38. Lin, Y.-C.; Shao, J.; Shin, S.-Y.; Saka, Z.; Joseph, M.; Manish, R.; Fei, S.; Habib, A. Comparative Analysis of Multi-Platform, Multi-Resolution, Multi-Temporal LiDAR Data for Forest Inventory. Remote Sens. 2022, 14, 649. [Google Scholar] [CrossRef]
  39. GIS: Indiana Imagery. Available online: https://www.in.gov/gis/indiana-imagery/ (accessed on 10 December 2022).
  40. Vastaranta, M.; Holopainen, M.; Yu, X.; Haapanen, R.; Melkas, T.; Hyyppä, J.; Hyyppä, H. Individual Tree Detection and Area-Based Approach in Retrieval of Forest Inventory Characteristics from Low-Pulse Airborne Laser Scanning Data. Photogramm. J. Finl. 2011, 22, 1–13. [Google Scholar]
  41. Shao, G.; Shao, G.; Fei, S. Delineation of Individual Deciduous Trees in Plantations with Low-Density LiDAR Data. Int. J. Remote Sens. 2019, 40, 346–363. [Google Scholar] [CrossRef]
  42. Oh, S.; Jung, J.; Shao, G.; Shao, G.; Gallion, J.; Fei, S. High-Resolution Canopy Height Model Generation and Validation Using USGS 3DEP LiDAR Data in Indiana, USA. Remote Sens. 2022, 14, 935. [Google Scholar] [CrossRef]
  43. Cheng, Y. Mean Shift, Mode Seeking, and Clustering. IEEE Trans. Pattern Anal. Mach. Intell. 1995, 17, 790–799. [Google Scholar] [CrossRef] [Green Version]
  44. Comaniciu, D.; Meer, P. Mean Shift: A Robust Approach toward Feature Space Analysis. IEEE Trans. Pattern Anal. Mach. Intell. 2002, 24, 603–619. [Google Scholar] [CrossRef] [Green Version]
  45. Shao, G.; Pauli, B.P.; Haulton, G.S.; Zollner, P.A.; Shao, G. Mapping Hardwood Forests through a Two-Stage Unsupervised Classification by Integrating Landsat Thematic Mapper and Forest Inventory Data. J. Appl. Remote Sens. 2014, 8, 083546. [Google Scholar] [CrossRef] [Green Version]
  46. Lockhart, B.R.; Weih Jr, R.C.; Smith, K.M. Crown Radius and Diameter at Breast Height Relationships for Six Bottomland Hardwood Species. J. Ark. Acad. Sci. 2005, 59, 110–115. [Google Scholar]
  47. Shimano, K. Analysis of the Relationship between DBH and Crown Projection Area Using a New Model. J. For. Res. 1997, 2, 237–242. [Google Scholar] [CrossRef]
  48. Lu, X.; Guo, Q.; Li, W.; Flanagan, J. A Bottom-up Approach to Segment Individual Deciduous Trees Using Leaf-off Lidar Point Cloud Data. ISPRS J. Photogramm. Remote Sens. 2014, 94, 1–12. [Google Scholar] [CrossRef]
  49. Zhao, K.; Suarez, J.C.; Garcia, M.; Hu, T.; Wang, C.; Londo, A. Utility of Multitemporal Lidar for Forest and Carbon Monitoring: Tree Growth, Biomass Dynamics, and Carbon Flux. Remote Sens. Environ. 2018, 204, 883–897. [Google Scholar] [CrossRef]
Figure 1. A profile of airborne LiDAR data representing a transect of the northern red oak stand in the study site. The red curve stands for the canopy height model (canopy surface), and the blue curve stands for the LiDAR point density distribution.
Remotesensing 15 01241 g001
Figure 2. Aerial view of the study area. The top two aerial photos show the northern red oak stand during leaf-on (a) and leaf-off (b) seasons; a stem map was added to the leaf-off photo, to show the subplot blocks; the bottom two aerial photos show the black walnut stand during leaf-on (c) and leaf-off (d) seasons; red lines were added to the leaf-ff photo to show the subplot blocks (see more details in Section 2.2).
Remotesensing 15 01241 g002
Figure 3. Flowchart of the stepwise tree detection approach.
Remotesensing 15 01241 g003
Figure 4. Visualization of the stepwise tree detection approach, including horizontal mean shift clustering (HMeanShift), vertical strata analysis, and the vertical length ratio (VLR). The black dots in the main graph represent the horizontal projections of LiDAR points, and the different colors represent the clusters created by HMeanShift. The HMeanShift graph (a) shows the search radius (red circles), the final position of the cluster (solid-lined circles), and the pathway of the mean shift (dash-lined circles). In the vertical strata analysis graph (b), the blue dots within the left cylinder represent the original LiDAR points in the cluster, while the blue dots within the right cylinder represent the crown points without ground residuals (black dots). The VLR graph (c) shows the VLR values of each cluster, with the blue cluster marked as a crown cluster and merged with the distance-closer pink cluster.
Remotesensing 15 01241 g004
Figure 5. Correlations with heatmap in estimations of tree height between the field measurements and the designed approaches. Dash lines are x = y; the blue box includes regression line expression, R-squared, and RMSE.
Remotesensing 15 01241 g005
Figure 6. Correlations with the heatmap in estimation of the crown size between field measured DBH and the designed approaches. Lines are regression lines with a 95% confidence interval; the blue boxes include the regression line expression, R-squared, and RMSE.
Remotesensing 15 01241 g006
Table 1. Tree height and DBH of the black walnut and northern red oak stands from the field measurements and stand tree densities.
Stand NameTree Height (m)DBH (cm)Tree Density (trees ha−1)
MaxMinMeanMedianSDMaxMinMeanMedianSD
Black walnut21.815.319.419.51.723.843.933.123.05.3161
Northern red oak28.119.125.025.82.57.223.912.312.43.3568
Table 2. The results of individual tree detection using single-step HMeanShfit with either a constant or dynamic kernel.
Single-Step HMeanShift
Plot Type *ActualCorrectOmissionCommissionDetection RateDetection AccuracyEstimated
Percentage (100% = 1)
Constant Kernel
H-oak1251081720.860.920.88
M-oak26723334170.870.900.94
L-oak97898440.920.771.37
Oak48943059630.880.881.01
B. Walnut1181117100.940.931.03
Total60754166730.890.891.01
Dynamic Kernel
H-oak1251141130.910.940.94
M-oak26724324230.910.911.00
L-oak97907360.930.811.30
Oak48944742620.910.901.04
B. Walnut118113580.960.951.03
Total60756047700.920.911.04
* H-oak = high density oak blocks; M-oak = medium density oak blocks; L-oak = low density oak blocks; Oak = total northern red oaks; B. Walnut = total black walnuts.
Table 3. Results of the stepwise tree detection approach (HMeanShift with either constant or dynamic kernel followed by vertical structure analysis).
Stepwise Tree Detection Approach
Plot Type *ActualCorrectOmissionCommissionDetection RateDetection AccuracyEstimated Percentage (100% = 1)
Constant Kernel
H-oak125116930.930.950.95
M-oak2672422570.910.940.93
L-oak97907150.930.891.08
Oak48944841250.920.930.97
B. Walnut118111720.940.960.96
Total60755948270.920.940.97
Dynamic Kernel
H-oak125117820.940.960.95
M-oak2672392870.900.930.92
L-oak97898120.920.901.04
Oak48944544210.910.930.95
B. Walnut118113590.960.941.03
Total60755849300.920.930.97
Treetop Watershed 607516881340.850.821.07
Density
Watershed
60754758810.900.891.03
* H-oak = High-density oak blocks; M-oak = Medium-density oak blocks; L-oak = Low-density oak blocks; Oak = total northern red oaks; B. Walnut = total black walnuts, Total = total northern red oaks and black walnuts.
Table 4. Paired McNemar’s tests between the results using single-step HMeanShift and the stepwise approach with either a constant or dynamic kernel. The chi-square Z values are presented in the table.
Approach *C-HMeanShiftD-HMeanShiftC-Stepwise
D-HMeanShift3.35
C-Stepwise3.206.14
D-Stepwise3.525.190.23
* C-HMeanShift = Constant kernel HMeanShift; D-HMeanShift = Dynamic kernel HMeanShift; C-Stepwise = Constant kernel stepwise approach; D-Stepwise = Dynamic kernel stepwise approach.
Table 5. Comparison of the computing efficiency between 2D HMeanShift (SA) and 3D MeanShift.
Time (s)BW-B *BW-SNRO-BNRO-S
2D HMeanShift30.8690.2276.702420
3D MeanShift67.19514.84168.4751340
3D/2D Ratio2.15.72.121.2
* BW-B = average processing time of single black walnut blocks; BW-S = processing time for the whole black walnut stand, without splitting into blocks; NRO-B = average processing time of single northern red oak block; NRO-S = processing time for whole northern red oak stand, without splitting into blocks.
Disclaimer/Publisher’s Note: The statements, opinions and data contained in all publications are solely those of the individual author(s) and contributor(s) and not of MDPI and/or the editor(s). MDPI and/or the editor(s) disclaim responsibility for any injury to people or property resulting from any ideas, methods, instructions or products referred to in the content.