Article

Potential of Satellite Spectral Resolution Vegetation Indices for Estimation of Canopy Chlorophyll Content of Field Crops: Mitigating Effects of Leaf Angle Distribution

1
Technology Innovation Center for Integration Applications in Remote Sensing and Navigation, Ministry of Natural Resources, School of Remote Sensing and Geomatics, Nanjing University of Information Science & Technology, Nanjing 210044, China
2
VTT Technical Research Centre of Finland Ltd., P.O. Box 1000, FI-02044 Espoo, Finland
*
Author to whom correspondence should be addressed.
Remote Sens. 2023, 15(5), 1234; https://doi.org/10.3390/rs15051234
Submission received: 15 January 2023 / Revised: 18 February 2023 / Accepted: 22 February 2023 / Published: 23 February 2023
(This article belongs to the Special Issue Crops and Vegetation Monitoring with Remote/Proximal Sensing)

Abstract

:
Accurate estimation of canopy chlorophyll content (CCC) is critically important for agricultural production management. However, vegetation indices derived from canopy reflectance are influenced by canopy structure, which limits their application across species and seasonality. For horizontally homogenous canopies such as field crops, LAI and leaf inclination angle distribution or leaf mean tilt angle (MTA) are two biophysical characteristics determining canopy structure. Since CCC is relevant to LAI, MTA is the only structural parameter affecting the correlation between CCC and vegetation indices. To date, there are few vegetation indices designed to minimize MTA effects for CCC estimation. Herein, in this study, CCC-sensitive and MTA-insensitive satellite broadband vegetation indices are developed for crop canopy chlorophyll content estimation. The most efficient broadband vegetation indices for four satellite sensors (Sentinel-2, RapidEye, WorldView-2 and GaoFen-6) with red edge channels were identified (in the context of various vegetation index types) using simulated satellite broadband reflectance based on field measurements and validated with PROSAIL model simulations. The results indicate that developed vegetation indices present strong correlations with CCC and weak correlations with MTA, with overall R2 of 0.76–0.80 and 0.84–0.95 for CCC and R2 of 0.00 and 0.00–0.04 in the field measured data and model simulations, respectively. The best vegetation indices identified in this study are the soil-adjusted index type index SAI (B6, B7) for Sentinel-2, Verrelts’s three-band spectral index type index BSI-V (NIR1, Red, Red Edge) for WorldView-2, Tian’s three-band spectral index type index BSI-T (Red Edge, Green, NIR) for RapidEye and difference index type index DI (B6, B4) for GaoFen-6. The identified indices can potentially be used for crop CCC estimation across species and seasonality. However, real satellite datasets and more crop species need to be tested in further studies.

Graphical Abstract

1. Introduction

Foliar chlorophyll content is a very important photosynthetic pigment that governs light absorption and conversion to chemical energy [1,2]. Canopy chlorophyll content (CCC), defined as the total amount of chlorophyll in plant leaves per unit ground area [3,4], is related to plant photosynthetic productivity and light use efficiency [5], and contributes to the vegetation response to the environment [6,7]. It is usually calculated as the product of leaf chlorophyll content (Cab) and leaf area index (LAI) [8,9], defined as the total of the single-sided leaf area per area unit of horizontal ground [10]. From the perspective of agricultural applications, the instantaneous value and dynamics of CCC indicate the crop growth potential and actual development [11,12,13]. CCC is also strongly correlated with plant nutritional status and crop yield [8,14,15,16,17], so it needs to be accurately determined for precision agriculture.
CCC drives visible light absorption and transmission within a canopy and hence it can be detected by optical remote sensing technology [8]. Instead of laborious time-consuming regional scale in situ measurements, spatially and temporally resolved CCC can be determined from remote sensing data. The numerous approaches developed for this [18,19] can be categorized into two general types, physically- and empirically-based methods. Physically-based CCC estimation approaches mainly rely on canopy radiative transfer models to determine the relationship between CCC and radiometric signals [20,21]. The empirical approach is to establish a statistical relationship between the measured CCC and observed spectral features [4,22]. One of the commonly used empirical approaches is via the use of spectral vegetation indices, mathematical combinations of remote sensing instrument band readings designed to enhance the sensitivity of the outcome to variables of interest and to minimize the impact of other factors [23,24,25].
Due to its simplicity, adaptability and computational efficiency, many vegetation indices have been designed to estimate CCC [26], such as the MERIS terrestrial chlorophyll index (MTCI) [27], normalized difference red edge index (NDRE) [28] and red edge chlorophyll index (CIred-edge) [3]. CCC is related to specific spectral features making it easier to detect using narrow-band indices [2,11,29,30]. Specifically, chlorophyll is visible in the reflectance spectrum between 680 and 760 nm (known as the red edge) [31,32], which can be efficiently utilized for estimating CCC [33]. For large-scale practical applications, the use of low-cost (or in many cases, free for the end user) spatially and temporally continuous multispectral satellite data simplify the design of the vegetation index and makes estimation of CCC feasible regionally or globally [9]. Fortunately, modern multispectral satellite sensors are equipped with red edge bands, such as Sentinel-2, RapidEye, WorldView-2 and GaoFen-6. Sentinel-2-based vegetation indices have been assessed for CCC estimation for several crop species, including potato, soybean, maize and winter wheat [33,34,35], but RapidEye, WorldView-2 and GaoFen-6 have received little attention in the estimation of crop CCC.
In addition to leaf optical properties, affected strongly by chlorophyll absorption in the visible part of the spectrum, remotely sensed canopy reflectance is affected by ground (soil) and canopy structure [36,37,38,39,40]. The canopy of field crops is usually assumed to be horizontally uniform, which means that its architecture can be simply characterized by the amount of leaves and their orientations within a canopy. These can be characterized using two physical parameters—LAI and leaf inclination angle distribution or leaf mean tilt angle (MTA), the leaf area-weighted average of all the leaf inclination angles in a canopy. To a large extent, MTA is a species-specific characteristic, and it has been reported to have more variation among species than within species [41,42,43,44]. In addition, MTA is affected by biome, genotype and growth conditions. As LAI is included in the computation of CCC, MTA is the only independent canopy structure parameter affecting the relationship between CCC and canopy reflectance in horizontally homogeneous canopies.
There are only a few studies on the removal or minimization of the influence of MTA on CCC estimation from satellite remote sensing data [45], mainly because of a lack of measured MTA and corresponding spectral observations, either true satellite measurements or the equivalent hyperspectral data resampled to simulate satellite spectral bands. To address this shortcoming, the objectives of this study are to (1) evaluate the performance of four multispectral satellites with red edge channels for CCC estimation of field crops with diverse canopy architectures using vegetation indices and (2) develop CCC-sensitive and MTA-insensitive vegetation indices for CCC estimation.

2. Materials and Methods

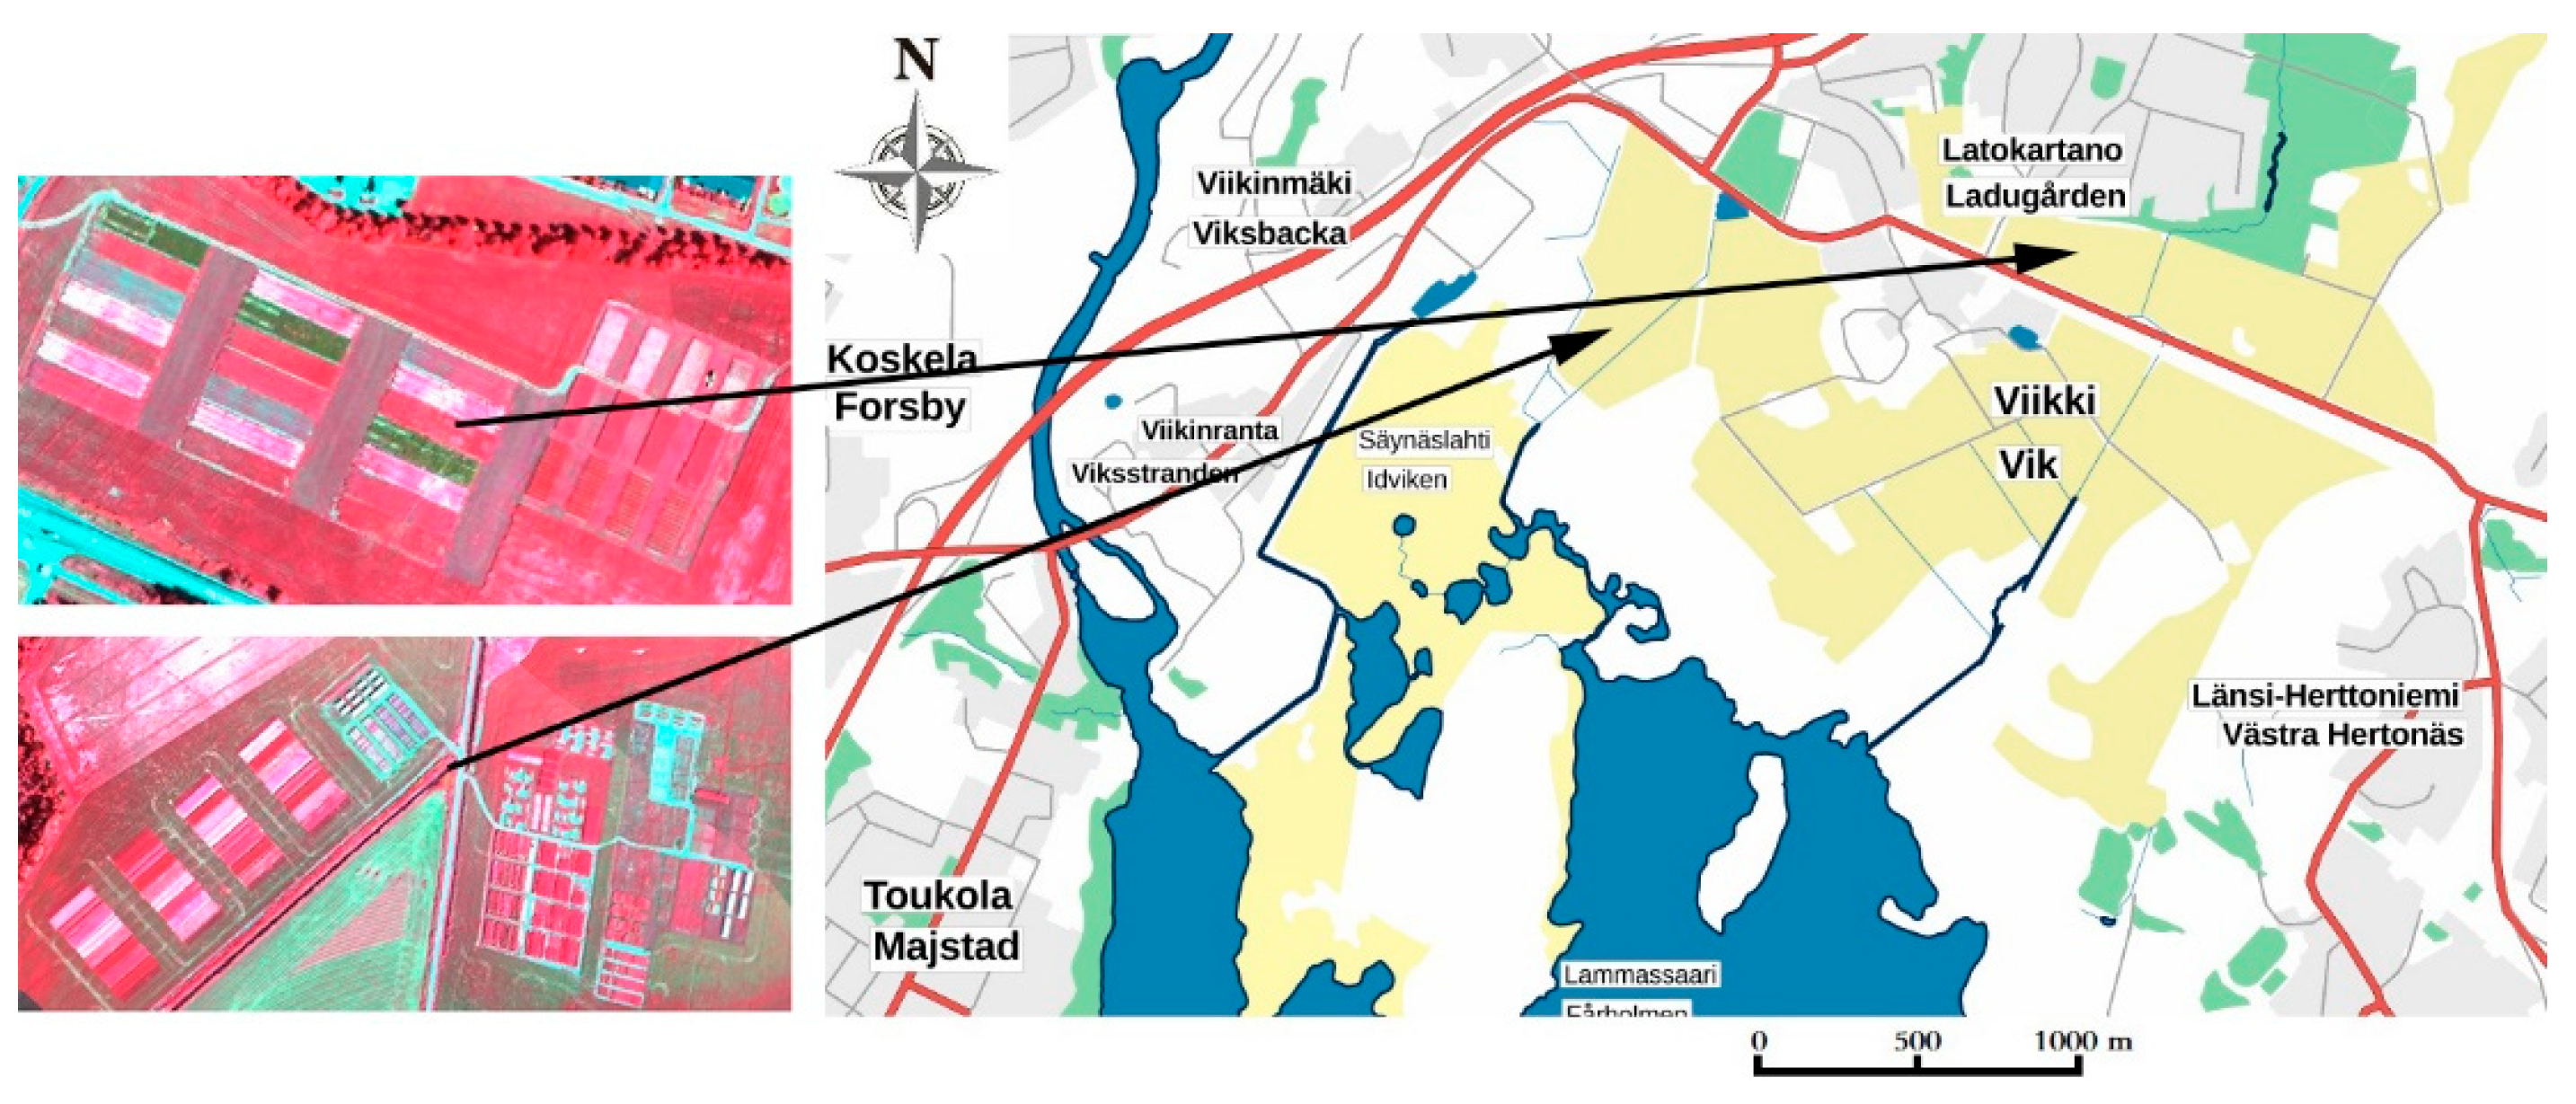
2.1. Study Area and Field Measurements

The empirical datasets acquired in this study include airborne imaging spectroscopy data acquisitions and field measurements at Viikki Experimental Farm (60.224°N, 25.021°E), Helsinki, Finland (Figure 1). The experimental area is located in southern Finland with a mean annual temperature of 6 °C. The study site area is approximately 4 km × 4 km with an altitude no more than 10 m above sea level. The study site encompasses six crop species, faba bean, narrow-leafed lupin, turnip rape, wheat, barley and oat. Three crop biophysical and biochemical parameters were collected including LAI, Cab and MTA from 162 plots. The maximum plot size is 50 m × 12 m and the minimum is 2 m × 10 m. A detailed description of the field plots is given in [46].
Canopy MTA was measured using the photographic method developed by [47] and validated and extended to field crops [46,48]. Leaf inclination angle measurements were taken on 6th July 2012. The photographs of leaves were acquired outside of the field plot approximately one meter away from the plot edge with a Nikon D1X digital camera. The photograph of the canopy was acquired using the camera attached and leveled on a tripod during acquisitions under windless conditions. The camera height was adjusted depending on crop height, ranging from 30 cm to 50 cm to cover the whole plant vertically. With the help of ImageJ software, leaf angles were visually measured from photographs for each species. Leaf inclination is defined so that increasing MTA indicates more vertical leaves. As suggested in [49], 75–100 leaves are sufficient to represent the leaf inclination angle distribution. This method keeps the MTA measurement error within 4° [48]. Full details of the method are given by [46].
The leaf area index of field crops was indirectly measured using a SunScan SS1 probe (Delta-T Devices). The 1 m long SunScan probe with 64 radiation microsensors was inserted below the crop canopy from the plot edge orthogonally to plant rows to minimize the row effects. An additional beam fraction sensor recorded the incident direct and diffuse downwelling irradiances simultaneously outside of field plots. The leaf area index was calculated through a canopy radiative transfer (RT) model implemented in the SunScan device. A one-parameter ellipsoidal leaf angle distribution model was assumed in this RT model, and the leaf clumping effect was not considered for this instrument. The ellipsoidal LAD model input parameter χ can be derived using Equation (16) in [50] as:
χ = 3 + ( MTA 553 ) 0.6061
MTA was assumed to be a species-specific characteristic. The details of the LAI calculation algorithm are fully described in SunScan user manual version 2.0.
The Cab of leaves was measured with a portable SPAD-502 device in the field. Based on the size of the field plot, 15–30 leaves were randomly sampled. This device acquired dimensionless readings that were converted into absolute Cab values using the formula [51,52]:
C ab   ( μ g   cm 2 ) = 0.0893 ( 10 SPAD 0.625 )
which has achieved a strong correlation between laboratory-determined Cab and SPAD-502 readings for field crops (soybean, maize and barley). After the LAI and Cab were acquired, the canopy CCC was calculated as:
CCC (μg cm−2) = Cab × LAI
Airborne imaging spectroscopy data of the study plots were acquired using an AISA Eagle II spectrometer on 25 July 2011 under cloudless conditions between 09:36 and 10:00 local time. The instrument provided data in 64 spectral bands covering the spectral range between 400 and 1000 nm, and the resolution of the spectra was between 9 and 10 nm. The average flight altitude was 600 m and achieved a ground spatial resolution of approximately 0.4 m. Radiometric correction of the raw image was completed using Specim CaliGeo software. The radiometrically calibrated imagery was georectified using Parge (ReSe Applications Schläpfer) by means of ground control points and the navigation data acquired during the flight. Atmospheric correction was carried out with ATCOR-4 (ReSe Applications Schläpfer). The plot scale spectra were visually extracted from each plot and averaged. A detailed description of imaging spectroscopy data acquisition is given in [46].

2.2. Validation Datasets from the PROSAIL Model Simulation

Canopy reflectance was simulated with the widely used PROSAIL model, which is a coupled model of the leaf reflectance model PROSPECT-5 [53] and canopy reflectance model SAILH [54,55]. In the PROSAIL model, homogeneous randomly distributed leaves are presumed to form a one-dimensional turbid medium [54], which is suitable for simulating the canopy reflectance of field crops. PROSPECT-5 simulates leaf reflectance and transmittance from 400 nm to 2500 nm as a function of six input parameters: Cab, the mesophyll structure parameter (N), carotenoid content (Ccar), brown pigment content (Cbrown), equivalent water thickness (Cw), and dry matter content (Cm). In addition to leaf optical properties, eight canopy structural parameters were used as inputs for PROSAIL: LAI, MTA (assuming an ellipsoidal distribution), solar zenith angle (ts), observer zenith angle (to), relative azimuth angle (φ), soil reflectance, fraction of diffuse radiation (skyl) and hot spot size parameter. The PROSAIL model inputs, summarized in Table 1, were set in accordance with in-situ measurement conditions and scientific literature: Cab was set between 20 and 90 μg cm−2, in steps of 5 μg cm−2, Ccar was set to 20% of the Cab value based on the LOPEX93 dataset [56], Cw was fixed to 0.001, N was fixed to 1.55—a mean value for various crops [57], Cm was set to 0.005 g cm−2—the mean value of the six crop species [58,59,60,61], Cbrown was fixed to 0 assuming no senescent leaves during the measurements. LAI was set between 1 and 5 with a 0.1 interval, and MTA ranged from 20 to 70 with a 2-degree interval. Based on the conditions of airborne imaging spectroscopy data acquisition, the three illumination and view geometry parameters ts, to and φ were set to 49.4°, 9.0° and 90.0°, respectively. The 6S atmosphere radiative transfer model was used to calculate the parameter skyl [62]. The hot spot parameter was fixed to 0.01 and the soil reference was measured using a handheld Analytical Spectral Devices spectroradiometer (ASD). In total, 15,990 canopy spectra between 400 nm and 1000 nm were simulated and resampled to satellite broadband reflectance.

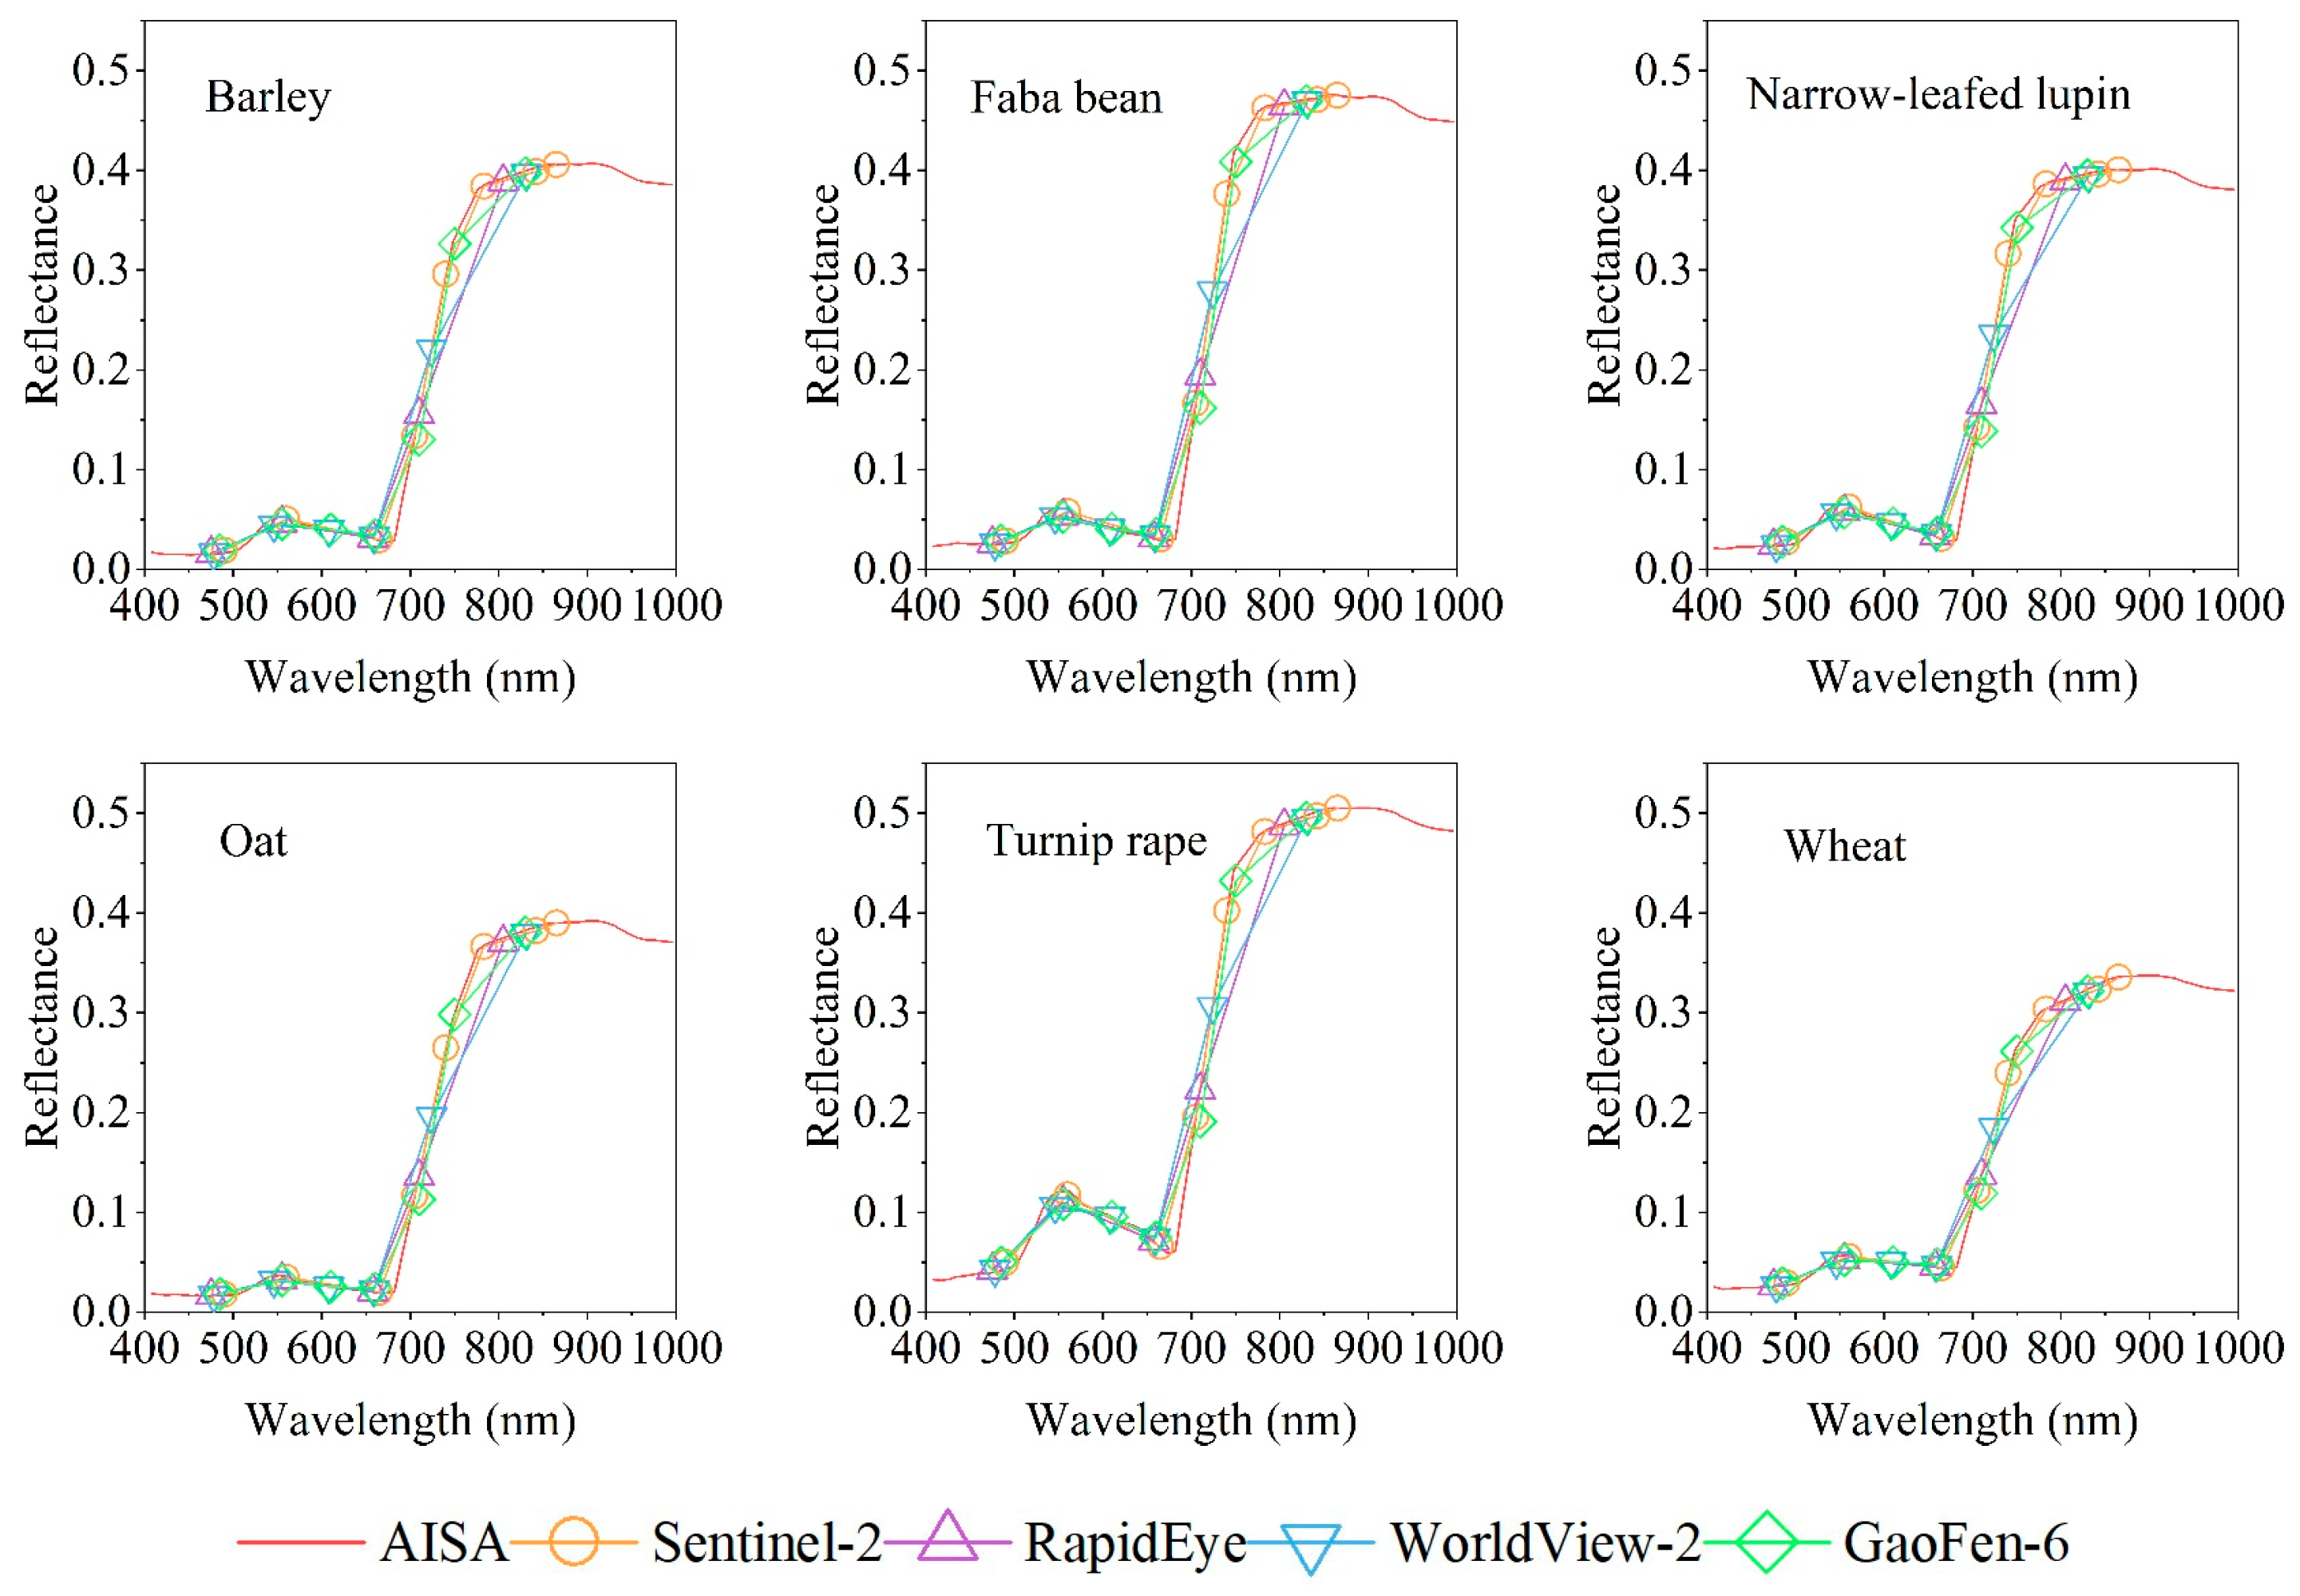
2.3. Satellite Broadband Reflectance Simulations

The airborne imaging spectroscopy data and PROSAIL model-simulated canopy reflectance in Visible to NIR spectral region (VNIR) were resampled to the broadband resolution of selected satellite sensors that had red edge channels: Sentinel-2, RapidEye, WorldView 2 and GaoFen-6. The MultiSpectral Instrument (MSI) of Sentinel-2 has 10 bands with three different spatial resolutions (10–60 m) in VNIR, including two red edge channels. RapidEye is a commercial Earth observation mission that offers high spatial resolution (6.5 m) imagery in five bands. The WorldView-2 satellite acquires very high spatial resolution (1.84 m) imagery in eight bands. The GaoFen-6 satellite, launched in 2018, has a multispectral sensor with 16 m spatial resolution in eight bands. The spectral response functions (SRFs, Figure A1 and Table A1) of the four multispectral instruments were used to convolve the modeled and measured narrow-band reflectance. The resampled four satellite broadband reflectance from the mean spectra of six crop species are presented in Figure 2.

2.4. Tested Vegetation Indices

A wide range of vegetation indices has been used to estimate vegetation canopy chlorophyll content, a product of LAI and Cab. In this study, twelve widely used vegetation indices that have been used to estimate chlorophyll content or LAI were evaluated (Table 2). Some of these use reflectance in VNIR: the normalized difference vegetation index (NDVI), enhanced vegetation index (EVI) and its two-band version (EVI2), optimized soil-adjusted vegetation index (OSAVI), renormalized difference vegetation index (RDVI), pigment-specific normalized difference index (PSND) and transformed chlorophyll absorption reflectance index/OSAVI (TCARI/OSAVI). These indices are used to extract one or more vegetation parameters, such as LAI, canopy cover fraction, biomass and pigment content. Other indices have been formulated with the red edge bands: the red-edge transformed chlorophyll absorption reflectance index/OSAVI (TCARI/OSAVIred edge), which has a red edge band instead of the NIR band, the MERIS terrestrial chlorophyll index (MTCI), two versions of normalized difference red-edge vegetation indices (NDRE1 and NDRE2, see Table 2 for details) and the red-edge chlorophyll index (CIred edge) (rows 1–12 in Table 2). These indices were used to extract chlorophyll content in previous studies. To identify the CCC-sensitive and MTA-insensitive band combinations, eleven general index types were selected from the literature next, including six two-band and five three-band formulations (Table 2): ratio index (RI), normalized difference index (NDI), difference index (DI), soil adjusted index (SAI), modified simple ratio (MSR) and modified soil adjusted index (MSAI), triangular index (TI), Gitelson three-band index (Git), Tian’s three-band index (BSI-T), Verrelts’s three-band index (BSI-V) and Wang’s three-band index (BSI-W) (rows 13–23 in Table 2). When calculating TI, the central wavelength of the broadband was used to calculate the wavelength difference.

2.5. Statistical Analysis

The relationships between the CCC, MTA and vegetation indices were evaluated using the coefficients of determination (R2). The R2 between vegetation indices and CCC is indicated as R2CCC and that relationship with MTA is indicated as R2MTA. The difference between R2CCC and R2MTA is used for the quantitative assessment of the CCC-sensitive and MTA-insensitive vegetation indices. The correlations between the CCC, MTA and individual band reflectance were also calculated.

3. Results

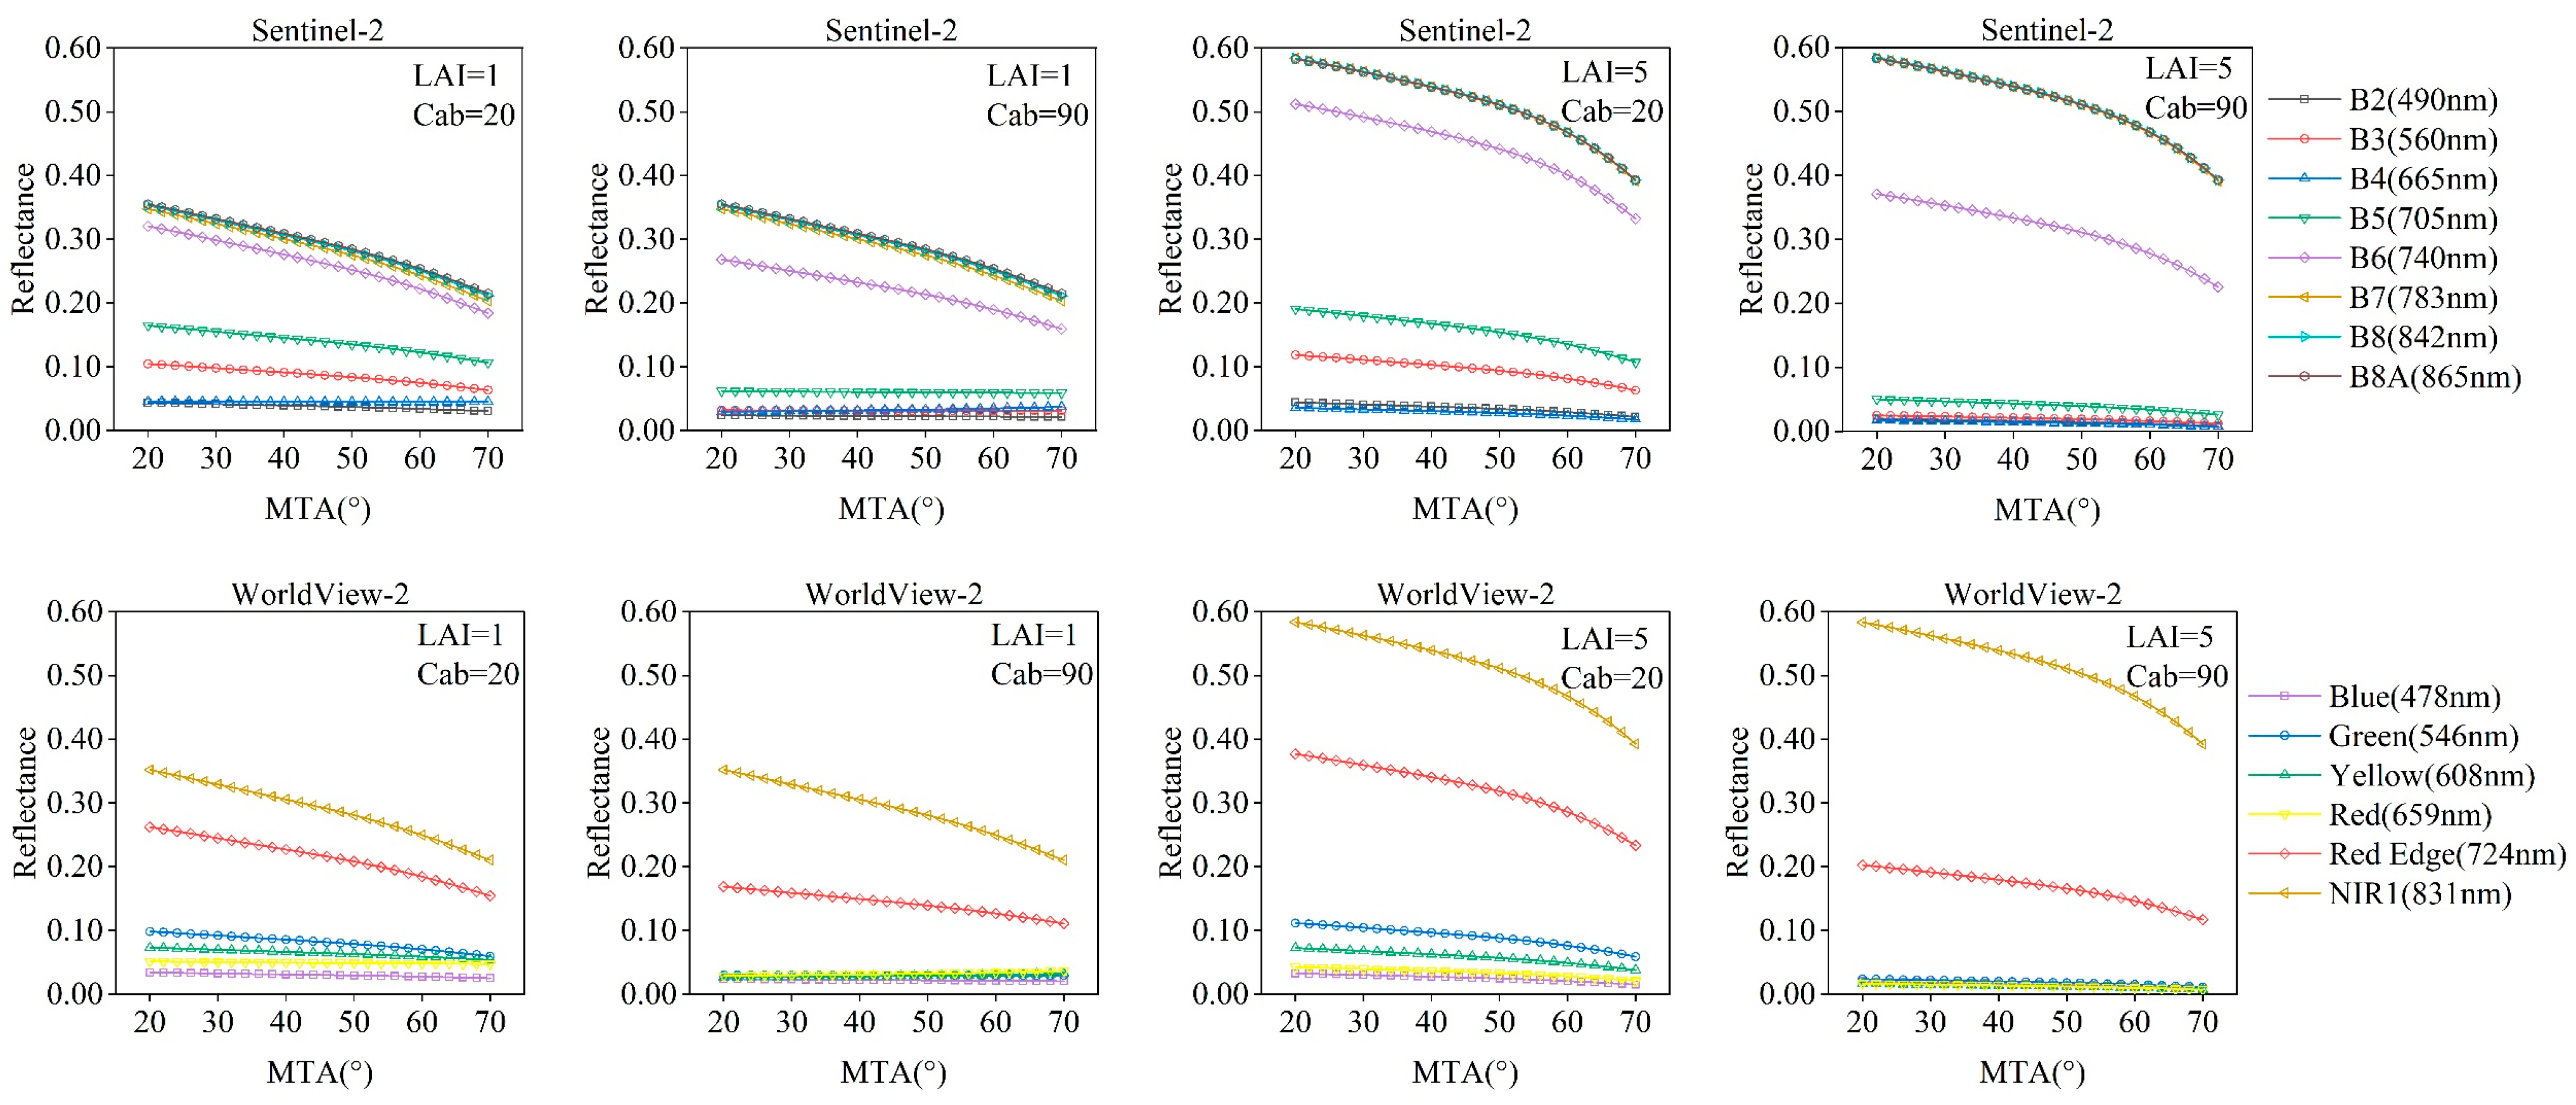
3.1. Responses of Satellite Broadband Reflectance to MTA

For illustration, the responses of individual broadband reflectance bands to MTA from PROSAIL model simulations are presented at four combinations of high and low LAI and Cab in Figure 3. At two low LAI conditions (LAI = 1), reflectance in the NIR region had a strong negative correlation with MTA for all the satellites. At the same time, MTA presented a medium to strong negative correlation with reflectance in the red edge depending on the satellite sensors. In the visible region, MTA had little effect on reflectance when Cab was high (Cab = 90). At two high LAI conditions (LAI = 5), MTA presented strong negative correlations with reflectance in NIR, and this correlation was enhanced when MTA varied between 60 and 70°. The determination coefficients between CCC, MTA and individual band reflectance using field-measured and model-simulated datasets were presented in Table A1. Generally, the bands with the strongest correlation to CCC appeared in visible regions, and those with the strongest correlations to MTA appeared in red edge and NIR regions.

3.2. Performance of Existing Vegetation Indices

The relationships between CCC, MTA and the tested vegetation indices derived from four broadband satellites are presented in Table 3, including both the field-measured dataset and model simulations. In general, model-simulated dataset-derived VIs had stronger correlations with CCC than those of the field-measured dataset.
In field measurements, for the tested VIs calculated using Sentinel-2 bands, the CIred edge had the strongest correlation with CCC (R2CCC = 0.68) and the smallest influence from MTA (R2MTA = 0.05). In model simulations, the CIred edge had the strongest correlation with CCC (R2CCC = 0.90) and a weak correlation with MTA (R2MTA = 0.00). For the other three satellite sensors, in the field-measured dataset analysis, PSND produced the strongest correlations with CCC (R2CCC = 0.49–0.52) and the weakest correlation with MTA (R2MTA = 0.17–0.19). Model-simulated PSND presented a medium-strong correlation with CCC (R2CCC = 0.57–0.67) and a weak correlation with MTA (R2MTA = 0.00–0.01). In model simulations, TCARI/OSAVI had the strongest correlation with CCC (R2CCC = 0.87–0.88) and the weakest correlation with MTA (R2MTA = 0.01). This index had medium-strong correlations with both CCC (R2CCC = 0.29–0.33) and MTA (R2MTA = 0.37–0.41). MTA had the largest effect on EVI in both the field-measured dataset (R2MTA = 0.61–0.64) and model simulations (R2MTA = 0.31–0.36).

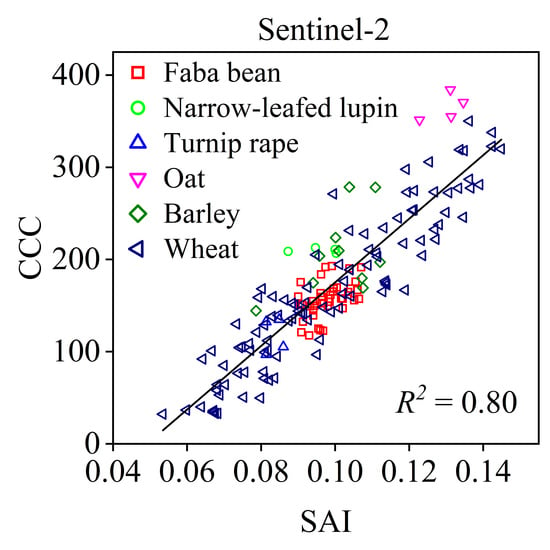
3.3. Identification of New Indices

In addition to the twelve tested vegetation indices, the potential of six two-band and five three-band new vegetation indices of predefined type were investigated for CCC estimation using the four satellite bands. In Figure A2 and Figure A3, for the six two-band types of indices, the matrices of determinations of coefficients between CCC (R2CCC), MTA (R2MTA) and vegetation indices using all possible combinations of field-measured datasets based on RI, NDVI, DI, SAI, MSR, MSAI formulations are presented. The corresponding difference matrices between R2CCC and R2MTA based on the six formulations are presented in Figure 4. The three best band sets for the three-band indices identified using simulated satellite bands in the field-measured dataset are presented in Table 4. These identified best bands for the two-band and three-band indices and the corresponding R2CCC and R2MTA using the field-measured data are presented in Table 4 and Table 5, respectively. The identified best indices were validated with PROSAIL model simulations, and the results are presented in Table 6.
In the Sentinel-2 bands, all the best new indices presented strong correlations with CCC (R2CCC = 0.74–0.80) and no correlation with MTA (R2MTA = 0.00–0.02). SAI (B6, B7), was identified as the best (R2CCC = 0.80 and R2MTA = 0.00) among all the new indices in the field-measured dataset (Figure 5). This combination was found to have a strong correlation with CCC (R2CCC = 0.95) and a weak correlation with MTA (R2MTA = 0.00) in the model-simulated dataset (Figure 6), as shown in Table 6. In the simulated WorldView-2 data, the R2CCC varied between 0.44 and 0.78 and R2MTA varied between 0.00 and 0.11. The identified new three-band of indices performed better (R2CCC = 0.58–0.78 and R2MTA = 0.0–0.10) than the two-band indices (R2CCC = 0.44–0.74 and R2MTA = 0.02–0.11). BSI-V (NIR1, Red, Red Edge) was identified as the best new index (R2CCC = 0.78 and R2MTA = 0.00). In the model-simulated dataset, this combination was found to have a strong correlation with CCC (R2CCC = 0.90) and no correlation with MTA (R2MTA = 0.01). In the simulated RapidEye data, large variations on correlation were identified among the best new indices for CCC (R2CCC = 0.22–0.76) and MTA (R2MTA = 0.00–0.32). BSI-T (red edge, green, NIR) was the best-performing index (R2CCC = 0.76 and R2MTA = 0.00) and was found to have a strong correlation with CCC (R2CCC = 0.84) and no correlation with MTA (R2MTA = 0.00) in the model-simulated dataset. In the simulated GaoFen-6 data, the best new indices presented large variations in correlations with CCC (R2CCC = 0.14–0.78) and MTA (R2MTA = 0.00–0.23). DI (B6, B4) was identified as the best index (R2CCC = 0.78 and R2MTA = 0.00) and was found to have a strong correlation with CCC (R2CCC = 0.94) and almost no correlation with MTA (R2MTA = 0.04) in the model-simulated dataset.

4. Discussion

Potential CCC-sensitive but MTA-insensitive satellite broadband vegetation indices were developed. To our knowledge, this is among the few studies that have focused on specifically designing this type of vegetation index. The vegetation indices were calibrated with field measurements and validated with widely used PROSAIL model simulations. The canopy reflectance model can be used to accurately simulate the actual reflectance spectra without the inherent bias caused by the specific growth conditions at any study sites.
Actual field-measured datasets have limited ranges of variables of interest and specific data distributions (with possibly site-specific) internal correlations. This limits their generality for calibrating vegetation indices. While model-based fits are universal, they inevitably include simplifications, such as the absence of material other than leaves. Before application, all theoretical models need to be validated in the field. A compromise is to link an existing field-measured dataset with model simulations as suggested in a previous study [82]. An efficient vegetation index should be supported both by field measurements and model simulations. In this study, the identified best indices for each satellite presented a good match between measurements and simulations.
The newly developed indices performed better than the tested existing vegetation indices and are recommended to remotely estimate crop CCC from satellites across species and seasonality. Theoretically, three-band vegetation indices have a larger information content and flexibility than two-band combinations. However, in our study, the three-band vegetation indices did not show a great advantage over the simpler two-band formulations. For the simulated Sentinel-2 and GaoFen-6 bands, the best indices were two-band, while for the WorldView-2 and RapidEye, the identified best indices were three-band.
Regardless of the number of bands, all the best indices for each satellite were constructed from NIR and red edge bands. This agreed with previous studies performed by [33], who demonstrated that these two band combinations are minimally affected by crop phenology and can potentially be used as generic algorithms to crop CCC estimation. Red edge reflectance is strongly negatively correlated with MTA [44,46], and the addition of this channel can attenuate the sensitivity of vegetation indices to leaf angles [83]. Sentinel-2 MSI performed better than the other evaluated satellite sensors in both field-measured data and model simulations, indicating a more optimal spectral band combination. Similarly, in all tested vegetation indices, the CIred edge computed with Sentinel-2 data was the best vegetation index strongly correlated with CCC (R2CCC = 0.68 in field measured data and R2CCC = 0.90 in model simulated data) and no correlation with MTA (R2MTA = 0.05 in field measured data and R2MTA = 0.00 in model simulated data). In previous studies, the performance of CIred edge has been evaluated for single crop species either from real Sentinel-2 imagery or resampled from field canopy reflectance. The following relationships have been reported in the literature for CIred edge and CCC: R2CCC = 0.58 for potato [34], R2CCC = 0.86 and 0.94 for maize and soybean, respectively [33], and R2CCC = 0.74 for wheat [35]. These relationships agree with the results in this study, which can be explained by the fact that the CIred edge was suitable for crop CCC estimation under a mixed pixel scenario [3].
For the other vegetation indices derived from Sentinel-2 bands, such as NDVI, NDRE1, NDRE2, MTCI, TCARI/OSAVI and TCARI/OSAVIred edge, R2CCC varied between 0.12 and 0.64 for field measured data and between 0.50 and 0.82 for model simulations. In a previous study, these correlations were between 0.66 and 0.78 for single wheat species [35], which are larger than that found in the field-measured data but within the range of our model simulations. Especially for the MTCI, which is specifically designed for the MERIS spectrometer, the correlation between CCC and real MERIS data-derived MTCI is R2CCC = 0.24 for soybean [26]. The value is better than that from Sentinel-2 data (R2CCC = 0.12) but lower than that from GaoFen-6 data (R2CCC = 0.48). The model-simulated MERIS-based MTCI presented a stronger correlation with CCC (R2CCC = 0.69) than real MERIS data [26], but this value is lower than the model simulation based on Sentinel-2 (R2CCC = 0.76) and GanFen-6 (R2CCC = 0.82) data in this study and even lower than that of proximal spectra- simulated Sentinel-2 data (R2CCC = 0.89) for maize and soybean [33].
Except for Sentinel-2, the three other satellites (WorldView2, RapidEye and GaoFen-6) have been widely used for remote sensing of vegetation. Surprisingly, there are few reports on their use for the estimation of CCC for field crops. In all tested vegetation indices, PSND had the strongest correlations with CCC in the field-measured data (R2CCC = 0.49–0.52), and similar results were found in PROSAIL model simulations (R2CCC = 0.56–0.68). TCARI/OSAVI presented the best correlation with CCC in PROSAIL model simulations (R2CCC = 0.82–0.88) and no correlation with MTA (R2MTA = 0.01), but this good performance was not consistent in field measurements. The matrices of difference between R2CCC and R2MTA for the three two-band RI and NDI are similar (Figure 4), and identical bands were identified for the best vegetation indices of both types. This can be explained by their mathematical similarity [84]. However, comparing the four satellite sensors, large differences in performance were found among the best vegetation indices of each type in both field measurements (Table 4 and Table 5) and model simulations (Table 6). Thus, finding the right type is also very important for optimizing vegetation indices.
For CCC estimation, it is essential to use band combinations. CCC effects on the responses of MTA to individual broadband reflectance varied with the combination of LAI and Cab. Even at similar CCC levels (CCC = 90–100 in Figure 3 in the second and third columns), this relationship can vary greatly. This is mainly because LAI and Cab determine the reflectance of different broadband separately. Generally, the MTA responses to NIR reflectance were determined by LAI and those to visible reflectance were determined by Cab.
Although the identified vegetation indices for the four satellite spectral configurations in this study produced good results in both field-measured and model-simulated data and are recommended for crop CCC estimation, there are some limitations in this study. First, the derived vegetation indices were not validated with real satellite imagery. Satellite sensor imaging needs to consider the atmospheric radiation and transmittance, geometric characteristics, spatial resolutions and signal-to-noise ratio, which limit the transferability of the vegetation indices developed in this study. Unfortunately, real satellite imagery could not be acquired simultaneously for the particular study area over a given time. In the future, more effort needs to be put into vegetation index evaluations using real satellite imagery.
The potential CCC-sensitive but MTA-insensitive satellite broadband vegetation indices developed in this study may provide a convenient method for accurately estimating crop CCC with diverse canopy architectures using satellite remote sensing data.

5. Conclusions

This research attempted to investigate the potential of satellite broadband vegetation indices for crop canopy chlorophyll content estimation with minimum effects from leaf inclination angle distribution. The broadband vegetation indices of four satellites (Sentinel-2, RapidEye, WorldView-2 and GaoFen-6) were resampled from canopy airborne imaging spectroscopy data of six crop species with various canopy structures. To obtain generic and robust crop CCC indices, both field-measured datasets and model simulations were used in this study. The best vegetation indices identified in this study are the soil-adjusted index type index SAI (B6, B7) for Sentinel-2, Verrelts’s three-band spectral index type index BSI-V (NIR1, Red, Red Edge) for WorldView-2, Tian’s three-band spectral index type index BSI-T (Red Edge, Green, NIR) for RapidEye and difference index type index DI (B6, B4) for GaoFen-6. The recommended indices produced strong correlations with CCC (R2CCC = 0.76–0.80 in field-measured data and R2CCC = 0.84–0.95 in model simulations) and no correlation with MTA (R2MTA = 0.00 for field-measured data and R2MTA = 0.00–0.04 for model simulations) and maintained consistent performance in both the field-measured dataset and model simulations. Thus, it is anticipated that more generic vegetation indices for crop CCC estimation can be derived from satellite broadband data. However, this is only a case study, and further studies are required to examine the suitability across more crop species and growth stages using real satellite imagery.

Author Contributions

X.Z. and J.J. conceived the research and implemented the data analysis. X.Z. prepared the original draft. M.M. revised the manuscript and supervised the research. All authors have read and agreed to the published version of the manuscript.

Funding

This research was supported by the National Science Foundation of China (grant No. 41801243) and the Academy of Finland (grant No. 317387).

Data Availability Statement

All data are presented within the article.

Acknowledgments

The authors would like to thank Priit Tammeorg, Clara Lizarazo Torres, Piia Kekkonen, F.L. Stoddard and Pirjo Mäkelä from the University of Helsinki, who kindly provided the SunScan and SPAD measurement data, and Petri Pellikka from the University of Helsinki for the hyperspectral acquisitions.

Conflicts of Interest

The authors declare no conflict of interest.

Appendix A

Table A1. The central wavelength, bandwidth and spatial resolution and R2 values from field measured dataset between CCC, MTA and individual band reflectance of four satellite sensors.
SensorCentral
Wavelength (nm)
Band/Band NumberBandwidth (nm)Spatial
Resolution (m)
MeasurementsModel
R C C C 2 R M T A 2 R C C C 2 R M T A 2
Sentinel-2490265100.580.000.390.25
560350100.440.050.420.08
665430100.530.080.540.07
705515200.070.770.430.10
740615200.000.870.000.45
783720200.040.780.270.39
8428115100.040.770.260.39
8658A20200.040.760.260.40
Worldview-2478Blue601.80.600.000.290.45
546Green701.80.450.050.410.08
608Yellow401.80.490.010.510.05
659Red601.80.540.050.570.06
724Red Edge401.80.000.870.100.33
831NIR11251.80.040.770.260.39
RapidEye475Blue7050.600.000.290.47
555Green7050.450.040.420.08
657.5Red5550.530.070.570.07
710Red Edge4050.030.830.310.19
805NIR9050.040.780.260.39
GaoFen-6485170160.580.010.390.26
555270160.460.030.420.08
660360160.550.050.570.06
8304120160.040.770.260.39
710540160.080.760.390.15
750640160.010.850.080.44
610840160.490.010.510.05
Figure A1. Spectral response functions of satellite sensors used for simulation of broadband reflectance.
Remotesensing 15 01234 g0a1
Figure A2. Map of the coefficient of determination between the CCC (R2CCC) and vegetation indices using all two band combinations based on the RI, NDVI, DI, SAI, MSR and MSAI formulations. The color indicates different R2 values.
Remotesensing 15 01234 g0a2
Figure A3. Map of the coefficient of determination between MTA (R2MTA) and vegetation indices using all two band combinations based on RI, NDVI, DI, SAI, MSR and MSAI formulations. The color indicates different R2 values.
Remotesensing 15 01234 g0a3

References

  1. Richardson, A.D.; Duigan, S.P.; Berlyn, G.P. An Evaluation of Noninvasive Methods to Estimate Foliar Chlorophyll Content. New Phytol. 2002, 153, 185–194. [Google Scholar] [CrossRef] [Green Version]
  2. Ustin, S.L.; Gitelson, A.A.; Jacquemoud, S.; Schaepman, M.; Asner, G.P.; Gamon, J.A.; Zarco-Tejada, P. Retrieval of Foliar Information about Plant Pigment Systems from High Resolution Spectroscopy. Remote Sens. Environ. 2009, 113, S67–S77. [Google Scholar] [CrossRef] [Green Version]
  3. Gitelson, A.A. Remote Estimation of Canopy Chlorophyll Content in Crops. Geophys. Res. Lett. 2005, 32, L08403. [Google Scholar] [CrossRef] [Green Version]
  4. Bacour, C.; Baret, F.; Béal, D.; Weiss, M.; Pavageau, K. Neural Network Estimation of LAI, FAPAR, FCover and LAI×Cab, from Top of Canopy MERIS Reflectance Data: Principles and Validation. Remote Sens. Environ. 2006, 105, 313–325. [Google Scholar] [CrossRef]
  5. Wu, C.; Niu, Z.; Gao, S. The Potential of the Satellite Derived Green Chlorophyll Index for Estimating Midday Light Use Efficiency in Maize, Coniferous Forest and Grassland. Ecol. Indic. 2012, 14, 66–73. [Google Scholar] [CrossRef]
  6. Murchie, E.H.; Lawson, T. Chlorophyll Fluorescence Analysis: A Guide to Good Practice and Understanding Some New Applications. J. Exp. Bot. 2013, 64, 3983–3998. [Google Scholar] [CrossRef] [PubMed] [Green Version]
  7. Luo, X.; Croft, H.; Chen, J.M.; Bartlett, P.; Staebler, R.; Froelich, N. Incorporating Leaf Chlorophyll Content into a Two-Leaf Terrestrial Biosphere Model for Estimating Carbon and Water Fluxes at a Forest Site. Agric. For. Meteorol. 2018, 248, 156–168. [Google Scholar] [CrossRef] [Green Version]
  8. Baret, F.; Houlès, V.; Guérif, M. Quantification of Plant Stress Using Remote Sensing Observations and Crop Models: The Case of Nitrogen Management. J. Exp. Bot. 2007, 58, 869–880. [Google Scholar] [CrossRef] [Green Version]
  9. Wu, C.; Wang, L.; Niu, Z.; Gao, S.; Wu, M. Nondestructive Estimation of Canopy Chlorophyll Content Using Hyperion and Landsat/TM Images. Int. J. Remote Sens. 2010, 31, 2159–2167. [Google Scholar] [CrossRef]
  10. Watson, D.J. Comparative Physiological Studies on the Growth of Field Crops: I. Variation in Net Assimilation Rate and Leaf Area between Species and Varieties, and within and between Years. Ann. Bot. 1947, 11, 41–76. [Google Scholar] [CrossRef]
  11. Inoue, Y.; Guérif, M.; Baret, F.; Skidmore, A.; Gitelson, A.; Schlerf, M.; Darvishzadeh, R.; Olioso, A. Simple and Robust Methods for Remote Sensing of Canopy Chlorophyll Content: A Comparative Analysis of Hyperspectral Data for Different Types of Vegetation. Plant Cell Environ. 2016, 39, 2609–2623. [Google Scholar] [CrossRef] [PubMed] [Green Version]
  12. Zhao, C.; Wang, Z.; Wang, J.; Huang, W.; Guo, T. Early Detection of Canopy Nitrogen Deficiency in Winter Wheat (Triticum aestivum L.) Based on Hyperspectral Measurement of Canopy Chlorophyll Status. N. Z. J. Crop Hortic. Sci. 2011, 39, 251–262. [Google Scholar] [CrossRef] [Green Version]
  13. Korus, A. Effect of Preliminary and Technological Treatments on the Content of Chlorophylls and Carotenoids in Kale (Brassica oleracea L. Var. Acephala). J. Food Process. Preserv. 2013, 37, 335–344. [Google Scholar] [CrossRef]
  14. Schlemmer, M.; Gitelson, A.; Schepers, J.; Ferguson, R.; Peng, Y.; Shanahan, J.; Rundquist, D. Remote Estimation of Nitrogen and Chlorophyll Contents in Maize at Leaf and Canopy Levels. Int. J. Appl. Earth Obs. Geoinf. 2013, 25, 47–54. [Google Scholar] [CrossRef] [Green Version]
  15. Gitelson, A.A.; Viña, A.; Verma, S.B.; Rundquist, D.C.; Arkebauer, T.J.; Keydan, G.; Leavitt, B.; Ciganda, V.; Burba, G.G.; Suyker, A.E. Relationship between Gross Primary Production and Chlorophyll Content in Crops: Implications for the Synoptic Monitoring of Vegetation Productivity. J. Geophys. Res. Atmos. 2006, 111, D08S11. [Google Scholar] [CrossRef] [Green Version]
  16. Peng, Y.; Gitelson, A.A.; Keydan, G.; Rundquist, D.C.; Moses, W. Remote Estimation of Gross Primary Production in Maize and Support for a New Paradigm Based on Total Crop Chlorophyll Content. Remote Sens. Environ. 2011, 115, 978–989. [Google Scholar] [CrossRef]
  17. Prey, L.; Hu, Y.; Schmidhalter, U. High-Throughput Field Phenotyping Traits of Grain Yield Formation and Nitrogen Use Efficiency: Optimizing the Selection of Vegetation Indices and Growth Stages. Front. Plant Sci. 2020, 10, 1672. [Google Scholar] [CrossRef] [Green Version]
  18. Dian, Y.; Le, Y.; Fang, S.; Xu, Y.; Yao, C.; Liu, G. Influence of Spectral Bandwidth and Position on Chlorophyll Content Retrieval at Leaf and Canopy Levels. J. Indian Soc. Remote Sens. 2016, 44, 583–593. [Google Scholar] [CrossRef]
  19. Li, X.; Liu, X.; Liu, M.; Wang, C.; Xia, X. A Hyperspectral Index Sensitive to Subtle Changes in the Canopy Chlorophyll Content under Arsenic Stress. Int. J. Appl. Earth Obs. Geoinf. 2015, 36, 41–53. [Google Scholar] [CrossRef]
  20. Darvishzadeh, R.; Matkan, A.A.; Dashti Ahangar, A. Inversion of a Radiative Transfer Model for Estimation of Rice Canopy Chlorophyll Content Using a Lookup-Table Approach. IEEE J. Sel. Top. Appl. Earth Obs. Remote Sens. 2012, 5, 1222–1230. [Google Scholar] [CrossRef]
  21. Ali, A.M.; Darvishzadeh, R.; Skidmore, A.; Heurich, M.; Paganini, M.; Heiden, U.; Mücher, S. Evaluating Prediction Models for Mapping Canopy Chlorophyll Content Across Biomes. Remote Sens. 2020, 12, 1788. [Google Scholar] [CrossRef]
  22. Dorigo, W.A.; Zurita-Milla, R.; de Wit, A.J.W.; Brazile, J.; Singh, R.; Schaepman, M.E. A Review on Reflective Remote Sensing and Data Assimilation Techniques for Enhanced Agroecosystem Modeling. Int. J. Appl. Earth Obs. Geoinf. 2007, 9, 165–193. [Google Scholar] [CrossRef]
  23. Moulin, S. Impacts of Model Parameter Uncertainties on Crop Reflectance Estimates: A Regional Case Study on Wheat. Int. J. Remote Sens. 1999, 20, 213–218. [Google Scholar] [CrossRef]
  24. Taddeo, S.; Dronova, I.; Depsky, N. Spectral Vegetation Indices of Wetland Greenness: Responses to Vegetation Structure, Composition, and Spatial Distribution. Remote Sens. Environ. 2019, 234, 111467. [Google Scholar] [CrossRef]
  25. Mao, Z.H.; Deng, L.; Duan, F.Z.; Li, X.J.; Qiao, D.Y. Angle Effects of Vegetation Indices and the Influence on Prediction of SPAD Values in Soybean and Maize. Int. J. Appl. Earth Obs. Geoinf. 2020, 93, 102198. [Google Scholar] [CrossRef]
  26. Sun, Q.; Jiao, Q.; Qian, X.; Liu, L.; Liu, X.; Dai, H. Improving the Retrieval of Crop Canopy Chlorophyll Content Using Vegetation Index Combinations. Remote Sens. 2021, 13, 470. [Google Scholar] [CrossRef]
  27. Dash, J.; Curran, P.J. The MERIS Terrestrial Chlorophyll Index. Int. J. Remote Sens. 2004, 25, 5403–5413. [Google Scholar] [CrossRef]
  28. Gitelson, A.; Merzlyak, M.N. Quantitative Estimation of Chlorophyll-a Using Reflectance Spectra: Experiments with Autumn Chestnut and Maple Leaves. J. Photochem. Photobiol. B 1994, 22, 247–252. [Google Scholar] [CrossRef]
  29. Clevers, J.G.P.W.; Kooistra, L. Using Hyperspectral Remote Sensing Data for Retrieving Canopy Chlorophyll and Nitrogen Content. IEEE J. Sel. Top. Appl. Earth Obs. Remote Sens. 2012, 5, 574–583. [Google Scholar] [CrossRef]
  30. He, R.; Li, H.; Qiao, X.; Jiang, J. Using Wavelet Analysis of Hyperspectral Remote-Sensing Data to Estimate Canopy Chlorophyll Content of Winter Wheat under Stripe Rust Stress. Int. J. Remote Sens. 2018, 39, 4059–4076. [Google Scholar] [CrossRef]
  31. Li, L.; Ren, T.; Ma, Y.; Wei, Q.; Wang, S.; Li, X.; Cong, R.; Liu, S.; Lu, J. Evaluating Chlorophyll Density in Winter Oilseed Rape (Brassica napus L.) Using Canopy Hyperspectral Red-Edge Parameters. Comput. Electron. Agric. 2016, 126, 21–31. [Google Scholar] [CrossRef]
  32. Okuda, K.; Taniguchi, K.; Miura, M.; Obata, K.; Yoshioka, H. Application of Vegetation Isoline Equations for Simultaneous Retrieval of Leaf Area Index and Leaf Chlorophyll Content Using Reflectance of Red Edge Band. In Proceedings of the Remote Sensing and Modeling of Ecosystems for Sustainability XIII, San Diego, CA, USA, 28 August–1 September 2016; Volume 9975, pp. 87–93. [Google Scholar]
  33. Peng, Y.; Nguy-Robertson, A.; Arkebauer, T.; Gitelson, A.A. Assessment of Canopy Chlorophyll Content Retrieval in Maize and Soybean: Implications of Hysteresis on the Development of Generic Algorithms. Remote Sens. 2017, 9, 226. [Google Scholar] [CrossRef] [Green Version]
  34. Clevers, J.; Kooistra, L.; van den Brande, M. Using Sentinel-2 Data for Retrieving LAI and Leaf and Canopy Chlorophyll Content of a Potato Crop. Remote Sens. 2017, 9, 405. [Google Scholar] [CrossRef] [Green Version]
  35. Xie, Q.; Dash, J.; Huete, A.; Jiang, A.; Yin, G.; Ding, Y.; Peng, D.; Hall, C.C.; Brown, L.; Shi, Y.; et al. Retrieval of Crop Biophysical Parameters from Sentinel-2 Remote Sensing Imagery. Int. J. Appl. Earth Obs. Geoinf. 2019, 80, 187–195. [Google Scholar] [CrossRef]
  36. Gausman, H.W.; Allen, W.A.; Cardenas, R.; Richardson, A.J. Effects of Leaf Nodal Position on Absorption and Scattering Coefficients and Infinite Reflectance of Cotton Leaves, Gossypium hirsutum L. Agron. J. 1971, 63, 87–91. [Google Scholar] [CrossRef]
  37. Sellers, P.J. Vegetation-Canopy Spectral Reflectance and Biophysical Processes; Asrar, G., Ed.; John Wiley and Sons: New York, NY, USA, 1989. [Google Scholar]
  38. Asner, G.P. Biophysical and Biochemical Sources of Variability in Canopy Reflectance. Remote Sens. Environ. 1998, 64, 234–253. [Google Scholar] [CrossRef]
  39. Zou, X.; Hernández-Clemente, R.; Tammeorg, P.; Lizarazo Torres, C.; Stoddard, F.L.; Mäkelä, P.; Pellikka, P.; Mõttus, M. Retrieval of Leaf Chlorophyll Content in Field Crops Using Narrow-Band Indices: Effects of Leaf Area Index and Leaf Mean Tilt Angle. Int. J. Remote Sens. 2015, 36, 6031–6055. [Google Scholar] [CrossRef]
  40. Zou, X.; Mõttus, M. Sensitivity of Common Vegetation Indices to the Canopy Structure of Field Crops. Remote Sens. 2017, 9, 994. [Google Scholar] [CrossRef] [Green Version]
  41. Ross, J. Tasks for Vegetation Science. In The Radiation Regime and Architecture of Plant Stands; Springer: Dordrecht, The Netherlands, 1981; ISBN 978-90-6193-607-7. [Google Scholar]
  42. McNeil, B.E.; Pisek, J.; Lepisk, H.; Flamenco, E.A. Measuring Leaf Angle Distribution in Broadleaf Canopies Using UAVs. Agric. For. Meteorol. 2016, 218, 204–208. [Google Scholar] [CrossRef]
  43. Zou, X.; Mõttus, M. Retrieving Crop Leaf Tilt Angle from Imaging Spectroscopy Data. Agric. For. Meteorol. 2015, 205, 73–82. [Google Scholar] [CrossRef]
  44. Zou, X.; Zhu, S.; Mõttus, M. Estimation of Canopy Structure of Field Crops Using Sentinel-2 Bands with Vegetation Indices and Machine Learning Algorithms. Remote Sens. 2022, 14, 2849. [Google Scholar] [CrossRef]
  45. Jiao, Q.; Sun, Q.; Zhang, B.; Huang, W.; Ye, H.; Zhang, Z.; Zhang, X.; Qian, B. A Random Forest Algorithm for Retrieving Canopy Chlorophyll Content of Wheat and Soybean Trained with PROSAIL Simulations Using Adjusted Average Leaf Angle. Remote Sens. 2022, 14, 98. [Google Scholar] [CrossRef]
  46. Zou, X.; Mõttus, M.; Tammeorg, P.; Torres, C.L.; Takala, T.; Pisek, J.; Mäkelä, P.; Stoddard, F.L.; Pellikka, P. Photographic Measurement of Leaf Angles in Field Crops. Agric. For. Meteorol. 2014, 184, 137–146. [Google Scholar] [CrossRef] [Green Version]
  47. Ryu, Y.; Sonnentag, O.; Nilson, T.; Vargas, R.; Kobayashi, H.; Wenk, R.; Baldocchi, D.D. How to Quantify Tree Leaf Area Index in an Open Savanna Ecosystem: A Multi-Instrument and Multi-Model Approach. Agric. For. Meteorol. 2010, 150, 63–76. [Google Scholar] [CrossRef]
  48. Pisek, J.; Ryu, Y.; Alikas, K. Estimating Leaf Inclination and G-Function from Leveled Digital Camera Photography in Broadleaf Canopies. Trees 2011, 25, 919–924. [Google Scholar] [CrossRef]
  49. Pisek, J.; Sonnentag, O.; Richardson, A.D.; Mõttus, M. Is the Spherical Leaf Inclination Angle Distribution a Valid Assumption for Temperate and Boreal Broadleaf Tree Species? Agric. For. Meteorol. 2013, 169, 186–194. [Google Scholar] [CrossRef]
  50. Campbell, G.S. Derivation of an Angle Density Function for Canopies with Ellipsoidal Leaf Angle Distributions. Agric. For. Meteorol. 1990, 49, 173–176. [Google Scholar] [CrossRef]
  51. Markwell, J.; Osterman, J.C.; Mitchell, J.L. Calibration of the Minolta SPAD-502 Leaf Chlorophyll Meter. Photosynth. Res. 1995, 46, 467–472. [Google Scholar] [CrossRef]
  52. Vohland, M.; Mader, S.; Dorigo, W. Applying Different Inversion Techniques to Retrieve Stand Variables of Summer Barley with PROSPECT+SAIL. Int. J. Appl. Earth Obs. Geoinf. 2010, 12, 71–80. [Google Scholar] [CrossRef]
  53. Feret, J.-B.; François, C.; Asner, G.P.; Gitelson, A.A.; Martin, R.E.; Bidel, L.P.R.; Ustin, S.L.; le Maire, G.; Jacquemoud, S. PROSPECT-4 and 5: Advances in the Leaf Optical Properties Model Separating Photosynthetic Pigments. Remote Sens. Environ. 2008, 112, 3030–3043. [Google Scholar] [CrossRef]
  54. Verhoef, W. Light Scattering by Leaf Layers with Application to Canopy Reflectance Modeling: The SAIL Model. Remote Sens. Environ. 1984, 16, 125–141. [Google Scholar] [CrossRef] [Green Version]
  55. Kuusk, A. The Hot Spot Effect in Plant Canopy Reflectance. In Photon-Vegetation Interactions; Springer: Berlin/Heidelberg, Germany, 1991; pp. 139–159. [Google Scholar] [CrossRef]
  56. Hosgood, B.; Jacquemoud, S.; Andreoli, G.; Verdebout, J.; Pedrini, G.; Schmuck, G. Leaf Optical Properties EXperiment 93 (LOPEX93); Office for Official Publications of the European Communities: Luxembourg, 1994. [Google Scholar]
  57. Haboudane, D.; Miller, J.R.; Pattey, E.; Zarco-Tejada, P.J.; Strachan, I.B. Hyperspectral Vegetation Indices and Novel Algorithms for Predicting Green LAI of Crop Canopies: Modeling and Validation in the Context of Precision Agriculture. Remote Sens. Environ. 2004, 90, 337–352. [Google Scholar] [CrossRef]
  58. Mäkelä, P.; Kleemola, J.; Jokinen, K.; Mantila, J.; Pehu, E.; Peltonen-Sainio, P. Growth Response of Pea and Summer Turnip Rape to Foliar Application of Glycinebetaine. Acta Agric. Scand. Sect. B Soil Plant Sci. 1997, 47, 168–175. [Google Scholar] [CrossRef]
  59. Dennett, M.D.; Ishag, K.H.M. Use of the Expolinear Growth Model to Analyse the Growth of Faba Bean, Peas and Lentils at Three Densities: Predictive Use of the Model. Ann. Bot. 1998, 82, 507–512. [Google Scholar] [CrossRef] [Green Version]
  60. Pinheiro, C.; Rodrigues, A.P.; de Carvalho, I.S.; Chaves, M.M.; Ricardo, C.P. Sugar Metabolism in Developing Lupin Seeds Is Affected by a Short-Term Water Deficit. J. Exp. Bot. 2005, 56, 2705–2712. [Google Scholar] [CrossRef] [Green Version]
  61. Vile, D.; Garnier, É.; Shipley, B.; Laurent, G.; Navas, M.L.; Roumet, C.; Lavorel, S.; Díaz, S.; Hodgson, J.G.; Lloret, F.; et al. Specific Leaf Area and Dry Matter Content Estimate Thickness in Laminar Leaves. Ann. Bot. 2005, 96, 1129–1136. [Google Scholar] [CrossRef] [PubMed]
  62. Vermote, E.F.; Tanre, D.; Deuze, J.L.; Herman, M.; Morcette, J.-J. Second Simulation of the Satellite Signal in the Solar Spectrum, 6S: An Overview. IEEE Trans. Geosci. Remote Sens. 1997, 35, 675–686. [Google Scholar] [CrossRef] [Green Version]
  63. Rouse, J.W. Monitoring the Vernal Advancement and Retrogradation (Green Wave Effect) of Natural Vegetation; NASA/GSFC, Type II; NASA: Greenbelt, MD, USA, 1973. [Google Scholar]
  64. Huete, A.; Didan, K.; Miura, T.; Rodriguez, E.P.; Gao, X.; Ferreira, L.G. Overview of the Radiometric and Biophysical Performance of the MODIS Vegetation Indices. Remote Sens. Environ. 2002, 83, 195–213. [Google Scholar] [CrossRef]
  65. Jiang, Z.; Huete, A.R.; Didan, K.; Miura, T. Development of a Two-Band Enhanced Vegetation Index without a Blue Band. Remote Sens. Environ. 2008, 112, 3833–3845. [Google Scholar] [CrossRef]
  66. Rondeaux, G.; Steven, M.; Baret, F. Optimization of Soil-Adjusted Vegetation Indices. Remote Sens. Environ. 1996, 55, 95–107. [Google Scholar] [CrossRef]
  67. Roujean, J.-L.; Breon, F.-M. Estimating PAR Absorbed by Vegetation from Bidirectional Reflectance Measurements. Remote Sens. Environ. 1995, 51, 375–384. [Google Scholar] [CrossRef]
  68. Blackburn, G.A. Quantifying Chlorophylls and Caroteniods at Leaf and Canopy Scales: An Evaluation of Some Hyperspectral Approaches. Remote Sens. Environ. 1998, 66, 273–285. [Google Scholar] [CrossRef]
  69. Daughtry, C.S.T.; Walthall, C.L.; Kim, M.S.; de Colstoun, E.B.; McMurtrey, J.E. Estimating Corn Leaf Chlorophyll Concentration from Leaf and Canopy Reflectance. Remote Sens. Environ. 2000, 74, 229–239. [Google Scholar] [CrossRef]
  70. Wu, C.; Niu, Z.; Tang, Q.; Huang, W. Estimating Chlorophyll Content from Hyperspectral Vegetation Indices: Modeling and Validation. Agric. For. Meteorol. 2008, 148, 1230–1241. [Google Scholar] [CrossRef]
  71. Barnes, E.; Clarke, T.R.; Richards, S.E.; Colaizzi, P.; Haberland, J.; Kostrzewski, M.; Waller, P.; Choi, C.; Riley, E.; Thompson, T.L. Coincident Detection of Crop Water Stress, Nitrogen Status, and Canopy Density Using Ground Based Multispectral Data. In Proceedings of the Fifth International Conference on Precision Agriculture, Bloomington, MN, USA, 16–19 July 2000. [Google Scholar]
  72. Gitelson, A.A.; Gritz, Y.; Merzlyak, M.N. Relationships between Leaf Chlorophyll Content and Spectral Reflectance and Algorithms for Non-Destructive Chlorophyll Assessment in Higher Plant Leaves. J. Plant Physiol. 2003, 160, 271–282. [Google Scholar] [CrossRef] [PubMed]
  73. Rouse, J.W.; Haas, R.H.; Deering, D.W.; Schell, J.A.; Harlan, J.C. Monitoring the Vernal Advancement of Retrogradation (Green Wave Effect) of Natural Vegetation; NASA/GSFC, Type III, Final Report; NASA: Greenbelt, MD, USA, 1974. [Google Scholar]
  74. Tucker, C.J. Red and Photographic Infrared Linear Combinations for Monitoring Vegetation. Remote Sens. Environ. 1979, 8, 127–150. [Google Scholar] [CrossRef] [Green Version]
  75. Huete, A.R. A Soil-Adjusted Vegetation Index (SAVI). Remote Sens. Environ. 1988, 25, 295–309. [Google Scholar] [CrossRef]
  76. Qi, J.; Chehbouni, A.; Huete, A.R.; Kerr, Y.H.; Sorooshian, S. A Modified Soil Adjusted Vegetation Index. Remote Sens. Environ. 1994, 48, 119–126. [Google Scholar] [CrossRef]
  77. Broge, N.H.; Leblanc, E. Comparing Prediction Power and Stability of Broadband and Hyperspectral Vegetation Indices for Estimation of Green Leaf Area Index and Canopy Chlorophyll Density. Remote Sens. Environ. 2001, 76, 156–172. [Google Scholar] [CrossRef]
  78. Gitelson, A.A.; Keydan, G.P.; Merzlyak, M.N. Three-Band Model for Noninvasive Estimation of Chlorophyll, Carotenoids, and Anthocyanin Contents in Higher Plant Leaves. Geophys. Res. Lett. 2006, 33, 026457. [Google Scholar] [CrossRef] [Green Version]
  79. Tian, Y.; Gu, K.; Chu, X.; Yao, X.; Cao, W.; Zhu, Y. Comparison of Different Hyperspectral Vegetation Indices for Canopy Leaf Nitrogen Concentration Estimation in Rice. Plant Soil 2014, 376, 193–209. [Google Scholar] [CrossRef]
  80. Verrelst, J.; Rivera, J.P.; Veroustraete, F.; Muñoz-Marí, J.; Clevers, J.G.P.W.; Camps-Valls, G.; Moreno, J. Experimental Sentinel-2 LAI Estimation Using Parametric, Non-Parametric and Physical Retrieval Methods—A Comparison. ISPRS J. Photogramm. Remote Sens. 2015, 108, 260–272. [Google Scholar] [CrossRef]
  81. Wang, W.; Yao, X.; Yao, X.; Tian, Y.; Liu, X.; Ni, J.; Cao, W.; Zhu, Y. Estimating Leaf Nitrogen Concentration with Three-Band Vegetation Indices in Rice and Wheat. Field Crops Res. 2012, 129, 90–98. [Google Scholar] [CrossRef]
  82. le Maire, G.; François, C.; Soudani, K.; Berveiller, D.; Pontailler, J.Y.; Bréda, N.; Genet, H.; Davi, H.; Dufrêne, E. Calibration and Validation of Hyperspectral Indices for the Estimation of Broadleaved Forest Leaf Chlorophyll Content, Leaf Mass per Area, Leaf Area Index and Leaf Canopy Biomass. Remote Sens. Environ. 2008, 112, 3846–3864. [Google Scholar] [CrossRef]
  83. Dong, T.; Liu, J.; Shang, J.; Qian, B.; Ma, B.; Kovacs, J.M.; Walters, D.; Jiao, X.; Geng, X.; Shi, Y. Assessment of Red-Edge Vegetation Indices for Crop Leaf Area Index Estimation. Remote Sens. Environ. 2019, 222, 133–143. [Google Scholar] [CrossRef]
  84. Zeng, Y.; Hao, D.; Huete, A.; Dechant, B.; Berry, J.; Chen, J.M.; Joiner, J.; Frankenberg, C.; Bond-Lamberty, B.; Ryu, Y.; et al. Optical Vegetation Indices for Monitoring Terrestrial Ecosystems Globally. Nat. Rev. Earth Environ. 2022, 3, 477–493. [Google Scholar] [CrossRef]
Figure 1. A map of the field site and aerial imagery of field plots.
Remotesensing 15 01234 g001
Figure 2. Mean reflectance spectra of the six crop species used in the study: the four simulated satellite broadband spectra and AISA spectra.
Remotesensing 15 01234 g002
Figure 3. Responses of satellite broadband reflectance to leaf mean tilt angle (MTA) from PROSAIL model simulation for four combinations of high and low LAI and Cab: low LAI and low Cab (left column), low LAI and high Cab (second column), high LAI and low Cab (third column) and high LAI and high Cab (right column) for Sentinel-2 (top row), WorldView-2 (second row), RapidEye (third row), and GeoFen-6 (bottom row).
Remotesensing 15 01234 g003aRemotesensing 15 01234 g003b
Figure 4. Matrices of difference between R2CCC and R2MTA in all possible two band combinations for RI, NDI, DI, SAI, MSR and MSAI formulations. The color indicates different R2 values, blank negative values.
Remotesensing 15 01234 g004
Figure 5. Correlation between the best vegetation indices, and CCC (top row) and MTA (bottom row) in Sentienl−2 (left column), WorldView−2 (second column), RapidEye (third column) and GaoFen-6 (right column) in the field measured dataset.
Remotesensing 15 01234 g005
Figure 6. Correlation between the best vegetation indices, and CCC (top row) and MTA (bottom row) for Sentinel−2 (left column), WorldView−2 (second column), RapidEye (third column) and GaoFen-6 (right column) in model simulations.
Remotesensing 15 01234 g006
Table 1. The variable settings of the PROSAIL model.
ModelVariableValue or Range
PROSPECTLeaf structure parameter (N)1.55
Leaf chlorophyll content (Cab)20:5:90 μg cm−2
Equivalent water thickness (Cw)0.001 cm
Dry matter content (Cm)0.005 g cm−2
Brown pigment content (Cbp)0 μg cm−2
Carotenoid content (Ccar)Linked to Cab (0.2 × Cab) μg cm−2
SAILLeaf area index (LAI)1, 1.1, …, 5.0
Leaf mean tilt angle (MTA)20, 22, …, 70°
Hot spot size0.01
Solar zenith angle (ts)49.4°
Observer zenith angle (to)
Azimuth angle (φ)90°
Fraction of diffuse radiation (skyl)6S model (Wm−2 nm−1)
Soil reflectanceASD measurement
Table 2. The vegetation indices used in this study: indices 1–12 are existing indices with fixed wavelengths; 13–23 are general indices with wavelengths found by optimization.
NoIndexAbbreviationFormulationReference
1Normalized difference vegetation indexNDVI R N I R R R e d R N I R + R R e d [63]
2Enhanced vegetation indexEVI 2.5 ( R N I R R R e d ) R N I R + 6 R R e d 7.5 R B l u e + 1 [64]
3Two-band enhanced vegetation indexEVI2 2.5 ( R N I R R R e d ) R N I R + 2.4 R R e d + 1 [65]
4Optimized soil-adjusted vegetation indexOSAVI 1.16 ( R N I R R R e d ) R N I R + R R e d + 0.16 [66]
5Renormalized difference vegetation indexRDVI R N I R R R e d R N I R + R R e d [67]
6Pigment-specific normalized difference indexPSND R N I R R B l u e R N I R + R B l u e [68]
7Transformed chlorophyll absorption reflectance index/OSAVITCARI/OSAVI 3 [ ( R N I R R R e d ) 0.2 ( R N I R R G r e e n ) R N I R R R e d ] ( 1 + 0.16 ) R N I R R R e d R N I R + R R e d + 0.16 [66,69]
8Red-edge Transformed chlorophyll absorption reflectance index/OSAVITCARI/OSAVIred edge 3 [ ( R RE 1 R R e d ) 0.2 ( R R E 1 R G r e e n ) R R E 1 R R e d ] ( 1 + 0.16 ) R N I R R R e d R N I R + R R e d + 0.16 [70]
9MERIS terrestrialchlorophyll indexMTCI R RE 2 R RE 1 R RE 1 R Red [27]
10Normalized difference red-edge version 1NDRE1 R R E 2 R R E 1 R R E 2 + R R E 1 [28]
11Normalized difference red-edge version 2NDRE2 R R E 3 R R E 1 R R E 3 + R R E 1 [71]
12Red-edge chlorophyll indexCIred edge R R E 3 R R E 1 1 [72]
13Ratio indexRI R λ 1 R λ 2 [57]
14Normalized difference index NDI R λ 1 R λ 2 R λ 1 + R λ 2 [73]
15Difference indexDI R λ 1 R λ 2 [74]
16Soil adjusted indexSAI 1.5   ( R λ 1 R λ 2 ) ( R λ 1 + R λ 2 + 0.5 ) [75]
17Modified simple ratio indexMSR [ R λ 1 R λ 2 1 ] × [ R λ 1 R λ 2 + 1 ] 1 [57]
18Modified soil adjusted indexMSAI 2 R λ 1 + 1 ( 2 R λ 1 + 1 ) 2 8 ( R λ 1 R λ 2 ) 2 [76]
19Triangular indexTI0.5 [ ( λ 2 λ 1 )( R λ 3 R λ 1 )- ( λ 3 λ 1 )( R λ 2 R λ 1 )][77]
20Gitelson’s three-bandGit ( 1 R λ 1 1 R λ 2 ) R λ 3 [78]
21Tian’s three-band spectral indexBSI-T R λ 1 R λ 2 R λ 3 R λ 1 + R λ 2 + R λ 3 [79]
22Verrelts’s three-band spectral indexBSI-V R λ 1 R λ 3 R λ 2 + R λ 3 [80]
23Wang’s three-band spectral indexBSI-W R λ 1 R λ 2 + 2 R λ 3 R λ 1 + R λ 2 2 R λ 3 [81]
The bands used for the test vegetation index calculations for Sentinel-2 are R R e d (B4), R G r e e n (B3), R B l u e (B2), R R E 1 (B5), R R E 2 (B6), R R E 3 (B7) and R N I R (B8); for GaoFen-6 R R e d (B3), R G r e e n (B2), R B l u e (B1), R R E 1 (B5), R R E 2 (B6) and R N I R (B4).
Table 3. Coefficient of determination (R2) between canopy chlorophyll content (CCC), leaf mean tilt angle (MTA) and tested vegetation indices.
DatasetIndexSentinel-2WorldView2RapidEyeGaoFen-6
R2CCCR2MTAR2CCCR2MTAR2CCCR2MTAR2CCCR2MTA
MeasurementNDVI0.460.240.470.230.460.240.470.23
EVI0.160.650.180610.170.630.170.62
EVI20.190.630.190.600.180.620.190.60
OSAVI0.320.460.320.430.310.450.320.43
RDVI0.220.560.230.550.220.570.230.55
PSND0.520.170.500.180.490.190.520.17
TCARI/OSAVI0.310.400.320.380.290.410.330.37
TCARI/OSAVIred edge0.310.180.200.480.270.310.360.08
MTCI0.120.140.480.21
NDRE10.410.300.490.21
NDRE20.640.07
CIred edge0.680.05
ModelNDVI0.500.010.570.010.560.010.560.01
EVI0.260.330.370.310.360.320.310.33
EVI20.360.280.390.280.380.280.390.28
OSAVI0.410.180.460.170.450.170.460.17
RDVI0.370.260.400.260.390.260.400.26
PSND0.670.000.570.010.560.010.680.00
TCARI/OSAVI0.820.010.880.010.870.010.870.01
TCARI/OSAVIred edge0.510.050.350.040.420.000.540.03
MTCI0.760.000.820.00
NDRE10.760.000.790.00
NDRE20.760.00
CIred edge0.900.00
The transverse line (“—”) denotes the sensor without band to calculate corresponding vegetation index.
Table 4. Three best band configurations for the new three-band vegetation indices in the field measured dataset for each simulated satellite.
Index Sentinel-2WorldView-2RapidEyeGaoFen-6
B1, B2, B3R2CCC, R2MTAB1, B2, B3R2CCC, R2MTAB1, B2, B3R2CCC, R2MTAB1, B2, B3R2CCC, R2MTA
TI1B7, B4, B50.79, 0.05NIR1, Green, Red Edge0.77, 0.02Blue, Green, Red Edge0.22, 0.32B1, B3, B80.14, 0.02
2B2, B6, B70.78, 0.06NIR1, Blue, Red Edge0.72, 0.03Blue, Green, NIR0.26, 0.45B5, B1, B20.24, 0.20
3B3, B6, B70.66, 0.27Red, Blue, Yellow0.13, 0.06Red Edge, Blue, NIR0.25, 0.52B4, B5, B80.31, 0.39
Git1B5, B8, B8A0.76, 0.00Green, Red Edge, NIR10.58, 0.10Green, Red Edge, NIR0.55, 0.11B5, B6, B40.66, 0.07
2B5, B8A, B80.75, 0.00Yellow, Red Edge, Red0.46, 0.02Green, Red Edge, Blue0.38, 0.00B2, B5, B80.55, 0.06
3B5, B7, B8A0.74, 0.01Green, Red Edge, Blue0.33, 0.00Green, NIR, Red Edge0.48, 0.17B2, B6, B40.58, 0.10
BSI-T1B7, B6, B20.78, 0.00NIR1, Blue, Red Edge0.76, 0.00Red Edge, Green, NIR0.76, 0.00B5, B3, B40.78, 0.01
2B7, B5, B60.77, 0.00NIR1, Green, Red Edge0.73, 0.00Red Edge, Blue, NIR0.74, 0.00B5, B4, B80.77, 0.00
3B8, B6, B40.76, 0.00NIR1, Yellow, Red Edge0.70, 0.02Red Edge, Red, NIR0.76, 0.09B4, B3, B60.74, 0.00
BSI-V1B8, B6, B20.78, 0.02NIR1, Red, Red Edge0.78, 0.00NIR, Blue, Red Edge0.72, 0.03B4, B6, B10.77, 0.01
2B8, B6, B50.78, 0.01NIR1, Yellow, Red Edge0.78, 0.01NIR, Green, Red Edge0.71, 0.03B4, B6, B50.77, 0.00
3B2, B6, B80.76, 0.01Red Edge, Red, NIR10.76, 0.00Red Edge, Green, NIR0.67, 0.04B1, B6, B40.75, 0.00
BSI-W1B6, B8, B20.74, 0.01Red Edge, Blue, NIR10.74, 0.03Red Edge, Blue, NIR0.64, 0.04B6, B4, B10.72, 0.00
2B6, B5, B70.73, 0.01Red Edge, Green, NIR10.72, 0.01Red Edge, Green, NIR0.62, 0.04B5, B6, B40.68, 0.00
3B6, B3, B70.73, 0.01Red Edge, NIR1, Blue0.71, 0.00Red Edge, NIR, Blue0.62, 0.07B6, B4, B20.65, 0.01
Table 5. Best band configurations for the two-band indices in the field measured dataset for each simulated satellite.
IndexSentinel-2WorldView-2RapidEyeGaoFen-6
B1, B2R2CCC, R2MTAB1, B2R2CCC, R2MTAB1, B2R2CCC, R2MTAB1, B2R2CCC, R2MTA
RIB5, B8A0.77, 0.00NIR1, Red Edge0.73, 0.10Red Edge, NIR0.74, 0.01B5, B40.73, 0.02
NDVIB5, B8A0.73, 0.00Red Edge, NIR10.74, 0.11Red Edge, NIR0.71, 0.02B5, B40.69, 0.03
DIB6, B8A0.76, 0.00Blue, Yellow0.36, 0.03Blue, Red0.40, 0.18B6, B40.78, 0.00
SAIB6, B70.80, 0.00Red Edge, NIR10.65, 0.09Blue, Red0.39, 0.19B8, B10.36, 0.05
MSRB5, B8A0.75, 0.00NIR1, Red Edge0.74, 0.11Red Edge, NIR0.73, 0.01B5, B40.72, 0.02
MSAIB6, B70.78, 0.00Red Edge, NIR10.56, 0.17Blue, Red0.40, 0.18B4, B60.69, 0.23
Table 6. Performance of the best new indices of each type for the four simulated satellite sensors in model simulations.
IndexSentinel-2WorldView-2RapidEyeGaoFen-6
BandsR2CCC, R2MTABandsR2CCC, R2MTABandsR2CCC, R2MTABandsR2CCC, R2MTA
RIB5, B8A0.89, 0.00NIR1, Red Edge0.80, 0.00Red Edge, NIR0.90, 0.00B5, B40.90, 0.00
NDVIB5, B8A0.76, 0.00Red Edge, NIR10.83, 0.01Red Edge, NIR0.80, 0.00B5, B40.79, 0.00
DIB6, B8A0.93, 0.04Blue, Yellow0.51, 0.00Blue, Red0.61, 0.05B6, B40.94, 0.04
SAIB6, B70.95, 0.00Red Edge, NIR10.90, 0.02Blue, Red0.62, 0.06B8,B10.57, 0.00
MSRB5, B8A0.87, 0.00NIR1, Red Edge0.82, 0.00Red Edge, NIR0.87, 0.00B5, B40.88, 0.00
MSAIB6, B70.96, 0.01Red Edge, NIR10.90, 0.04Blue, Red0.61, 0.06B4, B60.95, 0.00
TIB7, B4, B50.82, 0.05NIR1, Green, Red Edge0.92, 0.02Blue, Green, Red Edge0.43, 0.05B1, B3, B80.36, 0.01
GitB5, B8, B8A0.89, 0.00Green, Red Edge, NIR10.88, 0.00Green, Red Edge, NIR0.88, 0.00B5, B6, B40.91, 0.00
BSI-TB7, B6, B20.90, 0.01NIR1, Blue, Red Edge0.85, 0.01Red Edge, Green, NIR0.84, 0.00B5, B3, B40.79, 0.00
BSI-VB8, B6, B20.90, 0.01NIR1, Red, Red Edge0.90, 0.01NIR, Blue, Red Edge0.91, 0.01B4, B6, B10.87, 0.02
BSI-WB6, B8, B20.87, 0.01Red Edge, Blue, NIR10.76, 0.00Red Edge, Blue, NIR0.72, 0.00B6, B4, B10.83, 0.01
Disclaimer/Publisher’s Note: The statements, opinions and data contained in all publications are solely those of the individual author(s) and contributor(s) and not of MDPI and/or the editor(s). MDPI and/or the editor(s) disclaim responsibility for any injury to people or property resulting from any ideas, methods, instructions or products referred to in the content.

