Article

Climate Change and CO2 Fertilization Have Played Important Roles in the Recent Decadal Vegetation Greening Trend on the Chinese Loess Plateau

1
School of Resources and Environmental Engineering, Ludong University, Yantai 264025, China
2
Key Laboratory of Ecosystem Network Observation and Modeling, Institute of Geographic Sciences and Natural Resources Research, Chinese Academy of Sciences, Beijing 100101, China
3
Ecology and Nature Conservation Institute, Chinese Academy of Forestry, Beijing 100091, China
4
Faculty of Environment, Science and Economy, University of Exeter, Exeter EX4 4QF, UK
5
Department of Atmospheric Sciences, University of Illinois, Urbana, IL 61821, USA
6
Laboratoire des Sciences du Climat et de l’Environnement, LSCE/IPSL, CEA-CNRS-UVSQ, Université Paris-Saclay, F-91198 Gif-sur-Yvette, France
*
Author to whom correspondence should be addressed.
Remote Sens. 2023, 15(5), 1233; https://doi.org/10.3390/rs15051233
Submission received: 2 February 2023 / Revised: 20 February 2023 / Accepted: 21 February 2023 / Published: 23 February 2023

Abstract

:
Vegetation greening has been widely occurring on the Chinese Loess Plateau, and the contributions of human land-use management have been well-understood. However, the influences of climatic change and CO2 fertilization on reported vegetation variations remain difficult to determine. Therefore, we quantified the impacts of multiple factors on vegetation changes for the Chinese Loess Plateau from 2000 to 2019 by integrating satellite-based leaf area index (LAI) and simulated LAI from dynamic global vegetation models. More than 96% of the vegetated areas of the Loess Plateau exhibited greening trends, with an annually averaged satellite-based LAI rate of 0.037 ± 0.006 m2 m−2 a−1 (P < 0.01). Human land-use management and environmental change have jointly accelerated vegetation growth, explaining 54% and 46% of the overall greening trend, respectively. CO2 fertilization and climate change explain 55% and 45% of the greening trend due to environmental change, respectively; solar radiation and precipitation were the main driving factors for climate-induced vegetation greenness (P < 0.05). Spatially, the eastern part of the Loess Plateau was dominated by CO2 fertilization, while the western part was mainly affected by climate change. Furthermore, solar radiation was the key limiting factor affecting LAI variations in the relatively humid area, while precipitation was the major influencing factor in relatively arid areas. This study highlights the important roles that climate change and CO2 fertilization have played in vegetation greenness in recent decades of the Loess Plateau, despite strong influences of anthropogenic footprint.

Graphical Abstract

1. Introduction

Satellite-based data have revealed increasing greenness across terrestrial ecosystems since 2000 [1,2]. Vegetation changes are closely associated with variations in the carbon budget and ecohydrological processes. The rate and scale of projected climate changes and anthropogenic disturbances in the 21st century have already profoundly impacted terrestrial ecosystems and will continue to do so [3]. To better formulate climate change adaptation and coping strategies, an in-depth understanding of the drivers of vegetation dynamics is required [4]. However, how much multiple environmental factors affect vegetation variations in the context of intense anthropogenic activities has not been clearly quantified.
Environmental change and human land-use management are thought to alter vegetation growth directly or indirectly. First, it has been shown that warming promotes the greening of vegetation at high latitudes [5] by boosting metabolism and extending the growing season [6], but these positive influences appear to have diminished in the past decade [7,8]. Second, precipitation dominates vegetation greening and browning in water-limited ecosystems [9,10]. Third, increasing CO2 concentrations in the atmosphere enhances vegetation growth through promoted leaf photosynthesis [11,12]. Globally, dynamic vegetation models and satellite-observed data have suggested that CO2 fertilization dominates the vegetation restoration processes [13]. Finally, human land-use management is also an important driver of vegetation restoration, as more than 1/3 of vegetation growth at the global scale can be attributed to human land-use management [14,15]. Overall, vegetation growth is affected by various environmental and human factors.
Studies have tried to separate the effects of climate change and anthropogenic activities on vegetation growth [16,17,18,19,20]. The residual method is a commonly used method, which is based on linear regression and is simple to operate [18,21], but it usually ignores the nonlinear effects of climate change on vegetation, leading to large uncertainties in the assessment results. Machine learning methods can overcome these deficiencies, but they lack a clear mechanism [16]. For example, machine learning methods have difficulty disentangling the influences of CO2 fertilization and climatic change. Therefore, to better understand the driving factors of vegetation change, it is necessary to improve the quantification method using process-based vegetation models.
LAI is a clear physical attribute and can reflect the change in vegetation growth, meanwhile LAI is not only a state variable of process-based models, but also can be retrieved from remote sensing data [1]. Integrated satellite-based LAI and simulated LAI derived from terrestrial biosphere process-based models were used previously to discern natural and human impacts on vegetation variation [2]. Moreover, process-based models allow quantitative separation of the drivers of vegetation change using factorial experiments [13,22,23]. Therefore, the integration of remote sensing vegetation index and process-based model simulation results can deepen our understanding of the driving forces of vegetation change.
The Loess Plateau is an ecologically fragile region that has experienced destruction and restoration processes due to the joint effects of environmental change and human land-use management [24,25]. Increasing precipitation has significantly promoted vegetation restoration; anthropogenic activities such as ecological projects, cropland irrigation, and urban expansion have also significantly altered vegetation growth in the Loess Plateau [24,26]. Several studies have tried to separate the effects of various environmental factors on vegetation growth and the contributions of human land-use management [24,27,28,29]; however, the influences of climatic change and CO2 fertilization on reported vegetation variations remain difficult to determine in the Loess Plateau. Therefore, this study aims to: (1) investigate the spatial-temporal dynamics of vegetation variation on the Loess Plateau from 2000 to 2019; (2) quantitatively separate the influences of environmental and anthropogenic factors on vegetation growth; (3) and identify the relative contribution of CO2 fertilization and climate change on environmentally induced vegetation variation.

2. Materials and Methods

2.1. Study Area

The Loess Plateau is located in northern China and covers 7 provinces (Figure 1). The region belongs to the semi-arid continental monsoon zone, with a multiyear average temperature between 4 °C and 14 °C, and cumulative precipitation between 50 mm and 700 mm. The Loess Plateau has experienced destruction and then restoration processes due to natural and anthropogenic factors [30].

2.2. Data and Preprocessing

2.2.1. Satellite-Based LAI

The satellite-based LAI acquired from the MOD15A2H product was used to reflect the actual vegetation. The spatial resolution of MODIS LAI is 500 m × 500 m, and temporal resolution is 8 days. The average value of LAI over the growing season (June–August) was calculated to represent actual vegetation growth variations from 2000 to 2019.

2.2.2. Simulated LAI

The simulated LAI acquired from the TRENDY v9 project (https://blogs.exeter.ac.uk/trendy/, accessed on 1 July 2022) was used to assess the vegetation variations caused by environmental change. Five dynamic global vegetation models (i.e., ISAM, LPJ-GUESS, LPX-Bern, ORCHIDEEv3, and VISIT) with a relatively high spatial resolution of 0.5° × 0.5° was used.
The TRENDY project conducted three simulation scenarios to separate the impacts of different environmental factors on ecosystems. The simulation scenarios “S1” and “S2” were used in this study. For scenario “S1”, only atmospheric CO2 concentration was allowed to vary during the study period; for scenario “S2”, both atmospheric CO2 concentration and climate factors were allowed to change over time. Models incorporating the nitrogen cycle included temporal variations for both the S1 and S2 scenarios. For scenario “S3”, land use was also allowed to change. The Land-Use Harmonization (LUH2) product was the dominant land use and cover change driving the data used in scenario “S3”. The LUH2 product was constructed from national agricultural land area data, but was not constrained by forest area [31]. The LUH2 product showed a spurious temporal signal of an abrupt increase in cropland area in China since the 1980 s and underestimated the newly established forest area from 1990 to 2019 [32]. Therefore, the LUH2 product was not used to analyze the impact of forest area, and the simulation result of scenario “S3” was not used in this study.

2.2.3. Anthropogenic Factors

To analyze the correlation between the LAI and forest area, data related to forest area were collected from the national forest resource inventory (NFRI) for each province. The 6th, 7th, 8th, and 9th NFRIs covered the periods from 1999 to 2003, 2004 to 2008, 2009 to 2013, and 2014 to 2018, respectively. Meanwhile, a newly developed historical land cover database [32] for China was used to reflect the vegetation coverage rate. The new data incorporate land conversion signals from satellite images, field surveys, and report data; the data can more accurately reflect land-use changes [32]. Additionally, based on the gross domestic product (GDP) dataset, a key indicator of socioeconomic activities, we analyzed the correlations between economic development and vegetation variations.

2.2.4. Meteorological Data

The models in the TRENDY project were driven using either monthly Climatic Research Unit (CRU) [33] or 6 hourly CRU-Japanese 55-year Reanalysis (CRU-JRA55) [34] dataset. The CRU-JRA55 was generated based on the JRA-55 [35] and CRU TS datasets. Temperature, downward solar radiation, specific humidity, and precipitation in JRA-55 were aligned to the meteorological data in CRU TS (4.03). The other variables (e.g., atmospheric pressure, downward long-wave radiation, and wind speed) were not modified. The spatial resolution of CRU data was 0.5° × 0.5°.
Additionally, temperature, precipitation, and downward solar radiation from the CRU dataset were used to analyze the influencing factors of LAI.

2.3. Methods

2.3.1. LAI Normalization

The magnitudes of the satellite-based and simulated LAI values differed significantly. To enable comparison of different LAIs, we normalized the LAIs. The normalized LAIs were dimensionless but can capture the interannual percent change in origin satellite-observed and simulated LAIs, which is the focus of this study.
The normalized MODIS LAI (LAIMODIS_normalized) can be obtained by dividing the annual satellite-based LAI by the multi-year average satellite-based LAI:
L A I M O D I S _ n o r m a l i z e d , y e a r = L A I M O D I S , y e a r L A I M O D I S ¯ ,
where LAIMODIS_normalized,year and LAIMODIS,year represent the normalized and observed LAI at a certain year (year = 2000, 2001, 2002, …., 2019), respectively. ( L A I M O D I S ¯ ) represents the multi-year average satellite-based LAI.
For the simulated LAI, we first calculated the normalized LAI of each model referring to the normalization method of MODIS LAI, then calculated the arithmetic mean of the normalized LAI of each model to represent the normalized simulated LAI:
L A I E n v i r o n m e n t a l _ n o r m a l i z e d , y e a r i = L A I E n v i r o n m e n t a l , y e a r i L A I E n v i r o n m e n t a l i ¯ ,
L A I E n v i r o n m e n t a l _ n o r m a l i z e d , y e a r = i = 1 n L A I E n v i r o n m e n t a l _ n o r m a l i z e d , y e a r i / n ,
where LAIEnvironmental_normalized,year is the normalized simulated LAI at a certain year acquired from S2 scenario from TRENDYv9 project. L A I E n v i r o n m e n t a l _ n o r m a l i z e d , y e a r i and L A I E n v i r o n m e n t a l , y e a r i is the normalized and simulated LAI for model i (i = 1, 2, 3, 4, 5) at a certain year. L A I E n v i r o n m e n t a l i ¯ is the multi-year average simulated LAI of model i.

2.3.2. Quantify the Relative Contribution of Multiple Factors to the LAI Trend

By integrating the normalized MODIS LAI and normalized simulated LAI, we explored the biological and physical pathways affecting Loess Plateau ecosystem structures. We hypothesized that the simulated results of the TRENDY project and MODIS observation data are accurate and we ignored the uncertainties, then the normalized simulated LAI calculated from the “S2” scenario of the TRENDY project can reflect the relative interannual change in the terrestrial ecosystem under the influence of environmental change (e.g., climatic change, CO2 fertilization, nitrogen deposition, etc.), and normalized MODIS LAI can capture the influences of both environmental change and human land-use management. Therefore, if the environmental signal was remoted from the MODIS LAI time series, the residuals can be attributed to the effects of human land-use management at a certain year (LAIHuman_normalized,year), that is:
L A I H u m a n _ N o r m a l i z e d , y e a r = L A I M O D I S _ N o r m a l i z e d , y e a r L A I E n v i r o n m e n t a l _ normalized , year ,
The trends of LAIMODIS_normalized,year, LAIEnvironmental_normalized,year, and LAIHuman_normalized,year during the study period can be employed to represent the interannual change rates of actual LAI (LAIMODIS_normalized), environmental-induced LAI (LAIEnvironmental_normalized), and human-induced LAI (LAIHuman_normalized), respectively. The least-square linear regression was used to determine the regression coefficients. A P value < 0.05 was considered significant. Additionally, we also evaluated the significance between the slopes of LAIEnvironmental_normalized and LAIHuman_normalized changes from 2000 to 2019 by SPSS software. Notably, LAI variations that cannot be directly attributed to environmental change were assumed to be explained by the effects of human land-use management. Therefore, anthropogenic impacts can be both direct and indirect via synergy with environmental factors [36].
Furthermore, the scenarios “S1” and “S2” acquired from the TRENDY project were used to identify the impacts of CO2 fertilization and climate change. The direct effect of CO2 fertilization ( CO2 fertilization-induced LAI) was reflected in scenario “S1”. The effect of climate change (climate-induced LAI) was regarded as the difference between scenarios “S2” and “S1”. The simulation results of scenarios “S2” and “S1” were both normalized using the method described above.
A simple linear regression method was used to investigate trends in satellite-based LAI, that is LAIMODIS, during the study period to reflect the actual vegetation change. A P value < 0.05 was considered significant. The simple linear regression method was also used to calculate the slopes of normalized LAI (e.g., LAIMODIS_normalized, LAIEnvironmental_normalized and LAIHuman_normalized). The ratios of LAIEnvironmental_normalized slope to LAIMODIS_normalized slope, and LAIHuman_normalized slope to LAIMODIS_normalized slope represent the relative contributions of environmental factors and human land-use management to actual vegetation greening, respectively. Meanwhile, the ratios of the normalized CO2 fertilization-induced LAI slope to LAIEnvironmental_normalized slope, and normalized climate-induced LAI slope to LAIEnvironmental_normalized slope represent the relative contributions of CO2 fertilization and climate change to environmental-induced vegetation greening, respectively.

2.3.3. Statistical Methods
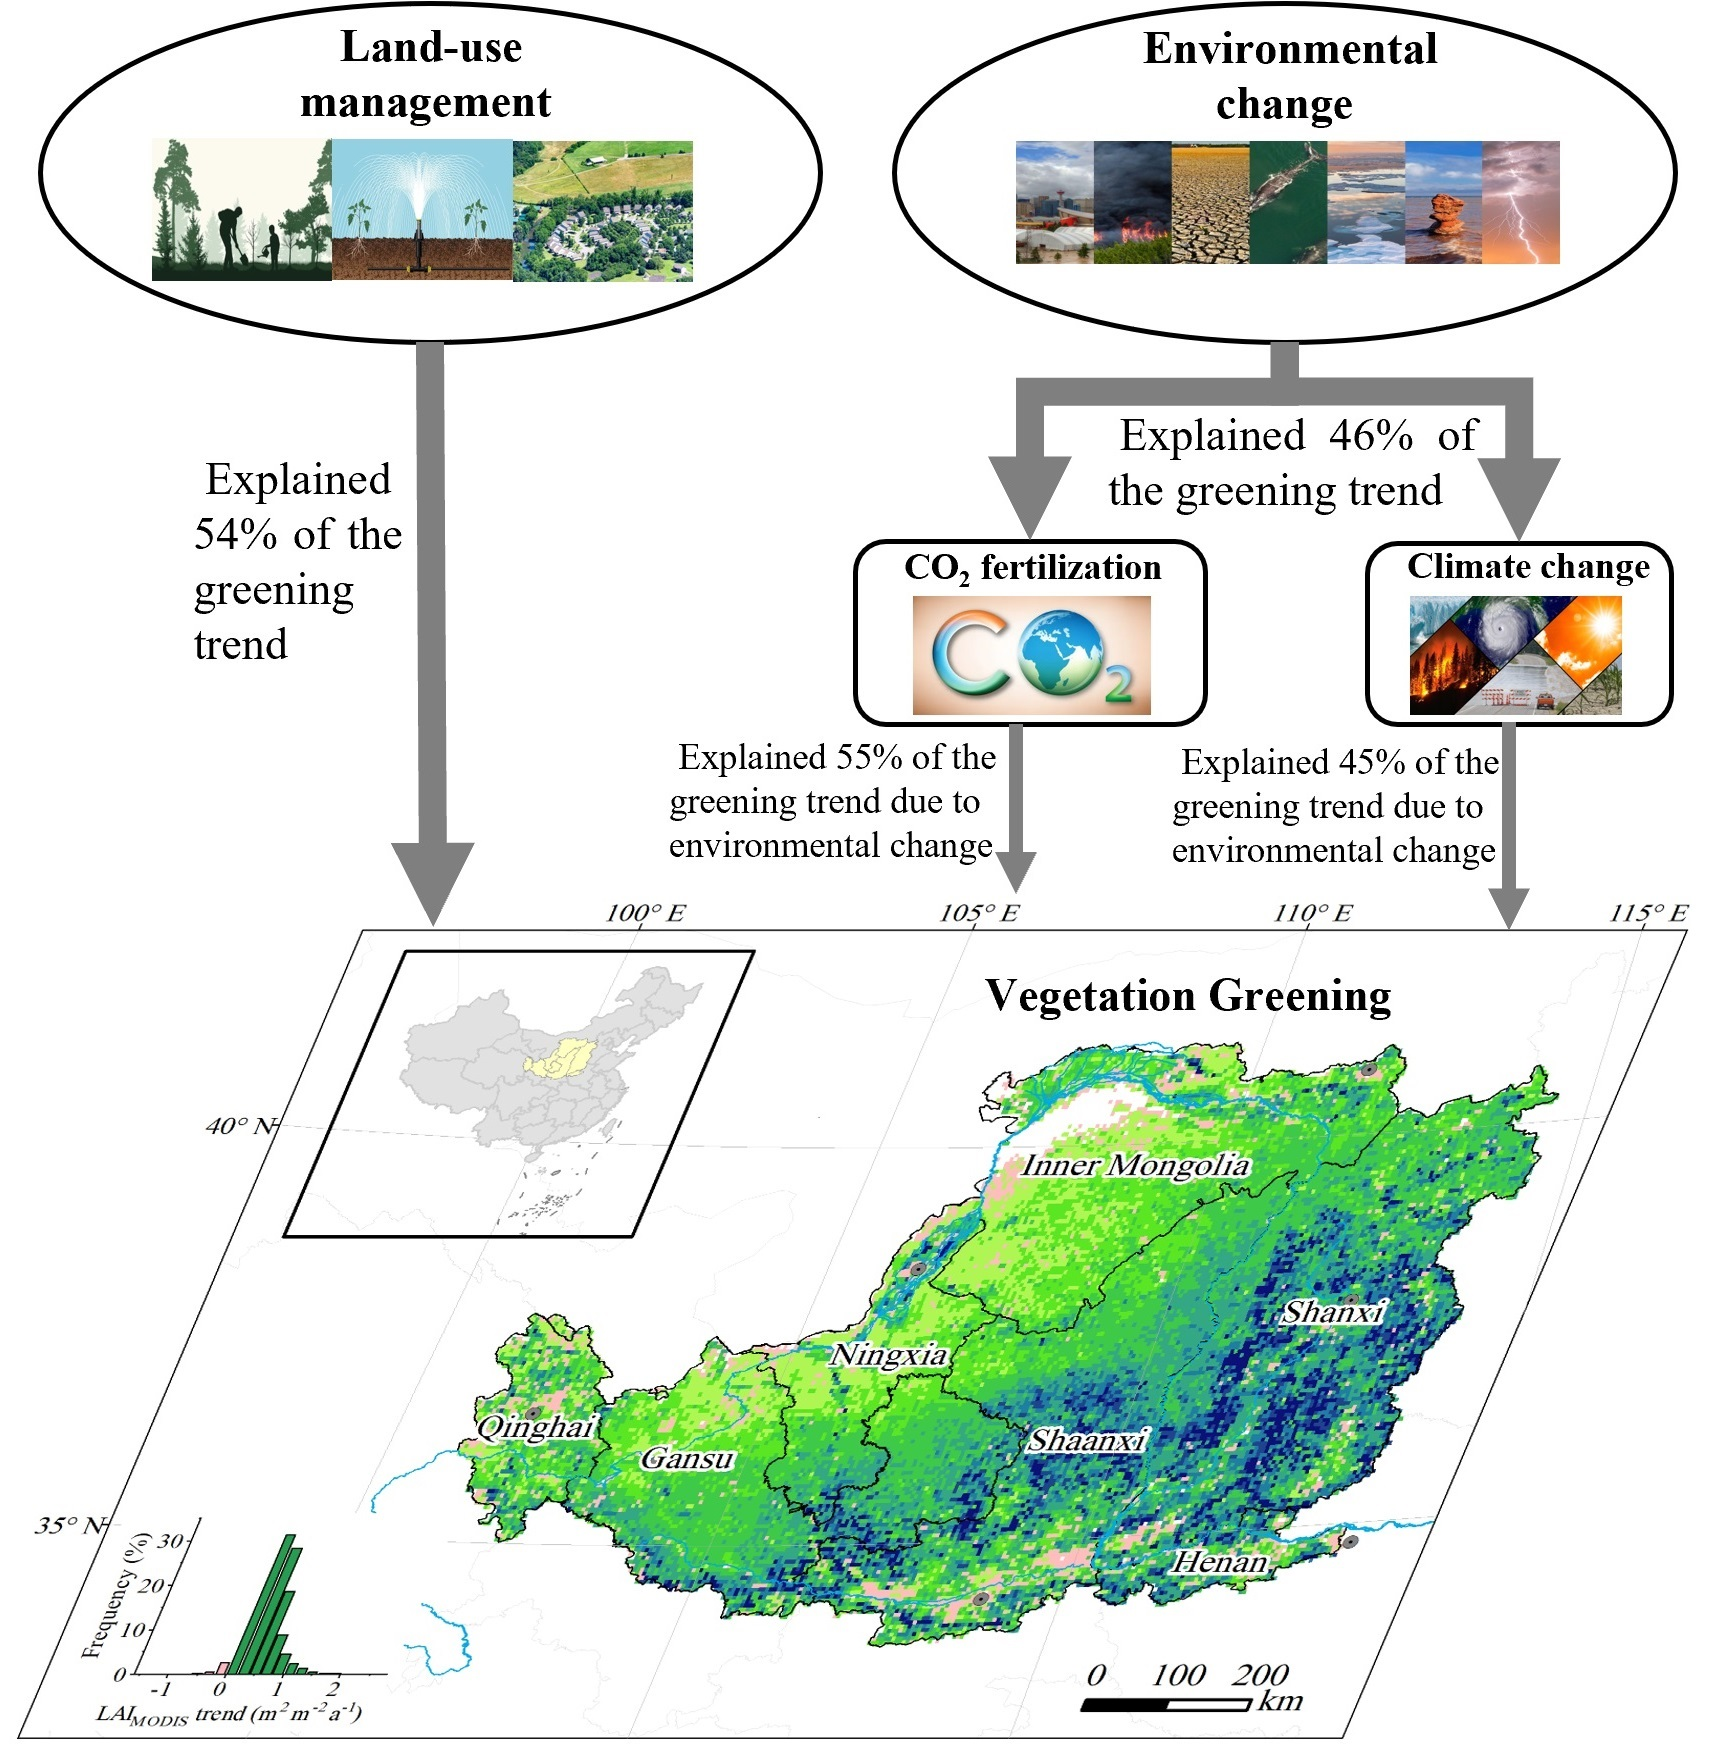
The spatial resolutions of satellite-based LAI, simulated LAI, and CRU meteorological data are so different that they cannot be directly compared at the grid scale. Therefore, we calculated the average LAI and meteorological values for the whole study area and each province, and then we separated the influence of human land-use management and environmental factors at the regional scale.
To investigate the response of interannual variation of LAI to climate change (i.e., temperature, precipitation, and download solar radiation), a partial correlation analysis method was carried out on the climate-induced LAI.

3. Results

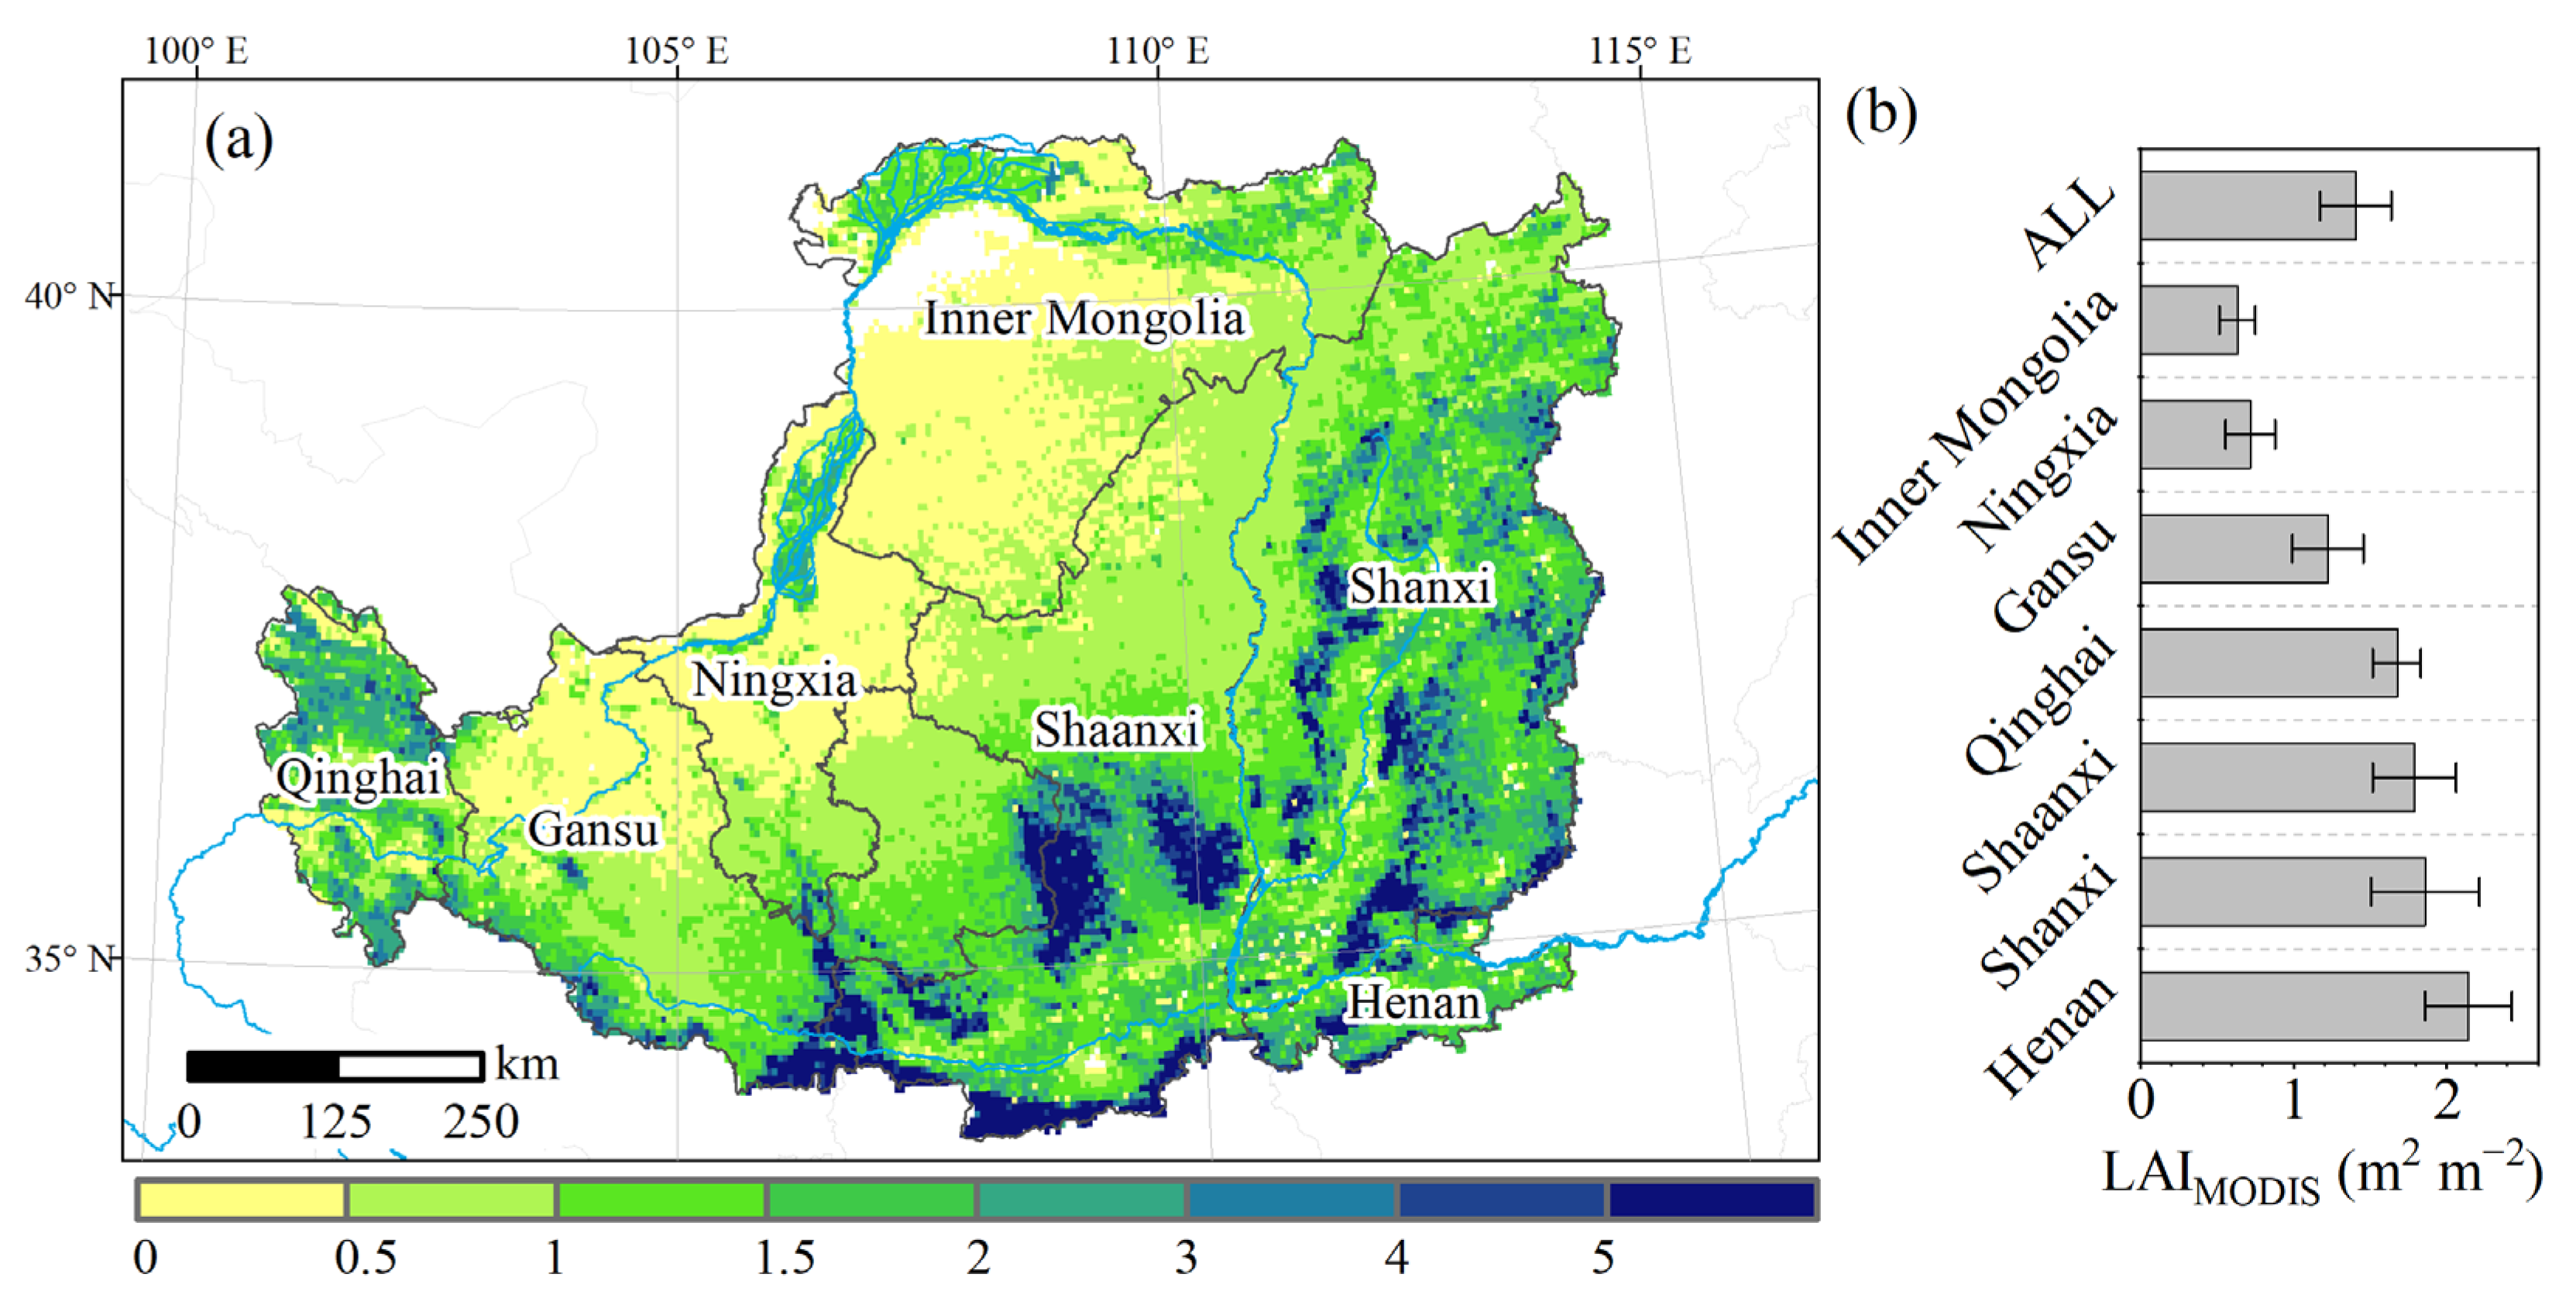
3.1. Actual Vegetation Changes Based on LAIMODIS

The LAIMODIS on the Loess Plateau shows a gradient, with decreasing values from southeast to northwest (Figure 2). The LAIMODIS values were greater than 4 m2 m−2 in the southeastern Loess Plateau, mainly due to the abundant precipitation, and woodland was extensively distributed. Meanwhile, in the northwestern region, low annual precipitation limited vegetation growth, and the dominant vegetation cover was grassland, with LAIMODIS generally below 0.5 m2 m−2. For the remaining regions, where farmland was widely distributed, the LAIMODIS ranged from 1 to 4 m2 m−2.
The multiyear average LAIMODIS for the Loess Plateau was 1.40 ± 0.23 m2 m−2 (mean ± standard deviation) during the study period (Figure 2b). The highest LAIMODIS occurred in Henan Province, with a value of 2.14 ± 0.28 m2 m−2, followed by Shanxi (1.86 ± 0.35 m2 m−2) and Shaanxi (1.79 ± 0.27 m2 m−2). Ningxia and Inner Mongolia had relatively low LAIMODIS, with values of 0.71 ± 0.16 m2 m−2 and 0.64 ± 0.12 m2 m−2, respectively, mainly due to the dry climate and low temperature. Moreover, LAIMODIS varied widely among biomes (Figure S1a). Woodland showed the highest average LAIMODIS (2.70 ± 0.06), which was more than twice that of farmland and grassland.
The LAIMODIS exhibited a significant positive trend (P < 0.01) across the study area between 2000 and 2019, where the slope ± standard errors were 0.037 ± 0.006 m2 m−2 a−1, and the change rate was 2.6% a−1 compared with the annual mean LAIMODIS. The overall increasing trends of LAIMODIS were consistent for each province, and the positive trends were all significant at the 0.01 level (Figure 3b). The largest increase in LAIMODIS was in Shanxi, with an annual increase of 0.057 ± 0.007 m2 m−2 a−1, followed by Shaanxi (0.044 ± 0.005 m2 m−2 a−1), Henan (0.042 ± 0.009 m2 m−2 a−1), Gansu (0.036 ± 0.006 m2 m−2 a−1), Ningxia (0.024 ± 0.005 m2 m−2 a−1), and Qinghai (0.022 ± 0.006 m2 m−2 a−1). Inner Mongolia showed the lowest growth trend at 0.017 ± 0.004 m2 m−2 a−1. However, after normalizing the trends with the average LAIMODIS values, Ningxia exhibited the largest rate of increase at 3.36% per year, followed by Shanxi (3.05% a−1); Qinghai showed the lowest relative increasing trend, with a value of 1.33% a−1 (Figure S2). Among the different biomes, woodland exhibited the highest increasing trend, with a value of 0.061 ± 0.009 m2 m−2 a−1, followed by farmland (0.038 ± 0.006 m2 m−2 a−1) and grassland (0.033 ± 0.005 m2 m−2 a−1) (Figure S1b).
The spatial heterogeneity of the interannual LAIMODIS variation was shown in Figure 3. More than 96% of the regions exhibited an upward trend in LAIMODIS, and approximately 76% of the regions showed a significantly and positively rising trend. The LAIMODIS increased the most in the southeastern area of the study area (e.g., most parts of Shanxi, central Shaanxi, and southeastern Gansu), with an annual increase of more than 0.10 m2 m−2 a−1; moreover, a relatively low increase in growing season LAIMODIS occurred mainly on the northwestern Loess Plateau, with annual increase values below 0.01 m2 m−2 a−1. Additionally, about 4% of the study area showed a downward LAIMODIS trend, mainly distributed around cities such as Xi’an, Weinan, Baoji, Taiyuan, and Hohhot.

3.2. Influences of Natural and Human Factors on Vegetation Changes

Simulated results obtained from the scenario S2 of TRENDY project indicated vegetation changes under the influence of environmental factors (Figure 4). All models showed significant increases in the simulated LAIs due to the impact of environmental factors, but there were large differences in its magnitudes, with values between 0.007 ± 0.006 m2 m−2 a−1 for the ISAM model and 0.046 ± 0.022 for the LPX-Bern model (Figure 4b). Moreover, we found that the magnitudes of the multiyear average simulated LAIs also differed, with values between 1.25 ± 0.14 m2 m−2 for the ORCHIDEEv3 model and 3.853 ± 0.46 m2 m−2 for the LPX-Bern model (Figure 4a).
We identified the relative contributions of environmental factors and human land-use management to the actual vegetation change based on the normalized LAIs (Figure 5). The LAIMODIS_normalized showed a distinct positive trend from 2000 to 2019 over the entire study area, with an increased value of 0.026 ± 0.005 (P < 0.01), indicating significant actual vegetation greening. LAIHuman_normalized showed a significant increasing trend, with a value of 0.014 ± 0.004 (P < 0.01), explaining approximately 54% of the greening trend; meanwhile, LAIEnvironmental_normalized also showed a significantly positive trend, with a value of 0.012 ± 0.006 (P < 0.01), explaining 46% of the greening trend (Figure 5a). The results indicated that environmental factors and human land-use management explained 46% and 54% of the actual vegetation changes, respectively. Additionally, the comparison between slopes of LAIEnvironmental_normalized and LAIHuman_normalized from 2000 to 2019 showed no statistically significant difference (P > 0.05), indicating that the impact of environmental changes and human land-use management may interact.
For the different provinces (Figure 5b), human land-use management explained most of the vegetation greening trend, ahead of environmental changes in Gansu, Ningxia, Shaanxi, Shanxi, and Henan. Particularly in Gansu, Ningxia, and Shaanxi, the relative contribution of human land-use management exceeded 63%. Moreover, for Qinghai and Inner Mongolia, environmental change dominated the increasing trend of the actual vegetation conditions. In Qinghai, environmental change contributed to 80% of the actual vegetation increasing trend.

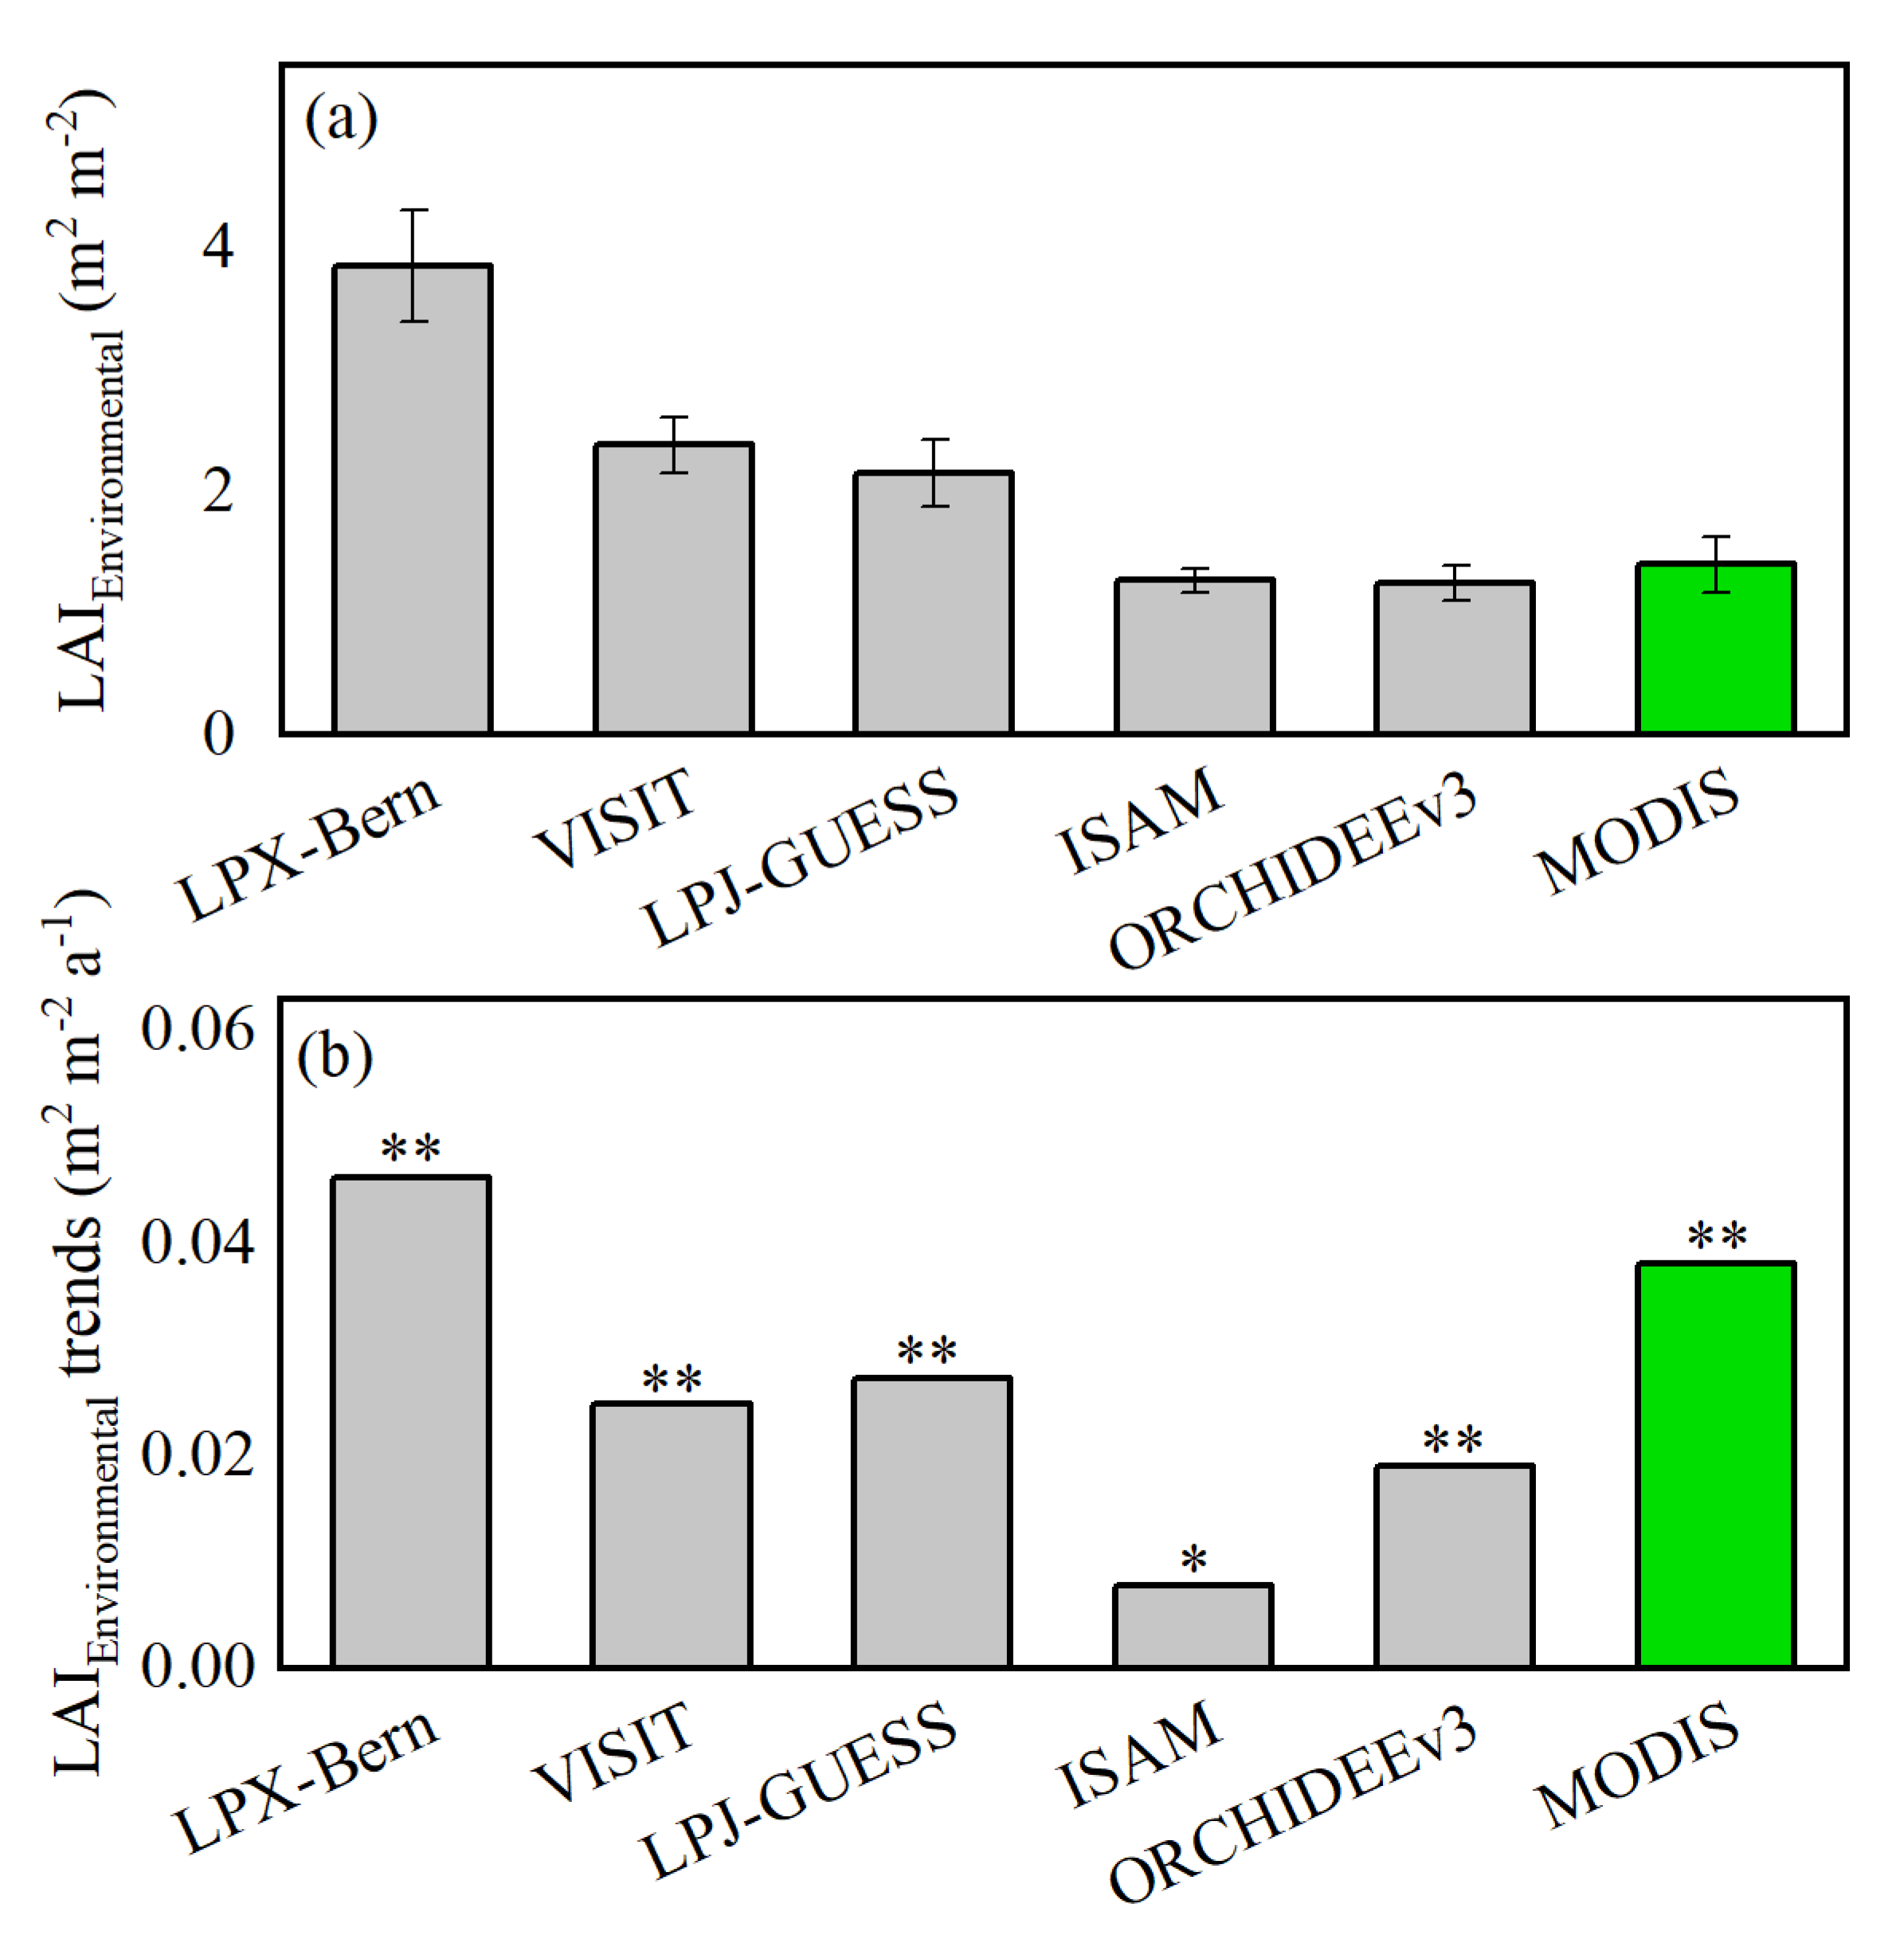
3.3. Effects of Different Environmental Factors on Vegetation Changes

Environmental change has markedly altered the dynamics of terrestrial vegetation. For all the study regions, CO2 fertilization effects and nitrogen deposition explained 55% of the environmental change-driven greening trend from 2000 to 2019, while climate change explained 45% (Figure 6a). The influences of different environmental factors on vegetation growth exhibited large spatial heterogeneity. For the eastern Loess Plateau, CO2 fertilization dominated the greening trend caused by environmental change, with the relative contributions of 74%, 61%, and 52% by Henan, Shanxi, and Shaanxi, respectively. For the western of study area, climate changes dominated the greening trend caused by environmental factors, and the relative contributions of Inner Mongolia, Ningxia, Gansu, and Qinghai were greater than 60%, which can be primarily ascribed to the dry climate in this area.
Furthermore, we investigated the influences of climatic variables on greening trends. Climate-induced LAI were significantly and positively correlated with solar radiation (R = 0.75) and precipitation (R = 0.54) across the whole study area. The correlations between climate-induced LAI and climatic variables varied across provinces (Figure 6b). Specifically, downscaled solar radiation dominated the interannual climate-induced LAI variation in Shanxi, Shaanxi, Henan, and Qinghai, which have relatively abundant precipitation or large areas with irrigation. Moreover, precipitation was the dominant driver in Inner Mongolia, Gansu, and Ningxia, which can be ascribed to the dry climate.

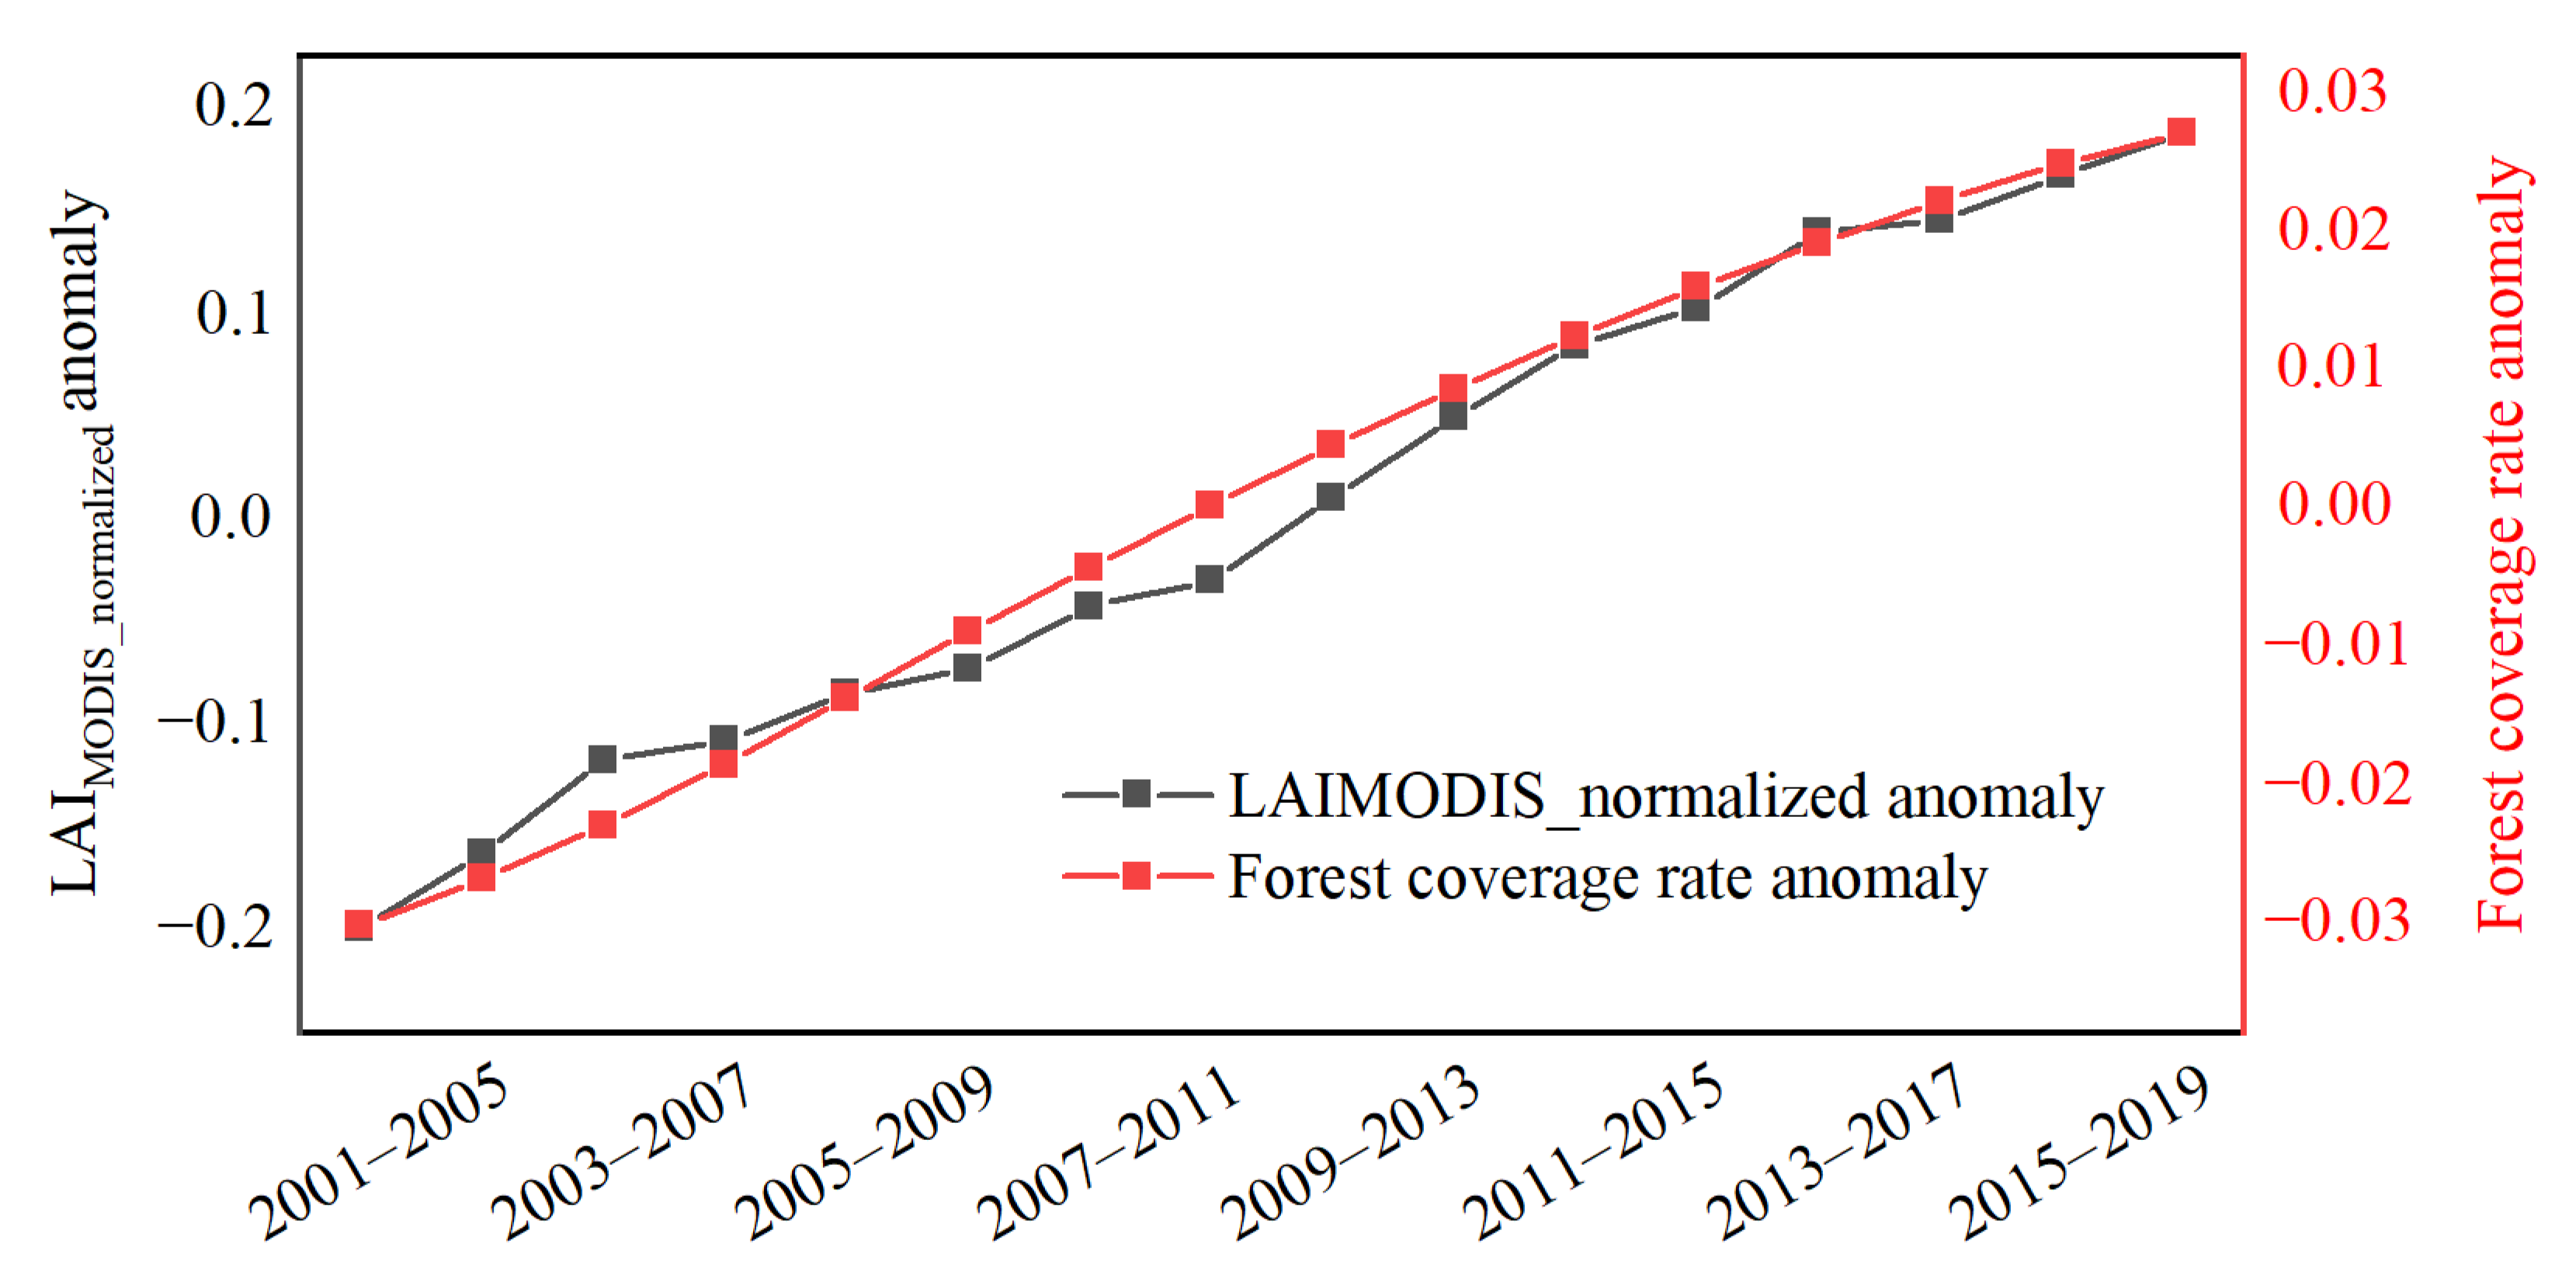
3.4. Relationship between Actual Vegetation Growth and Forest Area

The relationship between forest area and LAIMODIS_normalized variations is shown in Figure 7. The changes in forest area were significantly and positively correlated with the LAIMODIS_normalized, with an explanatory value of 83% for the whole Loess Plateau, suggesting that the increase in forest area is a main underlying driver for the observed vegetation greening trend. Moreover, the relationships between forest area and LAIMODIS_normalized were consistent among provinces, explaining more than 60% of the variability; in particular, for Ningxia, Shaanxi, and Shanxi, the relationship explained more than 96% of the variability in LAIMODIS_normalized (Figure 7b). The interannual variability in forested areas, which was acquired from the 6th to the 9th national forest resource inventory, was consistent with the trend of LAIMODIS_normalized in Shanxi and Shaanxi Provinces (Figure 7c,d).

4. Discussion

4.1. Vegetation Greening Trend

Compared with other vegetation indexes, the leaf area index has a well-defined physical meaning in vegetation [1]. The leaf area index can be obtained from satellite products and is a simulated state variable in process-based models. Integrating satellite-based and simulated data from dynamic global vegetation models can attribute vegetation dynamics to different driving factors [2,13]. However, leaf area index values simulated by different models differed because of different assumptions and parameters [6], which led to uncertainties in the attribution analysis. Using simulation results from multiple models simultaneously can reduce the uncertainties [37]. Therefore, integration of remote sensing data with simulated results from multiple process-based models can improve the accuracy of attribution analysis.
Satellite-based data revealed increasing greenness in terrestrial ecosystems globally [1], with approximately 33% of the vegetated area turning green, and the leaf area increased by 2.3% per decade [14]. China, especially the Loess Plateau, showed a strong greening trend [26,27]. Specifically, approximately 76% of the regions exhibited a significant upward trend in LAIMODIS since 2000 (P < 0.05), with a net increase rate of 27.1% in leaf area per decade, which was much higher than the global average. Meanwhile, there were spatiotemporal variations in greening across the study area. The LAIMODIS increased significantly in the central and southeastern Loess Plateau and decreased around large cities. Thus, vegetation on the Loess Plateau generally exhibited greening trends, but some parts showed a brown trend.

4.2. Contributions of Multiple Factors to Vegetation Greening

Inferred human land-use management and environmental change jointly altered vegetation variations [1]. Intensive land use explained more than one-third of the observed greening trend at the global scale, with forests and croplands explaining 42% and 32% of the large-scale greening in China, respectively [14]. The Loess Plateau is one of the most noticeable greening areas in China, and human land-use management (such as ecological projects, cropland irrigation, population, etc.) has contributed 54% of the greening trends. The sharp increase in forest area caused by ecological projects such as Grain for Green has greatly promoted the vegetation greening trend [25,38]; the interannual trends of 5 years smoothing LAIMODIS_normalized and forest coverage rate were similar (Figure 8). Cropland irrigation has also significantly contributed to the vegetation greening trend in the Loess Plateau [27]. The middle and upper reaches of the Yellow River Basin (covering most area of the Loess Plateau) have exhibited a significant expansion of irrigated farmland, yet rainfed croplands were the dominant sources of irrigation expansion [39]. Additionally, GDP and population have also affected vegetation restoration (Figure 9). A large number of farm laborers have moved from the countryside to relatively lucrative city jobs, which has reduced human pressure on rural areas and promoted GDP [40,41]. Moreover, prohibiting practices damaging grasslands through fencing and grazing exclusion has helped protect ecologically important grassland zones [42].
Globally, the ensemble model with results simulated by the TRENDY project suggest that increasing atmospheric CO2 accounts for approximately 70% of the vegetation greening trend, while climate change only explains 8% [13]. Meanwhile, CO2 fertilization accounts for 55% of the environmental-induced greening trend on the Loess Plateau, and climate change explains 45%. The Loess Plateau has a higher sensitivity to climate change compared with other areas on the global scale. Spatially, for the areas with relatively high leaf area (e.g., Henan, Shaanxi, and Shanxi), CO2 fertilization is the major indirect driving factor for the greening trend because rising CO2 concentrations can enhance photosynthesis [43] and extend the growth season [44]. Precipitation dominates vegetation variation in water-limited ecosystems (e.g., northwestern Loess Plateau) [9,28], and radiation is the main climate factor on the southeastern Loess Plateau. Additionally, rising CO2 concentrations allow plants to operate at lower leaf stomata openings, which can conserve soil moisture and allow plants to grow a little longer into a drought cycle (e.g., Inner Mongolia, Ningxia, and Gansu) [9,45].

4.3. Limitations and Uncertainties

This study focused on trends in satellite and simulated data to quantify the impact of multiple drivers on vegetation change. However, whether the differences between satellite-observed and simulated LAIs can be directly attributed to human land-use management is debatable. This study was not a factorial experiment and there was an assumption made that MODIS LAI variation can be decomposed (TRENDY-based) environmental variation and residual variation that is attributed to human activities. The histograms of multi-year average LAIMODIS_normalized and LAIEnvironmental_normalized are compared in Figure 10. Both LAIMODIS_normalized and LAIEnvironmental_normalized were close to normally distributed, but the distribution of LAIEnvironmental_normalized was more concentrated, the proportion of a normal distribution between 0.90 and 1.1 was 66%, while LAIMODIS_normalized was 52%; when considering the normalized LAI above 1.2, the proportion of LAIMODIS_normalized was higher than that of LAIEnvironmental_normalized, with values of 12% and 4%, respectively (Figure 10a). The distribution frequency of different models was similar (Figure 10b). Additionally, several studies have investigated key drivers of vegetation variations through combing satellite-observed and simulated data [2,13]. However, the over-sensitivity of models to atmospheric CO2 has led to a satellite-derived productivity increase in less than half of the model-derived productivity rises during the past decades at the global scale [46], which implies a negative impact of anthropogenic activities if the trends are directly compared. For the Chinese terrestrial ecosystem, the average trend of satellite-observed LAI is greater than the trend of LAI estimated by models in 25 of 31 provinces, which can be partly explained by human activities, such as afforestation [37]. The research suggests that the comparison of satellite-observed and simulated LAI trends can partly explain the impacts of human land-use management in China.
Additionally, we must acknowledge that atmospheric CO2 concentration and climate change are also significantly affected by human land-use management; therefore, anthropogenic factors might have greater influences than the value estimated in this study. Almost all the leaf areas simulated by process-based models exhibited uncertainties arising from model structure and parameter choices [37]. Therefore, the integrated simulated results from five models were used to separate the effects of different environmental factors on vegetation growth in this study. Additionally, the spatial resolutions mismatch between simulated and satellite-observed datasets increases the uncertainties; therefore, we conducted the analysis at the provincial level, which can help to reduce the impact of mismatch between spatial resolutions.

5. Conclusions

This study quantitatively assesses the drivers of vegetation growth in the Loess Plataea during the past decades through integrating satellite-derived LAI and simulated LAI from dynamic global vegetation models. The results showed that vegetation had an average annual increase of 0.037 ± 0.006 m2 m−2 a−1 (P < 0.01). Human land-use management and environmental change jointly promoted vegetation restoration, with explanatory rates of 54% and 46%, respectively. CO2 fertilization explained 55% of the greening trend caused by environmental change from 2000 to 2019, whereas climate change contributed 45%. Furthermore, solar radiation and precipitation dominated the climate-induced vegetation restoration (P < 0.05).

Supplementary Materials

The following supporting information can be downloaded at: https://www.mdpi.com/article/10.3390/rs15051233/s1, Figure S1: (a) Average LAIMODIS for each biome on the Loess Plateau. ** represents P < 0.01. (b) Interannual trend of LAIMODIS for each biome on the Loess Plateau from 2000 to 2019; Figure S2: Relative increasing trends of the LAIMODIS in different provinces on the Loess Plateau from 2000 to 2019.

Author Contributions

Conceptualization, Z.N. and B.S.; Formal analysis, Z.N.; Resources, S.S., A.K.J. and N.V.; Software, Z.N.; Supervision, Z.N.; Writing—original draft, Z.N.; Writing—review and editing, H.H., P.Y., S.S., Y.Z., Y.W., A.K.J., N.V. and B.S. All authors have read and agreed to the published version of the manuscript.

Funding

This research was funded by National Natural Science Foundation of China, grant number U20A2085, U21A2005, 41977009, and 42201312.

Data Availability Statement

The MOD15A2H product was downloaded from https://lpdaac.usgs.gov/products/mod15a2hv006/, accessed on 1 July 2022; the TRENDY v9 project was downloaded from https://blogs.exeter.ac.uk/trendy/, accessed on 1 July 2022; the CRU historical meteorological dataset was downloaded from https://crudata.uea.ac.uk/cru/data/hrg/cru_ts_4.04/, accessed on 1 September 2022; the national forest resource inventory area was downloaded from http://www.forestry.gov.cn/gjslzyqc.html, accessed on 1 September 2022; the GDP data from the National Bureau of Statistics were download from http://www.stats.gov.cn/tjsj/ndsj/, accessed on 1 October 2022.

Acknowledgments

We thank TRENDY modeling group for providing model simulation data. We would like to express our gratitude to Linlin Li, Xiyu Li, Yidi Wang, Mingyi Xia, and Jiayin Liu for their valuable contributions in data processing.

Conflicts of Interest

The authors declare no conflict of interest.

References

  1. Piao, S.; Wang, X.; Park, T.; Chen, C.; Lian, X.; He, Y.; Bjerke, J.W.; Chen, A.; Ciais, P.; Tømmervik, H. Characteristics, drivers and feedbacks of global greening. Nat. Rev. Earth Environ. 2020, 1, 14–27. [Google Scholar] [CrossRef] [Green Version]
  2. Mao, J.; Ribes, A.; Yan, B.; Shi, X.; Thornton, P.E.; Séférian, R.; Ciais, P.; Myneni, R.B.; Douville, H.; Piao, S.; et al. Human-induced greening of the northern extratropical land surface. Nat. Clim. Chang. 2016, 6, 959–963. [Google Scholar] [CrossRef]
  3. Seddon, A.W.; Macias-Fauria, M.; Long, P.R.; Benz, D.; Willis, K.J. Sensitivity of global terrestrial ecosystems to climate variability. Nature 2016, 531, 229–232. [Google Scholar] [CrossRef] [PubMed] [Green Version]
  4. Tong, X.; Brandt, M.; Yue, Y.; Horion, S.; Wang, K.; Keersmaecker, W.D.; Tian, F.; Schurgers, G.; Xiao, X.; Luo, Y.; et al. Increased vegetation growth and carbon stock in China karst via ecological engineering. Nat. Sustain. 2018, 1, 44–50. [Google Scholar] [CrossRef]
  5. Lian, X.; Myneni, R.; Chapin Iii, F.; Callaghan, T.V.; Pinzon, J.; Tucker, C.J.; Zhu, Z.; Bi, J.; Ciais, P.; Tømmervik, H. Temperature and vegetation seasonality diminishment over northern lands. Nat. Clim. Change 2013, 3, 581–586. [Google Scholar]
  6. Richardson, A.D.; Anderson, R.S.; Arain, M.A.; Barr, A.G.; Bohrer, G.; Chen, G.; Chen, J.M.; Ciais, P.; Davis, K.J.; Desai, A.R. Terrestrial biosphere models need better representation of vegetation phenology: Results from the N orth A merican C arbon P rogram S ite S ynthesis. Glob. Change Biol. 2012, 18, 566–584. [Google Scholar] [CrossRef] [Green Version]
  7. Piao, S.; Nan, H.; Huntingford, C.; Ciais, P.; Friedlingstein, P.; Sitch, S.; Peng, S.; Ahlstrom, A.; Canadell, J.G.; Cong, N.; et al. Evidence for a weakening relationship between interannual temperature variability and northern vegetation activity. Nat. Commun. 2014, 5, 5018. [Google Scholar] [CrossRef] [Green Version]
  8. Vickers, H.; Høgda, K.A.; Solbø, S.; Karlsen, S.R.; Tømmervik, H.; Aanes, R.; Hansen, B.B. Changes in greening in the high Arctic: Insights from a 30 year AVHRR max NDVI dataset for Svalbard. Environ. Res. Lett. 2016, 11, 105004. [Google Scholar] [CrossRef]
  9. Fensholt, R.; Langanke, T.; Rasmussen, K.; Reenberg, A.; Prince, S.D.; Tucker, C.; Scholes, R.J.; Le, Q.B.; Bondeau, A.; Eastman, R. Greenness in semi-arid areas across the globe 1981–2007—An Earth Observing Satellite based analysis of trends and drivers. Remote Sens. Environ. 2012, 121, 144–158. [Google Scholar] [CrossRef]
  10. Donohue, R.J.; McVICAR, T.R.; Roderick, M.L. Climate-related trends in Australian vegetation cover as inferred from satellite observations, 1981–2006. Glob. Change Biol. 2009, 15, 1025–1039. [Google Scholar] [CrossRef]
  11. Keenan, T.F.; Hollinger, D.Y.; Bohrer, G.; Dragoni, D.; Munger, J.W.; Schmid, H.P.; Richardson, A.D. Increase in forest water-use efficiency as atmospheric carbon dioxide concentrations rise. Nature 2013, 499, 324–327. [Google Scholar] [CrossRef]
  12. Yang, L.; Feng, Q.; Wen, X.; Barzegar, R.; Adamowski, J.F.; Zhu, M.; Yin, Z. Contributions of climate, elevated atmospheric CO2 concentration and land surface changes to variation in water use efficiency in Northwest China. Catena 2022, 213, 106220. [Google Scholar] [CrossRef]
  13. Zhu, Z.; Piao, S.; Myneni, R.B.; Huang, M.; Zeng, Z.; Canadell, J.G.; Ciais, P.; Sitch, S.; Friedlingstein, P.; Arneth, A.; et al. Greening of the Earth and its drivers. Nat. Clim. Chang. 2016, 6, 791–795. [Google Scholar] [CrossRef]
  14. Chen, C.; Park, T.; Wang, X.H.; Piao, S.L.; Xu, B.D.; Chaturvedi, R.K.; Fuchs, R.; Brovkin, V.; Ciais, P.; Fensholt, R.; et al. China and India lead in greening of the world through land-use management. Nat. Sustain. 2019, 2, 122–129. [Google Scholar] [CrossRef]
  15. Li, Y.; Liu, W.; Feng, Q.; Zhu, M.; Yang, L.; Zhang, J.; Yin, X. The role of land use change in affecting ecosystem services and the ecological security pattern of the Hexi Regions, Northwest China. Sci. Total Environ. 2023, 855, 158940. [Google Scholar] [CrossRef]
  16. Yang, L.; Shen, F.; Zhang, L.; Cai, Y.; Yi, F.; Zhou, C. Quantifying influences of natural and anthropogenic factors on vegetation changes using structural equation modeling: A case study in Jiangsu Province, China. J. Clean. Prod. 2021, 280, 124330. [Google Scholar] [CrossRef]
  17. Zhang, Y.; Wang, Q.; Wang, Z.; Yang, Y.; Li, J. Impact of human activities and climate change on the grassland dynamics under different regime policies in the Mongolian Plateau. Sci. Total Environ. 2020, 698, 134304. [Google Scholar] [CrossRef]
  18. Jiang, L.; Bao, A.; Guo, H.; Ndayisaba, F. Vegetation dynamics and responses to climate change and human activities in Central Asia. Sci. Total Environ. 2017, 599, 967–980. [Google Scholar] [CrossRef]
  19. Cao, W.; Wu, D.; Huang, L.; Pan, M.; Huhe, T. Determinizing the contributions of human activities and climate change on greening in the Beijing–Tianjin–Hebei Region, China. Sci. Rep. 2021, 11, 21201. [Google Scholar] [CrossRef]
  20. Li, Y.; Liu, W.; Feng, Q.; Zhu, M.; Yang, L.; Zhang, J. Effects of land use and land cover change on soil organic carbon storage in the Hexi regions, Northwest China. J. Environ. Manag. 2022, 312, 114911. [Google Scholar] [CrossRef]
  21. Zhang, Y.; Zhang, C.; Wang, Z.; Chen, Y.; Gang, C.; An, R.; Li, J. Vegetation dynamics and its driving forces from climate change and human activities in the Three-River Source Region, China from 1982 to 2012. Sci. Total Environ. 2016, 563, 210–220. [Google Scholar] [CrossRef] [PubMed]
  22. Niu, Z.; He, H.; Zhu, G.; Ren, X.; Zhang, L.; Zhang, K.; Yu, G.; Ge, R.; Li, P.; Zeng, N. An increasing trend in the ratio of transpiration to total terrestrial evapotranspiration in China from 1982 to 2015 caused by greening and warming. Agric. For. Meteorol. 2019, 279, 107701. [Google Scholar] [CrossRef]
  23. He, H.; Wang, S.; Zhang, L.; Wang, J.; Ren, X.; Zhou, L.; Piao, S.; Yan, H.; Ju, W.; Gu, F. Altered trends in carbon uptake in China’s terrestrial ecosystems under the enhanced summer monsoon and warming hiatus. Natl. Sci. Rev. 2019, 6, 505–514. [Google Scholar] [CrossRef] [PubMed] [Green Version]
  24. Liu, Z.; Wang, J.; Wang, X.; Wang, Y. Understanding the impacts of ‘Grain for Green’ land management practice on land greening dynamics over the Loess Plateau of China. Land Use Policy 2020, 99, 105084. [Google Scholar] [CrossRef]
  25. Tian, F.; Liu, L.-Z.; Yang, J.-H.; Wu, J.-J. Vegetation greening in more than 94% of the Yellow River Basin (YRB) region in China during the 21st century caused jointly by warming and anthropogenic activities. Ecol. Indic. 2021, 125, 107479. [Google Scholar] [CrossRef]
  26. Naeem, S.; Zhang, Y.; Zhang, X.; Tian, J.; Abbas, S.; Luo, L.; Meresa, H.K. Both climate and socioeconomic drivers contribute to vegetation greening of the Loess Plateau. Sci. Bull 2021, 66, 1160–1163. [Google Scholar] [CrossRef]
  27. Kou, P.; Xu, Q.; Jin, Z.; Yunus, A.P.; Luo, X.; Liu, M. Complex anthropogenic interaction on vegetation greening in the Chinese Loess Plateau. Sci. Total Environ. 2021, 778, 146065. [Google Scholar] [CrossRef]
  28. Nemani, R.R.; Keeling, C.D.; Hashimoto, H.; Jolly, W.M.; Piper, S.C.; Tucker, C.J.; Myneni, R.B.; Running, S.W. Climate-driven increases in global terrestrial net primary production from 1982 to 1999. Science 2003, 300, 1560–1563. [Google Scholar] [CrossRef] [Green Version]
  29. Zheng, K.; Wei, J.Z.; Pei, J.Y.; Cheng, H.; Zhang, X.L.; Huang, F.Q.; Li, F.M.; Ye, J.S. Impacts of climate change and human activities on grassland vegetation variation in the Chinese Loess Plateau. Sci. Total Environ. 2019, 660, 236–244. [Google Scholar] [CrossRef]
  30. Fu, B.; Wang, S.; Liu, Y.; Liu, J.; Liang, W.; Miao, C. Hydrogeomorphic ecosystem responses to natural and anthropogenic changes in the Loess Plateau of China. Annu. Rev. Earth Planet. Sci. 2017, 45, 223–243. [Google Scholar] [CrossRef]
  31. Goldewijk, K.K. Estimating global land use change over the past 300 years: The HYDE database. Glob. Biogeochem. Cycles 2001, 15, 417–433. [Google Scholar] [CrossRef]
  32. Yu, Z.; Ciais, P.; Piao, S.L.; Houghton, R.A.; Lu, C.Q.; Tian, H.Q.; Agathokleous, E.; Kattel, G.R.; Sitch, S.; Goll, D.; et al. Forest expansion dominates China’s land carbon sink since 1980. Nat. Commun. 2022, 13, 5374. [Google Scholar] [CrossRef]
  33. Harris, I.; Osborn, T.J.; Jones, P.; Lister, D. Version 4 of the CRU TS monthly high-resolution gridded multivariate climate dataset. Sci. Data 2020, 7, 109. [Google Scholar] [CrossRef] [Green Version]
  34. Teckentrup, L.; De Kauwe, M.G.; Pitman, A.J.; Goll, D.S.; Haverd, V.; Jain, A.K.; Joetzjer, E.; Kato, E.; Lienert, S.; Lombardozzi, D. Assessing the representation of the Australian carbon cycle in global vegetation models. Biogeosciences 2021, 18, 5639–5668. [Google Scholar] [CrossRef]
  35. Kobayashi, S.; Ota, Y.; Harada, Y.; Ebita, A.; Moriya, M.; Onoda, H.; Onogi, K.; Kamahori, H.; Kobayashi, C.; Endo, H. The JRA-55 reanalysis: General specifications and basic characteristics. J. Meteorol. Soc. Jpn. Ser. II 2015, 93, 5–48. [Google Scholar] [CrossRef] [Green Version]
  36. Chen, Y.Z.; Feng, X.M.; Tian, H.Q.; Wu, X.T.; Gao, Z.; Feng, Y.; Piao, S.L.; Lv, N.; Pan, N.Q.; Fu, B.J. Accelerated increase in vegetation carbon sequestration in China after 2010: A turning point resulting from climate and human interaction. Glob. Chang. Biol. 2021, 27, 5848–5864. [Google Scholar] [CrossRef]
  37. Piao, S.; Yin, G.; Tan, J.; Cheng, L.; Huang, M.; Li, Y.; Liu, R.; Mao, J.; Myneni, R.B.; Peng, S. Detection and attribution of vegetation greening trend in China over the last 30 years. Glob. Change Biol. 2015, 21, 1601–1609. [Google Scholar] [CrossRef]
  38. Feng, X.; Fu, B.; Piao, S.; Wang, S.; Ciais, P.; Zeng, Z.; Lü, Y.; Zeng, Y.; Li, Y.; Jiang, X.; et al. Revegetation in China’s Loess Plateau is approaching sustainable water resource limits. Nat. Clim. Chang. 2016, 6, 1019–1022. [Google Scholar] [CrossRef]
  39. Bai, M.; Zhou, S.; Tang, T. A Reconstruction of Irrigated Cropland Extent in China from 2000 to 2019 Using the Synergy of Statistics and Satellite-Based Datasets. Land 2022, 11, 1686. [Google Scholar] [CrossRef]
  40. Wei, J.-Z.; Zheng, K.; Zhang, F.; Fang, C.; Zhou, Y.-Y.; Li, X.-C.; Li, F.-M.; Ye, J.-S. Migration of rural residents to urban areas drives grassland vegetation increase in China’s Loess Plateau. Sustainability 2019, 11, 6764. [Google Scholar] [CrossRef] [Green Version]
  41. Li, W.; Li, X.; Tan, M.; Wang, Y. Influences of population pressure change on vegetation greenness in China’s mountainous areas. Ecol. Evol. 2017, 7, 9041–9053. [Google Scholar] [CrossRef]
  42. Wang, J.-J.; Jiang, Z.-D.; Xia, Z.-L. Grain-for-green policy and its achievements. In Restoration and Development of the Degraded Loess Plateau, China; Springer: Berlin/Heidelberg, Germany, 2014; pp. 137–147. [Google Scholar]
  43. Farquhar, G.D.; Sharkey, T.D. Stomatal conductance and photosynthesis. Annu. Rev. Plant Physiol. 1982, 33, 317–345. [Google Scholar] [CrossRef]
  44. Norby, R.J.; Zak, D.R. Ecological lessons from free-air CO2 enrichment (FACE) experiments. Annu. Rev. Ecol. Evol. Syst. 2011, 42, 181–203. [Google Scholar] [CrossRef] [Green Version]
  45. Ukkola, A.M.; Prentice, I.C.; Keenan, T.F.; Van Dijk, A.I.; Viney, N.R.; Myneni, R.B.; Bi, J. Reduced streamflow in water-stressed climates consistent with CO2 effects on vegetation. Nat. Clim. Chang. 2016, 6, 75–78. [Google Scholar] [CrossRef] [Green Version]
  46. Kolby Smith, W.; Reed, S.C.; Cleveland, C.C.; Ballantyne, A.P.; Anderegg, W.R.; Wieder, W.R.; Liu, Y.Y.; Running, S.W. Large divergence of satellite and Earth system model estimates of global terrestrial CO2 fertilization. Nat. Clim. Chang. 2016, 6, 306–310. [Google Scholar] [CrossRef]
Figure 1. The location and land cover of Loess Plateau in 2015.
Remotesensing 15 01233 g001
Figure 2. (a) The spatial pattern and (b) average values for each province of MODIS LAI on the Loess Plateau.
Remotesensing 15 01233 g002
Figure 3. The interannual trend of LAIMODIS on the Loess Plateau During 2000–2019. (a) The interannual variations in LAIMODIS on the Loess Plateau; (b) the interannual variation in LAIMODIS for each province of the Loess Plateau (** represents P < 0.01); (c) spatial distribution of LAIMODIS trends. The inset map at the top-left corner shows the significant increasing (green) or decreasing trend (blue) in LAIMODIS during the study period; the inset graph at the bottom-left corner describes the frequency distribution of satellite-based LAIMODIS trends.
Remotesensing 15 01233 g003
Figure 4. (a) Average environmental-induced LAIs based on the Scenario S2 from TRENDY project and (b) interannual trends of those LAIs in the Loess Plateau during the period between 2000 and 2019. * represents P < 0.05; ** represents P < 0.01.
Remotesensing 15 01233 g004
Figure 5. The influences of natural and anthropogenic factors on vegetation change in the Loess Plateau during 2000–2019. (a) The relative interannual trends of actual LAI (LAIMODIS_normalized), environmental change-induced LAI (LAIEnvironmental_normalized) and human land-use management-induced LAI (LAIHuman_normalized). Anomalies were calculated as the difference between the normalized LAI for a given year and the average value during the study period. (b) The relative contribution of environmental change and human land-use management to the actual LAI trends for each province.
Remotesensing 15 01233 g005
Figure 6. (a) Relative importance of climate change and CO2 fertilization to environmental-induced LAI on the Loess Plateau from 2000 to 2019. (b) Partial correlation coefficients between climate-induced LAI and climate factors. * = P < 0.05 and ** = P < 0.01.
Remotesensing 15 01233 g006
Figure 7. Relationship between the LAIMODIS_normalized trend and forest area for the (a) Loess Plateau, (b) different provinces, (c) Shanxi, and (d) Shaanxi. ** represents P < 0.01.
Remotesensing 15 01233 g007
Figure 8. The interannual changes in the LAIMODIS_normalized anomaly and forest coverage rate of the Loess Plateau from 2000 to 2019.
Remotesensing 15 01233 g008
Figure 9. Relationship between LAIMODIS_normalized and gross domestic product (GDP) since 2000 for (a) the Loess Plateau and (b) different provinces. ** represents P < 0.01.
Remotesensing 15 01233 g009
Figure 10. The frequency distribution of normalized LAI. (a) The frequency distribution of LAIMODIS_normalized and LAIEnvironmental_normalized; (b) the frequency distribution of normalized MODIS LAI and normalized simulated LAI from models.
Remotesensing 15 01233 g010
Disclaimer/Publisher’s Note: The statements, opinions and data contained in all publications are solely those of the individual author(s) and contributor(s) and not of MDPI and/or the editor(s). MDPI and/or the editor(s) disclaim responsibility for any injury to people or property resulting from any ideas, methods, instructions or products referred to in the content.

