Article

Improved Estimation of the Gross Primary Production of Europe by Considering the Spatial and Temporal Changes in Photosynthetic Capacity from 2001 to 2016

1
School of Geomatics and Urban Spatial Informatics, Beijing University of Civil Engineering and Architecture, Beijing 100044, China
2
State Key Laboratory of Remote Sensing Science, Aerospace Information Research Institute-Chinese Academy of Sciences and Beijing Normal University, Beijing 100101, China
3
Key Laboratory of Urban Spatial Information, Ministry of Natural Resources of the People’s Republic of China, Beijing University of Civil Engineering and Architecture, Beijing 102616, China
4
Sino-French Institute for Earth System Science, College of Urban and Environmental Sciences, Peking University, Beijing 100091, China
5
Institute for a Secure and Sustainable Environment (ISSE), University of Tennessee, Knoxville, TN 37996, USA
6
Department of Geography, University of North Carolina at Chapel Hill, Chapel Hill, NC 27599, USA
7
Jiangsu Provincial Key Laboratory of Geographic Information Science and Technology, International Institute for Earth System Science, Nanjing University, Nanjing 210023, China
*
Author to whom correspondence should be addressed.
Remote Sens. 2023, 15(5), 1172; https://doi.org/10.3390/rs15051172
Submission received: 6 January 2023 / Revised: 4 February 2023 / Accepted: 16 February 2023 / Published: 21 February 2023
(This article belongs to the Special Issue Remote Sensing of Vegetation Biochemical and Biophysical Parameters)

Abstract

:
The value of leaf photosynthetic capacity (Vcmax) varies with time and space, but state-of-the-art terrestrial biosphere models rarely include such Vcmax variability, hindering the accuracy of carbon cycle estimations on a large scale. In particular, while the European terrestrial ecosystem is particularly sensitive to climate change, current estimates of gross primary production (GPP) in Europe are subject to significant uncertainties (2.5 to 8.7 Pg C yr−1). This study applied a process-based Farquhar GPP model (FGM) to improve GPP estimation by introducing a spatially and temporally explicit Vcmax derived from the satellite-based leaf chlorophyll content (LCC) on two scales: across multiple eddy covariance tower sites and on the regional scale. Across the 19 EuroFLUX sites selected for independent model validation based on 9 plant functional types (PFTs), relative to the biome-specific Vcmax, the inclusion of the LCC-derived Vcmax improved the model estimates of GPP, with the coefficient of determination (R2) increased by 23% and the root mean square error (RMSE) decreased by 25%. Vcmax values are typically parameterized with PFT-specific Vcmax calibrated from flux tower observations or empirical Vcmax based on the TRY database (which includes 723 data points derived from Vcmax field measurements). On the regional scale, compared with GPP, using the LCC-derived Vcmax, the conventional method of fixing Vcmax using the calibrated Vcmax or TRY-based Vcmax overestimated the annual GPP of Europe by 0.5 to 2.9 Pg C yr−1 or 5 to 31% and overestimated the interannually increasing GPP trend by 0.007 to 0.01 Pg C yr−2 or 14 to 20%, respectively. The spatial pattern and interannual change trend of the European GPP estimated by the improved FGM showed general consistency with the existing studies, while our estimates indicated that the European terrestrial ecosystem (including part of Russia) had higher carbon assimilation potential (9.4 Pg C yr−1). Our study highlighted the urgent need to develop spatially and temporally consistent Vcmax products with a high accuracy so as to reduce uncertainties in global carbon modeling and improve our understanding of how terrestrial ecosystems respond to climate change.

1. Introduction

The terrestrial ecosystem offsets approximately 30.5% of the carbon dioxide (CO2) released due to anthropogenic activity [1] and plays a prominent role in regulating global carbon cycling [2]. As a quantitative indicator of the total amount of carbon assimilated via photosynthesis, terrestrial gross primary production (GPP) serves as the initial driver of the global carbon cycle [3]. On the continental scale, the terrestrial ecosystems in Europe have been proven to be ecologically fragile and particularly sensitive to climate change [4,5,6]. According to long-term-recorded remotely sensed data, the terrestrial ecosystem has demonstrated widespread greening since the 1980s, especially in the Northern Hemisphere [7]. Modeling studies have suggested that the total GPP values for Europe vary in a wide range from 2.5 to 8.7 Pg C yr−1 [8,9,10,11,12,13,14]. While there are some discrepancies between study regions (e.g., those including or excluding part of Russia), estimates of European GPP are subject to significant uncertainties, hindering our understanding of the role of the European terrestrial ecosystems in mitigating climate change.
Attempts to model GPP on a global scale using remote sensing data fall into three general categories. The first is empirical approaches based on statistical models or machine learning. These studies empirically link GPP with the spectral vegetation index [15,16,17], leaf area index (LAI) [18], and sun-induced chlorophyll fluorescence (SIF) [19,20]. Some studies use machine learning methods to estimate local or global GPP [21,22]. The second category is the widely used light use efficiency (LUE) model [23]. These models assume that GPP is a product of the fraction of absorbed photosynthetic active radiation (APAR) and LUE reduced by modifying factors. Examples are BIOMASS [24], CASA [25], C-Fix [8], 3-PG [26], VPM [27], EC-LUE [28], the P-model [29], and CCW [30] models. The third category is process-based terrestrial biosphere models (TBMs), such as CENTURY [31], TEM [24], Biome-BGC [32], BESS [33], BEPS [34], and FGM [35]. Biologically, GPP is a product of leaf-scale photosynthesis. Thus, GPP is related to both internal and environmental factors, including rapid leaf-level biochemical reactions, stomatal conductance [36], canopy structure [37], climatic factors, soil moisture [38], and slower environmental acclimation processes [39]. However, empirical models, machine learning methods, and LUE models have a limited ability to simulate the response of GPP to complicated environmental and internal biological factors due to their inadequate representation of the mechanisms that regulate the physiological process of photosynthesis.
TBMs have proven to be particularly useful for estimating GPP due to their inclusion of the biochemical processes of photosynthesis. TBMs commonly include the mechanistic leaf photosynthesis model developed by Farquhar et al. (1980). To estimate the spatiotemporal patterns of GPP on a large scale, TBMs require a range of forcing data, such as meteorological data, land cover, the leaf area index, the clumping index, and leaf trait information. Most importantly, the leaf photosynthesis rate simulated by the Farquhar model is particularly sensitive to the parameterization of leaf photosynthetic capacity at 25 °C (Vcmax) ( μ mol CO2 m−2 s−1) [2,40,41], reflecting the active amount and kinetic activity of the Rubisco enzyme in leaves. Inadequate constraints on Vcmax lead to substantial uncertainties in GPP estimation [42]. Traditionally, Vcmax is estimated by measuring the net photosynthesis rate (An) relative to internal CO2 pressure (Ci) (i.e., An–Ci curve) at different CO2 concentrations with saturating irradiance or using a modified ‘one-point method’ [43,44]. Measuring one An–Ci curve can take up to one hour, generating only one Vcmax value based on a small number of leaf samples. Thus, field measurements of Vcmax on the leaf scale [45] are laborious, time-consuming, and, most importantly, mismatched with the footprints (~100 m–450 m) of eddy covariance (EC) flux towers [46].
Due to the lack of spatiotemporal information on Vcmax, the state-of-the-art TBMs generally assume a constant Vcmax for a specific plant functional type (PFT). More specifically, PFT-specific Vcmax values are typically parameterized using two types of data: (1) optimal Vcmax data calibrated from a GPP derived from eddy covariance flux tower measurements [35,47,48]; and (2) empirical Vcmax compiled from field measurements reported in the literature [49]. However, many studies have proven the existence of variations in Vcmax with space and time, even for plants with the same PFT [50,51,52,53,54]. Consequently, the conventional parameterization methods that fix Vcmax as a PFT-specific constant can lead to substantial bias in GPP estimations. In addition, previous studies have mostly been conducted on the global scale, and TBMs with parameters calibrated based on all flux tower observations worldwide may have limited accuracy on the regional scale, as in Europe. Thus, European GPP could possibly be improved by including spatially and temporally explicit Vcmax values combined with a model calibration method based on EC observations based in Europe alone.
Recent advances in remote sensing have made it possible to derive dynamic Vcmax information on a global scale [55]. Global Vcmax products are generally estimated based on the strong correlation between Vcmax and two major biochemistry properties (i.e., the leaf chlorophyll content (LCC) and leaf nitrogen content) [56], which can be estimated from remotely sensed hyperspectral land surface reflectance and solar-induced chlorophyll fluorescence (SIF) data. For example, two Vcmax products are estimated from GOME-2 SIF data [57] and GOME-2/OCO-2 SIF data [51]. However, the spatial resolution of SIF-derived Vcmax products is generally too coarse (i.e., 36 km–1°) for regional studies. In contrast, the Vcmax products derived from LCC have a higher spatial resolution (i.e., 500 m to 1 ° ) [58,59]. While some LCC-based Vcmax products have a relatively low update frequency and a short accumulation time (i.e., less than a decade with a one-month interval) [58], a few LCC-based Vcmax products provide approximately twenty years of comprehensive Vcmax estimation at a 500 m spatial resolution and 8-day temporal resolution [59]. Thus, the newly developed remote sensing Vcmax products provide an opportunity to improve the estimation of GPP in Europe by including spatial and temporal variations in Vcmax.
While a high value has been placed on the modeling of Vcmax dynamics on a global scale, the concomitant increase in our understanding of the Vcmax change effect on GPP has only partially been realized. This brings us to the crux of our study: the quantitative analysis of uncertainties in GPP using the conventional constant Vcmax parameterization in TBMs. In this study, we hypothesize that by considering changes in Vcmax, we can improve the estimation of spatial and temporal variations in GPP. Specifically, we address the following three scientific questions: (1) How much carbon has been assimilated by the terrestrial ecosystem in Europe? (2) Can GPP estimation be improved by including the spatiotemporal dynamics of Vcmax compared with the conventional method of fixing Vcmax as a PFT-specific constant? (3) How much uncertainty lies in European GPP estimates that do not consider changes in Vcmax? By answering these questions, our study offers an improved estimation of the carbon assimilated by the terrestrial ecosystem in Europe and can help us to better understand the role of the Northern Hemisphere in mitigating climate change.

2. Materials and Methods

2.1. Study Regions and Flux Towers

The study region covers the mainland of Europe and part of Russia, excluding England and parts of Siberia. Flux towers provide direct measurements of ecosystem carbon fluxes. In this study, 40 sites located in Europe (Figure 1) were selected from FLUXNET 2015 (https://fluxnet.org/data/fluxnet2015-dataset/) [60] based on the availability of Vcmax data. In addition, we screened out EuroFLUX sites with inconsistent profiles of LAI and GPP derived from eddy covariance data. Given the limited pool of shrubland sites in EuroFLUX, the SH site from AmeriFLUX was also included, since only one CSH site (i.e., US-KS2) is available in AmeriFLUX. The land cover types in the study region were extracted from the MODIS International Geosphere–Biosphere Programme (IGBP) classification product (Figure 1), which has a spatial resolution of 500 m. The land cover types were grouped into a total of ten PFTs, including croplands (CRO), closed shrublands (CSH), deciduous broadleaf forest (DBF), deciduous needleleaf forest (DNF), evergreen broadleaf forest (EBF), evergreen needleleaf forest (ENF), grasslands (GRA), mixed forest (MF), open shrublands (OSH), and wetland (WET).

2.2. Methods

2.2.1. A Process-Based Farquhar GPP Model (FGM)

We recently developed a large-scale Farquhar GPP model (FGM) based on eddy covariance data and remote sensing data [35]. The FGM model was initially developed from a stand-level GPP model based on Song et al. (2009). Derived from the Song et al. (2009) model, the FGM estimates GPP by integrating the Farquhar leaf-level biochemical photosynthesis model [40] with a two-leaf radiation interception simulation method. In the Song et al. (2009) model, GPP is solved based on three complex equations: Fick’s law, the Farquhar photosynthesis model, and a model for stomatal conductance. This approach is computationally expensive. To reduce the computational need for large-scale GPP estimation at a high spatiotemporal resolution, we introduced the optimal stomatal conductance theory to compute GPP more efficiently with the FGM.
The FGM simulates carbon assimilation using the Farquhar, von Caemmerer, and Berry (i.e., FvCB) [40] enzyme kinetic model, which couples electron transport and the Calvin-Benson cycle. The function of the leaf photosynthetic rate takes the minimum of the Vcmax-limited photosynthesis rate (i.e., A v ) and light-limited photosynthesis rate (i.e., A j ). Some fundamental equations for GPP estimation with the FGM are described here:
A n = min { A v A j }
A v = V cmax ( C i Γ * ) C i + K C ( 1 + O / K O ) R d
A j = J ( C i Γ * ) 4 . 5 C i + 10 . 5 Γ * R d
where A n is the net photosynthesis rate; A v is the minimum of the V cmax -limited photosynthesis rate; A j   is the light-limited photosynthesis rate; Rd is the dark respiration rate; Γ * is the CO2 compensation point; K C and K O are the Michaelis–Menten constants of Rubisco for CO2 and O2, respectively; O is the intercellular oxygen partial pressure in the leaves; and J is the rate of electron transport.
According to the optimal stomatal conductance theory, plants adjust their stomata to minimize the combined unit costs of transpiration and carbon assimilation [61]. Assuming the residual conductance parameter g 0 equals zero, the ratio of the intercellular CO2 concentration ( C i ) to ambient CO2 concentration ( C a ) is regulated by the atmospheric vapor pressure deficit based on optimal stomatal theory [62,63]:
C i C a     g 1 g 1 + D
where D is the vapor pressure deficit in kPa, and g 1 is an empirical parameter in kPa0.5. According to its theoretical interpretation, the parameter g 1 increases with the marginal water cost of carbon λ and the CO2 compensation point Γ * . Thus, species with a high g 1 will have a low instantaneous water use efficiency, i.e., a lower ratio of photosynthesis to the transpiration rate.
The FGM estimates the mean carboxylation capacity of a unit sunlit leaf ( V cmax 25 _ sunlit ) and shaded leaf ( V cmax 25 _ shaded ) area with the following models [53,64,65]:
V cmax 25 _ sunlit = Ω LV cmax 25   ( 1 . 0 exp ( k n K b ( θ z ) Ω L ) ) ( k n + K b ( θ z ) Ω L ) / L sunlit
V cmax 25 _ shaded = Ω LV cmax 25 L shaded [ 1 . 0 exp ( k n ) k n 1 . 0 exp ( k n ( θ z ) Ω L ) ( k n + K b ( θ z ) Ω L ) ]
where Ω is the clumping index; L is the total LAI; L sunlit and L shaded are the LAIs for sunlit leaves and shaded leaves, respectively; k n is the coefficient of leaf nitrogen allocation; θ z is the solar zenith angle; K b ( θ z ) is the light extinction coefficient; and V cmax 25 is the maximum carboxylation rate standardized to 25 °C for sunlit leaves. L sunlit and L shaded are estimated using Beer’s law as follows:
L sunlit = e K b ( θ z ) Ω L K b ( θ z )
L shaded = L L sunlit
In this study, Vcmax represents the maximum carboxylation rates, standardized to 25   ° C hereafter (i.e., Vcmax25). In the FGM, the temperature effect on Vcmax is modeled as follows:
V cmax = V cmax 25   exp ( a 1 ( T   25 ) ) ( 1 + exp ( a 2 ( T 41 ) )
where T is air temperature and a1 (0.051) and a2 (0.205) are empirical parameters based on measurements [65,66].
The canopy total GPP is the sum of the GPP for both the sunlit and the shaded leaves:
GPP = A n sunlit L sunlit + A n shade L shade
where A n sunlit and A n shade are the net photosynthesis rate for a unit sunlit leaf area index and a unit shaded leaf area index, respectively.
Additional details of the theoretical framework, default parameter values for the FGM, and model calibration method can be found in our previous study [35].

2.2.2. Model Calibration and Validation Methods

In the original version of the FGM, both g 1 and V cmax were biome-specific and calibrated together using the FLUXNET2015 dataset [60]. In this study, because a new parameterization method for V cmax was adopted, we only needed to calibrate the parameter g 1 for various PFTs in the FGM. Here, we randomly split the sites for each PFT at a 1:1 ratio for independent model calibration and validation (Table 1). We calibrated the parameter g 1 using data collected at calibration sites for nine PFTs, and the remaining sites were reserved for independent validation. For most PFTs, the sites split for calibration covered a wide spatial distribution and ensured representative EC data for the calibration. Moreover, the independent validation reduced the number of uncertainties caused by the inclusion of prior information using reduplicate sites for the calibration and validation. The independent model calibration and validation ensured a reliable and objective assessment of the model’s performance.
Given that only one OSH site (i.e., ES-Lgs) is available in Europe, the flux data for ES-Lgs were separated by year for the model calibration and validation, respectively. When calibrating the values of g 1 for different PFTs, Vcmax was set to the seasonal dynamics derived from the LCC. Table 1 lists the results of the calibrated g 1 values for different PFTs. There are no flux towers for deciduous needleleaf forests (DNF) in Europe. Thus, we adopted the default values of g 1 for DNF [35].

2.2.3. Simulation Experiments

Four simulation scenarios were designed depending on the types of Vcmax used in the FGM. First, we defined a reference setup that included changes in all the factors (i.e., simulation “All”) to drive the FGM in a straightforward manner. In the “All” simulation, the FGM was operated with the spatially and temporally explicit Vcmax derived from the LCC in a 500 m grid cell and 8-day temporal interval from 2001 to 2016 (Table 2). By considering the spatial and temporal changes in Vcmax, the European GPP for the contemporary climate was estimated based on the “All” simulations.
While the other input data were kept fixed for all the runs, three other simulation scenarios (Table 2) were designed with different types of photosynthetic capacity (PC) parameterization methods, as follows: (a) In simulation “PC1”, the FGM was operated with 500 m, 8-day Vcmax data derived from the LCC in 2001 by considering spatial and seasonal changes in Vcmax, neglecting the interannual variations in Vcmax from 2001 to 2016. (b) In simulation “PC2”, the FGM was parameterized with PFT-specific Vcmax constants retrieved from flux tower observations. This typical Vcmax parameterization method is widely adopted for TBMs. (c) In simulation “PC3”, the FGM was parameterized with PFT-specific Vcmax constants provided by the TRY database (which includes 723 data points of Vcmax field measurements) [49]. Kattge et al. (2009) compiled data on qualitative traits, climate, and soil to subdivide terrestrial vegetation into PFTs and set Vcmax to different empirical values for different PFTs.
We then compared the simulations “PC1”, “PC2”, and “PC3” with the reference to quantify the effects of the changed photosynthesis capacity on the magnitude and spatial pattern of, as well as the temporal variation in, GPP. Thus, the simulation difference between “All” and “PC1” (i.e., “All”−“PC1”) represents the impacts of interannual changes in Vcmax on GPP. The simulation difference between “All” and “PC2” (i.e., “All”−“PC2”) or “PC3” (i.e., “All”–“PC3”) represents the uncertainties regarding GPP using two typical parameterization methods by fixing Vcmax as a PFT-specific constant.
Table 2. Scenario designs used to quantify the effects of changes in photosynthesis capacity (PC) on GPP based on the FGM. The symbol ‘△’ indicates that the input variable changes over time, while the symbol ‘▲’ indicates that the seasonality of Vcmax on a large scale is included. The symbol ‘ ’ indicates that the input variable is fixed at a biome-specific constant.
SimulationAll
(LCC-Derived Vcmax)
PC1
(LCC-Derived Vcmax)
PC2
(PFT-Specific Vcmax)
PC3
(PFT-Specific Vcmax)
LULC
LAI
Ω
Vcmax
(8-day, 2001 to 2016)

(8-day, 2001)

(Optimal constants retrieved from eddy covariance data)

(Empirical constants based on TRY 1 database)
DSR
Ta
RH
CO2
1 See Kattge et al. (2009).

2.2.4. Data Analysis Methods

(1)
Model performance evaluation during the calibration process
We conducted Monte Carlo simulations to calibrate parameter g1 and Vcmax for each biome. The optimal values of g1 for different biomes were set as driving parameters for the FGM, while the optimal values of Vcmax for different biomes were only used for the quantification of the Vcmax change effect on GPP. The Monte Carlo simulations identified optimal parameters when the simulated data reached the strongest agreement with the observed data using a weighted R2 (wR2) as a performance indicator [30,100]:
wR 2 = { | b | R 2 ,   b < 1 | b | 1 R 2 ,   b 1  
where b and R2 are the slope and coefficient of determination for the regression of the modeled GPP and GPP estimates derived from eddy covariance data (EC-GPP) when the intercept is forced to zero, respectively [101]. A coefficient of determination (R2) equal to one and b equal to one (wR2 = 1) indicate a perfect model performance. The range of R2 is 0 to 1, which describes the proportion of the observed dispersion that is explained by the prediction.
(2)
Quantification of the accuracy of the FGM GPP
To quantify the accuracy of the FGM GPP directly, first, we compared the simulated GPP with the EC-GPP collected during the daytime at the 19 validation sites. The R2 and root mean square error (RMSE) were estimated using the regression lines between the modeled GPP and EC-GPP to evaluate the FGM model performance.
Second, we quantified the accuracy of the spatial pattern of European GPP predicted by the FGM. The multi-year mean of the European vegetation photosynthesis rate was calculated based on different GPP products and the remotely sensed sun-induced chlorophyll fluorescence (SIF) data for the same study area. The results of the multi-year means of the annual European GPP and SIF data with coarse spatial resolutions were resampled to the target spatial resolution of 500 m by nearest neighbor interpolation. We calculated the spatial correlation matrix between the different GPP products and the SIF data. The correlation matrix provides the correlation coefficients between each combination of two inputs using Person’s correlation (r) metric as an indicator. It is calculated as:
r X , Y = i = 1 n ( X i   X ¯ ) ( Y i   Y ¯ ) i = 1 n ( X i   X ¯ ) 2 i = 1 n ( Y i   Y ¯ ) 2
where n is the number of vegetated pixels in the study area, i is the grid cell index, Xi is the estimates of GPP based on the FGM, and Yi is the estimates of GPP based on other GPP products or the SIF data.
Third, we quantified the accuracy of the interannual changes in the FGM GPP. We calculated the annual GPP of Europe by accumulating 8-day GPP predictions with a yearly temporal resolution from 2001 to 2016 based on the FGM and other GPP products. During the study period, the annual GPP of Europe predicted by the FGM was evaluated against other global GPP products using the correlation coefficient r and interannual trend b as two quantitative indicators. Here, r describes the temporal correlation coefficient between two GPP products based on the regression of interannual GPP dynamics from 2001 to 2016, in turn based on the FGM GPP and other GPP products, and b is the slope (Pg C yr−2) for the regression of interannual GPP dynamics (Pg C yr−1) from 2001 to 2016.
(3)
Quantification of the Vcmax change effects on GPP
On a large scale, we quantify the Vcmax change effect on GPP by measuring the magnitude in percent as the mean absolute difference between the pixel-based means of the simulations, on the one hand, and “PC2” and “PC3”, on the other, relative to the mean of the reference simulation with “All”, as:
Effect Magnitude = i = 1 n | AR ¯ REF ¯ | i = 1 n REF i ¯   ×   100
where REF is the reference modeling setup using the LCC-derived Vcmax, and AR is an alternative realization where the Vcmax of the reference setup has changed. The single overbar denotes the grid-cell-based temporal mean.

2.3. Data

2.3.1. Flux Data

FLUXNET2015 provides gap-filled EC-GPP and corresponding meteorological data on a daily time scale. We excluded sites without Vcmax data. A total of forty sites in EuroFLUX and one site in AmeriFLUX were selected from FLUXNET 2015 [60]. Time series LAI data were extracted from the GLASS LAI product for the pixels in which the flux towers were located. Because of the potential for uncertainties in both GPP and LAI, we excluded flux data with inconsistent temporal profiles of EC-GPP and LAI. This screening can reduce the amount of noise from the spatial mismatch between the remotely sensed data and field observations. In addition, nighttime flux data were removed. A total of 188 site years were selected for model calibration and validation purposes. The site-level daily EC-GPP, shortwave radiation, temperature, VPD, and LAI were used to drive the FGM.

2.3.2. Forcing Datasets for the FGM

Model inputs related to vegetation and environmental forcing data are listed in Table 3. PFTs on a large scale were determined using MODIS land use and land cover data according to the MODIS IGBP classification protocol. The FGM uses meteorological data (downward shortwave radiation (DSR), mean air temperature, and vapor pressure deficit (VPD)) from the Climatic Research Unit-NCEP (CRUNCEP), LAI data from the Global Land Surface Satellite (GLASS) product, and ambient CO2 concentration from the Mauna Loa Observatory (MLO) as inputs. We further included the spatially resolved model inputs for the clumping index (CI) and Vcmax. The CI data were from the global CI map derived from the MODIS bidirectional reflectance distribution function (BRDF) product [102]. Temporally and spatially continuous global Vcmax maps were estimated based on the remotely sensed chlorophyll content [103,104] using Rubisco–chlorophyll relationships between vegetation types via meta-analyses [105,106]. All data were processed to a target spatial resolution of 500 × 500 m and temporal resolution of 8 days.

2.3.3. Global GPP Products for Intercomparison

To examine the spatial pattern and interannual dynamics of the FGM GPP, a total of nine popular global GPP products (Table 4) were estimated using different methods, including one empirical model, four light use efficiency (LUE) models, three machining learning methods, and one process-based biophysical model. The GOSIF GPP product was derived from the empirical relationship between GPP and SIF [113,114]. The LUE-based GPP products included the CCW [30], MOD17 [115], VPM [116], and GLASS [28,117] products. Three machine-learning-based GPP products, including an artificial neural network (ANN), the multivariate adaptive regression splines method (MARS), and the random forest method (RF), were derived from FLUXCOM GPP [118,119]. In addition, a global process-based GPP estimation derived from the BEPS was also included [34]. We evaluated the FGM GPP with the collected GPP products and GOSIF data on a yearly scale. In addition, we also evaluated the FGM GPP with the GOSIF data, derived from the SIF soundings of the Orbiting Carbon Observatory-2 (OCO-2), MODIS data, and meteorological reanalysis data [35,113].

3. Results

3.1. Model Evaluation

3.1.1. Including Dynamic Vcmax Information Improved GPP Estimation at EuroFLUX Sites

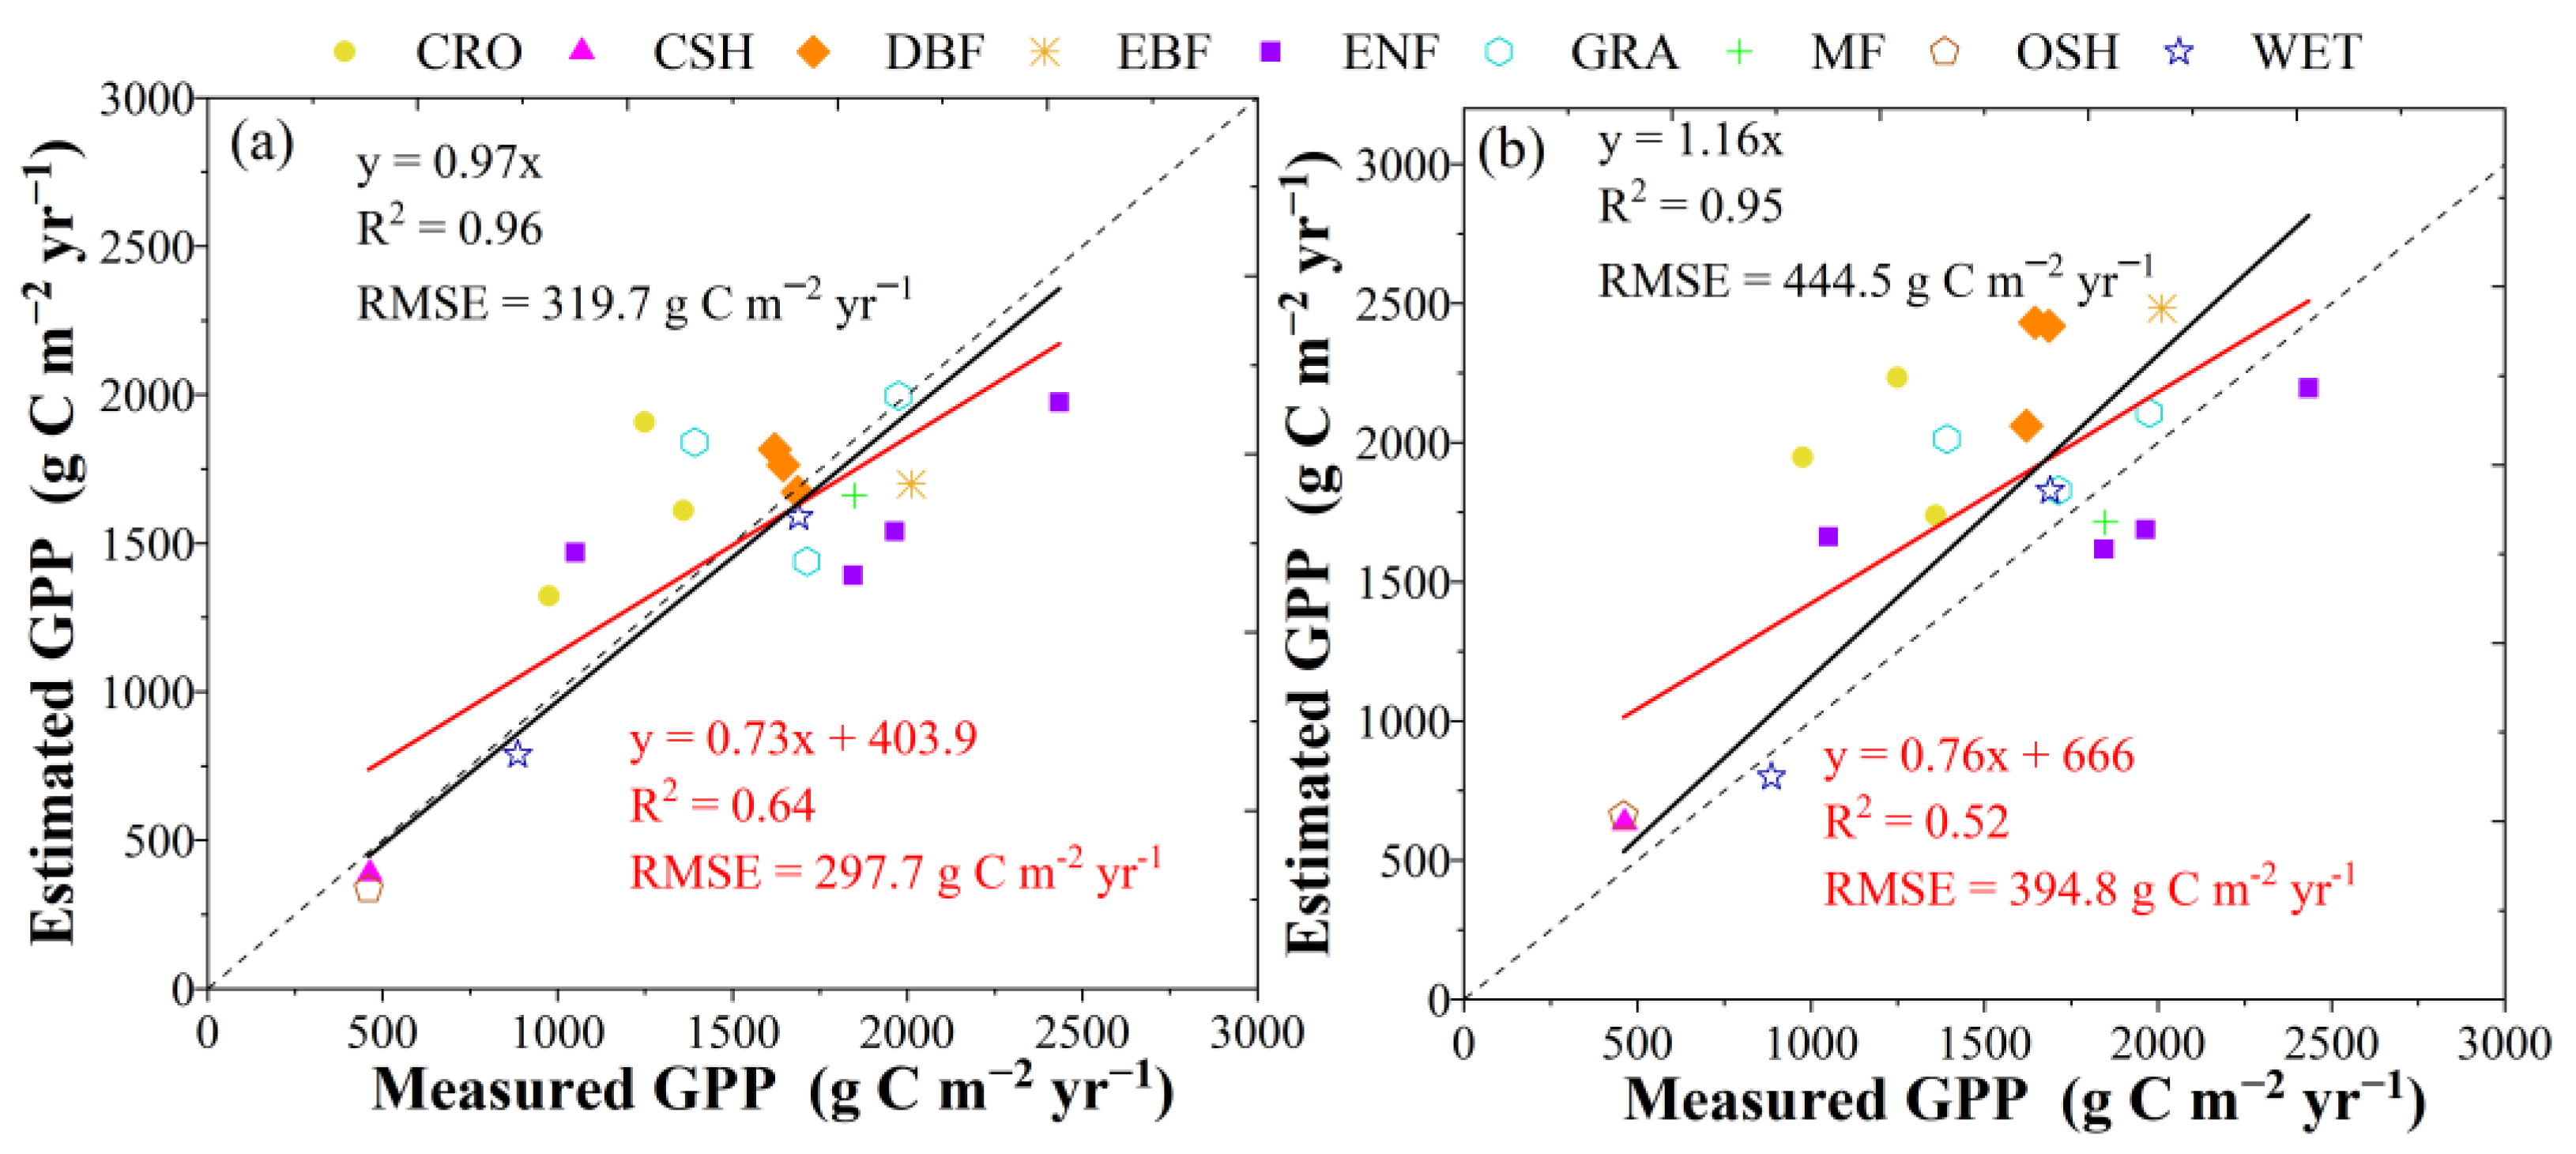
We first compared the performance of the FGM between the 19 validation sites (Table 1) using the LCC-derived dynamic Vcmax (“All”) and TRY-based constant Vcmax (“PC3”). While “PC3” used only the LAI to describe changes in vegetation status, “All” considered the variability in both the LAI and the Vcmax in the estimation of GPP. Compared with the TRY-based Vcmax, the FGM improved the estimation of daily GPP, with the R2 increased from 0.52 to 0.64 and RMSE decreased by 25%. When forcing the intercept to zero, the R2 was much higher (0.95 to 0.96). Meanwhile, the scatters between the estimated GPP and EC-GPP from “All” were closer to the 1:1 line, with smaller biases than “PC3” after including the LCC-derived Vcmax (Figure 2).
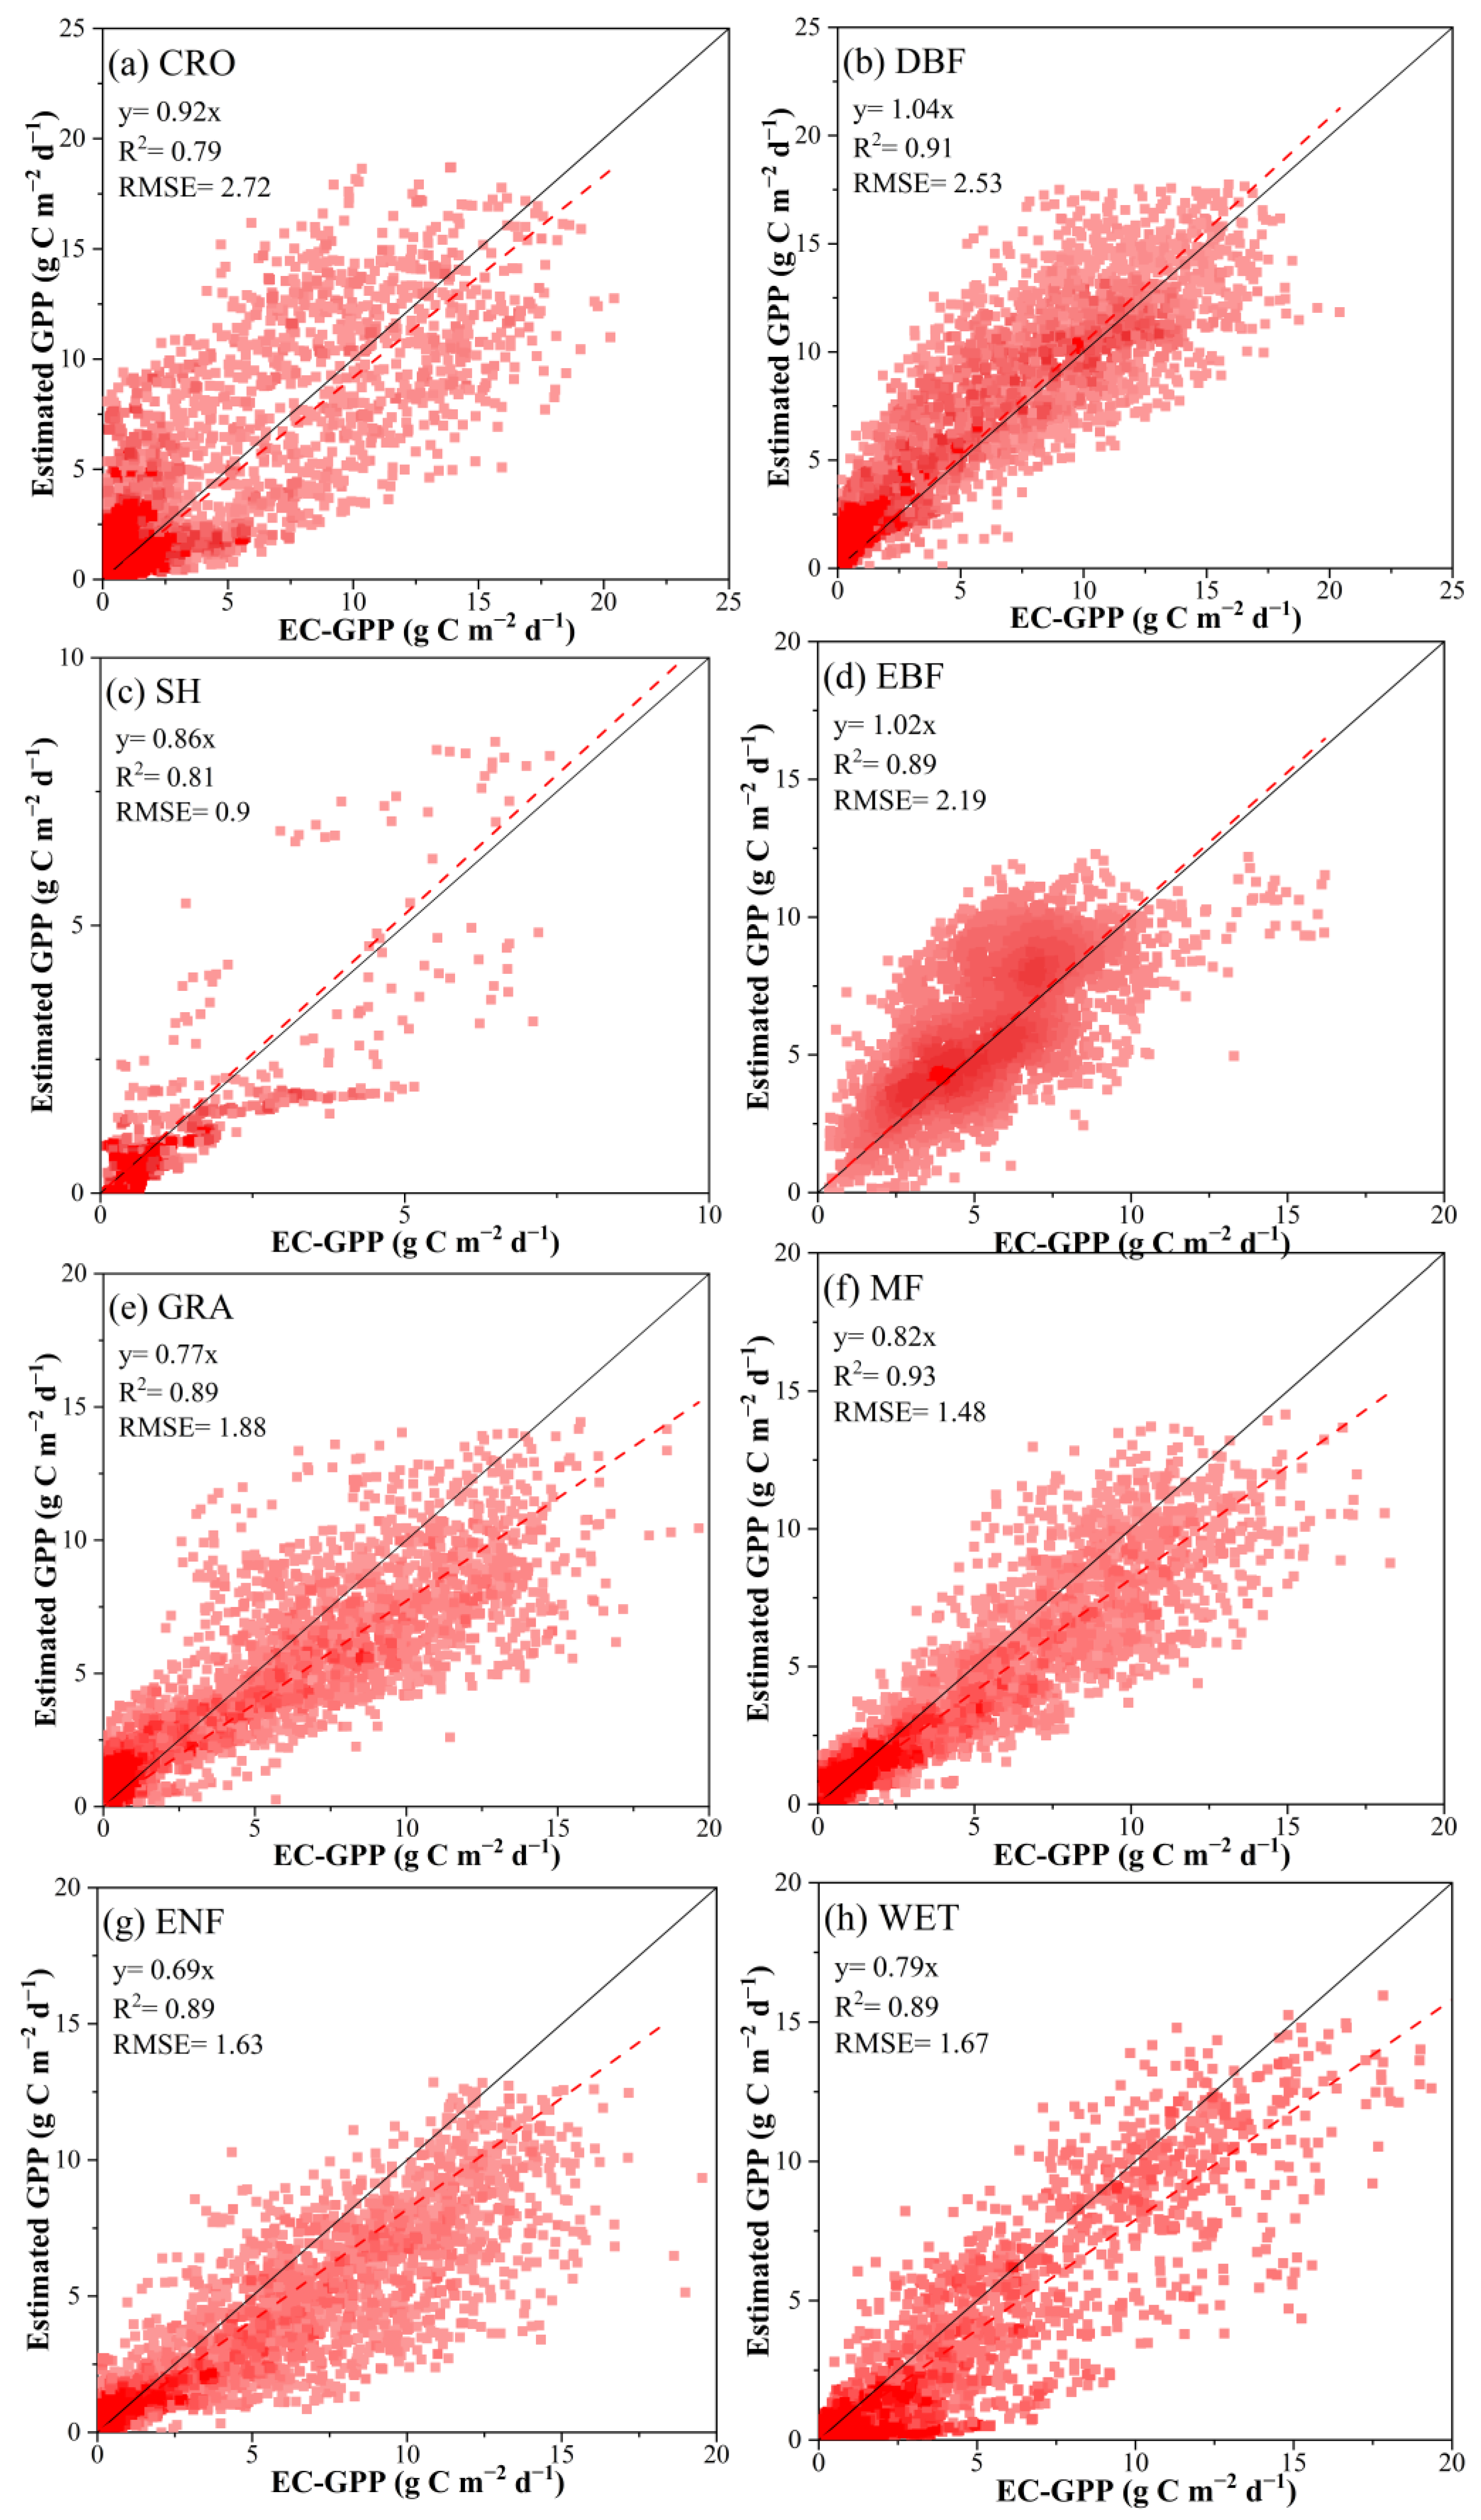
The FGM model generally showed a reasonable performance in predicting daily GPP compared with in situ GPP measurements across different biomes in Europe (Figure 3 and Figure 4). Overall, the FGM captured an average of 87.5% of the variation in the EC-GPP from the validation dataset. We randomly split the forty EuroFLUX sites into 1:1 by biome to conduct independent model calibration and validation. Our independent validation indicated that the R2 between the modeled GPP and EC-GPP ranged from 0.79 to 0.93, with RMSE values ranging from 0.9 to 2.73 g C m−2 d−1 (Figure 3). The independent validation analysis indicated the strongest model performances for MF and DBF (Figure 3b,f) and less satisfactory agreement for CRO (Figure 3a). The agricultural sites had a relatively high RMSE of 2.72 g C m−2 d−1 and a relatively low R2 of 0.79, mainly based on deviations in amplitude and growing season periods (Figure S1). For example, in the case of DE_Seh, the FGM predicted lower GPP values than those of EC-GPP (Figure S1). The modeled GPP values were close to the values of EC-GPP in 2008 but showed lower productivity in the vegetation phase compared to the values of EC-GPP in 2007 for the same site (e.g., DE_Seh), probably due to uncertainties in the remote sensing products, such as the LAI (Figure S2). Despite some discrepancies, the FGM generally simulated the variations in the GPP on the daily time scale effectively.

3.1.2. FGM GPP Estimations Matched with GOSIF and Other GPP Products

In addition to the flux tower measurements, we further introduced nine global GPP products and remotely sensed GOSIF data to examine the large-scale pattern and temporal dynamics of European GPP estimated by the FGM.
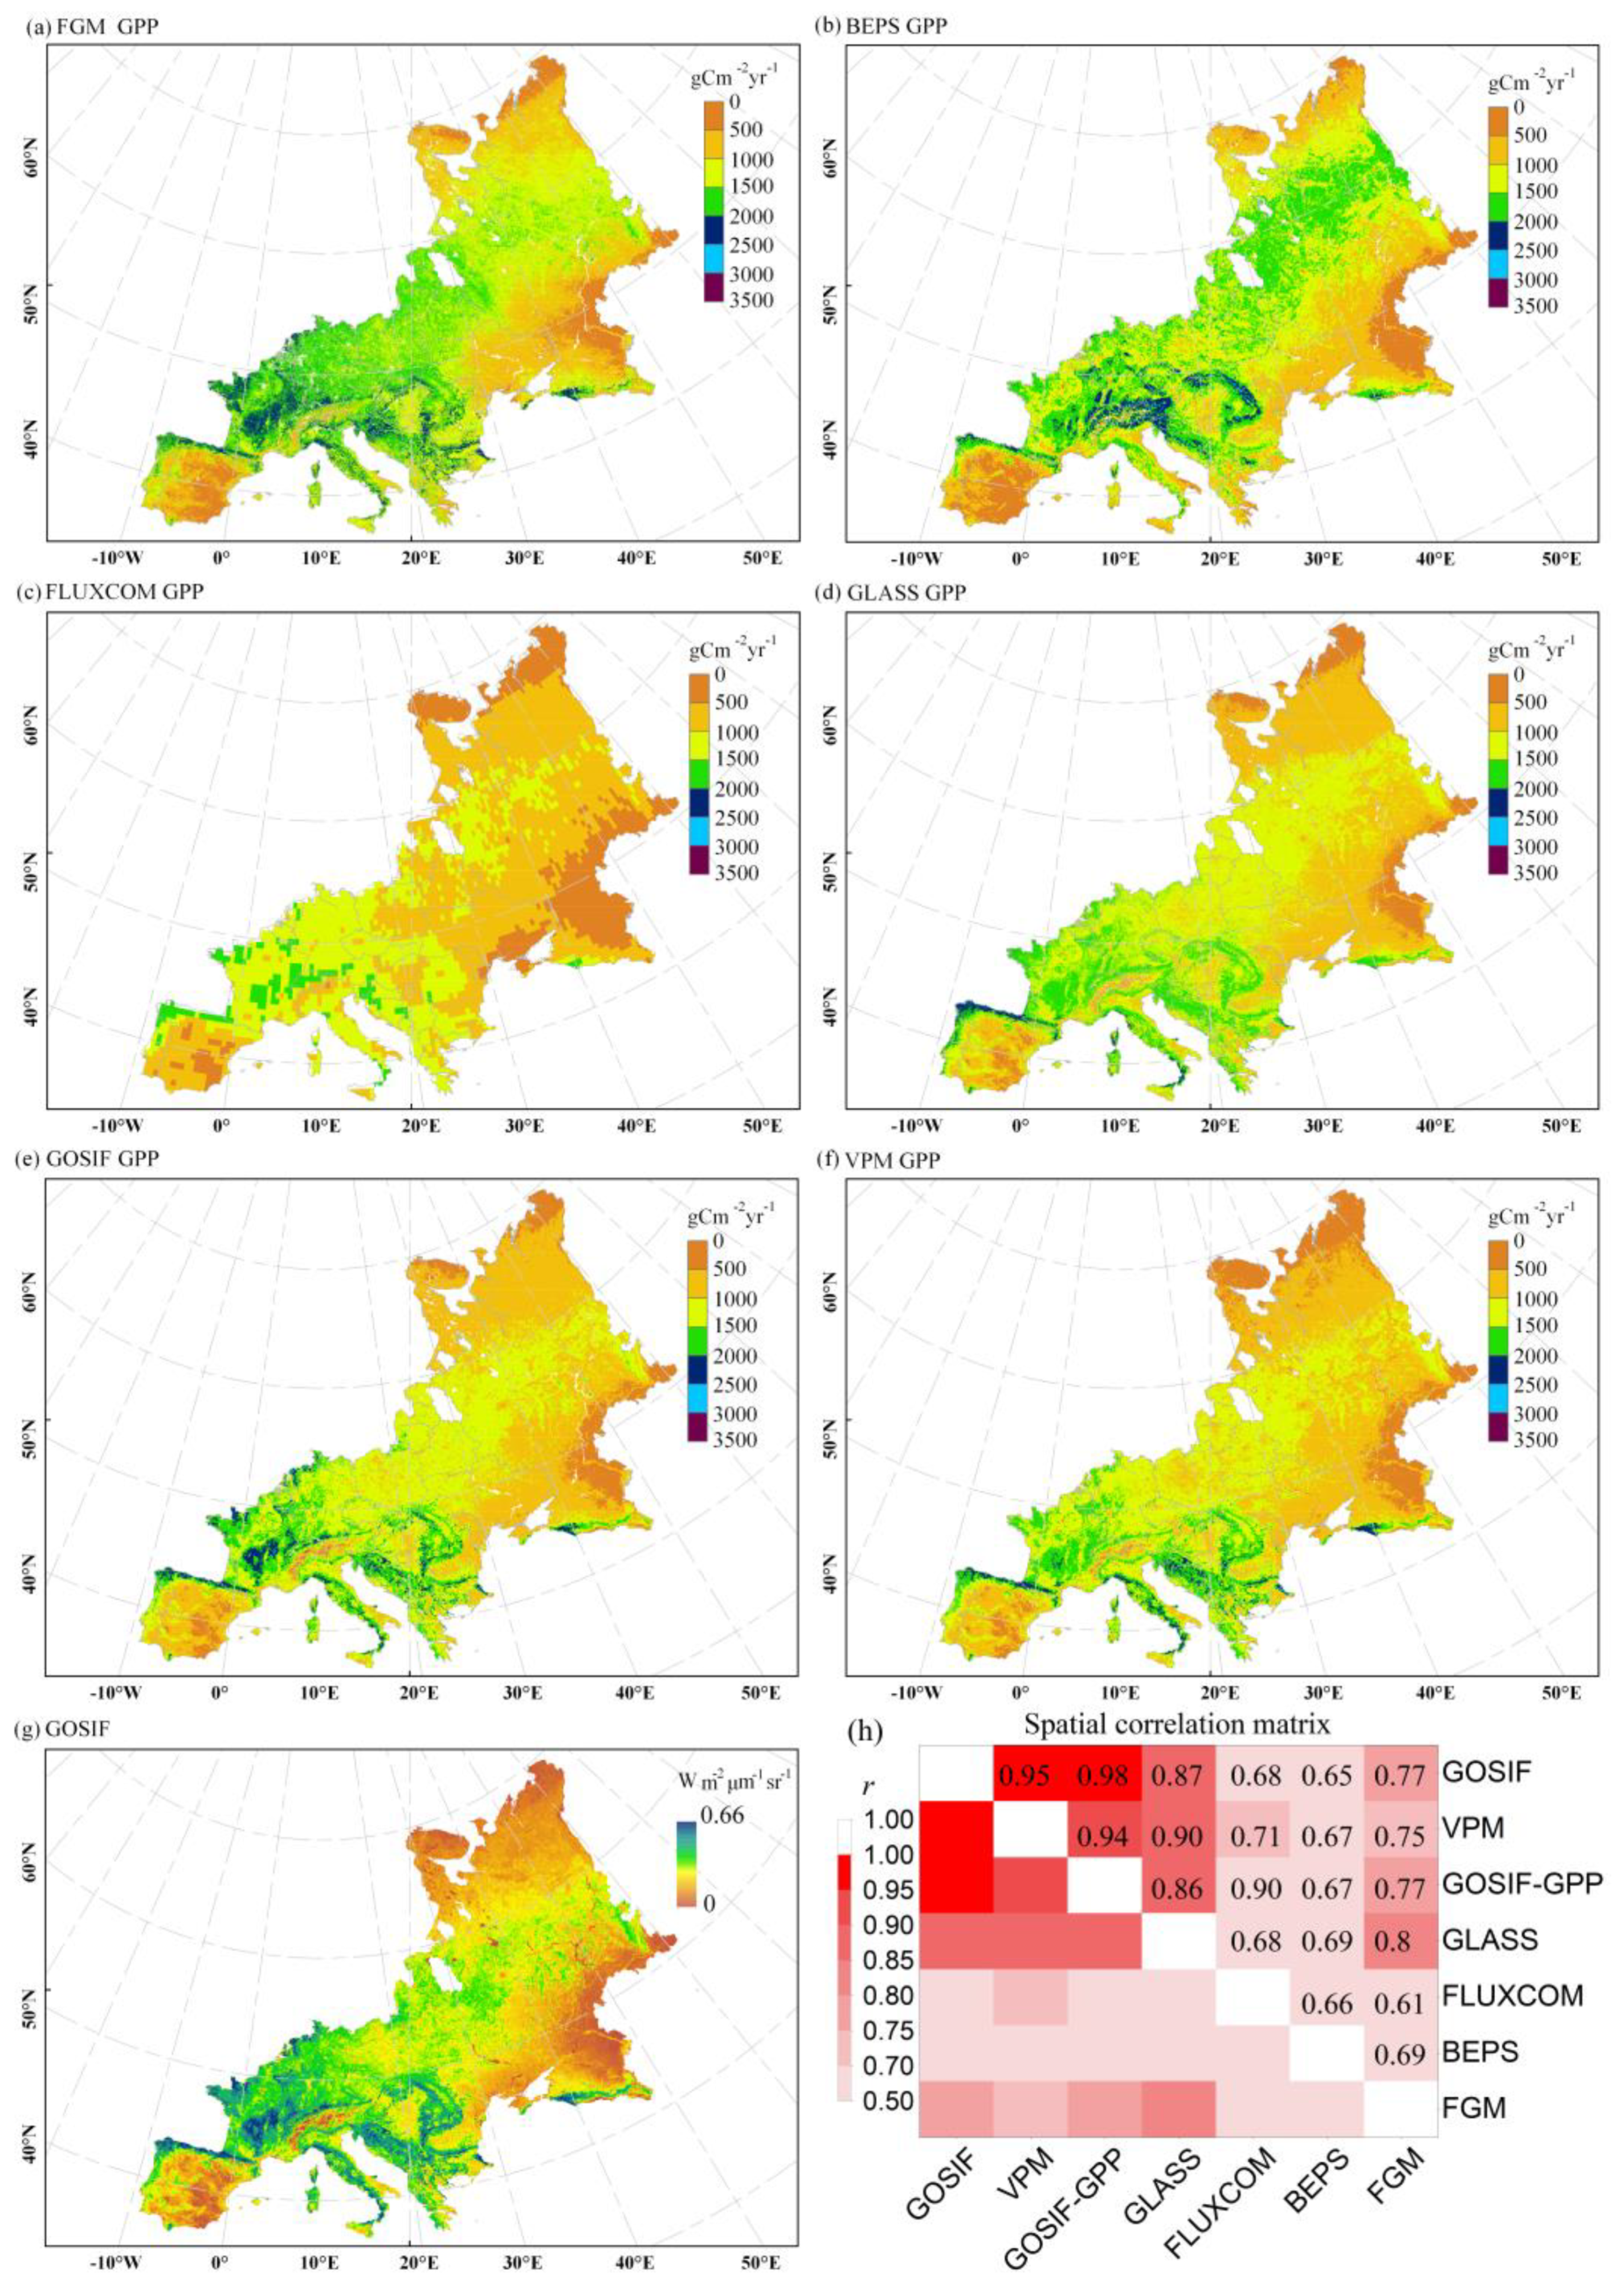
The FGM effectively simulated the general pattern of GPP along the temperature gradient across Europe (Figure 5a). The mean GPP increased from the boreal to temperate regions and decreased from the temperate regions to the Mediterranean regions. The spatial pattern of the annual mean GPP modeled by the FGM was well correlated with that of the other GPP products (r = 0.61–0.8) (Figure 5b–f) and GOSIF data (r = 0.77) (Figure 5g), although there were regional discrepancies in magnitude.
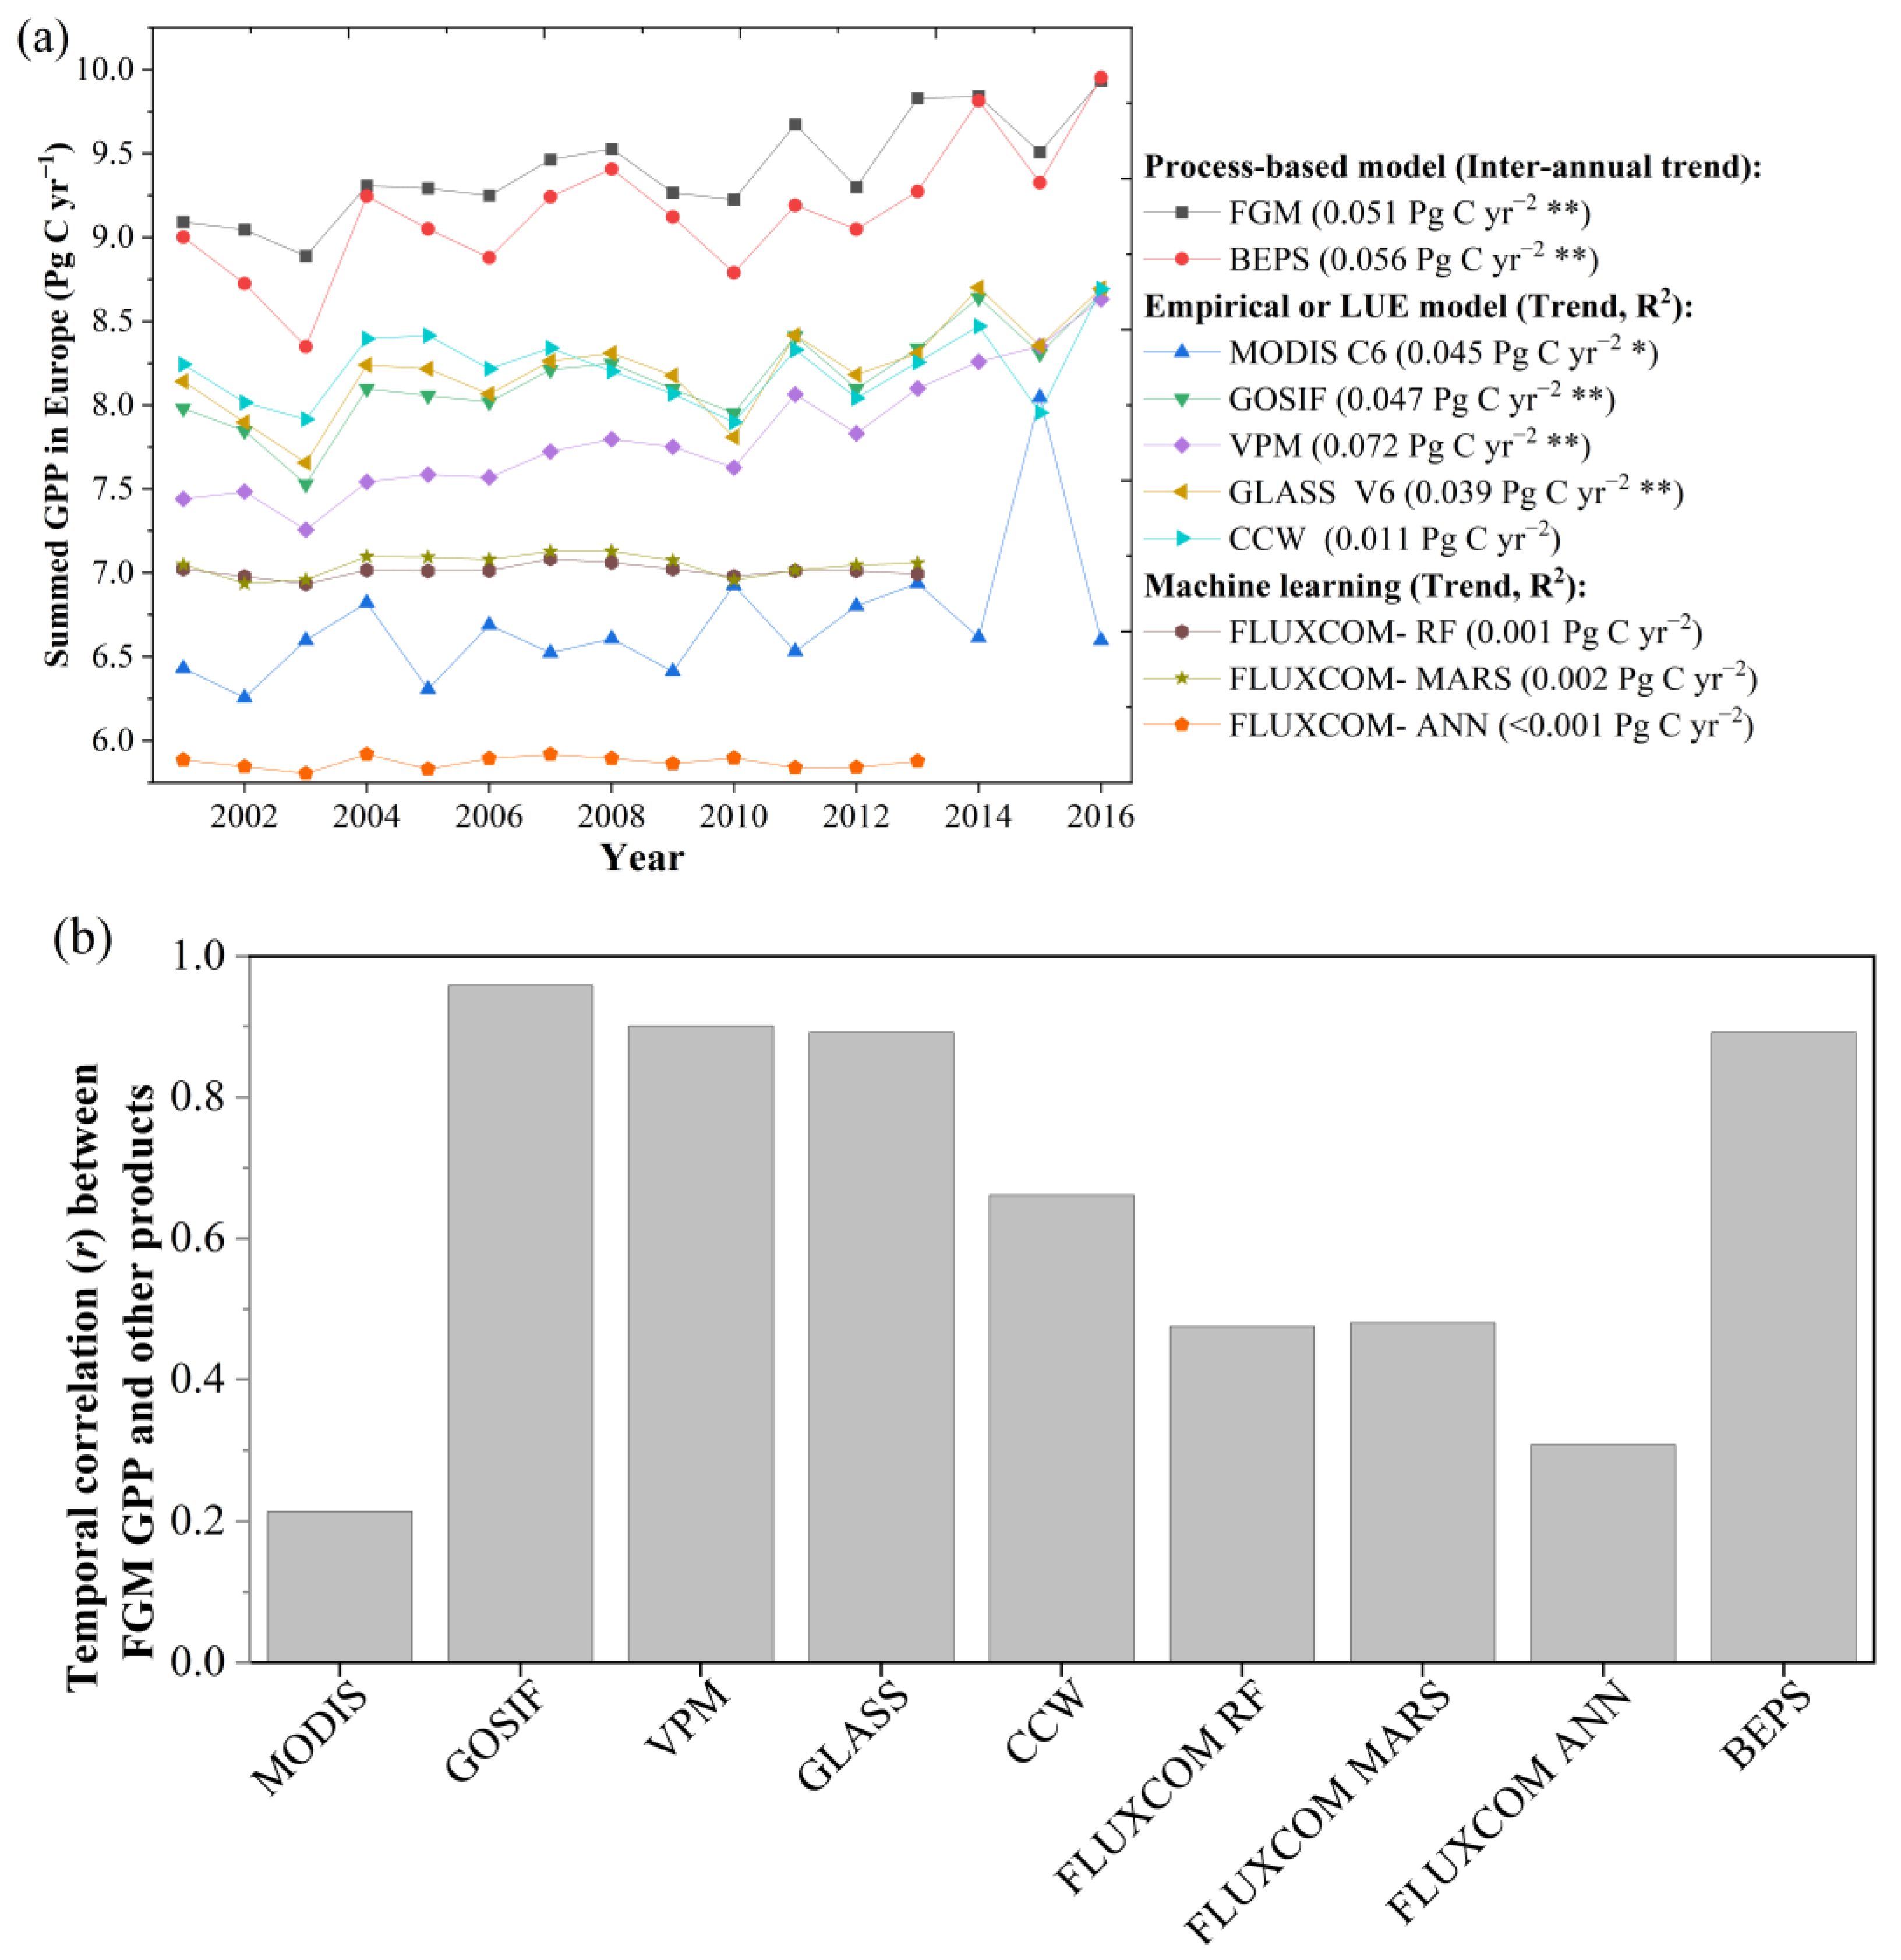
The multiyear mean of the annual GPP of Europe estimated by the FGM (9.4 Pg C yr−1) was reasonable compared with the other GPP products (5.9 to 9.2 Pg C yr−1) (Figure 6a). Moreover, the annual total GPP showed a significant increasing trend from 2001 to 2016 (+0.051 Pg C yr−2, R2 = 0.76, p < 0.01), which was in accordance with the other GPP products (Figure 6a). The annual total GPP across Europe increased from 9.09 Pg C yr−1 in 2001 to 9.94 Pg C yr−1 in 2016. In addition, the interannual dynamics of the FGM GPP correlated well with those of the GOSIF GPP, GLASS GPP, VPM GPP, BEPS GPP, and CCW GPP (Figure 6b). These evaluation results indicated that the FGM GPP was reasonable and could be used to further quantify the Vcmax change effect on GPP.

3.2. Impacts of Vcmax Change on GPP across Europe

3.2.1. Dynamic Vcmax Information Is Important for the Accurate Estimation of GPP Seasonality

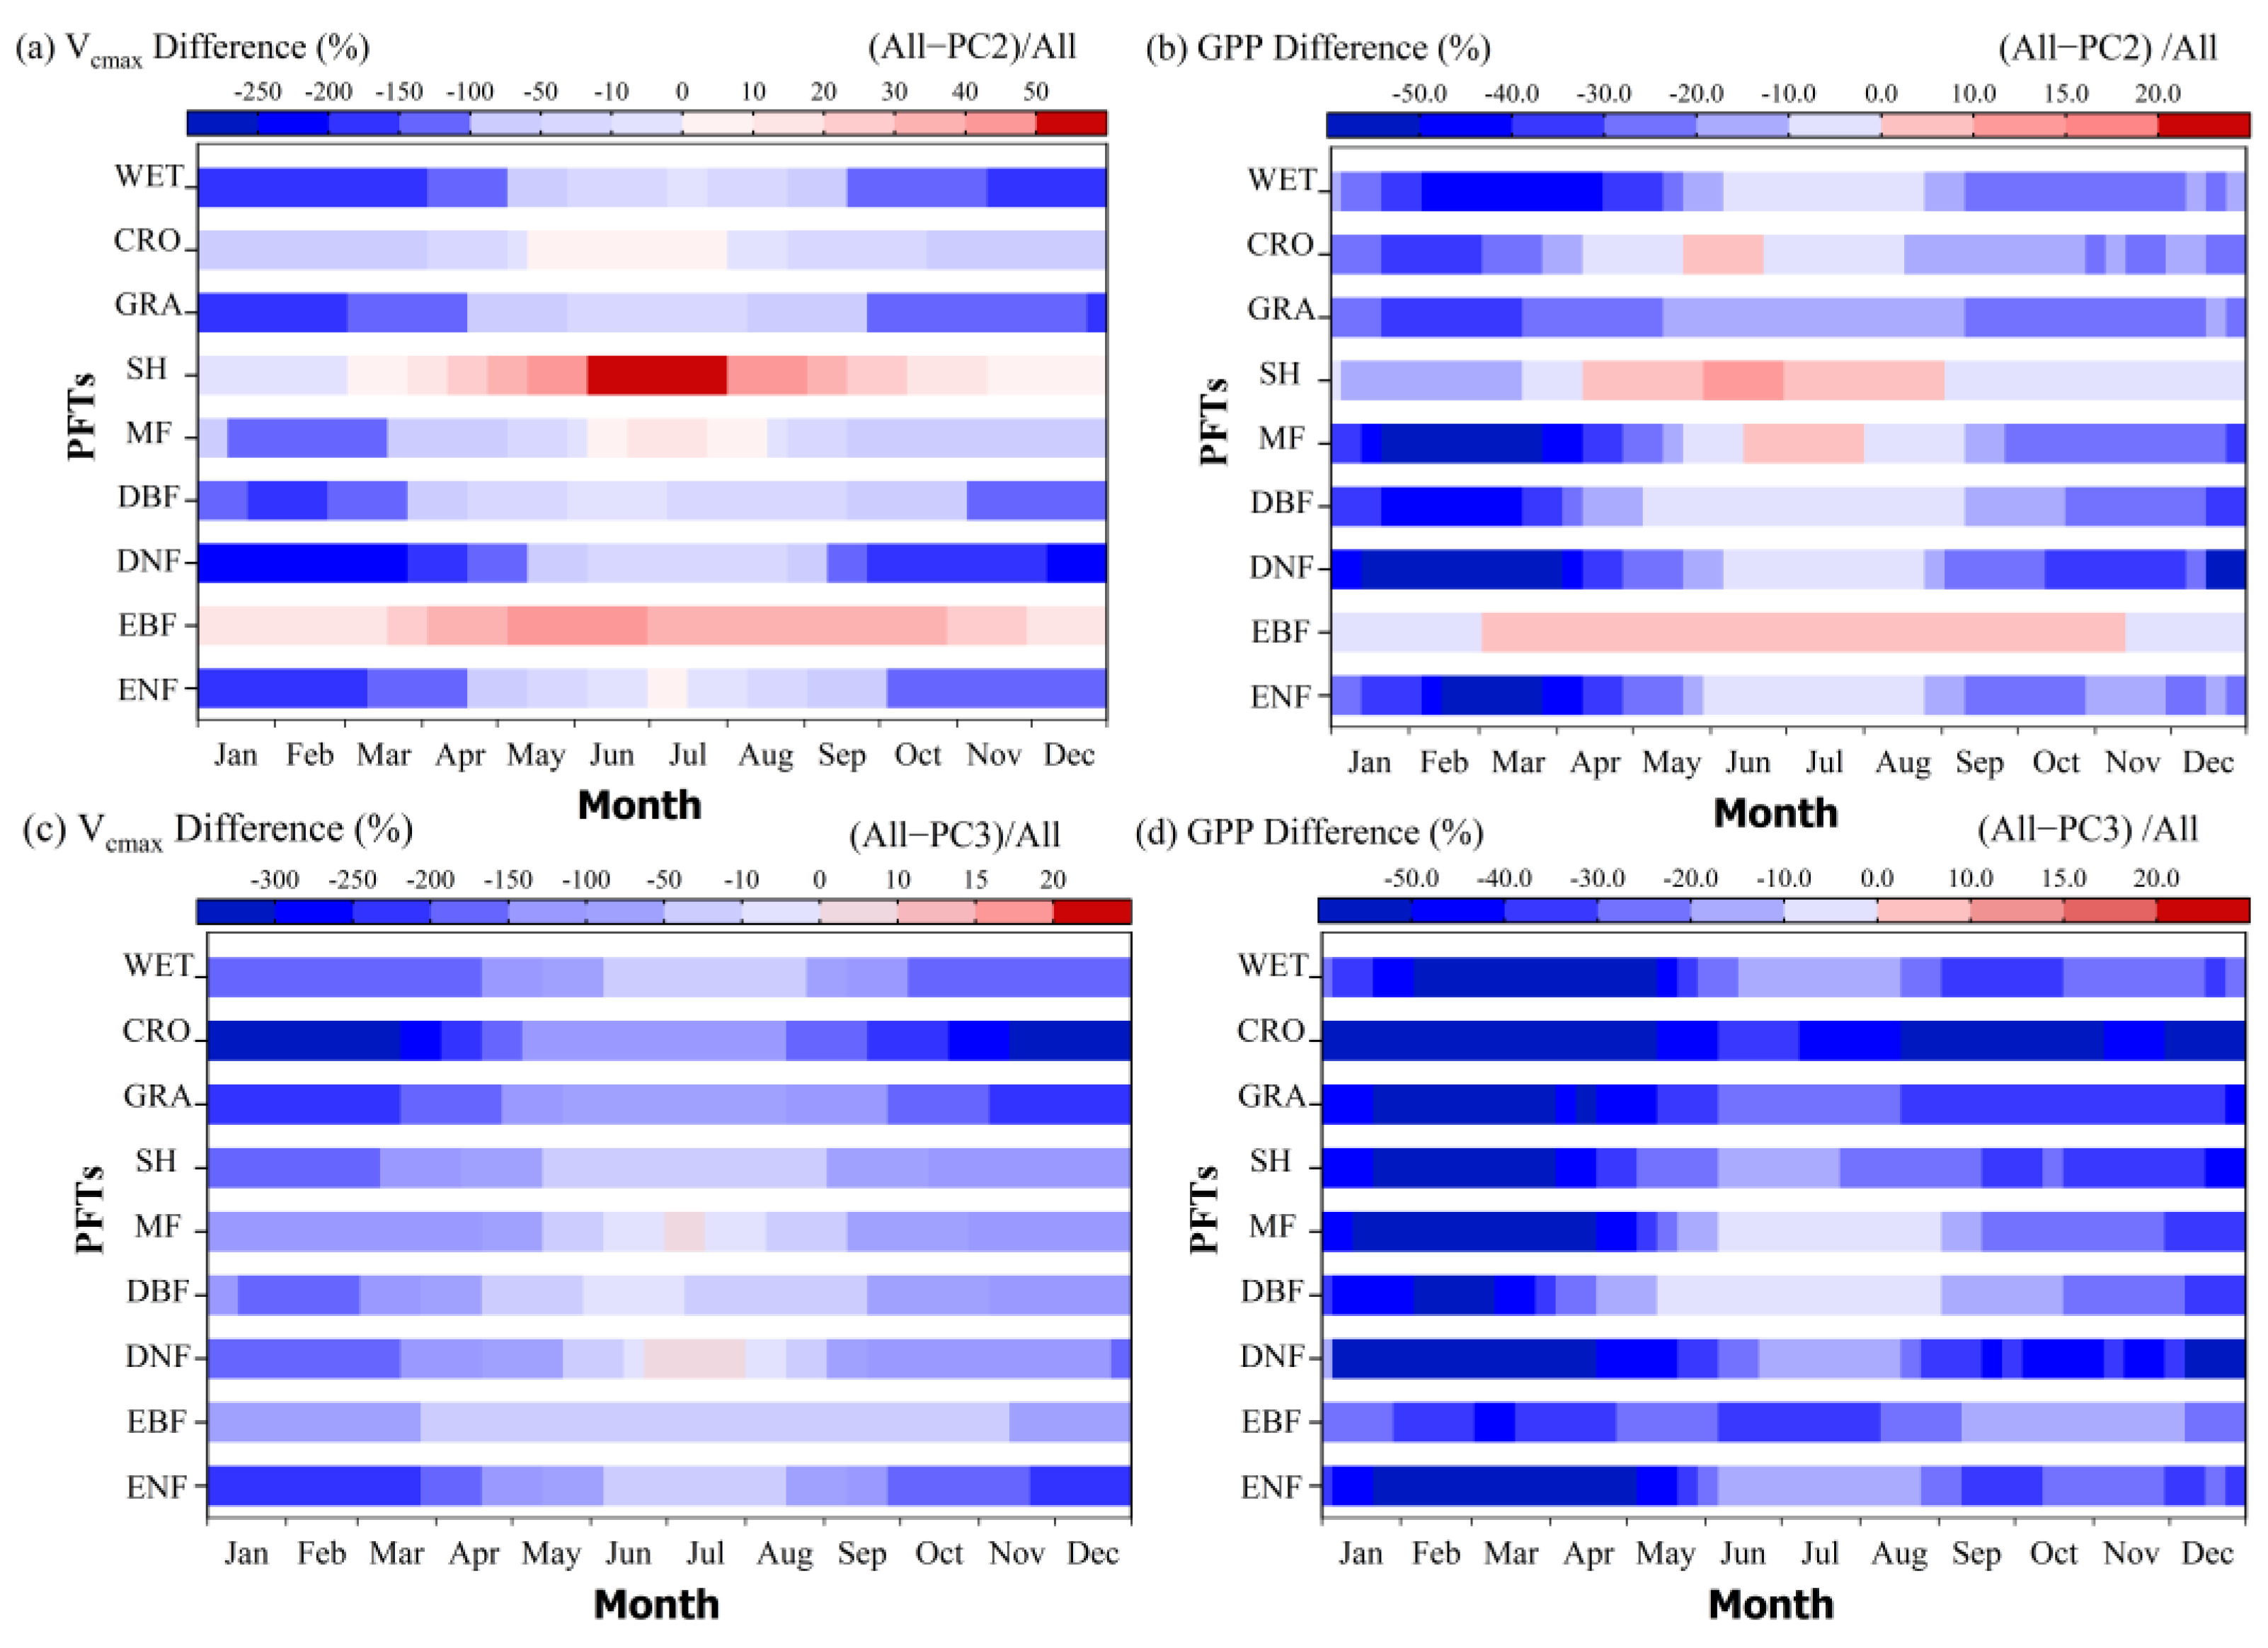
We further evaluated the seasonal variation in Vcmax using three types of Vcmax data: (a) Vcmax derived from the LCC (i.e., LCC-derived Vcmax); (b) Vcmax retrieved by the model calibration method (i.e., Calibrated Vcmax); and (c) Vcmax based on the TRY database (i.e., TRY-based Vcmax) (Figure 7). In comparison with the calibrated Vcmax, the LCC-derived Vcmax showed major differences, without a consistent bias in any one direction. In spring and autumn, the LCC-derived Vcmax reduced the overestimation of Vcmax for most PFTs and reduced the underestimation for EBF; in summer, the LCC-derived Vcmax reduced the overestimation of Vcmax for WET, GRA, DBF, and DNF and the underestimation for CRO, SH, MF, EBF, and ENF. In comparison with the Vcmax from the TRY database, we found that the TRY-based Vcmax was consistently larger than the LCC-derived Vcmax throughout the seasons for all biomes, especially for CRO and GRA. The seasonal pattern of the LCC-derived Vcmax was very similar to those of the LAI and GPP.
Consequently, these differences in Vcmax (Figure 8a,c) led to synchronous changes in the GPP estimated by the FGM (Figure 8b,d). In comparison with the GPP from “PC2” (Figure 8b), in spring and autumn, the inclusion of the LCC-derived Vcmax reduced the overestimation of GPP for all the PFTs, especially for MF, DBF, DNF, and ENF. In summer, the LCC-derived Vcmax reduced the overestimation of GPP for GRA and the underestimation of GPP for CRO, SH, MF, and EBF. In comparison with the GPP from “PC3”, the inclusion of the LCC-derived Vcmax reduced the overestimation of GPP using the TRY-based Vcmax (Figure 8d).

3.2.2. Including Dynamic Vcmax Information Improved the Estimation of the GPP Spatial Pattern

The conventional method of fixing Vcmax using the model calibration method and TRY database overestimated the European GPP by 0.5 Pg C yr−1 (Figure 9a) and 2.9 Pg C yr−1 (Figure 9b), respectively. Compared with “PC2”, using spatiotemporally explicit Vcmax information, the terrestrial ecosystem productivity mainly increased for regions in marine climate zones between 43°N–60°N and 0°E–30°E but decreased for most of the regions in other climate zones (Figure 9c). In contrast, the FGM driven by the TRY-based Vcmax overestimated the GPP for almost all the regions, especially for cropland (Figure 9d). Including dynamic Vcmax information improved the FGM’s performance in simulating the variability in European GPP based on the spatial correlations between the estimated annual GPP and other GPP products or GOSIF data (Figure 9e).

3.2.3. Interannual Changes in Vcmax Only Have a Minor Effect on GPP in a Limited Period of 16 Years

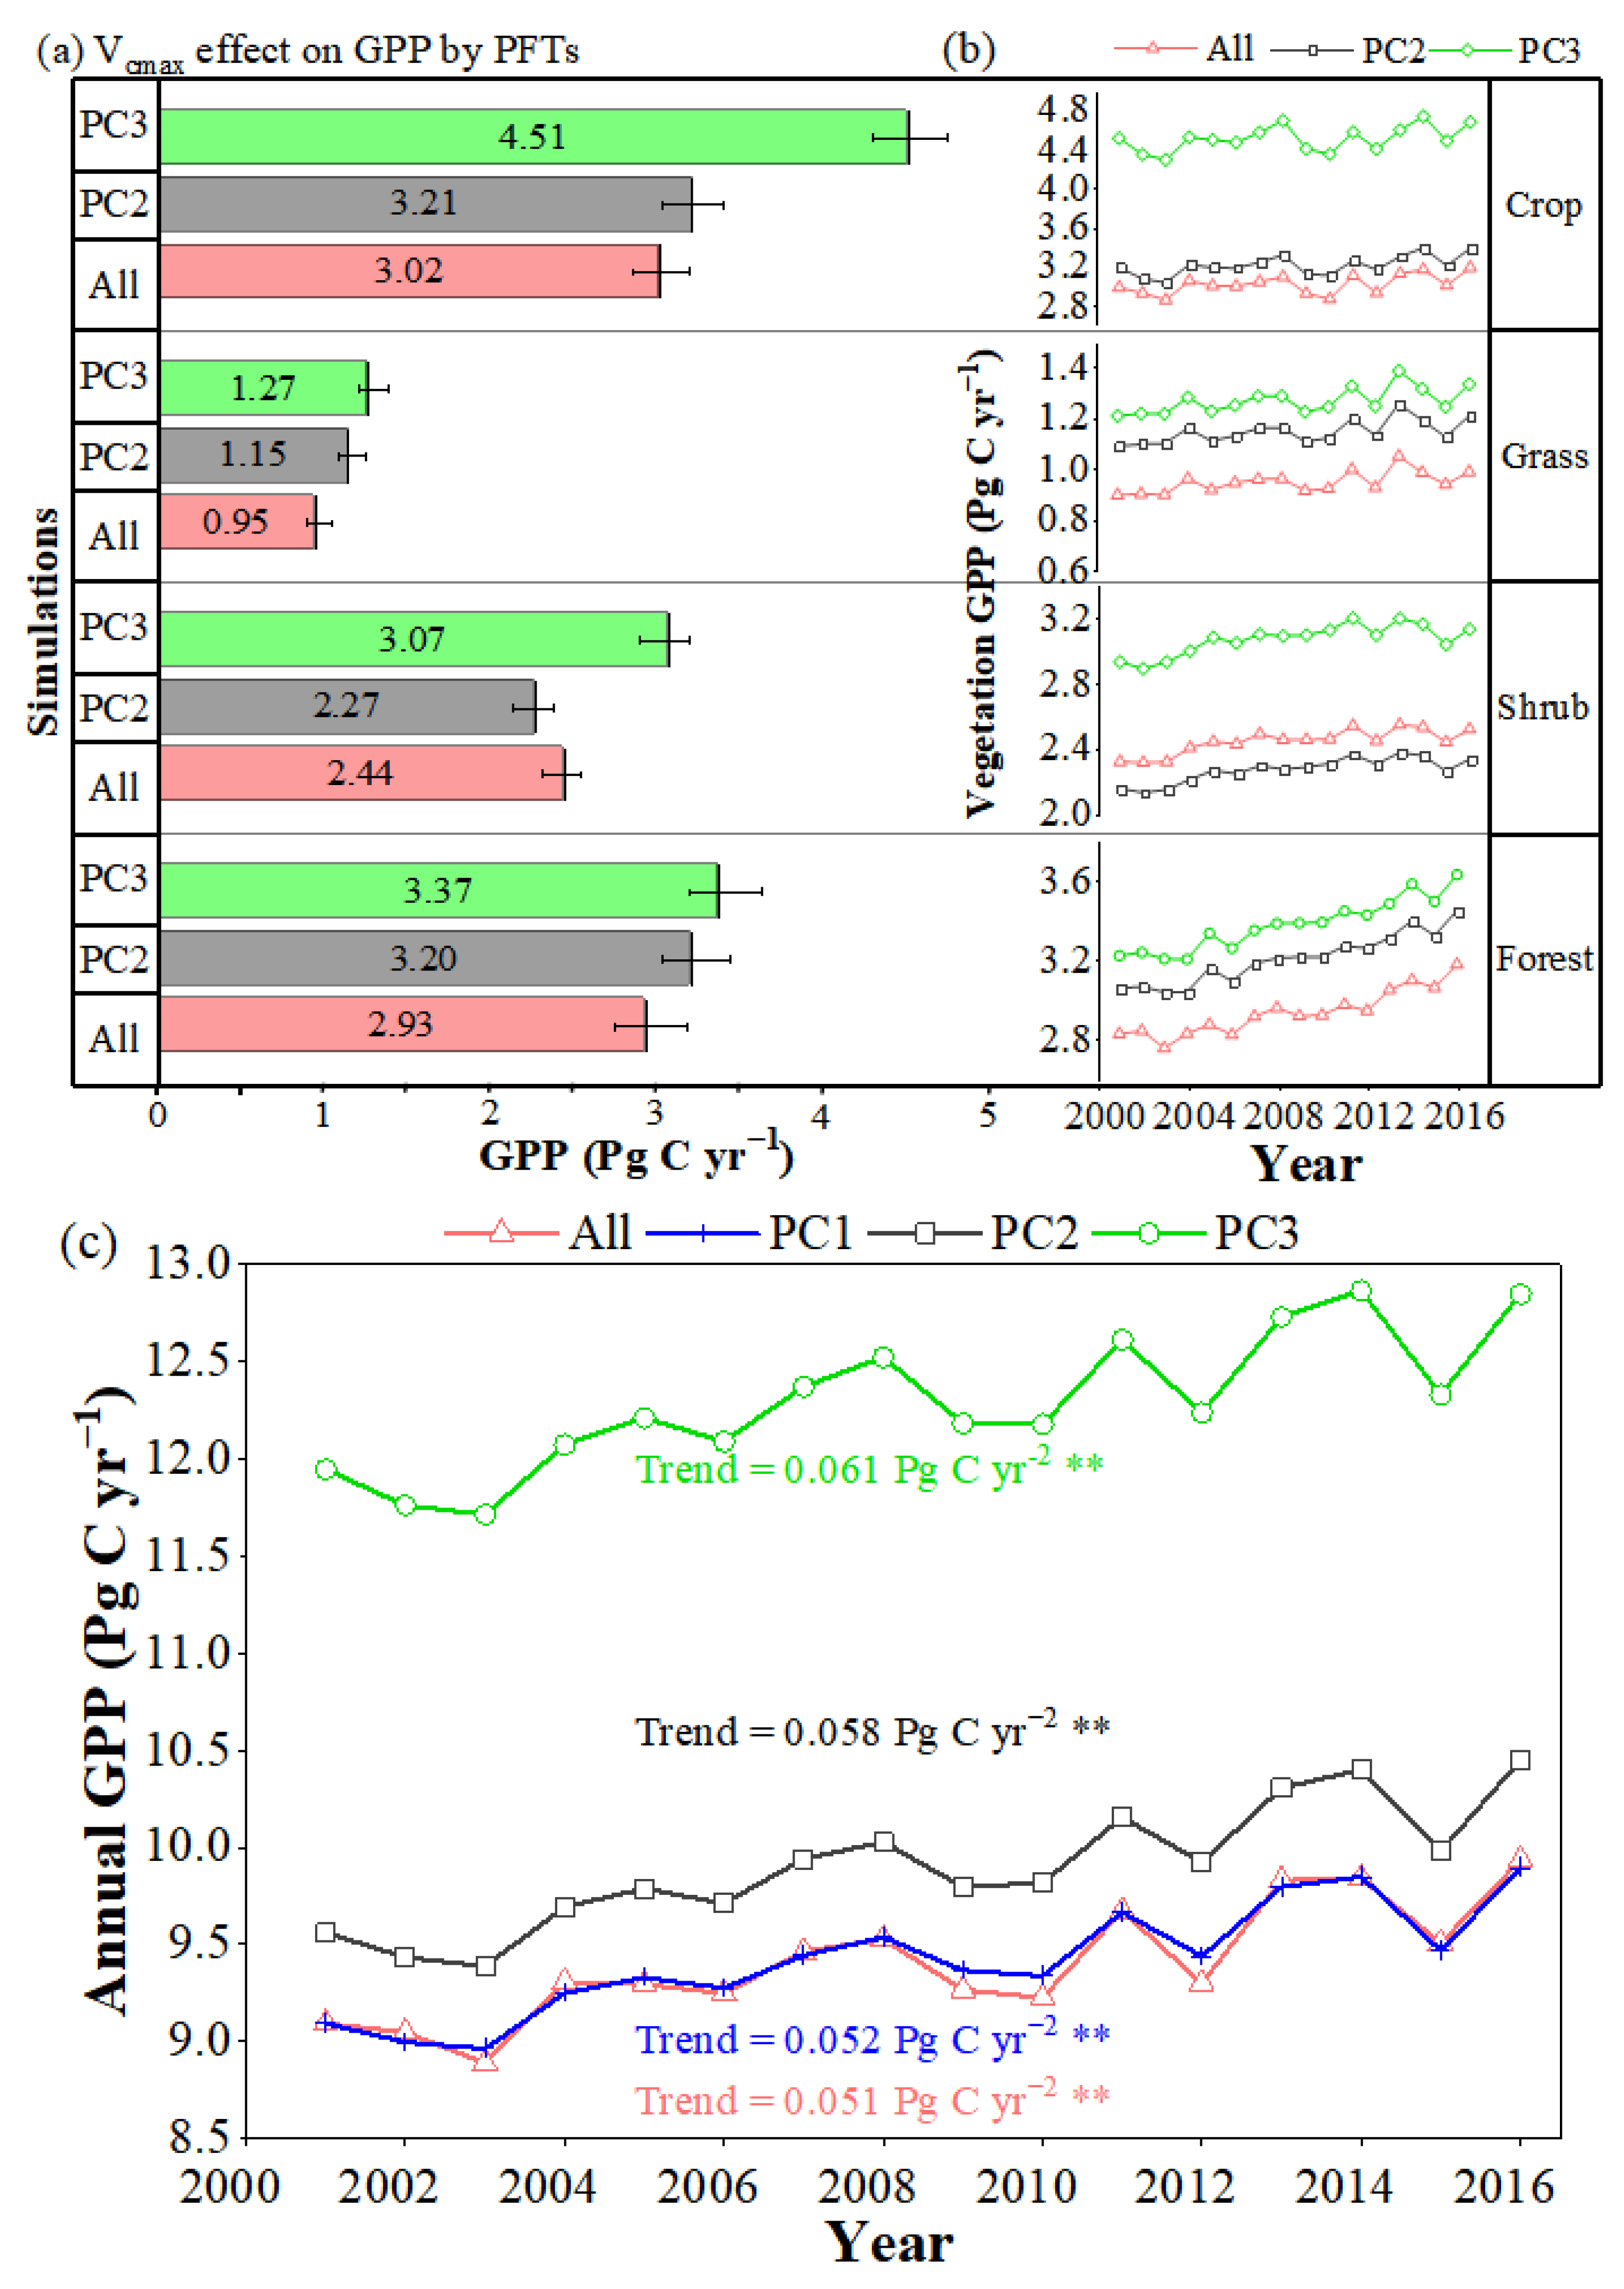
We further evaluated the Vcmax change effect on GPP on annual time scales (Figure 10). Compared with “PC2”, the annual GPP of cropland, grassland, and forests demonstrated reductions of 8%, 21%, and 9%, respectively, with the inclusion of the LCC-derived Vcmax. However, we also noticed a slight 8% increase in the GPP for shrubland. Using the TRY-based Vcmax, the FGM overestimated the annual GPP of cropland, grassland, shrubland, and forests by 49%, 34%, 26%, and 15%, respectively.
European vegetation appeared markedly more productive from 2001 to 2016. However, if we fixed Vcmax in the FGM using the calibrated Vcmax or TRY-based Vcmax, both the magnitude of and the rate of increase in GPP were overestimated (Figure 10c). Compared with “All”, “PC2” and “PC3” overestimated the annual increasing GPP trend by 14% and 20%, respectively. The magnitude and interannual dynamics of GPP simulated by the FGM for “PC1” (9.42 Pg C yr−1) were close to that for “All” (9.40 Pg C yr−1). In contrast, the annual GPPs for “PC2” (9.90 Pg C yr−1) and “PC3” (12.30 Pg C yr−1) were significantly higher than that for “All”. Thus, the inclusion of spatial and seasonal variations in Vcmax improved the GPP estimation, while interannual changes in Vcmax contributed little to the GPP in the limited study period of sixteen years.

4. Discussion

4.1. Effects of Vcmax Change on GPP Estimation

Many studies have demonstrated that Vcmax changes across both space and time. Leaf chlorophyll abundance is closely linked to photosynthesis capacity [56,59,123]. The Vcmax derived from the LCC (i.e., LCC-derived Vcmax) showed strong seasonality and significant spatial variation across Europe (Figure S3a) but only slight interannual variation over the limited study period of 16 years (Figure S3b). A comparison with the EC-GPP and other GPP or SIF products supported our hypothesis: the consideration of spatiotemporal changes in Vcmax provided more reliable GPP estimations for Europe. Compared with the GPP estimations obtained by fixing the Vcmax using the TRY database, the inclusion of temporally and spatially explicit Vcmax using the satellite-derived LCC product reduced the bias in the estimated daily GPP (Figure 2) and increased the spatial consistency between the FGM GPP and other GPP products or GOSIF data (Figure 9).
The positive impact of the LCC on GPP simulations on the site level in Europe that found in our study is comparable with the results of previous studies on single sites (with R2 enhanced by 10–12% and RMSE decreased by 24–32%) [124,125] or across multiple sites with different PFTs (with R2 enhanced by 9–22% and RMSE decreased by 15–32%) [123]. In this study, we found a 23% increase in R2 and a 25% decrease in RMSE (Figure 2) between the modeled GPP and EC-GPP for 19 EuroFLUX sites across 9 PFTs using the LCC-derived Vcmax to estimate GPP. On the regional scale, we found a 17% decrease in the annual GPP across the 19 EuroFLUX sites and a 24% decrease in the annual GPP for Europe. The maximum leaf photosynthesis capacity is known to change with the seasons under the influences of multiple factors, such as leaf development [53], changes in climatic variables [126], and drought conditions [127]. In this study, we found a higher Vcmax during summer than in spring and autumn (Figure 7). However, the Vcmax field measurements were generally collected close to the peak growing seasons. Thus, assuming a constant Vcmax based on the TRY database led to the overestimation of Vcmax in spring and autumn, which further resulted in an overestimation of GPP. The overestimation of the TRY-based GPP was in agreement with previous findings observed on a global scale. However, Luo et al. (2019) found only a 7% decrease in the annual GPP across 124 sites and a 7% decrease in the global GPP [123], which is much lower than the regional Vcmax change effect on GPP across Europe (17–24%).
While the Vcmax across Europe showed a small (but not significant) increasing trend from 2001 to 2016 (Figure S5), we found that including the interannual changes in Vcmax had only a minor impact on the interannual GPP change trend for the limited study period of 16 years (Figure 10). However, we could not neglect the interannual changes in Vcmax, since plants may continue to acclimate their leaf chemistry and photosynthesis capacity in response to climate change, especially in response to continued global warming and elevated CO2 concentrations [128]. According to optimality theory, rising CO2 and warming can reduce the global canopy demand for Rubisco and result in reductions in Vcmax in the long term [129]. In contrast, we found that the LCC-derived Vcmax showed an increasing trend (that was not statistically significant) across Europe (Figure S3), which is also revealed by the Vcmax estimated from SIF data [51,57]. Plants in high arctic regions are sensitive to changes in temperature [130]. During the study period, the interannual mean air temperature in Europe showed a significant increasing trend (+0.029 °C yr−1, R2 = 0.55, p = 0.01) (Figure S4b). However, we also observed enhanced VPD and water stress caused by global warming in Europe (Figure S4c). Plants may adapt to combined changes in different environmental factors, such as radiation brightening, warming temperatures, and enhanced VPD (Figure S4), by increasing their Vcmax to match the light-limited rate of photosynthesis and optimize carbon fixation [49,131,132].

4.2. Comparison with other GPP Products

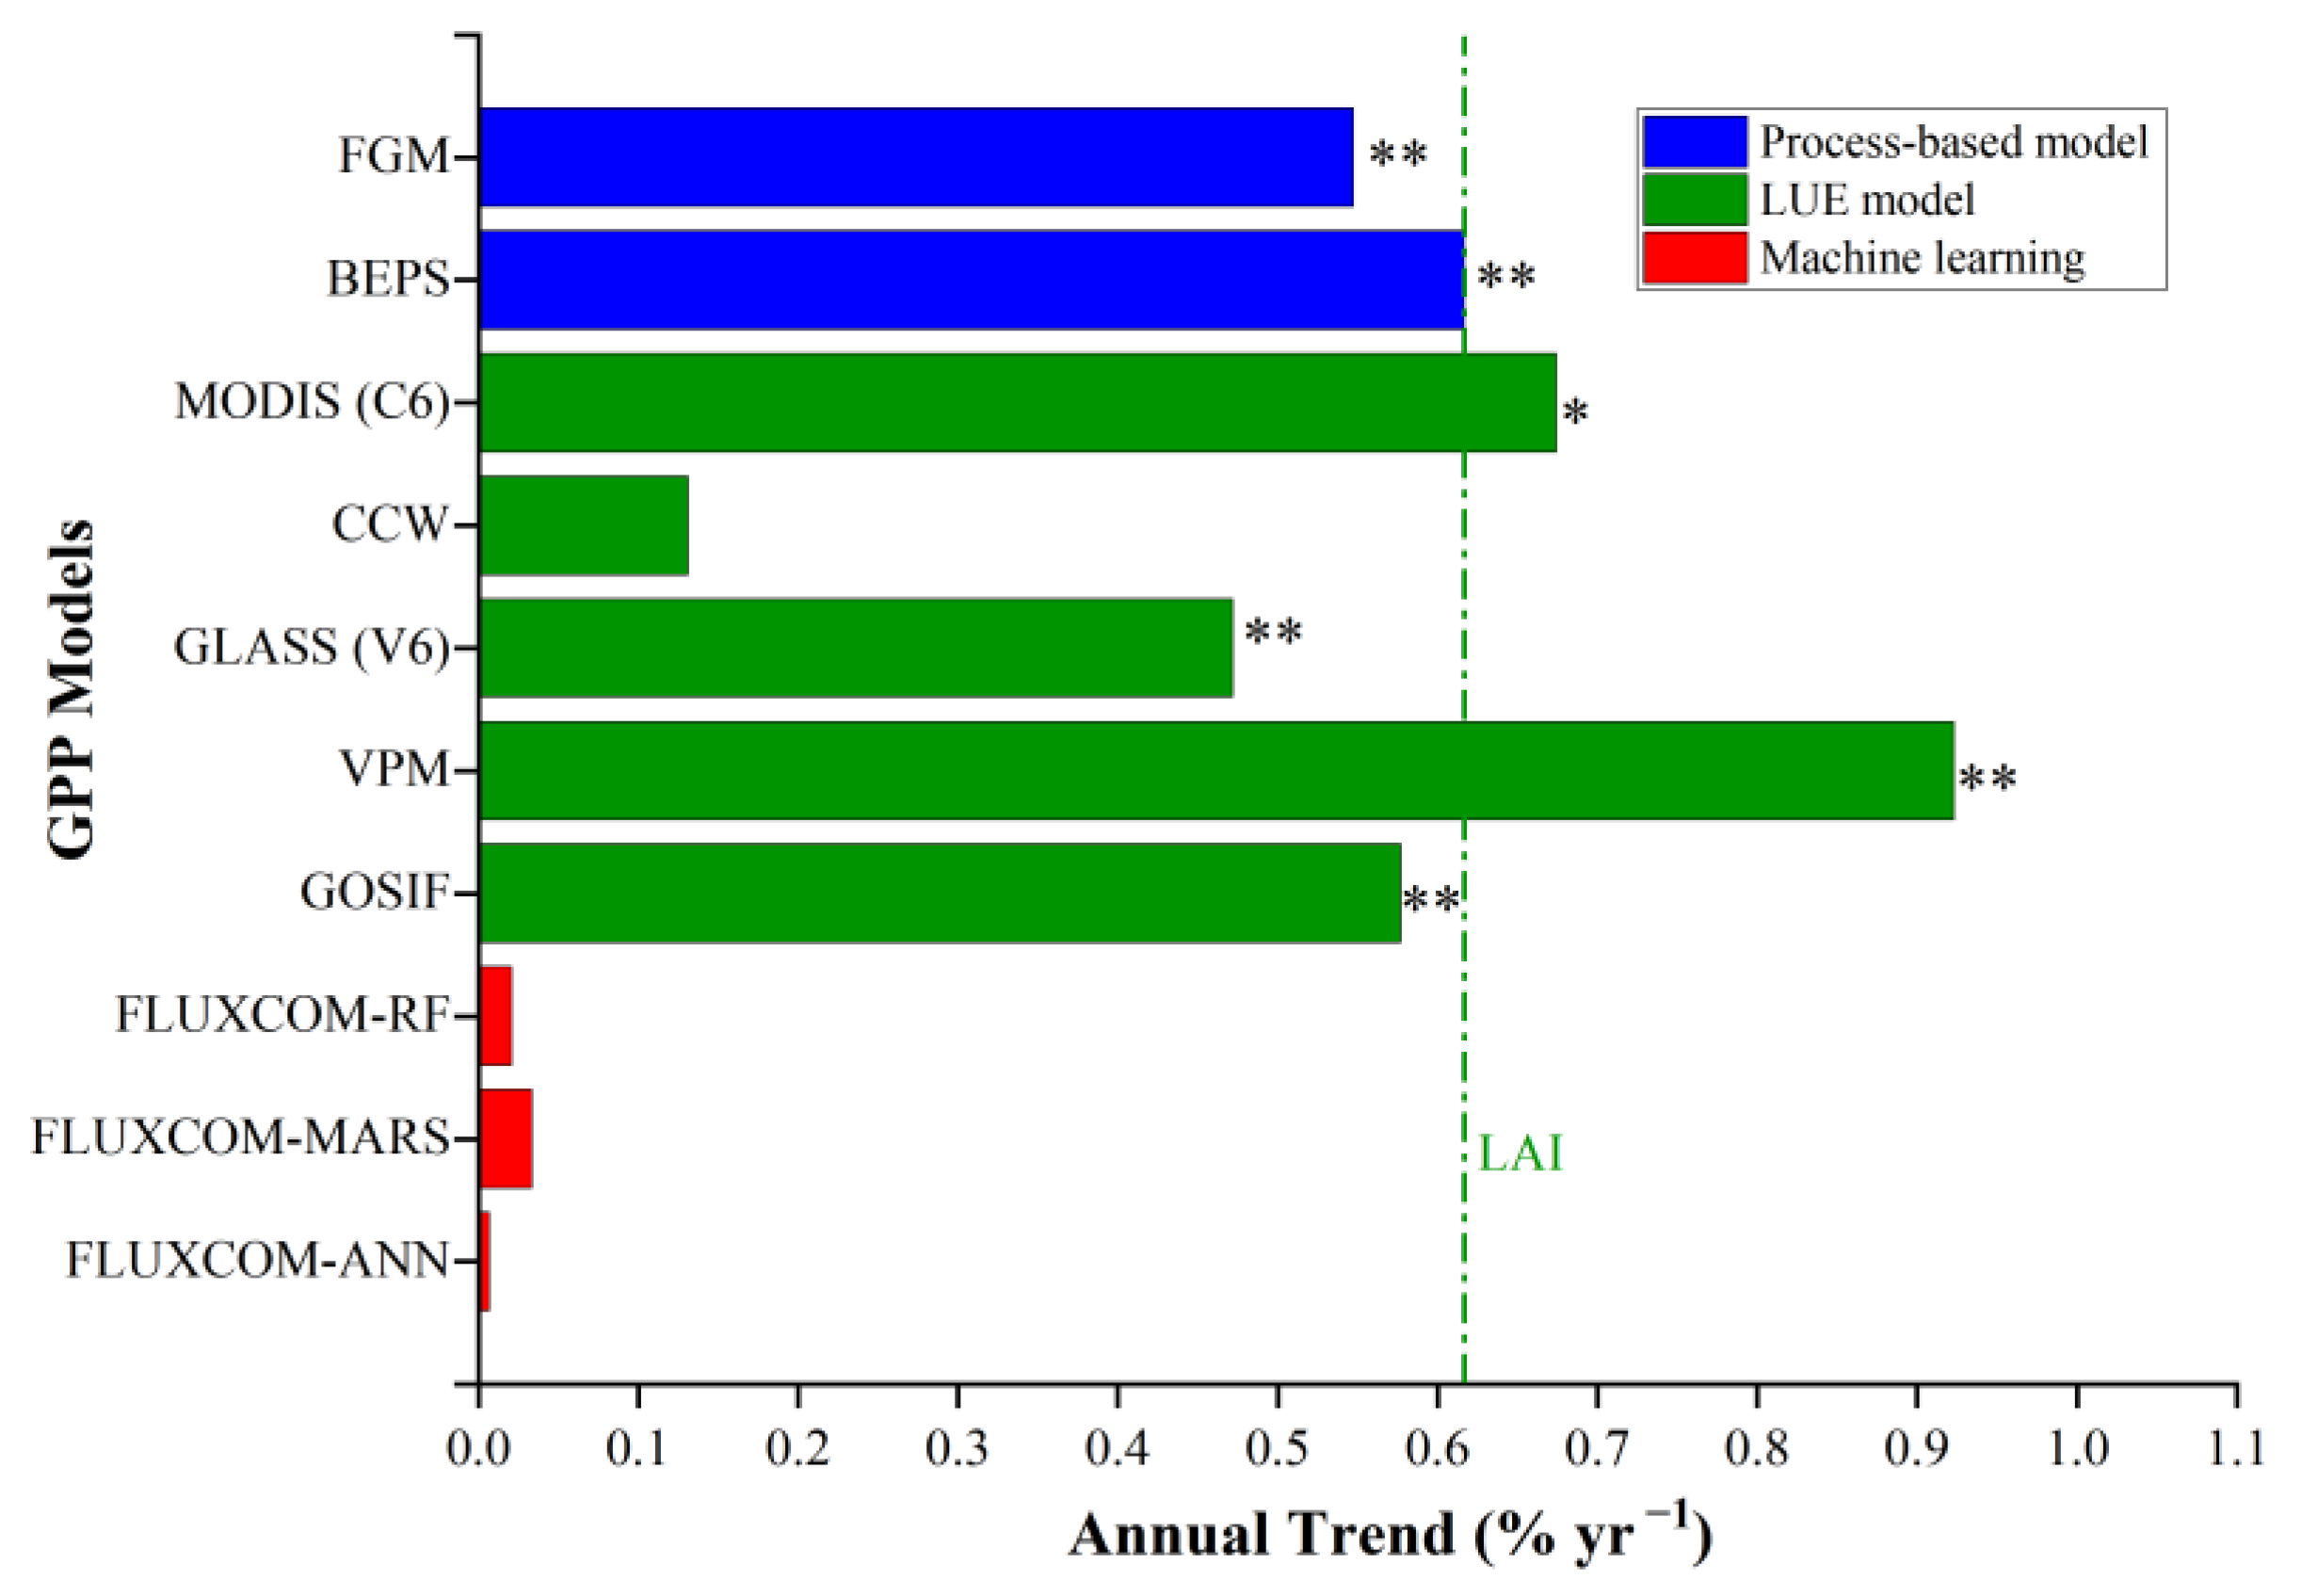
The increasing interannual trend in the GPP predicted by the FGM (+0.55% yr−1) was in the range of that estimated using other GPP products (+0.47% yr−1 to +0.92% yr−1) (Figure 6). From 2001 to 2016, terrestrial ecosystem productivity showed a significant increasing trend (p < 0.01) in Europe according to five previous GPP products (i.e., BEPS, MODIS, GLASS, GOSIF, and VPM) (Figure 6). The annual total GPP across Europe from 2001 to 2016 predicted by the VPM [116] showed an increasing trend of +0.92% yr−1, which is almost double the predictions of the FGM (Figure 6). Other studies reported that the increasing GPP trend detected by the VPM may be an overestimate [2], since the VPM is not strictly calibrated using field observations at FLUXNET sites [116]. In contrast, the CCW GPP products failed to detect the increasing GPP trend across Europe while successfully capturing the increasing trend of GPP on the global scale [2]. In the case of LUE models, the model parameters, especially those related to the fraction of photosynthetically active radiation (FPAR) and LUE, may have uncertainties and lead to errors in model estimations. Previous studies that estimated GPP dynamics were based mainly on LUE models and process-based models and, in most cases, did not include the spatial and temporal dynamics of Vcmax [51]. These models are unlikely to produce reliable simulations of photosynthesis–climate interactions at a fine temporal resolution or on a large scale.
Prior studies highlighted continuous increases in global terrestrial production during the last two to three decades based on remote sensing data [2,133]. In particular, enhanced GPP mainly occurs in the boreal and temperate regions, where widespread greening and climate warming occur [130]. In this study, we also found that European vegetation showed a significant ‘greening’ trend (i.e., increases in the LAI) from 2001 to 2016 (+0.62% yr−1). In addition, we further found that the GPP increasing trend throughout the European terrestrial ecosystem estimated by the FGM (+0.55% yr−1) was proportional to the greening rate detected by the LAI and other GPP products (0.47–0.67% yr−1) (Figure 11). With the help of spatially and temporally continuous Vcmax maps, we can expect that process-based models will help us to better understand the driving forces of enhanced carbon assimilation in Europe. However, determining how land surface greening, climate change, and other factors contribute to the increase in GPP observed across Europe is beyond the scope of this study and warrants further investigation.

4.3. Uncertainties in Vcmax Data and Implications for Photosynthesis Simulations

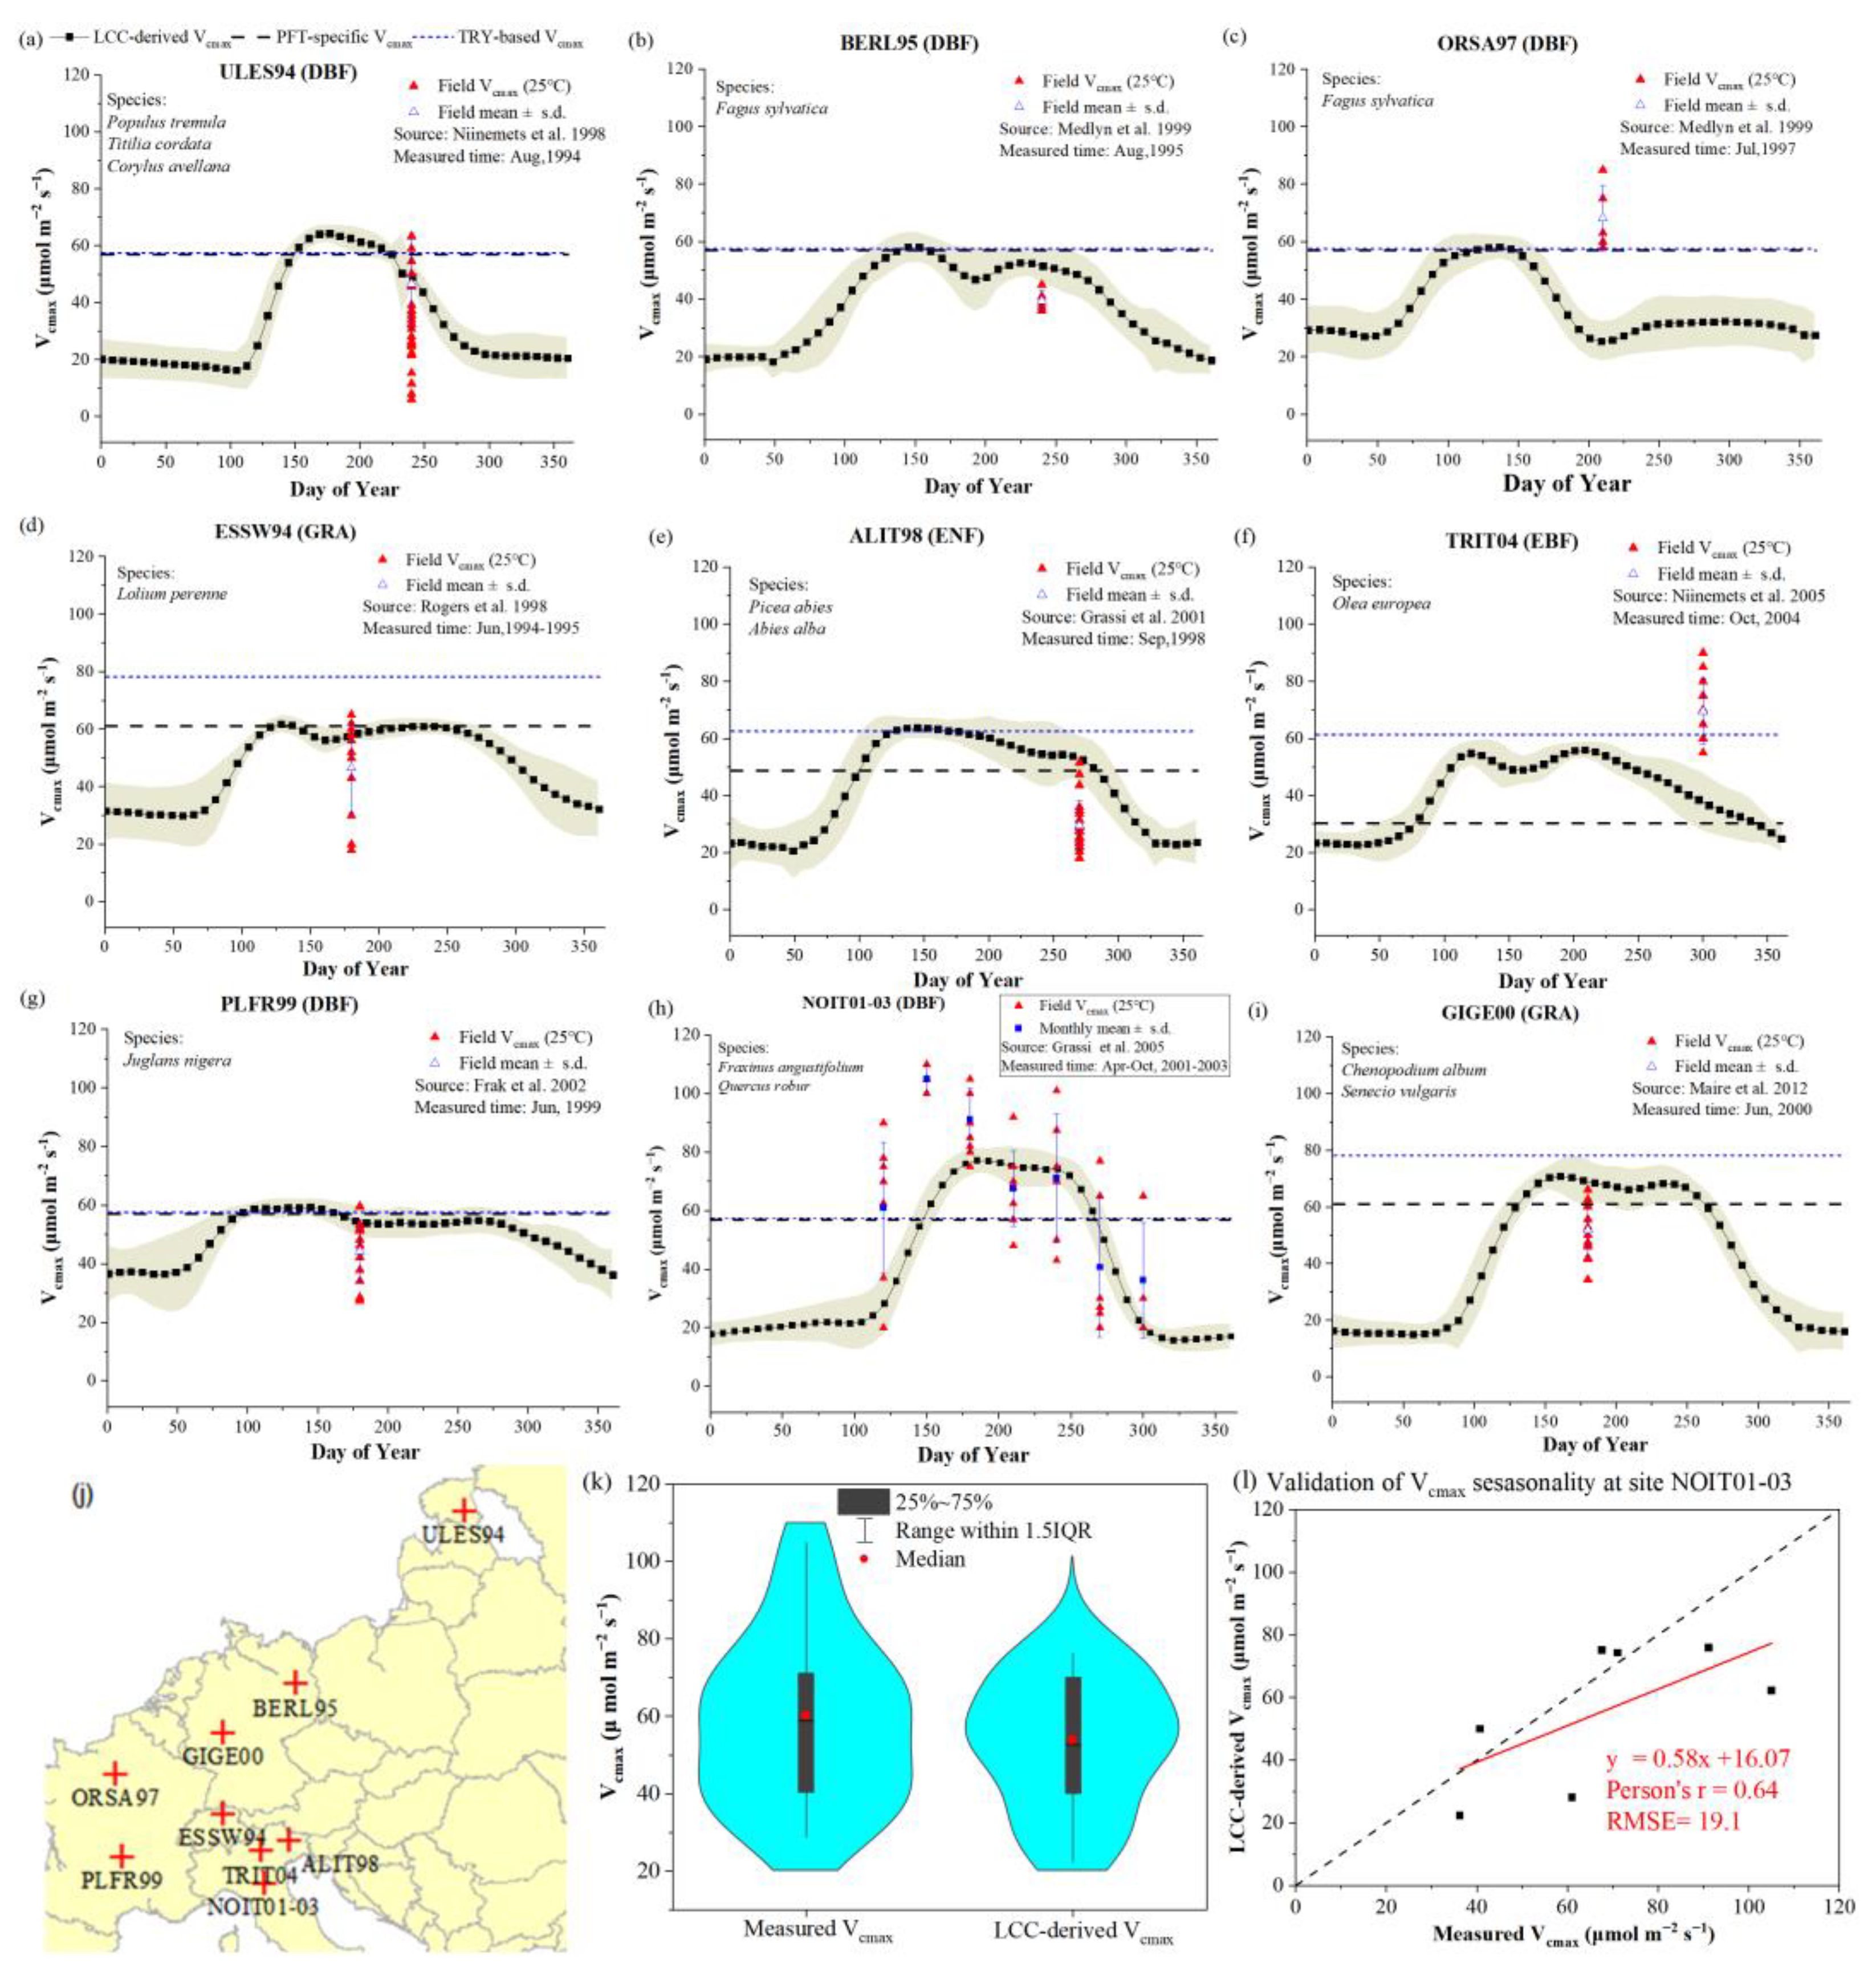
To examine the accuracy of the LCC-based Vcmax products used in this study, we first built an observational dataset of Vcmax by compiling field measurements collected at nine sites covering four PFTs (i.e., DBF, EBF, ENF, and GRA) across Europe (Figure 12) [127,134,135,136,137,138,139,140,141]. Then, we compared the mean Vcmax seasonality derived from the LCC, PFT-specific Vcmax, and field measurements of Vcmax for these sites (Figure 12a–i). The distribution of the monthly mean value of Vcmax measurements across the different sites was comparable to that of the corresponding Vcmax derived from the LCC (Figure 12k). The monthly averaged Vcmax values for site NOIT0-03, derived from the LCC, were well correlated with the field data collected (r = 0.64) during the growing season (i.e., from April to October) (Figure 12l). When we calibrated the Vcmax according to the PFTs, the FGM overestimated the Vcmax during spring, autumn, and winter at most sites, the same result as that which we obtained for the whole study area. It is worth noting that the Vcmax used in this study represents the maximum carboxylation rate at a standardized temperature of 25 °C (i.e., Vcmax25), which is a proxy for the Rubisco content rather than a realized rate at ambient temperatures. Thus, here, we observed larger Vcmax values (Figure S3a) than the Vcmax rates at the average growing season temperature reported in other studies [142].
Recently, several global-scale Vcmax products of different spatial and temporal resolutions have been distributed [51,57,58] with contrasting patterns. Large uncertainties still exist regarding the current Vcmax products, especially in terms of the temporal variations during the growing season [53]. Because a limited quantity of field-measured Vcmax data are available for validation, remote sensing Vcmax products have not yet been fully tested. Although efforts have been made to predict Vcmax on the global scale using remote sensing data [55,57,58,131,143], the mechanisms driving the spatiotemporal variability in plant photosynthetic production (e.g., environmental acclimation, leaf age effect) are still ongoing [53,54,139].
We found that the seasonal pattern of the LCC-derived Vcmax was very similar to that of the LAI. Thus, an alternative strategy for the LCC-based Vcmax is to use a PFT-specific Vcmax and scale it according to the LAI seasonality. This LAI-based Vcmax scaling approach was used for some models (e.g., BESS) [33,144] and could result in a robust performance, at least regarding the seasonality aspect. The Vcmax change effect on the GPP investigated here highlights the need for detailed studies using multi-source Vcmax datasets on different scales (e.g., site-level field measurements and large-scale remote sensing retrievals).
Although we improved European GPP estimations by including the spatiotemporal dynamics of Vcmax, there are still some uncertainties regarding the GPP estimated by the FGM. Uncertainties regarding the input parameter datasets are one possible source. Another possible limitation is that the algorithm of the FGM, as presented here, does not use precipitation or soil moisture data directly and implements only VPD, which is partly related to soil moisture. We assumed that VPD would be able to replace soil moisture for the assessment of the influence of drought on GPP. This is an example of how a future model could be improved.

5. Conclusions

In this study, by including the spatial and temporal variations in the maximum photosynthetic capacity rate (i.e., Vcmax) derived from the leaf chlorophyll metric using a remote-sensing-driven process-based model (i.e., FGM), we improved the estimation of the European GPP dynamics from 2001 to 2016 at 8-day time intervals and a 500 m spatial resolution. Compared with the traditional method of fixing the Vcmax as a PFT-specific constant using the empirical parameterization method, we obtained an improved model performance by modeling GPP considering the spatial and temporal variations in Vcmax. The FGM predictions revealed a greening and more productive Europe, consistent with the existing global-scale GPP products and recent literature reports of enhanced carbon sinks in boreal and temperate regions. Our reanalysis suggests that a process-based GPP model using Farquhar’s photosynthesis model requires the careful parameterization of Vcmax to accurately represent the photosynthetic capacity of terrestrial ecosystems. This study contributes to a better understanding of the role of European vegetation in the global carbon cycle.

Supplementary Materials

The following supporting information can be downloaded at: https://www.mdpi.com/article/10.3390/rs15051172/s1, Figure S1: Validation of the FGM model performance at different cropland sites against EC-GPP; Figure S2: A closer look at the LAI time series revealed that GLASS missed some of the second growing phases due to crop rotation at the BE-Lon site; Figure S3: Spatial and temporal patterns of LCC-based Vcmax from 2001 to 2016 at an 8-day interval; Figure S4: Interannual dynamics of mean downward solar radiation, air temperature, and vapor pressure deficit during the period from 2001 to 2016.

Author Contributions

Conceptualization, Q.W.; methodology, S.C. and C.S.; validation, Q.W.; formal analysis, Q.W.; investigation, Q.W.; resources, Q.W.; data curation, Q.W.; writing—original draft preparation, Q.W.; writing—review and editing, Y.Z., C.S., J.J., W.J., L.W. and J.J.; visualization, Q.W.; supervision, C.S.; funding acquisition, Q.W., L.W. and J.J. All authors have read and agreed to the published version of the manuscript.

Funding

This research was funded by the National Natural Science Foundation of China (grant No. 42201381), the open fund of the State Key Laboratory of Remote Sensing Science (grant No. OFSLRSS202209), the Fundamental Research Funds for Beijing University of Civil Engineering and Architecture (grant No. X21019), the National Key Research and Development Program of China (grant No. 2021YFE0117500), and the 2020 China-CEEC Joint Education Project of Institutions of Higher Education Project “Ecological Environment Monitoring of Urban Areas along the China–Europe Railway based on Remote Sensing and Artificial Intelligence”.

Data Availability Statement

The FGM GPP for Europe at yearly time-resolution has be published online through Zenodo: Qiaoli Wu, & Shaoyuan Chen. (2023). Yearly, 500-m, Gross Primary Production of Europe from 2001 to 2016 [Data set]. In Remote Sensing (Version 1). Zenodo. https://doi.org/10.5281/zenodo.7654606.

Acknowledgments

The authors would like to express their appreciation for the valuable assistance and data support provided by FLUXNET (https://fluxnet.org/), GLASS LAI, DSR, and GPP products, the MODIS LULCC product science team members, National Earth System Science Data Sharing Infrastructure, and National Science & Technology Infrastructure of China (http://www.geodata.cn, accessed on 25 November 2022).

Conflicts of Interest

The authors declare no conflict of interest.

References

  1. Friedlingstein, P.; Jones, M.W.; O’Sullivan, M.; Andrew, R.M.; Bakker, D.C.E.; Hauck, J.; Le Quéré, C.; Peters, G.P.; Peters, W.; Pongratz, J.; et al. Global Carbon Budget 2021. Earth Syst. Sci. Data 2022, 14, 1917–2005. [Google Scholar] [CrossRef]
  2. Zhang, Y.; Song, C.; Band, L.E.; Sun, G. No proportional increase of terrestrial gross carbon sequestration from the greening Earth. J. Geophys. Res. Biogeosci. 2019, 124, 2540–2553. [Google Scholar] [CrossRef]
  3. Beer, C.; Reichstein, M.; Tomelleri, E.; Ciais, P.; Jung, M.; Carvalhais, N.; Rödenbeck, C.; Arain, M.A.; Baldocchi, D.; Bonan, G.B. Terrestrial gross carbon dioxide uptake: Global distribution and covariation with climate. Science 2010, 329, 834–838. [Google Scholar] [CrossRef] [Green Version]
  4. Arias, P.; Bellouin, N.; Coppola, E.; Jones, R.; Krinner, G.; Marotzke, J.; Naik, V.; Palmer, M.; Plattner, G.-K.; Rogelj, J. Climate Change 2021: The Physical Science Basis. Contribution of Working Group I to the Sixth Assessment Report of the Intergovernmental Panel on Climate Change; Technical Summary; Cambridge University Press: Port Melbourne, Australia, 2021. [Google Scholar]
  5. Elkin, C.; Gutiérrez, A.G.; Leuzinger, S.; Manusch, C.; Temperli, C.; Rasche, L.; Bugmann, H. A 2 °C warmer world is not safe for ecosystem services in the E uropean A lps. Glob. Chang. Biol. 2013, 19, 1827–1840. [Google Scholar] [CrossRef] [PubMed]
  6. Marx, A.; Bastrup-Birk, A.; Louwagie, G.; Wugt-Larsen, F.; Biala, K.; Fussel, H.; Kurnik, B.; Schweiger, O.; Settele, J.; Civic, K. Terrestrial ecosystems, soil and forests. In Climate Change, Impacts and Vulnerability in Europe; European Environment Agency: Copenhagen, Denmark, 2016; pp. 153–182. [Google Scholar]
  7. Piao, S.; Wang, X.; Park, T.; Chen, C.; Lian, X.; He, Y.; Bjerke, J.W.; Chen, A.; Ciais, P.; Tømmervik, H. Characteristics, drivers and feedbacks of global greening. Nat. Rev. Earth Environ. 2020, 1, 14–27. [Google Scholar] [CrossRef] [Green Version]
  8. Veroustraete, F.; Sabbe, H.; Eerens, H. Estimation of carbon mass fluxes over Europe using the C-Fix model and Euroflux data. Remote Sens. Environ. 2002, 83, 376–399. [Google Scholar] [CrossRef]
  9. Jung, M.; Verstraete, M.; Gobron, N.; Reichstein, M.; Papale, D.; Bondeau, A.; Robustelli, M.; Pinty, B. Diagnostic assessment of European gross primary production. Glob. Chang. Biol. 2008, 14, 2349–2364. [Google Scholar] [CrossRef]
  10. Vetter, M.; Churkina, G.; Jung, M.; Reichstein, M.; Zaehle, S.; Bondeau, A.; Chen, Y.; Ciais, P.; Feser, F.; Freibauer, A. Analyzing the causes and spatial pattern of the European 2003 carbon flux anomaly using seven models. Biogeosciences 2008, 5, 561–583. [Google Scholar] [CrossRef] [Green Version]
  11. Beer, C.; Reichstein, M.; Ciais, P.; Farquhar, G.; Papale, D. Mean annual GPP of Europe derived from its water balance. Geophys. Res. Lett. 2007, 34, 1–4. [Google Scholar] [CrossRef] [Green Version]
  12. Thum, T.; Zaehle, S.; Köhler, P.; Aalto, T.; Aurela, M.; Guanter, L.; Kolari, P.; Laurila, T.; Lohila, A.; Magnani, F. Modelling sun-induced fluorescence and photosynthesis with a land surface model at local and regional scales in northern Europe. Biogeosciences 2017, 14, 1969–1987. [Google Scholar] [CrossRef] [Green Version]
  13. Martínez, B.; Sanchez-Ruiz, S.; Gilabert, M.; Moreno, A.; Campos-Taberner, M.; García-Haro, F.J.; Trigo, I.F.; Aurela, M.; Brümmer, C.; Carrara, A. Retrieval of daily gross primary production over Europe and Africa from an ensemble of SEVIRI/MSG products. Int. J. Appl. Earth Obs. Geoinf. 2018, 65, 124–136. [Google Scholar] [CrossRef]
  14. Wißkirchen, K.; Tum, M.; Günther, K.P.; Niklaus, M.; Eisfelder, C.; Knorr, W. Quantifying the carbon uptake by vegetation for Europe on a 1 km2 resolution using a remote sensing driven vegetation model. Geosci. Model Dev. 2013, 6, 1623–1640. [Google Scholar] [CrossRef] [Green Version]
  15. Badgley, G.; Anderegg, L.D.; Berry, J.A.; Field, C.B. Terrestrial gross primary production: Using NIRV to scale from site to globe. Glob. Chang. Biol. 2019, 25, 3731–3740. [Google Scholar] [CrossRef] [PubMed]
  16. Phillips, L.B.; Hansen, A.J.; Flather, C.H. Evaluating the species energy relationship with the newest measures of ecosystem energy: NDVI versus MODIS primary production. Remote Sens. Environ. 2008, 112, 4381–4392. [Google Scholar] [CrossRef]
  17. Sims, D.A.; Rahman, A.F.; Cordova, V.D.; El-Masri, B.Z.; Baldocchi, D.D.; Flanagan, L.B.; Goldstein, A.H.; Hollinger, D.Y.; Misson, L.; Monson, R.K. On the use of MODIS EVI to assess gross primary productivity of North American ecosystems. J. Geophys. Res. Biogeosci. 2006, 111, G04015. [Google Scholar] [CrossRef] [Green Version]
  18. Hashimoto, H.; Wang, W.; Milesi, C.; White, M.A.; Ganguly, S.; Gamo, M.; Hirata, R.; Myneni, R.B.; Nemani, R.R. Exploring simple algorithms for estimating gross primary production in forested areas from satellite data. Remote Sens. 2012, 4, 303–326. [Google Scholar] [CrossRef] [Green Version]
  19. Frankenberg, C.; Fisher, J.B.; Worden, J.; Badgley, G.; Saatchi, S.S.; Lee, J.E.; Toon, G.C.; Butz, A.; Jung, M.; Kuze, A. New global observations of the terrestrial carbon cycle from GOSAT: Patterns of plant fluorescence with gross primary productivity. Geophys. Res. Lett. 2011, 38, L17706. [Google Scholar] [CrossRef] [Green Version]
  20. Sun, Y.; Frankenberg, C.; Jung, M.; Joiner, J.; Guanter, L.; Köhler, P.; Magney, T. Overview of Solar-Induced chlorophyll Fluorescence (SIF) from the Orbiting Carbon Observatory-2: Retrieval, cross-mission comparison, and global monitoring for GPP. Remote Sens. Environ. 2018, 209, 808–823. [Google Scholar] [CrossRef]
  21. Xiao, J.; Zhuang, Q.; Law, B.E.; Chen, J.; Baldocchi, D.D.; Cook, D.R.; Oren, R.; Richardson, A.D.; Wharton, S.; Ma, S. A continuous measure of gross primary production for the conterminous United States derived from MODIS and AmeriFlux data. Remote Sens. Environ. 2010, 114, 576–591. [Google Scholar] [CrossRef] [Green Version]
  22. Yang, F.; Ichii, K.; White, M.A.; Hashimoto, H.; Michaelis, A.R.; Votava, P.; Zhu, A.-X.; Huete, A.; Running, S.W.; Nemani, R.R. Developing a continental-scale measure of gross primary production by combining MODIS and AmeriFlux data through Support Vector Machine approach. Remote Sens. Environ. 2007, 110, 109–122. [Google Scholar] [CrossRef]
  23. Monteith, J. Solar radiation and productivity in tropical ecosystems. J. Appl. Ecol. 1972, 9, 747–766. [Google Scholar] [CrossRef] [Green Version]
  24. McMurtrie, R.; Rook, D.; Kelliher, F. Modelling the yield of Pinus radiata on a site limited by water and nitrogen. For. Ecol. Manag. 1990, 30, 381–413. [Google Scholar] [CrossRef]
  25. Potter, C.; Klooster, S.; Myneni, R.; Genovese, V.; Tan, P.-N.; Kumar, V. Continental-scale comparisons of terrestrial carbon sinks estimated from satellite data and ecosystem modeling 1982–1998. Glob. Planet. Chang. 2003, 39, 201–213. [Google Scholar] [CrossRef]
  26. Landsberg, J.; Waring, R. A generalised model of forest productivity using simplified concepts of radiation-use efficiency, carbon balance and partitioning. For. Ecol. Manag. 1997, 95, 209–228. [Google Scholar] [CrossRef]
  27. Xiao, X.; Zhang, Q.; Saleska, S.; Hutyra, L.; De Camargo, P.; Wofsy, S.; Frolking, S.; Boles, S.; Keller, M.; Moore, B. Satellite-based modeling of gross primary production in a seasonally moist tropical evergreen forest. Remote Sens. Environ. 2005, 94, 105–122. [Google Scholar] [CrossRef]
  28. Yuan, W.; Liu, S.; Zhou, G.; Zhou, G.; Tieszen, L.L.; Baldocchi, D.; Bernhofer, C.; Gholz, H.; Goldstein, A.H.; Goulden, M.L. Deriving a light use efficiency model from eddy covariance flux data for predicting daily gross primary production across biomes. Agric. For. Meteorol. 2007, 143, 189–207. [Google Scholar] [CrossRef] [Green Version]
  29. Stocker, B.D.; Wang, H.; Smith, N.G.; Harrison, S.P.; Keenan, T.F.; Sandoval, D.; Davis, T.; Prentice, I.C. P-model v1. 0: An optimality-based light use efficiency model for simulating ecosystem gross primary production. Geosci. Model Dev. 2020, 13, 1545–1581. [Google Scholar] [CrossRef] [Green Version]
  30. Zhang, Y.; Song, C.; Sun, G.; Band, L.E.; McNulty, S.; Noormets, A.; Zhang, Q.; Zhang, Z. Development of a coupled carbon and water model for estimating global gross primary productivity and evapotranspiration based on eddy flux and remote sensing data. Agric. For. Meteorol. 2016, 223, 116–131. [Google Scholar] [CrossRef] [Green Version]
  31. Parton, W.; Scurlock, J.; Ojima, D.; Gilmanov, T.; Scholes, R.; Schimel, D.S.; Kirchner, T.; Menaut, J.C.; Seastedt, T.; Garcia Moya, E. Observations and modeling of biomass and soil organic matter dynamics for the grassland biome worldwide. Glob. Biogeochem. Cycles 1993, 7, 785–809. [Google Scholar] [CrossRef] [Green Version]
  32. Running, S.W.; Hunt Jr, E.R. Generalization of a Forest Ecosystem Process Model for Other Biomes, BIOME-BGC, and an Application for Global-Scale Models. In Scaling Physiological Processes; Ehleringer, J.R., Field, C.B., Eds.; Academic Press: San Diego, CA, USA, 1993. [Google Scholar]
  33. Jiang, C.; Ryu, Y. Multi-scale evaluation of global gross primary productivity and evapotranspiration products derived from Breathing Earth System Simulator (BESS). Remote Sens. Environ. 2016, 186, 528–547. [Google Scholar] [CrossRef]
  34. Liu, J.; Chen, J.; Cihlar, J.; Park, W. A process-based boreal ecosystem productivity simulator using remote sensing inputs. Remote Sens. Environ. 1997, 62, 158–175. [Google Scholar] [CrossRef]
  35. Chen, S.; Zhang, Y.; Wu, Q.; Liu, S.; Song, C.; Xiao, J.; Band, L.E.; Vose, J.M. Vegetation structural change and CO2 fertilization more than offset gross primary production decline caused by reduced solar radiation in China. Agric. For. Meteorol. 2021, 296, 108207. [Google Scholar] [CrossRef]
  36. Leuning, R.; Kelliher, F.M.; De Pury, D.; Schulze, E.D. Leaf nitrogen, photosynthesis, conductance and transpiration: Scaling from leaves to canopies. Plant Cell Environ. 1995, 18, 1183–1200. [Google Scholar] [CrossRef]
  37. Chen, J.M.; Ju, W.; Ciais, P.; Viovy, N.; Liu, R.; Liu, Y.; Lu, X. Vegetation structural change since 1981 significantly enhanced the terrestrial carbon sink. Nat. Commun. 2019, 10, 4259. [Google Scholar] [CrossRef] [PubMed] [Green Version]
  38. Zhang, Y.; Song, C.; Sun, G.; Band, L.E.; Noormets, A.; Zhang, Q. Understanding moisture stress on light use efficiency across terrestrial ecosystems based on global flux and remote-sensing data. J. Geophys. Res. Biogeosci. 2015, 120, 2053–2066. [Google Scholar] [CrossRef]
  39. Schöttler, M.A.; Tóth, S.Z. Photosynthetic complex stoichiometry dynamics in higher plants: Environmental acclimation and photosynthetic flux control. Front. Plant Sci. 2014, 5, 188. [Google Scholar] [PubMed]
  40. Farquhar, G.D.; von Caemmerer, S.v.; Berry, J.A. A biochemical model of photosynthetic CO2 assimilation in leaves of C3 species. planta 1980, 149, 78–90. [Google Scholar] [CrossRef] [PubMed] [Green Version]
  41. Luo, X.; Keenan, T.F.; Chen, J.M.; Croft, H.; Colin Prentice, I.; Smith, N.G.; Walker, A.P.; Wang, H.; Wang, R.; Xu, C. Global variation in the fraction of leaf nitrogen allocated to photosynthesis. Nat. Commun. 2021, 12, 4866. [Google Scholar] [CrossRef]
  42. Dietze, M.C. Gaps in knowledge and data driving uncertainty in models of photosynthesis. Photosynth. Res. 2014, 119, 3–14. [Google Scholar] [CrossRef]
  43. De Kauwe, M.G.; Lin, Y.S.; Wright, I.J.; Medlyn, B.E.; Crous, K.Y.; Ellsworth, D.S.; Maire, V.; Prentice, I.C.; Atkin, O.K.; Rogers, A. A test of the ‘one-point method’for estimating maximum carboxylation capacity from field-measured, light-saturated photosynthesis. New Phytol. 2016, 210, 1130–1144. [Google Scholar] [CrossRef] [Green Version]
  44. Moualeu-Ngangue, D.P.; Chen, T.W.; Stützel, H. A new method to estimate photosynthetic parameters through net assimilation rate− intercellular space CO2 concentration (A-Ci) curve and chlorophyll fluorescence measurements. New Phytol. 2017, 213, 1543–1554. [Google Scholar] [CrossRef]
  45. Reich, P.B.; Wright, I.J.; Lusk, C.H. PREDICTING LEAF PHYSIOLOGY FROM SIMPLE PLANT AND CLIMATE ATTRIBUTES: A GLOBAL GLOPNET ANALYSIS. Ecol. Appl. 2007, 17, 1982–1988. [Google Scholar] [CrossRef] [PubMed]
  46. Chu, H.; Luo, X.; Ouyang, Z.; Chan, W.S.; Dengel, S.; Biraud, S.C.; Torn, M.S.; Metzger, S.; Kumar, J.; Arain, M.A.; et al. Representativeness of Eddy-Covariance flux footprints for areas surrounding AmeriFlux sites. Agric. For. Meteorol. 2021, 301–302, 108350. [Google Scholar] [CrossRef]
  47. Wullschleger, S.D.; Epstein, H.E.; Box, E.O.; Euskirchen, E.S.; Goswami, S.; Iversen, C.M.; Kattge, J.; Norby, R.J.; van Bodegom, P.M.; Xu, X. Plant functional types in Earth system models: Past experiences and future directions for application of dynamic vegetation models in high-latitude ecosystems. Ann. Bot. 2014, 114, 1–16. [Google Scholar] [CrossRef] [PubMed] [Green Version]
  48. Yang, Y.; Zhu, Q.; Peng, C.; Wang, H.; Chen, H. From plant functional types to plant functional traits: A new paradigm in modelling global vegetation dynamics. Prog. Phys. Geogr. 2015, 39, 514–535. [Google Scholar] [CrossRef]
  49. Kattge, J.; Knorr, W.; Raddatz, T.; Wirth, C. Quantifying photosynthetic capacity and its relationship to leaf nitrogen content for global-scale terrestrial biosphere models. Glob. Chang. Biol. 2009, 15, 976–991. [Google Scholar] [CrossRef]
  50. Alton, P.B. Retrieval of seasonal Rubisco-limited photosynthetic capacity at global FLUXNET sites from hyperspectral satellite remote sensing: Impact on carbon modelling. Agric. For. Meteorol. 2017, 232, 74–88. [Google Scholar] [CrossRef] [Green Version]
  51. Wang, J.; Jiang, F.; Wang, H.; Qiu, B.; Wu, M.; He, W.; Ju, W.; Zhang, Y.; Chen, J.M.; Zhou, Y. Constraining global terrestrial gross primary productivity in a global carbon assimilation system with OCO-2 chlorophyll fluorescence data. Agric. For. Meteorol. 2021, 304, 108424. [Google Scholar] [CrossRef]
  52. Peng, Y.; Bloomfield, K.J.; Cernusak, L.A.; Domingues, T.F.; Colin Prentice, I. Global climate and nutrient controls of photosynthetic capacity. Commun. Biol. 2021, 4, 462. [Google Scholar] [CrossRef] [PubMed]
  53. Wu, Q.; Song, C.; Song, J.; Wang, J.; Chen, S.; Yang, L.; Xiang, W.; Zhao, Z.; Jiang, J. Effects of leaf age and canopy structure on gross ecosystem production in a subtropical evergreen Chinese fir forest. Agric. For. Meteorol. 2021, 310, 108618. [Google Scholar] [CrossRef]
  54. Jiang, C.; Ryu, Y.; Wang, H.; Keenan, T.F. An optimality-based model explains seasonal variation in C3 plant photosynthetic capacity. Glob. Chang. Biol. 2020, 26, 6493–6510. [Google Scholar] [CrossRef]
  55. Chen, J.M.; Wang, R.; Liu, Y.; He, L.; Croft, H.; Luo, X.; Wang, H.; Smith, N.G.; Keenan, T.F.; Prentice, I.C.; et al. Global Datasets of Leaf Photosynthetic Capacity for Ecological and Earth System Research. Earth Syst. Sci. Data 2022, 2022, 4077–4093. [Google Scholar] [CrossRef]
  56. Croft, H.; Chen, J.M.; Luo, X.; Bartlett, P.; Chen, B.; Staebler, R.M. Leaf chlorophyll content as a proxy for leaf photosynthetic capacity. Glob. Chang. Biol. 2017, 23, 3513–3524. [Google Scholar] [CrossRef] [Green Version]
  57. He, L.; Chen, J.M.; Liu, J.; Zheng, T.; Wang, R.; Joiner, J.; Chou, S.; Chen, B.; Liu, Y.; Liu, R. Diverse photosynthetic capacity of global ecosystems mapped by satellite chlorophyll fluorescence measurements. Remote Sens. Environ. 2019, 232, 111344. [Google Scholar] [CrossRef] [PubMed]
  58. Alton, P.B. Decadal trends in photosynthetic capacity and leaf area index inferred from satellite remote sensing for global vegetation types. Agric. For. Meteorol. 2018, 250, 361–375. [Google Scholar] [CrossRef] [Green Version]
  59. Lu, X.; Ju, W.; Li, J.; Croft, H.; Chen, J.M.; Luo, Y.; Yu, H.; Hu, H. Maximum carboxylation rate estimation with chlorophyll content as a proxy of rubisco content. J. Geophys. Res. Biogeosci. 2020, 125, e2020JG005748. [Google Scholar] [CrossRef]
  60. Pastorello, G.; Trotta, C.; Canfora, E.; Chu, H.; Christianson, D.; Cheah, Y.-W.; Poindexter, C.; Chen, J.; Elbashandy, A.; Humphrey, M.; et al. The FLUXNET2015 dataset and the ONEFlux processing pipeline for eddy covariance data. Sci. Data 2020, 7, 225. [Google Scholar] [CrossRef] [PubMed]
  61. Prentice, I.C.; Dong, N.; Gleason, S.M.; Maire, V.; Wright, I.J. Balancing the costs of carbon gain and water transport: Testing a new theoretical framework for plant functional ecology. Ecol. Lett. 2014, 17, 82–91. [Google Scholar] [CrossRef]
  62. Medlyn, B.E.; Duursma, R.A.; Eamus, D.; Ellsworth, D.S.; Prentice, I.C.; Barton, C.V.; Crous, K.Y.; Angelis, P.; Freeman, M.; Wingate, L. Reconciling the optimal and empirical approaches to modelling stomatal conductance. Glob. Chang. Biol. 2012, 18, 3476. [Google Scholar] [CrossRef] [Green Version]
  63. Medlyn, B.E.; Duursma, R.A.; Eamus, D.; Ellsworth, D.S.; Prentice, I.C.; Barton, C.V.; Crous, K.Y.; De Angelis, P.; Freeman, M.; Wingate, L. Reconciling the optimal and empirical approaches to modelling stomatal conductance. Glob. Chang. Biol. 2011, 17, 2134–2144. [Google Scholar] [CrossRef] [Green Version]
  64. De Pury, D.; Farquhar, G. Simple scaling of photosynthesis from leaves to canopies without the errors of big-leaf models. Plant Cell Environ. 1997, 20, 537–557. [Google Scholar] [CrossRef]
  65. Song, C.; Katul, G.; Oren, R.; Band, L.E.; Tague, C.L.; Stoy, P.C.; McCarthy, H.R. Energy, water, and carbon fluxes in a loblolly pine stand: Results from uniform and gappy canopy models with comparisons to eddy flux data. J. Geophys. Res. Biogeosci. 2009, 114, G04021. [Google Scholar] [CrossRef] [Green Version]
  66. Lai, C.T.; Katul, G.; Oren, R.; Ellsworth, D.; Schäfer, K. Modeling CO2 and water vapor turbulent flux distributions within a forest canopy. J. Geophys. Res. Atmos. 2000, 105, 26333–26351. [Google Scholar] [CrossRef] [Green Version]
  67. Baldocchi, D.; Penuelas, J. The physics and ecology of mining carbon dioxide from the atmosphere by ecosystems. Glob. Chang. Biol. 2019, 25, 1191–1197. [Google Scholar] [CrossRef] [Green Version]
  68. Vitale, L.; Di Tommasi, P.; D’Urso, G.; Magliulo, V. The response of ecosystem carbon fluxes to LAI and environmental drivers in a maize crop grown in two contrasting seasons. Int. J. Biometeorol. 2016, 60, 411–420. [Google Scholar] [CrossRef] [Green Version]
  69. Schmidt, M.; Reichenau, T.G.; Fiener, P.; Schneider, K. The carbon budget of a winter wheat field: An eddy covariance analysis of seasonal and inter-annual variability. Agric. For. Meteorol. 2012, 165, 114–126. [Google Scholar] [CrossRef]
  70. Anthoni, P.; Knohl, A.; Rebmann, C.; Freibauer, A.; Mund, M.; Ziegler, W.; Kolle, O.; Schulze, E.D. Forest and agricultural land-use-dependent CO2 exchange in Thuringia, Germany. Glob. Chang. Biol. 2004, 10, 2005–2019. [Google Scholar] [CrossRef]
  71. Loubet, B.; Laville, P.; Lehuger, S.; Larmanou, E.; Fléchard, C.; Mascher, N.; Genermont, S.; Roche, R.; Ferrara, R.M.; Stella, P. Carbon, nitrogen and Greenhouse gases budgets over a four years crop rotation in northern France. Plant Soil 2011, 343, 109–137. [Google Scholar] [CrossRef]
  72. Moureaux, C.; Debacq, A.; Bodson, B.; Heinesch, B.; Aubinet, M. Annual net ecosystem carbon exchange by a sugar beet crop. Agric. For. Meteorol. 2006, 139, 25–39. [Google Scholar] [CrossRef]
  73. Prescher, A.-K.; Grünwald, T.; Bernhofer, C. Land use regulates carbon budgets in eastern Germany: From NEE to NBP. Agric. For. Meteorol. 2010, 150, 1016–1025. [Google Scholar] [CrossRef]
  74. Valentini, R.; De Angelis, P.; Matteucci, G.; Monaco, R.; Dore, S.; Mucnozza, G.S. Seasonal net carbon dioxide exchange of a beech forest with the atmosphere. Glob. Chang. Biol. 1996, 2, 199–207. [Google Scholar] [CrossRef]
  75. Bazot, S.; Barthes, L.; Blanot, D.; Fresneau, C. Distribution of non-structural nitrogen and carbohydrate compounds in mature oak trees in a temperate forest at four key phenological stages. Trees 2013, 27, 1023–1034. [Google Scholar] [CrossRef]
  76. Rey, A.; Pegoraro, E.; Tedeschi, V.; De Parri, I.; Jarvis, P.G.; Valentini, R. Annual variation in soil respiration and its components in a coppice oak forest in Central Italy. Glob. Chang. Biol. 2002, 8, 851–866. [Google Scholar] [CrossRef]
  77. Tedeschi, V.; Rey, A.; Manca, G.; Valentini, R.; Jarvis, P.G.; Borghetti, M. Soil respiration in a Mediterranean oak forest at different developmental stages after coppicing. Glob. Chang. Biol. 2006, 12, 110–121. [Google Scholar] [CrossRef]
  78. Knohl, A.; Schulze, E.-D.; Kolle, O.; Buchmann, N. Large carbon uptake by an unmanaged 250-year-old deciduous forest in Central Germany. Agric. For. Meteorol. 2003, 118, 151–167. [Google Scholar] [CrossRef]
  79. Montagnani, L.; Manca, G.; Canepa, E.; Georgieva, E.; Acosta, M.; Feigenwinter, C.; Janous, D.; Kerschbaumer, G.; Lindroth, A.; Minach, L. A new mass conservation approach to the study of CO2 advection in an alpine forest. J. Geophys. Res. Atmos. 2009, 114, D07306. [Google Scholar] [CrossRef] [Green Version]
  80. Acosta, M.; Pavelka, M.; Montagnani, L.; Kutsch, W.; Lindroth, A.; Juszczak, R.; Janouš, D. Soil surface CO2 efflux measurements in Norway spruce forests: Comparison between four different sites across Europe—From boreal to alpine forest. Geoderma 2013, 192, 295–303. [Google Scholar] [CrossRef]
  81. Moors, E.J. Water Use of Forests in the Netherlands. Ph.D. Thesis, Vrije Universiteit, Amsterdam, The Netherlands, 2012. [Google Scholar]
  82. Kurbatova, J.; Li, C.; Varlagin, A.; Xiao, X.; Vygodskaya, N. Modeling carbon dynamics in two adjacent spruce forests with different soil conditions in Russia. Biogeosciences 2008, 5, 969–980. [Google Scholar] [CrossRef] [Green Version]
  83. Marcolla, B.; Pitacco, A.; Cescatti, A. Canopy architecture and turbulence structure in a coniferous forest. Bound. Layer Meteorol. 2003, 108, 39–59. [Google Scholar] [CrossRef]
  84. Zielis, S.; Etzold, S.; Zweifel, R.; Eugster, W.; Haeni, M.; Buchmann, N. NEP of a Swiss subalpine forest is significantly driven not only by current but also by previous year’s weather. Biogeosciences 2014, 11, 1627–1635. [Google Scholar] [CrossRef] [Green Version]
  85. GrüNwald, T.; Bernhofer, C. A decade of carbon, water and energy flux measurements of an old spruce forest at the Anchor Station Tharandt. Tellus B Chem. Phys. Meteorol. 2007, 59, 387–396. [Google Scholar] [CrossRef] [Green Version]
  86. Rambal, S.; Joffre, R.; Ourcival, J.; Cavender-Bares, J.; Rocheteau, A. The growth respiration component in eddy CO2 flux from a Quercus ilex mediterranean forest. Glob. Chang. Biol. 2004, 10, 1460–1469. [Google Scholar] [CrossRef]
  87. Garbulsky, M.F.; Peñuelas, J.; Papale, D.; Filella, I. Remote estimation of carbon dioxide uptake by a Mediterranean forest. Glob. Chang. Biol. 2008, 14, 2860–2867. [Google Scholar] [CrossRef]
  88. Galvagno, M.; Wohlfahrt, G.; Cremonese, E.; Rossini, M.; Colombo, R.; Filippa, G.; Julitta, T.; Manca, G.; Siniscalco, C.; Di Cella, U.M. Phenology and carbon dioxide source/sink strength of a subalpine grassland in response to an exceptionally short snow season. Environ. Res. Lett. 2013, 8, 025008. [Google Scholar] [CrossRef]
  89. Merbold, L.; Eugster, W.; Stieger, J.; Zahniser, M.; Nelson, D.; Buchmann, N. Greenhouse gas budget (CO2, CH4 and N2O) of intensively managed grassland following restoration. Glob. Chang. Biol. 2014, 20, 1913–1928. [Google Scholar] [CrossRef] [PubMed]
  90. Ammann, C.; Spirig, C.; Leifeld, J.; Neftel, A. Assessment of the nitrogen and carbon budget of two managed temperate grassland fields. Agric. Ecosyst. Environ. 2009, 133, 150–162. [Google Scholar] [CrossRef]
  91. Marcolla, B.; Cescatti, A.; Manca, G.; Zorer, R.; Cavagna, M.; Fiora, A.; Gianelle, D.; Rodeghiero, M.; Sottocornola, M.; Zampedri, R. Climatic controls and ecosystem responses drive the inter-annual variability of the net ecosystem exchange of an alpine meadow. Agric. For. Meteorol. 2011, 151, 1233–1243. [Google Scholar] [CrossRef]
  92. Imer, D.; Merbold, L.; Eugster, W.; Buchmann, N. Temporal and spatial variations of soil CO2, CH4 and N2O fluxes at three differently managed grasslands. Biogeosciences 2013, 10, 5931–5945. [Google Scholar] [CrossRef] [Green Version]
  93. Etzold, S.; Ruehr, N.K.; Zweifel, R.; Dobbertin, M.; Zingg, A.; Pluess, P.; Häsler, R.; Eugster, W.; Buchmann, N. The carbon balance of two contrasting mountain forest ecosystems in Switzerland: Similar annual trends, but seasonal differences. Ecosystems 2011, 14, 1289–1309. [Google Scholar] [CrossRef] [Green Version]
  94. Carrara, A.; Janssens, I.A.; Yuste, J.C.; Ceulemans, R. Seasonal changes in photosynthesis, respiration and NEE of a mixed temperate forest. Agric. For. Meteorol. 2004, 126, 15–31. [Google Scholar] [CrossRef]
  95. Aubinet, M.; Chermanne, B.; Vandenhaute, M.; Longdoz, B.; Yernaux, M.; Laitat, E. Long term carbon dioxide exchange above a mixed forest in the Belgian Ardennes. Agric. For. Meteorol. 2001, 108, 293–315. [Google Scholar] [CrossRef]
  96. Reverter, B.R.; Sánchez-Cañete, E.; Resco, V.; Serrano-Ortiz, P.; Oyonarte, C.; Kowalski, A.S. Analyzing the major drivers of NEE in a Mediterranean alpine shrubland. Biogeosciences 2010, 7, 2601–2611. [Google Scholar] [CrossRef] [Green Version]
  97. Dušek, J.; Čížková, H.; Stellner, S.; Czerný, R.; Květ, J. Fluctuating water table affects gross ecosystem production and gross radiation use efficiency in a sedge-grass marsh. Hydrobiologia 2012, 692, 57–66. [Google Scholar] [CrossRef]
  98. Zak, D.; Reuter, H.; Augustin, J.; Shatwell, T.; Barth, M.; Gelbrecht, J.; McInnes, R. Changes of the CO2 and CH4 production potential of rewetted fens in the perspective of temporal vegetation shifts. Biogeosciences 2015, 12, 2455–2468. [Google Scholar] [CrossRef] [Green Version]
  99. Hommeltenberg, J.; Schmid, H.; Drösler, M.; Werle, P. Can a bog drained for forestry be a stronger carbon sink than a natural bog forest? Biogeosciences 2014, 11, 3477–3493. [Google Scholar] [CrossRef] [Green Version]
  100. Krause, P.; Boyle, D.; Bäse, F. Comparison of different efficiency criteria for hydrological model assessment. Adv. Geosci. 2005, 5, 89–97. [Google Scholar] [CrossRef] [Green Version]
  101. Chatterjee, S.; Hadi, A.S. Influential observations, high leverage points, and outliers in linear regression. Stat. Sci. 1986, 1, 379–393. [Google Scholar]
  102. He, L.; Chen, J.M.; Pisek, J.; Schaaf, C.B.; Strahler, A.H. Global clumping index map derived from the MODIS BRDF product. Remote Sens. Environ. 2012, 119, 118–130. [Google Scholar] [CrossRef]
  103. Croft, H.; Chen, J.M.; Wang, R.; Mo, G.; Luo, S.; Luo, X.; He, L.; Gonsamo, A.; Arabian, J.; Zhang, Y.; et al. The global distribution of leaf chlorophyll content. Remote Sens. Environ. 2020, 236, 111479. [Google Scholar] [CrossRef]
  104. Xu, M.; Liu, R.; Chen, J.M.; Liu, Y.; Shang, R.; Ju, W.; Wu, C.; Huang, W. Retrieving leaf chlorophyll content using a matrix-based vegetation index combination approach. Remote Sens. Environ. 2019, 224, 60–73. [Google Scholar] [CrossRef]
  105. Lu, X.; Croft, H.; Chen, J.M.; Luo, Y.; Ju, W. Estimating photosynthetic capacity from optimized Rubisco–chlorophyll relationships among vegetation types and under global change. Environ. Res. Lett. 2022, 17, 014028. [Google Scholar] [CrossRef]
  106. Wang, S.; Li, Y.; Ju, W.; Chen, B.; Chen, J.; Croft, H.; Mickler, R.A.; Yang, F. Estimation of Leaf Photosynthetic Capacity From Leaf Chlorophyll Content and Leaf Age in a Subtropical Evergreen Coniferous Plantation. J. Geophys. Res. Biogeosci. 2020, 125, e2019JG005020. [Google Scholar] [CrossRef]
  107. Friedl, M.; Sulla-Menashe, D. MCD12Q1 MODIS/Terra+ Aqua Land Cover Type Yearly L3 Global 500m SIN Grid V006, NASA EOSDIS Land Processes DAAC [data set]. Available online: https://lpdaac.usgs.gov/products/mcd12q1v006/ (accessed on 20 April 2020).
  108. Xiao, Z.; Liang, S.; Wang, J.; Xiang, Y.; Zhao, X.; Song, J. Long-time-series global land surface satellite leaf area index product derived from MODIS and AVHRR surface reflectance. IEEE Trans. Geosci. Remote Sens. 2016, 54, 5301–5318. [Google Scholar] [CrossRef]
  109. Xiao, Z.; Liang, S.; Wang, J.; Chen, P.; Yin, X.; Zhang, L.; Song, J. Use of general regression neural networks for generating the GLASS leaf area index product from time-series MODIS surface reflectance. IEEE Trans. Geosci. Remote Sens. 2013, 52, 209–223. [Google Scholar] [CrossRef]
  110. Zhang, X.; Wang, D.; Liu, Q.; Yao, Y.; Jia, K.; He, T.; Jiang, B.; Wei, Y.; Ma, H.; Zhao, X. An operational approach for generating the global land surface downward shortwave radiation product from MODIS data. IEEE Trans. Geosci. Remote Sens. 2019, 57, 4636–4650. [Google Scholar] [CrossRef]
  111. Zhang, X.; Liang, S.; Zhou, G.; Wu, H.; Zhao, X. Generating Global LAnd Surface Satellite incident shortwave radiation and photosynthetically active radiation products from multiple satellite data. Remote Sens. Environ. 2014, 152, 318–332. [Google Scholar] [CrossRef]
  112. Viovy, N. CRUNCEP Version 7-Atmospheric Forcing Data for the Community Land Model; Research Data Archive at the National Center for Atmospheric Research; Computational and Information Systems Laboratory: Boulder CO, USA, 2018; Volume 10. [Google Scholar]
  113. Li, X.; Xiao, J. A global, 0.05-degree product of solar-induced chlorophyll fluorescence derived from OCO-2, MODIS, and reanalysis data. Remote Sens. 2019, 11, 517. [Google Scholar] [CrossRef] [Green Version]
  114. Xiao, J.; Li, X.; He, B.; Arain, M.A.; Beringer, J.; Desai, A.R.; Emmel, C.; Hollinger, D.Y.; Krasnova, A.; Mammarella, I.; et al. Solar-induced chlorophyll fluorescence exhibits a universal relationship with gross primary productivity across a wide variety of biomes. Glob. Chang. Biol. 2019, 25, e4–e6. [Google Scholar] [CrossRef] [PubMed] [Green Version]
  115. Running, S.W.; Nemani, R.R.; Heinsch, F.A.; Zhao, M.; Reeves, M.; Hashimoto, H. A continuous satellite-derived measure of global terrestrial primary production. Bioscience 2004, 54, 547–560. [Google Scholar] [CrossRef]
  116. Zhang, Y.; Xiao, X.; Wu, X.; Zhou, S.; Zhang, G.; Qin, Y.; Dong, J. A global moderate resolution dataset of gross primary production of vegetation for 2000–2016. Sci. Data 2017, 4, 1–13. [Google Scholar] [CrossRef] [Green Version]
  117. Yuan, W.; Liu, S.; Yu, G.; Bonnefond, J.-M.; Chen, J.; Davis, K.; Desai, A.R.; Goldstein, A.H.; Gianelle, D.; Rossi, F. Global estimates of evapotranspiration and gross primary production based on MODIS and global meteorology data. Remote Sens. Environ. 2010, 114, 1416–1431. [Google Scholar] [CrossRef] [Green Version]
  118. Jung, M.; Schwalm, C.; Migliavacca, M.; Walther, S.; Camps-Valls, G.; Koirala, S.; Anthoni, P.; Besnard, S.; Bodesheim, P.; Carvalhais, N. Scaling carbon fluxes from eddy covariance sites to globe: Synthesis and evaluation of the FLUXCOM approach. Biogeosciences 2020, 17, 1343–1365. [Google Scholar] [CrossRef] [Green Version]
  119. Tramontana, G.; Jung, M.; Schwalm, C.R.; Ichii, K.; Camps-Valls, G.; Ráduly, B.; Reichstein, M.; Arain, M.A.; Cescatti, A.; Kiely, G. Predicting carbon dioxide and energy fluxes across global FLUXNET sites with regression algorithms. Biogeosciences 2016, 13, 4291–4313. [Google Scholar] [CrossRef] [Green Version]
  120. Li, X.; Xiao, J.; He, B.; Altaf Arain, M.; Beringer, J.; Desai, A.R.; Emmel, C.; Hollinger, D.Y.; Krasnova, A.; Mammarella, I.; et al. Solar-induced chlorophyll fluorescence is strongly correlated with terrestrial photosynthesis for a wide variety of biomes: First global analysis based on OCO-2 and flux tower observations. Glob. Chang. Biol. 2018, 24, 3990–4008. [Google Scholar] [CrossRef] [PubMed]
  121. He, Q.; Ju, W.; Dai, S.; He, W.; Song, L.; Wang, S.; Li, X.; Mao, G. Drought risk of global terrestrial gross primary productivity over the last 40 years detected by a remote sensing-driven process model. J. Geophys. Res. Biogeosci. 2021, 126, e2020JG005944. [Google Scholar] [CrossRef]
  122. Liu, Y.; Zhou, Y.; Ju, W.; Wang, S.; Wu, X.; He, M.; Zhu, G. Impacts of droughts on carbon sequestration by China’s terrestrial ecosystems from 2000 to 2011. Biogeosciences 2014, 11, 2583–2599. [Google Scholar] [CrossRef] [Green Version]
  123. Luo, X.; Croft, H.; Chen, J.M.; He, L.; Keenan, T.F. Improved estimates of global terrestrial photosynthesis using information on leaf chlorophyll content. Glob. Chang. Biol. 2019, 25, 2499–2514. [Google Scholar] [CrossRef] [Green Version]
  124. Houborg, R.; Anderson, M.C.; Daughtry, C.; Kustas, W.; Rodell, M. Using leaf chlorophyll to parameterize light-use-efficiency within a thermal-based carbon, water and energy exchange model. Remote Sens. Environ. 2011, 115, 1694–1705. [Google Scholar] [CrossRef]
  125. Luo, X.; Croft, H.; Chen, J.M.; Bartlett, P.; Staebler, R.; Froelich, N. Incorporating leaf chlorophyll content into a two-leaf terrestrial biosphere model for estimating carbon and water fluxes at a forest site. Agric. For. Meteorol. 2018, 248, 156–168. [Google Scholar] [CrossRef] [Green Version]
  126. Laurent, M.; Tu, K.P.; Boniello, R.A.; Goldstein, A.H. Seasonality of photosynthetic parameters in a multi-specific and vertically complex forest ecosystem in the Sierra Nevada of California. Tree Physiol. 2006, 26, 729–741. [Google Scholar]
  127. Grassi, G.; Vicinelli, E.; Ponti, F.; Cantoni, L.; Magnani, F. Seasonal and interannual variability of photosynthetic capacity in relation to leaf nitrogen in a deciduous forest plantation in northern Italy. Tree Physiol. 2005, 25, 349–360. [Google Scholar] [CrossRef]
  128. Smith, N.G.; Keenan, T.F. Mechanisms underlying leaf photosynthetic acclimation to warming and elevated CO2 as inferred from least-cost optimality theory. Glob. Chang. Biol. 2020, 26, 5202–5216. [Google Scholar] [CrossRef] [PubMed]
  129. Dong, N.; Wright, I.J.; Chen, J.M.; Luo, X.; Wang, H.; Keenan, T.F.; Smith, N.G.; Prentice, I.C. Rising CO2 and warming reduce global canopy demand for nitrogen. New Phytol. 2022, 235, 1692–1700. [Google Scholar] [CrossRef] [PubMed]
  130. Lindner, M.; Maroschek, M.; Netherer, S.; Kremer, A.; Barbati, A.; Garcia-Gonzalo, J.; Seidl, R.; Delzon, S.; Corona, P.; Kolström, M.; et al. Climate change impacts, adaptive capacity, and vulnerability of European forest ecosystems. For. Ecol. Manag. 2010, 259, 698–709. [Google Scholar] [CrossRef]
  131. Smith, N.G.; Keenan, T.F.; Colin Prentice, I.; Wang, H.; Wright, I.J.; Niinemets, Ü.; Crous, K.Y.; Domingues, T.F.; Guerrieri, R.; Yoko Ishida, F. Global photosynthetic capacity is optimized to the environment. Ecol. Lett. 2019, 22, 506–517. [Google Scholar] [CrossRef] [PubMed] [Green Version]
  132. Smith, N.G.; Dukes, J.S. Short-term acclimation to warmer temperatures accelerates leaf carbon exchange processes across plant types. Glob. Chang. Biol. 2017, 23, 4840–4853. [Google Scholar] [CrossRef] [PubMed]
  133. Nemani, R.R.; Keeling, C.D.; Hashimoto, H.; Jolly, W.M.; Piper, S.C.; Tucker, C.J.; Myneni, R.B.; Running, S.W. Climate-driven increases in global terrestrial net primary production from 1982 to 1999. science 2003, 300, 1560–1563. [Google Scholar] [CrossRef] [Green Version]
  134. Grassi, G.; Bagnaresi, U. Foliar morphological and physiological plasticity in Picea abies and Abies alba saplings along a natural light gradient. Tree Physiol. 2001, 21, 959–967. [Google Scholar] [CrossRef] [PubMed] [Green Version]
  135. Ali, A.A.; Xu, C.; Rogers, A.; McDowell, N.G.; Medlyn, B.E.; Fisher, R.A.; Wullschleger, S.D.; Reich, P.B.; Vrugt, J.A.; Bauerle, W.L.; et al. Global-scale environmental control of plant photosynthetic capacity. Ecol. Appl. 2015, 25, 2349–2365. [Google Scholar] [CrossRef] [PubMed] [Green Version]
  136. Maire, V.; Martre, P.; Kattge, J.; Gastal, F.; Esser, G.; Fontaine, S.; Soussana, J.-F. The Coordination of Leaf Photosynthesis Links C and N Fluxes in C3 Plant Species. PLoS ONE 2012, 7, e38345. [Google Scholar] [CrossRef] [PubMed] [Green Version]
  137. Medlyn, B.E.; Badeck, F.-W.; De Pury, D.G.G.; Barton, C.V.M.; Broadmeadow, M.; Ceulemans, R.; De Angelis, P.; Forstreuter, M.; Jach, M.E.; Kellomäki, S.; et al. Effects of elevated [CO2] on photosynthesis in European forest species: A meta-analysis of model parameters. Plant Cell Environ. 1999, 22, 1475–1495. [Google Scholar] [CrossRef]
  138. Niinemets, Ü.; Kull, O.; Tenhunen, J. An analysis of light effects on foliar morphology, physiology, and light interception in temperate deciduous woody species of contrasting shade tolerance. Tree Physiol. 1998, 18, 681–696. [Google Scholar] [CrossRef] [PubMed] [Green Version]
  139. Niinemets, Ü.; Cescatti, A.; Rodeghiero, M.; Tosens, T. Leaf internal diffusion conductance limits photosynthesis more strongly in older leaves of Mediterranean evergreen broad-leaved species. Plant Cell Environ. 2005, 28, 1552–1566. [Google Scholar] [CrossRef]
  140. Rogers, A.; Fischer, B.U.; Bryant, J.; Frehner, M.; Blum, H.; Raines, C.A.; Long, S.P. Acclimation of photosynthesis to elevated co2under low-nitrogen nutrition is affected by the capacity for assimilate utilization. Perennial ryegrass under free-air CO2 enrichment. Plant Physiol. 1998, 118, 683–689. [Google Scholar] [CrossRef] [PubMed] [Green Version]
  141. Frak, E.; Le Roux, X.; Millard, P.; Adam, B.; Dreyer, E.; Escuit, C.; Sinoquet, H.; Vandame, M.; Varlet-Grancher, C. Spatial distribution of leaf nitrogen and photosynthetic capacity within the foliage of individual trees: Disentangling the effects of local light quality, leaf irradiance, and transpiration. J. Exp. Bot. 2002, 53, 2207–2216. [Google Scholar] [CrossRef] [Green Version]
  142. Smith, N.G.; Dukes, J.S. Drivers of leaf carbon exchange capacity across biomes at the continental scale. Ecology 2018, 99, 1610–1620. [Google Scholar] [CrossRef] [PubMed]
  143. Walker, A.P.; Quaife, T.; Van Bodegom, P.M.; De Kauwe, M.G.; Keenan, T.F.; Joiner, J.; Lomas, M.R.; MacBean, N.; Xu, C.; Yang, X. The impact of alternative trait-scaling hypotheses for the maximum photosynthetic carboxylation rate (Vcmax) on global gross primary production. New Phytol. 2017, 215, 1370–1386. [Google Scholar] [CrossRef] [Green Version]
  144. Ryu, Y.; Baldocchi, D.D.; Kobayashi, H.; Van Ingen, C.; Li, J.; Black, T.A.; Beringer, J.; Van Gorsel, E.; Knohl, A.; Law, B.E. Integration of MODIS land and atmosphere products with a coupled-process model to estimate gross primary productivity and evapotranspiration from 1 km to global scales. Glob. Biogeochem. Cycles 2011, 25, GB4017. [Google Scholar] [CrossRef] [Green Version]
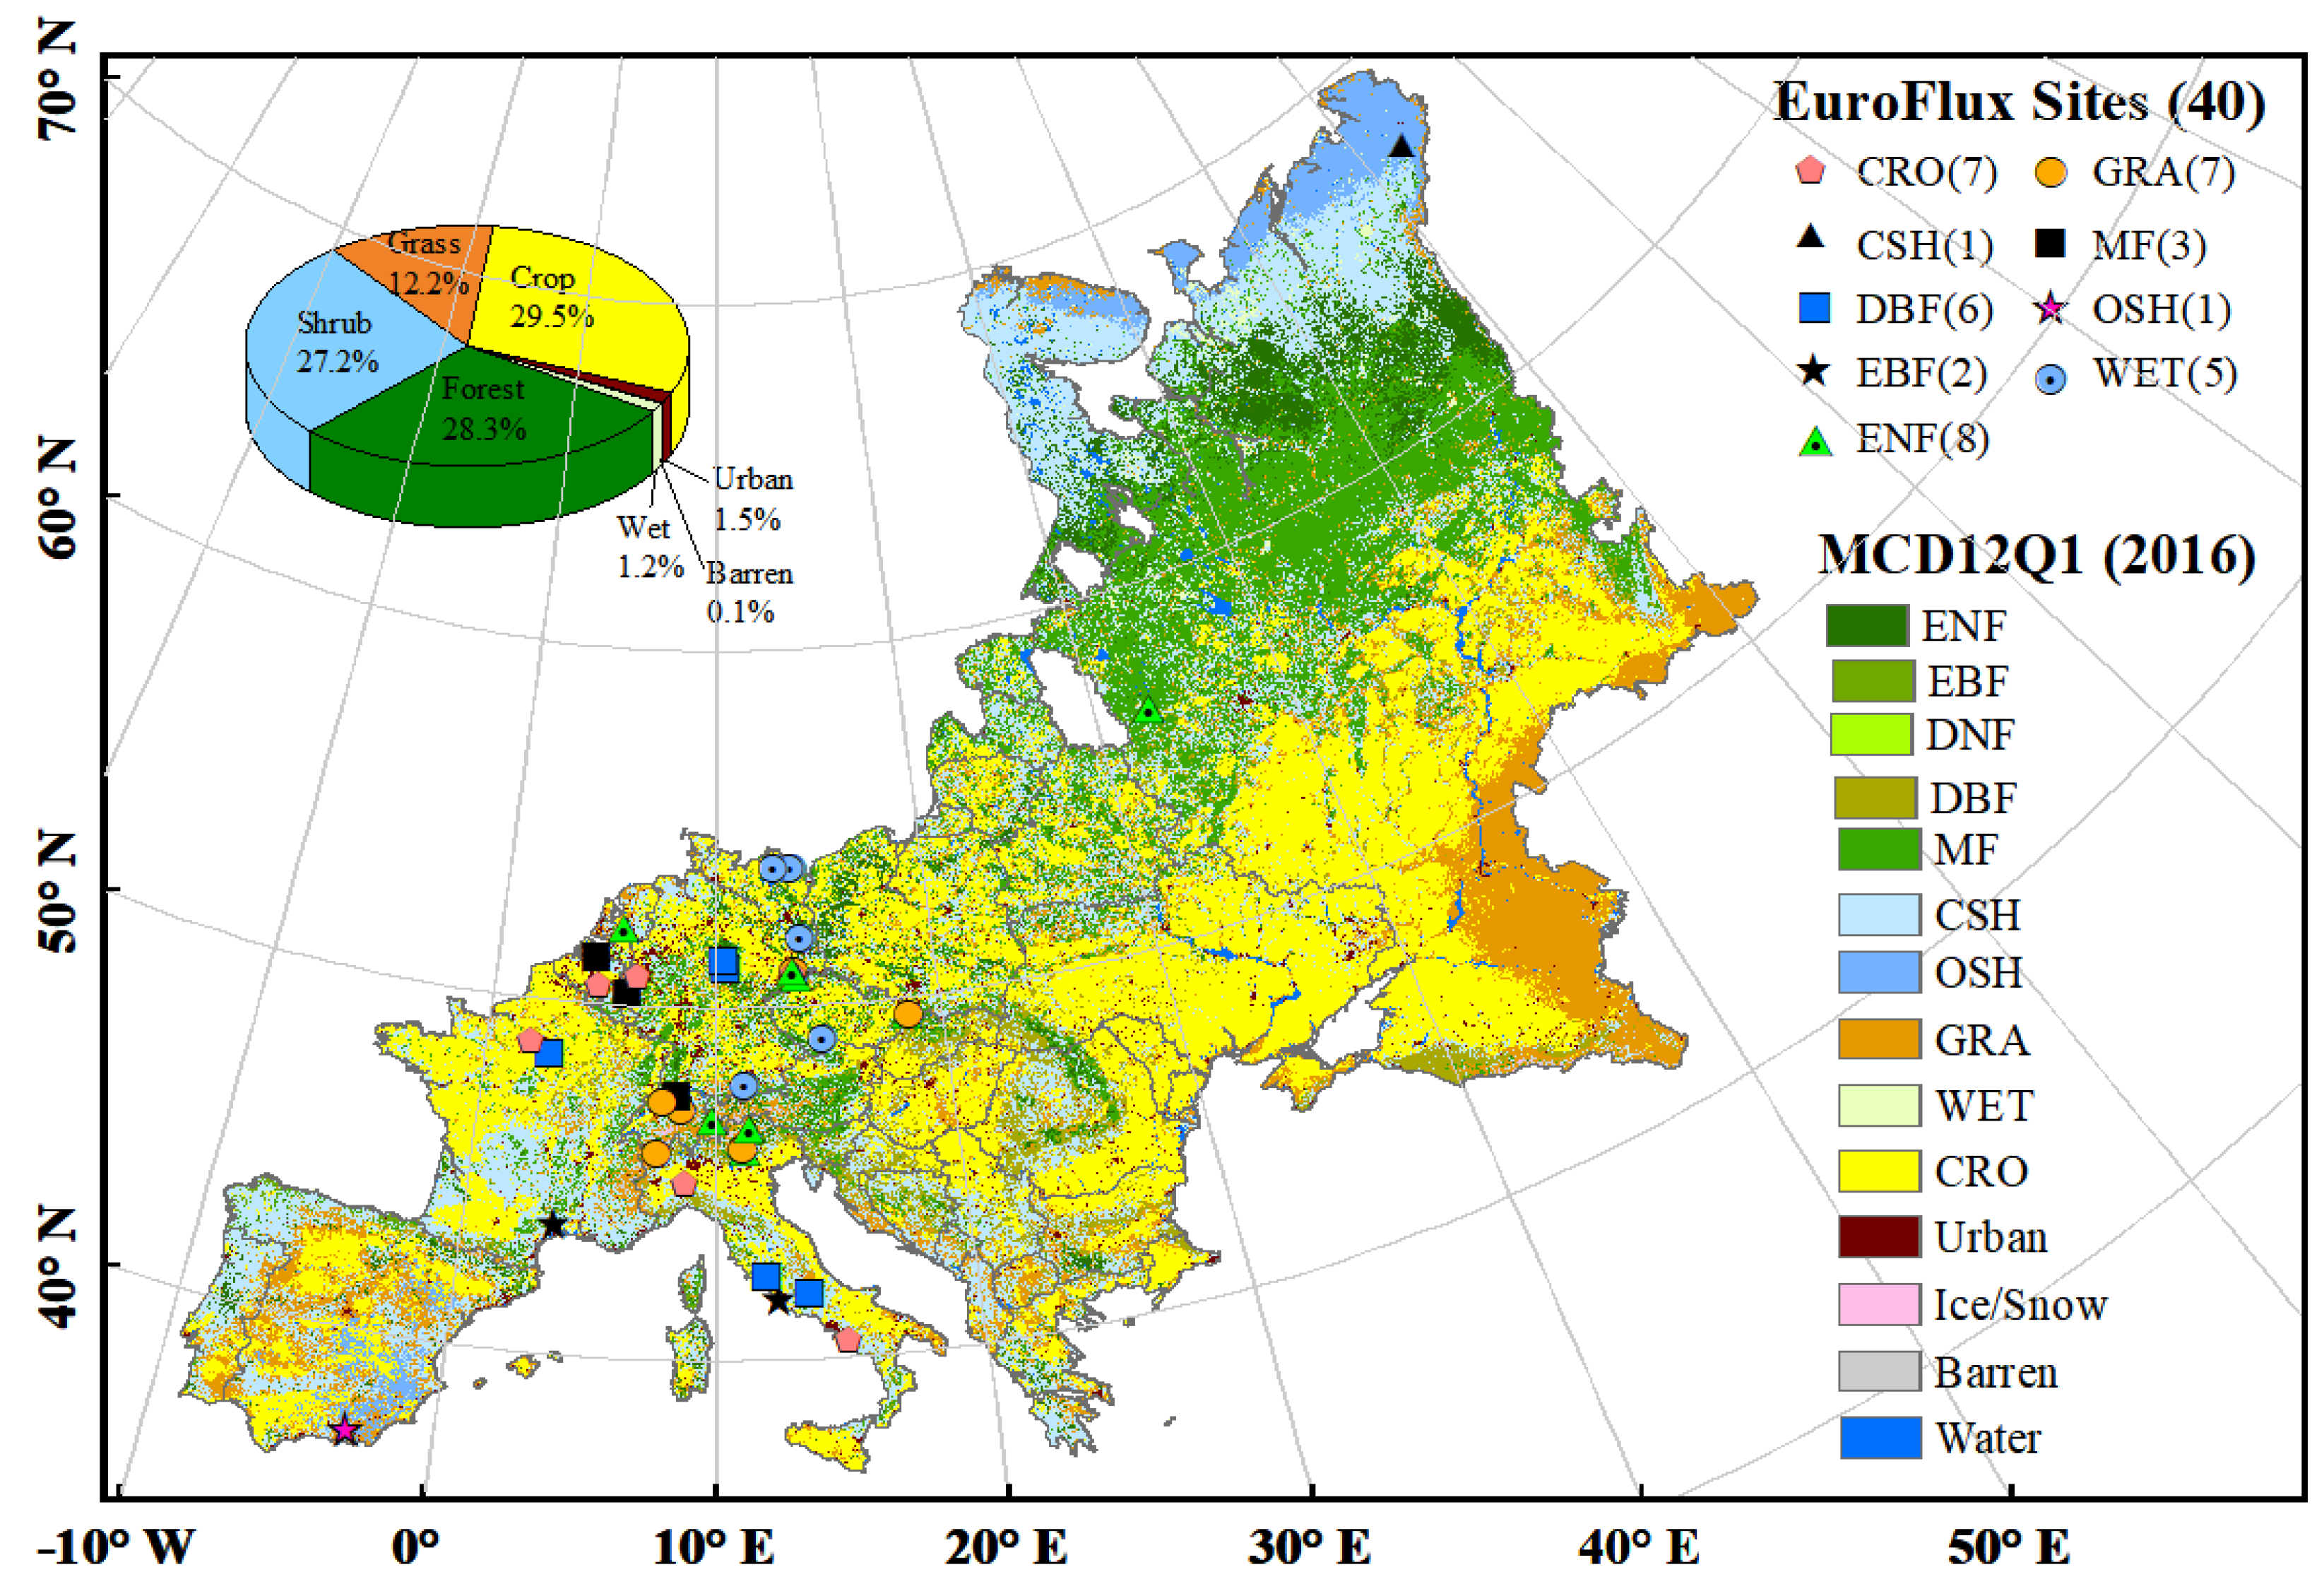
Figure 1. Spatial distribution of 40 EuroFLUX sites and land cover classification from MCD12Q1 in 2016 in Europe. Abbreviations: croplands (CRO), closed shrublands (CSH), deciduous broadleaf forest (DBF), deciduous needleleaf forest (DNF), evergreen broadleaf forest (EBF), evergreen needleleaf forest (ENF), grasslands (GRA), mixed forest (MF), open shrublands (OSH), and wetland (WET).
Remotesensing 15 01172 g001
Figure 2. Validation of model-estimated annual total GPP (g C m−2 yr−1) and GPP derived from EC data for the 19 EuroFLUX sites selected for independent model validation (Table 1). GPP values estimated using the FGM were parameterized with (a) LCC-derived Vcmax and (b) TRY-based Vcmax. The R2 and RMSE were estimated from the regression lines for the modeled GPP and EC-GPP. The black solid lines and the red solid lines are the regression lines with the intercept forced to 0 or not, respectively.
Remotesensing 15 01172 g002
Figure 3. Model calibration accuracy for nine PFTs: (a) CRO, (b) DBF, (c) SH, (d) EBF, (e) GRA, (f) MF, (g) ENF, and (h) WET. The R2, RMSE, and slope were estimated from the regression of the modeled GPP and EC-GPP for each biome with the intercept forced to 0. Biome abbreviations are given in Figure 2. The gray dots represent simulations constrained by seasonal dynamic Vcmax using the “All” model simulations (dots in pink circles). The dashed and solid lines are the regression line and 1:1 line, respectively.
Remotesensing 15 01172 g003
Figure 4. Model validation accuracy for nine PFTs: (a) CRO, (b) DBF, (c) SH, (d) EBF, (e) GRA, (f) MF, (g) ENF, and (h) WET.
Remotesensing 15 01172 g004
Figure 5. Spatial distribution of mean annual European GPP and SIF based on different sources of data, including (a) FGM GPP, (b) BEPS GPP, (c) FLUXCOM GPP, (d) GLASS GPP, (e) GPP derived from GOSIF, (f) VPM GPP, and (g) original GOSIF data. Here, (h) illustrates the correlation matrix between these data.
Remotesensing 15 01172 g005
Figure 6. Comparison of the interannual variations in annual GPP (Pg C yr−1) simulated by the FGM and by other methods (including BEPS, MODIS, CCW, GLASS, VPM, GOSIF, FLUXCOM-RF, FLUXCOM-MARS, and FLUXCOM-ANN). (a) Interannual dynamics of annual GPP for Europe during 2001–2016. ** and * indicate increasing trends in the total annual GPP from 2001 to 2016 at p-value < 0.05 and p-value < 0.01, respectively. (b) Temporal correlation (r) between the FGM GPP and other GPP products. A total of nine global GPP products were estimated by different methods.
Remotesensing 15 01172 g006
Figure 7. Seasonal dynamics of Vcmax (blue), LAI (green), and GPP (black) for nine PFTs: (a) evergreen needleleaf forest (ENF), (b) evergreen broadleaf forest (EBF), (c) deciduous needleleaf forest (DNF), (d) deciduous broadleaf forest (DBF), (e) mixed forest (MF), (f) shrublands (SH), (g) grasslands (GRA), (h) croplands (CRO), and (i) wetland (WET).
Remotesensing 15 01172 g007
Figure 8. Relative differences in Vcmax and corresponding relative GPP differences caused by changes in Vcmax with the seasons. (a) The relative differences in Vcmax between LCC-derived Vcmax and TRY-based Vcmax; (b) the corresponding relative difference in GPP caused by changes in Vcmax. (c) The differences between LCC-derived Vcmax and the calibrated Vcmax; (d) the corresponding difference in GPP caused by changes in Vcmax.
Remotesensing 15 01172 g008
Figure 9. Spatial pattern of mean annual GPP (g C m−2 yr−1) when Vcmax was parameterized in the FGM as a PFT-specific constant with two types of data: (a) calibrated Vcmax (“PC2”) and (b) TRY-based Vcmax (“PC3”). (c) and (d) represent the differences in GPP due to the different Vcmax parameterizations, i.e., GPP in “All” minus GPP in (a) and (b). (e) Spatial correlation (r) between the FGM GPP for three different simulations (“All”, “PC2”, and “PC3”) and other GPP products (including BEPS, FLUXCOM, GLASS, and GOSIF GPP products) and GOSIF data.
Remotesensing 15 01172 g009
Figure 10. The Vcmax change effect on GPP on annual time scales. (a) Difference in mean annual total GPP and (b) interannual variations in total GPP from 2001 to 2016 for the four dominant vegetation types (i.e., crop, forest, shrub, and forest) in the simulations w/o the Vcmax constraint. (c) The Vcmax change effect on interannual variations in total GPP across Europe simulated by the FGM in four model simulations (i.e., “All”, “PC1”, “PC2” and “PC3”) using the LCC-derived dynamic Vcmax from 2001 to 2016 (“All”), LCC-derived dynamic Vcmax from 2001 to 2016 (“PC1”), calibrated constant Vcmax (“PC2”), and TRY-based constant Vcmax (“PC3”). Section 2.2.3 contains descriptions of these four simulation experiments. ** in (c) indicate increasing trends in the total annual GPP from 2001 to 2016 at p-value < 0.01.
Remotesensing 15 01172 g010
Figure 11. Interannual trends in the GPP and LAI scaled by multiple-year means. The vertical dashed line indicates the rate of change in the LAI itself from 2001 to 2016 based on the GLASS LAI product. ** and * indicate increasing trends in the total annual GPP from 2001 to 2016 at p-value < 0.05 and p-value < 0.01, respectively. GPP = gross primary production; LUE = light use efficiency; LAI = leaf area index.
Remotesensing 15 01172 g011
Figure 12. Comparison of Vcmax derived from the LCC, PFT-specific Vcmax, and field-measurements for the following sites: (a) ULES94, (b) BERL95, (c) ORSA97, (d) ESSW94, (e) ALIT98, (f) TRIT04, (g) PLFR99, (h) NOIT01-03, and (i) GIGE00. The geographical map in (j) shows the locations of these nine sites in Europe. The violin plot in (k) compares the monthly mean values of Vcmax measurements and corresponding Vcmax derived from LCC-derived Vcmax maps. The scatter plot in (l) validates the LCC-derived Vcmax using time series field measurements collected at site NOIT01-03 during the growing season (April to October). The abbreviations in (ai) denote the PFTs of each site according to field surveys of plant species. Four PFTs are included, including deciduous broadleaf forest (DBF), evergreen broadleaf forest (EBF), evergreen needleleaf forest (ENF), and grasslands (GRA).
Remotesensing 15 01172 g012
Table 1. Sites for model calibration and validation and the calibrated g 1 for nine plant functional types (PFTs).
PFTs g 1 Sites   for   Calibration   ( Latitude ° ,   Longitude ° ) Sites   for   Validation   ( Latitude ° ,   Longitude ° )
CSH 11.14US-KS2 (28.61, −80.67) [60,67]RU-Vrk (67.05, 62.94)
CRO10IT-BCi (40.52, 14.96) [68]
IT-Cas (45.07, 8.72)
DE-Seh (50.87, 6.45) [69]
DE-Geb (51.10, 10.91) [70]
FR-Gri (48.84, 1.95) [71]
BE-Lon (50.55, 4.75) [72]
DE-Kli (50.89, 13.52) [73]
DBF1.66IT-Col (41.85, 13.59) [74]
FR-Fon (48.48, 2.78) [75]
DE-Lnf (51.33, 10.37) [70]
IT-Ro1 (42.41, 11.93) [76]
IT-Ro2 (42.39, 11.92) [77]
DE-Hai (51.08, 10.45) [78]
ENF0.62IT-Ren (46.59, 11.43) [79]
CZ-BK1 (49.50, 18.54) [80]
NL-Loo (52.17, 5.74) [81]
RU-Fyo (56.46, 32.92) [82]
IT-Lav (45.96, 11.28) [83]
CH-Dav (46.82, 9.86) [84]
DE-Obe (50.79, 13.72)
DE-Tha (50.96, 13.57) [85]
EBF0.62FR-Pue (43.74, 3.60) [86]IT-Cpz (41.71, 12.38) [87]
GRA1.14IT-Tor (45.84, 7.58) [88]
CH-Cha (47.21, 8.41) [89]
CH-Oe1 (47.29, 7.73) [90]
CZ-BK2 (49.49, 18.54)
IT-MBo (46.01, 11.05) [91]
CH-Fru (47.12, 8.54) [92]
DE-Gri (50.95, 13.51) [73]
MF0.62CH-Lae (47.48, 8.36) [93]
BE-Bra (51.03, 6.0) [94]
BE-Vie (50.30, 6.0) [95]
OSH10ES-LgS in 2008 (36.93, −2.75) [96]ES-Lgs in 2007 (36.93, −2.75) [96]
WET0.62CZ-wet (49.02, 14.77) [97]
DE-Spw (51.89, 14.03)
DE-Zrk (53.88, 12.89) [98]
DE-SfN (47.81, 11.33) [99]
DE-Akm (53.87, 13.68)
1 Abbreviations: closed shrublands (CSH), croplands (CRO), deciduous broadleaf forest (DBF), evergreen needleleaf forest (ENF), evergreen broadleaf forest (EBF), grasslands (GRA), mixed forest (MF), open shrublands (OSH), and wetland (WET). Site locations are shown in Figure 1. Please refer to the official website (https://fluxnet.org/sites/site-list-and-pages/, accessed on 19 February 2023) for more detailed descriptions.
Table 3. Vegetation and environmental inputs for the FGM from 2000 to 2016.
ParameterSourceTimeTemporal
Resolution
Spatial
Resolution
Reference
Land use and land cover (LULC)MODIS C62001 to 2016yearly500 m[107]
Leaf area index (LAI)GLASS V52001 to 20168-day500 m[108,109]
Clumping index (Ω)MODIS BRDF-derived20068-day500 m[102]
Photosynthetic capacity (Vcmax)Chlorophyll content2001 to 20168-day500 m[59,103,104,105,106]
Downward shortwave radiation (DSR)GLASS V52001 to 2016daily5 km[110,111]
Air temperature (Ta)CRUNCEP2001 to 20166 h0.5°[112]
Vapor pressure deficit (VPD)CRUNCEP2001 to 20166 h0.5°[112]
Ambient CO2 concentrationMLO2001 to 2016dailysitehttp://www.esrl.noaa.gov
Table 4. Information on nine GPP products for intercomparison.
GPPSpatial
Resolution
Temporal
Resolution
MethodTime PeriodReference
GOSIF 0.05 ° AnnualEmpirical model2001–2016[113,120]
BEPS0.073°DailyTBM2001–2016[34,37,121,122]
GLASS (v6)500 mAnnualLUE model2001–2016[28,117]
MODIS (c6)500 mAnnualLUE model2001–2016[115]
VPM500 mAnnualLUE model2001–2016[116]
CCW 0.05 ° AnnualLUE model2001–2016[30]
FLUXCOM 0.5 ° AnnualMachine Learning2001–2016[118,119]
Disclaimer/Publisher’s Note: The statements, opinions and data contained in all publications are solely those of the individual author(s) and contributor(s) and not of MDPI and/or the editor(s). MDPI and/or the editor(s) disclaim responsibility for any injury to people or property resulting from any ideas, methods, instructions or products referred to in the content.