
Augmenting CCAM Infrastructure for Creating Smart Roads and Enabling Autonomous Driving

 ,
,  , , , , and
Abstract
:1. Introduction
- To describe the Level 5 autonomous driving relevant concepts,
- To identify the common challenges in the roadside infrastructure for AD,
- To lay down the technical requirements of the CCAM Infrastructure,
- To identify the right set of sensory infrastructure and communication interfaces,
- To parameterize road and network infrastructures for advancements and evaluations,
- To process data and execute intelligent machine learning algorithms,
- To validate CCAM infrastructure’s mobility applications for traffic flow and mobility predictions.
2. Level-5 Autonomous Driving—An Overview of the Relevant Concepts
2.1. What Is Autonomous Driving?
- L-1—Driver Assistance: In L-1 automation, the human operator must always be present and engaged in the Dynamic Driving Task (DDT). Speed and steering cannot be controlled by the vehicle simultaneously. Furthermore, the driver can monitor any DDT performance decrease with the use of the L-1 automatic driving assistance technology. Cruise control, lane departure warning, and emergency braking assistance are a few L-1 examples.
- L-2—Partial Driving Automation: A human driver must be present at all times. Similar to L-1, if any autonomous driving component fails, the driver notices the failure and takes charge of the vehicle to meet the DDT performance standards. However, the L-1 and L-2 differ in that the system is completely in charge of lateral and longitudinal vehicle motion within a constrained operational design domain (ODD). The ODD is a representation of the physical and digital environment in which AVs must operate. Examples of L-2 vehicles include adaptive cruise control, active lane-keep assist, and autonomous emergency braking.
- L-3—Conditional Automation: When specific operational parameters are satisfied, an L-3 vehicle is capable of assuming complete control and functioning for specific segments of a route. In the event of an automated driving system failure, the system may request to resume human intervention. The DDT operation can be carried out by the L-3 AV in an area with heavy traffic; however, it cannot be performed at an accident or collision site. The traffic jam chauffeur is an example of an L-3 vehicle.
- L-4—High Automation: The ability of L-4 vehicles to intervene in the event of a problem or system breakdown is the primary distinction between L-3 and L-4 automation. In this way, these vehicles typically do not need human intervention. However, it is still possible for a human to manually override, though. L-4 vehicles are capable of driving autonomously. However, they are only able to do so in a limited region until the regulations and infrastructure evolve.
- L-5—Full Automation: Since L-5 vehicles do not need human intervention, DDT is no longer used. Even the steering wheel and the accelerator/brake pedal will be absent from L-5 vehicles. L-5 AVs will be capable of handling unexpected situations without human intervention and driving through extremely complex settings. In addition, they will be unrestricted by geofencing and capable of performing any task that a skilled human driver is capable of.
- Creating perception of all the dynamics of the complex road traffic environment including roundabouts, congestion, sharp turns, etc.,
- Dynamically adapting the local planing and control for any unprecedented event on the roads,
- Driving in congested and pedestrian occupied regions of the roads,
- Driving on the unmarked roads,
- Selecting optimal, autonomic, efficient, and adaptive manoeuvres, i.e., increasing and/or decreasing acceleration, overtake and lane change, and vehicle controls, e.g., steering wheel, speed, break, and gear change,
- Driving through extraordinary traffic conditions on the roads, i.e., bad weather (raining and snowing), and emergency vehicles (police vehicle and ambulance).
2.2. Autonomous Driving Usecase Groups
- Vehicle Platooning facilitates a dynamic group of vehicles to drive with a shorter inter-vehicle gap (directly related to the communication latency).
- Advance Driving facilitates collaboration among vehicles to perform complex manoeuvres, i.e., speeding, breaking, overtaking, etc., in a safer manner.
- Remote Driving facilitates a remote driver to operate vehicles in areas/situations where high reliability and short low latency is achievable.
- Extended Sensors facilitates holistic understanding of the complex environment by exchanging data (directly related to high data rate) gathered from all relevant road users (vehicles, RSUs, IoT enabled devices, etc.).
- General Aspects and Vehicle QoS facilitates the aforementioned use case groups in terms of communication coverage, service availability, service quality, and smoother user experience.
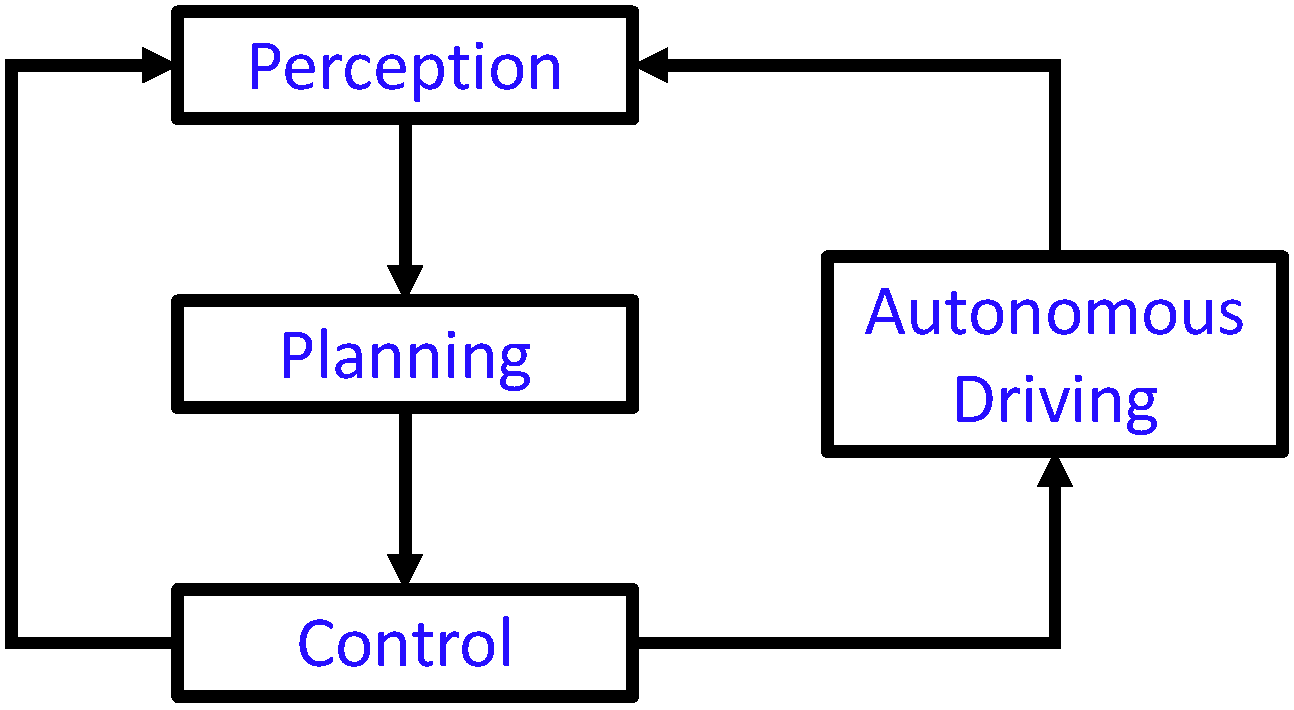
2.3. Autonomous Driving Core Layers
- Perception layer captures the context of the vehicle’s environment, which may be carried out through different techniques such as: fusion of the on-board sensory data, information exchanges with other vehicles and infrastructure, localization, etc.
- Planning layer processes involve actions regarding mission, behavioral, motion, space-time, and dynamic environment planning.
- Control layer executes the planned actions through traditional and prediction-based control, i.e., steering, breaking, and trajectory tracking controls.
3. Common Challenges in Autonomous Driving
3.1. Narrow Perception
- CH 1: How can a vehicle’s external perception be created accurately? Will the environment’s dynamics be recorded and sent (wherever necessary) in real time?
- CH 2: Can the classical local dynamic map be improved? If so, what extra information layers ought to be used and how will they help with the use cases of higher automation levels?
- CH 3: Do the 3GPP Release 15 and 16 standardized interfaces and architectural components support the protocols for the interchange and fusion of external perception with onboard perception? If not, what could be the potential alternatives?
- CH 4: What fusion techniques could be employed to obtain a real-time and accurate picture of the environment if the perception is generated externally on the RSUs and then fused with the data from the onboard vehicles?
- CH 5: What is the optimal fusion strategy for accurately fusing the sensory data from heterogeneous sensors?
- CH 6: Data on autonomous vehicles come from a variety of sources, including the vehicle’s sensors, sensors on other vehicles, RSU, etc. How to synchronize them is a significant challenge when dealing with a range of data sources. Should synchronization be handled by the storage system beforehand, or should we let the application developer do this?
3.2. Limited Computation
- CH 1: What perception information is to be provided, and to which vehicle? It is crucial since the RSU may cover a large geographic area with numerous vehicles, which creates the perception. It goes without saying that not all vehicles need to have access to every piece of information.
- CH 2: Can on-road deployed sensors generate environmental understanding as excellent, as it is produced by on-board sensors?
- CH 3: Can demand estimation for computation in the vehicle or at RSUs be conducted using artificial intelligence (AI) approaches? This is significant because new ideas could include virtualized network functions, machine learning as a service (MLaaS), data analytics as a service (DAaaS), information as a service (IaaS), and others that depend on the availability of computing infrastructure at regular times and locations.
3.3. Communication
- Ch 1: How can a vehicle accurately communicate with other vehicles and roadside infrastructure? Will the vehicles be able to achieve real-timeliness in their communications with other vehicles and roadside infrastructure?
- Ch 2: Can the information generation over a roadside unit be improved? If so, how will they realize the higher automation levels and the usecases therein?
- Ch 3: Can the generated maps either on vehicle or roadside unit be transmitted and/or received in long ranges?
- Ch 4: What could be the potential alternatives, if the existing communication interfaces lack support of the integration of external (roadside unit) and local (vehicle) information?
- Ch 5: What strategy is to be followed from updating the roadside unit’s information with onboard vehicle’s information or vice versa.
- Ch 6: What is the optimal communication strategy for accurately transmitting and receiving the sensory data from heterogeneous sensors available at the vehicle and roadside unit.
- Ch 7: Data over vehicle and roadside unit come from a variety of sources. How to communicate and synchronize the complex and challenging data.
- Ch 8: The communication infrastructure entails significant expenses. What are the vitalized alternatives for communication infrastructure?
- Ch 9: The engagement of communication infrastructure components in upstream and downstream operations is variable. How to segregate or decide what operations to be handled and when. Which connectivity needs to be highly available, the upstream or the downstream?
- Ch 10: How reliable will the communication between vehicles and RSUs be?
- Ch 11: It is not necessary to communicate every piece of information. What information needs to be communicated and how to prioritize that information.
4. Literature Review
- Challenging representation of various events (data) happening over the road,
- Right communication bit-pipes that meet the dynamically updating requirements,
- Processing the data to have conclusive outcomes, e.g., recommendation, warning, etc.
- A fully-connected neural network with Leaky Recifier and sigmoid activation functions is used for multiple DRL agents using PyTorch.
- The GPR model is build using scikit-learn.
- The Machine Hall 01–05 scenarios are used with the EuRoC dataset.
- A time-driven network simulator is build for experiments, which consists of vehicles, servers, and a wireless transmission (based on an open-source 5G simulator) modules.
- A desktop (AMD Ryzen 3600 3.8 GHz, 32 GB RAM) and a laptop (Intel i7-6500U 2.5 GHz, 8 GB RAM) were used as compute vehicles and edge servers in the experiments.
- The logging service for post-processing information.
- The forwarder service for external messages exchange using MQTT.
- The GNSS service for positioning and timing information (using GPS daemon).
- The GeoCasting services for messages distribution (using geo-tiling technique).
- Jetson TX2, GPU with 256 NVIDIA CUDA cores, Quad-Core, 8GB LPDDR4 RAM, and Ubuntu 18.04.
- A virtual machine (in OpenStack cloud server), 4 cores Intel Processor (Haswell, no TSX, IBRS), 4GB RAM, and Ubuntu Server 18.04.
- Intel(R) Xeon(R) CPU E31230@3.20 GHz, 8 GB RAM, and Ubuntu Desktop 18.04.
- An alienware laptop (Intel i7 4.4 GHz CPU, 16 GB DDR4 RAM, NVIDIA 1080p GPU with 2560 CUDA cores),
- MobileNetV2 (DeepLabv3+) for semantic segmentation,
- OpenCV for image transformations,
- The Point Cloud Library (PCL) for point cloud operations,
- QuickSketch for stitching,
- The C++ Boost library for serializing and transferring the map files over the network,
- Software modules for the aforementioned architectural components,
- Modification to ORB-SLAM2 (feature extraction, index generation, and feature matching modules),
- The open-source visual odometry algorithm for mono, stereo, and RGB-D cameras in the KITTI vision-based benchmarks.
- An On-Board Diagnosis (OBD)-II interface (OBDLink SX) was used to connect a Laguna LGN-20 OBU (with a TP-LINK MA-180 modem) with in-vehicle CAN bus for gathering vehicle (Renault Clio 4th generation) state data.
- An OpenVPN tunnel (router) managed the IPv6 network mobility since the telecom operator does not support IPv6 traffic.
- A Dell Poweredge R430 server (Intel(R) Xeon(R) CPU), CentOS 7 using OSM v4, Debian 9 OS (GNU), and OpenStack Pike is used to run the infrastructure, which include four VNF types, i.e., vOBU, OBU, data analytics, vehicle monitoring service.
- A MySQL database is used to store data, Grafana tool for monitoring services, and an Android application (on Samsung Galaxy S7) to access vehicle data from a mobile device.
- To techniques of data fusion,
- To approaches for enabling the specific AD use-cases (e.g., remote driving),
- To creating the high level perception/map through crowdsourcing techniques,
- To focusing on the information collected from automated and connected vehicles,
- To solutions for addressing the computation limitation,
- To the limited services with no contribution towards CCAM infrastructure, etc.
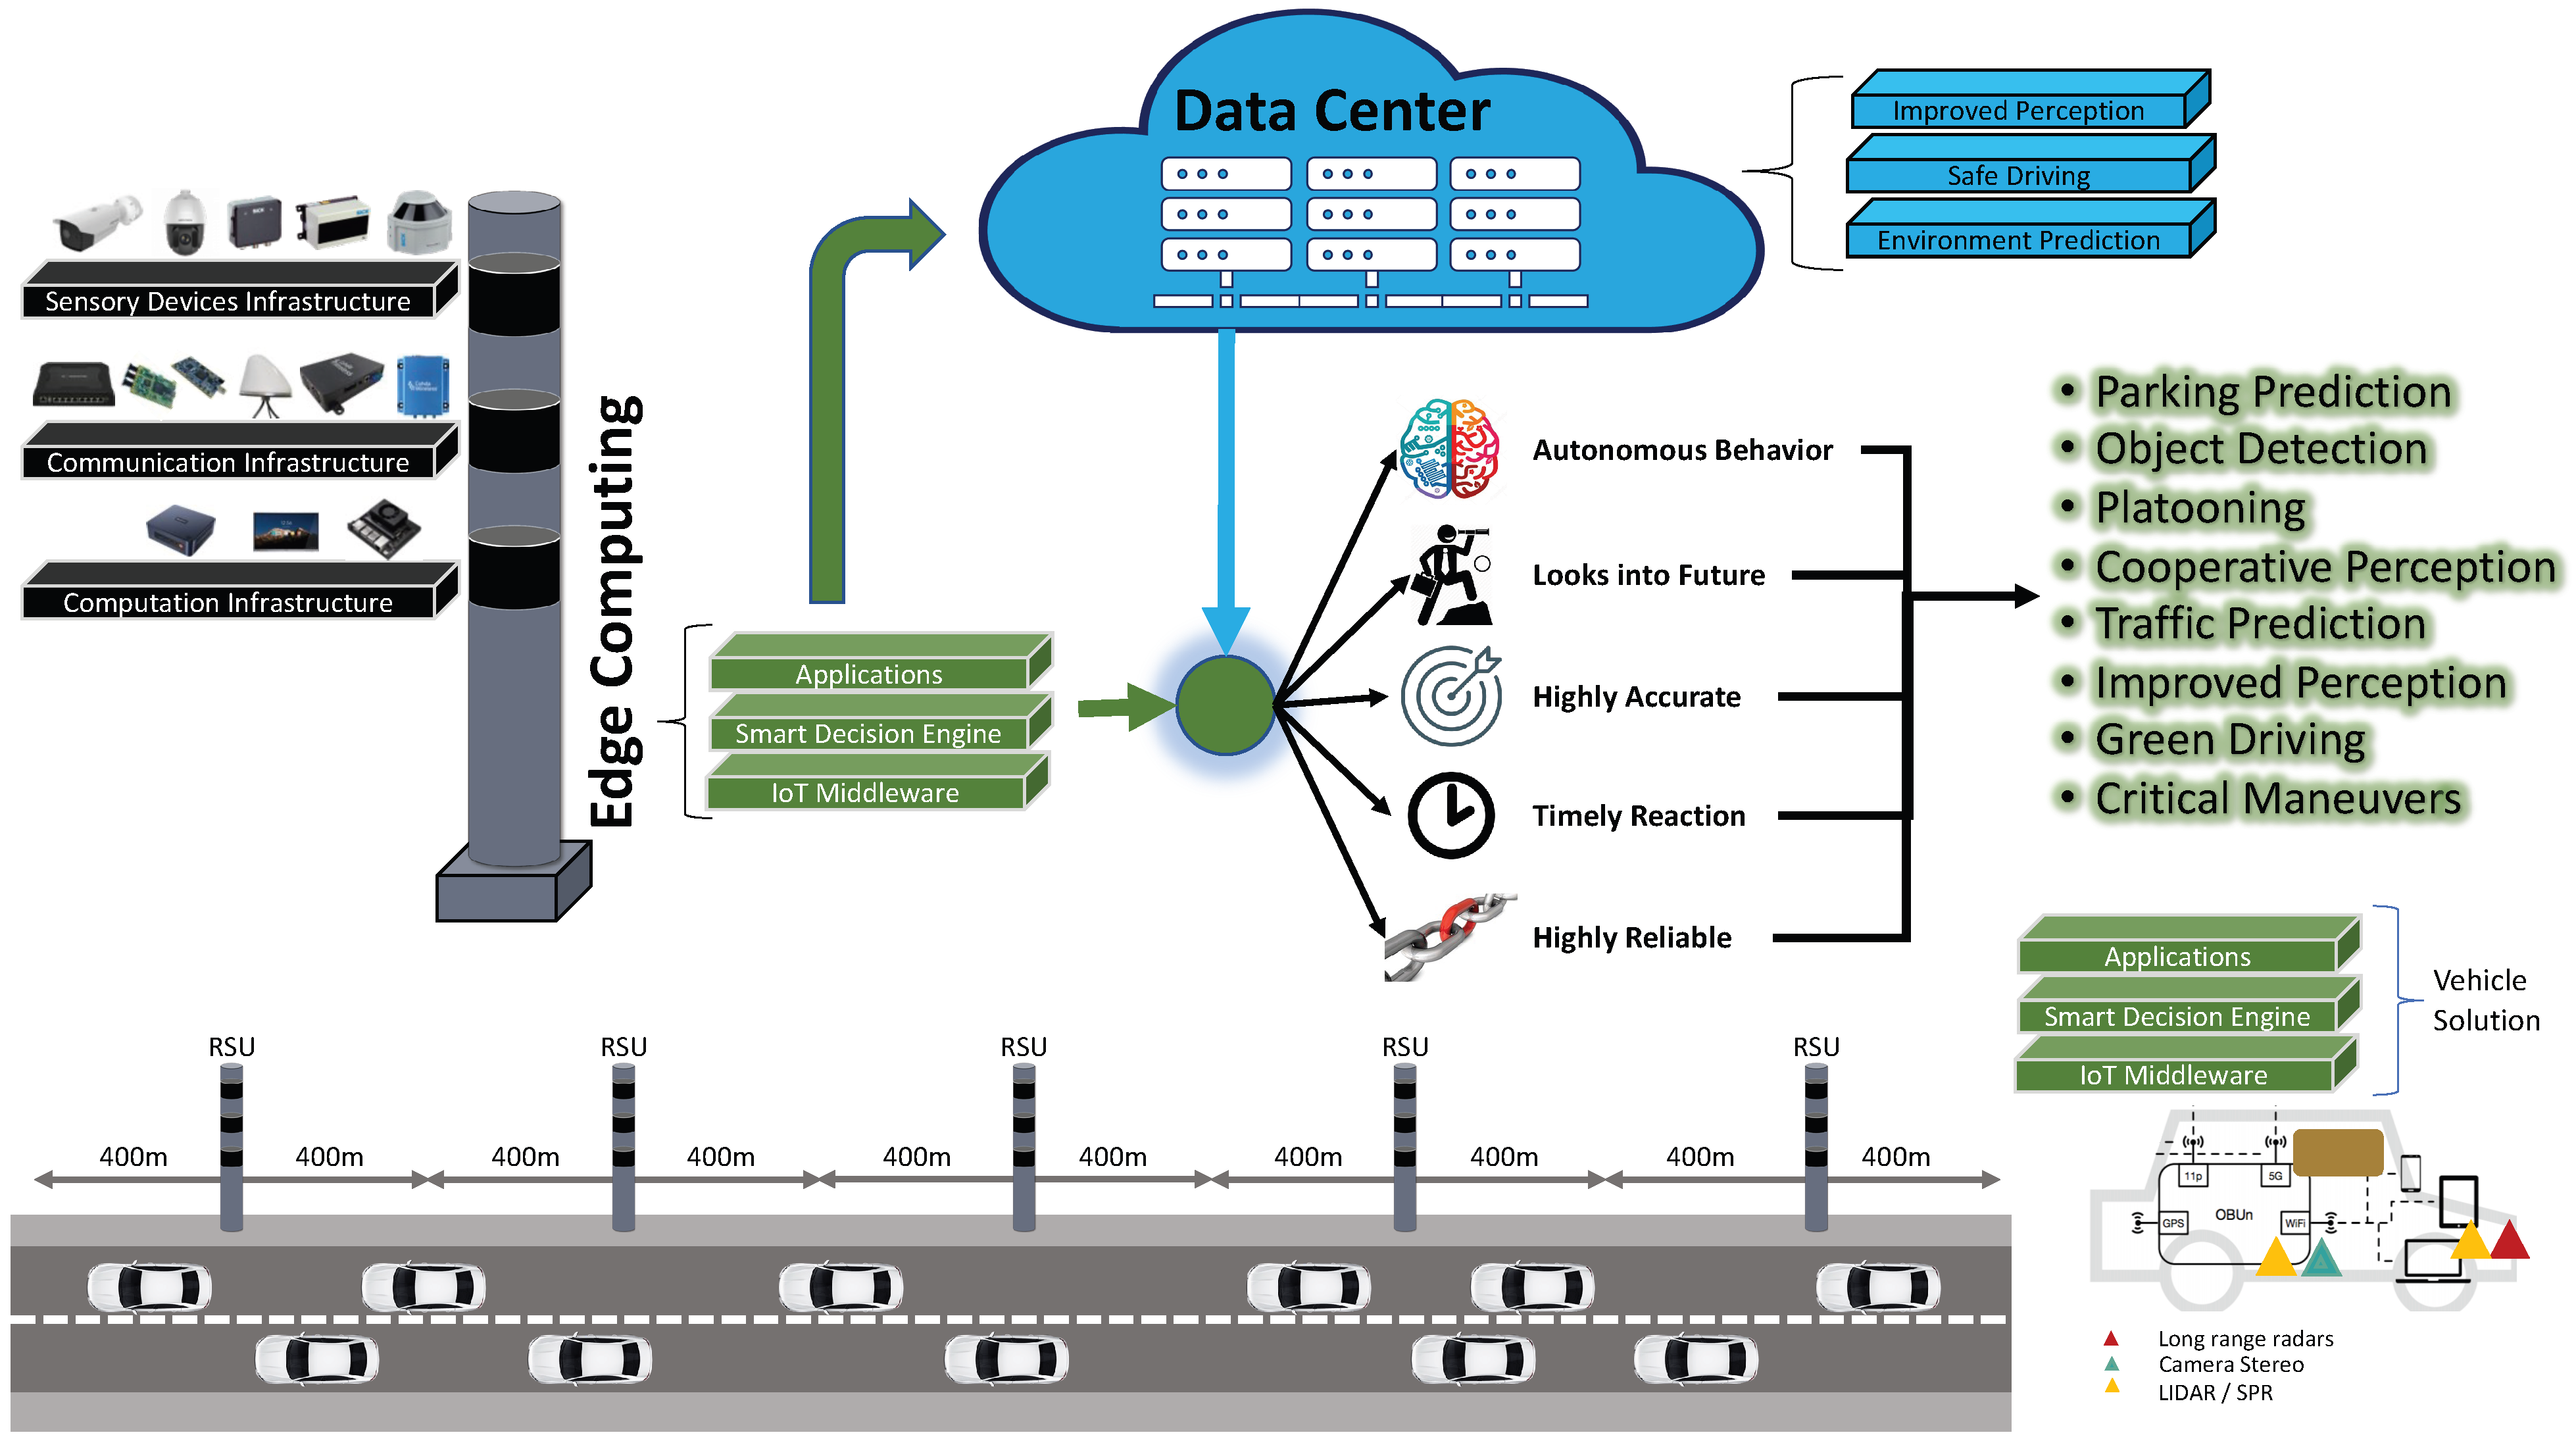
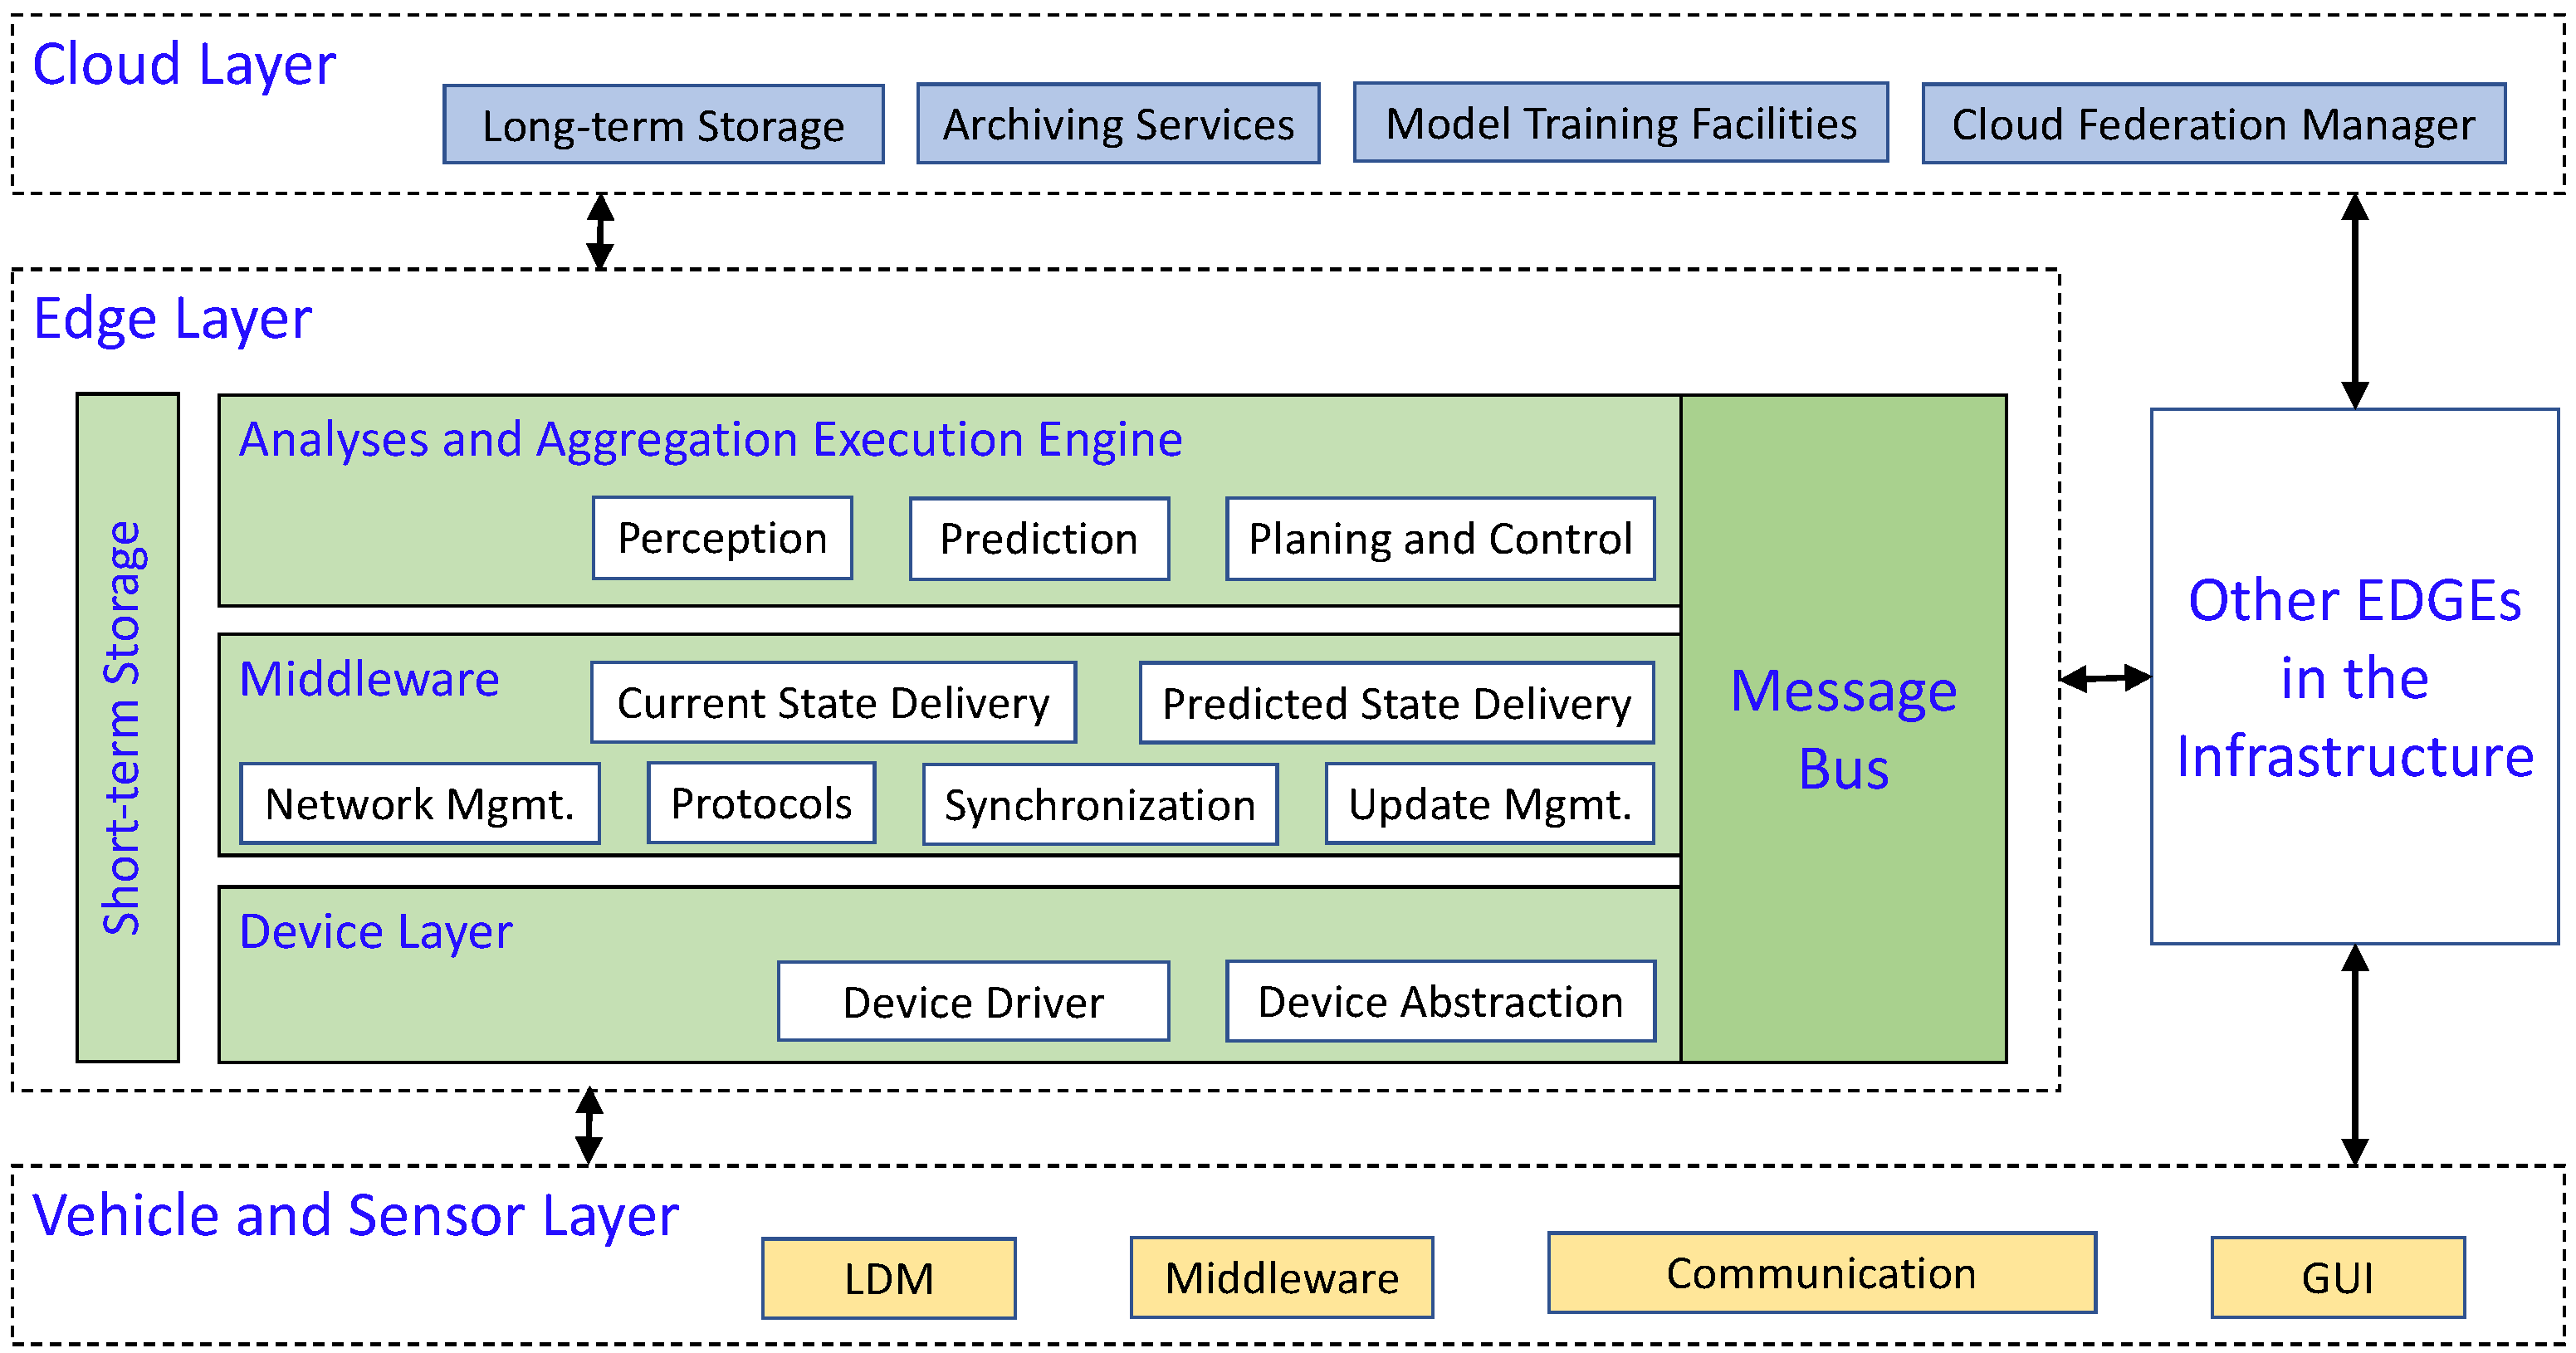
5. Proposed CCAM Solution for Autonomous Driving
- The ability to create dynamic segments for roads.
- The ability to adapt and understand dynamic and complex environments.
- The ability to process raw data and build intelligent machine learning pipelines.
- The ability to perform layer-to-layer communication using upstream and downstream channels.
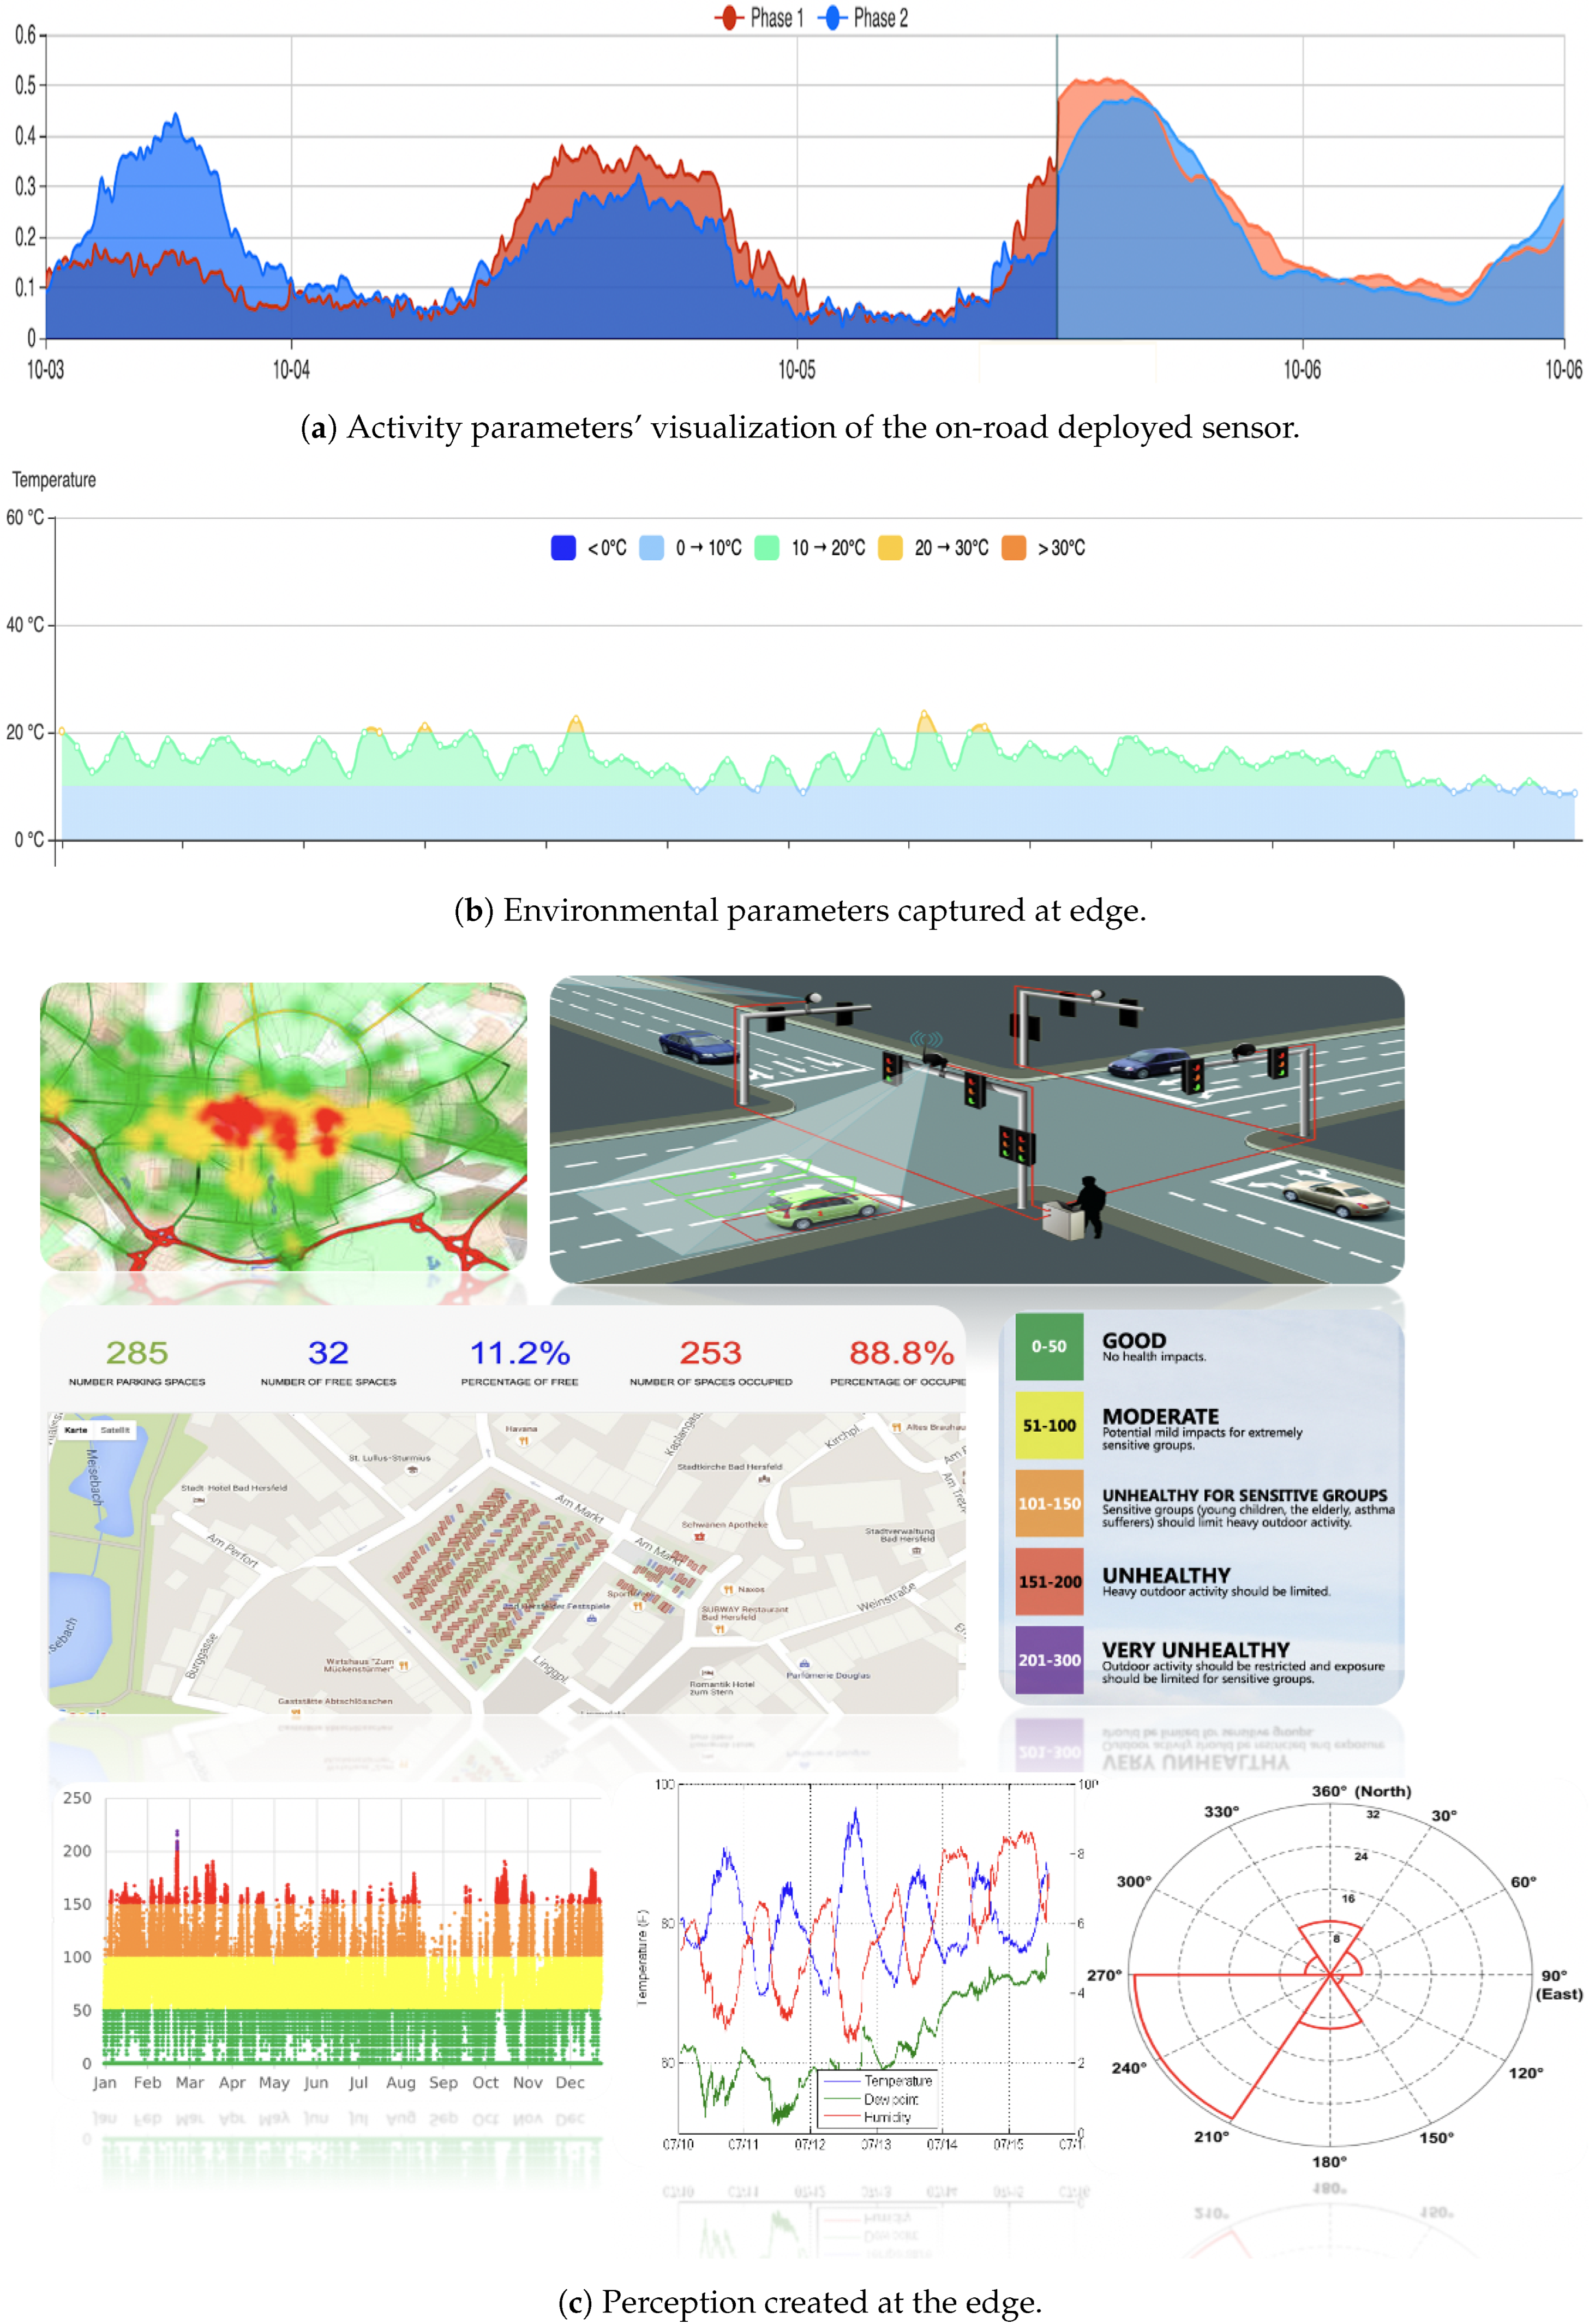
- Categorization—AI/ML methods can be used to categorize vehicles based on the sensory data captured by the on-road sensors.
- Activity Analysis—The data can be processed and analyzed using AI/ML methods to create heatmaps of various activities across the road segments.
- Tracking—AI/ML methods can be used to track the objects, once the objects are properly detected, for creating an enrich perception of the complex road segment.
- Traffic Analysis—AI/ML methods can process raw data to provide useful insights on traffic signs, traffic signals, speed, mobility patterns, and traffic density.
- Sensors and devices—This category contains all the devices and sensors that are used for collecting the right set of information/data from the road segment, i.e., devices that help capture the dynamics of the road segment. More details about this for the proposed CCAM infrastructure may be found in Section 5.1.
- Computation—This category corresponds to the right set of accelerators, e.g., GPUs, CPUs, TPUs, FPGA, etc. More details about this for the proposed CCAM infrastructure may be found in Section 5.2.
- Communication—This category defines the set of communication technologies that help achieve the objectives of the right communication bit-pipes for executing different use-cases of the autonomous driving. More details about this for the proposed CCAM infrastructure may be found in Section 5.3.
- AI/ML tools and platforms—This category encamps all the relevant AI/ML tool boxes, platforms, and approaches that help in creating the perception and context awareness for the specified road segment covered by the set of sensors deployed on the roadside unit. More details about this for the proposed CCAM infrastructure may be found in Section 5.4.
5.1. Sensors and Devices
5.2. Computation
5.3. Communication
5.4. AI/ML Tools and Platforms
6. Validation of the CCAM for Autonomous Driving
6.1. A Use-Case Experiment
- Analyzing properties, data type, aggregation, and time resolution of the data,
- Statistic aggregation and comparison of reference values,
- Using spatial correlations to analyze time relationships and constraints in the data.
- To perform matching between data sources, e.g., working days vs. holidays, normal hour of the day and peaks, daily averages, etc.,
- To detect temporary closures without difficulty,
- To have simple correlations between sensor stations,
- To perform accurate detection of traffic lights.
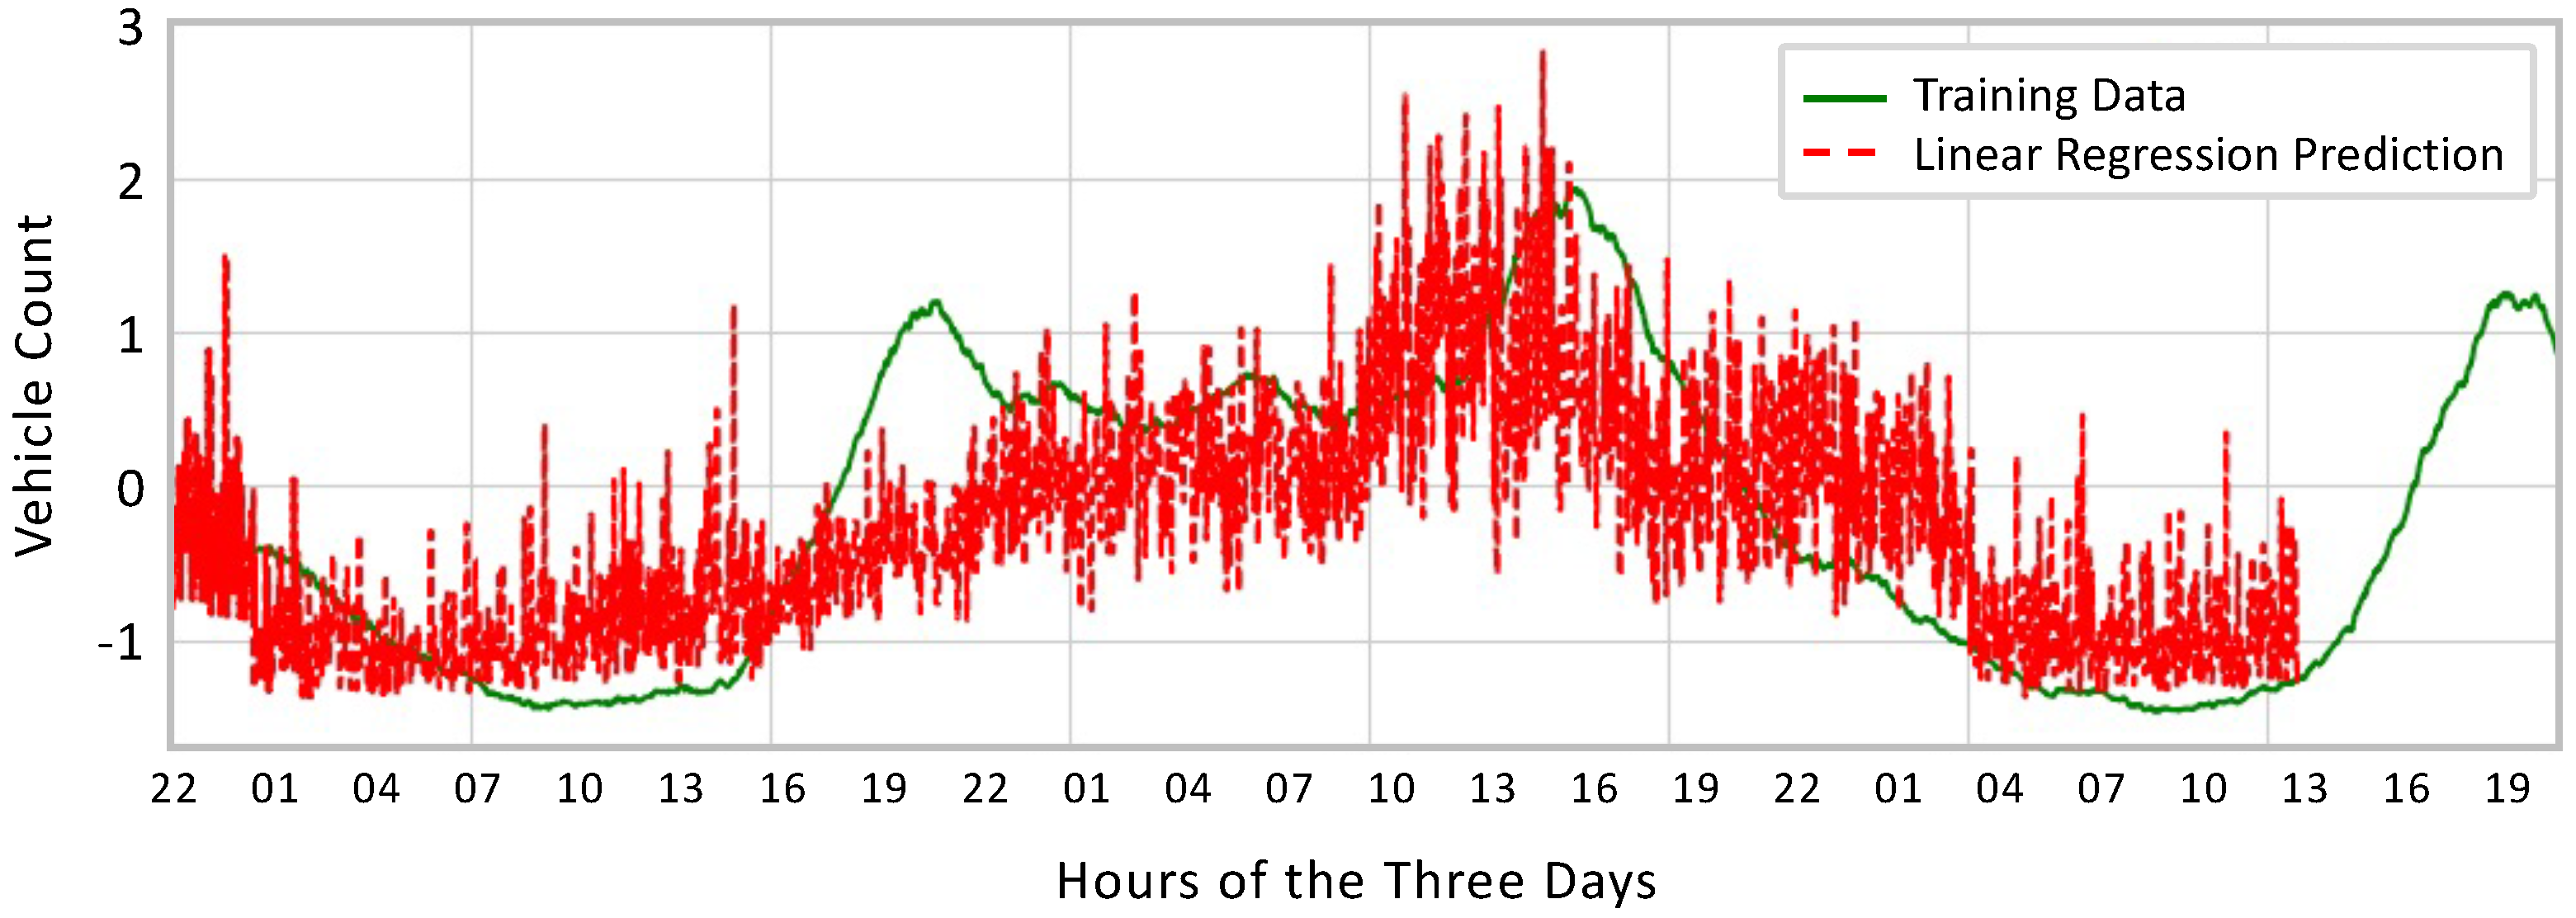
- A total of 100 neurons;
- Solver (L-BFGS);
- Activation function (tanh);
- Minute of the day (0–1439);
- Day of week (Monday–Sunday (0–6));
- Is a holiday (true, false);
- Vehicle count of that minute (number)—the class label/output.
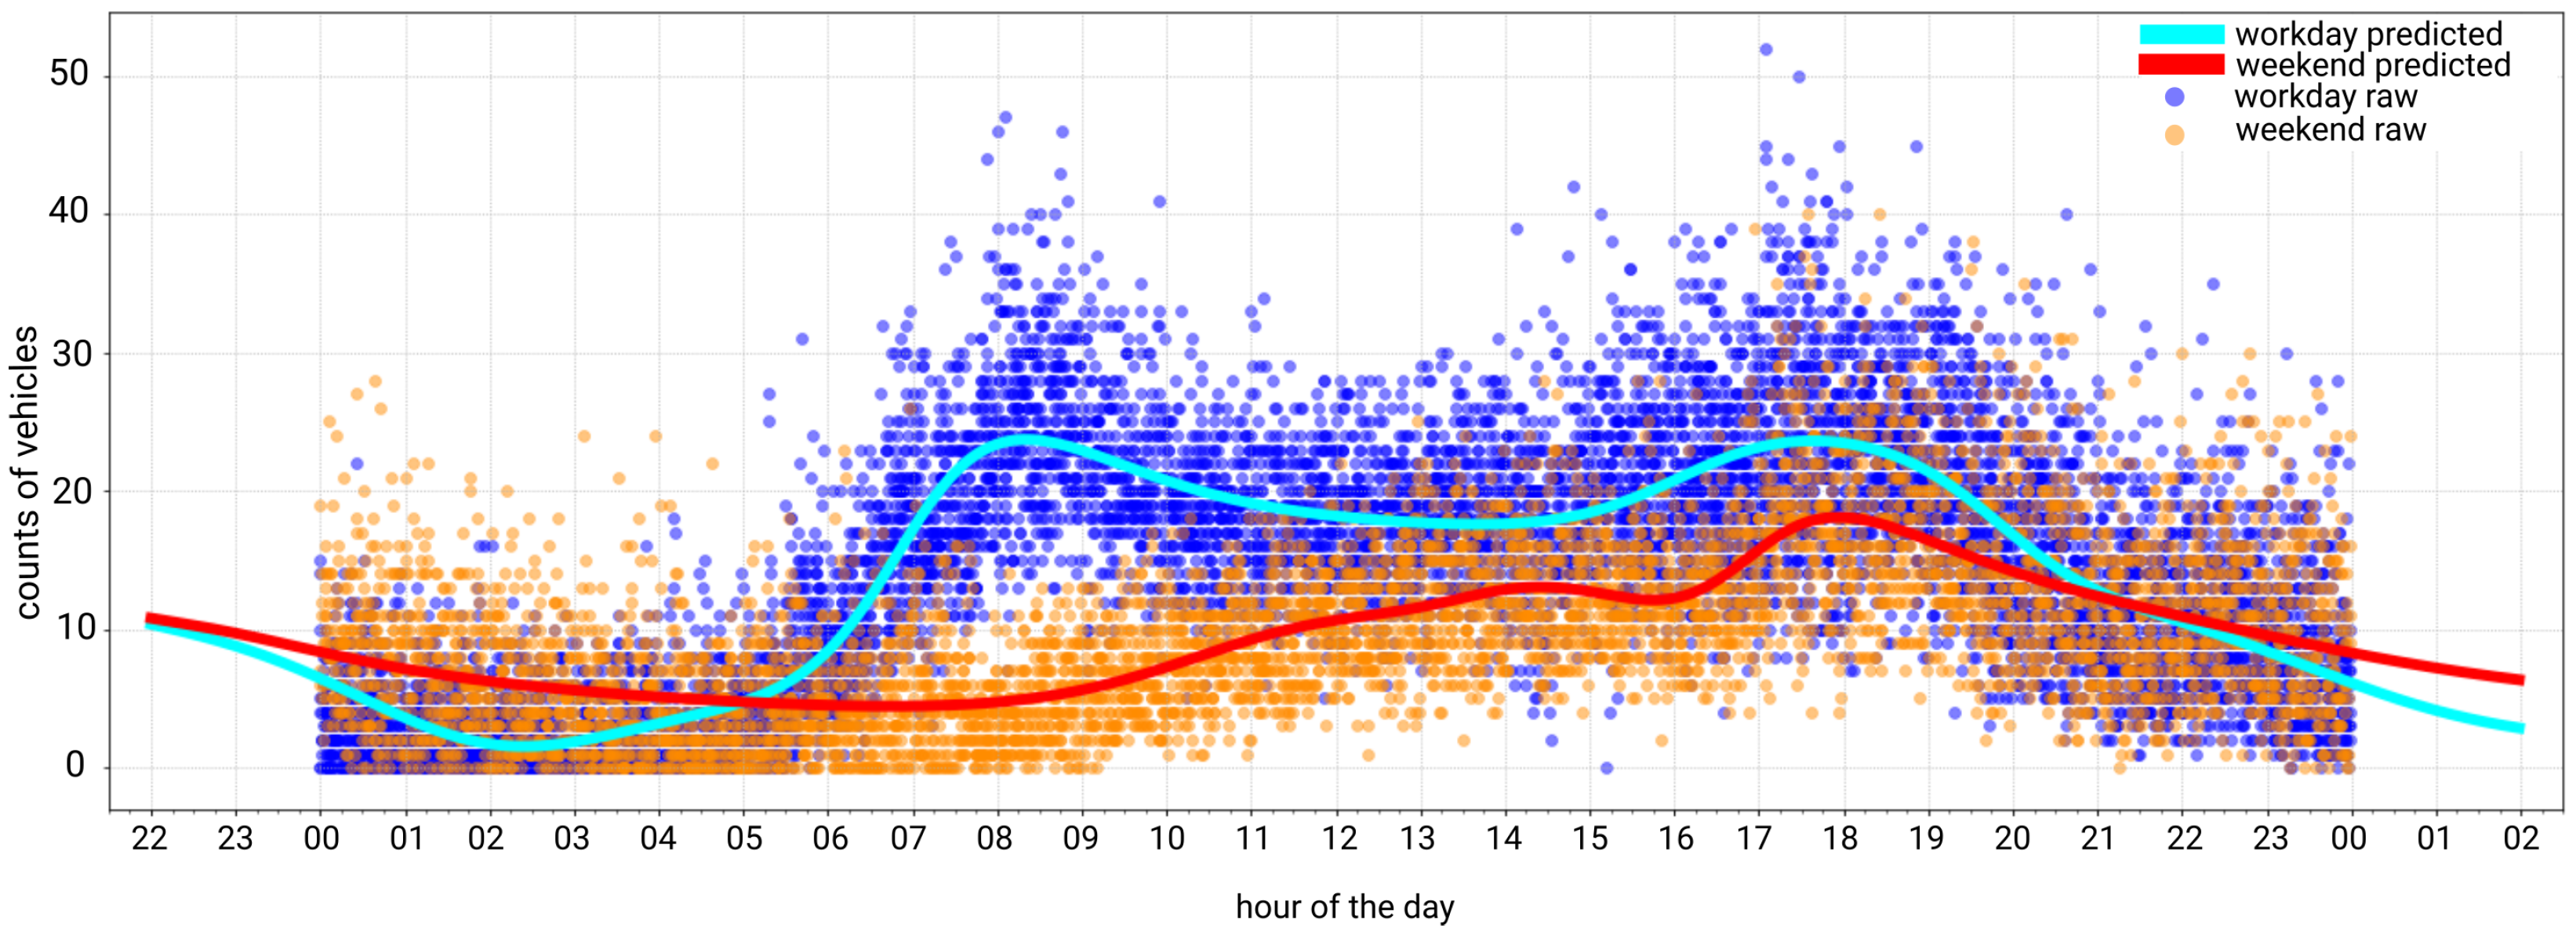
6.2. Dataset Cleaning and Visualization
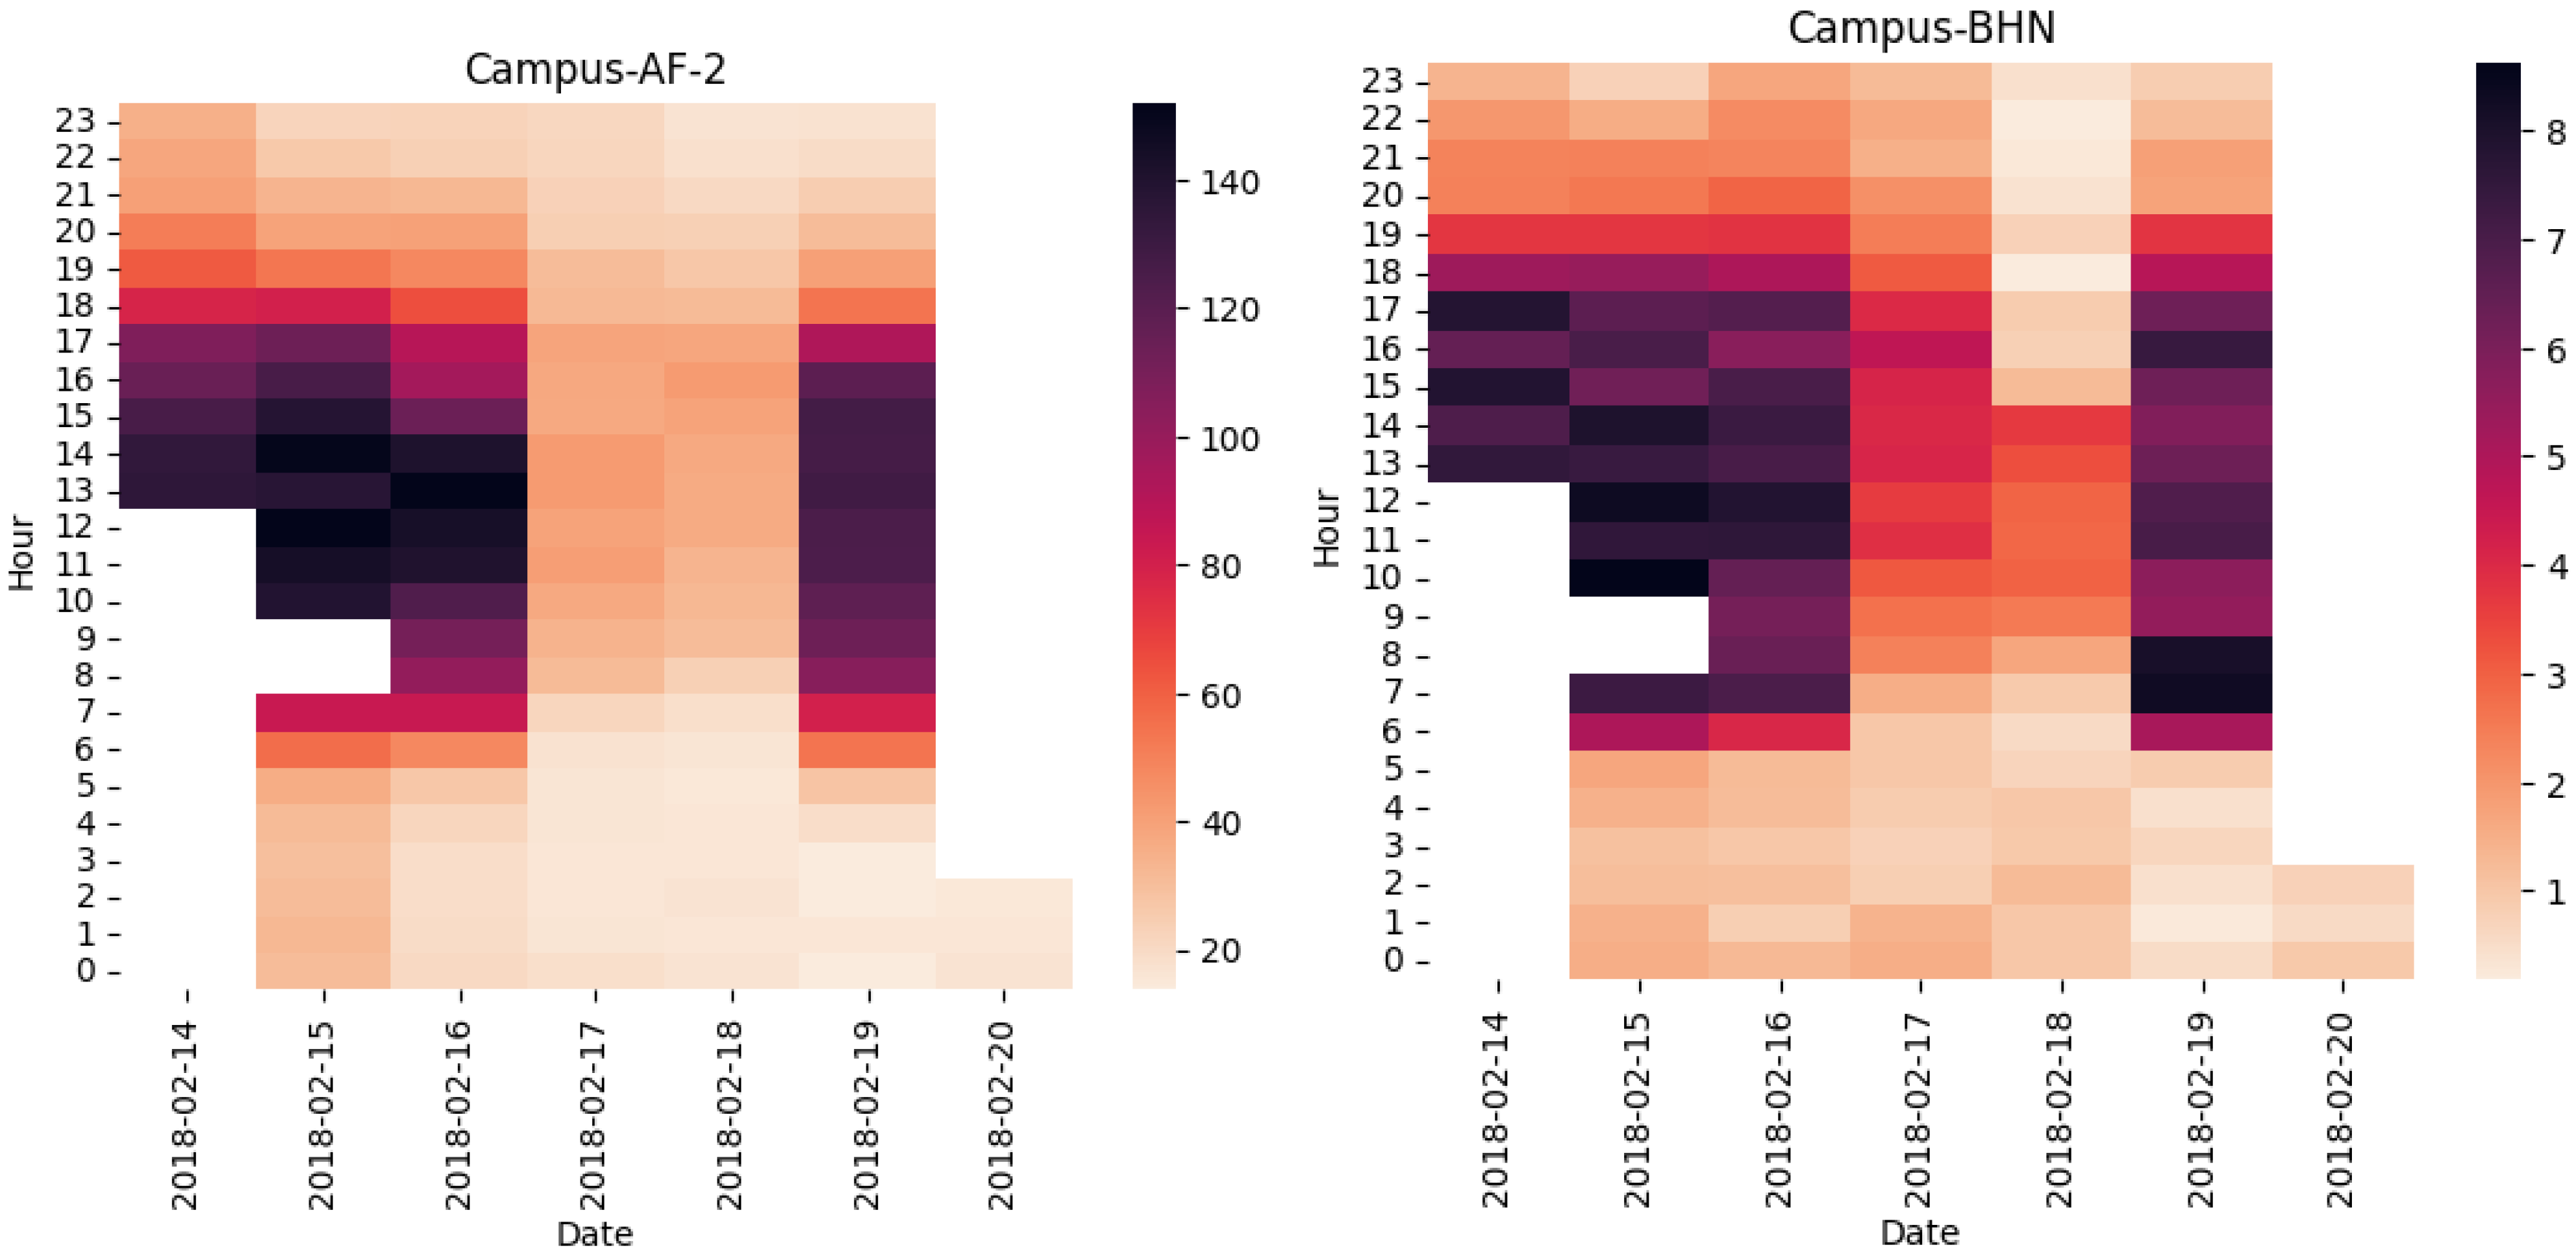
- AmpelHardenbergstrvon-BHN2-Outbound;
- VorplatzHardenbergstrvon-BHN3-Inbound;
- Otto-Suhr-Allee-TEL1-Inbound;
- Bismarckstrasse-TEL3-Outbound;
- Ernst-Reuter-PlatzGeb-A1-Outbound;
- Bismarckstrasse-TEL3-Inbound;
- VorplatzGeb-AF1-Rotary;
- Strdes17Junivon-EB1-Outbound;
- Marchstrasse-A2-Inbound;
- Strdes17Junivon-EB1-Inbound;
- Ernst-Reuter-Platz-TEL2-Rotary;
- MarchvonGeb-A2-Outbound;
- Ernst-Reuter-Platzvon-EB2-Rotary;
6.3. Experimental Setup
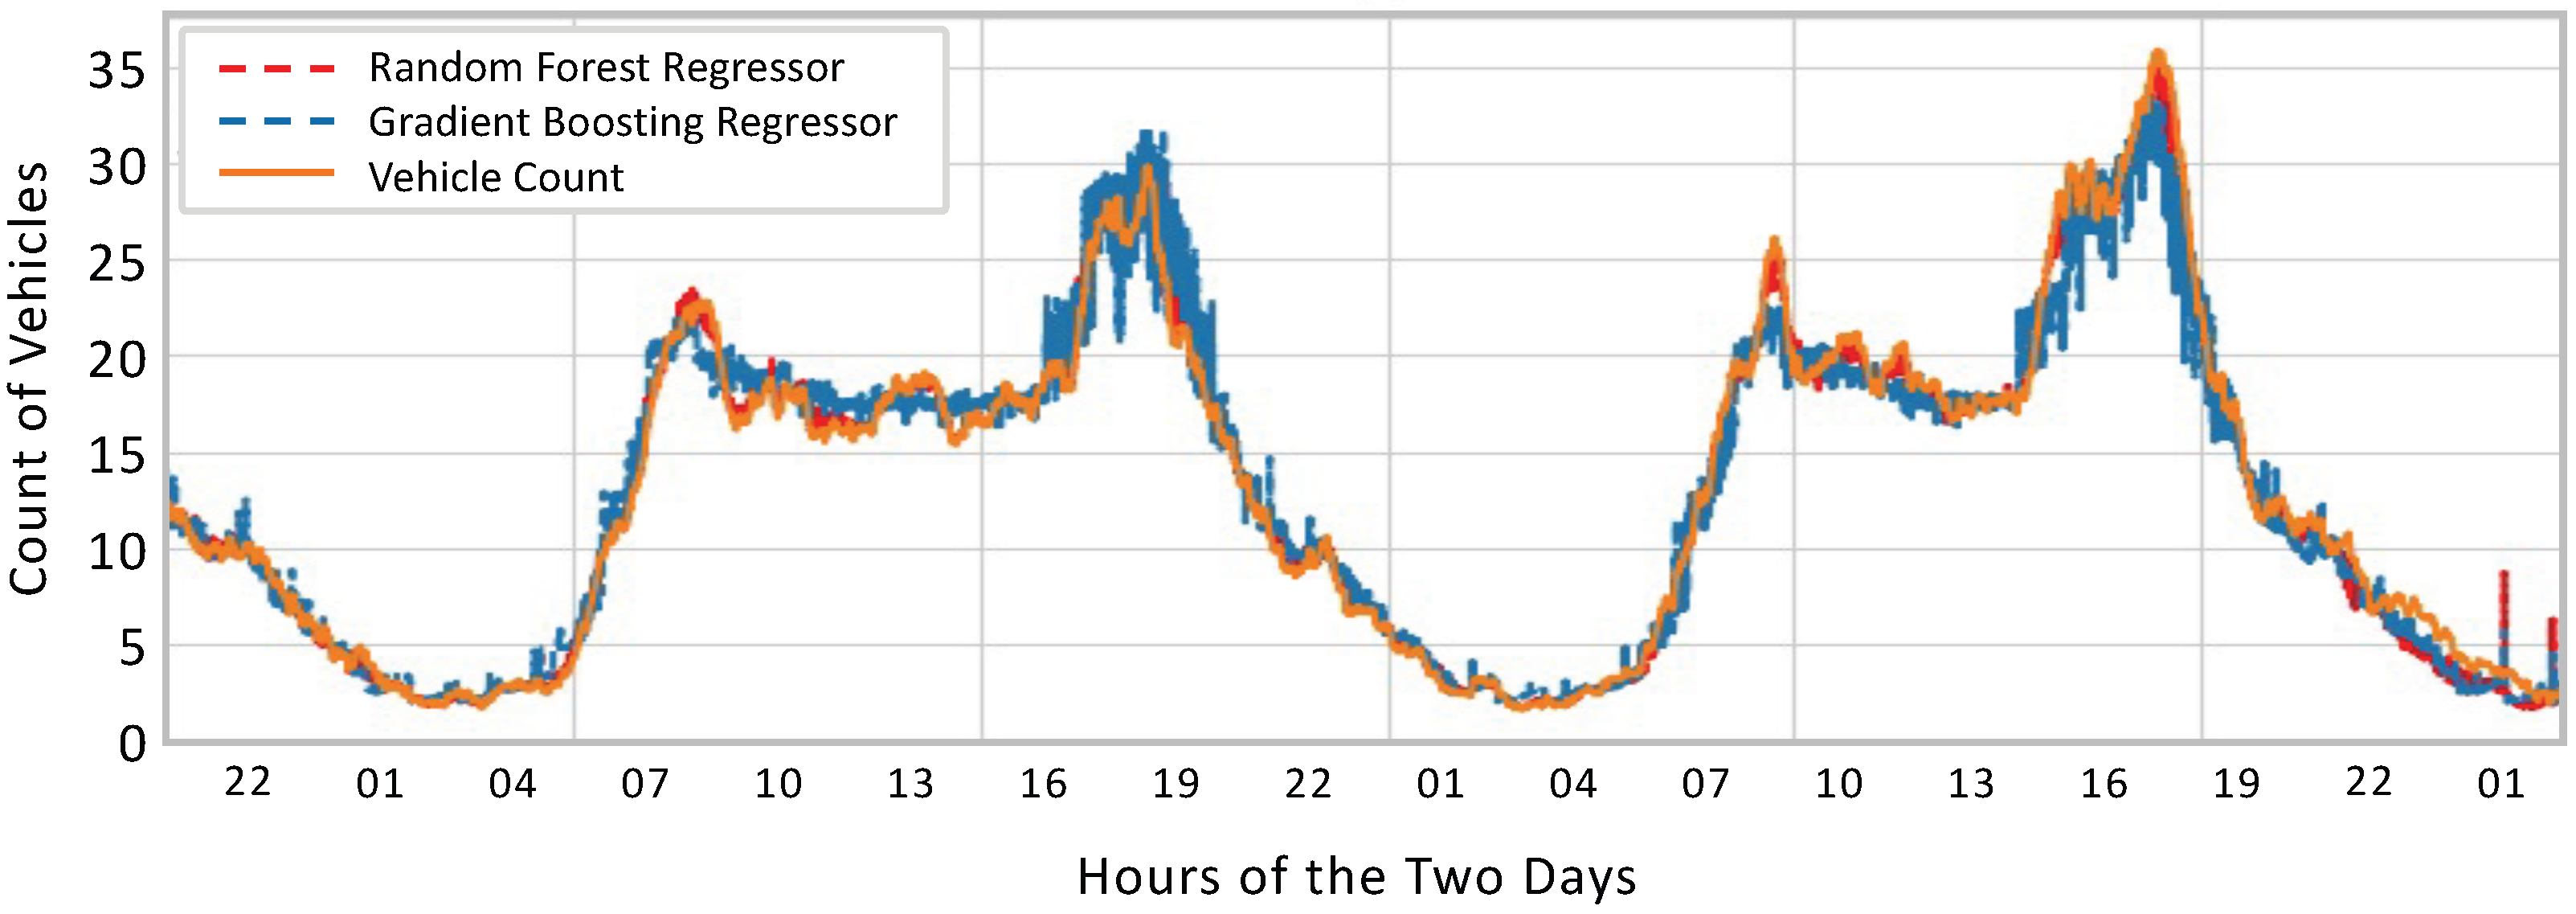
6.4. Results and Discussions
7. Conclusions
Author Contributions
Funding
Data Availability Statement
Conflicts of Interest
References
- SAE Levels of Driving Automation™ Refined for Clarity and International Audience. Available online: https://www.sae.org/blog/sae-j3016-update (accessed on 10 July 2022).
- Audi Abandons Self-Driving Plans for Current Flagship—SlashGear. Available online: https://www.slashgear.com/audi-a8-traffic-jam-pilot-level-3-cancelled-tech-self-driving-legislations-28618493 (accessed on 10 July 2022).
- Khan, M.A.; El Sayed, H.; Malik, S.; Zia, M.T.; Alkaabi, N.; Khan, J. A Journey towards Fully Autonomous Driving-Fueled by a Smart Communication System. Veh. Commun. 2022, 36, 100476. [Google Scholar] [CrossRef]
- Geißler, T.; Shi, E. Taxonomies of Connected, Cooperative and Automated Mobility. In Proceedings of the 2022 IEEE Intelligent Vehicles Symposium (IV), Aachen, Germany, 4–9 June 2022; pp. 1517–1524. [Google Scholar]
- Royuela, I.; Aguado, J.C.; de Miguel, I.; Merayo, N.; Barroso, R.J.D.; Hortelano, D.; Ruiz, L.; Fernández, P.; Lorenzo, R.M.; Abril, E.J. A testbed for CCAM services supported by edge computing, and use case of computation offloading. In Proceedings of the NOMS 2022-2022 IEEE/IFIP Network Operations and Management Symposium, Budapest, Hungary, 25–29 April 2022; pp. 1–6. [Google Scholar]
- Kousaridas, A.; Fallgren, M.; Fischer, E.; Moscatelli, F.; Vilalta, R.; Mühleisen, M.; Barmpounakis, S.; Vilajosana, X.; Euler, S.; Tossou, B.; et al. 5G Vehicle-to-Everything Services in Cross-Border Environments: Standardization and Challenges. IEEE Commun. Stand. Mag. 2021, 5, 22–30. [Google Scholar] [CrossRef]
- Hosseini, S.; Jooriah, M.; Rocha, D.; Almeida, J.; Bartolomeu, P.; Ferreira, J.; Rosales, C.; Miranda, M. Cooperative, Connected and Automated Mobility Service Continuity in a Cross-Border Multi-Access Edge Computing Federation Scenario. Front. Future Transp. 2022, 3, 911923. [Google Scholar] [CrossRef]
- SAE J3016 Automated-Driving Graphic. Available online: https://www.sae.org/news/2019/01/sae-updates-j3016-automated-driving-graphic (accessed on 20 September 2022).
- Service Requirements for Enhanced V2X Scenarios–Technical Specification # 22.186. Available online: https://portal.3gpp.org/desktopmodules/Specifications/SpecificationDetails.aspx?specificationId=3180 (accessed on 15 November 2022).
- Khan, M.A.; Sayed, H.E.; Malik, S.; Zia, T.; Khan, J.; Alkaabi, N.; Ignatious, H. Level-5 Autonomous Driving—Are We There Yet? A Review of Research Literature. ACM Comput. Surv. 2022, 55, 1–38. [Google Scholar] [CrossRef]
- Liu, Q.; Zhang, Y.; Wang, H. EdgeMap: CrowdSourcing High Definition Map in Automotive Edge Computing. arXiv 2022, arXiv:2201.07973. [Google Scholar]
- Naudts, D.; Maglogiannis, V.; Hadiwardoyo, S.; Van Den Akker, D.; Vanneste, S.; Mercelis, S.; Hellinckx, P.; Lannoo, B.; Marquez-Barja, J.; Moerman, I. Vehicular Communication Management Framework: A Flexible Hybrid Connectivity Platform for CCAM Services. Future Internet 2021, 13, 81. [Google Scholar] [CrossRef]
- Velez, G.; Perez, J.; Martin, A. 5G MEC-enabled vehicle discovery service for streaming-based CAM applications. Multimed. Tools Appl. 2021, 81, 12349–12370. [Google Scholar] [CrossRef]
- El Marai, O.; Taleb, T. Smooth and low latency video streaming for autonomous cars during handover. IEEE Netw. 2020, 34, 302–309. [Google Scholar] [CrossRef]
- Ahmad, F.; Qiu, H.; Eells, R.; Bai, F.; Govindan, R. {CarMap}: Fast 3D Feature Map Updates for Automobiles. In Proceedings of the 17th USENIX Symposium on Networked Systems Design and Implementation (NSDI 20), Santa Clara, CA, USA, 25–27 February 2020; pp. 1063–1081. [Google Scholar]
- Santa, J.; Fernández, P.J.; Ortiz, J.; Sanchez-Iborra, R.; Skarmeta, A.F. SURROGATES: Virtual OBUs to foster 5G vehicular services. Electronics 2019, 8, 117. [Google Scholar] [CrossRef]
- Khan, M.A. Intelligent Environment Enabling Autonomous Driving. IEEE Access 2021, 9, 32997–33017. [Google Scholar] [CrossRef]
- C-2VX-Enabling-Intelligent-Transport_2.pdf. Available online: https://www.gsma.com/iot/wp-content/uploads/2017/12/C-2VX-Enabling-Intelligent-Transport_2.pdf (accessed on 16 November 2022).
- Gyawali, S.; Xu, S. CA Study of 5G V2X Deployment by 5GPPP Automotive Working Group. IEEE Commun. Surv. Tutor. 2018. [Google Scholar]
- Technical Report #22.885—LTE Support for V2X Services. Available online: https://portal.3gpp.org/desktopmodules/Specifications/SpecificationDetails.aspx?specificationId=2898 (accessed on 16 November 2022).
- Khan, M.J.; Khan, M.A.; Beg, A.; Malik, S.; El-Sayed, H. An overview of the 3GPP identified Use Cases for V2X Services. Procedia Comput. Sci. 2022, 198, 750–756. [Google Scholar] [CrossRef]
- Harounabadi, M.; Soleymani, D.M.; Bhadauria, S.; Leyh, M.; Roth-Mandutz, E. V2X in 3GPP Standardization: NR Sidelink in Release-16 and Beyond. IEEE Commun. Stand. Mag. 2021, 5, 12–21. [Google Scholar] [CrossRef]
- Service Requirements for V2X Services—Technical Specification #22.185. Available online: https://portal.3gpp.org/desktopmodules/Specifications/SpecificationDetails.aspx?specificationId=2989 (accessed on 15 November 2022).
- Architecture Enhancements for V2X Services—Technical Specification #23.285. Available online: https://portal.3gpp.org/desktopmodules/Specifications/SpecificationDetails.aspx?specificationId=3078 (accessed on 15 November 2022).
- V2X services Management Object (MO)—Technical Specification #24.385. Available online: https://portal.3gpp.org/desktopmodules/Specifications/SpecificationDetails.aspx?specificationId=3113 (accessed on 15 November 2022).
- User Equipment (UE) to V2X Control Function—Technical Specification #24.386. Available online: https://portal.3gpp.org/desktopmodules/Specifications/SpecificationDetails.aspx?specificationId=3114 (accessed on 15 November 2022).
- Vehicle-to-Everything (V2X) Application Enabler (VAE) Layer—Technical Specification #24.486. Available online: https://portal.3gpp.org/desktopmodules/Specifications/SpecificationDetails.aspx?specificationId=3638 (accessed on 15 November 2022).
- V2X Control Function to V2X Application Server Aspects (V2)—Technical Specification #29.387. Available online: https://portal.3gpp.org/desktopmodules/Specifications/SpecificationDetails.aspx?specificationId=3118 (accessed on 15 November 2022).
- V2X Control Function to Home Subscriber Server (HSS) Aspects (V4)—Technical Specification #29.388. Available online: https://portal.3gpp.org/desktopmodules/Specifications/SpecificationDetails.aspx?specificationId=3119 (accessed on 15 November 2022).
- Inter-V2X Control Function Signalling Aspects (V6)—Technical Specification #29.389. Available online: https://portal.3gpp.org/desktopmodules/Specifications/SpecificationDetails.aspx?specificationId=3120 (accessed on 15 November 2022).
- Architecture Enhancements for 5G System (5GS) to support Vehicle-to-Everything (V2X) Services—Technical Specification #23.287. Available online: https://portal.3gpp.org/desktopmodules/Specifications/SpecificationDetails.aspx?specificationId=3578 (accessed on 15 November 2022).
- Vehicle-to-Everything (V2X) Services in 5G System (5GS)—Technical Specification #24.587. Available online: https://portal.3gpp.org/desktopmodules/Specifications/SpecificationDetails.aspx?specificationId=3640 (accessed on 15 November 2022).
- Vehicle-to-Everything (V2X) Services in 5G System (5GS)—Technical Specification #24.588. Available online: https://portal.3gpp.org/desktopmodules/Specifications/SpecificationDetails.aspx?specificationId=3641 (accessed on 15 November 2022).
- Application Layer Support for Vehicle-to-Everything (V2X) Services—Technical Specification #23.286. Available online: https://portal.3gpp.org/desktopmodules/Specifications/SpecificationDetails.aspx?specificationId=3562 (accessed on 15 November 2022).
- V2X Application Enabler (VAE) Services—Technical Specification #29.486. Available online: https://portal.3gpp.org/desktopmodules/Specifications/SpecificationDetails.aspx?specificationId=3639 (accessed on 15 November 2022).
- Security Aspect for LTE Support of Vehicle-to-Everything (V2X) Services—Technical Specification #33.185. Available online: https://portal.3gpp.org/desktopmodules/Specifications/SpecificationDetails.aspx?specificationId=3141 (accessed on 15 November 2022).
- Security Aspects of 3GPP Support for Advanced Vehicle-to-Everything (V2X) Services—Technical Specification #33.536. Available online: https://portal.3gpp.org/desktopmodules/Specifications/SpecificationDetails.aspx?specificationId=3724 (accessed on 15 November 2022).
- Khan, M.A.; Tembine, H.; Vasilakos, A.V. Game dynamics and cost of learning in heterogeneous 4G networks. IEEE J. Sel. Areas Commun. 2011, 30, 198–213. [Google Scholar] [CrossRef]
- Khan, M.A.; Tembine, H. Meta-learning for realizing self-x management of future networks. IEEE Access 2017, 5, 19072–19083. [Google Scholar] [CrossRef]


| Study and Year | Challenge | Contribution/Focus | Solution Approach | Architecture | Use Case/Scenario | Shortcomings |
|---|---|---|---|---|---|---|
| EdgeMap Year 2022 | Frequent updates of HD Maps under limited network resouces, i.e., transmission and computation resources. Maintaining up-to-date map through specialized collection vehicles. Vehicular offloading and resource reservation problem | A new HD map (EdgeMap) by Crowdsourcing data in MEC, Design and Implemenation of DATE Algorithm, Minimum resource utilization and offloading decision presented via extensive network simulations. | A crowdsourcing HD Map (EdgeMap) for minimum network resouces with balanced latency requirement. A DATE Algorithm based on multi-agent deep reinforcement learning for vehicular offloading and Gaussian process regression for resource usage | Architecture: Yes Experimental Setup: Yes Simulation: Yes Real-Experimentation: Yes Performance Metrics: Yes | Urban micro (UMi—Street Canyon) channel model, Scenarios of Machine Hall 01–05 | Not clear. |
| CAMINO Year 2021 | Real flexible and modular platforms for hybrid communication. Different communication technologies between different vehicles from different OEMs. | Enabling cross-technology vehicular communication to support CCAM services, Monitoring and logging of valuable information, Helping OEMs towards management and integration. | Integration of different V2X technologies, devices, interfaces, and services (i.e., C-V2X PC5, ITS-G5, 4G/5G C-V2X Uu, vehicle/infrastructure sensors, actuators, HMIs, and external service providers) | Architecture: Yes Experimental Setup: Yes Simulation: No Real-Experimentation: Yes Performance Metrics: Yes | Highways in Flanders, E313 highway (Belgian), A16 highway (Amsterdam) | Not clear. |
| 5G-MEC Year 2021 | V2V sharing data creates communication overhead and latency issues | Holistic understanding of the surrounded environment. Cooperative perception between Avs. Enabling streaming-based CAM application through MEC | MEC provides the exact information required for the AVs with low communication latency. | Architecture: No Experimental Setup: Yes Simulation: No Real-Experimentation: No Performance Metrics: No | See-Through Application of Extended Sensors | Not clear if MEC is able to prioritize between vehicles for information sharing when two vehicles request at the same time. |
| SLL-VS Year 2020 | In time live video (data) delivery. Continous live video streaming with no disruption (outage) during handover operation. High glass-to-glass latency | Low latency live video streaming for AD use cases. Mimimize the video stream outage during handover. Smooth video playback | A live video streaming solution that ensures a low E2E latency. A solution to minimize video stream outage during handover process between two different network operators. Resuming the stream automatically after a network outage due to handover operation. | Architecture: Yes Experimental Setup: Yes Simulation: No Real-Experimentation: Yes Performance Metrics: Yes | Remote Driving, See-What-I-See in Platooning, | No comparison with V2V-based streaming for latency and recovery time, No details over the practical implementaions (location etc.), Lack of modularity for other CCAM applications |
| CarMap Year 2020 | Difficult vehicle localization due to infreqent HD map updates. Large map size and dynamic environmental dynamics. Effective feature matching in feature maps. No fast map-updates, | Developed feature map, i.e., CarMap. Reduced map size by lean representation. Improve localization by using position information obtained through feature search. Developed algorithms for dynamic object filtering, map segment stitching, and map updates. | A crowd-sourced 3D feature-map (CarMap) with near real-time updates over a cellular network. | Architecture: Yes Experimental Setup: Yes Simulation: Yes Real-Experimentation: No Performance Metrics: Yes | Real-world traces and simulated traces in CarLA (i.e., sub-urban street, freeway roads, downtown roads), Scenarios such as static scene, dynamic scene, and multi-lane. | Edge is not taken into account for storage and compute resouces, Stitching operation becomes expensive for cloud service in real-time experiement. |
| SURROGATES Year 2019 | Continuous data gathering and processing of OB sensors is challenging. Mobility and processing needs are issues in vehicular domain, Intermediate cache and processing layers are required for data gathering | Virtualization of end-devices in ITS ecosystem. Improve system efficiency and adaptability by virtualization in vehicular environemnts. End-to-end architecture for NFV and MEC. Real implementation, deployment, and validation tests of the architecture | Virtualize vehicle OBUs into VNFs and create MEC layer for offloading processing and data-access requests. Real OBUs virtualization in MEC to create always available OBUs | Architecture: Yes Experimental Setup: Yes Simulation: No Real-Experimentation: Yes Performance Metrics: Yes | Testbed at the Espinardo Campus, University of Murcia, Spain | Introducing Edge layer is not a novel idea since the literature exist with studies that are using edge layer between device and cloud layer; however, virtualizing OBUs in edge layer is a novel approach |
| Sensor Type | Description | Parameters Measured |
|---|---|---|
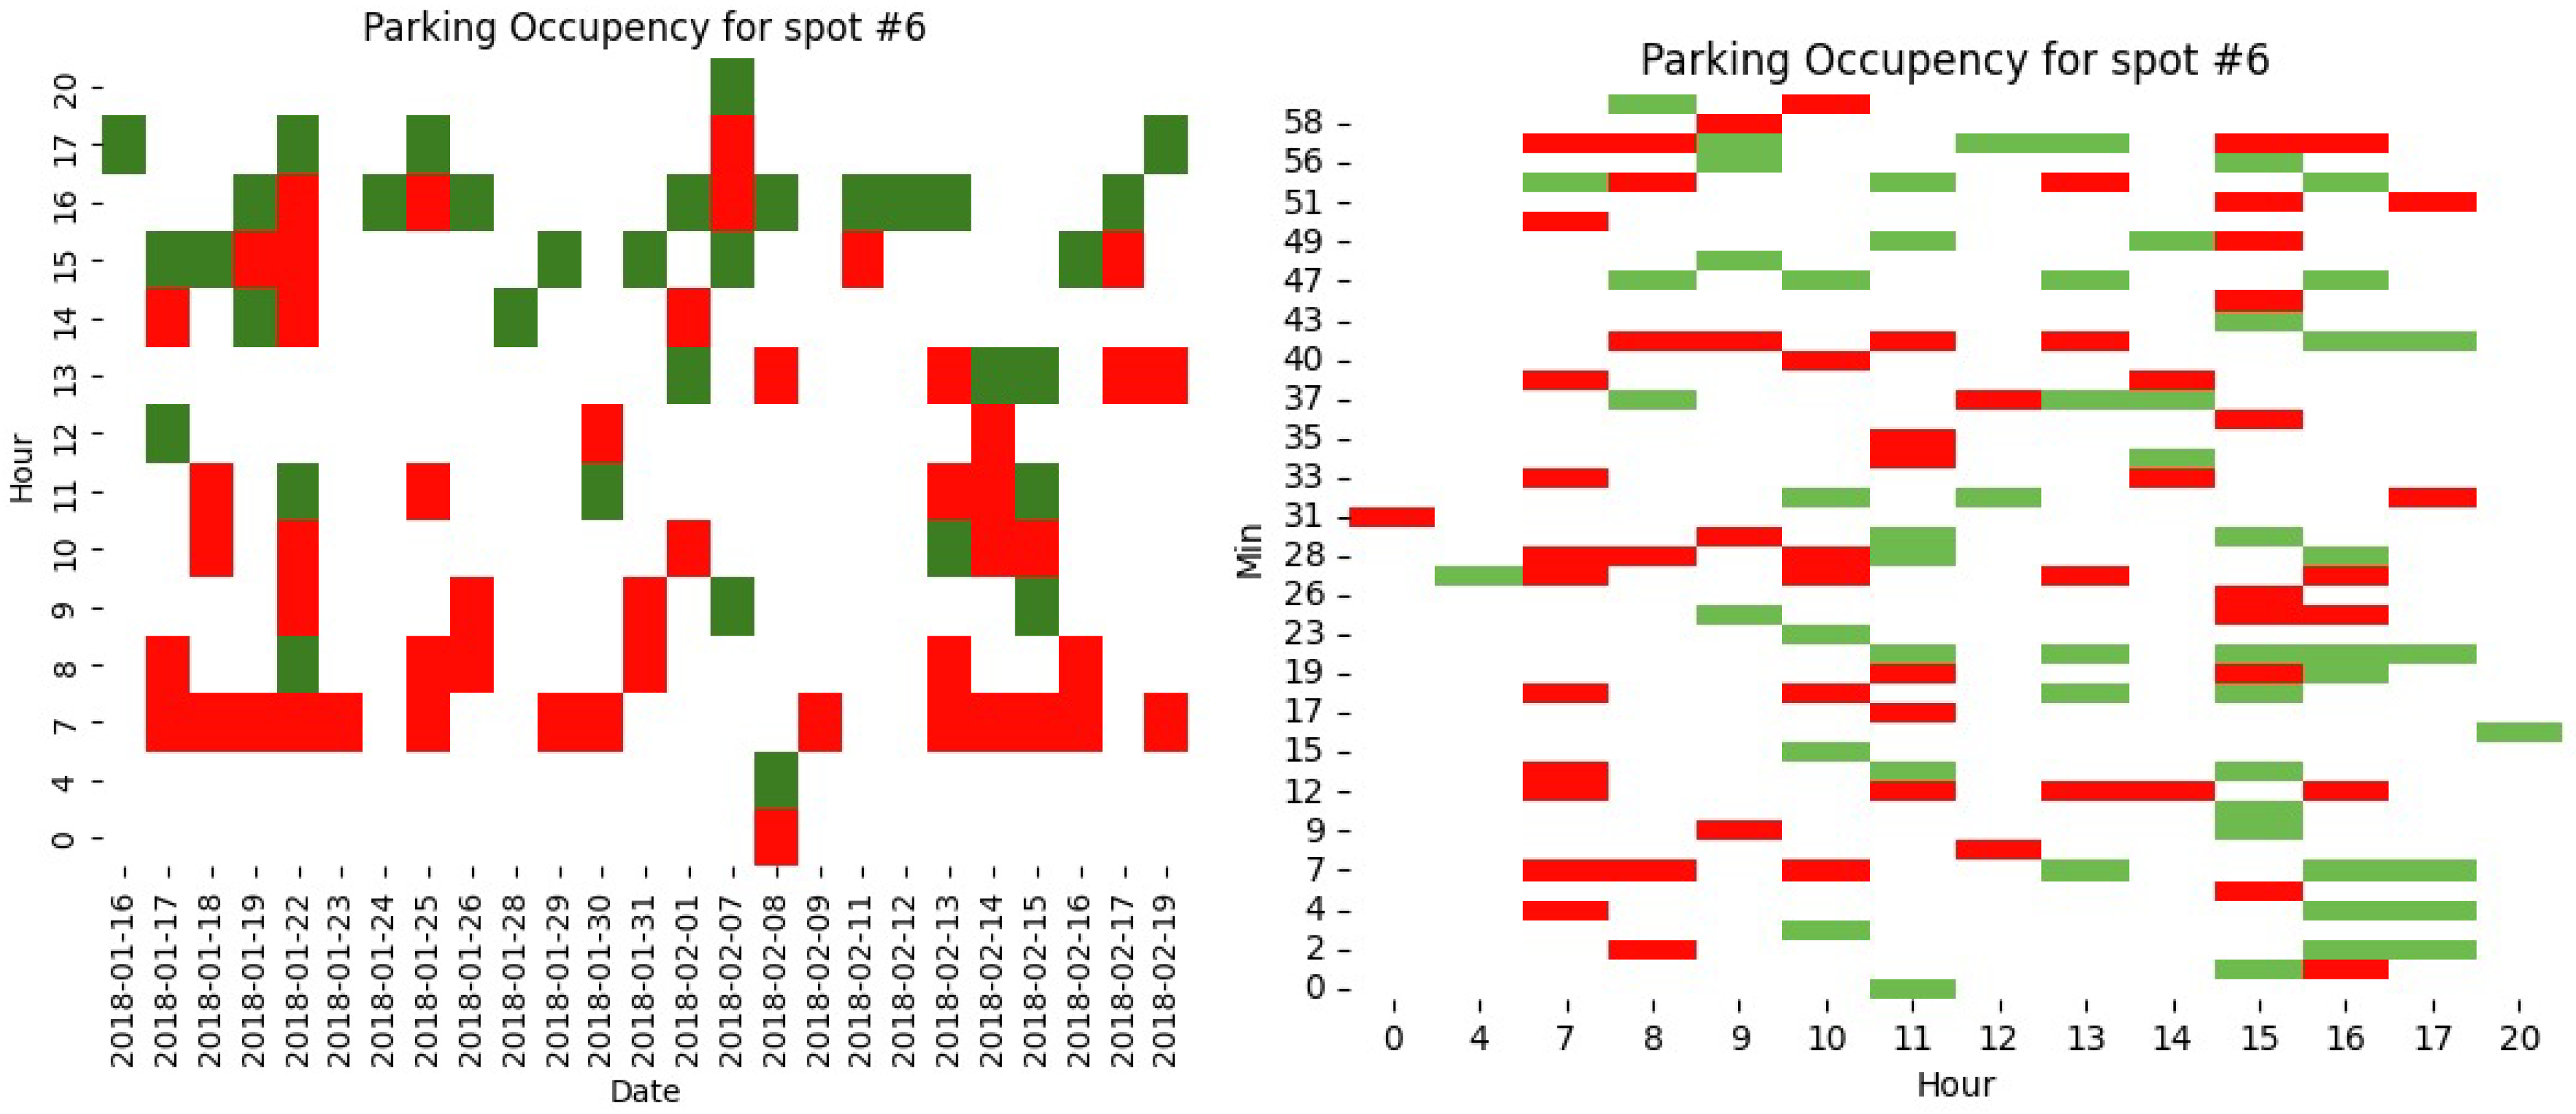
| Car Parking | In parking lots, these sensors can be of various use, including finding a preferred parking space for drivers, identifying wrong parking, parking violations and expired tickets. Up to 300 spaces can be covered by one sensor and the range can be as long as 400 m. The raw video streams are only processed on-board in an effort to increase privacy. | Total parking spots, free spots, and occupied spots |
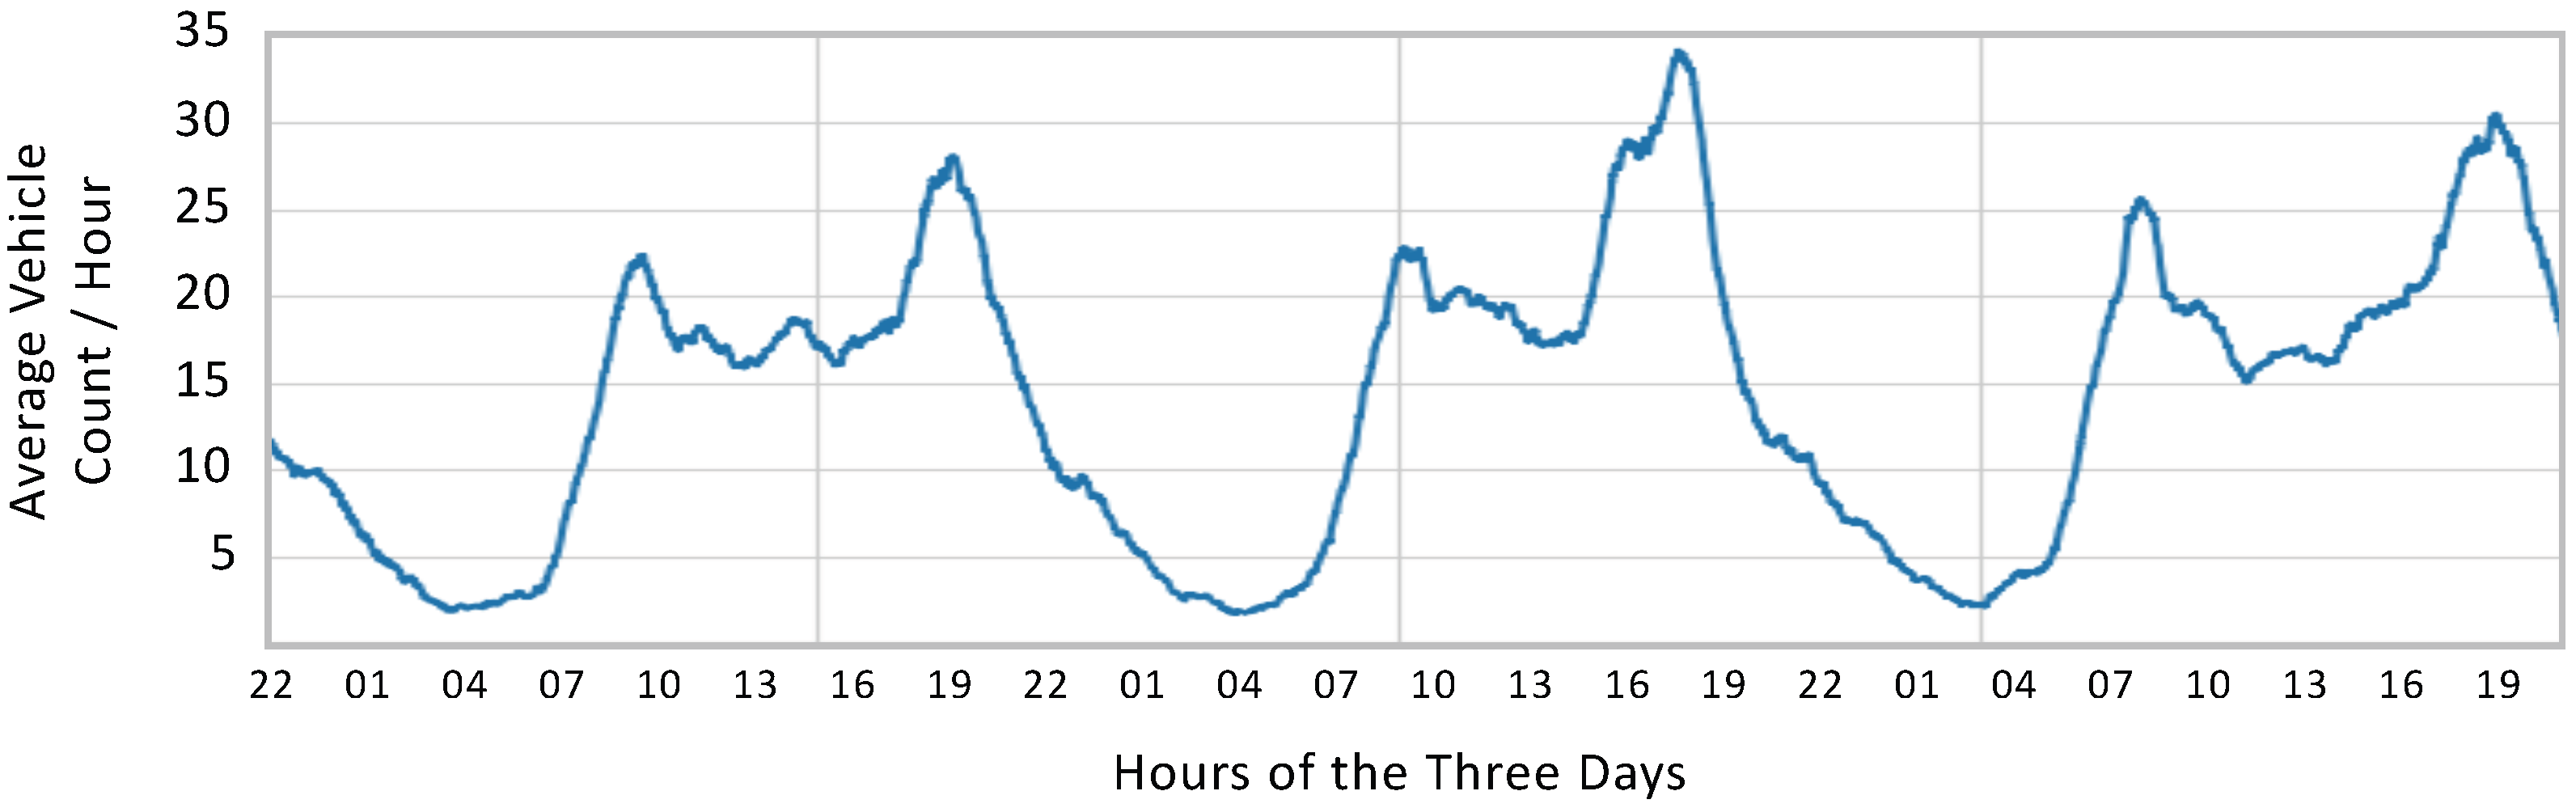
| Traffic Analysis | In highways, the crowded traffic can be caught/recorded via these sensors and it can capture as wide as four lanes per camera. The frequency with which the data are recorded can be modified according to needs, e.g., per month, week, day, hour, or per minute. The user can view the evaluations through camera image on a display, via email reported regularly by a reporting engine or sent through CSV file. | Classification of vehicle types and automatic counting of vehicles |
| Activity Analysis | These sensors can recognize/distinguish different automobile activities at certain geographical locations. Information regarding motion and most lingered places can be traced via analysis of sensory data. The information of activity patterns (pedestrian walking, cycling etc.), gathered via these sensors may assist in dynamic decision making for AD, e.g., scheduling traffic light controls or LDM trajectory planning. | Visualization of motion and dwelling time, objective measurement of hot spots, compilation of statistical evaluations with adjustable duration and intervals of evaluation. |
| Environmental | The effects of AD on the environment can be analyzed via these sensors. Moreover, different parameters and their relationship can be studied through interpretations and evaluations of sensory data collected from environmental and traffic analysis sensors. | Air quality index, NO2, NO, O3, particulate matter (PM1, PM2.5, PM10) |
| Road condition | These sensors are installed on masts (e.g., streetlamps) or bridges and can be used as optical technologies for the purpose of visual information of site and measure remote temperature. | Road status (dry, damp, wet, ice, snow, and chemically wet), road surface temperature, snow height, and water film height |
| Traffic Light | These sensors are integrated with the existing traffic control system and use DSRC communication technology for short range messages delivery between traffic light, vehicles, pedestrians, and other road users. | Traffic light status, e.g., red, yellow, green |
| Camera-based Sensors | The type of sensors visually scans its surroundings and capture images and videos that contains important and relevant information. The information is then used for perception creation, object detection, context or scene understanding, object tracking, etc. | Object detection, road status, and classification. |
| LiDAR Sensors | These sensors are popular to perform 3D mapping of the surroundings. The 3D mapping is in point-cloud format and operations over these point-cloud depends over the number of layers in the sensor. This is to say, LiDAR comes with various layers detailing the objects it scans. | Field-of-view, point density, and depth level based on scanning layers |
| RADAR Sensors | These sensors are usually used for detection objects that are moving or stable. Through radar, the object can be tracked by determining their distance, angle, and velocity. | Range and distance to the detectable object and object tracking. |
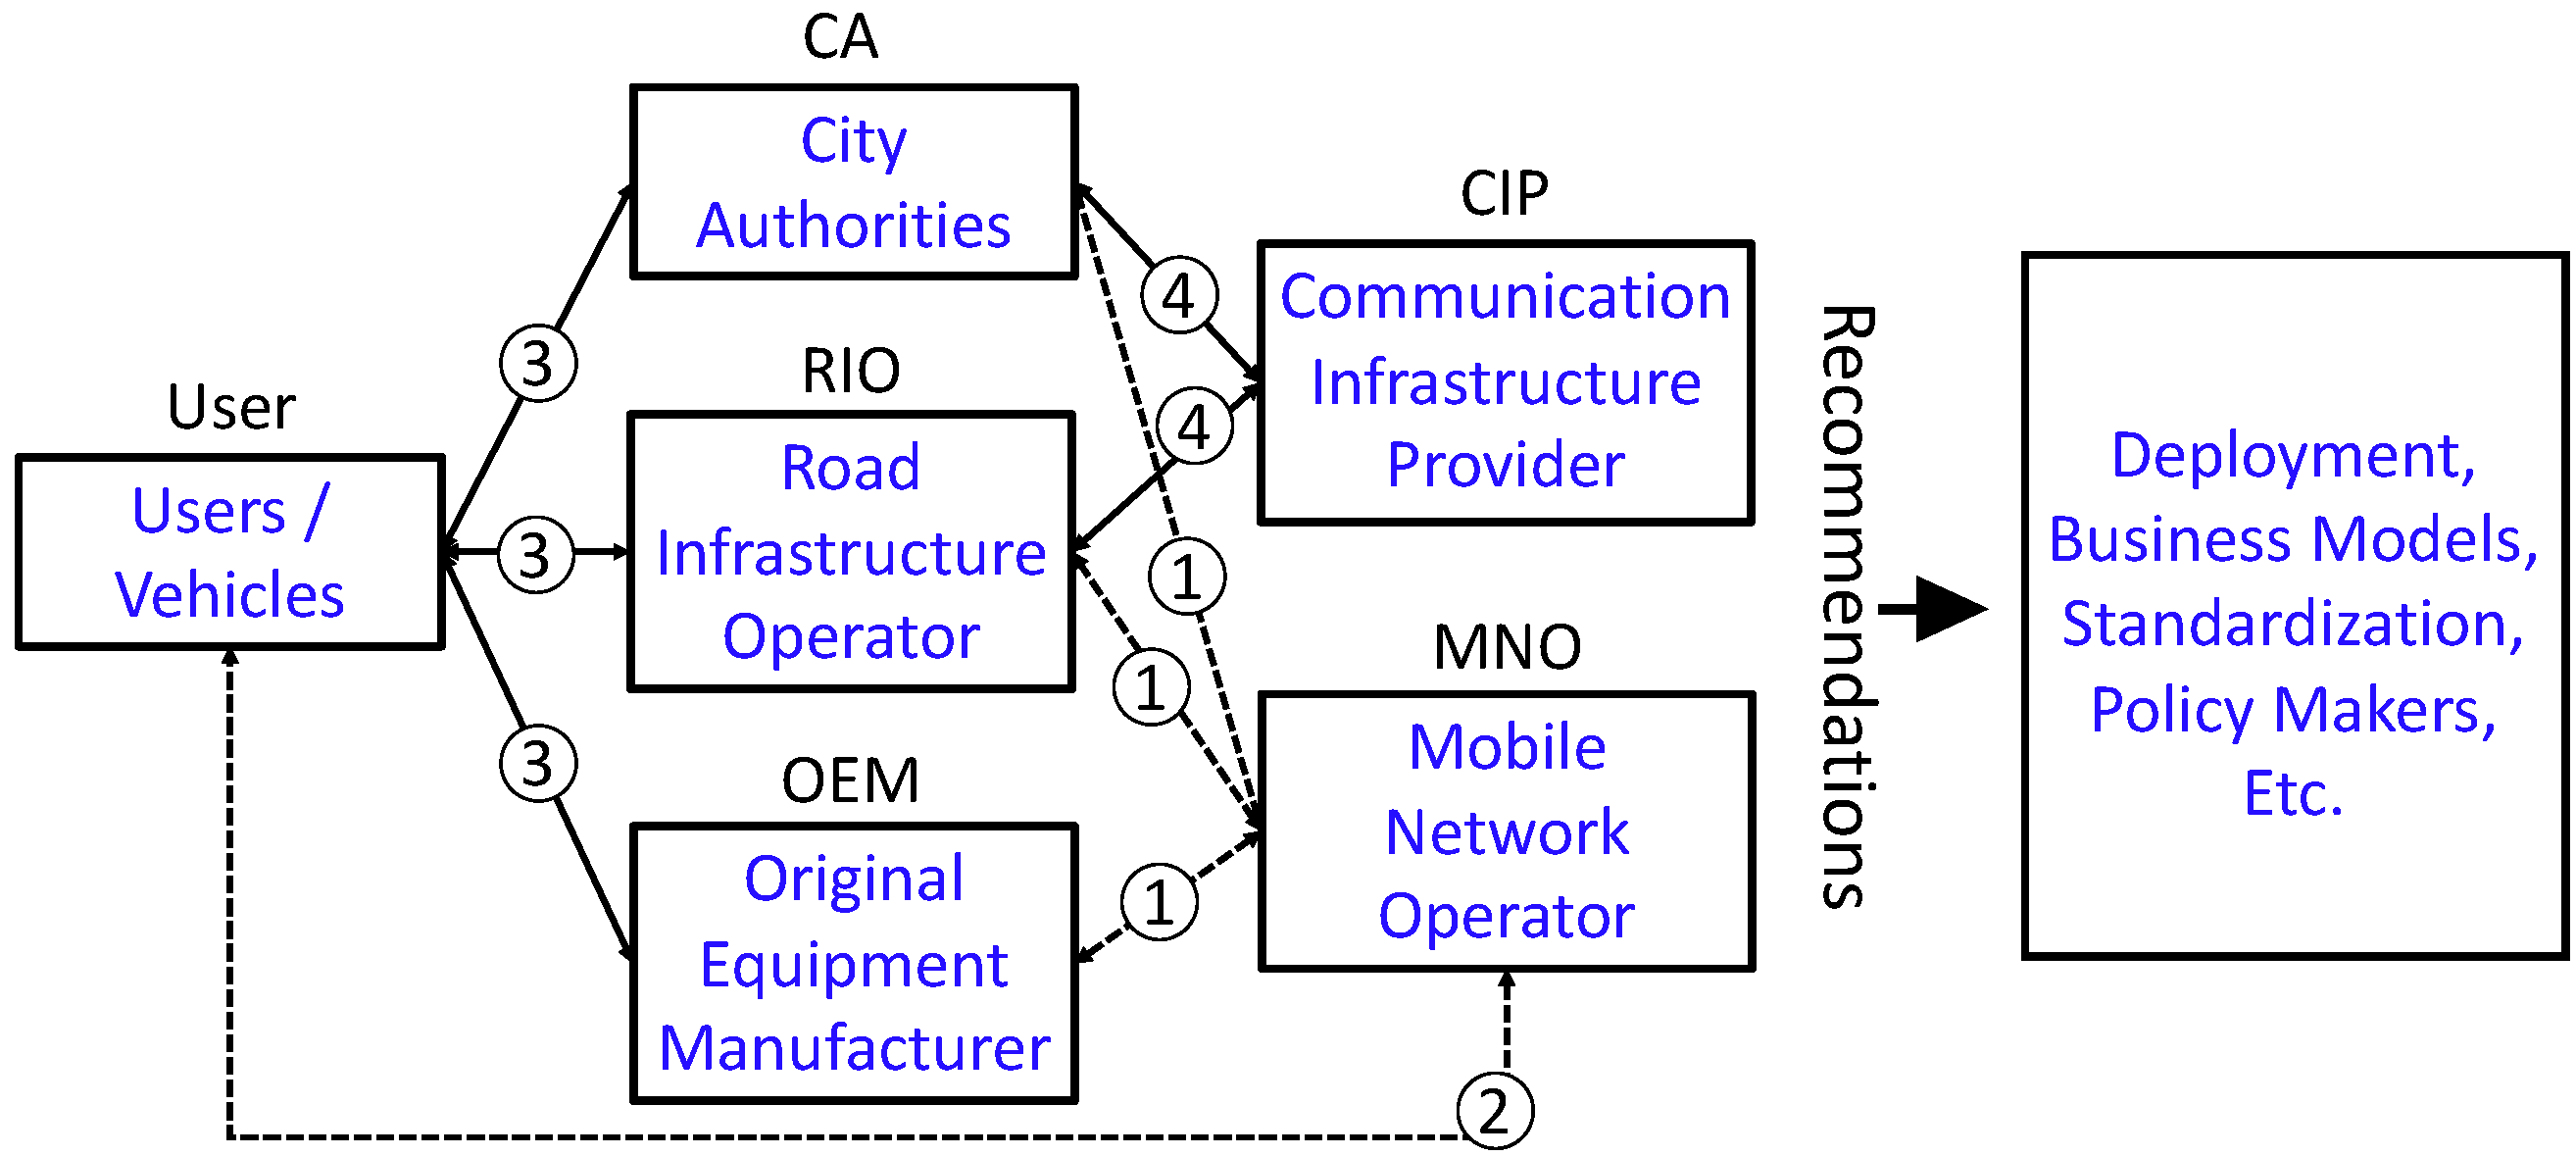
| Relationships | Denotation | Description |
|---|---|---|
| MNO CA RIO OEM | (i) MNO provides communication infrastructure, (ii) CA, RIO, and OEM are MNO tenants, (iii) CA controls the data, which it exchanges with other stakeholders in accordance with predetermined rules. | |
| MNO Users | MNO provides the services to the users. For infotainment, this relationship still holds true, but not for autonomous driving’s communication services. | |
| OEM CA RIO Users | OEM/CA/RIO provide services to the users. The services provided by CA, OEM, and RIO could include perception-as-a-service (PaaS). It could be the data which is gathered from outside sources such as on-road sensors, OEM backends, etc. | |
| CIP CA RIO OEM | The communication infrastructure is installed by CIP, and it is run by CA/RIO/OEM. |
| Term | Definition |
|---|---|
| 3GPP | The 3rd Generation Partnership Project (3GPP) is the collective name for several standard bodies that develop mobile telecommunications protocols and standards. 3GPP specifications cover cellular telecommunications technologies, such as radio access, core networks, and service capabilities, which offer a comprehensive system definition for mobile telecommunications. |
| Camera | These offer more thorough information and aid in comprehending depthless objects, which are typically overlooked by other types of sensors. Such depthless objects include speed limit boards, stop signs, slow signs, traffic lights, etc. |
| CCAM | Stands for cooperative connected and automated mobility. It enables the capabilities of autonomous driving by allowing sensory infrastructure, communication infrastructure, and computation infrastructure. |
| C-V2X | Stands for a cellular vehicle to everything communication, which allows the vehicles to communicate with each other, pedestrians, the cloud, and their environment. |
| EDM | Stands for edge dynamic map, which is built over the edge for facilitating road users with external information. |
| LiDAR | The type of sensor that sends and receives signals using a laser beam to detect objects. It also fires laser pulses at specific targets to produce a depth map. These sensors are reliable and real-time. Since LiDARs are depthless sensors, they are unable to distinguish depthless objects, such as traffic lights, signs, etc. |
| OBU | The onboard unit mounted on the vehicles is designed to exchange messages and communicate with other OBUs and RSUs leveraging dedicated short-range communication or the PC-5 communication. |
| Perception | The component of an autonomous vehicle responsible for collecting information from different onboard sensors and external sources; extracting the relevant knowledge and developing an understanding of the environment. |
| Radar | The RADAR sensor functions very similarly to the LiDAR, except using radio waves rather than laser. However, when radio waves come into contact with objects, they absorb less energy than light waves. Thus, they can operate over a relatively long distance. |
| RSU | The roadside unit can be mounted along a road or on the vehicle. It broadcasts the data to OBUs or exchanges data with OBUs in its communications zone. |
| TS | The Technical Specification documents are created by 3GPP. The TS covers the Core Network and radio component in addition to billing details and speech coding right down to the source code level. These TS are then transferred into standards. |
Disclaimer/Publisher’s Note: The statements, opinions and data contained in all publications are solely those of the individual author(s) and contributor(s) and not of MDPI and/or the editor(s). MDPI and/or the editor(s) disclaim responsibility for any injury to people or property resulting from any ideas, methods, instructions or products referred to in the content. |
© 2023 by the authors. Licensee MDPI, Basel, Switzerland. This article is an open access article distributed under the terms and conditions of the Creative Commons Attribution (CC BY) license (https://creativecommons.org/licenses/by/4.0/).
Share and Cite
Khan, M.J.; Khan, M.A.; Ullah, O.; Malik, S.; Iqbal, F.; El-Sayed, H.; Turaev, S. Augmenting CCAM Infrastructure for Creating Smart Roads and Enabling Autonomous Driving. Remote Sens. 2023, 15, 922. https://doi.org/10.3390/rs15040922
Khan MJ, Khan MA, Ullah O, Malik S, Iqbal F, El-Sayed H, Turaev S. Augmenting CCAM Infrastructure for Creating Smart Roads and Enabling Autonomous Driving. Remote Sensing. 2023; 15(4):922. https://doi.org/10.3390/rs15040922
Chicago/Turabian StyleKhan, M. Jalal, Manzoor Ahmed Khan, Obaid Ullah, Sumbal Malik, Farkhund Iqbal, Hesham El-Sayed, and Sherzod Turaev. 2023. "Augmenting CCAM Infrastructure for Creating Smart Roads and Enabling Autonomous Driving" Remote Sensing 15, no. 4: 922. https://doi.org/10.3390/rs15040922
APA StyleKhan, M. J., Khan, M. A., Ullah, O., Malik, S., Iqbal, F., El-Sayed, H., & Turaev, S. (2023). Augmenting CCAM Infrastructure for Creating Smart Roads and Enabling Autonomous Driving. Remote Sensing, 15(4), 922. https://doi.org/10.3390/rs15040922